linkage map construction and qtl analysis of … map construction and qtl analysis of agronomic and...
TRANSCRIPT

1
Linkage Map Construction and QTL Analysis of Agronomic and Fiber Quality Traits in
Cotton
Michael A. Gore*, David D. Fang, Jesse A. Poland, Jinfa Zhang, Richard G. Percy, Roy G.
Cantrell, Gregory Thyssen, and Alexander E. Lipka
M. A. Gore, Plant Physiology and Genetics Research Unit, United States Department of
Agriculture-Agricultural Research Service (USDA-ARS), U.S. Arid-Land Agricultural Research
Center, 21881 North Cardon Lane, Maricopa, AZ 85138, USA
D. D. Fang and G. Thyssen, Cotton Fiber Bioscience Research Unit, USDA-ARS, Southern
Regional Research Center, 1100 Robert E. Lee Boulevard, New Orleans, LA 70124, USA
J. A. Poland, Hard Winter Wheat Genetics Research Unit, USDA-ARS, Manhattan, KS and
Department of Agronomy, Kansas State University, Manhattan, KS 66506, USA
J. Zhang, Department of Plant and Environmental Sciences, New Mexico State University, Las
Cruces, NM 88003, USA
R. G. Percy, USDA-ARS, Southern Plains Agricultural Research Center, Crop Germplasm
Research Unit, 2881 F&B Road, College Station, TX 77845, USA
Page 1 of 62
The Plant Genome: Posted 22 Nov. 2013; doi: 10.3835/plantgenome2013.07.0023
2
R. G. Cantrell, Monsanto, 700 Chesterfield Parkway West, Mail Stop CC5A, Chesterfield, MO
63017, USA
A. E. Lipka, Institute for Genomic Diversity, Cornell University, Ithaca, New York, USA
Current Address: M. A. Gore, Department of Plant Breeding and Genetics, Cornell University,
Ithaca, NY 14853, USA
M. A. Gore and D. D. Fang contributed equally to this work.
Received .
*Corresponding author: ([email protected])
Abbreviations: GBS, genotyping-by-sequencing; ICIM, inclusive composite interval mapping,
QTL, quantitative trait locus; SNP, single-nucleotide polymorphism; SSR, simple-sequence
repeat
Page 2 of 62
The Plant Genome: Posted 22 Nov. 2013; doi: 10.3835/plantgenome2013.07.0023

3
Abstract
The superior fiber properties of Gossypium barbadense L. serve as a source of novel variation
for improving fiber quality in Upland cotton (G. hirsutum L.), but introgression from G.
barbadense has been largely unsuccessful due to hybrid breakdown and a lack of genetic and
genomic resources. In an effort to overcome these limitations, we constructed a linkage map and
conducted a quantitative trait locus (QTL) analysis of 10 agronomic and fiber quality traits in a
recombinant inbred mapping population derived from a cross between TM-1, an Upland cotton
line, and NM24016, an elite G. hirsutum line with stabilized introgression from G. barbadense.
The linkage map consisted of 429 simple-sequence repeat (SSR) and 412 genotyping-by-
sequencing (GBS)-based single-nucleotide polymorphism (SNP) marker loci that covered half of
the tetraploid cotton genome. Notably, the 841 marker loci were unevenly distributed among the
26 chromosomes of tetraploid cotton. The 10 traits evaluated on the TM-1×NM24016 population
in a multi-environment trial were highly heritable and most of the fiber traits showed
considerable transgressive variation. Through the QTL analysis, we identified a total of 28 QTLs
associated with the 10 traits. Our study provides a novel resource that can be used by breeders
and geneticists for the genetic improvement of agronomic and fiber quality traits in Upland
cotton.
Page 3 of 62
The Plant Genome: Posted 22 Nov. 2013; doi: 10.3835/plantgenome2013.07.0023

4
Introduction
As the world’s foremost natural fiber crop, cotton supports a multi-billion dollar production and
processing industry. Even though cotton is predominantly cultivated for its fiber, a byproduct of
cotton processing—cottonseed—is an important source of vegetable oil and high protein meal.
The cotton genus (Gossypium) captures a tremendous range of phenotypic and genomic
diversity, with a striking native geographic distribution that includes regions of Africa, Asia,
Australia, and the Americas (Fryxell, 1968; Fryxell, 1971; Fryxell, 1992). The nearly 50 species
that are assigned to this genus have undergone extensive chromosomal evolution, allowing
separation into one of nine genome groups that consist of either diploid (A-G and K) or
allotetraploid (AD) species (Reviewed in Wendel and Cronn, 2003). Remarkably, tetraploid
cotton appeared within the last 1-2 million years from a likely intercontinental dispersal of an A-
genome diploid to the Americas, followed by hybridization with an indigenous D-genome
diploid most closely similar to the extant wild species, G. raimondii (D5) (Reviewed in Wendel
et al., 2009). Within the Gossypium genus, two of the five tetraploid species (2n=4x=52; G.
hirstum and G. barbadense), along with two diploid species (2n=2x=26; G. herbaceum and G.
arboreum), were independently domesticated for cotton fiber production in the last few thousand
years in the New and Old World (Reviewed in Brubaker et al., 1999). However, the two
cultivated tetraploid species, G. hirstum and G. barbadense, account for the vast majority of
global cotton production.
The higher yielding and more broadly adapted G. hirsutum (source of Upland cotton) is
responsible for greater than 90% of the current world production of cotton fiber. With the
increasing global demand for textile products and intense competition from synthetic fibers, the
need for higher yielding Upland cotton cultivars with improved fiber quality has never been
Page 4 of 62
The Plant Genome: Posted 22 Nov. 2013; doi: 10.3835/plantgenome2013.07.0023

5
more critical. Inopportunely, there has been a continual decline in the rate of gain in cotton yields
over the past decade (Meredith, 2000). This yield plateau is likely the result of a very narrow
genetic base for Upland cotton that was initially imposed by polyploidization and domestication
bottlenecks, followed by a recent extended period of genetic improvement that relied on the
overutilization of elite germplasm within breeding programs that often captured a miniscule
fraction of the exploitable standing genetic variation (Brubaker et al., 1999; May et al., 1995;
Paterson et al., 2004; Wendel et al., 1992). The continued genetic erosion of the Upland
germplasm pool has become ever more systemic due to the excessive genetic restriction that
results from backcross breeding approaches routinely employed to develop commercial
transgenic cotton cultivars (Paterson et al., 2004; Van Esbroeck et al., 1998). Such limited allelic
variation not only restricts the rate of increase in yield potential, but also increases the genetic
vulnerability of Upland cotton to adverse climatic episodes, as well as pest and disease
epidemics.
Although G. barbadense (source of Egyptian, Pima, and Sea Island cotton) is grown in
limited areas around the world, its fiber quality properties are superior to that of G. hirsutum.
Unfortunately, efforts to enhance the fiber quality of G. hirsutum through hybridization with G.
barbadense have been largely unsuccessful due to the preferential elimination of G. barbadense
alleles in the F2 and later generations (Stephens, 1949). This selective loss of G. barbadense
alleles not only results in extensive segregation distortion (Jiang et al., 2000; Reinisch et al.,
1994), but also leads to the predominant expression of phenotypes that most closely resemble G.
hirsutum. Additionally, there is a reduction in fitness that manifests itself as a decline in vigor
and fertility in advanced generations of G. hirsutum × G. barbadense populations (Stephens,
1950). This phenomenon, termed hybrid breakdown, has severely limited the value of
Page 5 of 62
The Plant Genome: Posted 22 Nov. 2013; doi: 10.3835/plantgenome2013.07.0023
6
interspecific populations for the genetic improvement of fiber quality in Upland cotton. This has
made it particularly difficult, if not impossible, to develop a large number of fertile, interspecific
inbred lines for multi-environment trials on a commercial scale. Therefore, an alternative
breeding approach is needed to widen the genetic base of Upland cotton with novel, favorable
alleles from G. barbadense.
The crossing of G. hirsutum inbred lines possessing stable introgression segments from
G. barbadense with elite Upland cotton cultivars is an approach that could result in the
development of breeding populations for the genetic improvement of fiber quality with a lower
incidence of hybrid breakdown. Through multiple cycles of recombination and selection of
canonical phenotypes from both parental species, it was possible to develop NM24016, an elite
G. hirsutum line with significant introgression from diverse G. barbadense lines that accounts
for an estimated one-third of the mosaic genome (Cantrell and Davis, 2000; Tatineni et al.,
1996). This stable introgressed line was crossed to TM-1, an Upland cotton line that is the
genetic standard of G. hirsutum (Kohel et al., 1970), to develop a cotton mapping population of
recombinant inbred lines (RILs) that has been shown to have tremendous phenotypic diversity,
especially transgressive variation for fiber quality traits (Gore et al., 2012; Percy et al., 2006).
However, the lack of a genetic linkage map, as well as quantitative trait loci (QTLs) associated
with fiber quality properties has restricted the value of this novel mapping resource to the global
cotton community.
The identification of QTL alleles associated with economically important traits in an
intraspecific inbred mapping population with introgression segments from G. barbadense could
facilitate the molecular breeding of higher yielding Upland cultivars with enhanced fiber quality.
Page 6 of 62
The Plant Genome: Posted 22 Nov. 2013; doi: 10.3835/plantgenome2013.07.0023
7
The objectives of this study were (i) to construct a linkage map for the TM-1/NM24016
population and (ii) to identify favorable QTL alleles associated with agronomic and fiber traits.
Materials and methods
Plant materials and phenotypic evaluations
The construction and phenotypic evaluation of the TM-1×NM24016 recombinant inbred
mapping population were previously described (Gore et al., 2012; Percy et al., 2006). Briefly,
TM-1, NM24016, and 98 F5:7 RILs were evaluated in a completely randomized block design at
Las Cruces, NM, and Maricopa, AZ, in 2001 and 2002. In three of the four environments, four
complete replications of the experiment were grown. In 2001, three complete replications of the
experiment were grown at Las Cruces. Experimental units were two-row plots with an inter-row
spacing of 1.01 m at each location. The length of plots was 12.2 m in 2001 and 10 m in 2002.
Mechanical harvesting of plots was performed with a two-row harvester. Prior to mechanical
harvest, boll samples (50 bolls at Maricopa and 25 bolls at Las Cruces) were harvested by hand.
The collected seedcotton samples were ginned using a laboratory 10-saw gin to allow for the
measurement of boll and fiber quality traits. The RIL population and its two parents were
phenotyped for boll size (g boll-1
), lint percentage (%), lint yield (kg ha-1
), plant height (m) at
harvest (only Maricopa environments), fiber length (mm; 2.5%- and 50%-span lengths, the
distance spanned by 2.5% and 50% of the fibers), micronaire (unit), strength (kN m-1
kg-1
),
elongation (%), and uniformity (%). A digital fibrograph was used to measure fiber length, and a
Page 7 of 62
The Plant Genome: Posted 22 Nov. 2013; doi: 10.3835/plantgenome2013.07.0023
8
Fibronaire instrument (Motion Control, Dallas, TX) was used to measure micronaire. A
stelometer was used to measure fiber strength and elongation.
DNA isolation
Self-pollinated seeds from TM-1, NM24016, and 95 of the 98 F5:7 RILs were germinated in Petri
dishes lined with moistened filter paper at 32° C in a growth chamber. Viable self-pollinated
seeds were not available for lines NM26, NM54, and NM59. For each line, root tips were bulk
harvested from an average of ten 5-day-old seedlings. Total genomic DNA was isolated from
homogenized fresh 5-d-old root tissue using 2% cetyltrimethyl ammonium bromide as
previously described (Paterson et al., 1993), followed by purification with an Omega E.Z.N.A.
HiBind DNA column (Omega Bio-Tek, Norcross, GA). The DNA concentration and purity of
each sample were measured with a micro-volume UV-Vis spectrophotometer (NanoDrop
Technologies, Inc., Wilmington, DE).
SSR marker analysis
Genomic DNA samples of TM-1 and NM24016 were first screened with 2,183 SSR markers to
identify polymorphic markers between the two mapping parents. Primer sequences for SSR
markers are available from the CottonGen database (http://www.cottongen.org) and a substantial
number of them are included in a high-density linkage map for an interspecific cross between
TM-1 (G. hirsutum) and 3-79 (G. barbadense) (Fang and Yu, 2012). SSR oligonucleotide
primers were purchased from Sigma Genosys (Woodlands, TX) and Life Technologies (Foster
Page 8 of 62
The Plant Genome: Posted 22 Nov. 2013; doi: 10.3835/plantgenome2013.07.0023

9
City, CA). Forward primers were fluorescently-labeled at the 5′ end with 6-FAM (6-
carboxyfluorescein), HEX (4, 7, 2′, 4′, 5′, 7′-hexachloro-6-carboxyfluorescein), or NED (2, 7′, 8′-
benzo-5′-fluoro-2′, 4, 7-trichloro-5-carboxyfluorescein). PCR assay conditions for SSR marker
loci were as previously described (Fang et al., 2010). Briefly, three pairs of primers that each had
a different fluorescent label were multiplexed in each PCR assay. The 10 µL PCR reaction
included 20 ng genomic DNA, 2.5 µM each of the forward and reverse primers, 3.5 mM MgCl2,
0.2 mM dNTPs, 1 unit of DNA Taq polymerase (Promega Corporation, Madison, WI), and 1x
reaction buffer without MgCl2. Amplification conditions were 95° C for 3 min, followed by 34
cycles of 94° C for 45 s, 55o
C for 45 s, and 72° C for 1 min, with a final step of 72° C for 10
min. Amplified fragments were separated and sized on an automated capillary electrophoresis
system ABI 3730XL (Applied Biosystems, Inc., Foster City, CA). GeneScan-500 ROX (Applied
Biosystems, Inc.) was used as an internal DNA size standard. The output was analyzed with
GeneMapper 4.0 (Applied Biosystems, Inc.).
Of the 2,183 SSR markers that were screened, 538 of them were polymorphic between
the two parents, and were subsequently used to genotype the 95 RILs following the approach of
Fang et al. (2010) as was briefly described in the previous paragraph. We designated duplicated
marker loci by adding a lower-case letter in sequential alphabetical order after the primer name.
As reported in Gore et al. (2012), there was a low incidence of more than two parental alleles (15
loci) and putative non-parental alleles (54 loci; average of 2.5% non-parental alleles per RIL) for
SSR loci. For each SSR locus with more than two parental alleles, the rarest alleles (i.e., lowest
minor allele frequencies) were conservatively converted to missing data to allow for only one
major allele from each parent. In addition, all putative non-parental alleles were converted to
missing data.
Page 9 of 62
The Plant Genome: Posted 22 Nov. 2013; doi: 10.3835/plantgenome2013.07.0023
10
Genotyping-by-sequencing (GBS) marker analysis
We constructed a PstI-MspI GBS library with a set of optimized barcoded adapters (P384A) as
previously described (Poland et al., 2012). The 96-plex library consisted of the two mapping
parents (TM-1 and NM24016) in duplicate and 92 RILs. The constructed library was sequenced
twice on an Illumina HiSeq 2000 platform (Illumina Inc., San Diego, CA), which generated
113.8 M and 160.1 M sequence reads, respectively. SNP identification and population
genotyping were conducted as described by Poland et al. (2012). Briefly, putative biallelic SNPs
were identified by internally aligning sequence tags (i.e., unique sequences within the entire set
of tags) with a maximum mismatch allowance of three nucleotides in a 64 bp tag. In addition,
putative SNPs needed to be present in greater than 20% of the inbred lines. To filter for true
SNPs, a Fisher’s exact test was implemented to determine if the two SNP alleles were
independent in the population of inbred lines. Putative SNPs for which the null hypothesis of
independence was rejected at a significance level of α = 0.05 were converted to SNP calls in the
population.
Linkage map construction
We used 499 SSR loci detected by 459 SSR primer pairs and 491 SNP marker loci to construct a
linkage map with JoinMap version 4.0 software (Van Ooijen, 2006). Linkage groups were
created at a logarithm of odds ratio (LOD) score threshold of 5. Marker orders were estimated
using the maximum likelihood mapping algorithm. Recombination fractions were converted to
Page 10 of 62
The Plant Genome: Posted 22 Nov. 2013; doi: 10.3835/plantgenome2013.07.0023

11
map distances (cM) via the Kosambi mapping function (Kosambi, 1944). For each locus
included in the linkage map, segregation distortion was tested by χ2
analysis (degrees of freedom
= 1) against the expected 1:1 ratio in a RIL population. A Bonferroni correction was used to
control the family-wise error rate for multiple χ2
tests, resulting in an alpha level of 5.95x10⁻⁵
(0.05/841).
Localization of markers on the G. raimondii reference genome sequence
We downloaded the 13 pseudomolecule chromosomes (~750 Mb) of the diploid D5 genome
species G. raimondii (JGI assembly v2.1; http://www.phytozome.net) (Paterson et al., 2012). The
BLASTN version 2.2.26+ algorithm (stand-alone) was used to align context nucleotide
sequences for each of the aforementioned 459 SSR and 491 SNP markers to the G. raimondii
reference genome sequence with an E-value cutoff of 1e-20
for SSR markers and 1e-10
for SNP
markers. A higher E-value cutoff was used for the relatively shorter SNP context sequences
because shorter alignments tend to produce higher E-values (Karlin and Altschul, 1990).
Phenotypic data analysis and heritability estimation
The 10 traits were initially screened for outliers in SAS version 9.3 (SAS Institute, 2012) by
examining the Studentized deleted residuals (Kutner et al., 2004) obtained from mixed linear
models fitted with environment, line, and replication nested within environment as random
effects. For each trait, a best linear unbiased predictor (BLUP) for each line was predicted from a
mixed linear model fitted across environments with ASReml version 3.0 (Gilmour et al., 2009):
Page 11 of 62
The Plant Genome: Posted 22 Nov. 2013; doi: 10.3835/plantgenome2013.07.0023

12
Yijk = µ + envi + line j + env*lineij + rep(env)ik + εijk ,
in which Yijk is an individual phenotypic observation on a single plot; µ is the overall mean; envi
is the effect of the ith
environment; linej is the effect of the jth
line; env*lineij is the effect of the
interaction between the jth
line and the ith environment; rep(env)ik is the effect of the k
th
replication within the ith
environment; and εijk is the random error term. Likelihood ratio tests
were conducted to remove all terms from the model that were not significant at α = 0.05 (Littell
et al., 1996). The final model was used to estimate BLUPs for each line. The variance
components from these final models were used to estimate broad-sense heritability on an
individual plot ( 2
pH ) and a line-mean basis ( 2
lH ) per Holland et al. (2003). The standard errors
of heritability estimates were approximated with the delta method (Holland et al., 2003).
QTL analysis
For BLUPs of each trait, we mapped additive QTL effects with inclusive composite interval
mapping (ICIM) (Li et al., 2007), a variant of composite interval mapping (CIM), in QTL
IciMapping version 3.2 software (https://www.integratedbreeding.net/). The ICIM method
consists of two stages. In the first stage, stepwise regression was used to fit individual markers in
a general linear model. For each trait, the probability levels for markers to enter and exit the
model were calculated by a permutation procedure run 1,000 times (Anderson and Braak, 2003).
The P-value corresponding to an overall type I error rate of α = 0.05 was approximately 1 x 10⁻⁴
for the RIL population. To prevent a marker from entering and exiting the model during the same
Page 12 of 62
The Plant Genome: Posted 22 Nov. 2013; doi: 10.3835/plantgenome2013.07.0023
13
step, the entry threshold was set to P = 1 x 10⁻⁴
, while the exit threshold was set to P = 2 x 10⁻⁴
.
In the second stage, one-dimensional scanning across the entire genome at 1 cM steps was
conducted based on coefficient estimation in the first stage. For each trait, a permutation
procedure (Churchill and Doerge, 1994) was run 1,000 times in the QTL IciMapping version 3.2
software to select the LOD threshold for an experiment-wise type-I error rate of α = 0.05. The
LOD thresholds at α = 0.05 ranged from 3.33 to 3.45 with an average LOD score of 3.39.
Results
Genetic properties of the TM-1×NM24016 linkage map
We used 2,183 simple sequence repeat (SSR) markers to screen TM-1 and NM24016 for
polymorphisms and found 538 polymorphic markers between the two mapping parents. When
the 538 SSR markers were used to evaluate the TM-1×NM24016 mapping population, 65 of
them were identified as monomorphic within the population. An additional 14 SSR markers did
not produce distinct, reproducible patterns of polymorphism among lines and thus were not used
for linkage map construction. Of the remaining 459 SSR markers, 419 scored a single locus each,
while the other 40 scored two loci each, for a total of 499 SSR marker loci. In a complementary
experiment, the parents and population were genotyped with a highly multiplexed, genotyping-
by-sequencing (GBS) approach to further increase the number of markers available for
constructing a linkage map. With this approach that simultaneously combines polymorphism
identification and genotyping, 491 biallelic GBS-based SNP loci were scored in parallel across
Page 13 of 62
The Plant Genome: Posted 22 Nov. 2013; doi: 10.3835/plantgenome2013.07.0023
14
the parents and their progeny with high confidence. Taken together, the two genotyping
approaches scored a total of 990 SSR and SNP loci across the RIL population.
Of the 990 marker loci used for linkage map construction, 841 could be assigned to 117
linkage groups, while the other 140 could not be assigned to any linkage group (Table 1). The
number of markers on each linkage group ranged from 2 to 57, and the linkage map covered a
total of ~2,061 cM of the cotton genome. If not considering the three linkage groups that each
consisted entirely of markers that cosegregated, the length of each linkage group ranged from
0.51 to 55.46 cM, while the average distance between two markers for linkage groups ranged
from 0.30 to 17.50 cM. Of the 841 mapped marker loci, statistically significant segregation
distortion was detected for 145 loci (17.2%) at a Bonferroni-corrected threshold of 5%. In
general, there was a bias for TM-1 alleles at these 145 loci, suggesting a selective elimination of
alleles from NM24016. Interestingly, loci with distorted segregation ratios were especially
prevalent for two linkage groups that mapped to chromosomes 8 and 23, accounting for 40.0% of
the 145 loci. The average residual heterozygosity for each marker locus ranged from 0 to
14.29%, with an overall average of 3.88%. For each RIL, the average residual heterozygosity
was 3.85% and ranged from 0 to 25.72%.
Comparative analysis with the TM-1×NM24016 linkage map
We putatively assigned 116 of the 117 linkage groups to specific chromosomes of
tetraploid cotton using the intersection of SSR markers between the TM-1/NM24016 and
previously published linkage maps (Blenda et al., 2012; Fang and Yu, 2012) in combination with
anchoring markers to the G. raimondii (D5 diploid) reference genome sequence (Paterson et al.,
Page 14 of 62
The Plant Genome: Posted 22 Nov. 2013; doi: 10.3835/plantgenome2013.07.0023
15
2012). On average, each chromosome had 4.33 linkage groups, but marker loci were unevenly
distributed among the 26 chromosomes (Table 1). Notably, no marker loci were mapped to
chromosome 18, while chromosome 4 only had two loci that spanned 4.07 cM. In contrast,
chromosomes 11 and 19 had the highest marker densities with 84 and 81 loci, respectively.
There was a moderately strong positive correlation (R2
= 0.42, P < 0.0005) between the number
of SSR and SNP marker loci per chromosome, indicating that both SSR and SNP loci were
unevenly distributed in a related manner. Interestingly, there was essentially no correlation (R2 =
0.04, P = 0.33) between the number of markers per chromosome and estimates of physical
chromosome size (Mb) from G. raimondii (D5 diploid) and G. arboreum L. (A2 diploid)
(Paterson et al., 2012; Wang et al., 2008). With very few exceptions, chromosomal assignments
based on existing linkage maps were also concordant with those inferred by aligning marker
sequences to the G. raimondii genome sequence (Table S1). However, there were 141 markers
(113 SNPs and 28 SSRs) that could not be aligned to the genome sequence (no hits found). Of
these 141 markers, 114, 26, and 1 were linkage mapped to AT (Chr.01-13), DT (Chr.14-26), and
unknown chromosomes, respectively.
We compared the colinearity of SSR markers shared between our intraspecific linkage
map and an existing high-density linkage map constructed for an interspecific RIL population
(G. hirsutum TM-1× G. barbadense 3-79) that also used TM-1 as the female parent (Fang and
Yu, 2012). A total of 316 SSR marker loci from 99 linkage groups of the TM-1×NM24016 map
were found to also exist in the TM-1×3-79 linkage map. Among the 316 shared marker loci, 187
of them were perfectly collinear between the two linkage maps. In contrast, there were 129
discordant marker loci nearly evenly split between AT (63 loci) and DT (66 loci) chromosomes
(Supplementary Table S1). Furthermore, these discrepancies in collinearity were restricted to
Page 15 of 62
The Plant Genome: Posted 22 Nov. 2013; doi: 10.3835/plantgenome2013.07.0023

16
only 19 and 16 linkage groups assigned to AT and DT chromosomes, respectively. The alignment
of markers to the G. raimondii (D5 diploid) genome sequence, however, revealed that TM-
1×NM24016 map positions for at least 17 of the 66 discordant loci (25.8%) mapping to DT
chromosomes were collinear with their physical positions. The availability of a draft genome
sequence for G. hirsutum and G. barbadense will be critical to more precisely resolve marker
order along a chromosome and shed light on potential cryptic structural variation.
Heritabilities and QTL mapping of traits in the TM-1×NM24016 population
With a mixed model that corrected for systematic environmental effects, we reassessed 10
agronomic and fiber quality traits that had been scored on the TM-1×NM24016 population at
two locations in 2001 and 2002 (Percy et al., 2006). Similar to the findings of Percy et al. (2006),
the midparent BLUPs, as well as the mean and range of progeny RIL BLUPs revealed substantial
variability for the 10 traits, with RIL progeny especially showing transgressive variation for fiber
quality traits (Table 2). Estimates of broad-sense heritabilities on an individual plot basis ( 2
pH )
ranged from 0.30 to 0.68. In contrast, estimates of broad-sense heritabilities on a line-mean basis
( 2
lH ) ranged from 0.85 to 0.95, which were slightly higher than broad-sense heritability
estimates obtained by Percy et al (2006). Thus, replication of the experiment across multiple
environments provided a 35 to 72% increase of mean heritability for these 10 traits. This has
important implications for complex trait dissection because the statistical power to detect QTLs
is higher for traits with relatively higher heritability (Yu et al., 2008).
The estimated BLUPs for the 10 agronomic and fiber traits were used to map QTLs with
the inclusive composite interval mapping (ICIM) procedure. The QTL analysis identified a total
Page 16 of 62
The Plant Genome: Posted 22 Nov. 2013; doi: 10.3835/plantgenome2013.07.0023
17
of six QTLs for five traits at an experiment-wise type-I error rate of 5% (Table 3). Given that the
sample size of the TM-1×NM24016 mapping population (n = 95) only has adequate statistical
power to repeatedly detect large effect QTLs (Xu, 2003), we searched for QTLs with more
modest effects at an experiment-wise type-I error rate of 20%. With this less conservative type-I
error rate, an additional 22 QTLs were identified (Supplementary Table S2). When considering a
combined total of 28 QTLs, the number of QTLs associated with each trait ranged from one (lint
yield, plant height, 2.5%- and 50%-span length) to seven (fiber strength). Given that the 22
weaker effect QTLs were only identified with a relaxed type-I error rate, we focused on the six
QTLs that were declared significant at the more stringent genome-wide significance threshold.
These six QTLs were distributed among chromosomes 11, 15, 17, 19, and 25 (2 QTLs).
One of the two QTLs for fiber length uniformity mapped to a position on chromosome 25 that
was coincident with the 2.5%-span length QTL. Interestingly, these two QTLs on chromosome
25 showed opposite sign allelic effects and there was a modest negative correlation (R2 = 0.31, P
< 0.0001) between the BLUPs of these two fiber traits. The percent variance explained by an
individual QTL ranged from approximately 14 to 22%. Length uniformity was the only trait for
which two QTLs were identified, with a QTL each located on chromosomes 15 and 25. Taken
together, these two QTLs accounted for approximately 37% of the total variance for length
uniformity and approximately 42% of genetic variance. Interestingly, both parents contributed
favorable alleles for agronomic and fiber traits. Of the six QTLs identified, four of them had
positive additive effects, implying a higher value for boll size, fiber strength, and length
uniformity conferred by alleles from TM-1. The other two QTLs had negative additive effects,
suggesting that TM-1 contributed alleles that reduced lint yield and 2.5%-span length at these
two loci.
Page 17 of 62
The Plant Genome: Posted 22 Nov. 2013; doi: 10.3835/plantgenome2013.07.0023

18
Discussion
In general, G. barbadense has superior fiber quality, but is lower yielding and less adapted to
cotton growing regions relative to G. hirsutum. Unfortunately, efforts to transfer novel genetic
variation for fiber traits from G. barbadense to modern Upland cotton have been repeatedly
slowed by hybrid breakdown in the F2 and later generations (Jiang et al., 2000; Reinisch et al.,
1994; Stephens, 1949; Stephens, 1950). Elite G. hirsutum cotton lines with stabilized
introgression from G. barbadense could be used as parental lines to potentially help overcome
this genetic barrier (Cantrell and Davis, 2000; Tatineni et al., 1996), but a greater wealth of
genetic and genomic resources is needed to accelerate such an effort in molecular breeding
programs of Upland cotton. To address this issue, we constructed a linkage map for an immortal
Upland cotton mapping population with introgressed segments from G. barbadense and
conducted a QTL analysis of 10 agronomic and fiber traits. Our study is the first to use a GBS
approach to simultaneously identify and score SNPs within a cotton mapping population and
identify QTLs for complex trait variation with this novel mapping resource.
We constructed an intraspecific linkage map of tetraploid cotton with 841 SSR and
biallelic GBS-based SNP loci that spanned 2,061.06 cM of the genome. These 841 marker loci
were assembled into 117 linkage groups and of which 116 could be putatively assigned to 25 of
the 26 cotton chromosomes. The tetraploid cotton genome has an estimated genetic distance of
4,070 cM (Blenda et al., 2012), thus the 117 linkage groups covered 50.6% of the genome. As
would be expected for elite Upland cotton germplasm (Van Deynze et al., 2009), this incomplete
genome coverage is likely attributed to the low level of nucleotide diversity that exists between
Page 18 of 62
The Plant Genome: Posted 22 Nov. 2013; doi: 10.3835/plantgenome2013.07.0023
19
TM-1 and NM24016 (Lu et al., 2009) for the single-copy genomic fraction that the GBS method
preferentially targeted. Such low levels of diversity have also limited past efforts to construct
linkage maps with complete genome coverage for Upland cotton (Byers et al., 2012; Lin et al.,
2009; Shen et al., 2007; Ulloa et al., 2002; Zhang et al., 2009).
The 841 SSR and SNP marker loci were unevenly distributed among the 26
chromosomes of cotton (Table 1). Chromosomes 11 (84 loci) and 19 (81 loci) had the highest
number of mapped SSR and SNP marker loci, while chromosomes 18 (0 loci) and 4 (2 loci) had
the fewest. Similarly, Lin et al. (2010) revealed a biased distribution of mapped SSR markers
among cotton chromosomes based on the integration of seven interspecific linkage maps, with
the most SSR markers mapped to chromosomes 11 and 19 and least to chromosomes 2 and 4.
The unbalanced chromosomal distribution of marker loci is unlikely to be entirely attributed to
the genomic location of introgressed segments from G. barbadense, because 40.0% of the 145
loci with highly significant segregation distortion—potential signatures of introgression
segments in G. hirsutum mapping populations (Zhang et al., 2012)—were contained in only two
linkage groups that mapped to chromosomes 8 and 23. Furthermore, even though a higher rate of
polymorphism was observed between TM-1 and NM24016 for chromosomes 11 and 19, only
9.5-11.1% of the marker loci on these two chromosomes showed highly significant segregation
distortion, respectively.
Given that this is the first application of GBS in a cotton RIL population, it is not possible
to compare our results to that of other cotton studies. However, if the genome structure and
patterns of diversity for tetraploid cotton resembles that of other species such as barley and
wheat, the employed two-enzyme GBS approach is expected to identify and score SNPs evenly
among chromosomes with respect to chromosome length, as well as at a fairly uniform density
Page 19 of 62
The Plant Genome: Posted 22 Nov. 2013; doi: 10.3835/plantgenome2013.07.0023
20
along chromosomes with the exception of recombinationally suppressed centromeric regions
(Poland et al., 2012). However, essentially no correlation (R2 = 0.04, P = 0.33) was found
between marker number per chromosome and physical chromosome size for the TM-
1×NM24016 linkage map. This non-uniform marker coverage of the tetraploid cotton genome
conceivably resulted from large, monomorphic chromosomal blocks of identity-by-descent
(IBD) between TM-1 and NM24016. With the implementation of SSR markers, Fang et al.
(2013) identified 23 blocks of potential IBD of 20 cM or larger in a diversity panel of 193
Upland cotton cultivars. If pervasive in the modern germplasm pool, such large blocks of IBD
will greatly impede the construction of medium- to high-density intraspecific linkage maps for
elite Upland cotton lines.
In concordance with results of a comprehensive analysis conducted by Percy et al. (2006)
on the same phenotypic data set, we detected remarkable transgressive variation for fiber quality
traits and showed the 10 traits to be highly heritable (Table 2). These findings suggest that RILs
with extreme phenotypes inherited novel combinations of complementary alleles from TM-1 and
NM24016 (deVicente and Tanksley, 1993). The extent to which the 10 agronomic and fiber traits
were heritable within the TM-1×NM24016 population was estimated as a function of variance
components from mixed linear models (Holland et al., 2003). Replicated evaluation of the
intraspecific RIL population in Las Cruces, NM, and Maricopa, AZ, over two years resulted in
broad-sense heritabilities on a line-mean basis ( 2
lH ) that ranged from 0.85 to 0.95 for the ten
traits. These very high heritabilities suggest that the 10 traits should respond very favorably to
selection based on line means when using the identical experimental design and are
predominantly controlled by QTLs (Holland et al., 2003; Hung et al., 2012).
Page 20 of 62
The Plant Genome: Posted 22 Nov. 2013; doi: 10.3835/plantgenome2013.07.0023

21
With ICIM of the 10 agronomic and fiber traits within the TM-1×NM24016 population,
we identified a total of six QTLs associated with five traits at an experiment-wise type-I error
rate of 5% (Table 3). Only a single QTL was detected for each of boll size, lint yield, fiber
strength, and 2.5%-span length, while two QTLs were detected for length uniformity. Although
these five traits are highly heritable (Table 2), the detected QTLs explained only approximately
20 to 42% of the estimated heritability for their associated traits. However, the proportion of
phenotypic variance explained by each QTL is likely to be substantially overestimated with a
mapping population of only 100 individuals (Beavis, 1998). Furthermore, no QTLs were
detected for lint percentage, plant height, micronaire, fiber elongation, and 50%-span length at an
experiment-wise type-I error rate of 5%, which are also highly heritable traits.
A number of factors are likely contributing to the heritability remaining largely
unexplained for these 10 traits. Even though the linkage map consisted of 841 SSR and SNP loci,
we estimated that about 50% of the tetraploid cotton genome was not evaluated in the QTL
analysis. Such a large portion of the genome is likely to harbor additional QTLs, but some of
these QTLs could be interspersed among large blocks of IBD. In addition, a sample size of only
95 RILs does not provide sufficient statistical power to repeatedly identify QTLs with small to
intermediate effects (Xu, 2003). An additional 22 QTLs with relatively weaker effects were
detected for these traits at a less stringent experiment-wise type-I error rate of 20%
(Supplementary Table S2), implying that these traits have a polygenic inheritance and are likely
more suitable for genomic prediction models (Gore, unpublished data). The problem of “missing
heritability” will need to be addressed through the construction and evaluation of larger mapping
populations for cotton in combination with higher coverage linkage maps. Irrespective of these
statistical limitations, these 28 identified QTLs still enhance concerted efforts for genomics-
Page 21 of 62
The Plant Genome: Posted 22 Nov. 2013; doi: 10.3835/plantgenome2013.07.0023
22
assisted selection in Upland cotton, but the true novelty of these QTLs will need to be assessed
through a comprehensive meta-analysis of QTLs for agronomic and fiber quality in multiple
cotton RIL populations (J. Zhang, unpublished data).
Conclusions
The construction of high-density linkage maps for genome-wide QTL analysis in intraspecific
cotton populations has long been a formidable challenge. The implementation of a GBS method
combined with fluorescence-based SSR genotyping enabled the construction of a linkage map
with 841 SSR and SNP loci that covered half of the tetraploid cotton genome, which enabled the
identification of favorable QTL alleles that could be valuable for the genetic improvement of
Upland cotton. However, modification of the implemented GBS method is likely needed for a
higher degree of SNP marker saturation for intraspecific cotton populations. Such modification
could include the selection of more appropriate restriction enzymes for GBS in G. hirsutum that
will lead to a higher frequency and more uniform distribution of SNP markers among
chromosomes. This could be accomplished through an in silico digestion of the diploid and
eventual tetraploid cotton genome sequences, which has been effective for maize and soybean
(Elshire et al., 2011; Gore et al., 2009; Varala et al., 2011). In addition, the sequence variant-
calling pipeline can be enhanced to also simultaneously discover and score presence/absence
(dominant) and insertion/deletion (indel) markers. With a higher density map on a genome-wide
level, it will then be possible to more comprehensively exploit the value of introgressed mapping
populations for the transfer of novel variation from G. barbadense or wild G. hirsutum lines to
Upland cotton breeding programs. However, such a strategy needs to be combined with a
Page 22 of 62
The Plant Genome: Posted 22 Nov. 2013; doi: 10.3835/plantgenome2013.07.0023
23
powerful mating design such as nested association mapping (McMullen et al., 2009), which will
permit the genetic architecture of complex traits to be dissected at an unprecedented level and
further strengthen the foundation for genomics-assisted selection in Upland cotton.
Acknowledgements
We thank past members of the Percy, Zhang, and Cantrell laboratories for their assistance in
phenotypic data collection and members of the Gore, Fang, and Poland laboratories for DNA
isolation, SSR genotyping, and GBS library construction. This work was supported by the
USDA-ARS and Cotton Incorporated. Mention of trade names or commercial products in this
publication is solely for the purpose of providing specific information and does not imply
recommendation or endorsement by the USDA. The USDA is an equal opportunity provider and
employer.
Page 23 of 62
The Plant Genome: Posted 22 Nov. 2013; doi: 10.3835/plantgenome2013.07.0023
24
References
Anderson, M., and C.T. Braak. 2003. Permutation tests for multi-factorial analysis of variance. J.
Stat. Comput. Sim. 73:85-113.
Beavis, W.D. 1998. QTL analyses: power, precision, and accuracy, p. 145-162, In A. H.
Paterson, ed. Molecular dissection of complex traits. CRC Press, New York.
Blenda, A., D.D. Fang, J.F. Rami, O. Garsmeur, F. Luo, and J.M. Lacape. 2012. A high density
consensus genetic map of tetraploid cotton that integrates multiple component maps
through molecular marker redundancy check. PLoS ONE 7:e45739.
Brubaker, C.L., F.M. Bourland, and J.F. Wendel. 1999. The origin and domestication of cotton,
p. 3-32, In C. W. Smith and J. T. Cothren, eds. Cotton: Origin, history, technology, and
production. Wiley & Sons, New York.
Byers, R., D. Harker, S. Yourstone, P. Maughan, and J. Udall. 2012. Development and mapping
of SNP assays in allotetraploid cotton. Theor. Appl. Genet. 124:1201-1214.
Cantrell, R.G., and D.D. Davis. 2000. Registration of NM24016, an interspecific-derived cotton
genetic stock. Crop Sci. 40:1208
Churchill, G.A., and R.W. Doerge. 1994. Empirical threshold values for quantitative trait
mapping. Genetics 138:963-71.
deVicente, M.C., and S.D. Tanksley. 1993. QTL analysis of transgressive segregation in an
interspecific tomato cross. Genetics 134:585-96.
Elshire, R.J., J.C. Glaubitz, Q. Sun, J.A. Poland, K. Kawamoto, E.S. Buckler, and S.E. Mitchell.
2011. A robust, simple genotyping-by-sequencing (GBS) approach for high diversity
species. PLoS ONE 6:e19379.
Page 24 of 62
The Plant Genome: Posted 22 Nov. 2013; doi: 10.3835/plantgenome2013.07.0023

25
Fang, D., L. Hinze, R. Percy, P. Li, D. Deng, and G. Thyssen. 2013. A microsatellite-based
genome-wide analysis of genetic diversity and linkage disequilibrium in Upland cotton
(Gossypium hirsutum L.) cultivars from major cotton-growing countries. Euphytica
191:391-401.
Fang, D.D., and J.Z. Yu. 2012. Addition of 455 microsatellite marker loci to the high-density
Gossypium hirsutum TM-1 x G. barbadense 3-79 genetic map. J. Cotton Sci. 16:229-248.
Fang, D.D., J. Xiao, P.C. Canci, and R.G. Cantrell. 2010. A new SNP haplotype associated with
blue disease resistance gene in cotton (Gossypium hirsutum L.). Theor. Appl. Genet.
120:943-53.
Fryxell, P.A. 1968. A redefinition of the tribe Gossypieae. Bot. Gaz. 129:296-308.
Fryxell, P.A. 1971. Phenetic analysis and the phylogeny of the diploid species of Gossypium L.
(Malvaceae). Evolution 25:554-562.
Fryxell, P.A. 1992. A revised taxonomic interpretation of Gossypium L. (Malvaceae). Rheedea
2:108-165.
Gilmour, A.R., B. Gogel, B. Cullis, R. Thompson, D. Butler, M. Cherry, D. Collins, D.
Dutkowski, S. Harding, and K. Haskard. 2009. ASReml user guide release 3.0. VSN
International Ltd, Hemel Hempstead, UK.
Gore, M.A., R.G. Percy, J. Zhang, D.D. Fang, and R.G. Cantrell. 2012. Registration of the TM-
1/NM24016 cotton recombinant inbred mapping population. J. Plant Reg. 6:124-127.
Gore, M.A., J.M. Chia, R.J. Elshire, Q. Sun, E.S. Ersoz, B.L. Hurwitz, J.A. Peiffer, M.D.
McMullen, G.S. Grills, J. Ross-Ibarra, D.H. Ware, and E.S. Buckler. 2009. A first-
generation haplotype map of maize. Science 326:1115-1117.
Page 25 of 62
The Plant Genome: Posted 22 Nov. 2013; doi: 10.3835/plantgenome2013.07.0023
26
Holland, J.B., W.E. Nyquist, and C.T. Cervantes-Martínez. 2003. Estimating and interpreting
heritability for plant breeding: An update. Plant Breed. Rev. 22:9-112.
Hung, H.Y., C. Browne, K. Guill, N. Coles, M. Eller, A. Garcia, N. Lepak, S. Melia-Hancock,
M. Oropeza-Rosas, S. Salvo, N. Upadyayula, E.S. Buckler, S. Flint-Garcia, M.D.
McMullen, T.R. Rocheford, and J.B. Holland. 2012. The relationship between parental
genetic or phenotypic divergence and progeny variation in the maize nested association
mapping population. Heredity 108:490-499.
Jiang, C.-X., P.W. Chee, X. Draye, P.L. Morrell, C.W. Smith, and A.H. Paterson. 2000.
Multilocus interactions restrict gene introgression in interspecific populations of
polyploid Gossypium (Cotton). Evolution 54:798-814.
Karlin, S., and S.F. Altschul. 1990. Methods for assessing the statistical significance of
molecular sequence features by using general scoring schemes. Proc. Natl. Acad. Sci.
USA 87:2264-2268.
Kohel, R.J., T.R. Richmond, and C.F. Lewis. 1970. Texas Marker-1. Description of a genetic
standard for Gossypium hirsutum L. Crop Sci. 10:670-671.
Kosambi, D.D. 1944. The estimation of map distances from recombination values. Ann. Eugen.
12:172-175.
Kutner, M.H., C.J. Nachtsheim, J. Neter, and W. Li. 2004. Applied linear statistical models. 4th
Edition. McGraw-Hill, Boston, MA.
Li, H., G. Ye, and J. Wang. 2007. A modified algorithm for the improvement of composite
interval mapping. Genetics 175:361-374.
Lin, Z., D. Yuan, and X. Zhang. 2010. Mapped SSR markers unevenly distributed on the cotton
chromosomes. Frontiers of Agriculture in China 4:257-264.
Page 26 of 62
The Plant Genome: Posted 22 Nov. 2013; doi: 10.3835/plantgenome2013.07.0023

27
Lin, Z., Y. Zhang, X. Zhang, and X. Guo. 2009. A high-density integrative linkage map for
Gossypium hirsutum. Euphytica 166:35-45.
Littell, R.C., G.A. Milliken, W.W. Stroup, and R. Wolfinger. 1996. SAS system for mixed
models. SAS Publishing, Cary, NC.
Lu, Y., J. Curtiss, R.G. Percy, S.E. Hughs, S. Yu, and J. Zhang. 2009. DNA polymorphisms of
genes involved in fiber development in a selected set of cultivated tetraploid cotton. Crop
Sci. 49:1695-1704.
May, O.L., D.T. Bowman, and D.S. Calhoun. 1995. Genetic diversity of U.S. Upland cotton
cultivars released between 1980 and 1990. Crop Sci. 35:1570-1574.
McMullen, M.D., S. Kresovich, H.S. Villeda, P. Bradbury, H. Li, Q. Sun, S. Flint-Garcia, J.
Thornsberry, C. Acharya, C. Bottoms, P. Brown, C. Browne, M. Eller, K. Guill, C.
Harjes, D. Kroon, N. Lepak, S.E. Mitchell, B. Peterson, G. Pressoir, S. Romero, M.
Oropeza Rosas, S. Salvo, H. Yates, M. Hanson, E. Jones, S. Smith, J.C. Glaubitz, M.
Goodman, D. Ware, J.B. Holland, and E.S. Buckler. 2009. Genetic properties of the
maize nested association mapping population. Science 325:737-740.
Meredith, W.R., Jr. 2000. Cotton yield progress - why has it reached a plateau? Better Crops
84:6-9.
Paterson, A.H., C.L. Brubaker, and J.F. Wendel. 1993. A rapid method for extraction of cotton
(Gossypium spp.) genomic DNA suitable for RFLP or PCR analysis. Plant Mol. Biol.
Rep. 11:122-127.
Paterson, A.H., R.K. Boman, S.M. Brown, P.W. Chee, J.R. Gannaway, A.R. Gingle, O.L. May,
and C.W. Smith. 2004. Reducing the genetic vulnerability of cotton. Crop Sci. 44:1900-
1901.
Page 27 of 62
The Plant Genome: Posted 22 Nov. 2013; doi: 10.3835/plantgenome2013.07.0023
28
Paterson, A.H., J.F. Wendel, H. Gundlach, H. Guo, J. Jenkins, D. Jin, D. Llewellyn, K.C.
Showmaker, S. Shu, J. Udall, M.J. Yoo, R. Byers, W. Chen, A. Doron-Faigenboim, M.V.
Duke, L. Gong, J. Grimwood, C. Grover, K. Grupp, G. Hu, T.H. Lee, J. Li, L. Lin, T.
Liu, B.S. Marler, J.T. Page, A.W. Roberts, E. Romanel, W.S. Sanders, E. Szadkowski, X.
Tan, H. Tang, C. Xu, J. Wang, Z. Wang, D. Zhang, L. Zhang, H. Ashrafi, F. Bedon, J.E.
Bowers, C.L. Brubaker, P.W. Chee, S. Das, A.R. Gingle, C.H. Haigler, D. Harker, L.V.
Hoffmann, R. Hovav, D.C. Jones, C. Lemke, S. Mansoor, M. ur Rahman, L.N. Rainville,
A. Rambani, U.K. Reddy, J.K. Rong, Y. Saranga, B.E. Scheffler, J.A. Scheffler, D.M.
Stelly, B.A. Triplett, A. Van Deynze, M.F. Vaslin, V.N. Waghmare, S.A. Walford, R.J.
Wright, E.A. Zaki, T. Zhang, E.S. Dennis, K.F. Mayer, D.G. Peterson, D.S. Rokhsar, X.
Wang, and J. Schmutz. 2012. Repeated polyploidization of Gossypium genomes and the
evolution of spinnable cotton fibres. Nature 492:423-7.
Percy, R.G., R.G. Cantrell, and J. Zhang. 2006. Genetic variation for agronomic and fiber
properties in an introgressed recombinant inbred population of cotton. Crop Sci. 46:1311-
1317.
Poland, J.A., P.J. Brown, M.E. Sorrells, and J.L. Jannink. 2012. Development of high-density
genetic maps for barley and wheat using a novel two-enyme genotyping-by-sequencing
approach. PLoS ONE 7:e32253.
Reinisch, A.J., J.M. Dong, C.L. Brubaker, D.M. Stelly, J.F. Wendel, and A.H. Paterson. 1994. A
detailed RFLP map of cotton, Gossypium hirsutum x Gossypium barbadense:
chromosome organization and evolution in a disomic polyploid genome. Genetics
138:829-47.
SAS Institute. 2012. The SAS system for Windows. Release 9.3. SAS Inst., Cary, NC.
Page 28 of 62
The Plant Genome: Posted 22 Nov. 2013; doi: 10.3835/plantgenome2013.07.0023
29
Shen, X., W. Guo, Q. Lu, X. Zhu, Y. Yuan, and T. Zhang. 2007. Genetic mapping of quantitative
trait loci for fiber quality and yield trait by RIL approach in Upland cotton. Euphytica
155:371-380.
Stephens, S.G. 1949. The cytogenetics of speciation in Gossypium. I. Selective elimination of the
donor parent genotype in interspecific backcrosses. Genetics 34:627-37.
Stephens, S.G. 1950. The internal mechanism of speciation in Gossypium. Bot. Rev. 16:115-149.
Tatineni, V., R.G. Cantrell, and D.D. Davis. 1996. Genetic diversity in elite cotton germplasm
determined by morphological characteristics and RAPDs. Crop Sci. 36:186-192.
Ulloa, M., W.R. Meredith Jr, Z.W. Shappley, and A.L. Kahler. 2002. RFLP genetic linkage maps
from four F2.3 populations and a joinmap of Gossypium hirsutum L. Theor. Appl. Genet.
104:200-208.
Van Deynze, A., K. Stoffel, M. Lee, T. Wilkins, A. Kozik, R. Cantrell, J. Yu, R. Kohel, and D.
Stelly. 2009. Sampling nucleotide diversity in cotton. BMC Plant Biology 9:125.
Van Esbroeck, G.A., D.T. Bowman, D.S. Calhoun, and O.L. May. 1998. Changes in the genetic
diversity of cotton in the USA from 1970 to 1995. Crop Sci. 38:33-37.
Kyazma B.V. 2006. JoinMap 4.0: Software for the calculation of genetic linkage maps in
experimental populations. Kyazma B.V., Wageningen, The Netherlands.
Varala, K., K. Swaminathan, Y. Li, and M.E. Hudson. 2011. Rapid genotyping of soybean
cultivars using high throughput sequencing. PLoS ONE 6:e24811.
Wang, K., B. Guan, W. Guo, B. Zhou, Y. Hu, Y. Zhu, and T. Zhang. 2008. Completely
distinguishing individual A-genome chromosomes and their karyotyping analysis by
multiple bacterial artificial chromosome fluorescence in situ hybridization. Genetics
178:1117-1122.
Page 29 of 62
The Plant Genome: Posted 22 Nov. 2013; doi: 10.3835/plantgenome2013.07.0023

30
Wendel, J.F., and R.C. Cronn. 2003. Polyploidy and the evolutionary history of cotton. Adv.
Agron. 78:139-186
Wendel, J.F., C.L. Brubaker, and A.E. Percival. 1992. Genetic diversity in Gossypium hirsutum
and the origin of Upland cotton. Am. J. Bot. 79:1291-1310
Wendel, J.F., C. Brubaker, I. Alvarez, R. Cronn, and J.M. Stewart. 2009. Evolution and natural
history of the cotton genus, p. 3-22, In A. H. Paterson, ed. Genetics and genomics of
cotton, Vol. 3. Springer US.
Xu, S. 2003. Theoretical basis of the Beavis effect. Genetics 165:2259-2268.
Yu, J., J.B. Holland, M.D. McMullen, and E.S. Buckler. 2008. Genetic design and statistical
power of nested association mapping in maize. Genetics 178:539-551.
Zhang, K., J. Zhang, J. Ma, S. Tang, D. Liu, Z. Teng, D. Liu, and Z. Zhang. 2012. Genetic
mapping and quantitative trait locus analysis of fiber quality traits using a three-parent
composite population in Upland cotton (Gossypium hirsutum L.). Mol. Breeding 29:335-
348.
Zhang, Z.-S., M.-C. Hu, J. Zhang, D.-J. Liu, J. Zheng, K. Zhang, W. Wang, and Q. Wan. 2009.
Construction of a comprehensive PCR-based marker linkage map and QTL mapping for
fiber quality traits in upland cotton (Gossypium hirsutum L.). Mol. Breeding 24:49-61.
Page 30 of 62
The Plant Genome: Posted 22 Nov. 2013; doi: 10.3835/plantgenome2013.07.0023

31
Table 1. Distribution of 841 simple-sequence repeat (SSR) and single-nucleotide polymorphism
(SNP) marker loci among linkage groups (LGs) and the 26 tetraploid cotton chromosomes.
Chromosome Total No. SSRs No. SNPs No. LGs Length, cM
c01 23 10 13 2 51.55
c02 11 11 0 2 27.23
c03 41 23 18 6 123.81
c04 2 2 0 1 4.07
c05 20 14 6 5 25.14
c06 49 12 37 6 132.48
c07 21 18 3 6 58.68
c08 71 30 41 3 73.26
c09 37 15 22 4 114.14
c10 23 7 16 3 106.93
c11 84 26 58 6 102.90
c12 58 32 26 10 188.40
c13 39 22 17 5 133.90
c14 12 6 6 3 26.93
c15 30 15 15 3 57.84
c16 20 14 6 1 40.67
c17 14 13 1 5 56.67
c18 0 0 0 0 0.00
c19 81 46 35 11 186.07
c20 23 15 8 6 55.90
c21 37 26 11 5 88.66
c22 10 5 5 3 43.92
c23 46 21 25 3 98.26
c24 28 15 13 7 92.71
c25 42 23 19 6 98.30
c26 12 7 5 4 50.68
unknown 7 1 6 1 21.95
Total 841 429 412 117 2061.06
Page 31 of 62
The Plant Genome: Posted 22 Nov. 2013; doi: 10.3835/plantgenome2013.07.0023

32
Table 2. Means and ranges of BLUPs for 10 traits evaluated within the TM-1×NM24016 population, midparent values, and estimated
broad-sense heritabilities on an individual plot basis ( 2
pH ) and line-mean basis ( 2
lH ) with their standard error (S.E.) in four summer
environments: Maricopa, AZ, and Las Cruces, NM, across two years.
RIL population Parents
Heritabilities
Traits Mean Range NM24016 TM-1 Midparent 2ˆpH S.E. ( 2ˆ
pH ) 2ˆlH S.E. ( 2ˆ
lH )
Boll size (g boll-1
) 4.88 4.15–5.95 4.45 6.00 5.23 0.55 0.04 0.93 0.01
Lint percentage (%) 34.64 30.44–42.61 36.28 33.53 34.91 0.68 0.03 0.95 0.01
Lint yield (kg ha-1
) 1165.90 917.14–1981.83 1050.59 1342.92 1196.76 0.48 0.05 0.85 0.03
Plant height (m) 1.16 0.96–1.42 1.13 1.05 1.09 0.46 0.05 0.86 0.03
Micronaire (unit) 4.42 3.68–5.49 4.27 4.89 4.58 0.62 0.04 0.94 0.01
Fiber elongation (%) 7.16 5.57–8.37 6.65 7.28 6.97 0.43 0.04 0.89 0.02
Fiber strength (kN m kg-1
) 216.86 187.85–251.67 228.86 203.01 215.94 0.48 0.04 0.91 0.01
50%-Span length (mm) 14.68 13.75–15.81 15.08 14.59 14.84 0.30 0.04 0.85 0.02
2.5%-Span length (mm) 30.70 28.1–33.69 31.72 30.20 30.96 0.61 0.04 0.95 0.01
Length uniformity (%) 47.81 44.78–50.52 47.69 48.24 47.97 0.37 0.04 0.88 0.02
Page 32 of 62
The Plant Genome: Posted 22 Nov. 2013; doi: 10.3835/plantgenome2013.07.0023
33
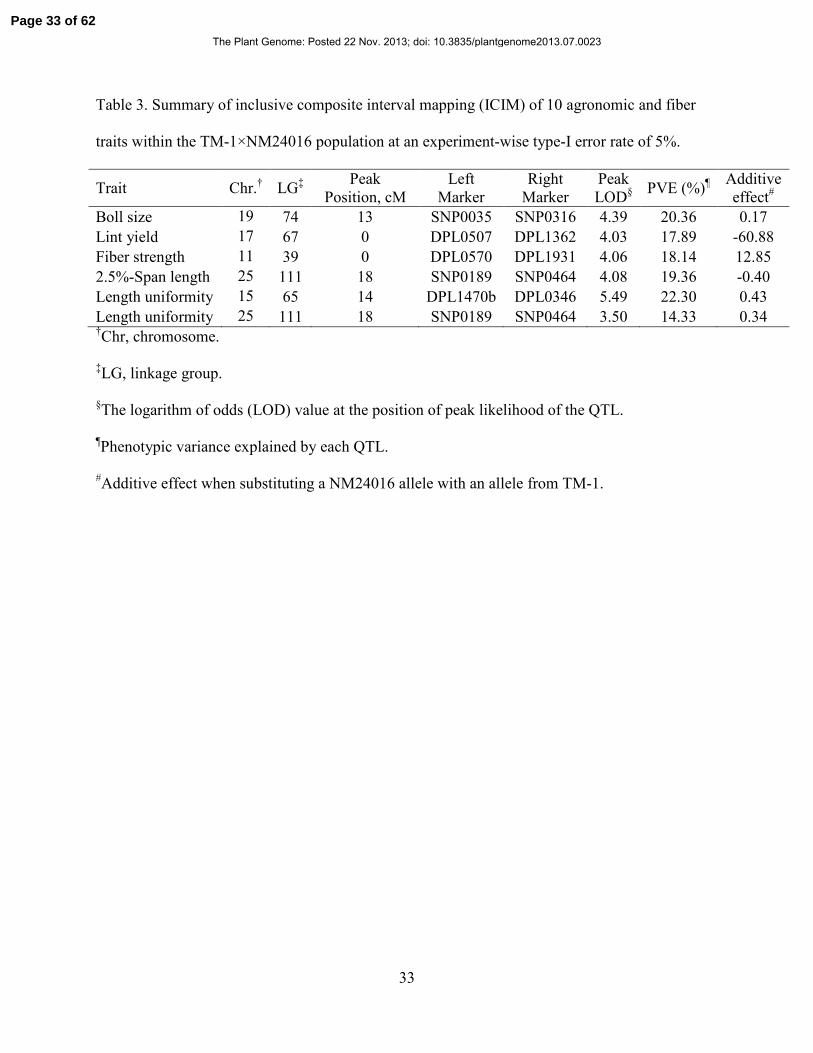
Table 3. Summary of inclusive composite interval mapping (ICIM) of 10 agronomic and fiber
traits within the TM-1×NM24016 population at an experiment-wise type-I error rate of 5%.
Trait Chr.† LG
‡
Peak
Position, cM
Left
Marker
Right
Marker
Peak
LOD§
PVE (%)¶
Additive
effect#
Boll size 19 74 13 SNP0035 SNP0316 4.39 20.36 0.17
Lint yield 17 67 0 DPL0507 DPL1362 4.03 17.89 -60.88
Fiber strength 11 39 0 DPL0570 DPL1931 4.06 18.14 12.85
2.5%-Span length 25 111 18 SNP0189 SNP0464 4.08 19.36 -0.40
Length uniformity 15 65 14 DPL1470b DPL0346 5.49 22.30 0.43
Length uniformity 25 111 18 SNP0189 SNP0464 3.50 14.33 0.34 †Chr, chromosome.
‡LG, linkage group.
§The logarithm of odds (LOD) value at the position of peak likelihood of the QTL.
¶Phenotypic variance explained by each QTL.
#Additive effect when substituting a NM24016 allele with an allele from TM-1.
Page 33 of 62
The Plant Genome: Posted 22 Nov. 2013; doi: 10.3835/plantgenome2013.07.0023

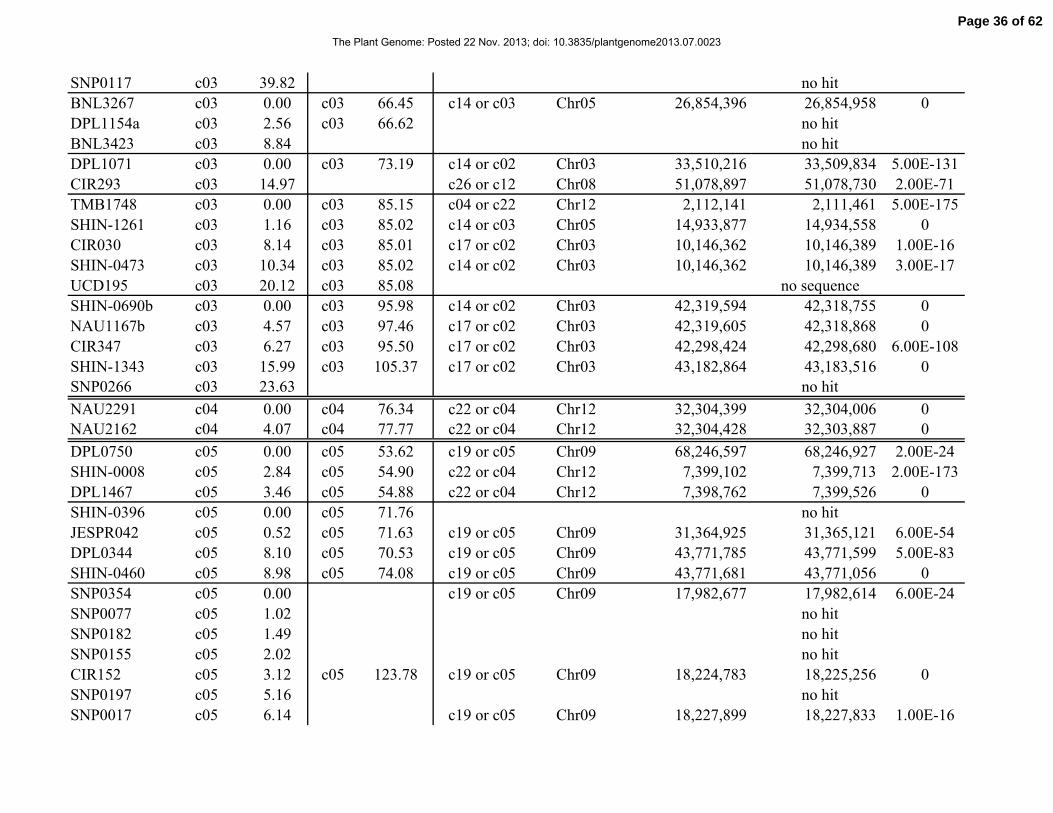
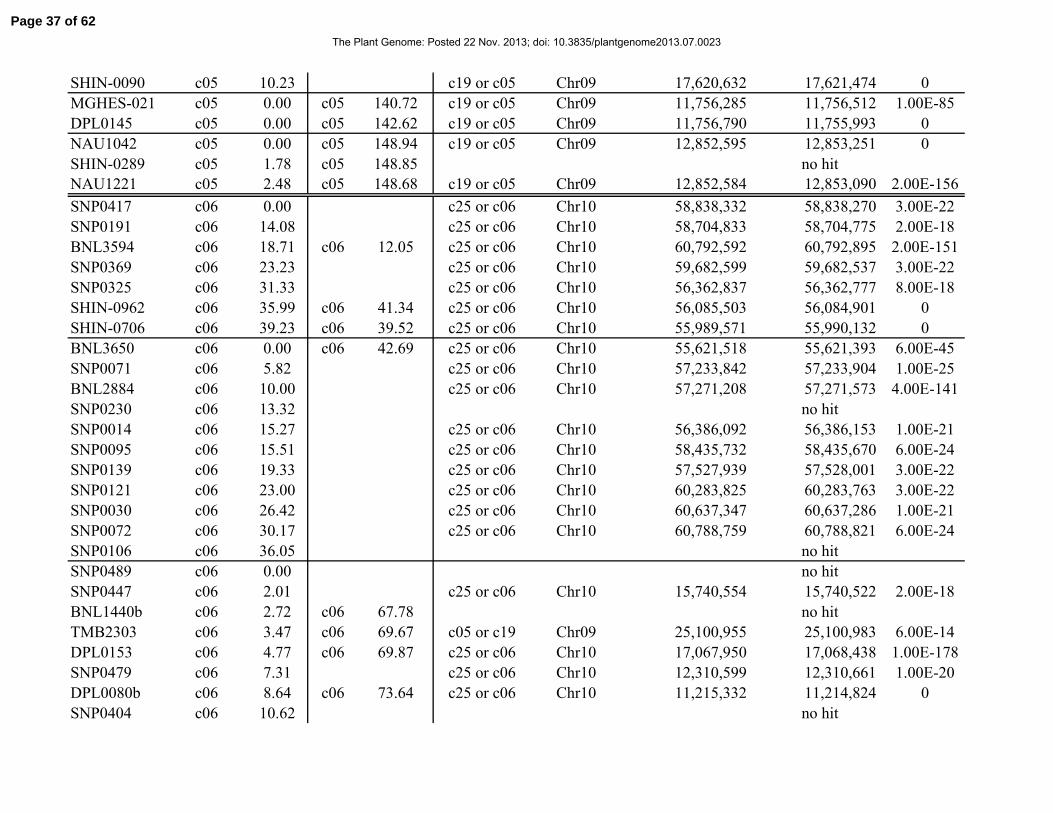
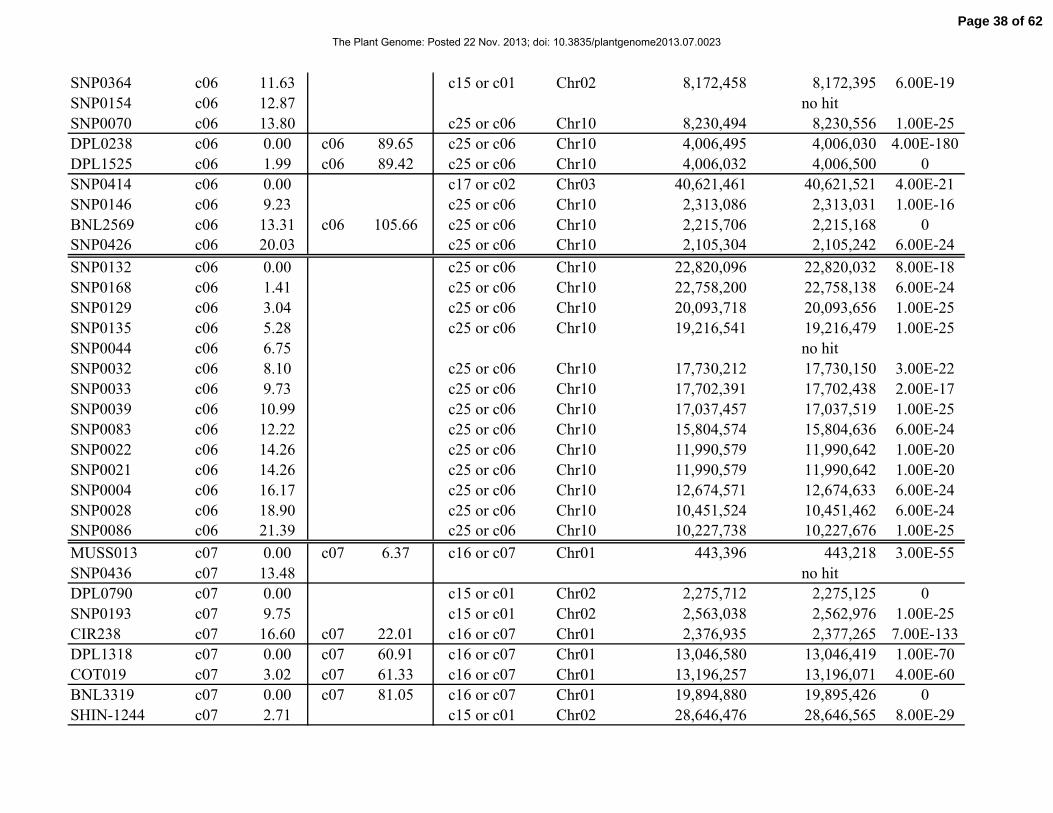
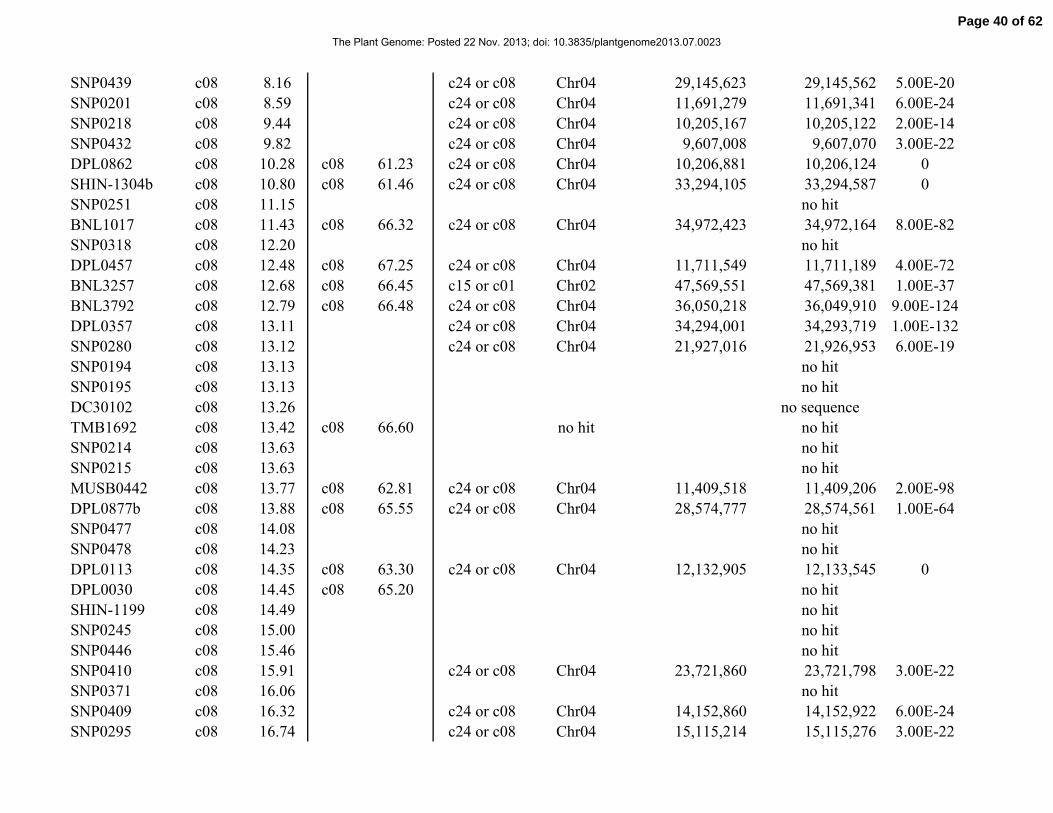
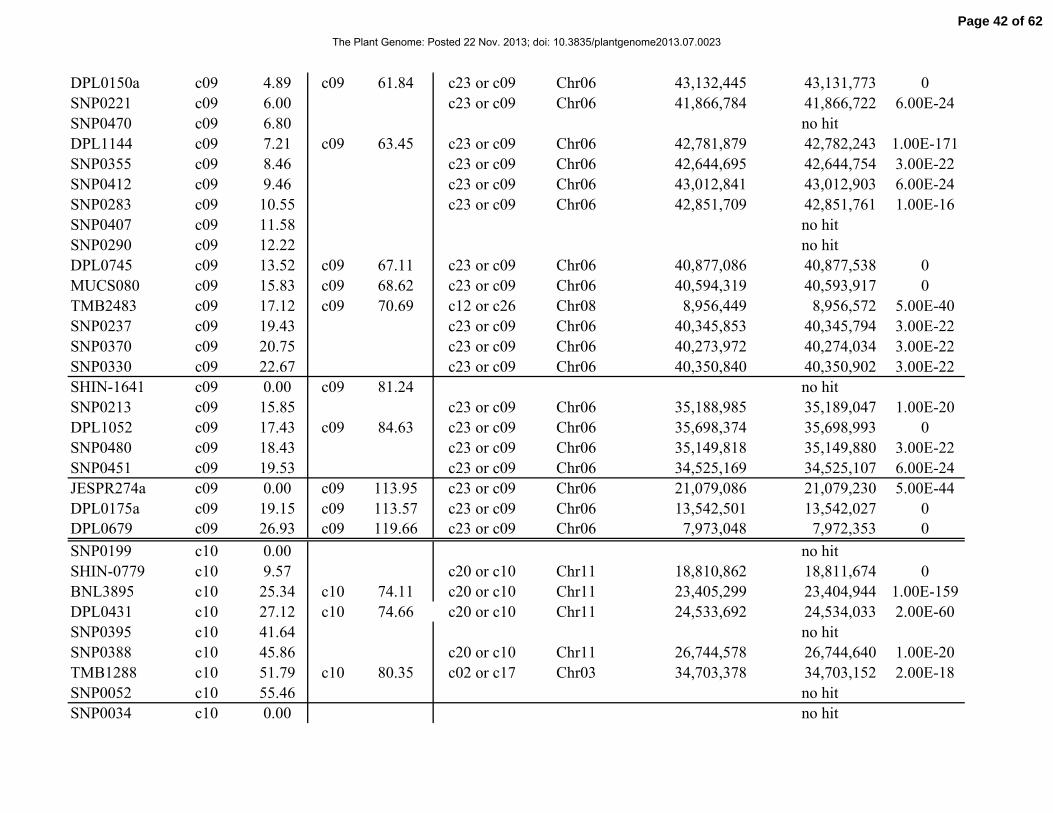
Supplementary Table 1. Comparison of the TM-1×NM24016 linkage map with the TM-1×3-79 linkage map and the
G. raimondii (D5 diploid) genome sequence.
Markers Chr.†
Pos. (cM) Chr. Pos. (cM) Chr.of G.h.§
Chr.of G.r.¶
Marker sequence
start (bp)
Marker sequence
end (bp) E-value
SNP0373 c01 0.00 c15 or c01 Chr02 7,701,497 7,701,548 6.00E-18
SNP0448 c01 4.58 c15 or c01 Chr02 9,032,162 9,032,223 2.00E-23
SNP0228 c01 6.05 no hit
SNP0229 c01 6.05 no hit
SNP0381 c01 6.23 no hit
SNP0282 c01 7.22 c15 or c01 Chr02 8,962,055 8,962,117 3.00E-22
DPL1268 c01 9.30 c01 44.44 c15 or c01 Chr02 9,141,144 9,141,781 0
SNP0236 c01 12.32 no hit
DPL1217 c01 13.62 c01 45.04 c21 or c11 Chr07 16,238,293 16,238,243 2.00E-18
SNP0362 c01 14.92 c15 or c01 Chr02 10,239,454 10,239,392 3.00E-22
SHIN-1487 c01 16.81 c01 45.63 c15 or c01 Chr02 10,243,897 10,243,031 0
TMB0283 c01 18.24 c01 49.61 c10 or c20 Chr11 42,477,187 42,477,390 3.00E-23
SNP0322 c01 21.63 c15 or c01 Chr02 11,763,034 11,762,972 3.00E-22
SNP0192 c01 23.86 c15 or c01 Chr02 12,326,437 12,326,375 3.00E-12
SNP0347 c01 25.90 no hit
DPL0053 c01 27.33 c01 56.15 c15 or c01 Chr02 12,855,359 12,855,147 8.00E-101
SNP0225 c01 29.89 c15 or c01 Chr02 12,859,705 12,859,767 1.00E-20
SHIN-0602 c01 32.00 c01 59.31 c15 or c01 Chr02 13,623,543 13,623,973 2.00E-144
DPL1673 c01 33.71 c01 59.48 c15 or c01 Chr02 13,624,212 13,623,650 0
DPL0094 c01 37.34 c01 59.67 c15 or c01 Chr02 13,623,650 13,624,212 0
SNP0366 c01 40.44 c15 or c01 Chr02 16,155,013 16,154,951 3.00E-22
SHIN-1397 c01 0.00 c01 116.82 c15 or c01 Chr02 60,866,521 60,866,133 0
DPL1470a c01 11.11 c01 118.15 c15 or c01 Chr02 60,804,061 60,803,223 0
COT064 c02 0.00 c02 53.75 c17 or c02 Chr03 5,362,535 5,362,902 4.00E-162
DC20076 c02 1.50 c15 or c01 Chr02 9,764,930 9,765,198 1.00E-110
C2-048 c02 7.61 c02 60.52 c17 or c02 Chr03 19,726,486 19,726,289 6.00E-56
JESPR101b c02 10.25 c02 60.93 c17 or c02 Chr03 18,634,900 18,635,125 2.00E-83
TM-1×NM24016 map G. raimondii genome sequenceTM-1×3-79 map‡
Page 34 of 62
The Plant Genome: Posted 22 Nov. 2013; doi: 10.3835/plantgenome2013.07.0023

BNL3590b c02 10.75 c02 61.48 c17 or c02 Chr03 18,635,039 18,634,806 3.00E-117
SHIN-0129b c02 11.53 c02 61.07 no hit
DC40319b c02 12.18 c02 62.15 c17 or c02 Chr03 18,884,157 18,884,656 0
TMB0471 c02 22.79 c02 57.27 c17 or c02 Chr03 25,194,827 25,194,428 5.00E-163
DPL0200 c02 26.21 c02 58.13 c17 or c02 Chr03 25,195,019 25,194,487 0
DPL0689 c02 0.00 c02 112.08 c14 or c03 Chr05 1,639,423 1,638,972 0
JESPR156 c02 1.01 c02 112.66 c14 or c03 Chr05 1,639,306 1,639,984 0
SHIN-1400 c03 0.00 c03 10.65 c14 or c03 Chr05 62,638,966 62,638,551 0
SNP0123 c03 3.93 no hit
SNP0122 c03 3.93 no hit
SNP0212 c03 8.29 no hit
SNP0421 c03 10.15 no hit
SNP0023 c03 13.94 no hit
C2-037 c03 16.43 c03 28.78 c14 or c03 Chr05 60,635,841 60,636,161 2.00E-116
MUCS407 c03 0.00 c03 37.57 c14 or c03 Chr05 58,424,182 58,423,923 8.00E-92
SNP0001 c03 4.25 c14 or c03 Chr05 59,218,770 59,218,711 3.00E-22
BNL4017 c03 7.37 c03 39.66 c14 or c03 Chr05 57,766,214 57,765,851 4.00E-141
SNP0084 c03 10.76 c14 or c03 Chr05 57,452,950 57,452,888 3.00E-22
SNP0068 c03 13.59 c14 or c03 Chr05 55,926,712 55,926,652 2.00E-24
BNL0226 c03 19.22 c03 46.98 c14 or c03 Chr05 53,481,455 53,481,193 2.00E-103
SNP0286 c03 26.83 c14 or c03 Chr05 42,401,515 42,401,576 2.00E-19
MUSS172 c03 28.72 c03 57.45 c14 or c03 Chr05 46,899,710 46,899,092 0
DPL0170 c03 30.65 c03 58.51 no hit
CIR209 c03 31.72 c24 or c08 Chr04 36,050,218 36,050,116 1.00E-39
SNP0148 c03 32.89 c14 or c03 Chr05 39,145,142 39,145,080 6.00E-24
SNP0130 c03 33.92 c14 or c03 Chr05 40,805,601 40,805,539 6.00E-24
SNP0025 c03 34.57 c14 or c03 Chr05 33,057,597 33,057,659 3.00E-22
SNP0232 c03 34.89 no hit
SNP0231 c03 34.89 no hit
SNP0024 c03 35.99 no hit
SNP0163 c03 36.23 no hit
DPL1154b c03 36.38 no hit
Page 35 of 62
The Plant Genome: Posted 22 Nov. 2013; doi: 10.3835/plantgenome2013.07.0023
SNP0117 c03 39.82 no hit
BNL3267 c03 0.00 c03 66.45 c14 or c03 Chr05 26,854,396 26,854,958 0
DPL1154a c03 2.56 c03 66.62 no hit
BNL3423 c03 8.84 no hit
DPL1071 c03 0.00 c03 73.19 c14 or c02 Chr03 33,510,216 33,509,834 5.00E-131
CIR293 c03 14.97 c26 or c12 Chr08 51,078,897 51,078,730 2.00E-71
TMB1748 c03 0.00 c03 85.15 c04 or c22 Chr12 2,112,141 2,111,461 5.00E-175
SHIN-1261 c03 1.16 c03 85.02 c14 or c03 Chr05 14,933,877 14,934,558 0
CIR030 c03 8.14 c03 85.01 c17 or c02 Chr03 10,146,362 10,146,389 1.00E-16
SHIN-0473 c03 10.34 c03 85.02 c14 or c02 Chr03 10,146,362 10,146,389 3.00E-17
UCD195 c03 20.12 c03 85.08 no sequence
SHIN-0690b c03 0.00 c03 95.98 c14 or c02 Chr03 42,319,594 42,318,755 0
NAU1167b c03 4.57 c03 97.46 c17 or c02 Chr03 42,319,605 42,318,868 0
CIR347 c03 6.27 c03 95.50 c17 or c02 Chr03 42,298,424 42,298,680 6.00E-108
SHIN-1343 c03 15.99 c03 105.37 c17 or c02 Chr03 43,182,864 43,183,516 0
SNP0266 c03 23.63 no hit
NAU2291 c04 0.00 c04 76.34 c22 or c04 Chr12 32,304,399 32,304,006 0
NAU2162 c04 4.07 c04 77.77 c22 or c04 Chr12 32,304,428 32,303,887 0
DPL0750 c05 0.00 c05 53.62 c19 or c05 Chr09 68,246,597 68,246,927 2.00E-24
SHIN-0008 c05 2.84 c05 54.90 c22 or c04 Chr12 7,399,102 7,399,713 2.00E-173
DPL1467 c05 3.46 c05 54.88 c22 or c04 Chr12 7,398,762 7,399,526 0
SHIN-0396 c05 0.00 c05 71.76 no hit
JESPR042 c05 0.52 c05 71.63 c19 or c05 Chr09 31,364,925 31,365,121 6.00E-54
DPL0344 c05 8.10 c05 70.53 c19 or c05 Chr09 43,771,785 43,771,599 5.00E-83
SHIN-0460 c05 8.98 c05 74.08 c19 or c05 Chr09 43,771,681 43,771,056 0
SNP0354 c05 0.00 c19 or c05 Chr09 17,982,677 17,982,614 6.00E-24
SNP0077 c05 1.02 no hit
SNP0182 c05 1.49 no hit
SNP0155 c05 2.02 no hit
CIR152 c05 3.12 c05 123.78 c19 or c05 Chr09 18,224,783 18,225,256 0
SNP0197 c05 5.16 no hit
SNP0017 c05 6.14 c19 or c05 Chr09 18,227,899 18,227,833 1.00E-16
Page 36 of 62
The Plant Genome: Posted 22 Nov. 2013; doi: 10.3835/plantgenome2013.07.0023
SHIN-0090 c05 10.23 c19 or c05 Chr09 17,620,632 17,621,474 0
MGHES-021 c05 0.00 c05 140.72 c19 or c05 Chr09 11,756,285 11,756,512 1.00E-85
DPL0145 c05 0.00 c05 142.62 c19 or c05 Chr09 11,756,790 11,755,993 0
NAU1042 c05 0.00 c05 148.94 c19 or c05 Chr09 12,852,595 12,853,251 0
SHIN-0289 c05 1.78 c05 148.85 no hit
NAU1221 c05 2.48 c05 148.68 c19 or c05 Chr09 12,852,584 12,853,090 2.00E-156
SNP0417 c06 0.00 c25 or c06 Chr10 58,838,332 58,838,270 3.00E-22
SNP0191 c06 14.08 c25 or c06 Chr10 58,704,833 58,704,775 2.00E-18
BNL3594 c06 18.71 c06 12.05 c25 or c06 Chr10 60,792,592 60,792,895 2.00E-151
SNP0369 c06 23.23 c25 or c06 Chr10 59,682,599 59,682,537 3.00E-22
SNP0325 c06 31.33 c25 or c06 Chr10 56,362,837 56,362,777 8.00E-18
SHIN-0962 c06 35.99 c06 41.34 c25 or c06 Chr10 56,085,503 56,084,901 0
SHIN-0706 c06 39.23 c06 39.52 c25 or c06 Chr10 55,989,571 55,990,132 0
BNL3650 c06 0.00 c06 42.69 c25 or c06 Chr10 55,621,518 55,621,393 6.00E-45
SNP0071 c06 5.82 c25 or c06 Chr10 57,233,842 57,233,904 1.00E-25
BNL2884 c06 10.00 c25 or c06 Chr10 57,271,208 57,271,573 4.00E-141
SNP0230 c06 13.32 no hit
SNP0014 c06 15.27 c25 or c06 Chr10 56,386,092 56,386,153 1.00E-21
SNP0095 c06 15.51 c25 or c06 Chr10 58,435,732 58,435,670 6.00E-24
SNP0139 c06 19.33 c25 or c06 Chr10 57,527,939 57,528,001 3.00E-22
SNP0121 c06 23.00 c25 or c06 Chr10 60,283,825 60,283,763 3.00E-22
SNP0030 c06 26.42 c25 or c06 Chr10 60,637,347 60,637,286 1.00E-21
SNP0072 c06 30.17 c25 or c06 Chr10 60,788,759 60,788,821 6.00E-24
SNP0106 c06 36.05 no hit
SNP0489 c06 0.00 no hit
SNP0447 c06 2.01 c25 or c06 Chr10 15,740,554 15,740,522 2.00E-18
BNL1440b c06 2.72 c06 67.78 no hit
TMB2303 c06 3.47 c06 69.67 c05 or c19 Chr09 25,100,955 25,100,983 6.00E-14
DPL0153 c06 4.77 c06 69.87 c25 or c06 Chr10 17,067,950 17,068,438 1.00E-178
SNP0479 c06 7.31 c25 or c06 Chr10 12,310,599 12,310,661 1.00E-20
DPL0080b c06 8.64 c06 73.64 c25 or c06 Chr10 11,215,332 11,214,824 0
SNP0404 c06 10.62 no hit
Page 37 of 62
The Plant Genome: Posted 22 Nov. 2013; doi: 10.3835/plantgenome2013.07.0023
SNP0364 c06 11.63 c15 or c01 Chr02 8,172,458 8,172,395 6.00E-19
SNP0154 c06 12.87 no hit
SNP0070 c06 13.80 c25 or c06 Chr10 8,230,494 8,230,556 1.00E-25
DPL0238 c06 0.00 c06 89.65 c25 or c06 Chr10 4,006,495 4,006,030 4.00E-180
DPL1525 c06 1.99 c06 89.42 c25 or c06 Chr10 4,006,032 4,006,500 0
SNP0414 c06 0.00 c17 or c02 Chr03 40,621,461 40,621,521 4.00E-21
SNP0146 c06 9.23 c25 or c06 Chr10 2,313,086 2,313,031 1.00E-16
BNL2569 c06 13.31 c06 105.66 c25 or c06 Chr10 2,215,706 2,215,168 0
SNP0426 c06 20.03 c25 or c06 Chr10 2,105,304 2,105,242 6.00E-24
SNP0132 c06 0.00 c25 or c06 Chr10 22,820,096 22,820,032 8.00E-18
SNP0168 c06 1.41 c25 or c06 Chr10 22,758,200 22,758,138 6.00E-24
SNP0129 c06 3.04 c25 or c06 Chr10 20,093,718 20,093,656 1.00E-25
SNP0135 c06 5.28 c25 or c06 Chr10 19,216,541 19,216,479 1.00E-25
SNP0044 c06 6.75 no hit
SNP0032 c06 8.10 c25 or c06 Chr10 17,730,212 17,730,150 3.00E-22
SNP0033 c06 9.73 c25 or c06 Chr10 17,702,391 17,702,438 2.00E-17
SNP0039 c06 10.99 c25 or c06 Chr10 17,037,457 17,037,519 1.00E-25
SNP0083 c06 12.22 c25 or c06 Chr10 15,804,574 15,804,636 6.00E-24
SNP0022 c06 14.26 c25 or c06 Chr10 11,990,579 11,990,642 1.00E-20
SNP0021 c06 14.26 c25 or c06 Chr10 11,990,579 11,990,642 1.00E-20
SNP0004 c06 16.17 c25 or c06 Chr10 12,674,571 12,674,633 6.00E-24
SNP0028 c06 18.90 c25 or c06 Chr10 10,451,524 10,451,462 6.00E-24
SNP0086 c06 21.39 c25 or c06 Chr10 10,227,738 10,227,676 1.00E-25
MUSS013 c07 0.00 c07 6.37 c16 or c07 Chr01 443,396 443,218 3.00E-55
SNP0436 c07 13.48 no hit
DPL0790 c07 0.00 c15 or c01 Chr02 2,275,712 2,275,125 0
SNP0193 c07 9.75 c15 or c01 Chr02 2,563,038 2,562,976 1.00E-25
CIR238 c07 16.60 c07 22.01 c16 or c07 Chr01 2,376,935 2,377,265 7.00E-133
DPL1318 c07 0.00 c07 60.91 c16 or c07 Chr01 13,046,580 13,046,419 1.00E-70
COT019 c07 3.02 c07 61.33 c16 or c07 Chr01 13,196,257 13,196,071 4.00E-60
BNL3319 c07 0.00 c07 81.05 c16 or c07 Chr01 19,894,880 19,895,426 0
SHIN-1244 c07 2.71 c15 or c01 Chr02 28,646,476 28,646,565 8.00E-29
Page 38 of 62
The Plant Genome: Posted 22 Nov. 2013; doi: 10.3835/plantgenome2013.07.0023

BNL1395b c07 0.00 c07 85.61 c16 or c07 Chr01 29,668,797 29,669,191 0
BNL1694 c07 11.05 c07 87.72 c16 or c07 Chr01 27,263,211 27,263,431 1.00E-102
TMB2844 c07 13.97 c07 89.23 c01 or c15 Chr02 21,360,998 21,361,204 1.00E-60
DC30109b c07 15.23 no sequence
DC20084 c07 15.93 c07 88.86 c16 or c07 Chr01 29,283,349 29,283,296 3.00E-12
TMB0561 c07 16.35 c07 88.95 c01 or c15 Chr02 21,361,204 21,360,998 1.00E-60
DPL0013b c07 16.78 c07 87.36 c16 or c07 Chr01 29,669,254 29,668,461 0
BNL1122 c07 16.92 c07 86.51 c16 or c07 Chr01 29,669,201 29,668,797 0
SNP0296 c07 18.51 no hit
TMB1888 c07 22.35 c03 or c14 Chr05 42,062,306 42,062,162 1.00E-46
DC30012 c07 0.00 no sequence
DPL0119 c07 0.51 c07 132.87 c24 or c08 Chr04 16,689,623 16,689,680 2.00E-12
C2-003 c08 0.00 c08 21.72 c24 or c08 Chr04 1,432,227 1,431,927 2.00E-116
SNP0200 c08 4.22 c24 or c08 Chr04 1,488,993 1,489,046 3.00E-17
SNP0309 c08 6.38 c24 or c08 Chr04 1,873,571 1,873,509 3.00E-22
SNP0209 c08 10.60 no hit
SNP0471 c08 16.44 c24 or c08 Chr04 2,251,644 2,251,582 6.00E-19
CIR278 c08 0.00 c08 49.77 c24 or c08 Chr04 5,685,979 5,686,369 2.00E-163
SNP0262 c08 0.87 no hit
SNP0263 c08 0.87 no hit
SNP0303 c08 2.29 c24 or c08 Chr04 5,797,210 5,797,249 6.00E-19
SNP0424 c08 3.82 no hit
SNP0423 c08 3.82 no hit
SNP0422 c08 3.82 no hit
SNP0460 c08 4.38 c24 or c08 Chr04 8,934,151 8,934,203 2.00E-18
DPL0111 c08 5.07 c08 59.29 c24 or c08 Chr04 9,164,707 9,164,106 0
CM0043 c08 5.52 c08 59.52 c24 or c08 Chr04 9,164,106 9,164,361 8.00E-103
SNP0462 c08 6.24 c24 or c08 Chr04 8,934,151 8,934,216 2.00E-19
SNP0319 c08 6.94 no hit
SNP0335 c08 7.26 no hit
SNP0461 c08 7.62 c24 or c08 Chr04 8,934,151 8,934,203 2.00E-18
SNP0205 c08 7.88 no hit
Page 39 of 62
The Plant Genome: Posted 22 Nov. 2013; doi: 10.3835/plantgenome2013.07.0023
SNP0439 c08 8.16 c24 or c08 Chr04 29,145,623 29,145,562 5.00E-20
SNP0201 c08 8.59 c24 or c08 Chr04 11,691,279 11,691,341 6.00E-24
SNP0218 c08 9.44 c24 or c08 Chr04 10,205,167 10,205,122 2.00E-14
SNP0432 c08 9.82 c24 or c08 Chr04 9,607,008 9,607,070 3.00E-22
DPL0862 c08 10.28 c08 61.23 c24 or c08 Chr04 10,206,881 10,206,124 0
SHIN-1304b c08 10.80 c08 61.46 c24 or c08 Chr04 33,294,105 33,294,587 0
SNP0251 c08 11.15 no hit
BNL1017 c08 11.43 c08 66.32 c24 or c08 Chr04 34,972,423 34,972,164 8.00E-82
SNP0318 c08 12.20 no hit
DPL0457 c08 12.48 c08 67.25 c24 or c08 Chr04 11,711,549 11,711,189 4.00E-72
BNL3257 c08 12.68 c08 66.45 c15 or c01 Chr02 47,569,551 47,569,381 1.00E-37
BNL3792 c08 12.79 c08 66.48 c24 or c08 Chr04 36,050,218 36,049,910 9.00E-124
DPL0357 c08 13.11 c24 or c08 Chr04 34,294,001 34,293,719 1.00E-132
SNP0280 c08 13.12 c24 or c08 Chr04 21,927,016 21,926,953 6.00E-19
SNP0194 c08 13.13 no hit
SNP0195 c08 13.13 no hit
DC30102 c08 13.26 no sequence
TMB1692 c08 13.42 c08 66.60 no hit no hit
SNP0214 c08 13.63 no hit
SNP0215 c08 13.63 no hit
MUSB0442 c08 13.77 c08 62.81 c24 or c08 Chr04 11,409,518 11,409,206 2.00E-98
DPL0877b c08 13.88 c08 65.55 c24 or c08 Chr04 28,574,777 28,574,561 1.00E-64
SNP0477 c08 14.08 no hit
SNP0478 c08 14.23 no hit
DPL0113 c08 14.35 c08 63.30 c24 or c08 Chr04 12,132,905 12,133,545 0
DPL0030 c08 14.45 c08 65.20 no hit
SHIN-1199 c08 14.49 no hit
SNP0245 c08 15.00 no hit
SNP0446 c08 15.46 no hit
SNP0410 c08 15.91 c24 or c08 Chr04 23,721,860 23,721,798 3.00E-22
SNP0371 c08 16.06 no hit
SNP0409 c08 16.32 c24 or c08 Chr04 14,152,860 14,152,922 6.00E-24
SNP0295 c08 16.74 c24 or c08 Chr04 15,115,214 15,115,276 3.00E-22
Page 40 of 62
The Plant Genome: Posted 22 Nov. 2013; doi: 10.3835/plantgenome2013.07.0023

SNP0306 c08 16.97 c24 or c08 Chr04 36,874,709 36,874,771 1.00E-20
DPL0686 c08 17.73 c24 or c08 Chr04 32,283,703 32,283,941 2.00E-85
BNL0387 c08 18.64 c08 66.45 c24 or c08 Chr04 36,040,847 36,041,155 2.00E-133
DPL0755 c08 19.11 c08 64.00 c24 or c08 Chr04 13,053,904 13,053,212 0
COT035 c08 20.76 c08 67.83 c24 or c08 Chr04 38,654,120 38,653,668 0
BNL3474 c08 21.07 c08 68.11 c24 or c08 Chr04 38,654,329 38,653,712 0
BNL3800 c08 22.30 c24 or c08 Chr04 39,594,686 39,594,857 2.00E-79
SNP0332 c08 23.98 no hit
DPL0133 c08 30.50 c08 71.72 c24 or c08 Chr04 40,567,738 40,568,451 0
SNP0415 c08 0.00 c24 or c08 Chr04 43,297,270 43,297,208 1.00E-20
DPL1609 c08 2.62 c23 or c09 Chr06 29,019,864 29,019,782 1.00E-20
SNP0359 c08 5.58 c24 or c08 Chr04 45,187,921 45,187,861 2.00E-24
TMB1640 c08 8.08 c08 98.56 c06 or c25 Chr10 53,355,200 53,355,414 4.00E-52
SNP0379 c08 10.47 c24 or c08 Chr04 44,807,468 44,807,528 2.00E-19
SNP0459 c08 16.07 no hit
C2-038 c08 19.99 c08 86.13 c23 or c09 Chr06 19,029,964 19,030,088 1.00E-23
BNL3638 c08 23.40 c24 or c08 Chr04 49,555,334 49,554,905 8.00E-144
TMB0834 c08 26.33 c08 88.28 c13 or c18 Chr13 17,204,933 17,204,854 6.00E-19
SNP0125 c09 0.00 no hit
MUSS398b c09 0.99 c23 or c09 Chr06 50,375,880 50,376,300 0
SNP0233 c09 1.86 no hit
SNP0234 c09 1.86 no hit
NAU2354 c09 3.84 c09 15.45 c23 or c09 Chr06 50,233,051 50,233,456 8.00E-160
SHIN-1542 c09 4.69 c09 15.30 c23 or c09 Chr06 50,233,951 50,233,553 0
DPL0530b c09 6.33 c23 or c09 Chr06 50,050,707 50,051,300 0
SNP0165 c09 15.77 c23 or c09 Chr06 49,311,729 49,311,688 3.00E-12
SNP0093 c09 20.32 c23 or c09 Chr06 49,320,032 49,320,094 6.00E-24
SNP0092 c09 33.99 c23 or c09 Chr06 47,112,024 47,111,963 2.00E-23
SNP0003 c09 38.53 c23 or c09 Chr06 46,607,526 46,607,464 6.00E-24
SNP0007 c09 45.01 no hit
SHIN-0817 c09 0.00 c09 66.11 c23 or c09 Chr06 41,841,751 41,840,933 0
SNP0190 c09 3.26 no hit
Page 41 of 62
The Plant Genome: Posted 22 Nov. 2013; doi: 10.3835/plantgenome2013.07.0023
DPL0150a c09 4.89 c09 61.84 c23 or c09 Chr06 43,132,445 43,131,773 0
SNP0221 c09 6.00 c23 or c09 Chr06 41,866,784 41,866,722 6.00E-24
SNP0470 c09 6.80 no hit
DPL1144 c09 7.21 c09 63.45 c23 or c09 Chr06 42,781,879 42,782,243 1.00E-171
SNP0355 c09 8.46 c23 or c09 Chr06 42,644,695 42,644,754 3.00E-22
SNP0412 c09 9.46 c23 or c09 Chr06 43,012,841 43,012,903 6.00E-24
SNP0283 c09 10.55 c23 or c09 Chr06 42,851,709 42,851,761 1.00E-16
SNP0407 c09 11.58 no hit
SNP0290 c09 12.22 no hit
DPL0745 c09 13.52 c09 67.11 c23 or c09 Chr06 40,877,086 40,877,538 0
MUCS080 c09 15.83 c09 68.62 c23 or c09 Chr06 40,594,319 40,593,917 0
TMB2483 c09 17.12 c09 70.69 c12 or c26 Chr08 8,956,449 8,956,572 5.00E-40
SNP0237 c09 19.43 c23 or c09 Chr06 40,345,853 40,345,794 3.00E-22
SNP0370 c09 20.75 c23 or c09 Chr06 40,273,972 40,274,034 3.00E-22
SNP0330 c09 22.67 c23 or c09 Chr06 40,350,840 40,350,902 3.00E-22
SHIN-1641 c09 0.00 c09 81.24 no hit
SNP0213 c09 15.85 c23 or c09 Chr06 35,188,985 35,189,047 1.00E-20
DPL1052 c09 17.43 c09 84.63 c23 or c09 Chr06 35,698,374 35,698,993 0
SNP0480 c09 18.43 c23 or c09 Chr06 35,149,818 35,149,880 3.00E-22
SNP0451 c09 19.53 c23 or c09 Chr06 34,525,169 34,525,107 6.00E-24
JESPR274a c09 0.00 c09 113.95 c23 or c09 Chr06 21,079,086 21,079,230 5.00E-44
DPL0175a c09 19.15 c09 113.57 c23 or c09 Chr06 13,542,501 13,542,027 0
DPL0679 c09 26.93 c09 119.66 c23 or c09 Chr06 7,973,048 7,972,353 0
SNP0199 c10 0.00 no hit
SHIN-0779 c10 9.57 c20 or c10 Chr11 18,810,862 18,811,674 0
BNL3895 c10 25.34 c10 74.11 c20 or c10 Chr11 23,405,299 23,404,944 1.00E-159
DPL0431 c10 27.12 c10 74.66 c20 or c10 Chr11 24,533,692 24,534,033 2.00E-60
SNP0395 c10 41.64 no hit
SNP0388 c10 45.86 c20 or c10 Chr11 26,744,578 26,744,640 1.00E-20
TMB1288 c10 51.79 c10 80.35 c02 or c17 Chr03 34,703,378 34,703,152 2.00E-18
SNP0052 c10 55.46 no hit
SNP0034 c10 0.00 no hit
Page 42 of 62
The Plant Genome: Posted 22 Nov. 2013; doi: 10.3835/plantgenome2013.07.0023
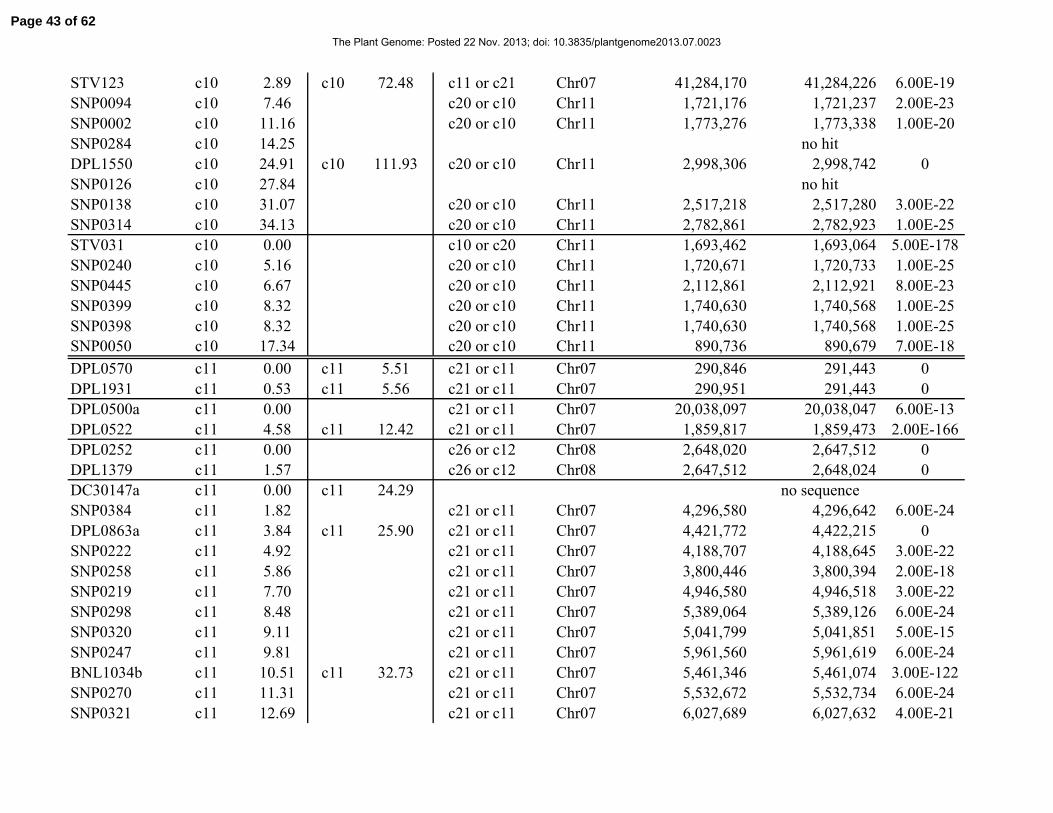
STV123 c10 2.89 c10 72.48 c11 or c21 Chr07 41,284,170 41,284,226 6.00E-19
SNP0094 c10 7.46 c20 or c10 Chr11 1,721,176 1,721,237 2.00E-23
SNP0002 c10 11.16 c20 or c10 Chr11 1,773,276 1,773,338 1.00E-20
SNP0284 c10 14.25 no hit
DPL1550 c10 24.91 c10 111.93 c20 or c10 Chr11 2,998,306 2,998,742 0
SNP0126 c10 27.84 no hit
SNP0138 c10 31.07 c20 or c10 Chr11 2,517,218 2,517,280 3.00E-22
SNP0314 c10 34.13 c20 or c10 Chr11 2,782,861 2,782,923 1.00E-25
STV031 c10 0.00 c10 or c20 Chr11 1,693,462 1,693,064 5.00E-178
SNP0240 c10 5.16 c20 or c10 Chr11 1,720,671 1,720,733 1.00E-25
SNP0445 c10 6.67 c20 or c10 Chr11 2,112,861 2,112,921 8.00E-23
SNP0399 c10 8.32 c20 or c10 Chr11 1,740,630 1,740,568 1.00E-25
SNP0398 c10 8.32 c20 or c10 Chr11 1,740,630 1,740,568 1.00E-25
SNP0050 c10 17.34 c20 or c10 Chr11 890,736 890,679 7.00E-18
DPL0570 c11 0.00 c11 5.51 c21 or c11 Chr07 290,846 291,443 0
DPL1931 c11 0.53 c11 5.56 c21 or c11 Chr07 290,951 291,443 0
DPL0500a c11 0.00 c21 or c11 Chr07 20,038,097 20,038,047 6.00E-13
DPL0522 c11 4.58 c11 12.42 c21 or c11 Chr07 1,859,817 1,859,473 2.00E-166
DPL0252 c11 0.00 c26 or c12 Chr08 2,648,020 2,647,512 0
DPL1379 c11 1.57 c26 or c12 Chr08 2,647,512 2,648,024 0
DC30147a c11 0.00 c11 24.29 no sequence
SNP0384 c11 1.82 c21 or c11 Chr07 4,296,580 4,296,642 6.00E-24
DPL0863a c11 3.84 c11 25.90 c21 or c11 Chr07 4,421,772 4,422,215 0
SNP0222 c11 4.92 c21 or c11 Chr07 4,188,707 4,188,645 3.00E-22
SNP0258 c11 5.86 c21 or c11 Chr07 3,800,446 3,800,394 2.00E-18
SNP0219 c11 7.70 c21 or c11 Chr07 4,946,580 4,946,518 3.00E-22
SNP0298 c11 8.48 c21 or c11 Chr07 5,389,064 5,389,126 6.00E-24
SNP0320 c11 9.11 c21 or c11 Chr07 5,041,799 5,041,851 5.00E-15
SNP0247 c11 9.81 c21 or c11 Chr07 5,961,560 5,961,619 6.00E-24
BNL1034b c11 10.51 c11 32.73 c21 or c11 Chr07 5,461,346 5,461,074 3.00E-122
SNP0270 c11 11.31 c21 or c11 Chr07 5,532,672 5,532,734 6.00E-24
SNP0321 c11 12.69 c21 or c11 Chr07 6,027,689 6,027,632 4.00E-21
Page 43 of 62
The Plant Genome: Posted 22 Nov. 2013; doi: 10.3835/plantgenome2013.07.0023
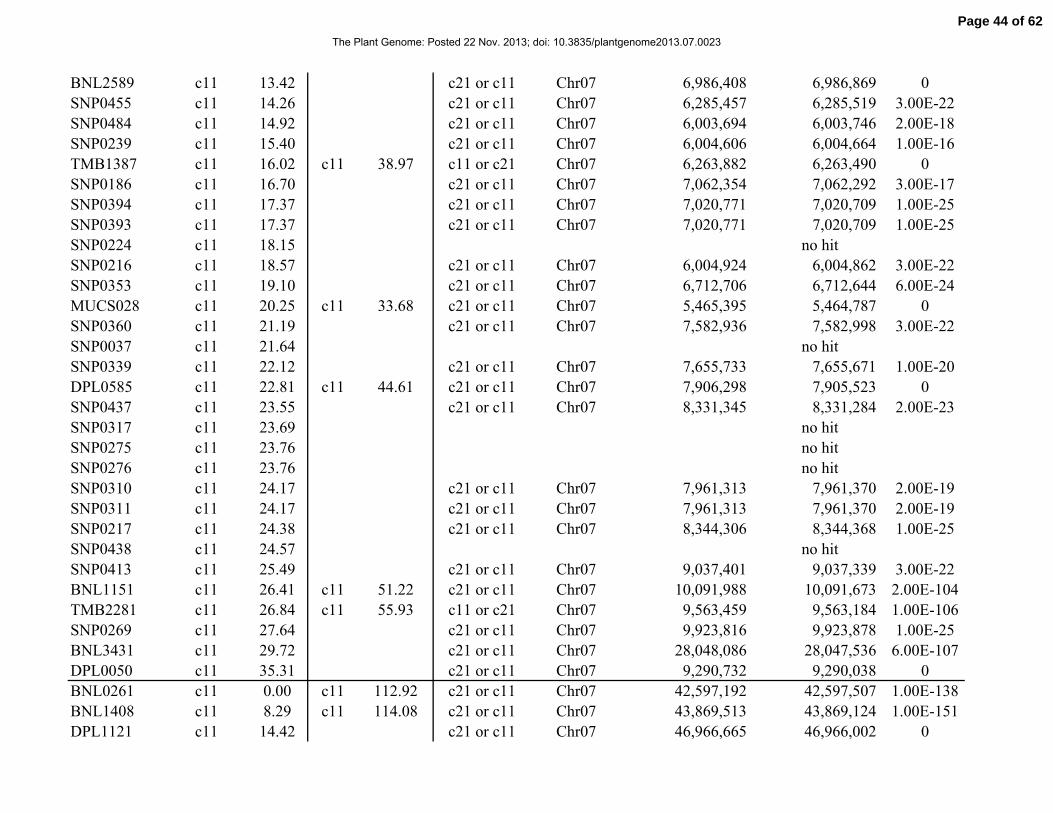
BNL2589 c11 13.42 c21 or c11 Chr07 6,986,408 6,986,869 0
SNP0455 c11 14.26 c21 or c11 Chr07 6,285,457 6,285,519 3.00E-22
SNP0484 c11 14.92 c21 or c11 Chr07 6,003,694 6,003,746 2.00E-18
SNP0239 c11 15.40 c21 or c11 Chr07 6,004,606 6,004,664 1.00E-16
TMB1387 c11 16.02 c11 38.97 c11 or c21 Chr07 6,263,882 6,263,490 0
SNP0186 c11 16.70 c21 or c11 Chr07 7,062,354 7,062,292 3.00E-17
SNP0394 c11 17.37 c21 or c11 Chr07 7,020,771 7,020,709 1.00E-25
SNP0393 c11 17.37 c21 or c11 Chr07 7,020,771 7,020,709 1.00E-25
SNP0224 c11 18.15 no hit
SNP0216 c11 18.57 c21 or c11 Chr07 6,004,924 6,004,862 3.00E-22
SNP0353 c11 19.10 c21 or c11 Chr07 6,712,706 6,712,644 6.00E-24
MUCS028 c11 20.25 c11 33.68 c21 or c11 Chr07 5,465,395 5,464,787 0
SNP0360 c11 21.19 c21 or c11 Chr07 7,582,936 7,582,998 3.00E-22
SNP0037 c11 21.64 no hit
SNP0339 c11 22.12 c21 or c11 Chr07 7,655,733 7,655,671 1.00E-20
DPL0585 c11 22.81 c11 44.61 c21 or c11 Chr07 7,906,298 7,905,523 0
SNP0437 c11 23.55 c21 or c11 Chr07 8,331,345 8,331,284 2.00E-23
SNP0317 c11 23.69 no hit
SNP0275 c11 23.76 no hit
SNP0276 c11 23.76 no hit
SNP0310 c11 24.17 c21 or c11 Chr07 7,961,313 7,961,370 2.00E-19
SNP0311 c11 24.17 c21 or c11 Chr07 7,961,313 7,961,370 2.00E-19
SNP0217 c11 24.38 c21 or c11 Chr07 8,344,306 8,344,368 1.00E-25
SNP0438 c11 24.57 no hit
SNP0413 c11 25.49 c21 or c11 Chr07 9,037,401 9,037,339 3.00E-22
BNL1151 c11 26.41 c11 51.22 c21 or c11 Chr07 10,091,988 10,091,673 2.00E-104
TMB2281 c11 26.84 c11 55.93 c11 or c21 Chr07 9,563,459 9,563,184 1.00E-106
SNP0269 c11 27.64 c21 or c11 Chr07 9,923,816 9,923,878 1.00E-25
BNL3431 c11 29.72 c21 or c11 Chr07 28,048,086 28,047,536 6.00E-107
DPL0050 c11 35.31 c21 or c11 Chr07 9,290,732 9,290,038 0
BNL0261 c11 0.00 c11 112.92 c21 or c11 Chr07 42,597,192 42,597,507 1.00E-138
BNL1408 c11 8.29 c11 114.08 c21 or c11 Chr07 43,869,513 43,869,124 1.00E-151
DPL1121 c11 14.42 c21 or c11 Chr07 46,966,665 46,966,002 0
Page 44 of 62
The Plant Genome: Posted 22 Nov. 2013; doi: 10.3835/plantgenome2013.07.0023
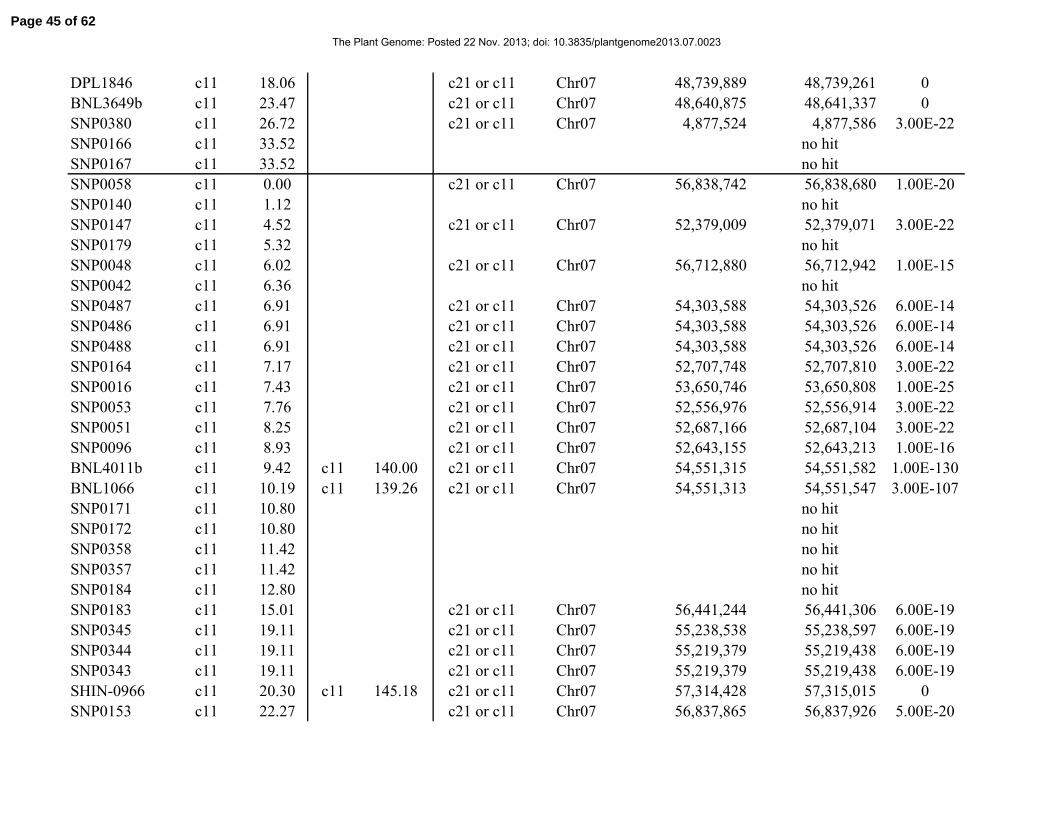
DPL1846 c11 18.06 c21 or c11 Chr07 48,739,889 48,739,261 0
BNL3649b c11 23.47 c21 or c11 Chr07 48,640,875 48,641,337 0
SNP0380 c11 26.72 c21 or c11 Chr07 4,877,524 4,877,586 3.00E-22
SNP0166 c11 33.52 no hit
SNP0167 c11 33.52 no hit
SNP0058 c11 0.00 c21 or c11 Chr07 56,838,742 56,838,680 1.00E-20
SNP0140 c11 1.12 no hit
SNP0147 c11 4.52 c21 or c11 Chr07 52,379,009 52,379,071 3.00E-22
SNP0179 c11 5.32 no hit
SNP0048 c11 6.02 c21 or c11 Chr07 56,712,880 56,712,942 1.00E-15
SNP0042 c11 6.36 no hit
SNP0487 c11 6.91 c21 or c11 Chr07 54,303,588 54,303,526 6.00E-14
SNP0486 c11 6.91 c21 or c11 Chr07 54,303,588 54,303,526 6.00E-14
SNP0488 c11 6.91 c21 or c11 Chr07 54,303,588 54,303,526 6.00E-14
SNP0164 c11 7.17 c21 or c11 Chr07 52,707,748 52,707,810 3.00E-22
SNP0016 c11 7.43 c21 or c11 Chr07 53,650,746 53,650,808 1.00E-25
SNP0053 c11 7.76 c21 or c11 Chr07 52,556,976 52,556,914 3.00E-22
SNP0051 c11 8.25 c21 or c11 Chr07 52,687,166 52,687,104 3.00E-22
SNP0096 c11 8.93 c21 or c11 Chr07 52,643,155 52,643,213 1.00E-16
BNL4011b c11 9.42 c11 140.00 c21 or c11 Chr07 54,551,315 54,551,582 1.00E-130
BNL1066 c11 10.19 c11 139.26 c21 or c11 Chr07 54,551,313 54,551,547 3.00E-107
SNP0171 c11 10.80 no hit
SNP0172 c11 10.80 no hit
SNP0358 c11 11.42 no hit
SNP0357 c11 11.42 no hit
SNP0184 c11 12.80 no hit
SNP0183 c11 15.01 c21 or c11 Chr07 56,441,244 56,441,306 6.00E-19
SNP0345 c11 19.11 c21 or c11 Chr07 55,238,538 55,238,597 6.00E-19
SNP0344 c11 19.11 c21 or c11 Chr07 55,219,379 55,219,438 6.00E-19
SNP0343 c11 19.11 c21 or c11 Chr07 55,219,379 55,219,438 6.00E-19
SHIN-0966 c11 20.30 c11 145.18 c21 or c11 Chr07 57,314,428 57,315,015 0
SNP0153 c11 22.27 c21 or c11 Chr07 56,837,865 56,837,926 5.00E-20
Page 45 of 62
The Plant Genome: Posted 22 Nov. 2013; doi: 10.3835/plantgenome2013.07.0023
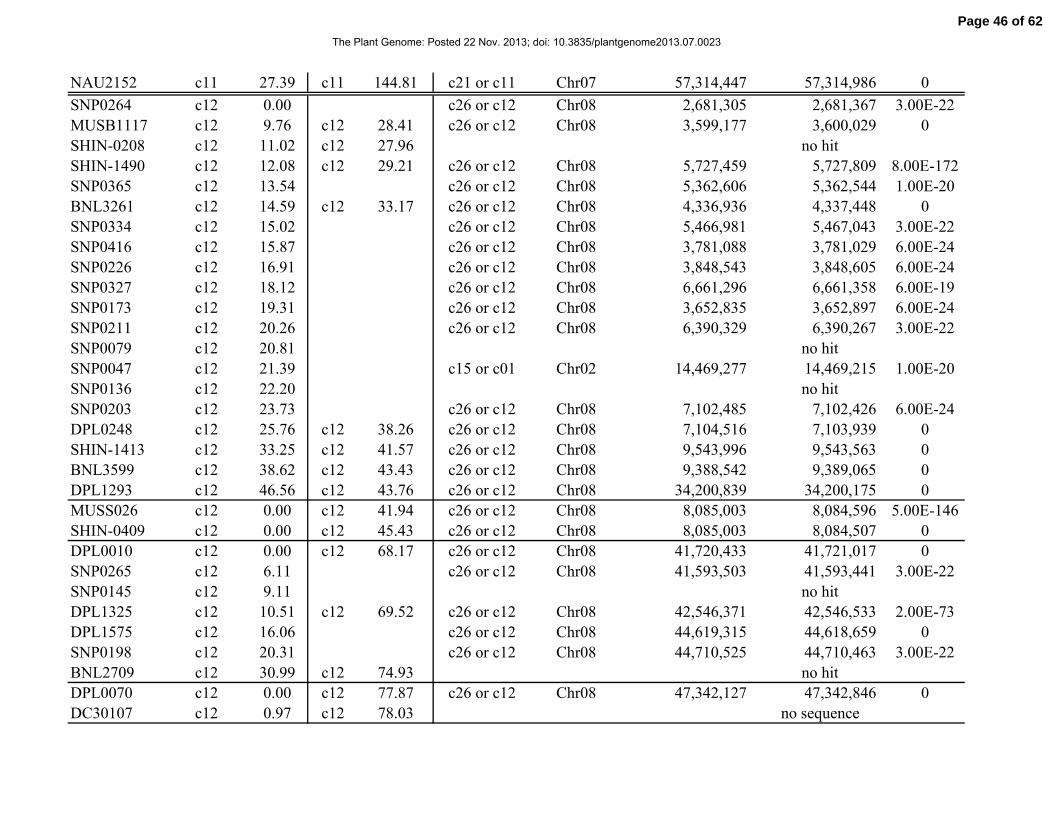
NAU2152 c11 27.39 c11 144.81 c21 or c11 Chr07 57,314,447 57,314,986 0
SNP0264 c12 0.00 c26 or c12 Chr08 2,681,305 2,681,367 3.00E-22
MUSB1117 c12 9.76 c12 28.41 c26 or c12 Chr08 3,599,177 3,600,029 0
SHIN-0208 c12 11.02 c12 27.96 no hit
SHIN-1490 c12 12.08 c12 29.21 c26 or c12 Chr08 5,727,459 5,727,809 8.00E-172
SNP0365 c12 13.54 c26 or c12 Chr08 5,362,606 5,362,544 1.00E-20
BNL3261 c12 14.59 c12 33.17 c26 or c12 Chr08 4,336,936 4,337,448 0
SNP0334 c12 15.02 c26 or c12 Chr08 5,466,981 5,467,043 3.00E-22
SNP0416 c12 15.87 c26 or c12 Chr08 3,781,088 3,781,029 6.00E-24
SNP0226 c12 16.91 c26 or c12 Chr08 3,848,543 3,848,605 6.00E-24
SNP0327 c12 18.12 c26 or c12 Chr08 6,661,296 6,661,358 6.00E-19
SNP0173 c12 19.31 c26 or c12 Chr08 3,652,835 3,652,897 6.00E-24
SNP0211 c12 20.26 c26 or c12 Chr08 6,390,329 6,390,267 3.00E-22
SNP0079 c12 20.81 no hit
SNP0047 c12 21.39 c15 or c01 Chr02 14,469,277 14,469,215 1.00E-20
SNP0136 c12 22.20 no hit
SNP0203 c12 23.73 c26 or c12 Chr08 7,102,485 7,102,426 6.00E-24
DPL0248 c12 25.76 c12 38.26 c26 or c12 Chr08 7,104,516 7,103,939 0
SHIN-1413 c12 33.25 c12 41.57 c26 or c12 Chr08 9,543,996 9,543,563 0
BNL3599 c12 38.62 c12 43.43 c26 or c12 Chr08 9,388,542 9,389,065 0
DPL1293 c12 46.56 c12 43.76 c26 or c12 Chr08 34,200,839 34,200,175 0
MUSS026 c12 0.00 c12 41.94 c26 or c12 Chr08 8,085,003 8,084,596 5.00E-146
SHIN-0409 c12 0.00 c12 45.43 c26 or c12 Chr08 8,085,003 8,084,507 0
DPL0010 c12 0.00 c12 68.17 c26 or c12 Chr08 41,720,433 41,721,017 0
SNP0265 c12 6.11 c26 or c12 Chr08 41,593,503 41,593,441 3.00E-22
SNP0145 c12 9.11 no hit
DPL1325 c12 10.51 c12 69.52 c26 or c12 Chr08 42,546,371 42,546,533 2.00E-73
DPL1575 c12 16.06 c26 or c12 Chr08 44,619,315 44,618,659 0
SNP0198 c12 20.31 c26 or c12 Chr08 44,710,525 44,710,463 3.00E-22
BNL2709 c12 30.99 c12 74.93 no hit
DPL0070 c12 0.00 c12 77.87 c26 or c12 Chr08 47,342,127 47,342,846 0
DC30107 c12 0.97 c12 78.03 no sequence
Page 46 of 62
The Plant Genome: Posted 22 Nov. 2013; doi: 10.3835/plantgenome2013.07.0023
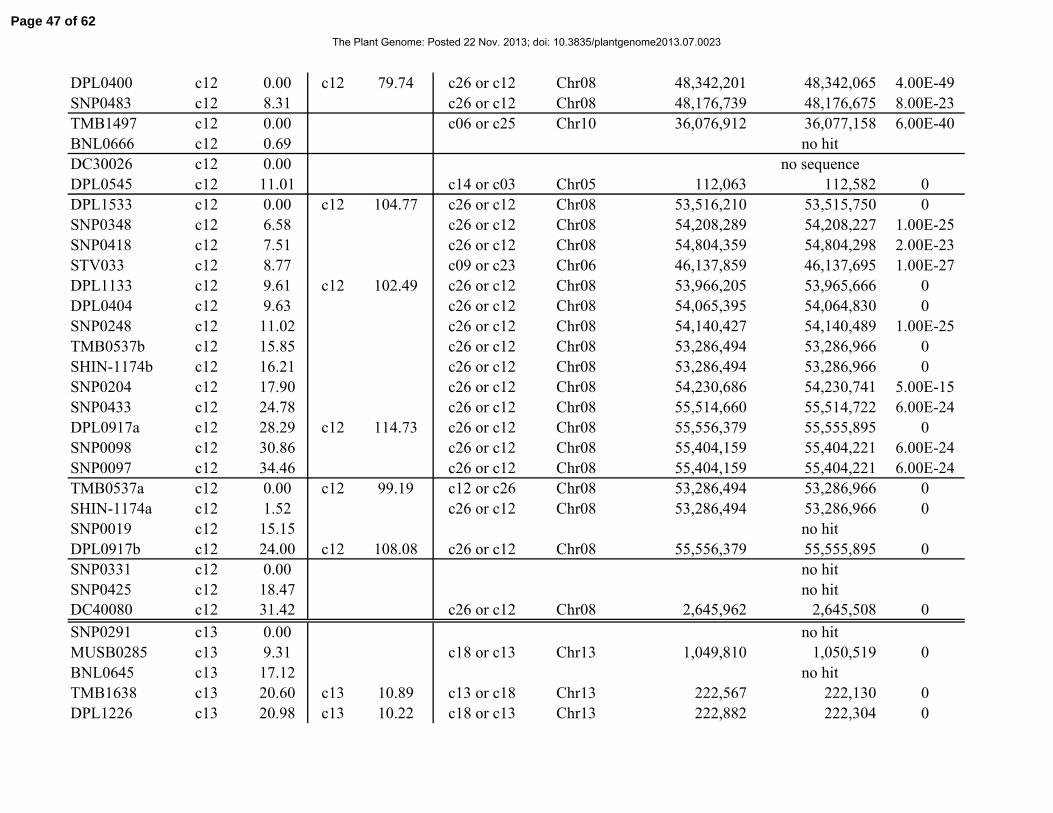
DPL0400 c12 0.00 c12 79.74 c26 or c12 Chr08 48,342,201 48,342,065 4.00E-49
SNP0483 c12 8.31 c26 or c12 Chr08 48,176,739 48,176,675 8.00E-23
TMB1497 c12 0.00 c06 or c25 Chr10 36,076,912 36,077,158 6.00E-40
BNL0666 c12 0.69 no hit
DC30026 c12 0.00 no sequence
DPL0545 c12 11.01 c14 or c03 Chr05 112,063 112,582 0
DPL1533 c12 0.00 c12 104.77 c26 or c12 Chr08 53,516,210 53,515,750 0
SNP0348 c12 6.58 c26 or c12 Chr08 54,208,289 54,208,227 1.00E-25
SNP0418 c12 7.51 c26 or c12 Chr08 54,804,359 54,804,298 2.00E-23
STV033 c12 8.77 c09 or c23 Chr06 46,137,859 46,137,695 1.00E-27
DPL1133 c12 9.61 c12 102.49 c26 or c12 Chr08 53,966,205 53,965,666 0
DPL0404 c12 9.63 c26 or c12 Chr08 54,065,395 54,064,830 0
SNP0248 c12 11.02 c26 or c12 Chr08 54,140,427 54,140,489 1.00E-25
TMB0537b c12 15.85 c26 or c12 Chr08 53,286,494 53,286,966 0
SHIN-1174b c12 16.21 c26 or c12 Chr08 53,286,494 53,286,966 0
SNP0204 c12 17.90 c26 or c12 Chr08 54,230,686 54,230,741 5.00E-15
SNP0433 c12 24.78 c26 or c12 Chr08 55,514,660 55,514,722 6.00E-24
DPL0917a c12 28.29 c12 114.73 c26 or c12 Chr08 55,556,379 55,555,895 0
SNP0098 c12 30.86 c26 or c12 Chr08 55,404,159 55,404,221 6.00E-24
SNP0097 c12 34.46 c26 or c12 Chr08 55,404,159 55,404,221 6.00E-24
TMB0537a c12 0.00 c12 99.19 c12 or c26 Chr08 53,286,494 53,286,966 0
SHIN-1174a c12 1.52 c26 or c12 Chr08 53,286,494 53,286,966 0
SNP0019 c12 15.15 no hit
DPL0917b c12 24.00 c12 108.08 c26 or c12 Chr08 55,556,379 55,555,895 0
SNP0331 c12 0.00 no hit
SNP0425 c12 18.47 no hit
DC40080 c12 31.42 c26 or c12 Chr08 2,645,962 2,645,508 0
SNP0291 c13 0.00 no hit
MUSB0285 c13 9.31 c18 or c13 Chr13 1,049,810 1,050,519 0
BNL0645 c13 17.12 no hit
TMB1638 c13 20.60 c13 10.89 c13 or c18 Chr13 222,567 222,130 0
DPL1226 c13 20.98 c13 10.22 c18 or c13 Chr13 222,882 222,304 0
Page 47 of 62
The Plant Genome: Posted 22 Nov. 2013; doi: 10.3835/plantgenome2013.07.0023
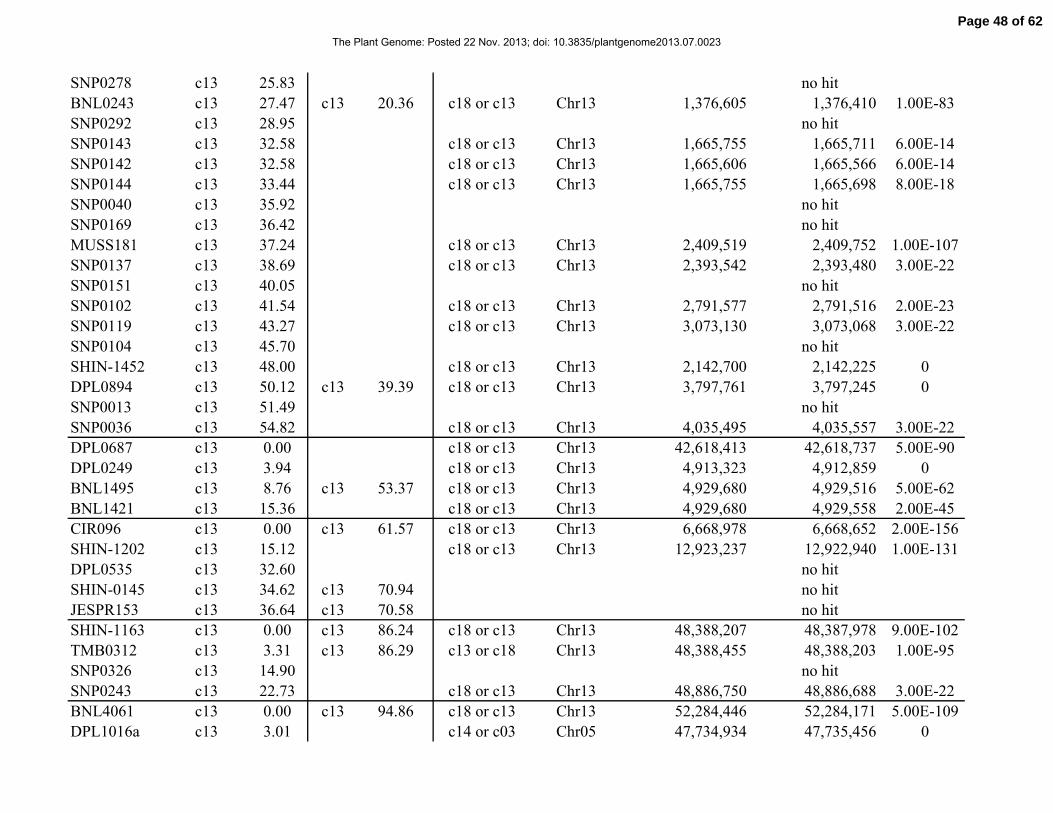
SNP0278 c13 25.83 no hit
BNL0243 c13 27.47 c13 20.36 c18 or c13 Chr13 1,376,605 1,376,410 1.00E-83
SNP0292 c13 28.95 no hit
SNP0143 c13 32.58 c18 or c13 Chr13 1,665,755 1,665,711 6.00E-14
SNP0142 c13 32.58 c18 or c13 Chr13 1,665,606 1,665,566 6.00E-14
SNP0144 c13 33.44 c18 or c13 Chr13 1,665,755 1,665,698 8.00E-18
SNP0040 c13 35.92 no hit
SNP0169 c13 36.42 no hit
MUSS181 c13 37.24 c18 or c13 Chr13 2,409,519 2,409,752 1.00E-107
SNP0137 c13 38.69 c18 or c13 Chr13 2,393,542 2,393,480 3.00E-22
SNP0151 c13 40.05 no hit
SNP0102 c13 41.54 c18 or c13 Chr13 2,791,577 2,791,516 2.00E-23
SNP0119 c13 43.27 c18 or c13 Chr13 3,073,130 3,073,068 3.00E-22
SNP0104 c13 45.70 no hit
SHIN-1452 c13 48.00 c18 or c13 Chr13 2,142,700 2,142,225 0
DPL0894 c13 50.12 c13 39.39 c18 or c13 Chr13 3,797,761 3,797,245 0
SNP0013 c13 51.49 no hit
SNP0036 c13 54.82 c18 or c13 Chr13 4,035,495 4,035,557 3.00E-22
DPL0687 c13 0.00 c18 or c13 Chr13 42,618,413 42,618,737 5.00E-90
DPL0249 c13 3.94 c18 or c13 Chr13 4,913,323 4,912,859 0
BNL1495 c13 8.76 c13 53.37 c18 or c13 Chr13 4,929,680 4,929,516 5.00E-62
BNL1421 c13 15.36 c18 or c13 Chr13 4,929,680 4,929,558 2.00E-45
CIR096 c13 0.00 c13 61.57 c18 or c13 Chr13 6,668,978 6,668,652 2.00E-156
SHIN-1202 c13 15.12 c18 or c13 Chr13 12,923,237 12,922,940 1.00E-131
DPL0535 c13 32.60 no hit
SHIN-0145 c13 34.62 c13 70.94 no hit
JESPR153 c13 36.64 c13 70.58 no hit
SHIN-1163 c13 0.00 c13 86.24 c18 or c13 Chr13 48,388,207 48,387,978 9.00E-102
TMB0312 c13 3.31 c13 86.29 c13 or c18 Chr13 48,388,455 48,388,203 1.00E-95
SNP0326 c13 14.90 no hit
SNP0243 c13 22.73 c18 or c13 Chr13 48,886,750 48,886,688 3.00E-22
BNL4061 c13 0.00 c13 94.86 c18 or c13 Chr13 52,284,446 52,284,171 5.00E-109
DPL1016a c13 3.01 c14 or c03 Chr05 47,734,934 47,735,456 0
Page 48 of 62
The Plant Genome: Posted 22 Nov. 2013; doi: 10.3835/plantgenome2013.07.0023
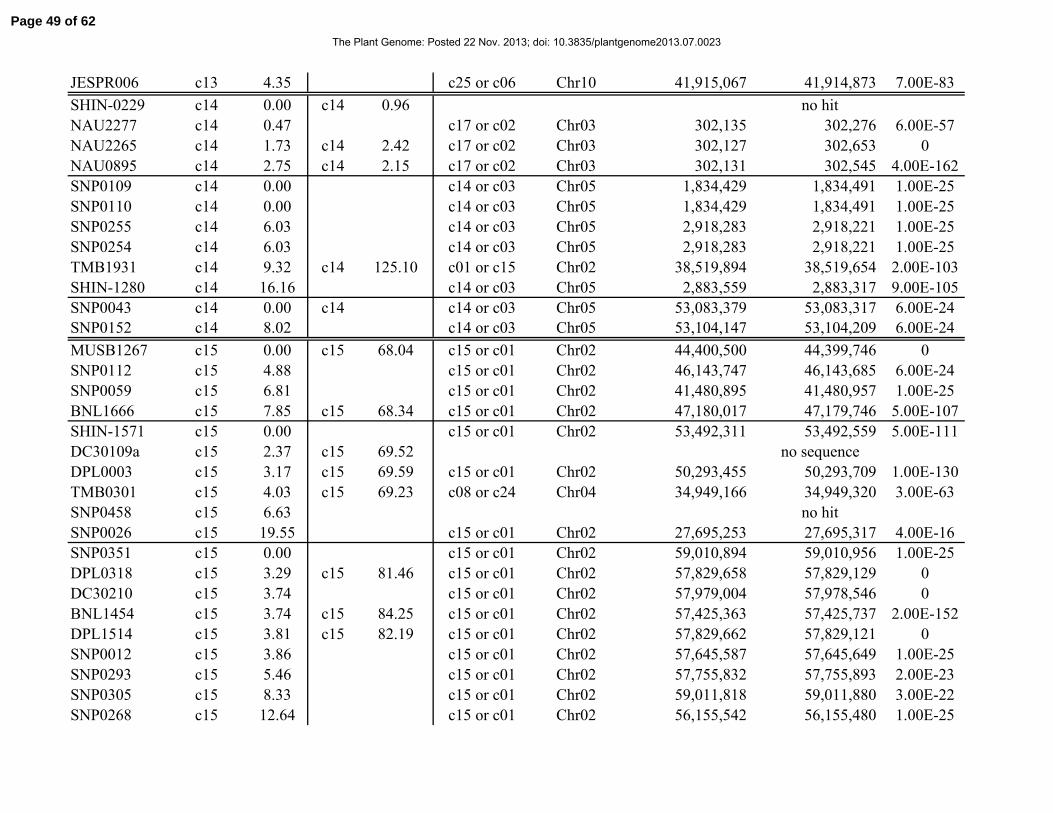
JESPR006 c13 4.35 c25 or c06 Chr10 41,915,067 41,914,873 7.00E-83
SHIN-0229 c14 0.00 c14 0.96 no hit
NAU2277 c14 0.47 c17 or c02 Chr03 302,135 302,276 6.00E-57
NAU2265 c14 1.73 c14 2.42 c17 or c02 Chr03 302,127 302,653 0
NAU0895 c14 2.75 c14 2.15 c17 or c02 Chr03 302,131 302,545 4.00E-162
SNP0109 c14 0.00 c14 or c03 Chr05 1,834,429 1,834,491 1.00E-25
SNP0110 c14 0.00 c14 or c03 Chr05 1,834,429 1,834,491 1.00E-25
SNP0255 c14 6.03 c14 or c03 Chr05 2,918,283 2,918,221 1.00E-25
SNP0254 c14 6.03 c14 or c03 Chr05 2,918,283 2,918,221 1.00E-25
TMB1931 c14 9.32 c14 125.10 c01 or c15 Chr02 38,519,894 38,519,654 2.00E-103
SHIN-1280 c14 16.16 c14 or c03 Chr05 2,883,559 2,883,317 9.00E-105
SNP0043 c14 0.00 c14 c14 or c03 Chr05 53,083,379 53,083,317 6.00E-24
SNP0152 c14 8.02 c14 or c03 Chr05 53,104,147 53,104,209 6.00E-24
MUSB1267 c15 0.00 c15 68.04 c15 or c01 Chr02 44,400,500 44,399,746 0
SNP0112 c15 4.88 c15 or c01 Chr02 46,143,747 46,143,685 6.00E-24
SNP0059 c15 6.81 c15 or c01 Chr02 41,480,895 41,480,957 1.00E-25
BNL1666 c15 7.85 c15 68.34 c15 or c01 Chr02 47,180,017 47,179,746 5.00E-107
SHIN-1571 c15 0.00 c15 or c01 Chr02 53,492,311 53,492,559 5.00E-111
DC30109a c15 2.37 c15 69.52 no sequence
DPL0003 c15 3.17 c15 69.59 c15 or c01 Chr02 50,293,455 50,293,709 1.00E-130
TMB0301 c15 4.03 c15 69.23 c08 or c24 Chr04 34,949,166 34,949,320 3.00E-63
SNP0458 c15 6.63 no hit
SNP0026 c15 19.55 c15 or c01 Chr02 27,695,253 27,695,317 4.00E-16
SNP0351 c15 0.00 c15 or c01 Chr02 59,010,894 59,010,956 1.00E-25
DPL0318 c15 3.29 c15 81.46 c15 or c01 Chr02 57,829,658 57,829,129 0
DC30210 c15 3.74 c15 or c01 Chr02 57,979,004 57,978,546 0
BNL1454 c15 3.74 c15 84.25 c15 or c01 Chr02 57,425,363 57,425,737 2.00E-152
DPL1514 c15 3.81 c15 82.19 c15 or c01 Chr02 57,829,662 57,829,121 0
SNP0012 c15 3.86 c15 or c01 Chr02 57,645,587 57,645,649 1.00E-25
SNP0293 c15 5.46 c15 or c01 Chr02 57,755,832 57,755,893 2.00E-23
SNP0305 c15 8.33 c15 or c01 Chr02 59,011,818 59,011,880 3.00E-22
SNP0268 c15 12.64 c15 or c01 Chr02 56,155,542 56,155,480 1.00E-25
Page 49 of 62
The Plant Genome: Posted 22 Nov. 2013; doi: 10.3835/plantgenome2013.07.0023
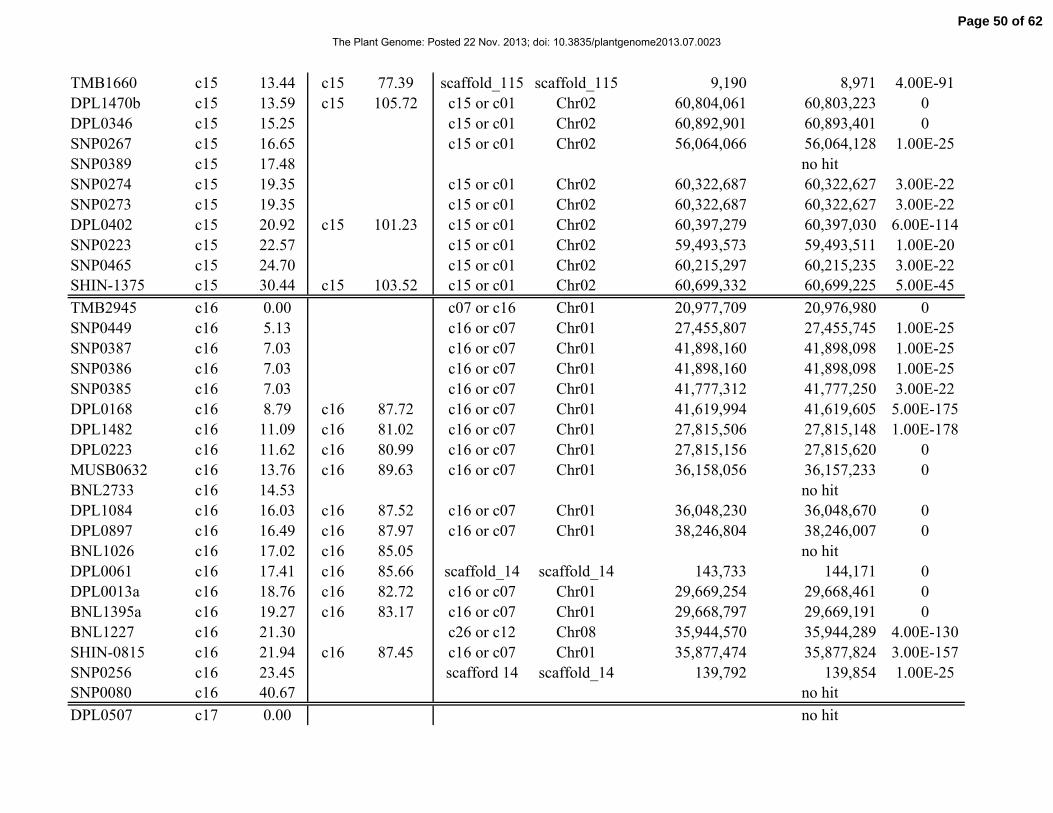
TMB1660 c15 13.44 c15 77.39 scaffold_115 scaffold_115 9,190 8,971 4.00E-91
DPL1470b c15 13.59 c15 105.72 c15 or c01 Chr02 60,804,061 60,803,223 0
DPL0346 c15 15.25 c15 or c01 Chr02 60,892,901 60,893,401 0
SNP0267 c15 16.65 c15 or c01 Chr02 56,064,066 56,064,128 1.00E-25
SNP0389 c15 17.48 no hit
SNP0274 c15 19.35 c15 or c01 Chr02 60,322,687 60,322,627 3.00E-22
SNP0273 c15 19.35 c15 or c01 Chr02 60,322,687 60,322,627 3.00E-22
DPL0402 c15 20.92 c15 101.23 c15 or c01 Chr02 60,397,279 60,397,030 6.00E-114
SNP0223 c15 22.57 c15 or c01 Chr02 59,493,573 59,493,511 1.00E-20
SNP0465 c15 24.70 c15 or c01 Chr02 60,215,297 60,215,235 3.00E-22
SHIN-1375 c15 30.44 c15 103.52 c15 or c01 Chr02 60,699,332 60,699,225 5.00E-45
TMB2945 c16 0.00 c07 or c16 Chr01 20,977,709 20,976,980 0
SNP0449 c16 5.13 c16 or c07 Chr01 27,455,807 27,455,745 1.00E-25
SNP0387 c16 7.03 c16 or c07 Chr01 41,898,160 41,898,098 1.00E-25
SNP0386 c16 7.03 c16 or c07 Chr01 41,898,160 41,898,098 1.00E-25
SNP0385 c16 7.03 c16 or c07 Chr01 41,777,312 41,777,250 3.00E-22
DPL0168 c16 8.79 c16 87.72 c16 or c07 Chr01 41,619,994 41,619,605 5.00E-175
DPL1482 c16 11.09 c16 81.02 c16 or c07 Chr01 27,815,506 27,815,148 1.00E-178
DPL0223 c16 11.62 c16 80.99 c16 or c07 Chr01 27,815,156 27,815,620 0
MUSB0632 c16 13.76 c16 89.63 c16 or c07 Chr01 36,158,056 36,157,233 0
BNL2733 c16 14.53 no hit
DPL1084 c16 16.03 c16 87.52 c16 or c07 Chr01 36,048,230 36,048,670 0
DPL0897 c16 16.49 c16 87.97 c16 or c07 Chr01 38,246,804 38,246,007 0
BNL1026 c16 17.02 c16 85.05 no hit
DPL0061 c16 17.41 c16 85.66 scaffold_14 scaffold_14 143,733 144,171 0
DPL0013a c16 18.76 c16 82.72 c16 or c07 Chr01 29,669,254 29,668,461 0
BNL1395a c16 19.27 c16 83.17 c16 or c07 Chr01 29,668,797 29,669,191 0
BNL1227 c16 21.30 c26 or c12 Chr08 35,944,570 35,944,289 4.00E-130
SHIN-0815 c16 21.94 c16 87.45 c16 or c07 Chr01 35,877,474 35,877,824 3.00E-157
SNP0256 c16 23.45 scafford 14 scaffold_14 139,792 139,854 1.00E-25
SNP0080 c16 40.67 no hit
DPL0507 c17 0.00 no hit
Page 50 of 62
The Plant Genome: Posted 22 Nov. 2013; doi: 10.3835/plantgenome2013.07.0023
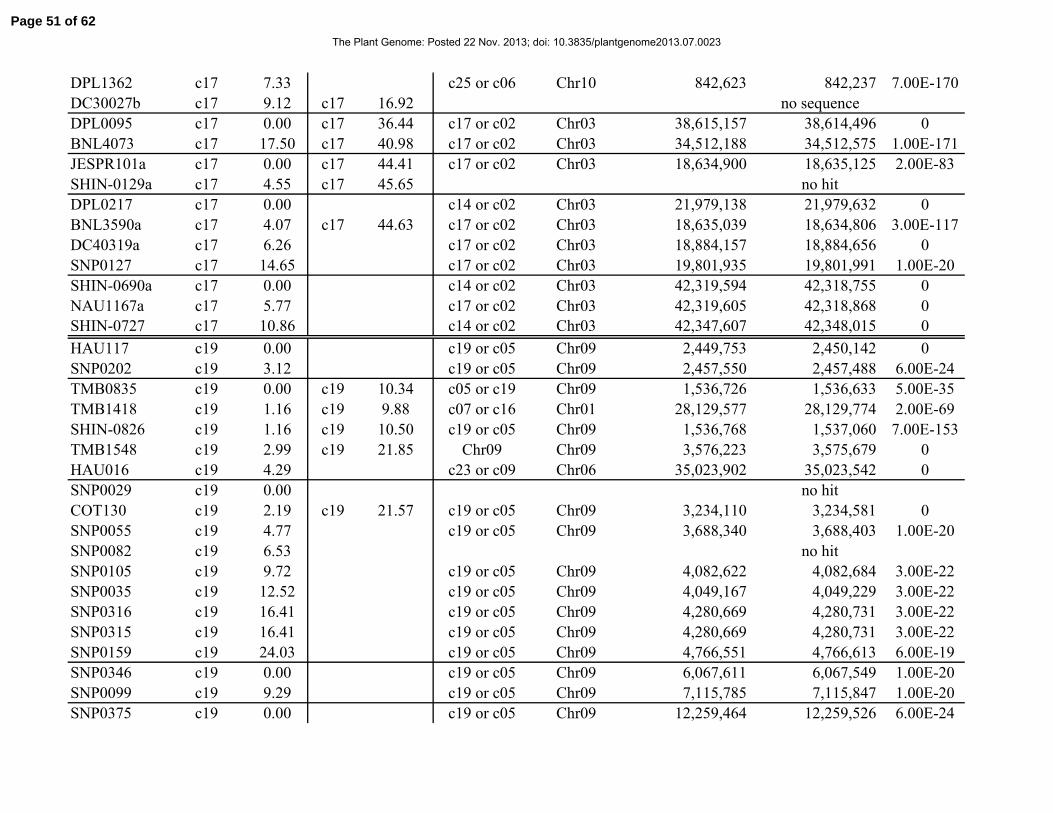
DPL1362 c17 7.33 c25 or c06 Chr10 842,623 842,237 7.00E-170
DC30027b c17 9.12 c17 16.92 no sequence
DPL0095 c17 0.00 c17 36.44 c17 or c02 Chr03 38,615,157 38,614,496 0
BNL4073 c17 17.50 c17 40.98 c17 or c02 Chr03 34,512,188 34,512,575 1.00E-171
JESPR101a c17 0.00 c17 44.41 c17 or c02 Chr03 18,634,900 18,635,125 2.00E-83
SHIN-0129a c17 4.55 c17 45.65 no hit
DPL0217 c17 0.00 c14 or c02 Chr03 21,979,138 21,979,632 0
BNL3590a c17 4.07 c17 44.63 c17 or c02 Chr03 18,635,039 18,634,806 3.00E-117
DC40319a c17 6.26 c17 or c02 Chr03 18,884,157 18,884,656 0
SNP0127 c17 14.65 c17 or c02 Chr03 19,801,935 19,801,991 1.00E-20
SHIN-0690a c17 0.00 c14 or c02 Chr03 42,319,594 42,318,755 0
NAU1167a c17 5.77 c17 or c02 Chr03 42,319,605 42,318,868 0
SHIN-0727 c17 10.86 c14 or c02 Chr03 42,347,607 42,348,015 0
HAU117 c19 0.00 c19 or c05 Chr09 2,449,753 2,450,142 0
SNP0202 c19 3.12 c19 or c05 Chr09 2,457,550 2,457,488 6.00E-24
TMB0835 c19 0.00 c19 10.34 c05 or c19 Chr09 1,536,726 1,536,633 5.00E-35
TMB1418 c19 1.16 c19 9.88 c07 or c16 Chr01 28,129,577 28,129,774 2.00E-69
SHIN-0826 c19 1.16 c19 10.50 c19 or c05 Chr09 1,536,768 1,537,060 7.00E-153
TMB1548 c19 2.99 c19 21.85 Chr09 Chr09 3,576,223 3,575,679 0
HAU016 c19 4.29 c23 or c09 Chr06 35,023,902 35,023,542 0
SNP0029 c19 0.00 no hit
COT130 c19 2.19 c19 21.57 c19 or c05 Chr09 3,234,110 3,234,581 0
SNP0055 c19 4.77 c19 or c05 Chr09 3,688,340 3,688,403 1.00E-20
SNP0082 c19 6.53 no hit
SNP0105 c19 9.72 c19 or c05 Chr09 4,082,622 4,082,684 3.00E-22
SNP0035 c19 12.52 c19 or c05 Chr09 4,049,167 4,049,229 3.00E-22
SNP0316 c19 16.41 c19 or c05 Chr09 4,280,669 4,280,731 3.00E-22
SNP0315 c19 16.41 c19 or c05 Chr09 4,280,669 4,280,731 3.00E-22
SNP0159 c19 24.03 c19 or c05 Chr09 4,766,551 4,766,613 6.00E-19
SNP0346 c19 0.00 c19 or c05 Chr09 6,067,611 6,067,549 1.00E-20
SNP0099 c19 9.29 c19 or c05 Chr09 7,115,785 7,115,847 1.00E-20
SNP0375 c19 0.00 c19 or c05 Chr09 12,259,464 12,259,526 6.00E-24
Page 51 of 62
The Plant Genome: Posted 22 Nov. 2013; doi: 10.3835/plantgenome2013.07.0023
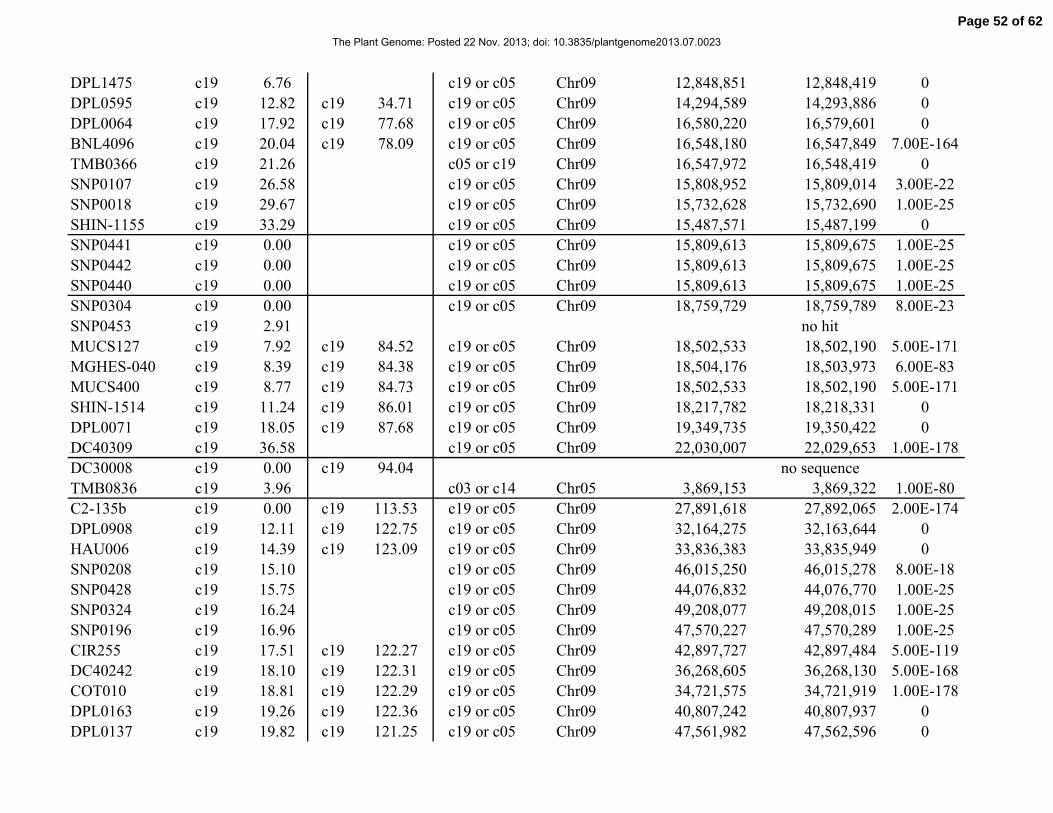
DPL1475 c19 6.76 c19 or c05 Chr09 12,848,851 12,848,419 0
DPL0595 c19 12.82 c19 34.71 c19 or c05 Chr09 14,294,589 14,293,886 0
DPL0064 c19 17.92 c19 77.68 c19 or c05 Chr09 16,580,220 16,579,601 0
BNL4096 c19 20.04 c19 78.09 c19 or c05 Chr09 16,548,180 16,547,849 7.00E-164
TMB0366 c19 21.26 c05 or c19 Chr09 16,547,972 16,548,419 0
SNP0107 c19 26.58 c19 or c05 Chr09 15,808,952 15,809,014 3.00E-22
SNP0018 c19 29.67 c19 or c05 Chr09 15,732,628 15,732,690 1.00E-25
SHIN-1155 c19 33.29 c19 or c05 Chr09 15,487,571 15,487,199 0
SNP0441 c19 0.00 c19 or c05 Chr09 15,809,613 15,809,675 1.00E-25
SNP0442 c19 0.00 c19 or c05 Chr09 15,809,613 15,809,675 1.00E-25
SNP0440 c19 0.00 c19 or c05 Chr09 15,809,613 15,809,675 1.00E-25
SNP0304 c19 0.00 c19 or c05 Chr09 18,759,729 18,759,789 8.00E-23
SNP0453 c19 2.91 no hit
MUCS127 c19 7.92 c19 84.52 c19 or c05 Chr09 18,502,533 18,502,190 5.00E-171
MGHES-040 c19 8.39 c19 84.38 c19 or c05 Chr09 18,504,176 18,503,973 6.00E-83
MUCS400 c19 8.77 c19 84.73 c19 or c05 Chr09 18,502,533 18,502,190 5.00E-171
SHIN-1514 c19 11.24 c19 86.01 c19 or c05 Chr09 18,217,782 18,218,331 0
DPL0071 c19 18.05 c19 87.68 c19 or c05 Chr09 19,349,735 19,350,422 0
DC40309 c19 36.58 c19 or c05 Chr09 22,030,007 22,029,653 1.00E-178
DC30008 c19 0.00 c19 94.04 no sequence
TMB0836 c19 3.96 c03 or c14 Chr05 3,869,153 3,869,322 1.00E-80
C2-135b c19 0.00 c19 113.53 c19 or c05 Chr09 27,891,618 27,892,065 2.00E-174
DPL0908 c19 12.11 c19 122.75 c19 or c05 Chr09 32,164,275 32,163,644 0
HAU006 c19 14.39 c19 123.09 c19 or c05 Chr09 33,836,383 33,835,949 0
SNP0208 c19 15.10 c19 or c05 Chr09 46,015,250 46,015,278 8.00E-18
SNP0428 c19 15.75 c19 or c05 Chr09 44,076,832 44,076,770 1.00E-25
SNP0324 c19 16.24 c19 or c05 Chr09 49,208,077 49,208,015 1.00E-25
SNP0196 c19 16.96 c19 or c05 Chr09 47,570,227 47,570,289 1.00E-25
CIR255 c19 17.51 c19 122.27 c19 or c05 Chr09 42,897,727 42,897,484 5.00E-119
DC40242 c19 18.10 c19 122.31 c19 or c05 Chr09 36,268,605 36,268,130 5.00E-168
COT010 c19 18.81 c19 122.29 c19 or c05 Chr09 34,721,575 34,721,919 1.00E-178
DPL0163 c19 19.26 c19 122.36 c19 or c05 Chr09 40,807,242 40,807,937 0
DPL0137 c19 19.82 c19 121.25 c19 or c05 Chr09 47,561,982 47,562,596 0
Page 52 of 62
The Plant Genome: Posted 22 Nov. 2013; doi: 10.3835/plantgenome2013.07.0023
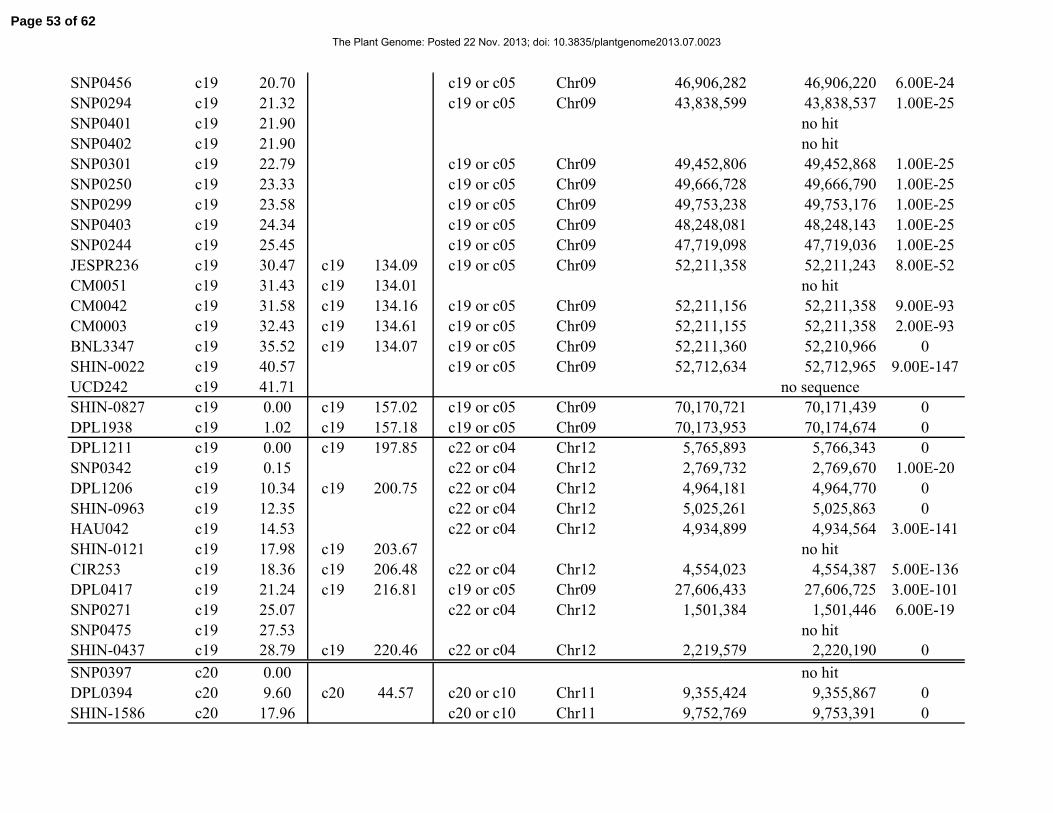
SNP0456 c19 20.70 c19 or c05 Chr09 46,906,282 46,906,220 6.00E-24
SNP0294 c19 21.32 c19 or c05 Chr09 43,838,599 43,838,537 1.00E-25
SNP0401 c19 21.90 no hit
SNP0402 c19 21.90 no hit
SNP0301 c19 22.79 c19 or c05 Chr09 49,452,806 49,452,868 1.00E-25
SNP0250 c19 23.33 c19 or c05 Chr09 49,666,728 49,666,790 1.00E-25
SNP0299 c19 23.58 c19 or c05 Chr09 49,753,238 49,753,176 1.00E-25
SNP0403 c19 24.34 c19 or c05 Chr09 48,248,081 48,248,143 1.00E-25
SNP0244 c19 25.45 c19 or c05 Chr09 47,719,098 47,719,036 1.00E-25
JESPR236 c19 30.47 c19 134.09 c19 or c05 Chr09 52,211,358 52,211,243 8.00E-52
CM0051 c19 31.43 c19 134.01 no hit
CM0042 c19 31.58 c19 134.16 c19 or c05 Chr09 52,211,156 52,211,358 9.00E-93
CM0003 c19 32.43 c19 134.61 c19 or c05 Chr09 52,211,155 52,211,358 2.00E-93
BNL3347 c19 35.52 c19 134.07 c19 or c05 Chr09 52,211,360 52,210,966 0
SHIN-0022 c19 40.57 c19 or c05 Chr09 52,712,634 52,712,965 9.00E-147
UCD242 c19 41.71 no sequence
SHIN-0827 c19 0.00 c19 157.02 c19 or c05 Chr09 70,170,721 70,171,439 0
DPL1938 c19 1.02 c19 157.18 c19 or c05 Chr09 70,173,953 70,174,674 0
DPL1211 c19 0.00 c19 197.85 c22 or c04 Chr12 5,765,893 5,766,343 0
SNP0342 c19 0.15 c22 or c04 Chr12 2,769,732 2,769,670 1.00E-20
DPL1206 c19 10.34 c19 200.75 c22 or c04 Chr12 4,964,181 4,964,770 0
SHIN-0963 c19 12.35 c22 or c04 Chr12 5,025,261 5,025,863 0
HAU042 c19 14.53 c22 or c04 Chr12 4,934,899 4,934,564 3.00E-141
SHIN-0121 c19 17.98 c19 203.67 no hit
CIR253 c19 18.36 c19 206.48 c22 or c04 Chr12 4,554,023 4,554,387 5.00E-136
DPL0417 c19 21.24 c19 216.81 c19 or c05 Chr09 27,606,433 27,606,725 3.00E-101
SNP0271 c19 25.07 c22 or c04 Chr12 1,501,384 1,501,446 6.00E-19
SNP0475 c19 27.53 no hit
SHIN-0437 c19 28.79 c19 220.46 c22 or c04 Chr12 2,219,579 2,220,190 0
SNP0397 c20 0.00 no hit
DPL0394 c20 9.60 c20 44.57 c20 or c10 Chr11 9,355,424 9,355,867 0
SHIN-1586 c20 17.96 c20 or c10 Chr11 9,752,769 9,753,391 0
Page 53 of 62
The Plant Genome: Posted 22 Nov. 2013; doi: 10.3835/plantgenome2013.07.0023

BNL0946 c20 0.00 c20 70.86 c20 or c10 Chr11 28,725,102 28,724,825 8.00E-142
DPL0697 c20 0.52 c20 or c10 Chr11 28,519,249 28,518,656 5.00E-161
DPL0135 c20 0.52 c20 71.05 c20 or c10 Chr11 28,724,363 28,724,867 0
TMB1939 c20 1.07 c09 or c23 Chr06 38,643,729 38,643,813 6.00E-18
DPL0225 c20 0.00 c20 78.45 c20 or c10 Chr11 49,500,452 49,500,903 0
BNL0119 c20 11.88 c20 78.93 c20 or c10 Chr11 50,619,562 50,619,343 5.00E-88
DPL0442 c20 0.00 c20 or c10 Chr11 54,950,803 54,950,259 0
SHIN-1165 c20 1.98 c20 or c10 Chr11 15,981,224 15,981,455 3.00E-33
DC40113 c20 0.00 c20 c20 or c10 Chr11 55,705,856 55,706,323 0
SNP0312 c20 3.31 c20 or c10 Chr11 55,723,371 55,723,309 3.00E-17
DPL1903 c20 0.00 c20 105.25 c20 or c10 Chr11 58,130,716 58,131,318 0
DPL1795 c20 2.16 c20 105.13 c20 or c10 Chr11 58,107,954 58,108,602 0
SNP0279 c20 9.42 c20 or c10 Chr11 58,536,297 58,536,359 6.00E-24
SNP0065 c20 9.85 c20 or c10 Chr11 60,205,349 60,205,287 3.00E-22
SNP0064 c20 9.85 c20 or c10 Chr11 60,304,292 60,304,230 3.00E-22
SNP0406 c20 12.54 c20 or c10 Chr11 57,912,863 57,912,917 3.00E-22
DPL1022 c20 14.58 c20 109.39 c20 or c10 Chr11 59,190,203 59,190,686 0
SNP0405 c20 16.27 c20 or c10 Chr11 57,912,863 57,912,917 4.00E-16
CIR353 c20 18.20 c23 or c09 Chr06 14,078,315 14,078,094 7.00E-77
SNP0120 c20 19.69 c20 or c10 Chr11 61,456,146 61,456,207 5.00E-25
SHIN-1167 c21 0.00 c21 35.51 c21 or c11 Chr07 4,152,698 4,152,122 0
DPL0131 c21 5.22 c21 35.22 c21 or c11 Chr07 3,873,468 3,874,120 0
SNP0241 c21 6.84 c21 or c11 Chr07 3,714,555 3,714,617 6.00E-24
SNP0308 c21 8.73 c21 or c11 Chr07 3,715,820 3,715,758 3.00E-22
DPL0777 c21 15.11 c21 39.03 c21 or c11 Chr07 4,674,912 4,675,460 0
MUSS324 c21 17.64 no hit
DPL0863b c21 21.18 c21 37.21 c21 or c11 Chr07 4,421,772 4,422,215 0
DC30147b c21 24.42 c21 37.68 no sequence
BNL1034a c21 38.18 c21 42.58 c21 or c11 Chr07 5,461,346 5,461,074 3.00E-122
BNL1053 c21 0.00 c21 75.34 c21 or c11 Chr07 16,505,978 16,505,768 1.00E-78
JESPR251 c21 2.18 c21 79.59 c21 or c11 Chr07 16,505,850 16,505,801 8.00E-19
SNP0476 c21 0.00 c14 or c03 Chr05 59,545,105 59,545,044 5.00E-25
Page 54 of 62
The Plant Genome: Posted 22 Nov. 2013; doi: 10.3835/plantgenome2013.07.0023
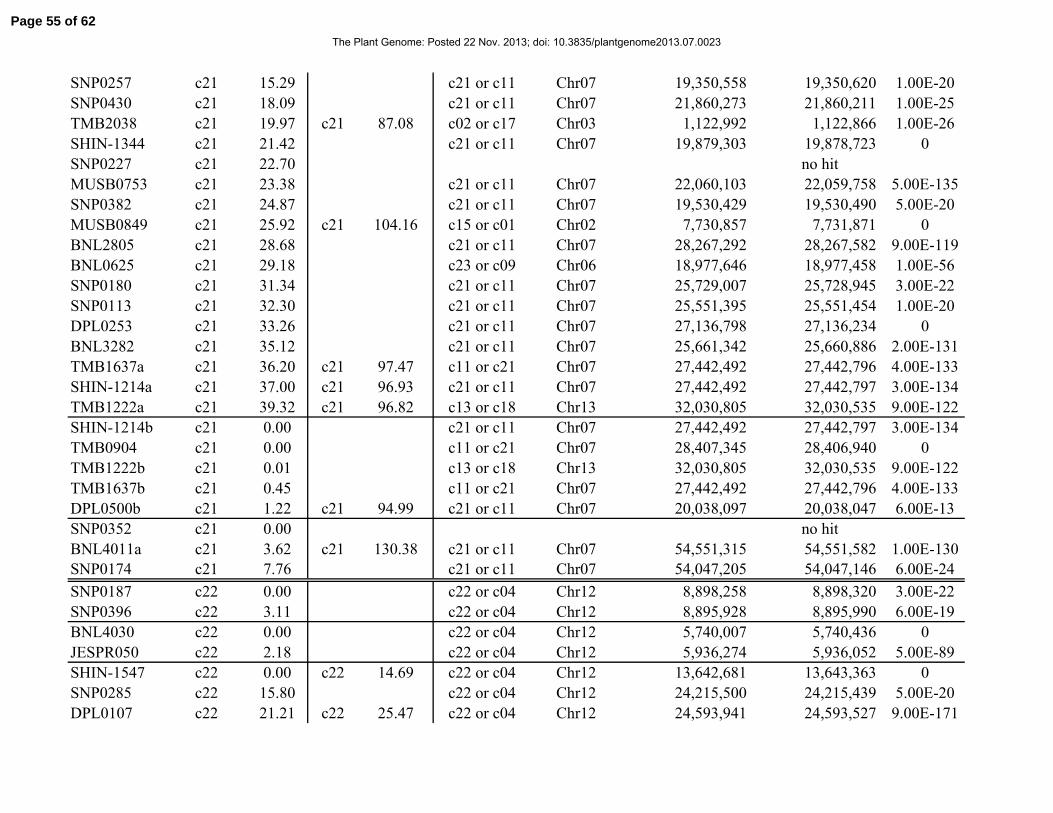
SNP0257 c21 15.29 c21 or c11 Chr07 19,350,558 19,350,620 1.00E-20
SNP0430 c21 18.09 c21 or c11 Chr07 21,860,273 21,860,211 1.00E-25
TMB2038 c21 19.97 c21 87.08 c02 or c17 Chr03 1,122,992 1,122,866 1.00E-26
SHIN-1344 c21 21.42 c21 or c11 Chr07 19,879,303 19,878,723 0
SNP0227 c21 22.70 no hit
MUSB0753 c21 23.38 c21 or c11 Chr07 22,060,103 22,059,758 5.00E-135
SNP0382 c21 24.87 c21 or c11 Chr07 19,530,429 19,530,490 5.00E-20
MUSB0849 c21 25.92 c21 104.16 c15 or c01 Chr02 7,730,857 7,731,871 0
BNL2805 c21 28.68 c21 or c11 Chr07 28,267,292 28,267,582 9.00E-119
BNL0625 c21 29.18 c23 or c09 Chr06 18,977,646 18,977,458 1.00E-56
SNP0180 c21 31.34 c21 or c11 Chr07 25,729,007 25,728,945 3.00E-22
SNP0113 c21 32.30 c21 or c11 Chr07 25,551,395 25,551,454 1.00E-20
DPL0253 c21 33.26 c21 or c11 Chr07 27,136,798 27,136,234 0
BNL3282 c21 35.12 c21 or c11 Chr07 25,661,342 25,660,886 2.00E-131
TMB1637a c21 36.20 c21 97.47 c11 or c21 Chr07 27,442,492 27,442,796 4.00E-133
SHIN-1214a c21 37.00 c21 96.93 c21 or c11 Chr07 27,442,492 27,442,797 3.00E-134
TMB1222a c21 39.32 c21 96.82 c13 or c18 Chr13 32,030,805 32,030,535 9.00E-122
SHIN-1214b c21 0.00 c21 or c11 Chr07 27,442,492 27,442,797 3.00E-134
TMB0904 c21 0.00 c11 or c21 Chr07 28,407,345 28,406,940 0
TMB1222b c21 0.01 c13 or c18 Chr13 32,030,805 32,030,535 9.00E-122
TMB1637b c21 0.45 c11 or c21 Chr07 27,442,492 27,442,796 4.00E-133
DPL0500b c21 1.22 c21 94.99 c21 or c11 Chr07 20,038,097 20,038,047 6.00E-13
SNP0352 c21 0.00 no hit
BNL4011a c21 3.62 c21 130.38 c21 or c11 Chr07 54,551,315 54,551,582 1.00E-130
SNP0174 c21 7.76 c21 or c11 Chr07 54,047,205 54,047,146 6.00E-24
SNP0187 c22 0.00 c22 or c04 Chr12 8,898,258 8,898,320 3.00E-22
SNP0396 c22 3.11 c22 or c04 Chr12 8,895,928 8,895,990 6.00E-19
BNL4030 c22 0.00 c22 or c04 Chr12 5,740,007 5,740,436 0
JESPR050 c22 2.18 c22 or c04 Chr12 5,936,274 5,936,052 5.00E-89
SHIN-1547 c22 0.00 c22 14.69 c22 or c04 Chr12 13,642,681 13,643,363 0
SNP0285 c22 15.80 c22 or c04 Chr12 24,215,500 24,215,439 5.00E-20
DPL0107 c22 21.21 c22 25.47 c22 or c04 Chr12 24,593,941 24,593,527 9.00E-171
Page 55 of 62
The Plant Genome: Posted 22 Nov. 2013; doi: 10.3835/plantgenome2013.07.0023
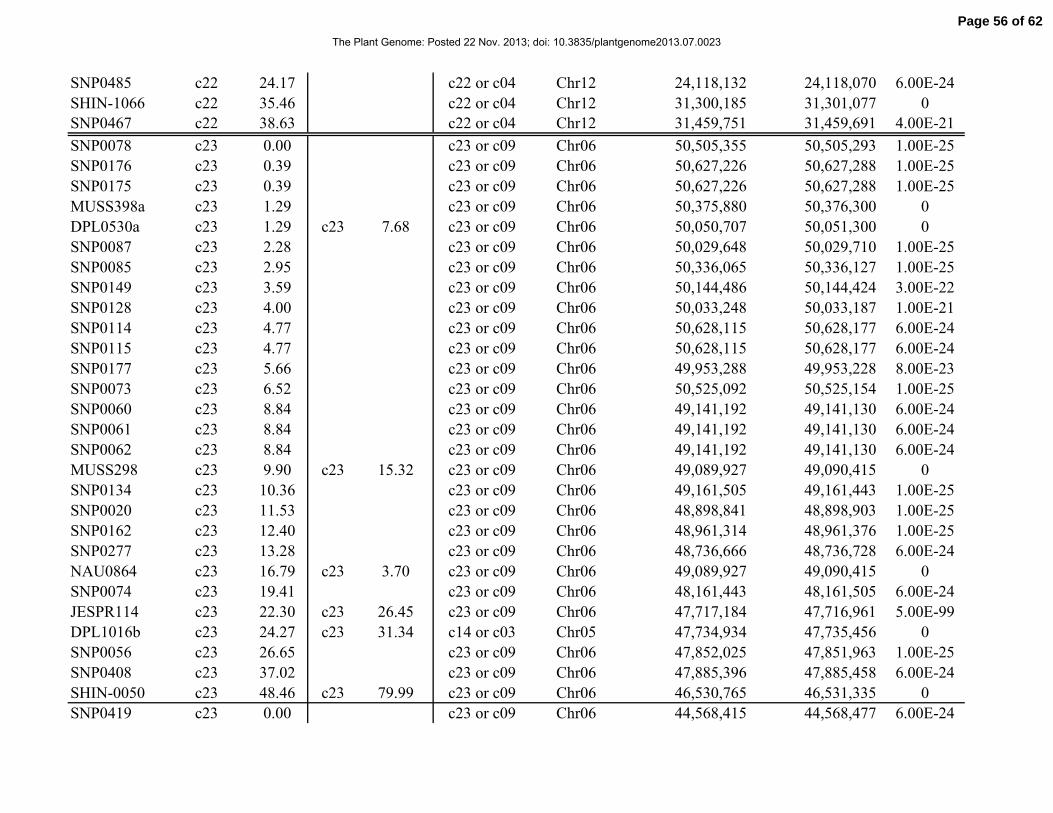
SNP0485 c22 24.17 c22 or c04 Chr12 24,118,132 24,118,070 6.00E-24
SHIN-1066 c22 35.46 c22 or c04 Chr12 31,300,185 31,301,077 0
SNP0467 c22 38.63 c22 or c04 Chr12 31,459,751 31,459,691 4.00E-21
SNP0078 c23 0.00 c23 or c09 Chr06 50,505,355 50,505,293 1.00E-25
SNP0176 c23 0.39 c23 or c09 Chr06 50,627,226 50,627,288 1.00E-25
SNP0175 c23 0.39 c23 or c09 Chr06 50,627,226 50,627,288 1.00E-25
MUSS398a c23 1.29 c23 or c09 Chr06 50,375,880 50,376,300 0
DPL0530a c23 1.29 c23 7.68 c23 or c09 Chr06 50,050,707 50,051,300 0
SNP0087 c23 2.28 c23 or c09 Chr06 50,029,648 50,029,710 1.00E-25
SNP0085 c23 2.95 c23 or c09 Chr06 50,336,065 50,336,127 1.00E-25
SNP0149 c23 3.59 c23 or c09 Chr06 50,144,486 50,144,424 3.00E-22
SNP0128 c23 4.00 c23 or c09 Chr06 50,033,248 50,033,187 1.00E-21
SNP0114 c23 4.77 c23 or c09 Chr06 50,628,115 50,628,177 6.00E-24
SNP0115 c23 4.77 c23 or c09 Chr06 50,628,115 50,628,177 6.00E-24
SNP0177 c23 5.66 c23 or c09 Chr06 49,953,288 49,953,228 8.00E-23
SNP0073 c23 6.52 c23 or c09 Chr06 50,525,092 50,525,154 1.00E-25
SNP0060 c23 8.84 c23 or c09 Chr06 49,141,192 49,141,130 6.00E-24
SNP0061 c23 8.84 c23 or c09 Chr06 49,141,192 49,141,130 6.00E-24
SNP0062 c23 8.84 c23 or c09 Chr06 49,141,192 49,141,130 6.00E-24
MUSS298 c23 9.90 c23 15.32 c23 or c09 Chr06 49,089,927 49,090,415 0
SNP0134 c23 10.36 c23 or c09 Chr06 49,161,505 49,161,443 1.00E-25
SNP0020 c23 11.53 c23 or c09 Chr06 48,898,841 48,898,903 1.00E-25
SNP0162 c23 12.40 c23 or c09 Chr06 48,961,314 48,961,376 1.00E-25
SNP0277 c23 13.28 c23 or c09 Chr06 48,736,666 48,736,728 6.00E-24
NAU0864 c23 16.79 c23 3.70 c23 or c09 Chr06 49,089,927 49,090,415 0
SNP0074 c23 19.41 c23 or c09 Chr06 48,161,443 48,161,505 6.00E-24
JESPR114 c23 22.30 c23 26.45 c23 or c09 Chr06 47,717,184 47,716,961 5.00E-99
DPL1016b c23 24.27 c23 31.34 c14 or c03 Chr05 47,734,934 47,735,456 0
SNP0056 c23 26.65 c23 or c09 Chr06 47,852,025 47,851,963 1.00E-25
SNP0408 c23 37.02 c23 or c09 Chr06 47,885,396 47,885,458 6.00E-24
SHIN-0050 c23 48.46 c23 79.99 c23 or c09 Chr06 46,530,765 46,531,335 0
SNP0419 c23 0.00 c23 or c09 Chr06 44,568,415 44,568,477 6.00E-24
Page 56 of 62
The Plant Genome: Posted 22 Nov. 2013; doi: 10.3835/plantgenome2013.07.0023
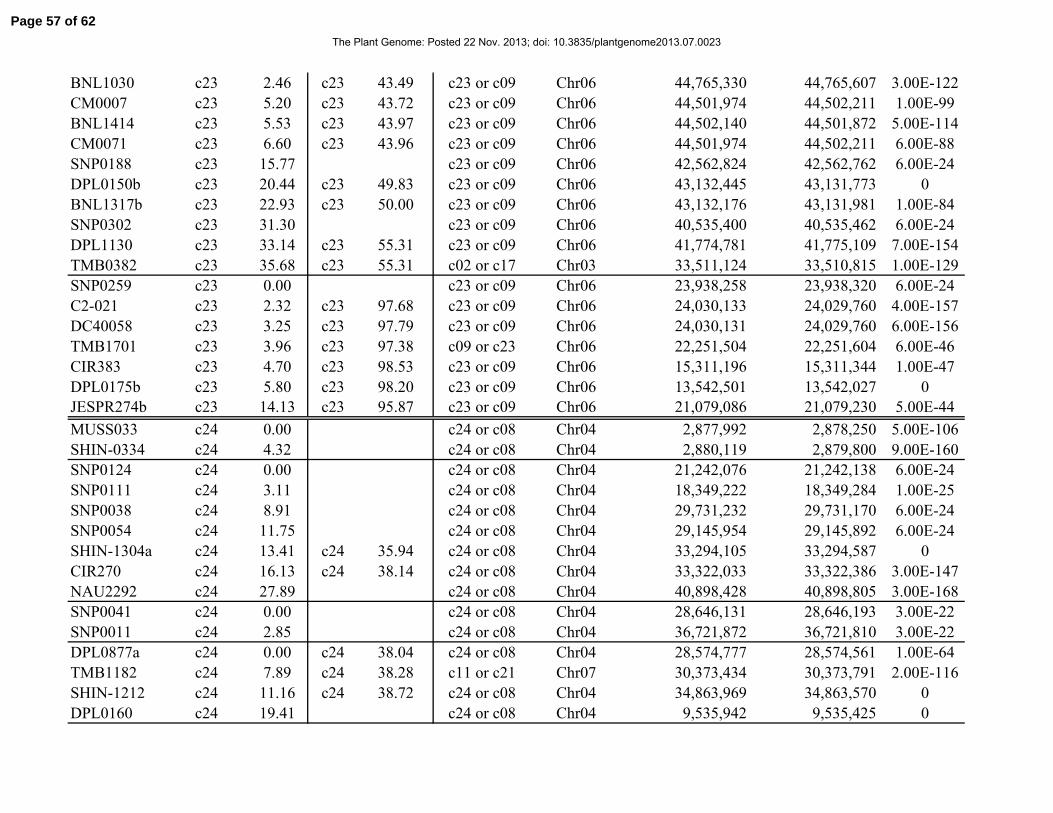
BNL1030 c23 2.46 c23 43.49 c23 or c09 Chr06 44,765,330 44,765,607 3.00E-122
CM0007 c23 5.20 c23 43.72 c23 or c09 Chr06 44,501,974 44,502,211 1.00E-99
BNL1414 c23 5.53 c23 43.97 c23 or c09 Chr06 44,502,140 44,501,872 5.00E-114
CM0071 c23 6.60 c23 43.96 c23 or c09 Chr06 44,501,974 44,502,211 6.00E-88
SNP0188 c23 15.77 c23 or c09 Chr06 42,562,824 42,562,762 6.00E-24
DPL0150b c23 20.44 c23 49.83 c23 or c09 Chr06 43,132,445 43,131,773 0
BNL1317b c23 22.93 c23 50.00 c23 or c09 Chr06 43,132,176 43,131,981 1.00E-84
SNP0302 c23 31.30 c23 or c09 Chr06 40,535,400 40,535,462 6.00E-24
DPL1130 c23 33.14 c23 55.31 c23 or c09 Chr06 41,774,781 41,775,109 7.00E-154
TMB0382 c23 35.68 c23 55.31 c02 or c17 Chr03 33,511,124 33,510,815 1.00E-129
SNP0259 c23 0.00 c23 or c09 Chr06 23,938,258 23,938,320 6.00E-24
C2-021 c23 2.32 c23 97.68 c23 or c09 Chr06 24,030,133 24,029,760 4.00E-157
DC40058 c23 3.25 c23 97.79 c23 or c09 Chr06 24,030,131 24,029,760 6.00E-156
TMB1701 c23 3.96 c23 97.38 c09 or c23 Chr06 22,251,504 22,251,604 6.00E-46
CIR383 c23 4.70 c23 98.53 c23 or c09 Chr06 15,311,196 15,311,344 1.00E-47
DPL0175b c23 5.80 c23 98.20 c23 or c09 Chr06 13,542,501 13,542,027 0
JESPR274b c23 14.13 c23 95.87 c23 or c09 Chr06 21,079,086 21,079,230 5.00E-44
MUSS033 c24 0.00 c24 or c08 Chr04 2,877,992 2,878,250 5.00E-106
SHIN-0334 c24 4.32 c24 or c08 Chr04 2,880,119 2,879,800 9.00E-160
SNP0124 c24 0.00 c24 or c08 Chr04 21,242,076 21,242,138 6.00E-24
SNP0111 c24 3.11 c24 or c08 Chr04 18,349,222 18,349,284 1.00E-25
SNP0038 c24 8.91 c24 or c08 Chr04 29,731,232 29,731,170 6.00E-24
SNP0054 c24 11.75 c24 or c08 Chr04 29,145,954 29,145,892 6.00E-24
SHIN-1304a c24 13.41 c24 35.94 c24 or c08 Chr04 33,294,105 33,294,587 0
CIR270 c24 16.13 c24 38.14 c24 or c08 Chr04 33,322,033 33,322,386 3.00E-147
NAU2292 c24 27.89 c24 or c08 Chr04 40,898,428 40,898,805 3.00E-168
SNP0041 c24 0.00 c24 or c08 Chr04 28,646,131 28,646,193 3.00E-22
SNP0011 c24 2.85 c24 or c08 Chr04 36,721,872 36,721,810 3.00E-22
DPL0877a c24 0.00 c24 38.04 c24 or c08 Chr04 28,574,777 28,574,561 1.00E-64
TMB1182 c24 7.89 c24 38.28 c11 or c21 Chr07 30,373,434 30,373,791 2.00E-116
SHIN-1212 c24 11.16 c24 38.72 c24 or c08 Chr04 34,863,969 34,863,570 0
DPL0160 c24 19.41 c24 or c08 Chr04 9,535,942 9,535,425 0
Page 57 of 62
The Plant Genome: Posted 22 Nov. 2013; doi: 10.3835/plantgenome2013.07.0023

BNL2655 c24 0.00 c24 41.54 c24 or c08 Chr04 37,477,704 37,477,437 1.00E-124
BNL2499 c24 1.11 c24 41.98 c24 or c08 Chr04 38,327,810 38,328,407 0
SNP0063 c24 0.00 c24 or c08 Chr04 59,775,862 59,775,924 6.00E-24
SNP0005 c24 3.52 c24 or c08 Chr04 59,508,055 59,507,993 6.00E-24
SNP0452 c24 9.01 c24 or c08 Chr04 57,621,568 57,621,504 8.00E-23
SNP0108 c24 12.41 no hit
SNP0246 c24 20.76 c24 or c08 Chr04 55,129,155 55,129,093 6.00E-24
SNP0329 c24 27.17 c24 or c08 Chr04 56,984,315 56,984,253 6.00E-24
SNP0281 c24 29.55 c24 or c08 Chr04 54,851,017 54,851,079 3.00E-22
SHIN-0384 c24 35.08 c24 79.58 c18 or c13 Chr13 44,197,913 44,197,730 1.00E-50
DPL0353 c24 0.00 c24 121.22 c24 or c08 Chr04 61,512,824 61,513,207 5.00E-157
DPL0152 c24 1.05 c24 121.06 c24 or c08 Chr04 61,521,045 61,521,375 3.00E-142
SHIN-1076 c24 2.05 c24 121.22 c24 or c08 Chr04 61,512,490 61,512,833 1.00E-134
DC20106 c25 0.00 c25 18.68 c19 or c05 Chr09 65,100,318 65,100,596 8.00E-78
SNP0313 c25 11.70 c25 or c06 Chr10 58,967,452 58,967,514 6.00E-24
DPL0282 c25 15.70 c25 21.90 c25 or c06 Chr10 58,929,081 58,929,742 0
CIR268 c25 0.00 c25 39.16 c25 or c06 Chr10 54,466,260 54,465,984 4.00E-131
DPL0811 c25 2.06 c25 or c06 Chr10 54,525,191 54,524,571 0
DPL1411a c25 0.00 c25 or c06 Chr10 265,339 265,949 0
BNL3937 c25 1.89 c25 51.73 c25 or c06 Chr10 25,302,993 25,303,436 0
TMB2898 c25 3.55 c25 51.91 c10 or c20 Chr11 16,117,773 16,117,160 6.00E-144
MUSB0979 c25 4.65 c25 or c06 Chr10 30,500,421 30,501,114 0
DPL0532b c25 6.94 c25 57.66 c25 or c06 Chr10 20,264,061 20,263,413 0
SNP0323 c25 0.00 c25 or c06 Chr10 21,751,730 21,751,792 3.00E-22
BNL1440a c25 1.10 c25 61.81 no hit
SNP0046 c25 2.95 no hit
SNP0045 c25 2.95 no hit
SNP0390 c25 6.35 c25 or c06 Chr10 17,025,861 17,025,923 6.00E-24
SNP0336 c25 6.76 c25 or c06 Chr10 15,766,915 15,766,977 3.00E-22
SNP0337 c25 6.76 c25 or c06 Chr10 15,766,915 15,766,977 3.00E-22
UCD311 c25 8.13 c25 62.20 no sequence
SNP0338 c25 11.37 c25 or c06 Chr10 10,904,510 10,904,448 6.00E-24
Page 58 of 62
The Plant Genome: Posted 22 Nov. 2013; doi: 10.3835/plantgenome2013.07.0023

SHIN-0885 c25 11.51 c25 67.95 c25 or c06 Chr10 8,978,714 8,979,364 0
DPL0080a c25 12.38 c25 or c06 Chr10 11,215,332 11,214,824 0
TMB0313 c25 16.13 c25 67.33 c06 or c25 Chr10 10,182,152 10,182,614 0
DPL0702 c25 0.00 c25 86.13 c25 or c06 Chr10 4,679,528 4,679,864 1.00E-158
SNP0189 c25 7.23 c16 or c07 Chr01 39,774,193 39,774,131 3.00E-17
SNP0464 c25 18.17 c25 or c06 Chr10 6,390,678 6,390,625 3.00E-17
SNP0463 c25 18.17 c25 or c06 Chr10 6,390,678 6,390,625 3.00E-17
SNP0435 c25 0.00 c25 or c06 Chr10 2,836,790 2,836,852 6.00E-24
SNP0434 c25 0.00 c25 or c06 Chr10 2,836,790 2,836,852 6.00E-24
BNL1047 c25 3.67 c25 90.37 c25 or c06 Chr10 3,104,164 3,104,390 8.00E-112
SNP0420 c25 6.65 c25 or c06 Chr10 2,977,857 2,977,795 6.00E-24
SNP0427 c25 13.70 c25 or c06 Chr10 2,105,304 2,105,242 6.00E-24
SNP0361 c25 17.02 c25 or c06 Chr10 1,651,293 1,651,231 1.00E-25
SNP0220 c25 19.80 c25 or c06 Chr10 121,518 121,456 6.00E-24
DPL1411b c25 23.59 c25 118.57 c25 or c06 Chr10 265,339 265,949 0
DC30135 c25 25.00 c25 118.31 no sequence
DPL0059 c25 25.98 c25 118.31 c25 or c06 Chr10 179,607 180,148 0
SNP0429 c25 26.86 no hit
SNP0372 c25 27.14 c25 or c06 Chr10 306,860 306,801 6.00E-24
BNL3359 c25 28.62 c25 or c06 Chr10 813,375 814,089 0
CIR267 c25 29.67 c25 or c06 Chr10 918,712 918,520 9.00E-66
BNL0827 c25 38.10 c25 115.93 c25 or c06 Chr10 995,271 994,964 7.00E-134
COT036 c25 39.30 c25 115.43 c25 or c06 Chr10 995,170 994,826 1.00E-153
SNP0367 c26 0.00 c26 or c12 Chr08 47,717,704 47,717,642 1.00E-20
SNP0368 c26 0.00 c26 or c12 Chr08 47,717,704 47,717,643 1.00E-21
DPL1373 c26 8.61 c26 46.62 c26 or c12 Chr08 36,819,248 36,820,045 0
SNP0376 c26 10.03 c26 or c12 Chr08 36,826,436 36,826,498 1.00E-25
DPL1283 c26 17.06 c26 47.37 c26 or c12 Chr08 38,034,012 38,034,552 0
C2-052B c26 0.00 c26 65.68 c26 or c12 Chr08 43,676,133 43,676,555 0
SNP0207 c26 8.38 no hit
BNL2495 c26 0.00 c26 73.26 c26 or c12 Chr08 46,952,763 46,953,293 0
SNP0088 c26 5.47 c26 or c12 Chr08 46,791,048 46,790,986 1.00E-25
Page 59 of 62
The Plant Genome: Posted 22 Nov. 2013; doi: 10.3835/plantgenome2013.07.0023
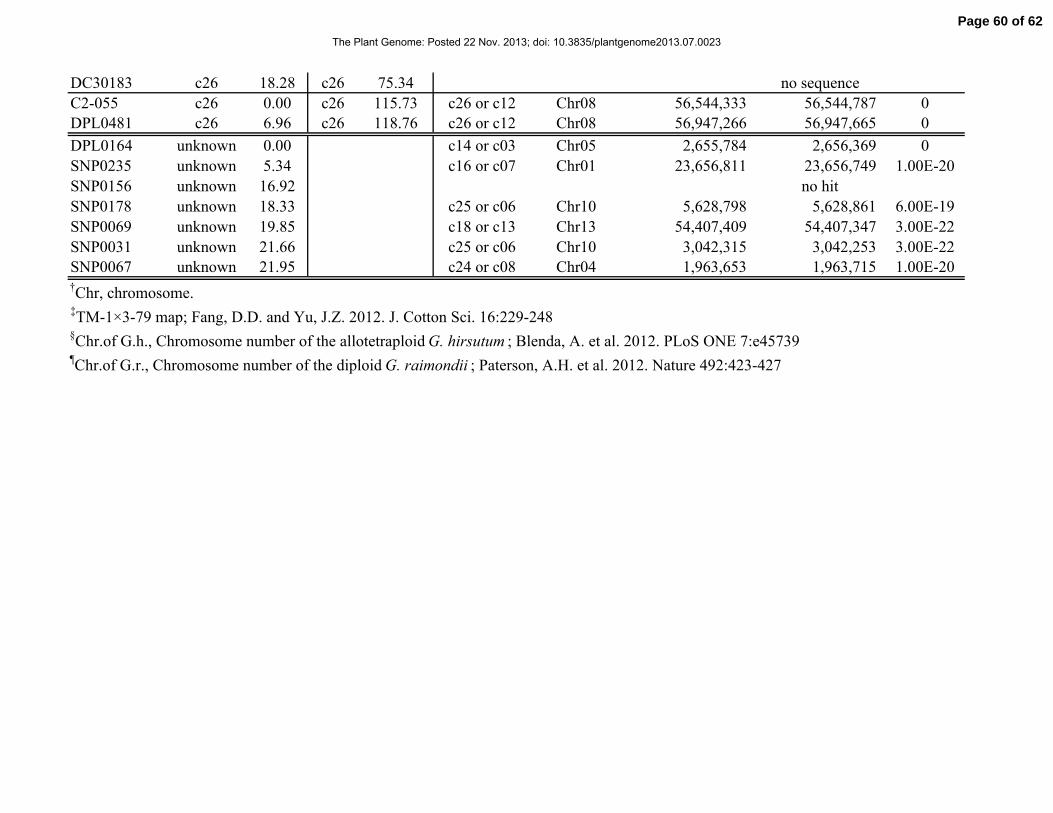
DC30183 c26 18.28 c26 75.34 no sequence
C2-055 c26 0.00 c26 115.73 c26 or c12 Chr08 56,544,333 56,544,787 0
DPL0481 c26 6.96 c26 118.76 c26 or c12 Chr08 56,947,266 56,947,665 0
DPL0164 unknown 0.00 c14 or c03 Chr05 2,655,784 2,656,369 0
SNP0235 unknown 5.34 c16 or c07 Chr01 23,656,811 23,656,749 1.00E-20
SNP0156 unknown 16.92 no hit
SNP0178 unknown 18.33 c25 or c06 Chr10 5,628,798 5,628,861 6.00E-19
SNP0069 unknown 19.85 c18 or c13 Chr13 54,407,409 54,407,347 3.00E-22
SNP0031 unknown 21.66 c25 or c06 Chr10 3,042,315 3,042,253 3.00E-22
SNP0067 unknown 21.95 c24 or c08 Chr04 1,963,653 1,963,715 1.00E-20†Chr, chromosome.‡TM-1×3-79 map; Fang, D.D. and Yu, J.Z. 2012. J. Cotton Sci. 16:229-248
§Chr.of G.h., Chromosome number of the allotetraploid G. hirsutum ; Blenda, A. et al. 2012. PLoS ONE 7:e45739
¶Chr.of G.r., Chromosome number of the diploid G. raimondii ; Paterson, A.H. et al. 2012. Nature 492:423-427
Page 60 of 62
The Plant Genome: Posted 22 Nov. 2013; doi: 10.3835/plantgenome2013.07.0023
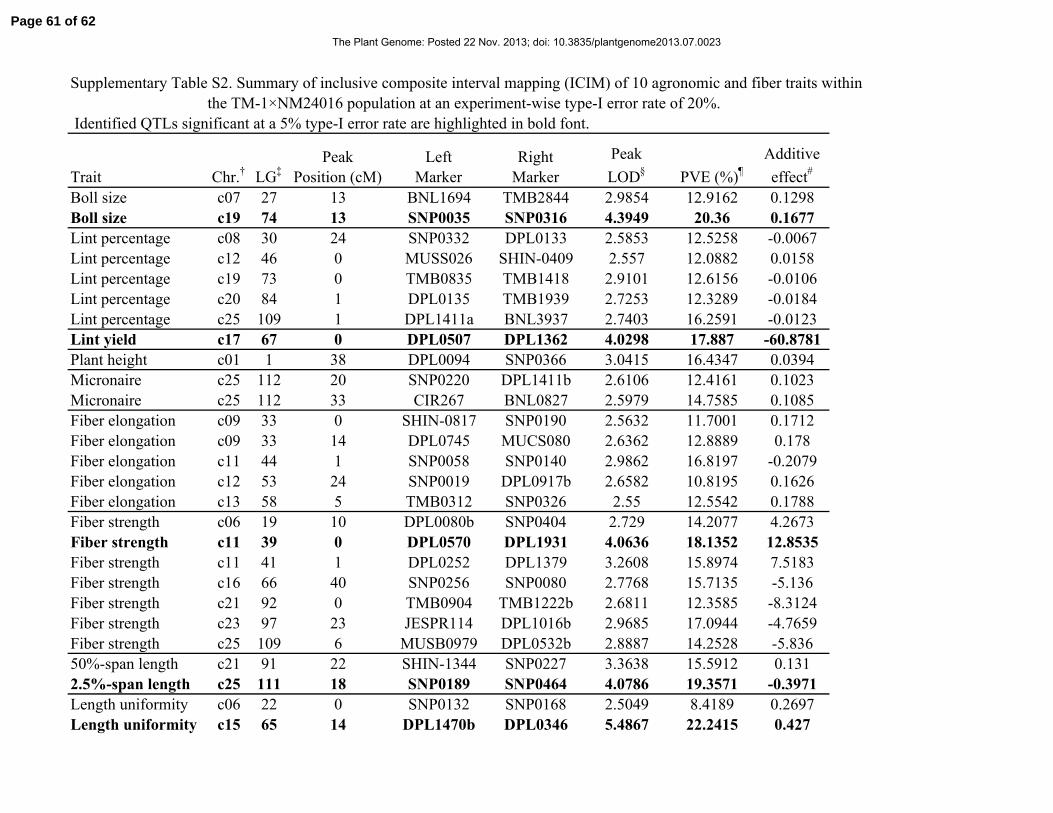
Supplementary Table S2. Summary of inclusive composite interval mapping (ICIM) of 10 agronomic and fiber traits within
the TM-1×NM24016 population at an experiment-wise type-I error rate of 20%.
Identified QTLs significant at a 5% type-I error rate are highlighted in bold font.
Trait Chr.†LG
‡Peak
Position (cM)
Left
Marker
Right
Marker
Peak
LOD§
PVE (%)¶
Additive
effect#
Boll size c07 27 13 BNL1694 TMB2844 2.9854 12.9162 0.1298
Boll size c19 74 13 SNP0035 SNP0316 4.3949 20.36 0.1677
Lint percentage c08 30 24 SNP0332 DPL0133 2.5853 12.5258 -0.0067
Lint percentage c12 46 0 MUSS026 SHIN-0409 2.557 12.0882 0.0158
Lint percentage c19 73 0 TMB0835 TMB1418 2.9101 12.6156 -0.0106
Lint percentage c20 84 1 DPL0135 TMB1939 2.7253 12.3289 -0.0184
Lint percentage c25 109 1 DPL1411a BNL3937 2.7403 16.2591 -0.0123
Lint yield c17 67 0 DPL0507 DPL1362 4.0298 17.887 -60.8781
Plant height c01 1 38 DPL0094 SNP0366 3.0415 16.4347 0.0394
Micronaire c25 112 20 SNP0220 DPL1411b 2.6106 12.4161 0.1023
Micronaire c25 112 33 CIR267 BNL0827 2.5979 14.7585 0.1085
Fiber elongation c09 33 0 SHIN-0817 SNP0190 2.5632 11.7001 0.1712
Fiber elongation c09 33 14 DPL0745 MUCS080 2.6362 12.8889 0.178
Fiber elongation c11 44 1 SNP0058 SNP0140 2.9862 16.8197 -0.2079
Fiber elongation c12 53 24 SNP0019 DPL0917b 2.6582 10.8195 0.1626
Fiber elongation c13 58 5 TMB0312 SNP0326 2.55 12.5542 0.1788
Fiber strength c06 19 10 DPL0080b SNP0404 2.729 14.2077 4.2673
Fiber strength c11 39 0 DPL0570 DPL1931 4.0636 18.1352 12.8535
Fiber strength c11 41 1 DPL0252 DPL1379 3.2608 15.8974 7.5183
Fiber strength c16 66 40 SNP0256 SNP0080 2.7768 15.7135 -5.136
Fiber strength c21 92 0 TMB0904 TMB1222b 2.6811 12.3585 -8.3124
Fiber strength c23 97 23 JESPR114 DPL1016b 2.9685 17.0944 -4.7659
Fiber strength c25 109 6 MUSB0979 DPL0532b 2.8887 14.2528 -5.836
50%-span length c21 91 22 SHIN-1344 SNP0227 3.3638 15.5912 0.131
2.5%-span length c25 111 18 SNP0189 SNP0464 4.0786 19.3571 -0.3971
Length uniformity c06 22 0 SNP0132 SNP0168 2.5049 8.4189 0.2697
Length uniformity c15 65 14 DPL1470b DPL0346 5.4867 22.2415 0.427
Page 61 of 62
The Plant Genome: Posted 22 Nov. 2013; doi: 10.3835/plantgenome2013.07.0023
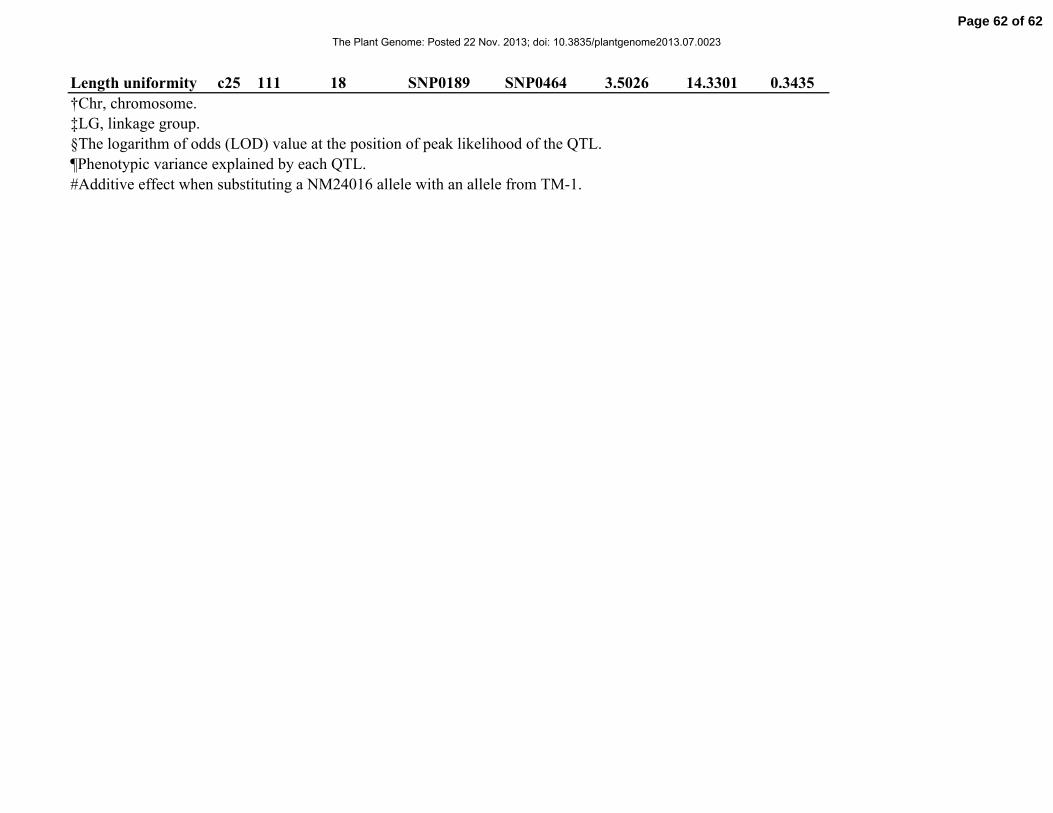
Length uniformity c25 111 18 SNP0189 SNP0464 3.5026 14.3301 0.3435
†Chr, chromosome.
‡LG, linkage group.
§The logarithm of odds (LOD) value at the position of peak likelihood of the QTL.
¶Phenotypic variance explained by each QTL.
#Additive effect when substituting a NM24016 allele with an allele from TM-1.
Page 62 of 62
The Plant Genome: Posted 22 Nov. 2013; doi: 10.3835/plantgenome2013.07.0023