linking hawaii fisherman reported commercial … 808-983-5386 fax: 808-983-2902 _____ cover graphics...
TRANSCRIPT

NOAA Technical Memorandum NMFS-PIFSC-11
September 2007
Linking Hawaii Fisherman Reported Commercial
Bottomfish Catch Data to Potential Bottomfish Habitat and Proposed Restricted Fishing Areas
using GIS and Spatial Analysis
Michael Parke
Pacific Islands Fisheries Science Center National Marine Fisheries Service National Oceanic and Atmospheric Administration U.S. Department of Commerce

About this document The mission of the National Oceanic and Atmospheric Administration (NOAA) is to understand and predict changes in the Earth=s environment and to conserve and manage coastal and oceanic marine resources and habitats to help meet our Nation=s economic, social, and environmental needs. As a branch of NOAA, the National Marine Fisheries Service (NMFS) conducts or sponsors research and monitoring programs to improve the scientific basis for conservation and management decisions. NMFS strives to make information about the purpose, methods, and results of its scientific studies widely available. NMFS= Pacific Islands Fisheries Science Center (PIFSC) uses the NOAA Technical Memorandum NMFS series to achieve timely dissemination of scientific and technical information that is of high quality but inappropriate for publication in the formal peer-reviewed literature. The contents are of broad scope, including technical workshop proceedings, large data compilations, status reports and reviews, lengthy scientific or statistical monographs, and more. NOAA Technical Memoranda published by the PIFSC, although informal, are subjected to extensive review and editing and reflect sound professional work. Accordingly, they may be referenced in the formal scientific and technical literature. A NOAA Technical Memorandum NMFS issued by the PIFSC may be cited using the following format:
Author. Date. Title. U.S. Dep. Commer., NOAA Tech. Memo., NOAA-TM-NMFS-PIFSC-XX, xx p.
__________________________ For further information direct inquiries to
Chief, Scientific Information Services Pacific Islands Fisheries Science Center National Marine Fisheries Service National Oceanic and Atmospheric Administration U.S. Department of Commerce 2570 Dole Street Honolulu, Hawaii 96822-2396
Phone: 808-983-5386 Fax: 808-983-2902
___________________________________________________________ Cover graphics by Michael Parke and Emily Lundblad, Pacific Islands Fisheries Science Center, Honolulu, Hawaii.

Pacific Islands Fisheries Science Center National Marine Fisheries Service National Oceanic and Atmospheric Administration U.S. Department of Commerce
Linking Hawaii Fisherman Reported Commercial
Bottomfish Catch Data to Potential Bottomfish Habitat and Proposed Restricted Fishing Areas
using GIS and Spatial Analysis
Michael Parke
Coral Reef Ecosystem Division
Pacific Islands Fisheries Science Center National Marine Fisheries Service
1125B Ala Moana Boulevard Honolulu, Hawaii 96814
NOAA Technical Memorandum NMFS-PIFSC-11
September 2007


iii
EXECUTIVE SUMMARY
This report outlines an effort to spatially link commercial bottomfish catch data from the State of Hawaii Fisherman Reporting System with potential adult bottomfish habitat and restricted fishing areas as proposed by the State of Hawaii (SOH) and the Western Pacific Fishery Management Council (WPFMC). In carrying out the analysis, data limitations required that we make multiple assumptions about “suitable” bottomfish habitat and the accuracy of reported catch locations. The results of the analysis are displayed in a series of maps and tables that provide a picture of the current commercial bottomfish fishing areas relative to suitable habitat and the possible relationships among habitat, reported catch, and Bottomfish Restricted Fishing Areas (BRFAs).
This analysis was finished prior to action taken by the State of Hawaii to officially adopt new BRFA boundaries. Since the State has legally implemented the new boundaries, all references in this paper to “proposed BRFAs” should be understood to refer to the new BRFAs. All references in this paper to “existing BRFAs” should be understood to refer to the previous implementation of 19 original BRFAs that have since been replaced by the 12 newly adopted BRFAs.


INTRODUCTION
The Hawaiian Islands bottomfish fishery typically targets a range of snappers and groupers that live between the depths of 100 and 400 meters, These and other deep-water snappers have been found to be associated with certain benthic features, such as high-relief hard-bottom slopes (Kelley, et al., 2006; Kelley and Ikehara, 2006; Kelley, 2000; and Yoklavich, et al., 2000). In 1998, following an assessment by the National Marine Fisheries Service that stocks of ehu and onaga were approaching a low “Spawning Potential Ratio” in the main Hawaiian Islands (MHI) (State of Hawaii, 2006), the State of Hawaii Department of Land and Natural Resources (DLNR) implemented Bottomfish Restricted Fishing Areas (BRFAs). The 19 BRFAs were an attempt by the State to eliminate fishing in certain geographic areas that might be high-quality bottomfish habitat to help ensure long-term sustainability of bottomfish stocks (State of Hawaii, 2006). Despite the implementation of the 19 BRFAs, in 2005, the Pacific Islands Fisheries Science Center determined that “overfishing” of bottomfish was occurring in the main Hawaiian Islands, and action was needed to reduce bottomfish fishing mortality by at least 24% (Moffitt, et al., 2006). In response, the DLNR proposed to redesign their system of BRFAs, reducing the overall number to 12, but increasing the size and quality of the areas closed to bottomfishing. The Western Pacific Fishery Management Council (WPFMC) also proposed two potential areas for closure; Penguin Bank and Middle Bank. In the remainder of this report, the general term Restricted Fishing Area (RFA) is used to refer to such management areas designated by the DLNR or WPFMC.
This analysis attempts to quantify the amount of high-quality bottomfish habitat within the proposed RFAs, to link reported bottomfish catch data with the favorable habitats within the proposed RFAs, and to provide a metric of potential fishing mortality reduction by assuming a direct relationship between favorable habitat and bottomfish catch.
Habitat Delineation
Delineation of potential habitat for commercial bottomfish was the first task. Fortunately, an almost complete set of multibeam and sidescan sonar data has been collected in the MHI over the last decade by the Pacific Islands Benthic Habitat Mapping Group, the University of Hawaii Undersea Research Laboratory (HURL), and the Hawaii Mapping Research Group. These data, most of which are in the public domain, include bathymetry and backscatter values for the areas of interest around the main Hawaiian Islands. These data were gridded into 20-m grid cells. Slope was derived as a first derivative of bathymetry values. Substrate hardness was derived from a selected set of backscatter values, with those areas falling outside a particular range of backscatter values being classified as nonhard.

2
The criteria used to delineate possible bottomfish habitats were depth, slope and hardness. The depth range chosen to be most appropriate for this analysis was 100 to 400 m, a modified definition of essential fish habitat (EFH) as defined for this species complex. Next, slopes greater than 20o were selected to further delimit the modified EFH areas into areas more likely to harbor targetable bottomfish. Then, areas that met a particular range of backscatter values (the particular values depend on the instrument used in the survey) were designated as hard bottom. Using geographic information system (GIS) software, digital maps of the main Hawaiian Islands were created that met each of these criteria. The areas in these three map products that intersected with each other, and thus met all three limiting criteria, were deemed to be “suitable” adult bottomfish habitat (see Figures 1 and 1a for a graphical example). Table 1 provides a measure of modified EFH, slope, hardness, and suitable habitat for each island area (the Maui numbers include Penguin Bank, Molokai, Kahoolawe, and Lanai). Table 1(a) provides a summary of (1) total modified EFH area; (2) total hard bottom area within the modified EFH; (3) total suitable habitat within the modified EFH; (4) total suitable habitat within the current State of Hawaii RFAs; (5) total suitable habitat within the proposed State of Hawaii RFAs; (6) total suitable habitat within the proposed WPFMC RFAs; (7) and the total suitable habitat within the combined proposed State and WPFMC RFAs.
We acknowledge that commercial bottomfish, especially uku, are found and extracted in other areas besides those that meet these selection criteria. However, submersible observations and fishing efforts by Dr. Chris Kelley, of HURL, indicate that these criteria are reasonable indicators of the presence of the species of interest for this analysis, and they correlate well with commercial fishing efforts (C. Kelley, pers. comm.). We are also cognizant that these habitats do not consider any life stages other than adult. Finally, we know that even some habitats that meet all of these selection criteria may still not be favorable due to a lack of adequate rugosity. For purposes of this analysis, we have assumed that the commercial bottomfish of interest prefer these designated habitats and that the commercially reported catch is taken predominately from such habitats, but this is ultimately a researchable hypothesis.
Fisherman Reported Catch Data and State Commercial Fisheries Statistical Reporting Zones
The State of Hawaii commercial fisherman catch reporting system provides self-
reported catch data from commercial bottomfishers operating in the Hawaiian Islands. Although the report forms used in this system have a number of fields that would provide very useful information for analysts and managers, few of the fields are typically filled out. The fields that are typically populated include license number, date, reporting area, gear, hours fished, vessel name, and number and pounds of fish caught. There is quite a bit of discussion regarding the accuracy of the reporting. For this analysis, I assumed that the fishermen reported their catch, species, and reporting zone accurately, although it is often difficult for a fisherman to precisely know in which reporting zone he is actually fishing because of the lack of definition and consistency in the reporting zone maps. Catch data were summed by species and zone.

3
State of Hawaii commercial fisheries statistical reporting zones used in this report are a modification of the digital reporting zones file that had been supplied by the Division of Aquatic Resources for use in a previous research project. This digital version of the paper charts showed errors and inconsistencies, and did not lend itself to meaningful analysis of the catch data. After consulting with the original mapmaker, and after receiving feedback on the common use of the charts, we modified the reporting zone charts to normalize the inshore reporting zones and create a consistent two-mile seaward boundary. Offshore zone boundaries were altered to align with inshore extents of the proposed areas. All other zones were unchanged. Having reporting zones with well-defined boundaries coincide with important habitat features (such as the 100-m contours) will enable future spatial analyses of bottomfish catch relative to habitat to provide better insight into the impacts of RFAs. In addition, catch reporting by latitude and longitude of sets would best facilitate a precise spatial analysis, but only if positions were accurately and precisely reported.
Habitat and Catch Analysis by Reporting Zone
Using GIS, delineated habitat areas were spatially joined to the modified reporting zones (see Figs. 2–5) to provide a metric of habitat area in each zone. Figure 6 provides a graphic of the percentage of each reporting zone that has potentially suitable habitat.
Commercial catch data were then spatially joined to the modified reporting zones to provide a graphic representation of the number of pounds of fish reported taken from each zone. Figures 7–11 display the 2005 reported catch in pounds in each zone for five important snappers: onaga (Etelis coruscans), opakapaka (Pristipomoides filamentosus), ehu (Etelis carbunculus), uku (Aprion virescens), and gindai (Pristipomoides zonatus), respectively.
Restricted Fishing Areas (RFAs)
The RFAs proposed by the State of Hawaii (SOH) and the WPFMC were digitally mapped and spatially intersected with maps of the modified EFH, slope, hardness, and suitable habitat to derive the area of suitable habitat contained within the RFAs as grouped by island area and Middle Bank. Tables 3 and 4 provide the areas in square kilometers of EFH, 20o slope, hard bottom, and suitable habitat for the existing RFAs and the proposed State RFAs by island (in this analysis, Penguin Bank, Molokai, Lanai, and Kahoolawe were considered part of Maui). Tables 5 and 6 provide the areas in square kilometers of EFH, 20o slope, hard bottom, and suitable habitat for proposed WPRMC RFAs and combined State of Hawaii and WPFMC RFAs. Table 7 provides numbers in square kilometers for EFH, slope, hardness, and suitable habitat divided into those RFA areas that fall within three miles of shore and those that are outside of the state three-mile limit.

4
Allocation of Catch to Restricted Fishing Areas
In an attempt to allocate reported catch to the proposed RFAs, catch was assumed to be directly correlated with amount of suitable habitat in each reporting zone. Suitable habitat areas in each zone were then spatially selected using the proposed RFA boundaries. This process allowed us to derive a percentage of habitat area, by reporting zone, within each RFA. Catch data in each zone were then multiplied by the percentage of that zone’s habitat contained within the RFA.
For example, the Penguin Bank coincident reporting zones contain ~ 15.4 km2 of suitable habitat. The proposed State of Hawaii RFA for Penguin Bank includes ~ 8.7 km2 of suitable habitat. Therefore, the combined catch from reporting zones 331 and 328 was multiplied by 0.563 (the ratio 7 km/15.4 km) to estimate the catch that occurs within the proposed RFA.
The results of this analysis are presented in Figures 12–23 as both catch in pounds
in each RFA by reporting zone and percentage of the total catch by reporting zone occurring within the respective RFAs. Tables 8, 9, and 10 provide estimates of the catch in pounds of onaga, opakapaka, and ehu within proposed RFAs based on habitat percentages, catch within the reporting zone and coincident zones (if the RFA spanned more than 1 zone), and catch within zones surrounding entire island areas and banks.

5
Table 1. Area (km2) of modified EFH, hard substrate, 20o slope, and suitable habitat within each island area.
Island Area
Modified EFH (100–400 m depth) Hard Substrate Slopes > 20 Degrees Suitable Habitat
km2 % of total km2 % of total km2
% of total km2
% of total
Middle Bank 85.1 1.5 39.1 3.7 12.1 2.7 7.5 3.1 Kaula Rock 28.9 0.5 10.7 1.0 19.7 4.4 7.5 3.1 Niihau 158.2 2.8 65.6 6.2 33.4 7.4 20.7 8.6 Kauai 227.5 4.0 45.6 4.3 58.6 13.0 21.0 8.7 Oahu 646.0 11.3 188.0 17.7 47.1 10.5 18.9 7.9 Maui Nui 2950.3 51.4 341.8 32.2 139.1 30.9 43.5 18.1 Hawaii 1640.7 28.6 369.7 34.9 139.4 31.0 120.9 50.4
5736.8 1060.6 449.3 240.1 Total km2 % of Total Modified EFH 100.0 18.5 7.8 4.2
Table 1(a). Summary of modified EFH, hardbottom, and suitable habitat statistics under various management schemes.
Habitat Designation/Management Scheme Total Area (km2) Percentage (%) Modified EFH 5736.8 100 of total modified EFH Hard bottom 1060.6 18.5 of total modified EFH Greater than 20o slope habitat 449.3 7.8 of total modified EFH Suitable habitat 240.1 4.2 of total modified EFH Suitable habitat in existing state BRFAs 22.1 9.2 of total suitable habitat Suitable habitat in proposed state BRFAs 26.9 11.2 of total suitable habitat Suitable habitat in Proposed WPFMC BRFAs 20.6 8.6 of total suitable habitat Suitable habitat in combined state and WPFMC BRFAs
42.4 17.7 of total suitable habitat

6
Table 2. Area (km2) of modified EFH, hard substrate, 20o slope, and suitable habitat within and outside the State of Hawaii three-mile limit.
Island Area Modified EFH Hard Substrate Slopes Suitable Habitat
Within Three-mile Limit
km2 % of total km2 % of total km2 % of total km2 % of total Middle Bank 0 0 0 0 0 0 0 0 Kaula Rock 12.7 0.5 5.3 0.9 10.1 3.2 4.4 2.3 Niihau 116.2 4.3 39.9 7.3 30.4 9.6 16.5 8.8 Kauai 170.8 6.3 36.5 6.7 56.7 17.8 18.8 9.9 Oahu 284.9 10.5 76.6 13.9 40.4 12.7 16.5 8.8 Maui Nui 1158.5 42.8 99.9 18.2 61.3 19.3 14.9 7.9 Hawaii 964.4 35.6 290.2 52.9 118.9 37.4 116.9 62.2 Total km2 2707.5 548.4 317.8 187.9 % of Total Modified EFH and Respective Habitats 47.2 51.7 70.7 78.3
Island Area Modified EFH Hard Substrate Slopes Suitable Habitat
Outside Three-mile Limit
km2 % of total km2 % of total km2 % of total km2 % of total Middle Bank 85.1 2.8 39.1 7.6 12.1 9.2 7.5 14.4 Kaula Rock 16.2 0.5 5.4 1.1 9.5 7.2 3.2 6.1 Niihau 41.9 1.4 25.7 5.0 3.0 2.3 4.2 8.1 Kauai 56.8 1.9 9.1 1.8 1.9 1.5 2.2 4.3 Oahu 361.1 11.9 111.5 21.8 6.7 5.1 2.4 4.7 Maui Nui 1791.8 59.2 241.8 47.2 77.7 59.1 28.5 54.7 Hawaii 676.3 22.3 79.5 15.5 20.5 15.6 4.1 7.8 Total km2 3029.3 512.2 131.6 52.2 % of Total Modified EFH and Respective Habitats 52.8 48.3 29.3 21.7

7
Table 3. Area (km2) of modified EFH, hard substrate, 20o slope, suitable habitat, and existing State of Hawaii RFAs, by island area.
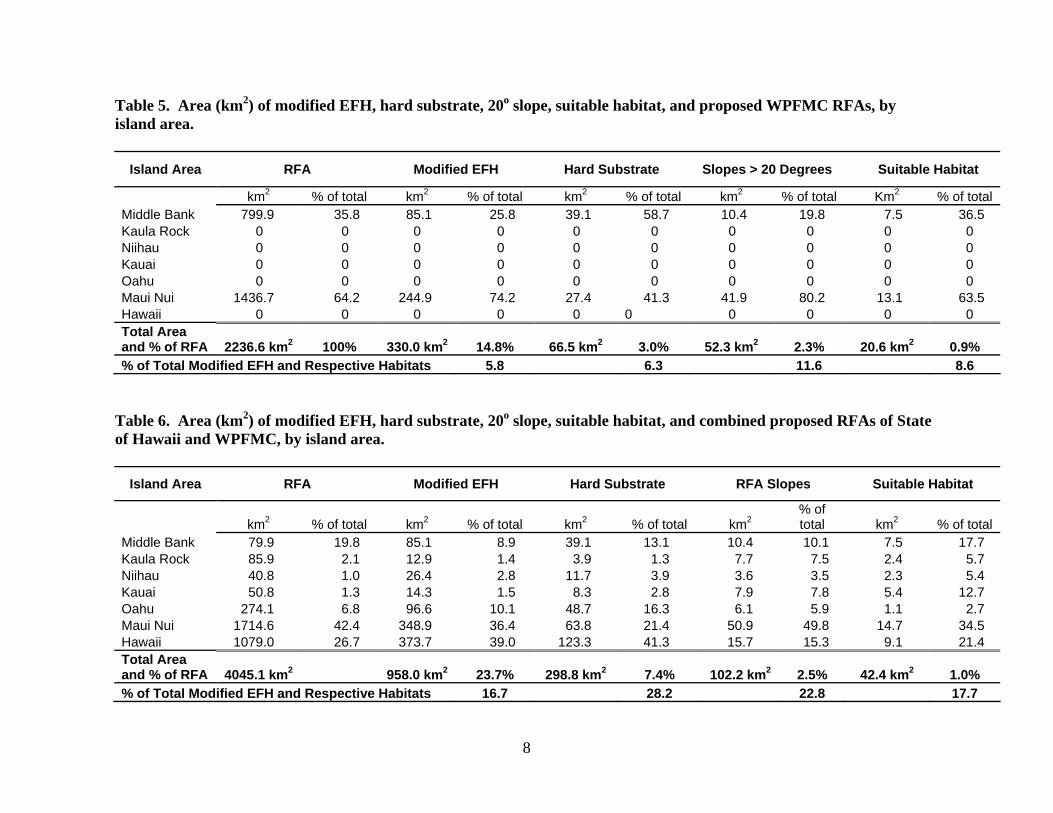
Island Area RFA Modified EFH Hard Substrate Slopes > 20 Degrees Suitable Habitat
km2 % of total km2 % of total km2 % of total km2 % of total km2 % of total Middle Bank 0 0 0 0 0 Kaula Rock 0 0 0 0 0 Niihau 50.2 6.0 25.4 6.1 11.9 14.6 2.7 6.7 2.0 9.1 Kauai 45.9 5.5 21.6 5.2 5.2 6.4 6.7 16.5 2.1 9.3 Oahu 58.7 7.0 31.4 7.5 8.9 11.0 4.8 11.8 2.4 10.7 Maui Nui 380.7 45.4 235.1 56.2 20.9 25.6 9.8 24.1 3.8 17.2 Hawaii 302.5 36.1 105.0 25.1 34.8 42.5 16.8 41.0 11.9 53.7 Total Area and % of RFA 838.0 km2 100% 418.6 km2 49.9% 81.9 km2 9.8% 40.9 km2 4.9% 22.1 km2 2.6% % of Total Modified EFH and Respective Habitats 7.3 7.7 9.1 9.2
Table 4. Area (km2) of modified EFH, hard substrate, 20o slope, suitable habitat, and proposed State of Hawaii RFAs, by island area.
Island Area RFA Modified EFH Hard Substrate Slopes > 20 Degrees Suitable Habitat
km2 % of total km2 % of total km2 % of total km2 % of total km2 % of total Middle Bank 0 0 0 0 0 0 0 0 0 0 Kaula Rock 85.9 4.1 12.9 1.8 3.9 1.6 7.7 11.2 2.6 8.9 Niihau 40.8 2.0 26.4 3.7 11.7 4.8 3.6 5.2 2.3 8.4 Kauai 50.8 2.5 14.3 2.0 7.9 3.2 7.9 11.6 5.3 19.7 Oahu 274.1 13.2 97.8 13.8 49.5 20.2 3.9 5.7 1.1 4.2 Maui Nui 541.3 26.1 185.2 26.1 48.2 19.7 29.6 43.3 6.7 25.0 Hawaii 1079.0 52.1 373.7 52.6 123.3 50.4 15.7 22.9 9.1 33.7 Total Area and % of RFA 2071.9 km2 100% 710.4 km2 34.3% 244.6 km2 11.8% 68.4 km2 3.3% 26.9 km2 1.3% % of Total Modified EFH and Respective Habitats 12.4 23.1 15.2 11.2
8
Table 5. Area (km2) of modified EFH, hard substrate, 20o slope, suitable habitat, and proposed WPFMC RFAs, by island area.
Island Area RFA Modified EFH Hard Substrate Slopes > 20 Degrees Suitable Habitat
km2 % of total km2 % of total km2 % of total km2 % of total Km2 % of total Middle Bank 799.9 35.8 85.1 25.8 39.1 58.7 10.4 19.8 7.5 36.5 Kaula Rock 0 0 0 0 0 0 0 0 0 0 Niihau 0 0 0 0 0 0 0 0 0 0 Kauai 0 0 0 0 0 0 0 0 0 0 Oahu 0 0 0 0 0 0 0 0 0 0 Maui Nui 1436.7 64.2 244.9 74.2 27.4 41.3 41.9 80.2 13.1 63.5 Hawaii 0 0 0 0 0 0 0 0 0 0 Total Area and % of RFA 2236.6 km2 100% 330.0 km2 14.8% 66.5 km2 3.0% 52.3 km2 2.3% 20.6 km2 0.9% % of Total Modified EFH and Respective Habitats 5.8 6.3 11.6 8.6
Table 6. Area (km2) of modified EFH, hard substrate, 20o slope, suitable habitat, and combined proposed RFAs of State of Hawaii and WPFMC, by island area.
Island Area RFA Modified EFH Hard Substrate RFA Slopes Suitable Habitat
km2 % of total km2 % of total km2 % of total km2 % of total km2 % of total
Middle Bank 79.9 19.8 85.1 8.9 39.1 13.1 10.4 10.1 7.5 17.7 Kaula Rock 85.9 2.1 12.9 1.4 3.9 1.3 7.7 7.5 2.4 5.7 Niihau 40.8 1.0 26.4 2.8 11.7 3.9 3.6 3.5 2.3 5.4 Kauai 50.8 1.3 14.3 1.5 8.3 2.8 7.9 7.8 5.4 12.7 Oahu 274.1 6.8 96.6 10.1 48.7 16.3 6.1 5.9 1.1 2.7 Maui Nui 1714.6 42.4 348.9 36.4 63.8 21.4 50.9 49.8 14.7 34.5 Hawaii 1079.0 26.7 373.7 39.0 123.3 41.3 15.7 15.3 9.1 21.4 Total Area and % of RFA 4045.1 km2 958.0 km2 23.7% 298.8 km2 7.4% 102.2 km2 2.5% 42.4 km2 1.0% % of Total Modified EFH and Respective Habitats 16.7 28.2 22.8 17.7

9
Table 7. Area (km2) of modified EFH, hard substrate, 20o slope, suitable habitat, and proposed State of Hawaii RFAs, by island area inside and outside the State of Hawaii three-mile limit.
Island Area Proposed RFA Modified EFH Hard Substrate Slopes Suitable Habitat
Within Three-mile Limit
km2 % of total Km2 % of total km2 % of total km2 % of total km2 % of total Middle Bank 0 0 0 0 0 0 0 0 0 0 Kaula Rock 15.3 0.7 2.0 0.29 0.6 0.24 1.6 2.36 0.5 1.91 Niihau 9.9 0.5 7.4 1.04 8.3 3.41 0.9 1.36 0.4 1.31 Kauai 50.7 2.4 14.3 2.01 7.9 3.23 7.9 11.62 5.3 19.64 Oahu 66.9 3.2 24.9 3.51 1.3 0.52 2.5 3.59 0.3 1.03 Maui Nui 158.9 7. 71.4 10.05 12.2 5.00 13.2 19.23 1.4 5.34 Hawaii 388.3 18.7 255.8 36.01 69.4 28.36 8.1 11.89 8.1 30.17 Total Area and % of RFA 690.3 km2 33.3% 375.9 km2 52.9% 99.7 km2 40.8% 34.2 km2 50.1% 16.0 km2 59.4% % of Total Modified EFH and Respective Habitats 6.6 9.4 7.6 6.7
Island Area Proposed RFA Modified EFH Hard Substrate Slopes Suitable Habitat
Outside Three-mile Limit
km2 % of total km2 % of total km2 % of total km2 % of total km2 % of total Middle Bank 0 0 0 0 0 0 0 0 0 0 Kaula Rock 70.6 3.4 10.9 1.54 33.6 1.37 6.1 8.88 1.9 7.02 Niihau 30.8 1. 19.0 2.68 33.6 1.37 2.6 3.86 1.9 7.12 Kauai 0.1 0 0 0 0 0 0 0 0 0 Oahu 207.1 10.0 72.8 10.25 48.2 19.71 1.4 2.11 0.9 3.19 Maui Nui 382.4 18.5 113.8 16.02 35.9 14.71 16.4 24.04 5.3 19.69 Hawaii 690.7 33.3 117.9 16.60 53.9 22.06 7.6 11.05 0.9 3.56 Total Area and % of RFA
1381.7 km2 66.7% 334.5 km2 47.1% 144.9 km2 59.2% 34.2 km2 49.9% 10.9 km2 40.6%
% of Total Modified EFH and Respective Habitats 5.8 13.7 7.6 4.6

10
Table 8. Catch of onaga (pounds) in 2005 within each RFA under various management schemes.
RFAs by Location
Onaga Catch within SOH RFA Allocated by % Suitable Habitat within RFA (lbs)
Onaga Catch within Reporting Zones Coincident to SOH RFAs
Irrespective of Habitat (lbs)
Onaga Catch within Reporting Zones Surrounding Islands or Banks
Irrespective of Habitat (lbs) Middle Bank 0 0 confidential Kaula (A) 34 327 327 Niihau (B) 111 209 3598 Kauai (C) 1321 2282 5642 W. Oahu (D) 97 1408 E. Oahu (E) 1687 2461 10,7901 Penguin Bank2 (F) 5614 13,713 18,7452 Molokai (G) 337 740 20663 W. Maui (H) 65 1485 N.E. Maui (J) 791 1163 21,2434 N. Hawaii (K) 971 1949 E. Hawaii (L) 3494 8209 S. Hawaii (M) 488 3772
21176
Totals 17,545 37,718 83,5875
Onaga Catch within WPFMC RFA allocated by % suitable
habitat within RFA (lbs)
Onaga Catch within Reporting Zones Coincident to WPFMC
RFAs irrespective of habitat (lbs)
Onaga Catch within Reporting Zones Surrounding Islands or Banks
irrespective of habitat (lbs) Middle Bank confidential confidential confidential Penguin Bank2 14,091 18,745 18,7452 Totals6 14,091 18,745 18,745
1 Reporting areas 420 and 429 not included in Oahu total, but in Penguin Bank total. 2 Penguin Bank total catch numbers for the “Catch within Reporting Zones Surrounding Islands or Banks” are identical because totals include the entire Penguin Bank reported catch and the total reported catch from all of the reporting grids surrounding Penguin Bank. Penguin Bank totals include reporting zones 328, 331, 332, 351, 420, 429, 452. 3 Molokai total catch from reporting areas 310, 311, 312, 313, 314, 332, 333. 4 Maui total catch includes reporting areas 300, 301, 302, 303, 304, 305, 306, 307, 308, 309, 320, 321, 322, 323, 324, 325, 326, 327. 5 Actual total is less than summative total to compensate for reporting area 332 being counted twice. Total reported 2005 Onaga catch for main Hawaiian Islands was 83950 pounds. Table 4 totals do not include catch reported outside of analysis zones. 6 Does not include Middle Bank due to confidentiality of data.

11
Table 9. Catch of opakapaka (pounds) in 2005 within each RFA under various management schemes.
RFAs by Location
Opakapaka Catch within SOH RFA Allocated by % Suitable
Habitat within RFA (lbs)
Opakapaka Catch within Reporting Zones Coincident to
SOH RFAs Irrespective of Habitat (lbs)
Opakapaka Catch within Reporting Zones Surrounding Islands or Banks
Irrespective of Habitat (lbs) Middle Bank 0 0 confidential Kaula (A) 326 1121 1121 Niihau (B) 118 222 4555 Kauai (C) 783 1187 5354 W. Oahu (D) 56 1754 E. Oahu (E) 869 938 10,6361 Penguin Bank2 (F) 4695 8340 12,4732 Molokai (G) 290 771 24793 W. Maui (H) 159 3622 N.E. Maui (J) 5074 7270 24,3414 N. Hawaii (K) 1786 2579 E. Hawaii (L) 2140 6820 S. Hawaii (M) 232 4552
19,265
Totals 16,528 39,176 80,2245
Opakapaka Catch within WPFMC RFA Allocated by % Suitable Habitat within RFA
(lbs)
Opakapaka Catch within Reporting Zones Coincident to WPFMC RFAs Irrespective of
Habitat (lbs)
Opakapaka Catch within Reporting Zones Surrounding Islands or Banks
Irrespective of Habitat (lbs) Middle Bank Confidential confidential confidential Penguin Bank2 8638 12,473 12,4732 Totals6 8638 12,473 12,473
1 Reporting areas 420 and 429 not included in Oahu total, but in Penguin Bank total. 2 Penguin Bank total catch numbers for the “Catch within Reporting Zones Surrounding Islands or Banks” are identical because totals include the entire Penguin Bank reported catch and the total reported catch from all of the reporting grids surrounding Penguin Bank. Penguin Bank totals include reporting zones 328, 331, 332, 351, 420, 429, 452. 3 Molokai total catch from reporting areas 310, 311, 312, 313, 314, 332, 333. 4 Maui total catch includes reporting areas 300, 301, 302, 303, 304, 305, 306, 307, 308, 309, 320, 321, 322, 323, 324, 325, 326, 327. 5 Actual total is less than summative total to compensate for reporting area 332 being counted twice and confidentiality of Middle Bank data. Total reported 2005 Paka catch for main Hawaiian Islands was 80997 pounds. Table 4 totals do not include catch reported outside of analysis zones. 6 Does not include Middle Bank due to confidentiality of data.

12
Table 10. Catch of ehu (pounds) in 2005 within each RFA under various management schemes.
RFAs by Location
Ehu Catch within SOH RFA Allocated by % Suitable Habitat within RFA (lbs)
Ehu Catch within Reporting Zones Coincident to SOH RFAs
Irrespective of Habitat (lbs)
Ehu Catch within Reporting Zones Surrounding Islands or Banks
Irrespective of Habitat (lbs) Middle Bank 0 0 confidential Kaula (A) 52 299 299 Niihau (B) 9 16 767 Kauai (C) 184 333 1799 W. Oahu (D) 35 840 E. Oahu (E) 228 485 42901 Penguin Bank2 (F) 1069 2601 36342 Molokai (G) 31 69 4043 W. Maui (H) 33 756 N.E. Maui (J) 56 85 52174 N. Hawaii (K) 223 555 E. Hawaii (L) 607 3894 S. Hawaii (M) 58 460
7914
Totals 2585 10393 243245
Ehu Catch within WPFMC RFA Allocated by % Suitable
Habitat within RFA (lbs)
Ehu Catch within Reporting Zones Coincident to WPFMC RFAs Irrespective of Habitat (lbs)
Ehu Catch within Reporting Zones Surrounding Islands or Banks
Irrespective of Habitat (lbs) Middle Bank confidential confidential confidential Penguin Bank2 2808 3634 36342 Totals6 2865 3750 3750
1 Reporting areas 420 and 429 not included in Oahu total, but in Penguin Bank total. 2 Penguin Bank total catch numbers for the “Catch within Reporting Zones Surrounding Islands or Banks” are identical because totals include the entire Penguin Bank reported catch and the total reported catch from all of the reporting grids surrounding Penguin Bank. Penguin Bank totals include reporting zones 328, 331, 332, 351, 420, 429, 452. 3 Molokai total catch from reporting areas 310, 311, 312, 313, 314, 332, 333. 4 Maui total catch includes reporting areas 300, 301, 302, 303, 304, 305, 306, 307, 308, 309, 320, 321, 322, 323, 324, 325, 326, 327. 5 Actual total is less than summative total to compensate for reporting area 332 being counted twice and confidentiality of Middle Bank catch data. Total reported 2005 Ehu catch for main Hawaiian Islands was 24594 pounds. Table 4 totals do not include catch reported outside of analysis zones. 6 Does not include Middle Bank due to confidentiality of data.
13
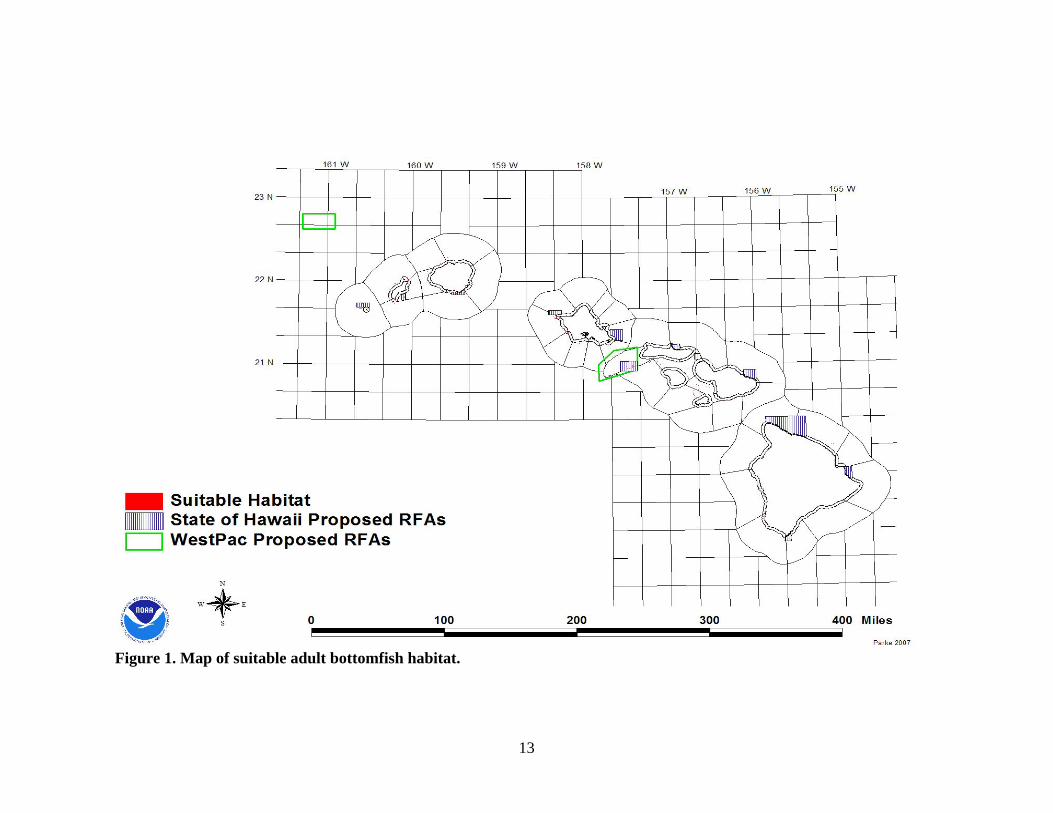
Figure 1. Map of suitable adult bottomfish habitat.
14
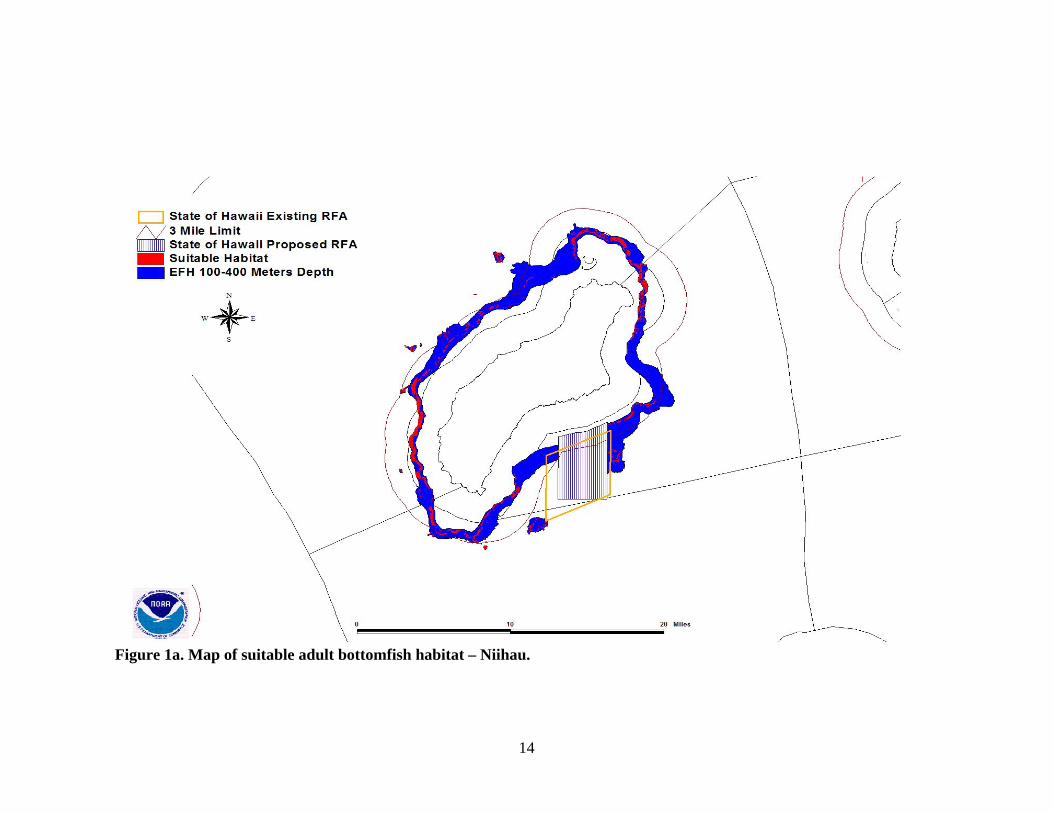
Figure 1a. Map of suitable adult bottomfish habitat – Niihau.

15
Figure 2. Map of State of Hawaii bottomfish habitat area (m2) by state reporting zone.

16
Figure 3. Map of bottomfish habitat area (m2) in Kauai, Niihau, Kaula, and Middle Bank by state reporting zone.

17
Figure 4. Map of bottomfish habitat area (m2) in Honolulu County and Maui County (including Penguin Bank) by state reporting zone.

18
Figure 5. Map of Big Island bottomfish habitat area (m2) by state reporting zone.

19
Figure 6. Map of percent suitable habitat by state reporting zone.

20
Figure 7. Map of 2005 onaga catch by reporting zone.

21
Figure 8. Map of 2005 opakapaka catch by reporting zone.

22
Figure 9. Map of 2005 ehu catch by reporting zone.

23
Figure 10. Map of 2005 uku catch by reporting zone.

24
Figure 11. Map of 2005 gindai catch by reporting zone.
25
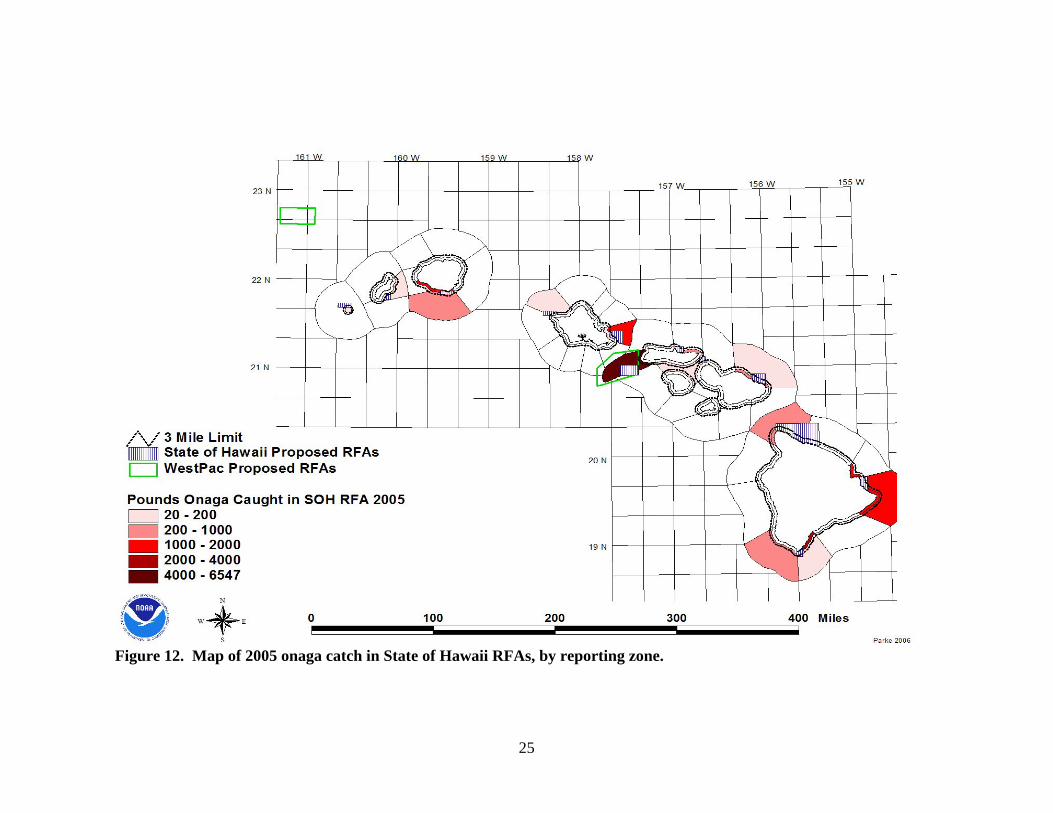
Figure 12. Map of 2005 onaga catch in State of Hawaii RFAs, by reporting zone.

26
Figure 13. Map of percent 2005 onaga catch in State of Hawaii RFAs, by reporting zone.

27
Figure 14. Map of 2005 onaga catch in WPFMC RFAs, by reporting zone.

28
Figure 15. Map of percent 2005 onaga catch in WPFMC RFAs, by reporting zone.

29
Figure 16. Map of 2005 opakapaka catch in State of Hawaii RFAs, by reporting zone.

30
Figure 17. Map of percent 2005 opakapaka catch in State of Hawaii RFAs, by reporting zone.

31
7 Figure 18. Map of 2005 opakapaka catch in WPFMC RFAs, by reporting area.

32
Figure 19. Map of percent 2005 opakapaka catch in WPFMC RFAs, by reporting zone.

33
Figure 20. Map of 2005 ehu catch in State of Hawaii RFAs, by reporting zone.

34
Figure 21. Map of percent 2005 ehu catch in State of Hawaii RFAs, by reporting zone.

35
Figure 22. Map of 2005 ehu catch in WPFMC RFAs, by reporting zone.

36
Figure 23. Map of percent 2005 ehu catch in WPFMC RFAs, by reporting zone.

37
REFERENCES Kelley, C., R. Moffitt, and J. R. Smith.
2006. Description of bottomfish essential fish habitat on four banks in the Northwestern Hawaiian Islands. Atoll Res. Bull. 543: 319-332.
Kelley, C., and W. Ikehara. 2006. The impacts of bottomfishing on Raita and West St. Rogatien Banks in the Northwestern Hawaiian Islands. Atoll Res. Bull. 543: 305-318.
Kelley, C. 2000. Characterizing deepwater habitats in Hawaii using multibeam sonar and submersible technologies. Abstract. 9th International Coral Reef Symposium, Bali,
Indonesia. October, 2000. p. 166. Moffitt, R., D. Kobayashi, and G. Dinardo.
2006. Status of the Hawaiian Bottomfish Stocks, 2004. Pacific Islands Fish. Sci. Cent., Admin. Rep. H-06-01, 45 p.
State of Hawaii.
2006. “Hawaii’s Bottomfish Fishery”. Land Board Briefing Paper. December 8, 2006. http://hawaii.gov/dlnr/dar/pubs/BLNR_Bottomfish.pdf
Yoklavich, M., H. G. Green, G. Calliet, D. Sullivan, R. Lea, and M. Love. 2000. Habitat associations of deep-water rockfishes in a submarine canyon: an example
of a natural refuge. Fish. Bull. 98:625–641.


Availability of NOAA Technical Memorandum NMFS Copies of this and other documents in the NOAA Technical Memorandum NMFS series issued by the Pacific Islands Fisheries Science Center are available online at the PIFSC Web site http://www.pifsc.noaa.gov in PDF format. In addition, this series and a wide range of other NOAA documents are available in various formats from the National Technical Information Service, 5285 Port Royal Road, Springfield, VA 22161, U.S.A. [Tel: (703)-605-6000]; URL: http://www.ntis.gov. A fee may be charged. Recent issues of NOAA Technical Memorandum NMFS–PIFSC are listed below: NOAA-TM-NMFS-PIFSC-5 The Hawaiian monk seal in the Northwestern Hawaiian Islands, 2002. T. C. JOHANOS and J. D. BAKER (comps. and eds.) (July 2005) 6 A sociocultural assessment of Filipino crew members working in the Hawaii-based longline fleet. S. D. ALLEN and A. GOUGH (October 2006) 7 Sea turtle and pelagic fish sensory biology: developing techniques to reduce sea turtle bycatch in longline fisheries. Y. SWIMMER and R. BRILL (December 2006) 8 Hawaii longline fishermen’s experiences with the observer program. S. STEWART and A. GOUGH (February 2007)
9 The Hawaiian monk seal in the Northwestern Hawaiian Islands, 2003. T. C. JOHANOS and J. D. BAKER (comps. and eds.) (March 2007)
10 Chemoreception in loggerhead sea turtles: an assessment of the feasibility of using chemical deterrents to prevent sea turtle interactions with longline fishing gear. A. SOUTHWOOD, B. HIGGINS, and Y. SWIMMER (July 2007)