linking mineral systems models to quantitative risk
TRANSCRIPT

Linking Mineral Systems Models to Quantitative Risk Analysis and
Decision-Making in Exploration
Oliver P. Kreuzer1,2 , Michael A. Etheridge1,3, Pietro Guj2, Maureen E. McMahon1,4,
and Darren J. Holden4
1GEMOC National Key Centre, Department of Earth and Planetary Sciences, Macquarie University, North Ryde, NSW 2109
2Centre for Exploration Targeting, The University of Western Australia and Curtin University of Technology, 35 Stirling Highway, Crawley, WA 6009, Australia
3Tectonex GeoConsultants Pty Ltd, 25 Darvall Street, Balmain, NSW 2041, Australia 4Geoinformatics Exploration Inc, 57 Havelock Street, West Perth, WA 6005, Australia
REVISED MANUSCRIPT – EDITOR VERSION II
Corresponding author: Oliver Kreuzer Centre for Exploration Targeting (M006) The University of Western Australia 35 Stirling Highway Crawley, WA 6009 Australia Phone: ++61.(0)8.6488.5807 Email: [email protected]

Abstract
This paper describes a methodology of translating mineral deposit models into
flexible probabilistic structures that are based on the critical processes of ore formation:
(1) extraction of ore components (fluids, metals and ligands) from crustal or mantle
sources or both; (2) fluid- or melt-assisted transport of ore components from source to
trap zones; (3) formation of trap zones (i.e., effective melt or fluid channels) that can
focus melt or fluid migration and accommodate large amounts of metal; and (4) operation
of the physicochemical processes that promote and sustain the deposition of metal from
fluids or melts passing through a particular trap site. Our approach integrates these
critical mineralization processes and conditions with concepts of probability theory,
decision analysis and financial modeling. The principal objective is to make mineral
deposit models amenable to financial risk and value analysis and suitable for
communication of value-creating geological concepts to financial stakeholders in
economic terms. A case study, based on an actual porphyry copper project, illustrates
how the probabilistic mineral systems model can generate a measure of the probability of
ore occurrence as an input for exploration decision trees and simulations to calculate the
expected value (EV) of an exploration project and the probability distribution of all
possible surrounding NPV values within a minimum and maximum range. Formulation
of the probabilistic model closely follows and combines principles of the well-established
petroleum and mineral systems approaches and makes use of Excel™-based model
templates with decision tree and simulation add-in software packages.
2

Introduction
Mineral exploration is an economic activity and as such is expected to provide an
acceptable return to those who invest in it (e.g., Singer and Kouda, 1999; Lord et al.,
2001). However, the probability of success in mineral exploration is generally so low and
the attendant geological uncertainty so high that it has always been very difficult for
investors and exploration managers to consistently manage programs to improve the
chance of financial success (e.g., Rose, 1987) in a cost-effective manner. Some recent
studies of the financial performance of the business of mineral exploration have
concluded that it is, at best, a break-even proposition but more likely a loss-making
investment (e.g., Eggert, 1993; Schodde, 2004; Leveille and Doggett, 2006). This study
examines ways to improve the ability to manage mineral exploration for better financial
performance.
Recent financial modeling indicated that there are three principal levers that control
the return on exploration investment at the portfolio and program levels (Etheridge et al.,
2006): (1) the number of projects effectively tested and turned over; (2) the average
expenditure per project (especially on those that failed); and (3) the average probability
of success across the portfolio. The industry attempts to improve the probability of
success by applying superior geoscience and allocating its investment dollars to the best
projects. A range of project ranking schemes are used to identify the most promising
projects. At the core of most schemes, and indeed much of our exploration judgment, are
mineral deposit models that describe the characteristics that are considered by the
author(s) of the model to represent key aspects of the type of mineral deposit that is
sought within a particular setting. Although generally referred to as either conceptual or
3

empirical, most of the widely used models include a variably complete array of process
factors for ore-formation, products of the mineralization process, characteristics of the
regional and local geology and structure, inferences about the tectonic setting, and grade
and tonnage data (e.g., Ludington et al., 1985; Cox and Singer, 1986; Hodgson, 1993;
Barton, 1993; Henley and Berger, 1993; Thompson, 1993; Hronsky, 2004; Sillitoe and
Thompson, 2006). Wyborn et al. (1994), Knox-Robinson and Wyborn (1997), McCuaig
and Hronsky (2000) and Hronsky (2004) advanced and promoted the mineral systems
concept with deposits being the focal points of much larger systems of energy and mass
flux. The implications of the mineral systems concept are that the parameters that control
size and location of deposits also are aspects of these large-scale systems, and that
mineral deposit models are of predictive value only if they incorporate the ore-forming
processes at all scales of the mineral system. This study adopts a mineral system
approach.
The concept of a mineral system is based closely on the petroleum systems model
(Magoon and Dow, 1994) that has unified exploration geoscience, project ranking and
portfolio investment management in the petroleum industry. A key factor in the broad
and rapid uptake of the petroleum systems model has been that it is amenable to practical
probabilistic risk and value analysis and to decision-making. The implementation of
quantitative methods of risk and decision analysis by petroleum companies since the late
1980s and early 1990s has brought greater objectivity and consistency to the valuation of
their project inventories. It has also led to adoption of economic yardsticks and risk and
reward definitions in selecting annual exploration portfolios and, ultimately, resulted in
4
5
improved exploration and financial success (e.g., Rose, 1999; McMaster, G., 2003 1;
Gouveia et al., 2003 2; Suslick and Schiozer, 2004). Applications of probabilistic
statistical methods have also been successful in the search for the lost submarine USS
Scorpion (Sontag and Drew, 1998), and in reducing the cost and increase the efficiency
of drug and medical device trials, increasing the effectiveness of ‘data mining’ techniques
and setting catch limits for fish (e.g., Malakoff, 1999).
The work described in this paper was part of a multidisciplinary, industry-
collaborative research project at Macquarie University, designed to investigate and
develop ways to improve management of risk, uncertainty and value creation in mineral
exploration. We offer a methodology that links our understanding of ore-forming
processes to flexible probabilistic decision-making tools that (1) promote systematic
estimation of geological uncertainty, (2) are amenable to probabilistic risk and value
analysis and (3) can convert our geological concepts to successful business models as is
routinely done in the petroleum industry. The overall aim of this paper is to demonstrate
that probabilistic mineral systems models are superior to the widely used mineral deposit
models in terms of flexibility, quantitative analysis of risk and uncertainty, and
communication of value-creating geological concepts to managers and financial
stakeholders. Formulation of the probabilistic mineral systems models closely followed
the principles of the petroleum (Magoon and Dow, 1994) and mineral (Wyborn et al.,
1994) systems approaches, and the approach to measuring exploration success by Lord et
al. (2001).
1 McMaster, G., 2003, Merging risk assessment and portfolio management: the search for value: www.gsspe.de/events/mcmaster/DistLectCirculate1.ppt 2 Gouveia, J., Rose, P., and Gingerich, J., 2003, The prospector myth – coming to terms with risk management in mineral exploration: www.pdac.ca/pdac/publications/papers/2003/Gingerich-Risk.pdf

Definition of the Terms Risk and Uncertainty
In the broader context of risk management the term risk generally combines the
likelihood of an event occurring and the consequences of the event should it occur. This
definition is embedded in various risk management standards and usually presented as
matrix of likelihood against consequences (e.g., Clemens and Pfitzer, 2006). We follow
the practice of the petroleum industry where exploration risk is defined as the probability
of a project delivering a negative financial consequence. In this context risk may be
defined as the probability of failure and is equal to one minus the probability of success
(e.g., Singer and Kouda, 1999; Murtha, 2000).
Uncertainty is a measure of our inability to assign a single value to a possible event
and defined as the variability of possible events around their mean (expected) value. The
quantification of uncertainty is the difference between the true value of a natural outcome
and an estimate of its value. Biases occur when values are systematically under- or
overestimated (e.g., Bárdossy and Fodor, 2001).
Previous Approaches to Geological Process Modeling
The petroleum systems approach
A petroleum system includes all elements and processes that are necessary to generate
and store hydrocarbons. It is a natural system that exists wherever the distribution of
petroleum source, reservoir, seal and overburden rocks was linked in space and time with
trap formation and the generation, migration and accumulation of hydrocarbons (Magoon

and Dow, 1994). The stratigraphic, geographic and temporal extent of petroleum systems
is displayed in petroleum system maps, schematic cross-sections and burial history
diagrams, whereas the components of petroleum systems and their critical timing
relationships are recorded in petroleum events charts (e.g., Smith 1994; Demirel, 2004;
Sarmiento and Rangel, 2004). Given that the petroleum systems model is process-based
and considers all process components that are necessary to form a commercial deposit, it
is now widely used to manage geological uncertainty and exploration risk by (1)
determining the spatial and temporal distribution of the essential elements and processes,
(2) gaining an understanding of where the petroleum came from and how it migrated, (3)
predicting the places where petroleum is most likely present, and (4) estimating the
quantity of the petroleum that was generated and trapped (e.g., Magoon and Dow, 1994;
Smith, 1994; Newendorp and Schuyler 2000; Suslick and Schiozer, 2004).
The mineral systems approach
The mineral systems approach (e.g., Wyborn et al., 1994; Knox-Robinson and
Wyborn, 1997; Hagemann and Cassidy, 2000; Huston, 2000; Huston et al., 2004)
promoted by Geoscience Australia is essentially an adaptation of the petroleum systems
approach of Magoon and Dow (1994). Although mineral systems are generally perceived
as being more diverse and complex than petroleum systems, the critical parameters of ore
formation can be reduced to (1) a source of energy that drives the system, (2) sources of
fluids, metals and ligands, (3) pathways along which fluids can migrate to trap zones, (4)
trap zones (i.e., narrow, effective pathways) along which fluid flow becomes focused and
fluid composition is modified, and (5) outflow zones for discharge of residual fluids (see
7

fig. 3 in Knox-Robinson and Wyborn, 1997). Ore formation is precluded where a
particular mineral system lacks one or more of these essential components. Being
process-based, the application of the mineral systems approach is neither restricted to a
particular geological setting nor limited to a specific mineral deposit type; indeed,
multiple mineral deposit types can be realized and tested within a single mineral system
(e.g., Wyborn et al., 1994; Knox-Robinson and Wyborn, 1997; Hagemann and Cassidy,
2000). Applied to mineral exploration, the mineral systems approach requires
identification at various scales of the critical ore-forming processes and mappable
features that characterize a particular mineral system (e.g., Wyborn et al., 1994).
The probabilistic approach
The probabilistic approach to process modeling of Lord et al. (2001) requires the
following actions: (1) formulation of an underlying geological process model; (2)
identification of the independent, critical success factors (P1 = ore component sources, P2
= fluid conduits, P3 = trap sites, and P4 = physico-chemical processes at the trap sites);
(3) assignment of probabilities to each factor; and (4) application of the multiplication
rule (e.g., Megill, 1988) to obtain an overall probability of success (i.e., that potentially
economic mineralization is present at the location of interest) (PMineralisation = P1 × P2 ×
P3 × P4).
By integrating process-based mineral deposit modeling and aspects of probability
theory, Lord et al. (2001) created a powerful tool for quantitative ranking and evaluation
of exploration projects and assessment of exploration strategy and performance. Owing to
8

the numerical output, the probabilistic approach of Lord et al (2001) promotes
communication of geological uncertainties and technical and financial risk.
New Probabilistic Mineral Systems Models
Background information on the software and quantitative methods used in this paper
is given in Appendix 1, including the basic concepts of probability theory, Bayesian
(conditional) probability and the expected value (EV) concept. A schematic overview of
the approach is given in Figure 1.
Modeling step 1: Formulation of mineral systems models
The first step in the modeling approach is to list the critical processes that must
operate for ore deposition to occur within a particular area (cf. Wyborn et al., 1994; Lord
et al., 2001; Penney et al., 2004). These are (1) extraction of ore components such as
fluids, metals and ligands from crustal or mantle sources, (2) fluid- or melt-assisted
transport of ore components from source regions to trap zones (i.e., effective melt, fluid
or vapor channels), (3) formation of trap zones that are sufficiently wide to accommodate
large amounts of metal but narrow enough to efficiently focus melt or fluid migration
during protracted or brief and repetitive events of energy an mass flux, and (4) operation
of the physicochemical processes that promote and sustain the deposition of metal from
melts, fluids or vapor passing through a trap zone. We propose that the critical processes
are similar for most, if not all, mineral deposit types. The key to the inherent natural
diversity of mineral deposits lies in the diversity of the critical subprocesses, essential
elements and four-dimensional extent. These factors can be extremely variable, even for
9

adjacent mineral deposits of similar style (e.g., sulfide-rich and sulfide-poor lode-gold
deposits, Kolar goldfield, India: Mishra and Panigrahi, 1998).
Appendix 2 gives examples of mineral system models and model templates for lode-
gold, porphyry-copper, nickel-sulfide and stratiform lead-zinc deposits that are based on
our assessment of the current state of knowledge. These models were used to develop and
test the probabilistic mineral systems model presented in this paper and serve as
examples of how to assign critical processes and subprocesses of ore formation to the
model template.
Modeling step 2: Design of mineral systems model templates
The model sheets in Appendix 2 are indented as frameworks for the systematic
compilation and development of a comprehensive knowledge base of the factors that are
critical in and lead to the formation of the targeted mineral deposit style within a
particular area of interest. The model sheets consist of five parts: (1) the essential
elements of the mineral system (model part 1); (2) the critical processes (model part 2A)
and subprocesses (model part 2B) that must operate for ore deposition to occur within a
particular area; (3) the four-dimensional extent of the ore-forming system (model part 3);
(4) post-ore processes (model part 4) such as outflow of spent fluids from trap zones,
upgrading of mineral systems by supergene or metamorphic processes, and preservation
of mineral systems through time; and (5) decision-making (model part 5) (i.e., to drill
test, seek further information via an additional targeting technique, or abandon a project).
Modeling step 3: Transfer of model templates into analysis software
10

The mineral systems models were programmed into Excel™ spreadsheets for use
with standard, add-in risk analysis software such as @RISK™ and PrecisionTree™ by
Palisade Corporation (see www.palisade.com for further information), Crystal Ball™ by
Oracle Corporation (www.crystalball.com) and RiskSim™ and TreePlan™ by Decision
Toolworks (www.decisiontoolworks.com).
Modeling step 4: Assignment of probabilities to processes of ore formation
In the spreadsheet of Figure 2, the user (1) determines whether or not particular
subprocesses operated within a particular area, and (2) assigns either single probabilistic
values (on a scale from 0.0 to 1.0) or ranges of likely values, based on geological
evidence for the subprocess having operated at the location of interest. Where a range of
probabilities is assigned, the values are assigned a uniform distribution that is
characterized by the extremes of the range (i.e., minimum and maximum) and has
constant probability (i.e., all values of the distribution are equally probable). This
distribution is sampled randomly during subsequent simulations of the system (modeling
step 7). To standardize subjective probability estimates we recommend the use of
calibrated scales, such as the Sherman-Kent scale (e.g., Jones and Hillis, 2003; Table 1).
Examples of assigning probabilities are described in a case study below.
The probability of a critical process (e.g., P1 to P4 in Fig. 2) having operated is the
product of the probabilities assigned to the each critical subprocess. By multiplying P1,
P2, P3 and P4, a probability of occurrence of potentially economic mineralization
(PMineralization) can be obtained for a particular location (Lord et al., 2001). In this analysis,
the probability of occurrence of the critical processes of ore formation at a particular
11

location is independent of historic exploration or mining or other estimates of mineral
deposit occurrence. Hence, we argue that a 100 per cent fit to the probabilistic mineral
systems model (i.e., PMineralisation = 1.0) is an indication for a mineral deposit definitely
having formed at a particular location. To obtain a PMineralisation of 1.0, the user would
have to assign probabilities of 1.0 to all critical subprocess, and thus would have to have
unambiguous evidence for all subprocesses, including those that are linked directly to the
scale and intensity of metal deposition (e.g., P3B and P4B in Fig. 2), having occurred. If,
on the other hand, we assign a probability of 0.0 to one or more of the critical
subprocesses, the chance of ore occurrence becomes zero. By assigning a probability of
0.5, we acknowledge that it is equally likely that a subprocess did or did not operate
within a particular project area.
A particular mineral system can only exist where the distribution of its essential
elements was linked in space and time with the critical processes of ore formation.
Identification of this spatial and temporal link and determination of the critical processes
of ore formation are the keys to (1) exploration targeting, which concentrates on areas
where this link can be demonstrated, and (2) data compilation, which focuses on
collecting evidence for the critical processes and subprocesses of ore formation having
occurred within these areas of interest. This approach differs from the traditional mineral
deposit models, which exploration geologists use as guidelines while focusing on
evidence for mineralization processes to discover ore (e.g., McCuaig and Hronsky, 2000).
The probabilistic mineral systems models help to keep track of and measure the degree of
fit of the model elements to specific cases.
12

Modeling step 5: Definition of exploration cost and value distributions
All monetary values in our probabilistic decision model are linked to cost and value
inputs or their probability distribution functions (Fig. 1) that were either estimated or
fitted to historical datasets using risk analysis software. These distributions are contained
in an assumptions worksheet.
The possible costs of exploration (i.e., surveying, drill testing and resource
delineation) and feasibility are defined by the parameters of triangular distributions
(minimum, most likely, maximum) that are user inputs and adjustable to suit particular
company estimates or cost structures.
Three databases of the value of mineral deposits were used in the probabilistic
decision model (Fig. 1, Table 2). The datasets of the Metals Economics Group include
acquisition values of all gold and base metal (n = 343) projects for which transactions
were recorded between 1993 and 2003. By having removed from this database any
projects that had commenced mining, we obtained a subset of values for projects at
exploration stages ranging from B to E of the exploration process as defined by Lord et
al. (2001) (Table 3). For comparability all transactions were grossed up to full project
value and converted to Australian dollars at 2004 values. The dataset of Schodde (2004)
Australian gold discoveries (n = 59) between 1985 and 2002 is a record of the net present
value (NPV) of these discoveries at the time of the decision to mine. These NPVs,
expressed at 2003 Australian dollar values, were calculated using generalized project
capital and operating cost estimates, a gold price of Australian dollars 550 per ounce and
the tax rules of 2003. The dataset of Leveille and Doggett (2006) of global copper
projects (n = 65) discovered and developed between 1992 and 2004 includes calculations
13

of their NPVs in US dollars at 2004 values. The underlying cash flows are based on
average metal prices over the period 1992 to 2004, an effective tax rate of 30 per cent and
are discounted at a rate of 8 per cent. These three datasets are fitted well by the lognormal
distribution and this is consistent with the commonly lognormal distribution of mineral
deposit grade and tonnage data (e.g., Folinsbee, 1977; Singer, 1993; Rose, 1999). A good
fit was confirmed by goodness-of-fit tests such as Chi-Square, Anderson-Darling and
Kolmogorov-Smirnov, using risk analysis software.
Modeling step 6: Integration of the mineral systems model templates with an exploration
decision tree
Decision trees are widely used for structuring, analyzing and quantifying investment
decisions in sequential chronological order and calculating their EVs in terms of the
probability of occurrence and monetary reward of all possible outcomes (e.g., Newendorp
and Schuyler, 2000; Clemen and Reilly, 2001). In step 6 of our modeling approach, the
spreadsheet-based mineral systems models are used as inputs in a decision tree (Figs. 1
and 3) that follows the conventions outlined in Newendorp and Schuyler (2000), Murtha
(2000) and Clemen and Reilly (2001) and incorporates Monte Carlo simulation
capability.
The tree in Figure 3 is intended to calculate the EV of exploration projects that are at
stage B of the exploration process as defined by Lord et al. (2001); that is the ground has
been acquired, a geological knowledge base has been established and drillable targets
have been or are being identified. The underlying maximum time frame is the number of
years required for successful completion of exploration stages B to D (Lord et al., 2001;
14
Table 3), concluding with the delineation of a potentially payable resource that can either
be mined or sold.
The exploration decision tree offers three main decision paths: (1) drill, (2) apply
additional targeting technique, or (3) terminate. Decision path 1 (Fig. 3) is based on the
scenario where a company has identified a target with a PMineralisation value (as described
in modeling step 4) that is at a level justifying immediate drill testing. Decision path 2
(Fig. 3) is tailored to the situation where the PMineralisation of a target is below the level
required to justify immediate drilling, but where the application of an additional
geochemical or geophysical targeting method is expected to result in a revised and
improved PMineralisation that would warrant drill testing. This posterior or updated
PMineralisation is calculated using Bayes’ rule of conditional probability (Appendix 1).
Decision path 3 (Fig. 3) reflects the scenario where, in spite of skillful exploration, no
drillable targets are defined, and where the application of further targeting techniques is
perceived as futile.
Pay-off values, computed for each decision path in the decision tree, represent the
EVs of the three exploration strategies outlined above. A positive EV indicates that the
corresponding exploration strategy is likely to be successful whereas a negative EV
justifies rejecting the underlying decision alternative.
Modeling step 7: Monte Carlo simulation
The final step in the modeling approach is a Monte Carlo simulation (e.g., Morin and
Ficarazzo, 2006) of the exploration decision tree where input value probability
distributions (i.e., uniform: PMineralisation; triangular: costs of exploration, sale prices;
15

lognormal: value of mineral deposits) that describe the model inputs are sampled at
random up to several tens of thousands of times. Each simulation step represents an
individual possible outcome and is aggregated into the final result: a statistical
distribution of possible NPVs of the modeled project that surround their mean (“base
case”) EV (Fig. 1).
A Porphyry Copper Case Study
This case study is a real world application of the probabilistic mineral systems
modeling approach to an undisclosed porphyry copper-gold project. To come up with a
structure for calculating the EV of this project, the project owner modified the
exploration decision tree. Monetary values in this case study are in nominal US dollars
and results are based solely on the assessment of the geological risk factors.
Prospect characteristics
The prospect is located within a metallogenic province comprising rock assemblages
and mineral deposits that are typical for magmatic island-arc environments. Three
economically mineable porphyry copper-gold systems containing between 250 and 1000
million metric tons of ore at grades ranging from 0.3 to 0.6 per cent copper and 0.3 to 0.8
g/t gold have previously been discovered within this province. The prospect is situated
along strike of and mid-way (i.e., 40 km from each) between two of these significant
porphyry copper-gold deposits. The province also contains numerous copper-gold skarn
occurrences but they are commonly much smaller and of inferior value compared to the
16
porphyry copper-gold deposits. In addition, the copper-gold skarn occurrences can cause
false positives that can set porphyry copper-gold exploration efforts on the wrong track.
The prospect being valued in this case study is defined by copper (>200 ppm), gold
(>1000 ppb) and molybdenum (>10 ppm) geochemical anomalies in soils over an area of
approximately 800 by 600 m. The anomalous molybdenum values are an important
predictor of the style of mineralization likely to be present within the project area given
that porphyry copper-gold deposits within the belt are molybdenite-bearing, whereas the
copper-gold skarns are not. The copper, gold and molybdenum anomalies at the prospect
are flanked by zones of elevated lead and zinc values. This metal zonation pattern (Cu,
Au, Mo Pb, Zn) is typical for intrusion-related deposits (e.g., Lang and Baker, 2001).
The sporadic outcrops within the project area mainly are altered volcanic rocks that
were deposited at the time of the porphyry copper-gold mineralization and contain
elevated potassium with respect to average values in other volcanic rocks in this
province. Intrusive rocks within, or adjacent to, the project area include (1) an
approximately 5 m-wide, porphyritic granodiorite dike that cuts the volcanic rocks within
the project area, (2) a porphyritic intrusion that is exposed approximately 0.3 km to the
east of the soil geochemical anomaly, and (3) a large, composite granitic to granodioritic
body that likely solidified at the time of porphyry copper-gold mineralization and crops
out approximately 0.8 km west of the boundary of the project area. Two fault zones,
inferred from geophysical images, cut the granodioritic and volcanic rocks within the
project area. A detailed aeromagnetic survey recorded an elliptical positive anomaly at
the margins of the copper, gold and molybdenum geochemical soil anomalies. An
inverted geophysical profile implies the presence of an ellipsoidal body approximately
17

100 m below the current surface. Taken as a whole, the geological, geochemical and
geophysical data suggest that porphyry copper-gold mineralization may be present
beneath the volcanic rocks at the prospect.
Rationale for the assignment of probabilities
The project area is located within a proven porphyry copper-gold province, close to
economic porphyry systems, and next to a composite intrusion that was emplaced at the
time of porphyry copper-gold mineralization. Hence, it is probable to highly probable that
metals, ligands and fluids were extracted from appropriate sources (Table 1). Based on
this prediction, a range of probability values from 0.90 to 0.98 (mean = 0.94) was
assigned to P1 (Fig. 2).
The estimated probability of ore components having migrated to a trap zone (P2) is
0.56 (Fig. 2). This number is the product of the probability of emplacement of a finger-,
sill-, or dike-like intrusion (P2A = 0.70; range: 0.60 to 0.80) and volatile exsolution (P2B =
0.80; range: 0.70 to 0.90). Evidence for P2 includes (1) the presence of an elliptical
geophysical anomaly that may be the signature of an intrusion underneath the volcanic
rocks within the project area, (2) the presence of a porphyritic, dike-like intrusion, and (3)
the presence of structures that are interpreted as having been active at the time of and
exhibit a control on mineralisation.
A value of 0.49 was computed for the probability of trap formation (P3 in Fig. 2). This
value is the product of the probability of localized dilational deformation and creation of
permeability focused on the target intrusion (P3A) and the probability of the extent and
intensity of the detected alteration assemblage being similar to that of economic porphyry
18
deposits elsewhere in the region (P3B). The value of P3A was estimated in the range from
0.60 to 0.80 (mean = 0.70), given the presence of composite igneous bodies and
transcurrent fault zones within and adjacent to the project area, and thus a good chance
that localized dilational deformation and creation of permeability were developed. The
value of P3B was estimated in the range from 0.60 to 0.80 (mean = 0.70), given the
presence of a large zone of intense potassium alteration similar to that of known
economic porphyry copper-gold deposits in the area.
A value of 0.25 was calculated for the probability of metal deposition (P4 in Fig. 2).
This is the product of the probability that appropriate physico-chemical conditions for
mineralization existed (P4A), and the probability that the size of the trap and intensity of
mineralization were sufficient to accumulate significant amounts of metal (P4B). Elevated
copper, gold, molybdenum, lead and zinc values at the prospect suggest that appropriate
physico-chemical conditions for causing metal deposition existed within the project area.
Hence, a range of probabilities from 0.4 to 0.6 (mean = 0.50) was assigned to P4A. The
value of P4B was also estimated in the range from 0.4 to 0.6 (mean = 0.50), given that the
zones of anomalous copper, gold, molybdenum, lead and zinc in soils are large (800 ×
600 m) and the coincident geophysical response is of a magnitude similar to that of the
known economic porphyry copper-gold deposits in the belt. Therefore, the subjective
probability of occurrence of a potentially economic porphyry copper-gold deposit at the
prospect is:
PMineralisation = P1 × (P2A × P2B) × (P3A × P3B) × (P4A × P4B) (4)
= 0.94 × (0.70 × 0.80) × (0.70 × 0.70) × (0.50 × 0.50)
= 0.0645 or 6.45%
19

Even in the case of an initial ore-grade drill intersection the project would still have to
overcome two major hurdles prior to any decision to mine: a successful resource
delineation programme and feasibility study. The conditional probability of delineating
adequate resources given an initial ore-grade intersection is about 0.30 (range: 0.10 to
0.50); that of concluding a successful feasibility study is about 0.85 (range: 0.75 to 0.95)
(P. Guj, unpublished data). When PMineralisation is multiplied by 0.30 and 0.85 the product
is 0.016 (1.6%). This number may seem small but it is significantly higher than or falls
within the range of typical industry success (defined as the discovery of a mineral deposit
that becomes a future mine) rates of 0.0003 to 0.005 for greenfields and 0.01 to 0.05 for
brownfields exploration (e.g., Kreuzer, 2007).
Exploration cost and value distributions
A first-pass program of 4 drill holes to depths of 300 m has been proposed to test this
porphyry copper-gold target, which has never been drilled before. Given the uncertainty
about the size and geometry of the target the exploration costs were estimated as the
means of triangular distributions; the estimated minima and maxima are given in
brackets. The expected (mean) cost of this program was estimated at $0.3 million
(minimum cost: $0.1 million; maximum cost: $0.55 million). However, in the event that
the drilling would intersect potentially economic porphyry copper-gold mineralization,
additional, grid-based resource delineation drilling would have to follow. The most likely
cost of this program is $4 million (minimum cost: $2 million; maximum cost: $5.5
million). If resource delineation is successful, the costs of a feasibility study are expected
20

to add a further $10 million (minimum cost: $6.5 million; maximum cost: $14 million) to
the exploration expenditure.
The possible value of the target distributes lognormally with an approximate mean of
$248.2 million and standard deviation of $603.3 million. These parameters were obtained
from fitting a lognormal distribution to the values of 33 porphyry copper deposits in the
Metals Economic Group transactions database (Table 2). A minimum target value of $50
million was selected to reflect corporate financial objectives, the remote location of the
project and other logistical considerations. The implication of this minimum target value
is that a potential discovery with a value below $50 million would be sold rather than
developed. Given that the largest known porphyry copper deposit in the region has an
estimated value of approximately $1 billion, the lognormal distribution was truncated at
this maximum value. As a consequence of the removal of all values less than $50 million
and greater $1 billion a Monte Carlo simulation of this truncated distribution generates a
mean ($143.457 million) and standard deviation ($193.448 million) that are somewhat
lower than the respective values of the whole dataset.
As illustrated in Figure 4, the project owner has the option of terminating or selling
the project given unsatisfactory results. Project termination in the absence of an initial
ore-grade intersection is most likely to erode the value of the project to zero, whereas the
options to sell the project are likely to create cashflows. For the purpose of this exercise
these are estimated at $9.67 million (in the range from $5 to $14 million) given an initial
ore-grade intersection, and $18.33 million (in the range from $5 to $30 million) and
$8.00 million (in the range from $3 to $15 million) given that a resource delineation
21

programme (e.g., deposit too small after resource delineation) or feasibility study (e.g.,
deposit subeconomic after feasibility) do not meet corporate targets.
Expected value (EV) calculation
The EV (Appendix 1) of this porphyry copper-gold project was calculated using a
decision tree (Fig. 4) constructed to suit the specific parameters of the project and
illustrate uncertainties about the project geology and exploration expenditure linked to
the decision by the company to drill the target. A Monte Carlo simulation produced a
positively skewed distribution of possible project NPVs with a mean (expected) NPV of
$2.628 million and standard deviation of $3.544 million. The minimum NPV of the
project is -$0.122 million and linked to failure at the feasibility stage, whereas the
maximum NPV is $27.201 million and linked to the possibility of a significant discovery.
Based on the existing exploration results and supported by this analysis, the project was
considered to offer acceptable risk-reward trade-offs and scheduled for initial drill
testing.
Discussion
Rationale and scope of the model and targeted user group
The approach presented in this paper illustrates how to (1) translate mineral deposit
models into flexible, probabilistic mineral systems models that are based on the critical
processes of ore formation, (2) estimate and handle probability distribution functions of
exploration costs and mineral deposit values, and (3) integrate these with basic risk
22

analysis tools for calculating not only the EV of a particular project NPV, but also the
probability distribution of all its possible NPV values surrounding it. This approach is
more simplistic than those used by some major mineral resources companies (N.
Hayward, BHP Billiton Ltd, pers. commun., 2006) but is highly appropriate for junior or
intermediate companies that want to be more consistent and objective in evaluating and
ranking their projects but have limited or no access to appropriate databases and/or
specialists to develop, maintain and run sophisticated geological and financial risk and
value models.
Problems in assigning subjective probabilities
The companies with the best mineral deposit models and systems for controlling
heuristic errors and biases (cf. McCuaig et al., 2007) have a competitive advantage when
it comes to the reliability of their probability estimates.
Subjective probabilities assigned to geological risk factors are commonly over-
optimistic or too inconsistent between projects (e.g., Rose, 1999) and biased given that
geoscientists have to rely upon their previous experience when interpreting incomplete or
inferior geoscientific datasets (e.g., Bond et al., 2007). Greater consistency and accuracy
may be achieved by adopting disciplined interviewing techniques such as the Delphi
technique (e.g., Rowe and Wright, 1999) and utilizing calibrated scales such as the
Sherman-Kent scale (e.g., Jones and Hillis, 2003; Table 1). However, subjective
probabilities should ideally be corroborated by objective frequency distributions of the
outcomes of geological model studies of mineral deposits and actual mineral exploration
projects.
23

More objective probabilities can also be derived from geological and spatial data
analysis by methods such as logistic regression, weights of evidence, or artificial neural
networks (e.g., Barnett and Williams, 2006). There is significant scope for exploring
ways of linking mineral systems models to the Geographic Information System (GIS) and
numerical modeling environments. Such an approach would generate more realistic data
input for mineral systems models and allow testing multiple mineral deposit models and
interpretations of the geology, structure and geochemical and geophysical surveys of a
particular project area.
Problems in assigning probabilities when no information is available
When operating under conditions of ignorance an analyst can only apply the same
probability to mutually exclusive and collectively exhaustive possible events (Laplace
criterion: e.g., Taha, 1976). Such an approach was adopted both in our model, and in the
probabilistic approach of Lord et al. (2001), where a value of P = 0.5 indicates that there
is an equal chance that a critical success factor did or did not operate when no
information is available. However, it could be argued that we are never completely
ignorant and that, given the low rate of occurrence of mineral deposits in individual
exploration target areas, unfavorable evidence for critical subprocesses having occurred
is statistically more likely to be present than favorable evidence. In other words, if we
assume conditions of true ignorance, randomly choose a place on earth with no prior
geological knowledge and assign P = 0.5 to all unknown risk factors (i.e., the critical sub-
processes) in Figure 2 the resulting PMineralization would be 0.008 or 0.8%. This figure is
significantly greater than the chance of obtaining an initial ore-grade intersection for most
24

early-stage projects generated by skilled exploration teams (N. Hayward, BHP Billiton
Ltd, pers. commun., 2006). However, if we were to assign probabilities of less than 0.5 to
risk factors in an area generated by a skilled exploration team but characterized by
limited data (e.g., a part of a proven metallogenic province that is under cover) we would
penalize this area compared to others where data are readily available. A serious
consequence of this approach is that areas with high potential endowment but limited
data may be rejected (cf. Hronsky and Groves, 2008).
Assumption of conditional independency
For computational simplicity the probabilistic approach of Lord et al. (2001) assumed
that the critical success factors of ore formation (P1 = ore component sources, P2 = fluid
conduits, P3 = trap sites, and P4 = physico-chemical processes at the trap sites) are
conditionally independent. In reality some of these process factors may not necessarily be
independent. For example, the trap site (P3) of a lode-gold deposit may constitute a small
part and be a subsidiary fault geometry of the fault zone that acted as the fluid conduit
(P2). Furthermore, research by workers such as Cox et al. (2001) and Sibson (1990)
illustrates that the best fluid conduits have only local dilations under weak bulk strain
conditions, favoring the greatest fluid flux. Such settings are intimately associated with
supralithostatic fluid overpressure and hydrofracturing of less permeable subsidiary
structures to create fertile traps sites. These catastrophic fault-valve fluid releases require
a strong dependence between fluid conduits and trap sites. Ignoring dependencies
between different process elements can bias PMineralization and thus the outcome of the
modeling.
25

Additional work is required to identify and quantify interdependencies and their
impact on the models. Possible solutions may lie in (1) the application of a conditional
Bayesian (Appendix 1) rather than multiplicative approach as proposed by Lord et al.
(2001), (2) numerical modeling of the processes that represent the critical first-order
controls on the mineral system of interest (e.g., Potma et al., 2008), and/or (3) breaking
down mineral systems into their fundamental, independent physico-chemical factors that
cause ore deposition (i.e., permeability, gradient in non-hydrostatic fluid pressure,
solubility sensitivities, spatial gradients in temperature, pressure and concentration of
metal species, and the duration of the system) (Barnicoat et al., 2007).
Summary and Conclusions
The probabilistic mineral systems model introduced in this paper is a flexible,
internally consistent template that is structured in accordance with the previously
published, and widely accepted petroleum and mineral systems approaches.
The model integrates the critical processes of ore formation and scale and intensity of
metal deposition with basic concepts of probability theory and financial and decision
analysis, thereby generating a link between the geological potential of an exploration
project and its probability-adjusted financial value. As such, the probabilistic mineral
systems model provides a powerful tool for (1) assessing the probability of exploration
success, (2) ranking and evaluating exploration opportunities on a uniform and consistent
basis, (3) planning exploration programs on a basis of probability-based expected values
(EVs), (4) predicting possible outcomes and selecting the most financially advantageous
26

course of action under conditions of uncertainty, and (5) highlighting what additional
types of geological information could be collected for improving the chance of success
and achieving greater EV.
A real-world case study illustrates how the probabilistic mineral systems model can
generate a measure of the probability of ore formation and how this probability can be
used in an exploration decision tree that incorporates Monte Carlo simulation capability.
This tree is intended for calculating the expected (mean) net present value (NPV) of an
exploration project under deterministic conditions and then, by means of Monte Carlo
simulation, the variability of all possible NPVs surrounding the EV within a minimum
and maximum range and their probability distribution.
Acknowledgements
This paper is a result of an industry-collaborative research project at Macquarie
University, Sydney. We acknowledge the financial support of Macquarie University
(Vice Chancellor Research Development Fund) and industry sponsors BHP Billiton Ltd,
Codelco, Geoinformatics Exploration Australia Pty Ltd, Gold Fields Australasia Ltd,
Jackaroo Drill Fund Pty Ltd, Newmont Mining Corporation, Placer Dome Asia Pacific
Ltd, Teck Cominco Ltd, and WMC Resources Ltd. The Metals Economics Group
(MEG), Richard Schodde (BHP Billiton Ltd) and Richard Leveille (Phelps Dodge
Exploration Corp) are thanked for providing invaluable databases of the value of mineral
deposits. Insightful comments and constructive criticism by Nick Hayward and Jon
Hronsky (BHP Billiton Ltd) are greatly appreciated and helped to significantly improve
an earlier version of the manuscript. We are grateful to two anonymous ECONOMIC
27

GEOLOGY reviewers and the Editor Mark Hannington for their constructive and
thoughtful comments.
Appendix 1: Background to Quantitative Methods
Basic concepts of probability theory
A probability is a numerical measure of the likelihood that a particular chance
outcome will occur. Given that any outcome has no more than a 100 per cent and no less
than a zero per cent chance of occurrence, probabilities are assigned on a scale from zero
to one. Translated into an exploration scenario, a probability of occurrence of a particular
ore-forming process of P = 1.0 can be assigned only where drilling or other hard data
prove that the process operated. A probability of P = 0.0 denotes that the critical process
definitely did not operate. A value of P = 0.5 means that it is equally likely that a critical
process did or did not operate within a skillfully selected project area (Lord et al., 2001).
There are two ways of obtaining probabilities: theoretically and empirically.
Theoretical probabilities are those that can be determined by rigorous mathematical
calculations or purely objective logic, and thus are independent of prior experience.
Determination of theoretical probabilities requires complete understanding of a system
(e.g., card or roulette game). Empirical probabilities, on the other hand, are estimates of
the relative frequency of events, based on past observations, experimental trials and
experience ranging from relatively objective to subjective. Objective empirical
probabilities are those that rely on quantitative historical information from identical or
comparable situations, whereas subjective probabilities reflect a person’s (or group’s)
28

degree of belief that a particular outcome will occur. Although subjective, these estimates
are indispensable in situations where empirical data are not available or meaningless.
Probability judgments in mineral exploration generally fall in the subjective empirical
category.
Chance events are said to be mutually exclusive if their occurrence excludes or
precludes the occurrence of any other possible event. Chance events are collectively
exhaustive when they contain all possible outcomes of an experiment. Probability theory
dictates that a set of individual, mutually exclusive and collectively exhaustive chance
events must add up to one. When two or more events are independent, the probability that
all the outcomes will occur simultaneously (jointly or in sequence) is the product of the
individual probabilities of occurrence (e.g., Lapin, 1994; Everitt, 1999; Newendorp and
Schuyler, 2000; Wisniewski, 2002; Morris, 2003):
P(A + B + C + D) = PA × PB × PC × PD (1).
The underlying assumption of the application of this multiplication rule to the
probabilistic analysis of ore-forming processes (e.g., Lord et al., 2001) is that the
occurrence of one critical process of ore formation in no way affects, or is affected by,
the occurrence of the other critical processes.
Bayesian (conditional) probability
Bayes’ rule (also known as Bayes’ theorem) provides a theoretical framework for
revision or updating of an initial (prior) belief about the likelihood of an event (event A)
29

before its outcome, or the outcome of a second event (event B) is observed. This prior
distribution is the probability distribution before knowing the outcome of A or B. After
having observed A or B, we update our judgment. The new posterior probability
distribution can be calculated using Bayes' rule. The posterior probability is conditional
and written as P(A|B) = probability of A given B (e.g., Lapin, 1994; Newendorp and
Schuyler, 2000; Murtha, 2000; Albert and Rossman, 2001; Petrie et al., 2003).
As an example, without information about the prior probability of occurrence of a
mineral deposit at a particular location, it is impossible to determine the posterior
probability of such an occurrence given a range of exploration data. It is the posterior
probability on which we base our key exploration decisions (e.g., drill or collect more
data, abandon or stay), whether we do it explicitly or, more commonly, implicitly by
combining personal judgment, experience, intuition and a variety of target ranking
schemes. The following example may serve to illustrate how Bayes’ rule was built into
the probabilistic mineral systems model for calculating the probability that a mineral
deposit occurs at a particular location given the result of an additional targeting technique
relating to that location (cf. Barnett and Williams, 2006). Mathematically this problem
can be expressed as:
)'|()'()|()()|()()|(
DAPDPDAPDPDAPDPADP×+×
×= (2)
where P(D) = prior probability of occurrence of a mineral deposit at a particular location,
1 – P(D) = P(D') = complementary event of P(D) or the prior probability of failure,
P(A|D) = conditional probability of an anomaly given the presence of a mineral deposit
30

or the true positive rate of the targeting tool, P(A|D') = conditional probability of an
anomaly given that no mineral deposit is present or the false positive rate of the targeting
tool (e.g., Lapin, 1994; Newendorp and Schuyler, 2000; Murtha, 2000; Albert and
Rossman, 2001; Petrie et al., 2003).
Expected value (EV) concept
The EV concept is the probability-weighted, or mean, value of all possible outcomes
of an investment decision. The merit of this concept lies in its explicit incorporation of
uncertainty into a future value estimate. As such, the EV concept is a decision-making
tool that facilitates project ranking when companies are risk-neutral. Risk-neutral
investors maximize EV and are indifferent to the magnitude of potential losses. However,
in reality most investors are risk-averse. Decision alternatives with positive EVs are
considered investments; those with negative EVs are gambles (e.g., e.g., Drew, 1972;
Rose, 1999; Newendorp and Schuyler, 2000; Lord et al., 2001). The EV equation is
defined as:
)(...)()(1
2211 i
N
iNN VVPVVPVVPVEV =×++×+×= ∑
=
)( iVP× (3)
where EV = expected (mean) value of the investment, V = value of individual possible
discrete outcomes (net present value (NPV) of target at decision-to-mine, or any other
agreed measure of monetary value), P(V) = probability of V occurring, N = number of
possible outcomes, and i = outcome 1, 2, 3, … , k (e.g., Newendorp and Schuyler, 2000).
31

Appendix 2: Examples of Mineral Systems Models
Models were formulated for lode-gold, porphyry-copper, nickel-sulfide and stratiform
lead-zinc deposits, to develop and test the application of the probabilistic mineral systems
model. They are presented here as examples of how to assign critical processes of ore
formation to the model template.
Lode-gold systems model
Lode-gold deposits are rare but reproducible products of tectonothermal anomalies
that were created during the evolution of convergent plate margins by accretionary and
collisional processes (e.g., Kerrich and Cassidy, 1994; Hagemann and Cassidy, 2000;
Goldfarb et al., 2001a, b; Groves et al., 2003; Groves et al., 2005). Isotopic tracers of
fluid sources have not provided definite evidence of the origin of the ore components
(e.g., Ridley and Diamond, 2000), but it is most likely that they were sourced from rocks
or melts, or both, present in convergent plate margin environments. Commonly cited
models for extraction of ore components from their sources include mantle degassing
(e.g., McCuaig and Kerrich, 1998) and deep penetration and circulation of meteoric
waters (e.g. Neng et al., 1999; Yao et al., 1999; Mishra and Panigrahi, 1999; Boiron et
al., 2003; Vallance et al., 2003, 2004), although Ridley and Diamond (2000) suggested
that only the concepts of magmatic and metamorphic devolatilization have held up to
scientific scrutiny and testing.
Transport of large quantities of ore components from source to trap regions can only
occur and be sustained where fluids have access to permeable pathways. Such conduits
32

may include aquifers but are commonly fault or shear zones that are being actively
deformed. However, permeability can be rapidly destroyed by such processes as fracture
sealing during mineral deposition. Hence, deformation must be ongoing for structures to
be continuously or repeatedly active and to maintain their effectiveness of passing the
enormous volumes of fluid and metals required to produce a sizeable gold deposit (e.g.,
Sibson, 1990; Cox, 1999; Cox et al., 2001).
According to Cox et al. (2001), fluid flow within fault and shear zones is controlled
by fracture aperture and fracture density, and thus the degree of permeability.
Permeability depends to some extent on rock type but is principally localized by fault
irregularities, such as jogs, steps, bends and splays. These damage zones form very
effective, narrow fluid channels that may act as metal traps where their active
deformation coincides in space and time with processes that are capable of destabilizing
the physical and chemical balance of the ore-forming fluids. Alternatively, a metal trap
may form where relatively soluble rocks, such as dolomite or limestone, are locally
dissolved by ore-forming fluids as envisaged for Carlin-type gold deposits (e.g., Emsbo
et al., 2003). Given that great volumes of fluid and high fluid flux are needed for
transporting to the trap zone the volume of metal that is contained within a large gold
deposit (e.g., Cox et al., 1991), a trap should generally be characterized by wall-rock
alteration of much greater three-dimensional extent and intensity than that in areas away
from the trap.
Important and widely accepted processes of metal deposition within lode-gold
environments include (1) adiabatic and conductive cooling of ore-forming fluids, (2)
interaction between ore-forming fluids and their wall rocks, (3) phase separation as a
33

reaction to pressure decrease at the time of ascent or throttling of ore-forming fluids, and
(4) the mixing of two or more fluids with different physical and chemical properties (e.g.,
McCuaig and Kerrich, 1998; Mikucki, 1998). For metal deposition to occur, these
processes have to operate at trap sites on fault or shear zones that are being deformed
repeatedly or continuously at the time of activity of the gold-related hydrothermal
system. Regardless of the type of physico-chemical process that triggered metal
deposition, the three-dimensional extent of a trap must be large enough to host a sizeable
and economic mineral deposit.
Porphyry-copper systems model
Porphyry-copper (± gold, ± molybdenum) deposits are products of subduction-related
magmatism at convergent plate margins (e.g., Sillitoe, 2000; Richards, 2003; Cooke et
al., 2005). Sillitoe (2000), Richards (2003), Hollings et al. (2004), White (2004) and
Cooke et al. (2005) suggest that most giant porphyry-copper deposits, particularly those
that are <20 m.y. old, formed in regions where there have been (1) low angle subduction
of thicker than average oceanic crust (e.g., aseismic ridges, oceanic plateaus or seamount
chains), (2) changes in the dip of the subduction zone that resulted in tearing or bending
of the slab, (3) changes from orthogonal to oblique subduction; (4) reversals of arc
polarity, or (5) collisional events that resulted in crustal thickening, rapid uplift,
exhumation and generation of oxidized melts capable of transporting copper, gold and
sulfur dioxide.
Magma ascent is regarded by many authors as a process that is controlled by
structures that are actively being deformed (e.g., Tosdal and Richards, 2001; Chernicoff
34

et al., 2002; Richards, 2003), whereas others (e.g., Paterson and Schmidt, 1999, 2001;
Sillitoe, 2000) suggest that melt transport and emplacement are neither focused nor
channeled by faults. In the porphyry-copper model, it is crucial that magma ascent and
emplacement result in the formation of finger-, sill- or dike-like intrusions that, as
indicated by empirical data, are mainly found in areas of dilation at or near regional-scale
fault zones (e.g., Lindsay et al., 1995; Garwin, 2002; Richards, 2003; Guillou-Frottier
and Burov, 2003). Additional critical process steps in the migration of ore components to
trap regions are exsolution of volatiles from the melt (first boiling) and water saturation
of the melt caused by the crystallization of anhydrous phases (second boiling), controlled
by cooling and crystallization of the melt, deformation of the roof rocks and volume
expansion (i.e., decompression) of the ore-forming fluids. The prefixes ‘first’ and
‘second’ are not indicative of the order of the boiling events as both processes occur
repeatedly over the time of formation of a porphyry-copper deposit (e.g., Cline, 2003).
Most porphyry-copper deposits are hosted, either fully or partially, by finger-, sill- or
dike-like intrusions of composite porphyry stocks (e.g., Sillitoe, 2000), implying that
dilational deformation, permeability and fluid flux were mainly focused on the
mineralized subvolcanic centers (e.g., Lindsay et al., 1995). Recurring fracturing events
created damage zones of high permeability (e.g., up to 50 fractures per meter at Batu
Hijau: Garwin, 2002) that served as effective trap zones. The great three-dimensional
extent, intensity and degree of overprinting (telescoping) of hydrothermal alteration
zones centered on porphyry-copper deposits further suggests that by far the greatest
volume of hot, acidic fluid was channeled through these locations (e.g., Garwin, 2002).
35
Metal deposition from ore-forming fluids within porphyry-copper environments is
commonly brought about by phase separation, migration down temperature and pressure
gradients, fluid-rock interaction and mixing with external fluids (e.g., Richards, 2003).
For an economic porphyry-copper deposit to be formed, the trap region has to be capable
of holding large volumes of metals in closely spaced veins or large breccia bodies. Giant
porphyry-copper deposits, such as Batu Hijau and Chuquicamata, also show evidence for
recurring fracturing events as practically all fractures were opened and mineralized more
than once (Lindsay et al., 1995; Ossandon et al., 2001; Garwin, 2002).
Magmatic nickel-sulfide systems model
Magmatic nickel-copper (± cobalt, ± platinum group metals) deposits are restricted to
mafic to ultramafic, olivine-rich intrusions, commonly forming part of large igneous
provinces. The origin of these complexes has been linked to either melting of mantle
sources within hot regions (“hot spots”) in the mantle or arrival of mantle plumes at the
base to the source regions. Commonly proposed tectonic environments are
intracontinental rift and rifted continental margin settings (e.g., Naldrett, 1989, 1992;
Wooden et al., 1992; Misra, 2000; Li et al., 2001; Jaques et al., 2002; Diakov et al., 2002;
Yakubchuk and Nikishin, 2004; Lesher, 2004).
Contamination of magmas with crustal sulfur as they migrate from source to trap
regions or magma mixing, or both, or fractional crystallization in staging chambers are
considered by most workers as essential for achieving sulfur saturation of the melts (e.g.,
Naldrett, 1992; Chai and Naldrett, 1992; Li and Naldrett, 2000; Li et al., 2001, 2002;
Hannah and Stein, 2002; Arndt et al., 2003).
36

A number of studies have illustrated that massive sulfide ores at Noril’sk (Naldrett et
al., 1996), Voisey’s Bay (Evans-Lamswood et al., 2000) and Uitkomst (Li et al., 2002)
accumulated at specific sites within the magma conduits (dynamic environments),
whereas the sulfide content of rocks comprising the magma chambers (low-energy
environments) is commonly much lower. Based on this concept, Evans-Lamswood et al.
(2000) and Diakov et al. (2002) developed predictive models, suggesting that metals in
nickel-sulfide systems are most likely to be trapped at sites where changes to conduit
morphology affect the magma flow regime (e.g., decrease or increase of conduit width,
change in conduit orientation, entry points to magma chambers, structural discontinuities,
localized stoping and thermal erosion). In some nickel-sulfide systems, metal
concentration was clearly controlled by localized dilational deformation, permeability
and decompression. An excellent example is the Jinchuan deposit, where discontinuous
fracture zones within the nickel ore are rich in platinum group metals (e.g., up to 2.4 ppm
Pt: Chai and Naldrett, 1992). As illustrated by intrusions in the Noril’sk region,
metasomatic zones around mineralized igneous bodies are everywhere of higher
temperature origin and spatially more extensive than those surrounding barren plutons. In
addition, the metasomatic zones around mineralized intrusions are everywhere thicker
than the intrusions themselves (Diakov et al., 2002).
Metal deposition within trap zones is controlled by three critical subprocesses: (1) the
mafic to ultramafic magma has to reach the point of sulfur saturation for segregation of
liquid sulfide droplets to occur, (2) the liquid sulfide has to interact with sufficient
volumes of new magma to concentrate chalcophile metals at the trap site to an economic
37
level, and (3) for an economic deposit to form, the liquid sulfides have to be concentrated
within a relatively small volume of rock (e.g., Naldrett, 1989; Hannah and Stein, 2002).
Stratiform zinc-lead systems model
Sedimentary-hosted exhalative- (SEDEX) and Irish-type stratiform zinc-lead (±
silver, ± barite) deposits are located within extensive, long-lived rift-sag basins in which
clastic and volcanic rocks dominate the rift phase and shales and carbonates dominate the
sag phase. They are interpreted to have formed in rifted continental margin,
intracontinental or back-arc settings (e.g., McGoldrick and Large, 1998; Large et al.,
2002; Betts et al., 2003). Metals contained in these deposits were extracted by evolved
basinal brines from either intra- (volcanic and volcanoclastic rocks, sandstone) or
extrabasinal (basement) sources (e.g., Johnston, 1999; Leach et al., 2004).
Transport of ore components from source to trap regions was most likely achieved by
topography-driven and/or convective migration of basinal brines through aquifers or
along regional-scale, basin-penetrating structures (i.e., dilatant fault segments, fault
intersections) that were being actively deformed (e.g., Johnston, 1999; Garven et al.,
2001; Large et al., 2002; Betts and Lister, 2002).
Four fundamentally different models have been proposed for the formation of trap
zones in stratiform zinc-lead systems: (1) localized rock dissolution and replacement
(e.g., Wilkinson et al., 2005); (2) replacement of undercompacted shale horizons or
petroleum accumulations (e.g., Broadbent et al., 1998; Broadbent et al., 2002; Ord et al.,
2002); (3) localized dilational deformation, permeability and fluid flux (e.g., Johnston,
1999); (4) fluid pooling in sea-floor depressions next to or near regional-scale fault zones
38

39
(e.g., Goodfellow et al., 1993; Cooke et al., 2000; Sangster, 2002). Alteration zones
associated with giant or larger stratiform zinc-lead deposits are everywhere of great
extent and intensity (e.g., Large et al., 2002).
According to Cooke et al. (2000) and Large et al. (2002), metal deposition from
oxidized brines requires a separate source of reduced sulfur to mix with the ore-forming
brine, or a mechanism for generating reduced sulfur at the site of metal deposition. These
processes can be achieved by interaction of ore-forming brines with carbon-rich rocks or
fluids, such as those of anoxic brine pools or hydrocarbon reservoirs. Metal precipitation
from reduced brines can be triggered by processes, such as cooling, pH increase or
addition of reduced sulfur. These processes may result from mixing of the reduced brines
with seawater or interaction with carbonate-rich wall rocks (e.g., Cooke et al., 2000;
Large et al., 2002). Thus, large replenishable reservoirs are required for the accumulation
of huge volumes of zinc, lead and silver. In addition, host rock sequences (or brine pools)
have to be of great lateral extent and continuity, and prospective host rock packages of
great thickness (e.g., Rohrlach et al., 1998; Betts and Lister, 2002).
References
Albert, J.H., and Rossman, A.J., 2001, Workshop Statistics: Discovery with Data, a
Bayesian Approach: Key College Publishing, Emeryville, 350 p.
Arndt, N.T., Czamanske, G.K., Walker, R.J., Chauvel, C., and Fedorenko, V.A., 2003,
Geochemistry and origin of the intrusive hosts of the Noril'sk-Talnakh Cu-Ni-PGE
sulfide deposits: ECONOMIC GEOLOGY, v. 98, p. 495-515.
Bárdossy, G., and Fodor, J., 2001, Traditional and new ways to handle uncertainty in
geology: Natural Resources Research, v. 10, p. 179-187.
Barnett, C.T., and Williams, P.M., 2006, Mineral exploration using modern data mining
techniques, in Doggett, M.D., and Parry, J.R., eds., Wealth Creation in the Minerals
Industry: Integrating Science, Business, and Education: ECONOMIC GEOLOGY SPECIAL
PUBLICATION, v. 12, p. 295-310.
Barnicoat, A.C., and the pmd*CRC Y4 Team, 2007, Putting it all together: anatomy of a
giant mineral system, in Bierlein, F.P., and Knox-Robinson, C.M., eds., Proceedings of
the Kalgoorlie’07 Conference, Kalgoorlie: Geoscience Australia Record, v. 2007/14, p.
47-51.
Barton Jr., P.B., 1993, Problems and opportunities for mineral deposit models, in Kirkham,
R.V., Sinclair, W.D., Thorpe, R.I., and Duke, J.M., eds., Mineral Deposit Modeling:
Geological Association of Canada Special Paper, v. 40, p. 7-13.
Betts, P.G., and Lister, G.S., 2002, Geodynamically indicated targeting strategy for shale-
hosted massive sulfide Pb-Zn-Ag mineralisation in the Western fold belt, Mt Isa terrane:
Australian Journal of Earth Sciences, v. 49, p. 985-1010.
Betts, P.G., Giles, D., and Lister, G.S., 2003, Tectonic environment of shale-hosted massive
sulfide Zn-Pb-Ag deposits of Proterozoic northeastern Australia: ECONOMIC GEOLOGY,
v. 98, p. 557-576.
Boiron, M.-C., Cathelineau, M., Banks, D.A., Fourcade, S., and Vallance, J., 2003, Mixing
of metamorphic and surficial fluids during the uplift of the Hercynian upper crust;
consequences for gold deposition: Chemical Geology, v. 194, p. 119-141.
40

Bond, C.E., Gibbs, A.D., Shipton, Z.K., and Jones, S., 2007, What do you think this is?
“Conceptual uncertainty” in geoscience interpretation: GSA Today, v. 17, p. 4-10.
Broadbent, G.C., Myers, R.E., and Wright, J.V., 1998, Geology and origin of shale-hosted
Zn-Pb-Ag mineralization at the Century deposit, northwest Queensland, Australia:
ECONOMIC GEOLOGY, v. 93, p. 1264-1294.
Broadbent, G.C., Andrews, S.J., and Kelso, I.J., 2002, A decade of new ideas: geology and
exploration history of the Century Zn-Pb-Ag deposit, northwestern Queensland,
Australia, in Goldfarb, R.J., and Nielsen, R.L., eds., Integrated Methods for Discovery:
Global Exploration in the Twenty-first Century: ECONOMIC GEOLOGY SPECIAL
PUBLICATION, v. 9, p. 119-140.
Chai, G., and Naldrett, A.J., 1992, Characteristics of Ni-Cu-PGE mineralization and genesis
of the Jinchuan deposit, northwest China: ECONOMIC GEOLOGY, v. 87, p. 1475-1495.
Chernicoff, C.J., Richards, J.P., and Zappettini, E.O., 2002, Crustal lineament control on
magmatism and mineralization in northwestern Argentina: geological, geophysical, and
remote sensing evidence: Ore Geology Reviews, v. 21, p. 127-155.
Clemen, R.T., and Reilly, T., 2001, Making Hard Decisions with Decision Tools®: 2nd
Edition, Duxbury Press, Belmont, 733 p.
Clemens, P., and Pfitzer, T., 2006, Risk assessment and control: is your system safety
program wasting resources? Professional Safety, v. 41, p. 41-44.
Cline, J.S., 2003, How to concentrate copper: Science, v. 302, p. 2075-2076.
Cooke, D.R., Bull, S.W., Large, R.R., and McGoldrick, P.J., 2000, The importance of
oxidized brines for the formation of Australian Proterozoic stratiform sediment-hosted
Pb-Zn (SEDEX) deposits: ECONOMIC GEOLOGY, v. 95, p. 1-18.
41

Cooke, D.R., Hollings, P., and Walshe, J.L., 2005, Giant porphyry deposits: characteristics,
distribution, and tectonic controls: ECONOMIC GEOLOGY, v. 100, p. 801-818.
Cox, D.P., and Singer, D.A., 1986, Mineral deposit models: United States Geological
Survey Bulletin, v. 1693, 289 p.
Cox, S.F., 1999, Deformational controls on the dynamics of fluid flow in mesothermal gold
systems, in McCaffrey, K.J.W., Lonergan, L., and Wilkinson, J.J., eds., Fractures, Fluid
Flow and Mineralization: Geological Society of London Special Publication, v. 155, p.
123-140.
Cox, S.F., Knackstedt, M.A., and Braun, J., 2001, Principles of structural control on
permeability and fluid flow in hydrothermal systems, in Richards, J.P., and Tosdal,
R.M., eds., Structural Controls on Ore Genesis: REVIEWS IN ECONOMIC GEOLOGY, v. 14,
p. 1-24.
Cox, S.F., Wall, V.J., Etheridge, and M.A., Potter, T.F., 1991. Deformational and
metamorphic processes in the formation of mesothermal vein-hosted gold deposits –
examples from the Lachlan Fold Belt in central Victoria, Australia: Ore Geology
Reviews, v. 6, p. 391-423.
Demirel, I.H., 2004, Petroleum systems in the eastern and central Taurus region, Turkey:
Marine and Petroleum Geology, v. 21, p. 1061-1071.
Drew, L.J., 1972, Spatial distribution of the probability of occurrence and the value of
petroleum: Kansas, an example: Mathematical Geology, v. 4, p. 155-171.
Diakov, S., West, R., Schissel, D., Krivtsov, A., Kochnev-Pervoukhov, V., and Migachev,
I., 2002, Recent advances in the Noril'sk model and its application for exploration of Ni-
Cu-PGE sulfide deposits, in Goldfarb, R.J., and Nielsen, R.L., eds., Integrated Methods
42

for Discovery: Global Exploration in the Twenty-first Century: ECONOMIC GEOLOGY
SPECIAL PUBLICATION, v. 9, p. 203-226.
Emsbo, P., Hofstra, A.H., Lauha, E.A., Griffin, G.L., and Hutchinson, R.W., 2003, Origin
of high-grade gold ore, source of ore fluid components, and genesis of the Meikle and
neighboring Carlin-type deposits, northern Carlin trend, Nevada. ECONOMIC GEOLOGY,
v. 98, p. 1069-1105.
Eggert, R.G., 1993, Managing for successful mineral exploration – a review: Resources
Policy, v. 19, p. 173-176.
Etheridge, M.A., Kreuzer, O.P., Lucas, G., McMahon, M., Wastell, C., 2006, Making better
decisions and generating greater value in mineral exploration [abs.]: SEG 2006 – Wealth
Creation in the Minerals Industry, Keystone, Society of Economic Geologists, p. 26-28.
Evans-Lamswood, D.M., Butt, D.P., Jackson, R.S., Lee, D.V., Muggridge, M.G., and
Wheeler, R.I., 2000, Physical controls associated with the distribution of sulfides in the
Voisey’s Bay Ni-Cu-Co deposit, Labrador: ECONOMIC GEOLOGY, v. 95, p. 749-769.
Everitt, B.S., 1999, Chance Rules: An Informal Guide to Probability, Risk, and Statistics:
Copernicus, New York, 202 p.
Folinsbee, R.E., 1977, World’s view; from Alph to Zipf: Geological Society of America
Bulletin, v. 88, p. 897-907.
Garven, G., Bull, S.W., and Large, R.R., 2001, Hydrothermal fluid flow models of
stratiform ore genesis in the McArthur Basin, Northern Territory, Australia: Geofluids,
v. 1, p. 289-311.
Garwin, S., 2002, The geologic setting of intrusion-related hydrothermal systems near the
Batu Hijau porphyry copper-gold deposit, Sumbawa, Indonesia, in Goldfarb, R.J., and
43

Nielsen, R.L., eds., Integrated Methods for Discovery: Global Exploration in the
Twenty-First Century: ECONOMIC GEOLOGY SPECIAL PUBLICATION, v. 9, p. 333-336.
Goldfarb, R.J., Groves, D.I., and Gardoll, S., 2001a, Rotund versus skinny orogens; well-
nourished or malnourished gold?: Geology, v. 29, p. 539-542.
Goldfarb, R.J., Groves, D.I., and Gardoll, S., 2001b, Orogenic gold and geologic time: a
global synthesis: Ore Geology Reviews, v. 18, p. 1-75.
Goodfellow, W.D., Lydon, J.W., and Turner, R.J.W., 1993, Geology and genesis of
stratiform sediment-hosted (SEDEX) zinc-lead-silver sulphide deposits, in Kirkham,
R.V., Sinclair, W.D., Thorpe, R.I., and Duke, J.M., eds., Mineral Deposit Modeling:
Geological Association of Canada Special Paper, v. 40, p. 201-251.
Groves, D.I., Goldfarb, R.J., Robert, F., and Hart, C.J.R., 2003, Gold deposits in
metamorphic belts: overview of current understanding, outstanding problems, future
research, and exploration significance: ECONOMIC GEOLOGY, v. 98, p. 1-29.
Groves, D.I., Condie, K.C., Goldfarb, R.J., Hronsky, J.M.A., and Vielreicher, R.M., 2005,
Secular changes in global tectonic processes and their influence on the temporal
distribution of gold-bearing mineral deposits: ECONOMIC GEOLOGY, v. 100, p. 203-224.
Guillou-Frottier, L., and Burov, E., 2003, The development and fracturing of plutonic
apexes: implications for porphyry ore deposits: Earth and Planetary Science Letters, v.
214, p. 341-356.
Hagemann, S.G., and Cassidy, K.F., 2000, Archaean lode gold deposits, in Hagemann,
S.G., and Brown, P.E., eds., Gold in 2000: REVIEWS IN ECONOMIC GEOLOGY, v. 13, p. 9-
68.
44

Hannah, J.L., and Stein, H.J., 2002, Re-Os model for the origin of sulfide deposits in
anorthosite-associated intrusive complexes: ECONOMIC GEOLOGY, v. 97, p. 371-383.
Henley, R.W., and Berger, B.R., 1993, What is an exploration model anyway? An analysis
of the cognitive development and use of models in mineral exploration, in Kirkham,
R.V., Sinclair, W.D., Thorpe, R.I., and Duke, J.M., eds., Mineral Deposit Modeling:
Geological Association of Canada Special Paper, v. 40, p. 41-50.
Hodgson, C.J., 1993, Uses (and abuses) of ore deposit models in mineral exploration:
Geoscience Canada, v. 17, p. 79-89.
Hollings, P., Cooke, D.R., and Walshe, J.L., 2004, The characteristics, distribution and
controls on giant porphyry copper deposits: The Gangue, Geological Association of
Canada Mineral Deposit Division, v. 82, p. 1 and 5-6.
Hronsky, J.M.A., 2004, The science of exploration targeting [abs.], in Muhling, J.,
Goldfarb, R., Vielreicher, N., Bierlein, F., Stumpfl, E., Groves, D., and Kenworthy, S.,
eds., SEG 2004 – Predictive Mineral Discovery Under Cover: Centre for Global
Metallogeny, The University of Western Australia Publication, SEG 2004 Conference,
Perth, v. 33, p. 129-133.
Hronsky, J.M.A., and Groves, D.I., 2008, Science of targeting: definition, strategies,
targeting and performance measurement: Australian Journal of Earth Sciences, v. 55, p.
3-12.
Jaques, A.L., Jaireth, S., and Walshe, J.L., 2002, Mineral systems of Australia: an overview
of resources, settings and processes: Australian Journal of Earth Sciences, v. 49, p. 632-
660.
45

Johnston, J.D., 1999, Regional fluid flow and the genesis of Irish Carboniferous base metal
deposits: Mineralium Deposita, v. 34, p. 571-598.
Jones, R.M., and Hillis, R.R., 2003, An integrated, quantitative approach to assessing fault-
seal risk: American Association of Petroleum Geoscientists Bulletin, v. 87, p. 507-524.
Kerrich, R., and Cassidy, K.F., 1994, Temporal relationships of lode gold mineralization to
accretion, magmatism, metamorphism and deformation – Archean to present: a review:
Ore Geology Reviews, v. 9, p. 263-310.
Knox-Robinson, C.M., and Wyborn, L.A.I., 1997, Towards a holistic exploration strategy:
using geographic information systems as tool to enhance exploration: Australian Journal
of Earth Sciences, v. 44, p. 453-463.
Kreuzer, O.P., 2007, Risk modelling – increasing the effectiveness of our exploration
investments [abs.], in Bierlein, F.P., and Knox-Robinson, C.M., eds., Proceedings of
Geoconferences (WA) Inc. Kalgoorlie ’07 Conference: Geoscience Australia Record
2007, v. 14, p. 226-230.
Lang, J.R., and Baker, T., 2001, Intrusion-related gold systems: the present level of
understanding: Mineralium Deposita, v. 36, p. 477-489.
Lapin, L.L., 1994, Quantitative Methods for Business Decisions: Sixth edition, Duxbury
Press, Belmont, 1250 p.
Large, R.R., Bull, S.W., Selley, D., Yang, J., Cooke, D.R., Garven, G., and McGoldrick, P.,
2002, Controls on the formation of giant stratiform sediment-hosted Zn-Ag-Pb deposits:
with particular reference to the north Australian Proterozoic, in Cooke, D.R., and
Pongratz, J., eds., Giant Ore Deposits: Characteristics, Genesis and Exploration:
46

University of Tasmania, Centre for Ore Deposit Research Special Publication, v. 4, p.
107-149.
Leach, D.L., Marsh, E., Emsbo, P., Rombach, C.S., Kelley, K.D., and Anthony, M., 2004,
Nature of hydrothermal fluids at the shale-hosted Red Dog Zn-Pb-Ag deposit, Brooks
Range, Alaska: ECONOMIC GEOLOGY, v. 99, p. 1449-1480.
Lesher, C.M., 2004, Footprints of magmatic Ni-Cu-(PGE) systems [abs.], in Muhling, J.,
Goldfarb, R.J., Vielreicher, N., Bierlein, F.P., Stumpfl, E., Groves, D.I., and Kenworthy,
S., eds., SEG 2004: Predictive Mineral Discovery under Cover: Centre for Global
Metallogeny, The University of Western Australia Publication, v. 33, p. 117-120.
Leveille, R., and Doggett, M.D., 2006, Costs, risks and returns of copper exploration:
assessing trends in discovery and maturity with particular reference to Chile, in Doggett,
M.D, and Parry, J.R., eds., Wealth Creation in the Minerals Industry – Integrating
Science, Business, and Education: ECONOMIC GEOLOGY SPECIAL PUBLICATION, v. 12, p.
91-107.
Li, C., and Naldrett, A.J., 2000, Melting reactions of gneissic inclusions with enclosing
magma at Voisey's Bay, Labrador, Canada: implications with respect to ore genesis:
ECONOMIC GEOLOGY, v. 95, p. 801-814.
Li, C., Naldrett, A.J., and Ripley, E.M., 2001, Critical factors for the formation of a nickel-
copper deposit in an evolved magma system: lessons from a comparison of the Pants
Lake and Voisey's Bay sulfide occurrences in Labrador, Canada: Mineralium Deposita,
v. 36, p. 85-92.
Li, C., Ripley, E.M., Maier, W.D., and Gomwe, T.E.S., 2002, Olivine and sulfur isotopic
compositions of the Uitkomst Ni-Cu sulfide ore-bearing complex, South Africa:
47

evidence for sulfur contamination and multiple magma emplacements: Chemical
Geology, v. 188, p. 149-159.
Lindsay, D.D., Zentilli, M., and De La Rivera, J.R., 1995, Evolution of an active ductile to
brittle shear system controlling mineralization at the Chuquicamata porphyry copper
deposit, northern Chile: International Geology Reviews, v. 37, p. 945-958.
Lord, D., Etheridge, M.A., Willson, M., Hall, G., and Uttley, P.J., 2001, Measuring
exploration success: an alternative to the discovery-cost-per-ounce method of
quantifying exploration success, Society of Economic Geologists Newsletter, 45, p. 1
and 10-16.
Ludington, S., Barton Jr., P.B., and Johnson, K.M., 1985, Mineral deposit models: theory
and practice: United States Geological Survey Open-file Report, v. 85-391, 18 p.
Magoon, L.B., and Dow, W.G., 1994, The petroleum system, in Magoon, L.B., and Dow,
W.G., eds., The Petroleum System: From Source to Trap: Memoir, American Association
of Petroleum Geologists, Tulsa, v. 60, p. 3-24.
Malakoff, D., 1999, Bayes offers a 'new' way to make sense of numbers. Science, v. 286, p.
1460-1464.
McCuaig, T.C., and Kerrich, R., 1998, P-T-t-deformation-fluid characteristics of lode gold
deposits: evidence from alteration systematics: Ore Geology Reviews, v. 12, p. 381-453.
McCuaig, T.C., and Hronsky, J.M.A., 2000, The current status and future of the interface
between the exploration industry and economic geology research, in Hagemann, S.G.,
and Brown, P.E., eds., Gold in 2000: REVIEWS IN ECONOMIC GEOLOGY, v. 13, p. 553-
559.
48

McCuaig, T.C., Kreuzer, O.P., and Brown, W.M., 2007, Fooling ourselves – dealing with
model uncertainty in a mineral systems approach to exploration, in Andrew, C.J., ed.,
Mineral Exploration and Research: Digging Deeper: Proceedings of the 9th Biennial
SGA Meeting, Dublin, p. 1435-1438.
McGoldrick, P., and Large, R.R., 1998, Proterozoic stratiform sediment-hosted Zn-Pb-Ag
deposits: Journal of Australian Geology and Geophysics, v. 17, p. 189-196.
Megill, R.E., 1988, Exploration Economics: PennWell, Tulsa, 238 p.
Mikucki, E.J., 1998, Hydrothermal transport and depositional processes in Archean lode-
gold systems: a review: Ore Geology Reviews, v. 13, p. 307-321.
Mishra, B., and Panigrahi, M.K., 1999, Fluid evolution in the Kolar gold field: evidence
from fluid inclusion studies: Mineralium Deposita, v. 34, p. 173-181.
Misra, K.C., 2000, Understanding Mineral Deposits: Kluwer Academic Publishers,
Dordrecht, 845 p.
Morin, M.A., and Ficarazzo, F., 2006, Monte Carlo simulation as a tool to predict blasting
fragmentation based on the Kuz–Ram model. Computers and Geosciences, v. 32, p.
352-359.
Morris, C., 2003, Quantitative Approaches in Business Studies: Sixth Edition, Prentice Hall
Financial Times, Harlow, 512 p.
Murtha, J.A., 2000, Decisions Involving Uncertainty: An @RISKTM Tutorial for the
Petroleum Industry: Palisade Corporation, Newfield, 140 p.
Naldrett, A.J., 1989, Ores associated with flood basalts, in Whitney, J.A., and Naldrett, A.J.,
eds., Ore Deposition Associated with Magmas: REVIEWS IN ECONOMIC GEOLOGY, v. 4,
p. 103-118.
49

Naldrett, A.J., 1992, A model for the Ni-Cu-PGE ores of the Noril'sk region and its
application to other areas of flood basalt: ECONOMIC GEOLOGY, v. 87, p. 1945-1962.
Naldrett, A.J., Fedorenko, V.A., Asif, M., Shushen, L., Kuniliov, V.E., Stekhin, A.I.,
Lightfoot, P.C., and Gorbachev, N.S., 1996, Controls on the composition of Ni-Cu
sulfide deposits as illustrated by those at Noril'sk, Siberia: ECONOMIC GEOLOGY, v. 91,
p. 751-773.
Neng, J., Jiuhua, X., and Mianxin, S., 1999, Fluid inclusion characteristics of mesothermal
gold deposits in the Xiaoqinling district, Shaanxi and Henan provinces, People's
Republic of China: Mineralium Deposita, v. 34, p. 150-162.
Newendorp, P.D., and Schuyler, J.R., 2000, Decision Analysis for Petroleum Exploration:
Second Edition, Planning Press, Aurora, 618 p.
Ord, A., Hobbs, B.E., Zhang, Y., Broadbent, G.C., Brown, M., Willetts, G., Sorjonen-Ward,
P., Walshe, J.L., and Zhao, C., 2002, Geodynamic modelling of the Century deposit, Mt
Isa province, Queensland: Australian Journal of Earth Sciences, v. 49, p. 1011-1039.
Ossandon, G., Freraut, R., Gustafson, L.B., Lindsay, D.D., and Zentilli, M., 2001, Geology
of the Chuquicamata mine: a progress report: ECONOMIC GEOLOGY, v. 96, p. 249-270.
Paterson, S.R., and Schmidt, K.L., 1999, Is there a close spatial relationship between faults
and plutons?: Journal of Structural Geology, v. 21, p. 1131-1142.
Paterson, S.R., and Schmidt, K.L., 2001, Reply to discussion of "Is there a close spatial
relationship between faults and plutons?": Journal of Structural Geology, v. 23, p. 2029-
2032.
Penney, S.R., Allen, R.M., Harrisson, S., Lees, T.C., Murphy, F.C., Norman, A.R., and
Roberts, P.A., 2004, A global-scale exploration risk analysis technique to determine the
50

best mineral belts for exploration: Applied Earth Science (Transaction of the Institute of
Mining and Metallurgy B), v. 133, p. B183-B196.
Petrie, A., Bulman, J.S., and Osborn, J.F., 2003, Further statistics in dentistry – Part 9:
Bayesian statistics: British Dental Journal, v. 194, p. 129-134.
Potma, W., Roberts, P.A., Schaubs, P.M., Sheldon, H.A., Zhang, Y., Hobbs, B.E., and Ord,
A., 2008, Predictive targeting in Australian orogenic-gold systems at the deposit to
district scale using numerical modeling: Australian Journal of Earth Sciences, v. 55, p.
101-122.
Richards, J.P., 2003, Tectono-magmatic precursors for porphyry Cu-(Mo-Au) deposit
formation: ECONOMIC GEOLOGY, v. 98, p. 1515-1533.
Ridley, J.R., and Diamond, L.W., 2000, Fluid geochemistry of orogenic lode gold deposits
and implications for genetic models, in Hagemann, S.G., and Brown, P.E., eds., Gold in
2000: REVIEWS IN ECONOMIC GEOLOGY, v. 13, p. 141-162.
Rohrlach, B.D., Fu, M., and Clarke, J.D.A., 1998, Geological setting, paragenesis and fluid
history of the Walford Creek Zn-Pb-Cu-Ag prospect, Mt Isa basin, Australia: Australian
Journal of Earth Sciences, v. 45, p. 63-81.
Rose, P.R., 1987, Dealing with risk and uncertainty in exploration: how can we improve?:
American Association of Petroleum Geologists Bulletin, v. 71, p. 1-16.
Rose, P.R., 1999, Taking the risk out of petroleum exploration; the adaptation of systematic
risk analysis by international corporations during the 1990s: The Leading Edge, v. 18, p.
192-199.
Rowe, G., and Wright, G., 1999, The Delphi technique as a forecasting tool: issues and
analysis: International Journal of Forecasting, v. 15, p. 353-375.
51

Sangster, D.F., 2002, The role of dense brines in the formation of vent-distal sedimentary-
exhalative (SEDEX) lead-zinc deposits: field and laboratory evidence: Mineralium
Deposita, v. 37, p. 149-157.
Sarmiento, L.F., and Rangel, A., 2004, Petroleum systems of the upper Magdalena Valley,
Colombia: Marine and Petroleum Geology, v. 21, p. 373-391.
Schodde R.C., 2004 [abs.], Discovery performance of the Western World gold industry
over the period 1985 – 2003: PACRIM 2004 Congress Melbourne, The Australasian
Institute for Mining and Metallurgy Proceedings, p. 367-380.
Sibson, R.H., 1990, Conditions for fault-valve behaviour, in Knipe, R.J., and Rutter, E.H.,
eds., Deformation Mechanics, Rheology and Tectonics: Geological Society of London
Special Publication, v. 54, p. 15-28.
Sillitoe, R.H., 2000, Gold-rich porphyry deposits: descriptive and genetic models and their
role in exploration and discovery, in Hagemann, S.G., and Brown, P.E., eds., Gold in
2000: REVIEWS IN ECONOMIC GEOLOGY, v. 13, p. 315-345.
Sillitoe, R.H., and Thompson, J.F.H., 2006, Changes in mineral exploration practice:
consequences for discovery, in Doggett, M.D., and Parry, J.R., eds., Wealth Creation in
the Minerals Industry: Integrating Science, Business, and Education: ECONOMIC
GEOLOGY SPECIAL PUBLICATION, v., 12, p. 193-219.
Singer, D.A., 1993, Basic concepts in three-part quantitative assessments of undiscovered
mineral resources: Natural Resources Research, v. 2, p. 69-81.
Singer, D.A., and Kouda, R., 1999, Examining risk in mineral exploration: Natural
Resources Research, v. 8, p. 111-122.
52

Smith, J.T., 1994, Petroleum system logic as an exploration tool in a frontier setting, in
Magoon, L.B., and Dow, W.G., eds., The Petroleum System: From Source to Trap:
Memoir, American Association of Petroleum Geologists, Tulsa, v. 60, p. 25-49.
Sontag, S., and Drew, C., 1998, Blind Man's Bluff: The Untold Story of American
Submarine Espionage: Public Affairs, New York, 352 p.
Suslick, S.B., and Schiozer, D.J., 2004, Risk analysis applied to petroleum exploration and
production: an overview (editorial): Journal of Petroleum Science and Engineering, v.
44, p. 1-9.
Taha, H.A., 1976, Operations Research: An Introduction: Second Edition, Collier-
Macmillan International Editions, New York, 335 p.
Thompson, J.F.H., 1993, Application of deposit models to exploration, in Kirkham, R.V.,
Sinclair, W.D., Thorpe, R.I., and Duke, J.M., eds., Mineral Deposit Modeling:
Geological Association of Canada Special Paper, v. 40, p. 51-67.
Tosdal, R.M., and Richards, J.P., 2001, Magmatic and structural controls on the
development of porphyry Cu ± Mo ± Au deposits, in Richards, J.P., and Tosdal, R.M.,
eds., Structural Controls on Ore Genesis: REVIEWS IN ECONOMIC GEOLOGY, v. 14, p.
157-181.
Vallance, J., Cathelineau, M., Boiron, M.-C., Fourcade, S., Shepherd, T.J., and Naden, J.,
2003, Fluid-rock interactions and the role of late Hercynian aplite intrusion in the
genesis of the Castromil gold deposit, northern Portugal: Chemical Geology, v. 194, p.
201-224.
Vallance, J., Boiron, M.-C., Cathelineau, M., Fourcade, S., Varlet, M., and Marignac, C.,
2004, The granite hosted gold deposit of Moulin de Cheni (Saint-Yrieix District, Massif
53

Central, France); petrographic, structural, fluid inclusion and oxygen isotope
constraints: Mineralium Deposita, v. 39, p. 265-281.
White, N.C., 2004 [abs.], Porphyry-epithermal Cu-Au-Ag systems: regional, district and
local footprints, the guides to discovery, in Muhling, J., Goldfarb, R.J., Vielreicher, N.,
Bierlein, F.P., Stumpfl, E., Groves, D.I., and Kenworthy, S., eds., SEG 2004: Predictive
Mineral Discovery under Cover: Centre for Global Metallogeny, The University of
Western Australia Publication, v. 33, p. 108-111.
Wilkinson, J.J., Eyre, S.L., and Boyce, A.J., 2005, Ore-forming processes in Irish-type
carbonate-hosted Zn-Pb deposits: evidence from mineralogy, chemistry, and isotopic
composition of sulfides at the Lisheen mine: ECONOMIC GEOLOGY, v. 100, p. 63-86.
Wisniewski, M., 2002, Quantitative Methods for Decision Makers: Third Edition, Prentice
Hall Financial Times, Harlow, 575 p.
Wooden, J.L., Czamanske, G.K., Bouse, R.M., Likhachev, A.P., Kuniliov, V.E., and
Lyul’ko, V., 1992, Pb isotope data indicate a complex, mantle origin for the Noril'sk-
Talnakh ores, Siberia: ECONOMIC GEOLOGY, v. 87, p. 1153-1165.
Wyborn, L.A.I., Heinrich, C.A., and Jaques, A.L., 1994, Australian Proterozoic mineral
systems: essential ingredients and mappable criteria [abs.], in Hallenstein, P.C., ed.,
Australian Mining Looks North – the Challenges and Choices: Australian Institute of
Mining and Metallurgy Publication Series, v. 5, p. 109-115.
Yakubchuk, A., and Nikishin, A., 2004, Noril'sk-Talnakh Cu-Ni-PGE deposits: a revised
tectonic model: Mineralium Deposita, v. 39, p. 125-142.
54

55
Yao, Y., Morteani, G., and Trumbull, R.B., 1999, Fluid inclusion microthermometry and
the P-T evolution of gold-bearing hydrothermal fluids in the Niuxinshan gold deposit,
eastern Hebei Province, NE China: Mineralium Deposita, v. 34, p. 348-365.
Figure Captions Fig. 1. Schematic overview of the modeling process: (A) a subjective (expert) measure of
the probability of ore occurrence computed in the probabilistic mineral systems model for
a particular project area or target and (B) estimates of the costs of mineral exploration
and feasibility, and the possible value of the targeted mineral deposit style serve as inputs
for (C) an exploration decision tree that offers possible decision alternatives. (D) Monte
Carlo simulation of the exploration decision tree produces (E) the expected value (EV) of
a particular exploration project and the probability distribution of all its possible NPVs
within a minimum and maximum range.
Fig. 2. Excel™-integrated probabilistic mineral systems model for porphyry-copper (±
gold, ± molybdenum) deposits. Discrete probabilistic values (on a scale from 0.0 to 1.0)
or ranges of likely values as illustrated in this example are assigned to each critical
subprocess. Each assignment must be based on geological evidence for the particular
subprocess having operated at the location of interest. The probability of occurrence of a
critical process is the product of the probabilities assigned to the each critical subprocess.
By multiplying P1, P2, P3 and P4, a probability of occurrence of potentially economic
mineralization (PMineralization) can be obtained for a particular area of interest (cf. Lord et
al., 2001). Where a range of probabilities is assigned, the values are assigned a uniform
distribution that is characterized by the minimum and maximum of the range and
constant probability.
56

Fig. 3. Exploration decision tree offering three main decision paths: (1) drill, (2) apply
additional targeting technique, and (3) terminate. The tree can be used in either a
deterministic or probabilistic manner. The deterministic tree (illustrated in this figure) is
intended to calculate the “base case” expected value (EV) of a project for which drillable
targets have been or are being identified (i.e., exploration stage B of Lord et al., 2001)
and as a function of expected (mean) values of inputs. The probabilistic tree integrates
the probabilistic distributions of the inputs outlined in Figure 1A and B with a Monte
Carlo simulation tool for computing not only the EV of a project but also the probability
distribution of all possible project NPVs within a minimum and maximum range. Key to
abbreviations: EV = expected value; $M = million dollars.
Fig. 4. (A) Schematic representation of the exploration decision tree and probabilistic
cost and value distributions as applied to a real-world porphyry copper-gold case study
(see text for details). The case study illustrates how the probabilistic mineral systems
model can generate a measure of the probability of ore formation and how this
probability can be used in an exploration decision tree that incorporates Monte Carlo
simulation capability. (B) Results of the simulation of the distribution of all possible net
present values (NPVs) of the drill decision. (C) Results of the simulation of the
distribution of all possible values of the porphyry-copper target sampled in the range
from $50 million to $1 billion. Key to abbreviations: $M = million dollars.
Appendix 2, Fig. 1. Mineral systems model template for lode-gold deposits (see text for
a rationale for the formulation of the geological process model). The model sheets consist
57

58
of five parts: (1) the essential elements of the mineral system; (2) the critical processes
and subprocesses that must operate for ore deposition to occur within a particular area;
(3) the four-dimensional extent of the ore-forming system; (4) post-ore processes such as
outflow of spent fluids from trap zones, upgrading of mineral systems by supergene or
metamorphic processes, and preservation of mineral systems through time; and (5)
decision-making (i.e., to drill test, seek further information via an additional targeting
technique, or abandon a project).
Appendix 2, Fig. 2. Mineral systems model template for porphyry-copper (± gold, ±
molybdenum) deposits.
Appendix 2, Fig. 3. Mineral systems model template for magmatic nickel-sulfide
(copper, ± cobalt, ± platinum group metals) deposits.
Appendix 2, Fig. 4. Mineral systems model template for stratiform zinc-lead (± silver, ±
barite) deposits.

Cost and Value Distributions
Estimate costs
Additional targeting
Drill testing
Delineation drilling
Feasibility Min Max
Mostlikely
Estimate NPV value oftarget mineral deposit
μ, σ
Probabilistic Mineral Systems Model
Identify criticalore-forming processes
Assign probabilities toeach process
Source
Pathway
Trap
Deposition
Min Max
Exploration Decision Tree
0.3000 0.0000$120.90M $116.70M
TRUE PathValue-$3.83M $38.47M0.7000 0.0000
$9.53M $5.33M0.0645 Company Criteria Met
$0.00M$38.74M
FALSE 0.0000$9.53M $9.17MFALSE Drill
-$0.37M$2.16M
0.9355 0.0000$0.00M -$0.37M
Test Decision$4.10M
0.3000 0.0354$120.90M $116.55M
TRUE-$3.83M
$38.59M0.7000 0.0826
$9.53M $5.18M0.1180$0.00M
$38.59M
FALSE 0.0000$9.53M $9.02MTRUE Drill
-$0.37M$4.10M
0.8820 0.8820$0.00M -$0.52MTRUE Test
-$0.15M$4.10M
FALSE 0.0000$0.00M -$0.15M
0.9355 0.0000$0.0M $0.00M
FALSE Terminate$0.00M
$0.00M0.0645 0.0000
$0.00M $0.00M
Project
Not too small (handto mining division)
Too small
Additional tar-geting technique
Drill
Terminate
Drill
Terminate
Nothing there
Bugger!
No discovery
Discovery
Yes: resourcedelineation
No: sell
No discovery
Discovery Company Criteria Met
No: sell
Yes: resourcedelineation
Path Value
Not too small (handto mining division)
Too small
Monte Carlo Simulation
Repeated random sampling of allinput data distributions in the ex-ploration decision tree
Computation of probability distri-bution of all possible project NPVvalues of the simulated scenarios
Distribution of possible ProjectNet Present Values (NPVs)
Freq
uenc
y
Project NPV values
Figure 1.
Expected value (EV)
A B
C D E
Integrated Decision Model
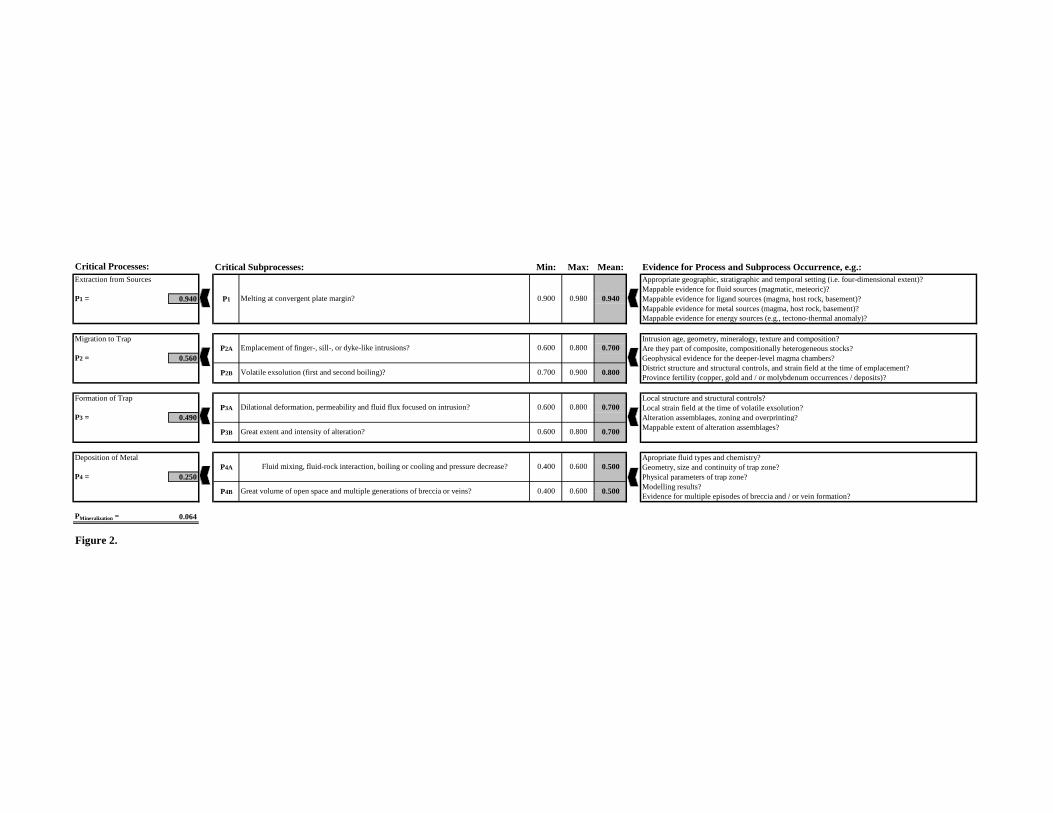
Critical Subprocesses: Min: Max: Mean: Evidence for Process and Subprocess Occurrence, e.g.:Extraction from Sources Appropriate geographic, stratigraphic and temporal setting (i.e. four-dimensional extent)?
Mappable evidence for fluid sources (magmatic, meteoric)?P1 = 0.940 Mappable evidence for ligand sources (magma, host rock, basement)?
Mappable evidence for metal sources (magma, host rock, basement)?Mappable evidence for energy sources (e.g., tectono-thermal anomaly)?
Migration to Trap Intrusion age, geometry, mineralogy, texture and composition?Are they part of composite, compositionally heterogeneous stocks?
P2 = 0.560 Geophysical evidence for the deeper-level magma chambers?District structure and structural controls, and strain field at the time of emplacement?Province fertility (copper, gold and / or molybdenum occurrences / deposits)?
Formation of Trap Local structure and structural controls?Local strain field at the time of volatile exsolution?
P3 = 0.490 Alteration assemblages, zoning and overprinting?Mappable extent of alteration assemblages?
Deposition of Metal Apropriate fluid types and chemistry?Geometry, size and continuity of trap zone?
P4 = 0.250 Physical parameters of trap zone?Modelling results?Evidence for multiple episodes of breccia and / or vein formation?
PMineralization = 0.064
Figure 2.
0.500P4A Fluid mixing, fluid-rock interaction, boiling or cooling and pressure decrease?
P4B Great volume of open space and multiple generations of breccia or veins? 0.400 0.600 0.500
0.800
0.600 0.800
0.400 0.600
P3A
P2A
P2B
P3B
0.800
0.700
0.700
Dilational deformation, permeability and fluid flux focused on intrusion?
Volatile exsolution (first and second boiling)?
0.700
Great extent and intensity of alteration?
0.600 0.800
0.700 0.900
0.600
Critical Processes:
0.940Melting at convergent plate margin?
Emplacement of finger-, sill-, or dyke-like intrusions?
0.900 0.980P1

EV of project
$4.641M
Drill
Initial ore-gradeintersection
Resourcedelineation
Acceptable grade /tonnage potential
Feasibility
Sell
Terminate
Feasible = expectedproject NPV value
Terminate
Apply additionaltargeting technique
Target Drill
Terminate
$169.710M
-$6.300M
$14.030M
$9.370M
-$0.300M
$169.560M
-$6.450M
$13.880M
$9.220M
-$0.450M
-$0.150M
$0.000M
-$0.300M$3.125M
$52.814M
-$0.300M$0.000M
$9.670M
-$4.000M$52.814M
$14.030M
$143.309MP = 0.3000
P = 0.7000P = 0.0645
P = 0.9355
$18.330M
-$10.000M$143.309
P = 0.1500
P = 0.8500$184.010M
$8.000M
$0.000M
-$0.150M
$14.703M-$0.300M$14.703M
P = 0.6774
P = 0.3236
P = 0.2853
P = 0.7147
$52.664M
-$4.000M$52.664M
$9.670M
P = 0.3000
P = 0.7000$13.880M
$143.159M-$10.000M
$143.159M
$18.330M
$8.000MP = 0.1500
P = 0.8500$184.010M
No target
Unfeasible = sell
No initial ore-gradeintersection
Too small
-$0.150M$4.641M
Initial ore-gradeintersection
No initial ore-gradeintersection
-$0.150M
Acceptable grade /tonnage potential
Too small
Feasibility
Sell
Sell
Resourcedelineation
Sell
-$0.450M
Feasible = expectedproject NPV value
Unfeasible = sell
Branch simulated in Figure 4
Figure 3.
PMineralization
PosteriorPMineralization
Cost of drilling
Cost of targeting
Cost of resourcedelineation
Cost of feasibility
PAnomaly

Drill
Initial ore-gradeintersection
Resourcedelineation
Acceptable grade /tonnage potential
Feasibility
Sell
Terminate
Feasible = expectedproject NPV value
$
$
$
$
$No initial ore-gradeintersection
Too small
Sell
Figure 4.
2000
3000
1000
4000
Target Value (in $M)
0-100 1000
300 500 700 900
Freq
uenc
y
Mean (= EV) $143.457MStandard deviation $193.000MMinimum $0.000MMedian $79.000MMaximum $999.999M
2000
4000
0
6000
8000
Freq
uenc
y
NPV of Drill Decision (in $M)
0-5 5 10 15 20 25
$2.628M$3.544M
-$0.122M$1.352M
$27.201M
Mean (= EV)Standard deviationMinimumMedianMaximum
A
B C
Unfeasible = sell

Numerical Value Corresponding Verbal Prediction
0.98–1.00 Proven; definitely true 0.90–0.98 Virtually certain; convinced 0.75–0.90 Highly probable; strongly believe; highly likely 0.60–0.75 Likely; probably true; about twice as likely to be true as untrue; chances are good0.40–0.60 Chances are about even, or slightly better than even or slightly less than even0.20–0.40 Could be true but more probably not; unlikely; chances are fairly poor; two or three times more likely to be untrue than true0.02–0.20 Possible but very doubtful; only a slight chance; very unlikely indeed; very improbable 0.00–0.02 Proven untrue; impossible
Table 1. Sherman-Kent Scale for Quantifying Subjective Probability Estimates (modified from Jones and Hillis, 2003)

Table 2. Databases of the value of mineral deposits
μ σ
Gold and BaseMetals Acquisitions
1993–2003
343 Metals EconomicsGroup
Large global datasetBroad spectrum of deposit stylesBroad range of commodity typesBroad spectrum of pre-mining projects at various stages of exploration
Project transaction prices in dollars of the day
2004 A$1 121.09 303.95
Australian GoldDiscoveries
1985–2002
59 Schodde (2003) Small Australian datasetNorrow range of gold deposit sylesRestricted commodity spectrum (gold ± copper)Restricted to projects that were actually minedCoherent data based on a single studyRobust methodology of compilation
NPV calculations based at the time of decision to mine, using constant A$550/oz and the tax rules of today
2003 A$ 85.85 193.12
Global CopperProjects
1992–2004
65 Leveille andDoggett (2006)
Small global datasetVarious copper deposit sylesRestricted commodity spectrum (copper, gold, silver, molybdenum, zinc, cobalt)Restricted to projects that were actually minedCoherent data based on a single studyRobust methodology of compilation
IRR and NPV calculations at discount rates of 8%, based on an effective tax rate of 30% and average metal prices over the period 1992-2004
2004 US$ 285.51 1748.80
1For the purpose of this study all transactions were grossed up to full project value and converted to Australian dollars of 2004Key to abbreviations: NPV = net present value; IRR = internal rate of return
Database Entries ParametersValuation Method CurrencyCharacteristicsSourcePeriod

Table 3. Definition of exploration stages (modified from Lord et al., 2001)
Stage Objective Milestones
A Project generation Select and acquire ground in well endowed beltsEstablish data base and management systemBuild an expert team for the belt
B Prospect definition (reconnaissance) Build area knowledgeTest presence of mineralizing systemDefine prospect risksDefine drillable targets
C Systematic drill testing of targets Establish size and grade potentialTest potential of mineralizing systemTest geologic informationTest geologic and mineralization models
D Resource delineation Test continuityEstablish controls on grade distribution
E Feasibility Establish economic / metallurgical parametersDetermine net present value (NPV)Determine project costs
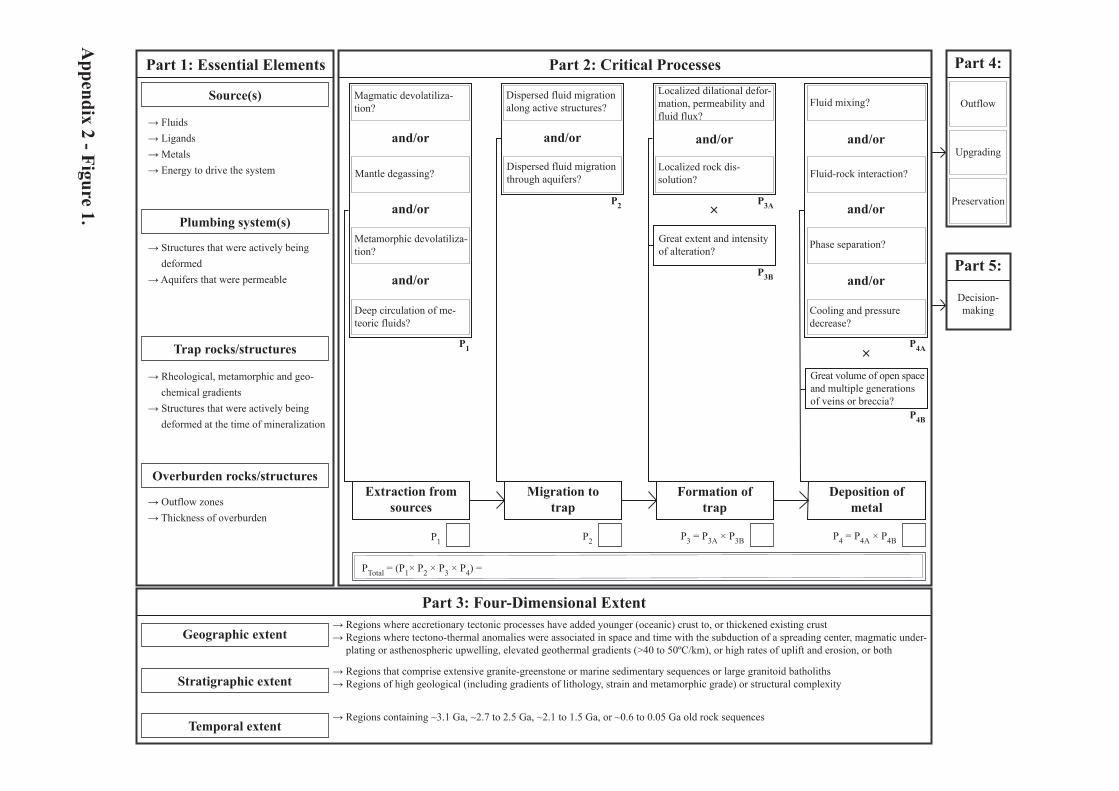
PTotal = (P1× P2 × P3 × P4) =
Extraction fromsources
Magmatic devolatiliza-tion?
Mantle degassing?
Metamorphic devolatiliza-tion?
Deep circulation of me-teoric fluids?
and/or
and/or
and/or
Migration totrap
P2 P3 = P3A × P3BP1
Deposition ofmetal
Formation oftrap
and/or
Localized dilational defor-mation, permeability andfluid flux?
Fluid mixing?
Fluid-rock interaction?
Phase separation?
Cooling and pressuredecrease?
and/or and/or
and/or
×
Part 2: Critical Processes
Localized rock dis-solution?
and/or×
Great extent and intensityof alteration?
P4 = P4A × P4B
P3A
P3B
P4B
P4A
Dispersed fluid migrationalong active structures?
Dispersed fluid migrationthrough aquifers?
Decision-making
Upgrading
Part 5:
Part 4:
Outflow
Preservation
→ Rheological, metamorphic and geo- chemical gradients→ Structures that were actively being deformed at the time of mineralization
→ Outflow zones→ Thickness of overburden
→ Fluids→ Ligands→ Metals→ Energy to drive the system
→ Structures that were actively being deformed→ Aquifers that were permeable
Part 1: Essential Elements
Source(s)
Plumbing system(s)
Trap rocks/structures
Overburden rocks/structures
→ Regions where accretionary tectonic processes have added younger (oceanic) crust to, or thickened existing crust→ Regions where tectono-thermal anomalies were associated in space and time with the subduction of a spreading center, magmatic under- plating or asthenospheric upwelling, elevated geothermal gradients (>40 to 50ºC/km), or high rates of uplift and erosion, or both
→ Regions containing ~3.1 Ga, ~2.7 to 2.5 Ga, ~2.1 to 1.5 Ga, or ~0.6 to 0.05 Ga old rock sequences
→ Regions that comprise extensive granite-greenstone or marine sedimentary sequences or large granitoid batholiths→ Regions of high geological (including gradients of lithology, strain and metamorphic grade) or structural complexity
Part 3: Four-Dimensional Extent
Stratigraphic extent
Temporal extent
Geographic extent
Appendix 2 - Figure 1.
Great volume of open spaceand multiple generationsof veins or breccia?
P2
P1

PTotal = (P1× P2 × P3 × P4) =
Extraction fromsources
Melting at convergentmargin?
Migration totrap
P2 = P2A × P2B P3 = P3A × P3BP1
Deposition ofmetal
Formation oftrap
×
Dilational deformation,permeability and fluid fluxfocused on intrusion?
Fluid mixing?
Fluid-rock interaction?
Boiling?
Cooling and pressure de-crease?
and/or
and/or
×
Part 2: Critical Processes
and/or
×
Great volume of open spaceand multiple generationsof veins or breccia?
Great extent and intensityof alteration?
P4 = P4A × P4B
P3A
P3B
P2A
P2B
P4B
P4A
Emplacement of finger-,sill- or dike-like intrusionor inrusions?
Volatile exsolution (firstand second boiling)?
Decision-making
Upgrading
Part 5:
Part 4:
Outflow
Preservation
→ Rheological, metamorphic and geo- chemical gradients→ Structures that were actively being deformed at the time of mineralization
→ Outflow zones→ Thickness of overburden
→ Melts→ Fluids→ Ligands→ Metals→ Energy to drive the system
→ Structures that were actively being deformed→ Magma chambers and conduits
Part 1: Essential Elements
Source(s)
Plumbing system(s)
Trap rocks/structures
Overburden rocks/structures
→ Regions where accretionary tectonic processes added continental or oceanic crust→ In particular, magmatic/volcanic arcs that recorded: (1) collision with or subduction of ridges, seamounts or plateaus; (2) changes from orthogonal to oblique, or high- to low-angle subduction; (3) arc polarity reversals; or (4) significant uplift and erosion
→ Volcanic/magmatic arcs of Tertiary, or, to a lesser degree, Permian to Cretaceous age; older examples are rare
→ Spatial association with high-level, porphyritic, finger-, sill- or dike-like intrusions that: (1) form part of composite, compositionally heterogeneous stocks; (2) are alkaline, calc-alkaline or shoshonitic, and of felsic, intermediate or mafic composition; and (3) are connected to deeper-level magma staging chambers, such as large intrusions or batholiths
Part 3: Four-Dimensional Extent
Stratigraphic extent
Temporal extent
Geographic extent
Appendix 2 - Figure 2.
P1

PTotal = (P1× P2 × P3 × P4) =
Extraction fromsources
Melting of mantle source?
Migration totrap
P2 = P2A × P2B P3 = P3A × P3BP1
Deposition ofmetal
Formation oftrap
Segregation and con-centration of liquidsulfide?
Part 2: Critical Processes
P4 = P4A × P4B × P4C
P4B
P4A
P4C
Sulfur contamination?
Magma mixing?
P2A
Fractional crystallization?
Decision-making
Upgrading
Part 5:
Part 4:
Outflow
Preservation
→ Rheological, metamorphic and geo- chemical gradients→ Magma chambers and conduits→ Structures that were actively being deformed at the time of mineralization
→ Outflow zones→ Thickness of overburden
→ Mantle-derived, differentiated, Mg-rich, mafic to ultramafic melts→ Ligands→ Metals→ Energy to drive the system
→ Structures that were actively being deformed→ Magma chambers and conduits
Part 1: Essential Elements
Source(s)
Plumbing system(s)
Trap rocks/structures
Overburden rocks/structures
→ Intracontinental rift and rifted continetal margin regions where long-lived melting in the mantle triggered multiple episodes of vo- luminous mafic to ultramafic melt emplacement into the crust that formed large igneous provinces
→ Regions containing Phanerozic intrusive and extrusive rocks
→ Differentiated, mafic to ultramafic, olivine-rich intrusive bodies of troctolitic, picritic, harzburgitic or dunitic composition that: (1) formed part of dynamic magma systems; (2) formed part of large igneous provinces; (3) are located at or close to regional-scale fault zones; and (4) are hosted by sulfide-bearing country rocks
Part 3: Four-Dimensional Extent
Stratigraphic extent
Temporal extent
Geographic extent
and/or
and/or
×Potential host intrusionfully differentiated?
P2B
Localized dilational defor-mation, permeability andfluid flux?
Localized stoping or ther-mal erosion?
Change of orientation,morphology or width ofmagma conduit?
Entry of a magma conduitat base of a magmachamber/intrusion?
and/or
and/or
×
and/or
Great extent and intensityof metasomatism?
P3B
P3A
×
×
Extensive zones of highsulfide : rock ratio; greatvolume of open space?
Partitioning of Ni, ±Cu,±PGE (from new magma)into liquid sulfide?
Appendix 2 - Figure 3.
P1

PTotal = (P1× P2 × P3 × P4) =
Extraction fromsources
and/or
Migration totrap
P2 P3 = P3A × P3BP1
Deposition ofmetal
Formation oftrap
and/or
Localized dilational defor-mation, permeability andfluid flux?
Fluid mixing?
Fluid-rock interaction?
and/or and/or
and/or
×
Part 2: Critical Processes
Localized rock dis-solution?
and/or
×
Great extent and intensityof alteration?
P4 = P4A × P4B
P3A
P3B P4B
P4A
Decision-making
Upgrading
Part 5:
Part 4:
Outflow
Preservation
→ Rheological, metamorphic and geo- chemical gradients→ Structures that were actively being deformed at the time of mineralization→ Large replenishable reservoirs for sustaining physico-chemical processes
→ Outflow zones→ Seal rocks overlying aquifers
→ Fluids (i.e., brines)→ Ligands→ Metals→ Energy to drive the system
→ Structures (for discharge/recharge) that were actively being deformed→ Thick, laterally extensive, moderately permeable aquifers→ Single, large system of energy and mass flux
Part 1: Essential Elements
Source(s)
Plumbing system(s)
Trap rocks/structures
Overburden rocks/structures
→ Regions where multiple episodes of extension produced large, long-lived, compartmentalized rift-sag basins (i.e., continental margin/ back-arc or intracontinental settings), and within palaeolatitudes that were favorable for brine and carbonate generation→ Areas at or close to long-lived, regional-scale, basin-penetrating fault zones
→ Basins of Palaeoproterozic and Cambrian to Carboniferous age
→ Organic carbonaceous siltstone or shale sequences (SEDEX-type), or stratigraphically lowermost carbonate sequences
Part 3: Four-Dimensional Extent
Stratigraphic extent
Temporal extent
Geographic extent
Intrabasinal (permeable,metal-rich basement fill)?
Topographically drivenfluid flow along aquifersand active structures?
Convection of fluid flowalong aquifers and activestructures?
Extrabasinal (metal-richbasement rocks)?
Cooling, pH increase oraddition of H2S?
Thermochemical or bio-genic sulfate reduction?
Replacement of undercom-pacted shale horizons orpetroleum accumulations?
Sea-floor depression nextto or near regional-scalefault zone?
Repetition, great volumeand continuity ofprospective horizons?
and/or
and/or
Appendix 2 - Figure 4.
P2P1