quantitative trait loci conferring grain mineral...
TRANSCRIPT

Quantitative trait loci conferring grain mineral nutrientconcentrations in durum wheat 3 wild emmerwheat RIL population
Zvi Peleg Æ Ismail Cakmak Æ Levent Ozturk ÆAtilla Yazici Æ Yan Jun Æ Hikmet Budak ÆAbraham B. Korol Æ Tzion Fahima Æ Yehoshua Saranga
Abstract Mineral nutrient malnutrition, and particularly
deficiency in zinc and iron, afflicts over 3 billion people
worldwide. Wild emmer wheat, Triticum turgidum ssp.
dicoccoides, genepool harbors a rich allelic repertoire for
mineral nutrients in the grain. The genetic and physiolog-
ical basis of grain protein, micronutrients (zinc, iron,
copper and manganese) and macronutrients (calcium,
magnesium, potassium, phosphorus and sulfur) concentra-
tion was studied in tetraploid wheat population of 152
recombinant inbred lines (RILs), derived from a cross
between durum wheat (cv. Langdon) and wild emmer
(accession G18-16). Wide genetic variation was found
among the RILs for all grain minerals, with considerable
transgressive effect. A total of 82 QTLs were mapped for
10 minerals with LOD score range of 3.2–16.7. Most QTLs
were in favor of the wild allele (50 QTLs). Fourteen pairs
of QTLs for the same trait were mapped to seemingly
homoeologous positions, reflecting synteny between the A
and B genomes. Significant positive correlation was found
between grain protein concentration (GPC), Zn, Fe and Cu,
which was supported by significant overlap between the
respective QTLs, suggesting common physiological and/or
genetic factors controlling the concentrations of these
mineral nutrients. Few genomic regions (chromosomes 2A,
5A, 6B and 7A) were found to harbor clusters of QTLs for
GPC and other nutrients. These identified QTLs may
facilitate the use of wild alleles for improving grain
nutritional quality of elite wheat cultivars, especially in
terms of protein, Zn and Fe.
Introduction
Mineral nutrients play a fundamental role in the biochem-
ical and physiological functions of biological systems.
While higher plants obtain their mineral nutrients primarily
from the soil, animal and humans depend mostly on higher
plants to supply them with mineral nutrients (Grusak and
Cakmak 2005). Mineral nutrient malnutrition, and particu-
larly deficiency in Zn and Fe, afflicts over 3 billion people
worldwide (Welch and Graham 2004), resulting in overall
poor health, anemia, increased morbidity and mortality
rates, and low worker productivity (Cakmak 2002; Hotz and
Brown 2004; Sanchez and Swaminathan 2005). Recently, it
has been declared that micronutrient deficiency problems
are high priority research area, and their elimination will
greatly benefit humanity and contribute to global stability
(http://www.copenhagenconsensus.com). Enhancement in
grain concentrations of mineral nutrients (biofortification),
agronomically and/or genetically, is considered the most
promising and cost effective approach to alleviate malnu-
trition and related health problems (Bouis 2003; Welch and
Graham 2004; Cakmak 2008; Peleg et al. 2008a). This
Communicated by D. Hoisington.
Z. Peleg � Y. Jun � Y. Saranga (&)
The Robert H. Smith Institute of Plant Science and Genetics
in Agriculture, The Hebrew University of Jerusalem,
P.O. Box 12, 76100 Rehovot, Israel
e-mail: [email protected]
Z. Peleg � Y. Jun � A. B. Korol � T. Fahima
Department of Evolutionary and Environmental Biology,
Faculty of Science and Science Education,
The Institute of Evolution, University of Haifa,
31905 Haifa, Israel
I. Cakmak � L. Ozturk � A. Yazici � H. Budak
Faculty of Engineering and Natural Sciences,
Sabanci University, 34956 Istanbul, Turkey

solution, however, requires a comprehensive exploration of
potential genetic resources and an in-depth understanding
of the physiological and genetic basis of mineral nutrients
accumulation in staple food crop.
High seed concentrations of mineral nutrients are a key
factor for vigorous germination and successful seedling
establishment (Welch 1999; Yilmaz et al. 1998). The
amount of minerals in the seed depends on a plethora of
processes including absorption from soil, uptake by the
roots, translocation and redistribution within the plant tis-
sues and remobilization to the seed (Grusak and Cakmak
2005). Each of these processes is most likely controlled by
many genes, which makes the accumulation of minerals in
seeds a complex polygenic phenomenon. The advent of
molecular markers enables to dissect such complex traits
via analysis of quantitative trait loci (QTLs). The identifi-
cation of QTLs for grain mineral nutrients can accelerate
crop improvement through marker-assisted selection and
eventually can lead to QTL cloning (Salvi and Tuberosa
2005).
Wheat (Triticum spp.) is the major staple food crop in
many parts of the world in terms of cultivated area and
food source, contributing 28% of the world edible dry
matter and up to 60% of the daily calorie intake in several
developing countries (FAOstat 2007). Therefore, the
composition and nutritional quality of the wheat grain has
a significant impact on human health and well-being,
especially in the developing world. However, the joint
effects of domestication and its associated evolutionary
phenomena (i.e., founder effect) following modern
breeding processes has eroded the genetic basis of crop
species (Ladizinsky 1998; Tanksley and McCouch 1997).
Domesticated wheat contains very low levels of minerals
and shows a narrow genetic variation as compared with its
wild relatives (Cakmak 2008). Using crosses between
cultivated and wild species of inbreeding plants, alleles
that were ‘‘left behind’’ during the domestication process
may be reintroduced into the cultivated genepool
(McCouch 2004) for the improvement of grain mineral
nutrients.
Wild emmer wheat [T. turgidum ssp. dicoccoides (korn.)
Thell] is the tetraploid (2n = 4x = 28; genome BBAA)
progenitor of both domesticated tetraploid durum wheat
[T. turgidum ssp. durum (Desf.) MacKey] and hexaploid
(2n = 6x = 42; BBAADD) bread wheat (T. aestivum L.)
(Feldman 2001). Wild emmer germplasm harbors a rich
allelic repertoire for improving grain concentrations of
micro- and macronutrients in cultivated wheats (Cakmak
et al. 2004; Peleg et al. 2008a). A recombinant-inbred line
(RIL) population, derived from a cross between durum
wheat and wild emmer, was used in the current study to (1)
determine the chromosomal location and phenotypic
effects of QTLs associated with wheat grain mineral
nutrient concentration; (2) study the phenotypic and
genotypic association between the various grain minerals;
and (3) identify potential alleles form the wild for future
wheat improvement.
Materials and methods
Plant material and growth conditions
A population of 152 F6 RILs was developed by single-seed
decent from a cross between durum wheat (cultivar
Langdon; LDN hereafter) and wild emmer wheat (acces-
sion #G18-16) (Peleg et al. 2008b). The RIL population
was tested in the field under three environments over
2 years in the experimental farm of The Hebrew University
of Jerusalem in Rehovot, Israel (34�470N, 31�540E; 54 m
above sea level). The soil at this location is brown-red
degrading sandy loam (Rhodoxeralf, American Soil
Science Society classification) composed of 76% sand, 8%
silt and 16% clay. Seeds were disinfected (3.6% Sodium
Hypochloric acid, for 10 min) and placed for vernalization
on a moist germination paper for 3 weeks in a dark cold
room (4�C), followed by 3 days of acclimation at room
temperature. Seedlings were then transplanted into an
insect-proof screenhouse protected by a polyethylene top.
Water was applied via a drip irrigation system during the
winter months (December–April) to mimic the natural
pattern of rainfall in the east Mediterranean region. Plants
were treated with pesticides to avoid development of
pathogens or insect pests and weeded manually once a
week. In the winter of 2004–2005, two irrigation regimes
were applied: well-watered (750 mm) control (WW05) and
water-limited (350 mm) (WL05), using a split-plot facto-
rial (RIL 9 irrigation regime) block design with irrigation
regimes in main plots and genotypes in sub-plots. In the
winter of 2006–2007, well-watered (720 mm) treatment
(WW07) was applied, using a randomized block design.
Each trial was three times replicated with 75 cm long plots,
each consisting of five plants.
Phenotypic measurements
Each plot was harvested as soon as over 50% of the plants
reached maturity to minimize seed dispersal. All spikes
were harvested, oven-dried (35�C for 48 h) and weighed. A
sub-sample of the harvested spikes from each plot (about
20–30 g) was threshed. Grains of each sub-sample were
weighed, used to calculate grain yield (GY) and subjected
to mineral analyses. Nitrogen in the grain was determined
by using a C/N analyzer (TruSpec CN, Leco Co., USA).
Grain nitrogen concentration was multiplied by 5.83 to
obtain grain protein concentration (GPC) (Merrill and Watt

1973). Grain macronutrients (calcium, Ca; magnesium,
Mg; potassium, K; phosphorus, P; and sulfur, S) and
micronutrients (zinc, Zn; iron, Fe; copper, Cu; and man-
ganese, Mn) concentrations were determined by induc-
tively coupled plasma-optical emission spectroscopy (ICP-
OES; Vista-Pro Axial; Varian Pty Ltd, Australia), after
digesting samples in a closed microwave system. Mea-
surements of mineral nutrients were checked using the
certified values of the related minerals in the reference leaf
and grain samples received from the National Institute of
Standards and Technology (NIST; Gaithersburg, MD,
USA).
Statistical analysis of phenotypic data
The JMP� ver. 7.0 statistical package (SAS Institute, Cary,
NC, USA) was used for statistical analyses. All phenotypic
variables were tested for normal distribution. A factorial
model was employed for the analysis of variance, with
RILs and blocks as random effects and the trail as a fixed
effect. Broad sense heritability estimate (h2) was calculated
for each trait across three irrigation regimes using variance
components estimated based on ANOVA:
h2 ¼ r2g=ðr2
g þ r2g�e=eÞ
where r2g ¼ ½ðMSRIL �MSRIL�eÞ=e�, r2
g�e ¼ MSRIL�e and
e is the number of environments and MS is the mean
square. Correlation analyses were used to assess the asso-
ciation among the various grain minerals under each
environment. Principal component analysis (PCA) was
used to determine the associations among the ten grain
mineral concentrations. PCA was based on a correlation
matrix and was presented as biplot ordinations of popula-
tions (PC scores). Two components were extracted using
Eigenvalues [1 to ensure meaningful implementation of
the data by each factor.
QTL analysis
A genetic linkage map of 2,317 cM was previously devel-
oped for the 152 RIL mapping population based on 197 SSR
and 493 DArT markers (Peleg et al. 2008b). DArT markers
that were presented in the above map by clone ID numbers,
were renamed with the prefix ‘‘wPt’’, ‘‘rPt’’ or ‘‘tPt’’ (cor-
responding to wheat, rye or Triticale, respectively) followed
by number. A skeleton map comprised of 307 markers,
scattered along the 14 chromosomes (Chr) of tetraploid
wheat (one marker per 7.5 cM) was used for QTL mapping.
QTL analysis was performed with the MultiQTL package
using the general interval mapping for the RIL-selfing
population (describe in Peleg et al. 2009). To examine
G 9 E interaction, the three-environment QTL model was
compared against a sub-model assuming an equal effect of
all environments, using 5,000 permutation tests (such
comparison was not applicable in case of a two-QTL
solution). The effect of epistatic interaction was examined
for each trait by comparison of H0 (e = 0), i.e., additive
effects of the QTL and H1 (e = 0), i.e., assuming epistasis
(Ronin et al. 1999).
Correspondence between QTLs of different traits was
determined using the hypergeometric probability function
(Larsen and Marx 1985) according to Paterson et al.
(1995):
P ¼
lm
� �n� ls� m
� �
ns
� �
where n is the number of comparable intervals; m is the
number of ‘matches’ (QTLs of two traits with [50%
overlap of their confidence intervals) declared between
QTLs; l is the number of QTLs found in the larger sample
and s is the number of QTLs found in the smaller sample.
Results
Phenotypic diversity for grain mineral concentrations
Table 1 presents the mean values, ranges, and heritability
estimates of ten grain mineral nutrient concentrations of the
two parental lines and the RILs under each of the three
environments. Analysis of variance (ANOVA) indicated a
high level (P \ 0.05) of genetic variation for all mineral
nutrients analyzed as well as environmental effects (not
shown). All variables under each of the environments
exhibited normal distribution. Transgressive segregation
was common among all traits (Table 1). For example, the
highest levels of Zn among the RILs were 46–79% greater
than those of their domesticated parental line. Broad-sense
heritability estimates (h2) indicates the proportion of phe-
notypic variance attributable to genotypic difference.
Estimates of h2 for grain mineral concentration ranged
from 0.41 (for Mn) to 0.79 (for Ca) (Table 1).
Principal component analysis (PCA) revealed similar
patterns when applied for each environment separately (not
shown), therefore, a joint PCA was conducted based on
genotype means across all environments (Fig. 1). PCA
extracted two major principal components (Eigenvalues
[1) that accounted collectively for 57.8% of the variation.
Principal component 1 (PC1, X-axis, Fig. 1) explained
44.0% of the variation among RILs, and was loaded pos-
itively with GPC, Zn, Fe, P, Mg, Ca, Cu and S. PC2
(Y-axis, Fig. 1) explained 13.8% of the RILs variation, and

was positively loaded with K and Ca and negatively loaded
with Zn and Fe. The PCA showed strong associations
between GPC, Zn and Fe (Fig. 1). This association was
supported by the high and positive correlations between
these variables. Grain Zn concentration correlated with
grain Fe concentration (r = 0.72, P B 0.0001, r = 0.79,
P B 0.0001 and r = 0.69, P B 0.0001 for WL05, WW05
and WW07, respectively), GPC correlated with Zn
(r = 0.58, P B 0.0001; r = 0.48, P B 0.0001; and
r = 0.41, P B 0.0001, respectively), and GPC with Fe
(r = 0.52, P B 0.0001; r = 0.49, P B 0.0001; and
r = 0.33, P B 0.0001, respectively). Strong association
was also found between Cu and GPC, Zn and Fe and
between Mg and P (Fig. 1).
Major characteristics of the detected QTLs
Eighty-two significant QTLs, scattered across all the 14
chromosomes of the tetraploid wheat, were detected for
grain protein and nine grain mineral nutrient concentrations
characterized under three environments (Table 2). In 50
QTLs (61%) the wild allele (G18-16) contributed to
improved grain mineral concentrations and in the remain-
ing 32 QTLs (39%) the domesticated allele (LDN) was
favorable. Thirty-eight QTLs exhibited G 9 E interaction,
of which 25 QTLs were detected under all environments
(in one case two environments) with different effects and
13 QTLs were detected under one environment, whereas
the remaining 44 QTLs (54%) showed no interaction withTa
ble
1M
ean
val
ues
,ra
ng
esan
dh
erit
abil
ity
esti
mat
es(h
2)
of
gra
inp
rote
inco
nce
ntr
atio
nan
dn
ine
gra
inm
iner
aln
utr
ien
tco
nce
ntr
atio
ns
of
15
2re
com
bin
ant
inb
red
lin
es(L
ang
do
n9
G1
8-1
6)
asw
ell
asth
etw
op
aren
tal
lin
esu
nd
erea
chen
vir
on
men
tal
con
dit
ion
s
Tra
itW
ater
-lim
ited
20
05
Wel
l-w
ater
ed2
00
5W
ell-
wat
ered
20
07
h2
RIL
sL
DN
G1
8-1
6R
ILs
LD
NG
18
-16
RIL
sL
DN
G1
8-1
6
Mea
nR
ang
eM
ean
Ran
ge
Mea
nR
ang
e
GP
C(%
)2
4.1
19
.8–
29
.22
3.2
25
.52
0.7
12
.6–
27
.21
8.9
25
.01
6.0
12
.9–
21
.11
4.1
20
.40
.63
Zn
(mg
/kg
-1)
74
.94
8.5
–1
14
.76
5.7
75
.06
0.1
39
.0–
10
5.0
58
.78
9.0
55
.93
9.0
–7
8.0
53
.55
5.5
0.6
2
Fe
(mg
/kg
-1)
51
.43
6.0
–7
0.0
58
.05
2.8
42
.32
9.7
–8
0.5
45
.75
9.8
25
.31
7.0
–4
1.0
17
.73
1.8
0.6
9
Cu
(mg
/kg
-1)
6.7
5.0
–1
0.0
7.0
7.3
6.1
4.0
–8
.55
.33
8.3
7.7
5.4
–1
1.7
7.2
7.7
0.7
6
Mn
(mg
/kg
-1)
56
.52
4.5
–1
04
.06
8.0
61
.85
5.9
31
.0–
91
.55
7.3
36
9.5
27
.31
6.3
–4
1.0
28
.52
7.5
0.4
1
Ca
(mg
/kg
-1)
58
4.9
40
3.0
–8
13
.05
63
.76
45
.24
70
.32
69
.0–
69
7.3
46
6.1
61
0.6
40
0.7
26
9.7
–5
78
.03
36
.84
14
.40
.79
Mg
(mg
/kg
-1)
1,4
76
.21
,29
1.0
–1
,74
1.3
1,5
45
.01
,56
1.4
1,4
92
.11
,25
8.0
–1
,73
7.5
1,4
36
1,6
29
.01
,57
6.9
1,3
33
.1–
1,8
21
.91
,46
9.0
1,8
02
.50
.74
K(m
g/k
g-
1)
5,1
03
.34
,08
4.0
–6
,44
6.0
5,3
78
.04
,58
3.0
4,5
20
.93
,66
0.0
–6
,56
8.7
4,4
30
4,5
41
.04
,61
5.9
3,9
26
.5–
5,7
54
.54
,15
3.0
5,1
36
.00
.58
P(m
g/k
g-
1)
5,4
10
.24
,39
0.0
–6
,41
5.0
5,5
66
.05
,36
5.0
4,8
93
.23
,61
4.0
–5
,77
8.7
5,0
05
5,1
83
.74
,77
6.6
4,0
08
.1–
5,4
16
.54
,45
8.0
5,1
75
.30
.62
S(m
g/k
g-
1)
2,2
78
.51
,83
4.5
–2
,77
4.
72
,31
7.0
2,6
31
.02
,09
1.4
1,7
25
.3–
2,5
99
.02
,03
02
,39
9.2
1,6
70
.21
,32
1.6
–2
,05
8.6
1,5
64
.02
,00
4.7
0.7
6
-0.5
0.0
0.5
PC
2 (
13.8
%)
GPC
ZnFe
K
PMg
S
Ca
Mn
Cu
-0.5 0.0 0.5
PC1 (44.0%)
Fig. 1 Principal component analysis (based on correlation matrix) of
grain protein and nine mineral nutrient concentrations in 152
recombinant inbred lines (Langdon 9 G18-16) under three environ-
ments. Biplot vectors are trait factor loadings for PC1 and PC2
environmental conditions. No significant two-locus epis-
tasis was found between any of the QTLs controlling any
of the ten traits.
QTLs detected for each trait
Detailed biometric parameters of QTLs detected for each
of the traits are as follows:
Grain protein concentration: A total of ten significant
QTLs were associated with GPC with LOD (log of the
odds) scores ranging between 3.2–10.4, explaining 1–14%
of the variance (Tables 2, 3). Higher GPC was conferred by
the G18-16 allele at eight loci (2A, 2B, 4A, 5A, 5B, 6A,
6B, 7A) and by the LDN allele at two loci (3B, 7B). Six
QTLs showed significant G 9 E interaction, one of them
(2A) exhibited similar trend across environments, two
QTLs (5A, 5B) exhibited a contrasting effect in one of the
three environments, two QTLs (2B, 7B) were found only
under WW05 and one (6A) under the WW07 environment.
Grain zinc concentration A total of six significant QTLs
were associated with Zn with LOD scores ranging between
3.7 and 16.4, explaining 1–23% of the variance (Tables 2,
3). Higher Zn was conferred by the G18-16 allele at five
loci (2A, 5A, 6B, 7A, 7B) and by the LDN allele at one
locus (2A). Three QTLs showed significant G 9 E inter-
action, 2 of them (5A, 6B) showed a similar trend across
environments and one QTL (7B) was found only under the
WL05 environment.
Grain iron concentration A total of 11 significant QTLs
were associated with Fe with LOD scores ranging between
4.6 and 16.7 explaining 2–18% of the variance (Tables 2,
3). Higher Fe was conferred by the G18-16 allele at five
loci (2A, 3B, 5A, 6B, 7A) and by the LDN allele at six loci
(2A, 2B, 3A, 4B, 6A, 7B). Five QTLs showed significant
G 9 E interaction, 2 of them (5A, 6A) exhibited a similar
trend across environments, one (3A) had a contrasting
effect in one of the three environments, and 2 QTLs (3B,
4B) were found only under the WW07 environment.
Grain copper concentration A total of ten significant
QTLs were associated with Cu with LOD scores ranging
between 4.9 and 10.4, explaining 1–13% of the variance
(Tables 2, 3). Higher Cu was conferred by the G18-16
allele at six loci (2A, 4A, 4B, 5A, 6B, 7A) and by the LDN
allele at four loci (1A, 3B, 6A, 7B). Four QTLs (5A, 6B,
7A, 7B) showed significant G 9 E interaction with a
similar trend across environments.
Grain manganese concentration A total of two signifi-
cant QTLs were associated with Mn with LOD scores of
3.9–4.1, explaining 11–14% of the variance (Tables 2, 3).
In both QTLs higher Mn was conferred by the LDN allele.
These 2 QTLs exhibited significant G 9 E interaction,
both found only under WW07.
Grain calcium concentration A total of nine significant
QTLs were associated with Ca with LOD scores ranging
between 5.9 and 16.0, explaining 1–21% of the variance
(Tables 2, 3). Higher Ca was conferred by the G18-16 allele
at four loci (1A, 4A, 5B, 6B) and by the LDN allele at five
loci (2B, 4B, 6A, 6B, 7B). Two QTLs showed significant
G 9 E interaction (2B, 4B), one of them (2B) exhibited a
similar trend across environments, and one QTL (4B) was
found only under the WW05 and WW07 environments.
Grain magnesium concentration A total of eight sig-
nificant QTLs were associated with Mg with LOD scores
ranging between 5.0 and 9.8, explaining 1.1–17% of the
variance (Tables 2, 3). Higher Mg was conferred by the
G18-16 allele at six loci (1B, 2A, 3A, 5B, 6B, 7B) and by
the LDN allele at two loci (6A, 7A). Four QTLs showed
significant G 9 E interaction, three of them (2A, 3A, 5B)
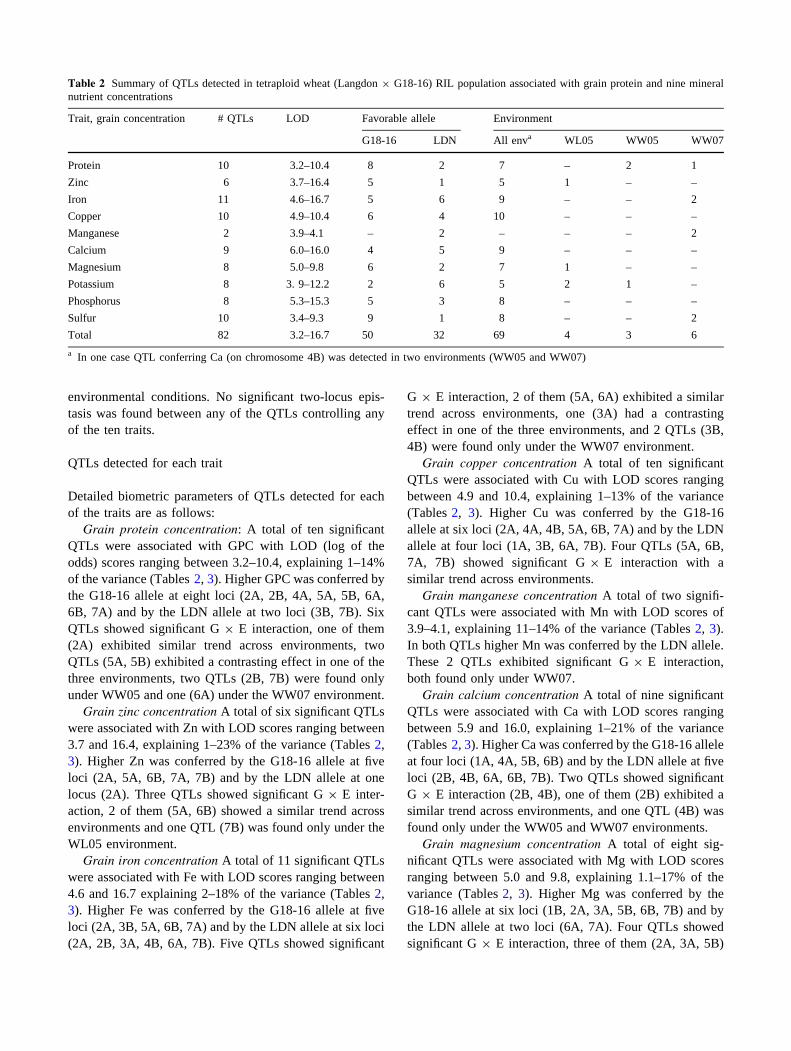
Table 2 Summary of QTLs detected in tetraploid wheat (Langdon 9 G18-16) RIL population associated with grain protein and nine mineral
nutrient concentrations
Trait, grain concentration # QTLs LOD Favorable allele Environment
G18-16 LDN All enva WL05 WW05 WW07
Protein 10 3.2–10.4 8 2 7 – 2 1
Zinc 6 3.7–16.4 5 1 5 1 – –
Iron 11 4.6–16.7 5 6 9 – – 2
Copper 10 4.9–10.4 6 4 10 – – –
Manganese 2 3.9–4.1 – 2 – – – 2
Calcium 9 6.0–16.0 4 5 9 – – –
Magnesium 8 5.0–9.8 6 2 7 1 – –
Potassium 8 3. 9–12.2 2 6 5 2 1 –
Phosphorus 8 5.3–15.3 5 3 8 – – –
Sulfur 10 3.4–9.3 9 1 8 – – 2
Total 82 3.2–16.7 50 32 69 4 3 6
a In one case QTL conferring Ca (on chromosome 4B) was detected in two environments (WW05 and WW07)

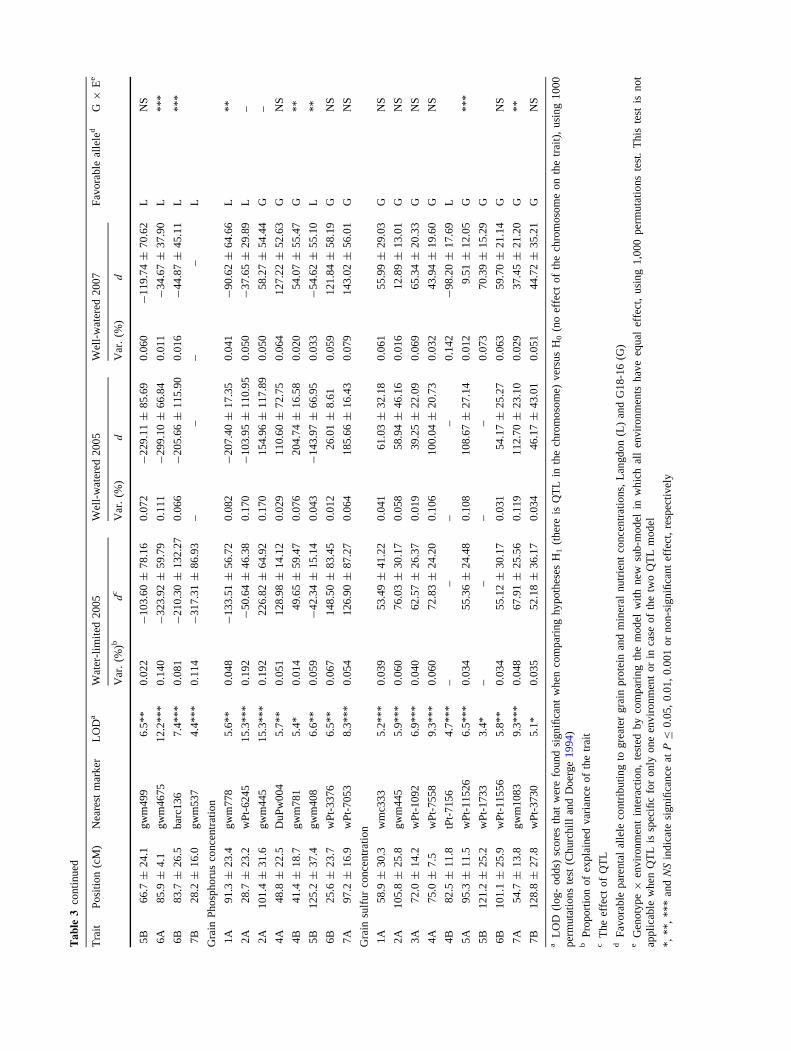
Ta
ble
3B
iom
etri
cal
par
amet
ers
of
QT
Ls
affe
ctin
gg
rain
pro
tein
and
gra
inm
iner
aln
utr
ien
tco
nce
ntr
atio
ns
inte
trap
loid
wh
eat
RIL
po
pu
lati
on
(LD
N9
G1
8-1
6)
Tra
itP
osi
tio
n(c
M)
Nea
rest
mar
ker
LO
Da
Wat
er-l
imit
ed2
00
5W
ell-
wat
ered
20
05
Wel
l-w
ater
ed2
00
7F
avo
rab
leal
lele
dG
9E
e
Var
.(%
)bd
cV
ar.
(%)
dV
ar.
(%)
d
Gra
inp
rote
inco
nce
ntr
atio
n
2A
11
1.3
±2
1.4
gw
m4
45
7.9
**
*0
.13
71
.20
±0
.55
0.0
36
0.6
3±
0.4
40
.00
90
.02
±0
.28
G*
*
2B
95
.4±
13
.8g
wm
12
49
4.4
**
*–
–0
.09
01
.10
±0
.43
––
G
3B
14
8.1
±3
1.4
gw
m7
05
5.
7*
*0
.01
9-
0.3
6±
0.3
30
.03
7-
0.3
0±
0.7
10
.07
5-
0.4
3±
0.6
7L
NS
4A
77
.2±
12
.9w
Pt-
75
58
5.9
**
0.0
24
0.4
6±
0.3
20
.09
71
.21
±0
.35
0.0
12
0.1
4±
0.3
1G
NS
5A
11
.8±
15
.1g
wm
15
46
.4*
**
0.0
36
-0
.61
±0
.31
0.0
51
0.8
6±
0.3
00
.07
10
.76
±0
.31
G*
*
5B
14
9.3
±2
1.5
wP
t-1
15
79
6.0
**
0.0
19
0.3
9±
0.3
10
.02
8-
0.3
5±
0.5
70
.08
50
.86
±0
.27
G*
**
6A
57
.1±
22
.1tP
t-4
20
93
.2*
––
––
0.0
92
0.7
4±
0.3
3G
6B
95
.7±
11
.9g
wm
77
11
0.4
**
*0
.12
01
.22
±0
.27
0.0
61
0.9
5±
0.3
00
.03
80
.56
±0
.22
GN
S
7A
10
1.2
±1
0.9
gw
m3
32
6.9
**
*0
.05
60
.81
±0
.33
0.0
30
0.6
1±
0.3
50
.09
60
.93
±0
.24
GN
S
7B
22
.9±
11
.5g
wm
26
33
.4*
––
0.0
79
-1
.08
±0
.27
––
L
Gra
inzi
nc
con
cen
trat
ion
2A
68
.3±
44
.0w
Pt-
82
16
10
.5*
**
0.1
16
-5
.63
±6
.42
0.1
54
-5
.19
±4
.54
0.1
09
-3
.42
±4
.45
L–
2A
11
2.4
±3
5.0
gw
m4
45
10
.5*
**
0.1
16
4.9
3±
7.6
30
.15
42
.01
±6
.19
0.1
09
2.8
2±
4.4
4G
–
5A
25
.8±
22
.0g
wm
29
35
.2*
*0
.03
33
.54
±3
.05
0.0
93
5.2
3±
1.4
30
.01
30
.64
±1
.42
G*
*
6B
13
3.5
±4
8.6
gw
m1
07
65
.3*
0.0
49
4.5
5±
3.3
20
.05
43
.11
±2
.71
0.0
22
0.7
3±
2.1
1G
*
7A
65
.8±
4.6
wP
t-9
55
51
6.4
**
*0
.09
05
.35
±2
.24
0.1
57
6.9
1±
1.3
40
.23
57
.54
±1
.29
GN
S
7B
94
.8±
18
.6g
wm
98
33
.7*
0.1
10
8.5
0±
1.9
7–
––
–G
Gra
inir
on
con
cen
trat
ion
2A
60
.1±
20
.1g
wm
47
31
2.2
**
*0
.12
0-
3.3
4±
3.2
30
.11
7-
3.0
6±
2.3
20
.08
4-
1.6
9±
1.6
2L
–
2A
95
.4±
32
.2g
wm
10
54
12
.2*
**
0.1
20
3.5
5±
2.9
50
.11
71
.68
±2
.85
0.0
84
0.5
4±
1.3
0G
–
2B
12
2.2
±2
0.1
wP
t-8
40
46
.4*
*0
.06
0-
3.1
9±
1.5
80
.02
7-
1.6
3±
0.9
50
.03
1-
1.1
3±
0.9
8L
NS
3A
25
.1±
28
.2w
Pt-
27
56
5.0
*0
.02
1-
1.6
1±
1.3
20
.04
02
.00
±1
.42
0.0
17
-0
.03
±1
.11
L*
3B
19
6.3
±1
5.1
gw
m1
26
64
.6*
**
––
––
0.0
94
2.2
7±
0.9
3G
4B
14
.3±
4.3
wP
t-3
25
56
.8
**
*–
––
–0
.12
3-
2.7
5±
0.4
9L
5A
7.5
±6
.2g
wm
15
49
.0*
**
0.0
23
1.9
8±
0.9
90
.14
64
.28
±0
.67
0.0
08
0.2
4±
0.2
3G
*
6A
66
.9±
22
.5g
wm
11
50
6.7
**
0.0
88
-4
.01
±1
.42
0.0
29
-1
.39
±0
.95
0.0
27
-1
.03
±0
.95
L*
6B
16
0.5
±2
5.2
wP
t-5
27
08
.2*
**
0.0
48
2.9
7±
2.2
30
.06
82
.76
±1
.04
0.0
28
1.1
3±
0.8
6G
NS
7A
66
.5±
2.4
wP
t-9
55
51
6.7
**
*0
.08
23
.99
±1
.01
0.1
07
3.6
3±
0.1
20
.17
83
.49
±0
.63
GN
S
7B
46
.0±
19
.3g
wm
40
08
.2*
**
0.0
34
-2
.44
±1
.14
0.0
58
-2
.64
±0
.74
0.0
67
-2
.03
±0
.84
LN
S
Gra
inco
pp
erco
nce
ntr
atio
n
1A
11
9.6
±9
.1D
uP
w0
38
10
.4*
**
0.1
16
-0
.60
±0
.12
0.0
44
-0
.36
±0
.12
0.0
47
-0
.42
±0
.15
LN
S
2A
80
.0±
14
.1w
Pt-
81
15
8.9
**
*0
.04
70
.35
±0
.16
0.0
80
0.4
8±
0.1
80
.07
70
.54
±0
.19
GN
S
3B
11
1.4
±3
8.8
gw
m8
53
6.5
**
*0
.02
8-
0.1
3±
0.2
60
.02
9-
0.1
7±
0.2
30
.07
1-
0.2
5±
0.3
8L
NS

Ta
ble
3co
nti
nu
ed
Tra
itP
osi
tio
n(c
M)
Nea
rest
mar
ker
LO
Da
Wat
er-l
imit
ed2
00
5W
ell-
wat
ered
20
05
Wel
l-w
ater
ed2
00
7F
avo
rab
leal
lele
dG
9E
e
Var
.(%
)bd
cV
ar.
(%)
dV
ar.
(%)
d
4A
94
.1±
13
.5w
mc2
62
7.6
*0
.04
50
.35
±0
.15
0.0
47
0.3
7±
0.1
40
.05
50
.45
±0
.15
GN
S
4B
66
.7±
10
.4g
wm
30
72
7.5
**
*0
.05
60
.40
±0
.13
0.0
67
0.4
5±
0.1
30
.03
10
.32
±0
.17
GN
S
5A
12
.6±
11
.2g
wm
15
48
.8*
**
0.0
48
0.3
7±
0.1
30
.13
10
.65
±0
.13
0.0
12
0.1
6±
0.1
5G
*
6A
67
.5±
33
.7g
wm
11
50
4.9
*0
.04
6-
0.2
9±
0.2
50
.02
5-
0.1
2±
0.2
20
.02
7-
0.0
7±
0.0
3L
NS
6B
13
2.2
±2
9.8
gw
m1
07
65
.9*
0.0
26
0.2
3±
0.1
30
.05
60
.23
±0
.18
0.0
56
0.3
7±
0.2
3G
**
*
7A
86
.3±
17
.3w
Pt-
70
53
5.1
*0
.03
20
.27
±0
.17
0.0
07
0.0
3±
0.1
10
.06
20
.47
±0
.20
G*
7B
72
.4±
24
.2g
wm
46
6.7
**
*0
.00
9-
0.0
2±
0.1
70
.01
3-
0.1
4±
0.4
50
.11
7-
0.6
7±
0.2
0L
**
*
Gra
inm
ang
anes
eco
nce
ntr
atio
n
2B
13
4.7
±1
9.0
wP
t-0
69
44
.1*
**
––
––
0.1
12
-2
.90
±0
.81
L
7B
48
.9±
30
.5g
wm
40
03
.9*
*–
––
–0
.13
6-
3.8
6±
0.2
1L
Gra
inca
lciu
mco
nce
ntr
atio
n
1A
31
.7±
26
.7g
wm
30
83
6.0
**
*0
.00
82
.70
±1
.50
0.0
19
16
.70
±1
1.9
50
.07
33
0.3
7±
9.2
5G
NS
2B
86
.5±
6.9
wP
t-6
57
61
2.5
**
*0
.16
8-
68
.97
±1
3.6
60
.09
7-
45
.31
±9
.76
0.0
28
-1
7.4
8±
9.2
9L
**
*
4A
28
.7±
2.4
gw
m6
10
13
.3*
**
0.0
65
43
.17
±1
1.0
40
.12
15
1.3
5±
8.1
40
.04
82
3.3
2±
10
.10
GN
S
4B
88
.1±
9.7
wP
t-9
39
36
.0*
*–
–0
.01
4-
19
.94
±9
.89
0.1
03
-3
6.4
5±
8.8
9L
*
5B
54
.2±
5.9
gw
m3
71
13
.3*
**
0.0
52
38
.41
±9
.84
0.0
81
42
.10
±7
.80
0.0
60
27
.60
±7
.34
GN
S
6A
10
6.9
±2
0.2
wP
t-0
13
96
.6*
*0
.00
9-
5.9
1±
7.6
60
.06
4-
35
.68
±1
2.5
90
.03
5-
19
.21
±1
0.4
8L
NS
6B
22
.6±
28
.1w
Pt-
11
50
61
3.9
**
*0
.19
04
0.8
8±
32
.76
0.0
55
21
.44
±1
8.4
80
.01
63
.75
±1
.47
GN
S
6B
14
5.4
±2
0.7
gw
m2
19
13
.9*
**
0.1
90
-4
8.3
2±
27
.11
0.0
55
-1
6.1
5±
16
.11
0.0
16
3.2
9±
11
.76
LN
S
7B
23
.0±
7.8
gw
m2
63
16
.0*
**
0.0
35
-2
9.3
5±
12
.67
0.1
72
-6
1.8
7±
8.5
50
.20
6-
51
.22
±1
0.1
2L
NS
Gra
inm
agn
esiu
mco
nce
ntr
atio
n
1B
13
2.6
±3
5.8
gw
m8
06
5.3
*0
.02
11
8.8
6±
17
.15
0.0
69
44
.89
±2
0.9
00
.03
12
6.4
2±
15
.14
GN
S
2A
71
.5±
9.5
wP
t-8
21
69
.8*
**
0.1
67
74
.11
±1
5.9
00
.08
55
0.0
1±
22
.65
0.0
29
25
.65
±1
5.4
5G
**
3A
12
.4±
7.7
gw
m1
15
99
.3*
**
0.0
79
50
.25
±1
2.1
30
.01
11
3.9
1±
12
.71
0.0
99
53
.79
±1
2.0
3G
*
5B
15
5.6
±3
9.4
wP
t-1
15
79
6.8
**
*0
.04
13
1.9
0±
19
.58
0.0
14
5.9
8±
11
.23
0.0
96
43
.21
±3
2.2
1G
**
6A
14
5.8
±1
3.5
gw
m7
19
5.0
**
*0
.08
3-
50
.79
±1
3.3
9–
––
–L
6B
42
.9±
30
.1w
Pt-
77
48
6.5
**
*0
.07
54
6.7
5±
19
.36
0.0
23
21
.71
±1
8.7
10
.05
63
8.5
8±
15
.18
GN
S
7A
49
.6±
18
.1g
wm
87
1a
6.0
**
*0
.06
5-
40
.65
±2
3.5
70
.02
4-
9.2
1±
2.7
00
.02
8-
16
.56
±1
3.4
5L
NS
7B
13
1.1
±2
9.2
wP
t-8
41
76
.0*
*0
.01
91
9.6
6±
16
.05
0.0
71
35
.38
±2
4.6
70
.03
62
5.0
1±
21
.03
GN
S
Gra
inP
ota
ssiu
mco
nce
ntr
atio
n
1A
18
1.5
±3
1.4
gw
m7
50
4.3
**
0.0
73
19
3.3
9±
12
1.6
6–
––
–G
1A
36
.1±
29
.9cf
a21
58
a3
.9*
––
0.1
12
-2
96
.43
±9
8.2
0–
–L
2A
13
6.1
±1
6.9
tPt-
31
36
8.7
**
*0
.11
52
84
.99
±8
2.8
80
.05
01
85
.82
±8
7.4
20
.07
01
30
.73
±7
2.1
3G
NS
2B
88
.0±
28
.9w
Pt-
65
76
5.2
*0
.06
5-
15
0.3
2±
16
6.2
10
.03
7-
12
7.4
5±
11
1.8
70
.02
6-
16
.30
±1
9.4
0L
*
Ta
ble
3co
nti
nu
ed
Tra
itP
osi
tio
n(c
M)
Nea
rest
mar
ker
LO
Da
Wat
er-l
imit
ed2
00
5W
ell-
wat
ered
20
05
Wel
l-w
ater
ed2
00
7F
avo
rab
leal
lele
dG
9E
e
Var
.(%
)bd
cV
ar.
(%)
dV
ar.
(%)
d
5B
66
.7±
24
.1g
wm
49
96
.5*
*0
.02
2-
10
3.6
0±
78
.16
0.0
72
-2
29
.11
±8
5.6
90
.06
0-
11
9.7
4±
70
.62
LN
S
6A
85
.9±
4.1
gw
m4
67
51
2.2
**
*0
.14
0-
32
3.9
2±
59
.79
0.1
11
-2
99
.10
±6
6.8
40
.01
1-
34
.67
±3
7.9
0L
**
*
6B
83
.7±
26
.5b
arc1
36
7.4
**
*0
.08
1-
21
0.3
0±
13
2.2
70
.06
6-
20
5.6
6±
11
5.9
00
.01
6-
44
.87
±4
5.1
1L
**
*
7B
28
.2±
16
.0g
wm
53
74
.4*
**
0.1
14
-3
17
.31
±8
6.9
3–
––
–L
Gra
inP
ho
sph
oru
sco
nce
ntr
atio
n
1A
91
.3±
23
.4g
wm
77
85
.6*
*0
.04
8-
13
3.5
1±
56
.72
0.0
82
-2
07
.40
±1
7.3
50
.04
1-
90
.62
±6
4.6
6L
**
2A
28
.7±
23
.2w
Pt-
62
45
15
.3*
**
0.1
92
-5
0.6
4±
46
.38
0.1
70
-1
03
.95
±1
10
.95
0.0
50
-3
7.6
5±
29
.89
L–
2A
10
1.4
±3
1.6
gw
m4
45
15
.3*
**
0.1
92
22
6.8
2±
64
.92
0.1
70
15
4.9
6±
11
7.8
90
.05
05
8.2
7±
54
.44
G–
4A
48
.8±
22
.5D
uP
w0
04
5.7
**
0.0
51
12
8.9
8±
14
.12
0.0
29
11
0.6
0±
72
.75
0.0
64
12
7.2
2±
52
.63
GN
S
4B
41
.4±
18
.7g
wm
78
15
.4*
0.0
14
49
.65
±5
9.4
70
.07
62
04
.74
±1
6.5
80
.02
05
4.0
7±
55
.47
G*
*
5B
12
5.2
±3
7.4
gw
m4
08
6.6
**
0.0
59
-4
2.3
4±
15
.14
0.0
43
-1
43
.97
±6
6.9
50
.03
3-
54
.62
±5
5.1
0L
**
6B
25
.6±
23
.7w
Pt-
33
76
6.5
**
0.0
67
14
8.5
0±
83
.45
0.0
12
26
.01
±8
.61
0.0
59
12
1.8
4±
58
.19
GN
S
7A
97
.2±
16
.9w
Pt-
70
53
8.3
**
*0
.05
41
26
.90
±8
7.2
70
.06
41
85
.66
±1
6.4
30
.07
91
43
.02
±5
6.0
1G
NS
Gra
insu
lfu
rco
nce
ntr
atio
n
1A
58
.9±
30
.3w
mc3
33
5.2
**
*0
.03
95
3.4
9±
41
.22
0.0
41
61
.03
±3
2.1
80
.06
15
5.9
9±
29
.03
GN
S
2A
10
5.8
±2
5.8
gw
m4
45
5.9
**
*0
.06
07
6.0
3±
30
.17
0.0
58
58
.94
±4
6.1
60
.01
61
2.8
9±
13
.01
GN
S
3A
72
.0±
14
.2w
Pt-
10
92
6.9
**
*0
.04
06
2.5
7±
26
.37
0.0
19
39
.25
±2
2.0
90
.06
96
5.3
4±
20
.33
GN
S
4A
75
.0±
7.5
wP
t-7
55
89
.3*
**
0.0
60
72
.83
±2
4.2
00
.10
61
00
.04
±2
0.7
30
.03
24
3.9
4±
19
.60
GN
S
4B
82
.5±
11
.8tP
t-7
15
64
.7*
**
––
––
0.1
42
-9
8.2
0±
17
.69
L
5A
95
.3±
11
.5w
Pt-
11
52
66
.5*
**
0.0
34
55
.36
±2
4.4
80
.10
81
08
.67
±2
7.1
40
.01
29
.51
±1
2.0
5G
**
*
5B
12
1.2
±2
5.2
wP
t-1
73
33
.4*
––
––
0.0
73
70
.39
±1
5.2
9G
6B
10
1.1
±2
5.9
wP
t-1
15
56
5.8
**
0.0
34
55
.12
±3
0.1
70
.03
15
4.1
7±
25
.27
0.0
63
59
.70
±2
1.1
4G
NS
7A
54
.7±
13
.8g
wm
10
83
9.3
**
*0
.04
86
7.9
1±
25
.56
0.1
19
11
2.7
0±
23
.10
0.0
29
37
.45
±2
1.2
0G
**
7B
12
8.8
±2
7.8
wP
t-3
73
05
.1*
0.0
35
52
.18
±3
6.1
70
.03
44
6.1
7±
43
.01
0.0
51
44
.72
±3
5.2
1G
NS
aL
OD
(lo
g-
od
ds)
sco
res
that
wer
efo
un
dsi
gn
ifica
nt
wh
enco
mp
arin
gh
yp
oth
eses
H1
(th
ere
isQ
TL
inth
ech
rom
oso
me)
ver
sus
H0
(no
effe
cto
fth
ech
rom
oso
me
on
the
trai
t),
usi
ng
10
00
per
mu
tati
on
ste
st(C
hu
rch
ill
and
Do
erg
e1
99
4)
bP
rop
ort
ion
of
exp
lain
edv
aria
nce
of
the
trai
tc
Th
eef
fect
of
QT
Ld
Fav
ora
ble
par
enta
lal
lele
con
trib
uti
ng
tog
reat
erg
rain
pro
tein
and
min
eral
nu
trie
nt
con
cen
trat
ion
s,L
ang
do
n(L
)an
dG
18
-16
(G)
eG
eno
typ
e9
env
iro
nm
ent
inte
ract
ion
,te
sted
by
com
par
ing
the
mo
del
wit
hn
ewsu
b-m
od
elin
wh
ich
all
env
iro
nm
ents
hav
eeq
ual
effe
ct,
usi
ng
1,0
00
per
mu
tati
on
ste
st.
Th
iste
stis
no
t
app
lica
ble
wh
enQ
TL
issp
ecifi
cfo
ro
nly
on
een
vir
on
men
to
rin
case
of
the
two
QT
Lm
od
el
*,
**
,*
**
and
NS
ind
icat
esi
gn
ifica
nce
atP
B0
.05
,0
.01
,0
.00
1o
rn
on
-sig
nifi
can
tef
fect
,re
spec
tiv
ely

exhibited a similar trend across environments, and one
QTL (6A) was found only under the WW05 environment.
Grain potassium concentration A total of eight signifi-
cant QTLs were associated with K with LOD scores
ranging between 3.9 and 12.2, explaining 2–14% of the
variance (Tables 2, 3). Higher K was conferred by the G18-
16 allele at two loci (1A, 2A) and by the LDN allele at six
loci (1A, 2B, 5B, 6A, 6B, 7B). Six QTLs showed signifi-
cant G 9 E interaction, three of them (2B, 6A, 6B)
exhibited a similar trend across environments, two QTLs
(1A, 7B) were found only under WL05 and one (1A) under
the WW05 environment.
Grain phosphorus concentration A total of eight sig-
nificant QTLs were associated with P concentration in the
grain with LOD scores ranging between 5.4–15.3,
explaining 1–19% of the variance (Tables 2, 3). Higher P
was conferred by the G18-16 allele at 5 loci (2A, 4A, 4B,
6B, 7A) and by the LDN allele at three loci (1A, 2A, 5B).
Three QTLs showed significant G 9 E interaction (1A, 4B,
5B) with a similar trend across environments.
Grain sulfur concentration A total of ten significant
QTLs were associated with S with LOD scores ranging
between 3.4 and 9.3, explaining 1.2–14.2% of the variance
(Tables 2, 3). Higher S was conferred by the G18-16 allele
at nine loci (1A, 2A, 3A, 4A, 5A, 5B, 6B, 7A, 7B) and by
the LDN allele at one locus (4B). Four QTLs showed sig-
nificant G 9 E interaction, two of them (5A, 7A) exhibited
a similar trend across environments, and two QTLs (4B, 5B)
were found only under the WW07 environment.
Discussion
Sufficient amount of protein and minerals in the daily diet
is essential for human health. While global cereal grain
yields have increased dramatically since the Green Revo-
lution, cereal-based diet is short of providing sufficient
protein and mineral nutrients, leading to increased per-
centage of people suffering from nutrient malnutrition
(Welch and Graham 2004). Among grain mineral nutrients,
Zn and Fe deficiencies are the most important global
challenge. According to the World Health Organization,
deficiencies in Zn and Fe rank 5th and 6th, respectively,
among the risk factors responsible for illnesses in devel-
oping countries (WHO 2002).
Little information is available about the genetic control
and molecular- physiological mechanisms contributing to
high accumulation of macro- and micro-nutrients in the
grain. QTL analysis proved a powerful tool in agricultural
studies, pointing out the chromosomal location of genes
suitable for breeding programs. However, most of the QTL
studies conducted so far focused on GPC with very little
attention given to other grain nutrients. In wheat, we are
aware of only three publications reporting on QTL map-
ping of grain minerals: one in T. monococcum (Zn, Fe, Cu
and Mn; Ozkan et al. 2007) and two in bread wheat (Zn and
P; Shi et al. 2008; Genc et al. 2008). In the present study,
QTL analysis was employed to dissect the genetic basis of
grain protein and nine mineral concentrations, using a
tetraploid wheat (LDN 9 G18-16) RIL population. More-
over, the use of a cross between wild and domesticated
wheat may facilitate the identification of novel genes that
are not present in the domesticated germplasm.
QTLs conferring grain protein concentration
Application of N fertilizer, the most common approach to
enhance GPC in wheat, is biologically limited. Abundant
experimental evidence shows that GPC increases with N
application up to a certain point, after which it remains
stable, while the straw N concentration keeps increasing
(Barneix 2007 and references therein). Genetic improve-
ment is the most promising strategy to increase GPC under
either optimal or sub-optimal N availability. In the present
study, ten QTLs associated with GPC were identified
(Fig. 2, Table 3). QTLs affecting variation in GPC were
reported in tetraploid and hexaploid wheat on all 14
chromosomes of genome A and B (Joppa et al. 1997; Snape
et al. 1997; Prasad et al. 1999; Perretant et al. 2000; Harjit
et al. 2001; Zanetti et al. 2001; Borner et al. 2002; Blanco
et al. 2002; Groos et al. 2003; Gonzalez-Hernandez et al.
2004; Blanco et al. 2006; Zhang et al. 2008). Because of
the multigenic nature of GPC and G 9 E interactions, most
QTLs for GPC, detected in the current and previous stud-
ies, accounted for relatively small proportion of the total
phenotypic variance. Nevertheless, two major QTLs were
associated with higher GPC (2A, 6B), explaining 12–
13.7% of the phenotypic variance (Table 3). A major QTL
for GPC from wild emmer wheat was localized on chro-
mosome arm 6BS (Joppa et al. 1997) and successfully
transferred into bread wheat cultivars (Mesfin et al. 1999;
Khan et al. 2000). Recently, this QTL, designated Gpc-B1,
was cloned (Uauy et al. 2006; Distelfeld and Fahima 2007).
The wild emmer wheat genepool harbors a wide genetic
variation for GPC (Avivi 1979; Cakmak et al. 2004; Peleg
et al. 2008a), which was considered relevant for improving
domesticated wheat (Blanco et al. 2002; Gonzalez-Her-
nandez et al. 2004; Joppa et al. 1997). In the present study,
the wild emmer alleles (G18-16) were favorable in most
(80%) QTLs for GPC, thus confirming the potential of wild
emmer germplasm for wheat breeding programmes.
QTLs conferring grain micronutrient concentrations
Micronutrients (Zn, Fe, Cu and Mn) are required by plants
at very low concentrations, while at high concentrations

they may become toxic. Thus, plants have evolved a com-
plex regulation networks to control minerals homeostasis
(Grusak and Cakmak 2005; Grotz and Guerinot 2006).
Zinc plays multiple roles in various physiological and
metabolic processes in plants including membrane func-
tion, protein synthesis and detoxification of reactive oxy-
gen species (Cakmak 2000). In the current study, Zn was
conferred by six QTLs (2A, 2A, 5A, 6B, 7A, 7B), with the
wild allele being favorable in five cases (Table 2). Five
QTLs conferring Zn concentration were mapped in previ-
ous studies, with three of them corresponding to our
results: 5A (Ozkan et al. 2007; Shi et al. 2008), 6B
(Distelfeld et al. 2007; Genc et al. 2008), and 7A (Shi et al.
2008; Genc et al. 2008). Iron is involved in many enzy-
matic functions in plants affecting photosynthesis and
chlorophyll biosynthesis (Marschner 1995). Fe was con-
ferred in the current study by 11 QTLs, with the wild allele
being favorable in five cases. Two QTLs were mapped also
in previous studies: 5A (Ozkan et al. 2007) and 6B
(Distelfeld et al. 2007). Copper plays important roles in
photosynthesis and pollen (Marschner 1995). Cu was
conferred in the current study by ten QTLs, with the wild
allele being favorable in six cases. Only one of the mapped
QTLs was previously reported (5A; Ozkan et al. 2007).
Manganese is involved in activities of several enzymes
related to photosynthesis, respiration, and nitrogen metab-
olism (Marschner 1995). Mn was conferred in the current
study by two QTLs, both with the domesticated allele
being favorable. These two QTLs were found only in the
WW07 environment, indicating a pronounced G 9 E
interaction. In agreement with this, heritability estimates
for Mn were low (0.41) relative to other minerals. We are
not aware of a previous report on these two QTLs (2B and
7B), however, two other QTLs conferring Mn were pre-
viously reported: 5A (Ozkan et al. 2007) and 6B (Distelfeld
et al. 2007).
QTLs conferring grain macro-nutrient concentrations
Macronutrients (Ca, Mg, K, P and S) are essential elements
used by plants in relatively large amounts. Unlike micro-
nutrients, which have only functional roles, macronutrients
have both structural and functional roles. We are not aware
of previous reports of QTLs for macronutrient concentra-
tions in wheat grain, apart from a single publication on P
(Shi et al. 2008).
Fig. 2 Likelihood intervals for QTLs associated with grain protein
(GPC) and grain mineral nutrient concentrations of zinc (Zn), iron
(Fe), copper (Cu), manganese (Mn), calcium (Ca), magnesium (Mg),
potassium (K), phosphorus (P) and sulfur (S) in recombinant inbred
lines of the cross between Langdon and G18-16. QTLs expressed only
for the following specific environment are marked: water-limited in
2005 (WL05), well-watered in 2005 (WW05), and well-watered in
2007 (WW07)

Fig. 2 continued
Fig. 2 continued

Calcium is a structural element in cell wall and bio-
logical membranes (Marschner 1995). Ca was conferred in
the current study by nine QTLs, with the wild allele being
favorable in four cases. Magnesium is a critical structural
component of the chlorophyll molecule in plants. Mg was
conferred in the current study by eight QTLs, with the wild
allele being favorable in six cases. Potassium is absorbed
by plants in larger amounts than any other mineral element
(excluding nitrogen) and is necessary for photosynthetic
carbohydrates metabolism and protein synthesis (Marsch-
ner 1995). K was conferred in the current study by eight
QTLs, with the wild allele being favorable in only two
cases. Phosphorus is among the key substrates in energy
metabolism and biosynthesis of nucleic acids and mem-
branes. P was conferred in the current study by eight QTLs,
with the wild allele being favorable in five cases. Three
QTLs conferring P concentration were mapped in a pre-
vious study, one of which corresponds to our results
(4A; Shi et al. 2008). Sulfur promotes activity of several
co-enzymes, vitamins and proteins, it is involved in chlo-
rophyll formation and improves root growth and seed
production (Marschner 1995). S was conferred in the
current study by ten QTLs, with the wild allele being
favorable in nine cases.
Homoeologous QTL loci
Owing to the allopolyploid nature of the wheat genome, a
number of important traits such as daylength sensitivity
(Ppd; group 2), plant height (Rht; group 4) and
vernalization requirement (Vrn; group 5) are controlled by
series of genes on homoeologous linkage groups (Law
et al. 1976; McVittie et al. 1978; Scarth and Law 1983). In
the current study, as many as 28 QTLs (14 pairs) for the
same trait were mapped to seemingly homoeologous
positions on five chromosome groups (2, 4, 5, 6, 7) of the
tetraploid wheat (Fig. 2). Homoeology was detected for
nine traits (excluding Mn) including GPC (groups 2, 6), Zn
(group 7), Fe (group 2), K (groups 2, 6), P (group 4), Mg
(group 7), S (groups 4, 5, 7), Ca (group 6) and Cu (groups
4, 6). Similarly, in a previous study, with the same RIL
population (Peleg et al. 2009), 30 QTLs (15 pairs) for plant
productivity and drought related traits were mapped to
seemingly homoeologous positions. Both parental lines are
allotetraploids comprised of two genomes (A and B) that
are presumed to have diverged from a common ancestor
2.5–4.5 million years ago (Huang et al. 2002) and gave rise
to the tetraploid genome about 0.5 million years ago
(Dvorak and Akhunov 2005). Therefore, although not
confirmed by tightly linked markers, it is very likely that
the numerous homoeologous-QTLs reflect synteny
between A and B genomes.
Association among grain protein and mineral
concentrations
To test the extent to which different traits were genetically
associated, we evaluated the correspondence of QTL con-
fidence intervals. The 82 QTLs discovered in the current
study were located in 32 non-overlapping genomic regions
(Fig. 2). Relationships between QTLs conferring grain
protein and mineral concentrations may shed light on
possible common mechanisms influencing mineral con-
centrations in the grain of wheat and other cereal species.
Quantitative trait loci conferring high GPC were co-
localized with QTLs conferring high Zn in three genomic
regions (2A, 5A, 6B) and with QTLs conferring high Fe in
five genomic regions (2A, 2B, 5A, 6A, 7B) (Fig. 2,
Table 4). The likelihood that such associations would
occur by chance are P = 0.05 and P = 0.008, respectively
(Larsen and Marx 1985; Paterson et al. 1995). These results
were further supported by principal component analysis
(Fig. 1) and positive phenotypic correlations between GPC
and both Zn or Fe (Table 4). Positive correlation between
GPC, Zn and Fe has been reported for several cereals
including: wild emmer wheat (Cakmak et al. 2004; Peleg
et al. 2008a), emmer wheat, Triticum dicoccum (Gregorio
2002), bread wheat, T. aestivum L (Peterson et al. 1986;
Raboy et al. 1991), and Triticale (Feil and Fossati 1995).
Recently, the Gpc-B1 allele from wild emmer was found to
encode a NAC transcription factor (NAM-B1) inducing
accelerated senescence and increased grain protein, Zn and
Fe concentrations. It has been suggested that NAM-B1
Fig. 2 continued

controls nutrient remobilization from leaves to grains
(Uauy et al. 2006). In the current study, QTLs conferring
GPC and Zn were clearly mapped to the same genomic
region (6BS) and QTL for Fe was mapped to the same
chromosome arm. The common genetic control of GPC, Zn
and Fe was further demonstrated in two additional genomic
regions (2A, 5A) in which QTLs for these three grain
constituents exhibited significant overlap (Fig. 2).
Exceptionally strong association was found between
QTLs conferring Zn and QTLs for Fe, with co-localization
in five genomic regions (P = 0.0009), two of which cor-
responded also to GPC. These findings are further sup-
ported by a significant positive correlation (r = 0.79,
P = 0.0001) (Fig. 1; Table 4), indicating a strong genetic
association between mechanisms affecting grain Zn and Fe
concentrations. Numerous previous studies reported on
positive correlation between grain Zn and Fe concentra-
tions in cereals (e.g., Cakmak et al. 2004; Morgounov et al.
2007; Peleg et al. 2008a), however, only one study reported
on co-localization of QTLs for Zn and Fe contents in rice
(Stangoulis et al. 2007). In Arabidopsis thaliana, QTLs for
Zn and Fe were found to be either co-localized (Waters and
Grusak 2008) or not associated (Vreugdenhil et al. 2004).
The ten QTLs conferring Cu, found in the current study,
were significantly co-localized with QTLs for GPC in six
cases (P = 0.0006), with QTLs for Zn in five cases
(P = 0.0007) and with QTLs for Fe in five cases
(P = 0.01) (Fig. 2, Table 4). These relationships were
further supported by the PC analysis (Fig. 1) showing
strong positive correlation between Cu concentration and
GPC, Zn and Fe (Table 4). Grain Cu concentration was
hardly investigated, presumably due to its low nutritional
priority, and we are not aware of prior reports on pheno-
typic or genotypic (QTL overlap) association between Cu
and other minerals in wheat grain. In wheat, Fe, Zn and Cu
are highly mobile, while Mn is almost immobile in the
phloem (Pearson and Rengel 1994; Garnett and Graham
2005). All nutrient transports into the grain must at some
stage pass through the phloem due to xylem discontinuity
in the grain stalk (O’Brien et al. 1985). This could explain,
on the one hand, the close association between Zn, Fe and
Cu, and on the other hand the low number of QTLs (2)
detected for Mn. Notably, both QTLs for Mn were sig-
nificantly co-localized with QTLs for Fe (Table 4).
Approximately 75% of the total P in the wheat
grain is stored as phytic acid (myo-inositol 1,2,3,4,5,6-
Table 4 Genotypic and phenotypic association among wheat grain
protein and nine mineral nutrient concentrations and grain yield. The
upper values indicate the number of corresponding QTLs ([50%
overlap between their confidence intervals) out of the total number of
QTLs detected for each trait (indicated in parenthesis). The lower
values indicate the coefficients of correlation (r) between each pair of
traits in the 152 RILs (LDN 9 G18-16) averaged across the three
environments
GPC (10) Zn (6) Fe (11) Cu (10) Mn (2) Ca (9) Mg (8) K (8) P (8) S (10)
Zn (6) 3*
0.55***
Fe (11) 5** 5***
0.59*** 0.79***
Cu (10) 6*** 5*** 5*
0.38*** 0.56*** 0.54***
Mn (2) 1 0 2* 1
0.19* 0.29*** 0.19* 0.03
Ca (9) 2 1 1 1 0
0.14 0.27*** 0.19* 0.08 0.24**
Mg (8) 1 2 3 1 0 1
0.46*** 0.37*** 0.33*** 0.37*** 0.23** 0.4***
K (8) 4* 0 2 1 1 4* 0
0.21* 0.05 0.11 0.18* -0.03 0.28*** 0.27***
P (8) 4* 2 2 2 0 2 3 1
0.61*** 0.5*** 0.49*** 0.38*** 0.14 0.37*** 0.69*** 0.53***
S (10) 4* 3 2 3 0 2 3 2 3
0.66*** 0.58*** 0.5*** 0.27*** 0.2* 0.33*** 0.52*** 0.11 0.54***
GY (6) 3* 1 1 2 1 2 0 1 1 1
-0.29*** -0.26*** -0.22** -0.18* 0.04 0.03 -0.23** -0.11 -0.33*** -0.24**
*, **, and *** indicate significant correspondence (Larsen and Marx 1985; Paterson et al. 1995) or correlation coefficient at P B 0.05, 0.01 and
0.001, respectively

hexakisphosphate), mostly in the germ and aleurone layers
(Raboy 2000). This relatively small molecule with a high
charge density is a strong chelator of positively charged
mineral cations such as Fe, Zn, Ca, K and Mg (Raboy 2000;
Lott and West 2001). In winter wheat, GPC was strongly
correlated with both phytic acid and total P (Raboy et al.
1991). Thus, selection for increased GPC is expected to be
associated with increased grain phytic acid. In the current
study, four out of eight QTLs for grain P concentration were
co-localized with QTLs for GPC (P = 0.027), which was
also supported by phenotypic association (Fig. 1, Table 4).
However, while in three loci (2A, 4A, 7A) the wild allele was
associated with higher values of P and GPC (Table 3), in one
locus (5B) the wild allele conferred high GPC and low P, thus
offering the prospect of improving GPC without increasing
phytic acid. Four macronutrients, P, Ca, K and Mg, exhibited
positive phenotypic association (Fig. 1, Table 4). QTLs
conferring high Ca were co-localized with QTLs for high K
in four genomic region (P = 0.01), which may reflect the
common affinity of Ca and K to phytate. However, QTLs for
P and Mg showed no significant genetic association with
either QTLs for K or Ca (Table 4). In agreement with these
results, correspondence between QTLs for Ca and K
co-localized with a known phytate locus was reported in
Arabidopsis thaliana (Vreugdenhil et al. 2004).
An association between QTLs conferring high S and
QTLs for GPC occurred in four genomic regions
(P = 0.03) (Fig. 2, Table 4). These results are further
supported by significant positive phenotypic correlations
between S and GPC (Fig. 1, Table 4). In all of these
genomic region (2A, 4A, 5B, 6B) the wild allele contrib-
uted to increased N or S (Table 2). Plants tend to maintain
a relatively constant ratio of organic N to organic S, par-
ticularly in their vegetative tissues, even though the ratio of
total N to total S can vary widely in response to N and S
supply (Dijkshoorn and van Wijk 1967). Therefore, the
positive genotypic and phenotypic association between N
and S is not surprising.
Association between grain mineral nutrient
concentrations and grain yield
High yield capacity is a major requirement for any crop
cultivar. Therefore, when breeding for other traits, special
attention should be given to avoid negative effects on yield.
In previous studies in wheat, grain mineral nutrient con-
centrations exhibited negative associations with GY
(Loffler et al. 1983; Cox et al. 1985; Gauer et al. 1992;
Groos et al. 2003; Calderini and Ortiz-Monasterio 2003;
Oury et al. 2006). However, neither negative nor positive
associations between grain mineral concentrations and
productivity were found in wild emmer wheat (Peleg
et al. 2008a). Recently, the same mapping population
(LDN 9 G18-16) tested under two contrasting water
availabilities (WW05 and WL05), revealed 6 QTLs con-
ferring GY (2B, 2B, 4A, 4B, 5A, 7B; Peleg et al. 2009).
GY data under the three environments (WW05, WL05 and
WW07) studied here for grain minerals were re-analyzed
and showed similar results (not shown). Three out of ten
QTLs conferring GPC were significantly associated with
QTLs conferring GY (2B, 4A, 7B). High GPC and low
yield were conferred by wild alleles in two genomic
regions (2B, 4A) and by the domesticated allele in
one region (7B). This was further supported by a negative
correlation between GPC and GY (r = -0.29, P =
0.0003) (Table 4).
Abbo et al. (2009) hypothesized that under ancient non-
fertilized practices, low nutrient requirement (and grain
mineral concentrations) might have conferred GY advan-
tage and was hence unintentionally selected for in farmers’
fields. Indeed, modern wheat cultivars have typically lower
grain protein and mineral concentrations relative to their
wild ancestors (e.g., Peleg et al. 2008a). Yet seven QTLs
for GPC (2A, 3B, 5A, 5B, 6A, 6B, 7A) explaining up to
13.7 (per single QTL) of the variation in GPC were not
associated with GY. Furthermore, the six genomic region
conferring GY (Peleg et al. 2009) were not significantly
association with QTLs for Zn (P = 0.23), Fe (P = 0.28) or
other minerals (Table 4). Thus the introduction of QTLs
for improved grain protein and mineral concentrations is
not necessarily expected to reduce productivity.
Conclusions and implications for wheat improvement
Breeding staple food crops with higher nutrient concen-
tration in the grain is a low-cost, sustainable strategy to
alleviate micronutrient malnutrition. Increasing grain con-
centrations of mineral nutrients is also likely to improve
seed germination and seedling development under various
stress conditions. Wild emmer wheat was shown to offer
abundant genetic diversity for multiple biotic and abiotic
stress adaptive traits (Feldman and Sears 1981; Nevo et al.
2002), including grain protein and mineral nutrient con-
centrations (Avivi 1979; Cakmak et al. 2004; Peleg et al.
2008a). Indeed, in most QTLs detected in the current study
the wild parent allele was favorable. Recently, a gene
affecting GPC, Zn and Fe (TtNAM-B1) originating from
wild emmer wheat was cloned (Distelfeld and Fahima 2007
and references therein). Likewise, QTL analysis of segre-
gating population derived from cross between domesti-
cated 9 wild bean revealed an advantage of the wild
parental alleles in seed Zn and Fe content (158 and 180%,
respectively) compared with cultivated bean (Guzman-
Maldonado et al. 2003).
QTLs conferring high grain mineral concentrations may
reflect genes acting in one or more different steps, such as

root uptake, root-to-shoot translocation, storage (in leaves
or grain) and remobilization, as well as genes that encode
regulatory proteins. The identified associations between
QTLs affecting different mineral nutrients suggest physi-
ological coupling of certain processes that govern mineral
accumulation in wheat grain. Few genomic regions (Chr.
2A, 5A, 6B, 7A) were found to harbor clusters of QTLs for
GPC and other minerals. These regions offer unique
opportunities for synchronous improvement of GPC, Zn,
Fe and other mineral nutrients in wheat grain. Neverthe-
less, genomic regions associated with only one or few
minerals should not be overlooked as they may confer
other, mineral-specific, mechanisms.
Our results exemplify unique opportunities to exploit
favorable alleles that were excluded from the domesticated
genepool as a result of the genetic bottleneck involved in
the domestication processes. The concurrent mapping of
QTL for several minerals as well as the dissection of their
inter- and intra-relationships provides an insight into the
functional basis of the physiology, genomic architecture
and evolution of minerals accumulation in wheat and other
cereal crops.
Acknowledgments This study was supported by HarvestPlus Bio-
fortification Challenge Program (http://www.harvestplus.org). The
authors are also grateful to The Israel Science Foundation (ISF) grant
#1089/04 and State Planning Organization of the Turkish Republic for
providing additional support to this study. We greatly acknowledge A.
Avneri, M. Chatzav and U. Uner for their excellent assistance in the
field experiments. Z. Peleg is indebted to the Israel Council for Higher
Education postdoctoral fellowships award.
References
Abbo S, Saranga Y, Peleg Z, Kerem Z, Lev-Yadun S, Gopher A
(2009) Reconsidering domestication of legumes versus cereals in
the ancient Near East. Q Rev Biol 84:29–50
Avivi L (1979) Utilization of Triticum dicoccoides for the improve-
ment of grain protein quantity and quality in cultivated wheats.
Monogr Genet Agrar 4:27–38
Barneix AJ (2007) Physiology and biochemistry of source-regulated
protein accumulation in the wheat grain. J Plant Physiol
164:581–590
Blanco A, Pasqualone A, Troccoli A, Di Fonzo N, Simeone R (2002)
Detection of grain protein content QTLs across environments in
tetraploid wheats. Plant Mol Biol 48:615–623
Blanco A, Simeone R, Gadaleta A (2006) Detection of QTLs for grain
protein content in durum wheat. Theor Appl Genet 112:1195–
1204
Borner A, Schumann E, Furste A, Coster H, Leithold B, Roder MS,
Weber WE (2002) Mapping of quantitative trait loci determining
agronomic important characters in hexaploid wheat (Triticumaestivum L.). Theor Appl Genet 105:921–936
Bouis HE (2003) Micronutrient fortification of plants through plant
breeding: can it improve nutrition in man at low cost? Proc Nut
Soc 62:403–411
Cakmak I (2000) Role of zinc in protecting plant cells from reactive
oxygen species. New Phytol 146:185–205
Cakmak I (2002) Plant nutrition research: Priorities to meet human
needs for food in sustainable ways. Plant Soil 247:3–24
Cakmak I (2008) Enrichment of cereal grains with zinc: agronomic or
genetic biofortification? Plant Soil 302:1–17
Cakmak I, Torun A, Ozkan H, Millet E, Feldman M, Fahima T, Korol
AB, Nevo E, Braun HJ (2004) Triticum dicoccoides: an
important genetic resource for increasing zinc and iron concen-
tration in modern cultivated wheat. Soil Sci Plant Nut 50:1047–
1054
Calderini DF, Ortiz-Monasterio I (2003) Grain position affects grain
macronutrient and micronutrient concentrations in wheat. Crop
Sci 43:141–151
Churchill GA, Doerge RW (1994) Empirical threshold values for
quantitative trait mapping. Genetics 138:963–971
Cox M, Qualset C, Rains D (1985) Genetic variation for nitrogen
assimilation and translocation in wheat. I. Dry matter and
nitrogen accumulation. Crop Sci 25:430–435
Dijkshoorn W, van Wijk AL (1967) The sulphur requirements of
plants as evidenced by the sulphur–nitrogen ratio in the organic
matter a review of published data. Plant Soil 26:129–157
Distelfeld A, Fahima T (2007) Wild emmer wheat as a source for
high-grain-protein genes: map-based cloning of Gpc-B1. Isr J
Plant Sci 55:297–306
Distelfeld A, Cakmak I, Peleg Z, Ozturk L, Yazici AM, Budak H,
Saranga Y, Fahima T (2007) Multiple QTL-effects of wheat
Gpc-B1 locus on grain protein and micronutrient concentrations.
Physiol Plant 129:635–643
Dvorak J, Akhunov ED (2005) Tempos of gene locus deletions and
duplications and their relationship to recombination rate during
diploid and polyploid evolution in the Aegilops-Triticumalliance. Genetics 171:323–332
FAOstat (2007) Food and Agriculture Organization of the United
Nations. http://faostat.fao.org
Feil B, Fossati D (1995) Minerals composition of Triticale grains as
related to grain yield and grain protein. Crop Sci 35:1426–1431
Feldman M (2001) The origin of cultivated wheat. In: Bonjean AP,
Angus WJ (eds) The world wheat book. Lavoisier Tech & Doc,
Paris, pp 3–56
Feldman M, Sears ER (1981) The wild gene resources of wheat. Sci
Am 244:102–112
Garnett R, Graham RD (2005) Distribution and remobilization of iron
and copper in wheat. Ann Bot 95:817–826
Gauer L, Grant C, Gehl D, Bailey L (1992) Effects of nitrogen
fertilization on grain protein content, nitrogen uptake, and
nitrogen use efficiency of six spring wheat (Triticum aestivumL.) cultivars, in relation to estimated moisture supply. Can J
Plant Sci 72:235–241
Genc Y, Verbyla AP, Torun AA, Cakmak I, Willsmore K, Wallwork
H, McDonald GK (2008) Quantitative trait loci analysis of zinc
efficiency and grain zinc concentration in wheat using whole
genome average interval mapping. Plant soil 310:67–75
Gonzalez-Hernandez JL, Elias EM, Kianian SF (2004) Mapping
genes for grain protein concentration and grain yield on
chromosome 5B of Triticum turgidum (L.) var. dicoccoides.
Euphytica 139:217–225
Gregorio GB (2002) Progress in breeding for trace minerals in staple
crops. J Nutr 132:500S–502S
Groos C, Robert N, Bervas E, Charmet G (2003) Genetic analysis of
grain protein-content, grain yield and thousand-kernel weight in
bread wheat. Theor Appl Genet 106:1032–1040
Grotz N, Guerinot ML (2006) Molecular aspects of Cu, Fe and Zn
homeostasis in plants. Biochim Biophys Acta 1763:595–608
Grusak MA, Cakmak I (2005) Methods to improve the crop-delivery
of minerals to humans and livestock. In: Broadley MR, White PJ
(eds) Plant nutritional genomics. Blackwell Publishing, Oxford,
pp 265–286

Guzman-Maldonado SH, Martinez O, costa-Gallegos JA, Guevara-
Lara F, Paredes-Lopez O (2003) Putative quantitative trait loci
for physical and chemical components of common bean. Crop
Sci 43:1029–1035
Harjit S, Prasad M, Varshney RK, Roy JK, Balyan HS, Dhaliwal HS,
Gupta PK (2001) STMS markers for grain protein content and
their validation using near-isogenic lines in bread wheat. Plant
Breed 120:273–278
Hotz C, Brown K (2004) Assessment of the risk of zinc deficiency in
populations and options for its control. Food Nutr Bull 25:94–
204
Huang S, Sirikhachornkit A, Su X, Faris J, Gill B, Haselkorn R,
Gornicki P (2002) Genes encoding plastid acetyl-CoA carbox-
ylase and 3-phosphoglycerate kinase of the Triticum/Aegilopscomplex and the evolutionary history of polyploid wheat. Proc
Natl Acad Sci 99:8133–8138
Joppa LR, Du C, Hart GE, Hareland GA (1997) Mapping gene(s) for
grain protein in tetraploid wheat (Triticum turgidum L.) using a
population of recombinant inbreed chromosome lines. Crop Sci
37:1586–1589
Khan IA, Procunier JD, Humphreys DG, Tranquilli G, Schlatter AR,
Marcucci-Poltri S, Frohberg R, Dubcovsky J (2000) Develop-
ment of PCR based markers for a high grain protein content gene
from Triticum turgidum ssp. dicoccoides transferred to bread
wheat. Crop Sci 40:518–524
Ladizinsky G (1998) Plant evolution under domestication. Kluwer,
Dordrecht
Larsen RJ, Marx ML (1985) An introduction to probability and its
applications. Prentice Hall Inc., Englewood Cliffs
Law CN, Worland AJ, Giorgi B (1976) The genetic control of ear-
emergence time by chromosomes 5A and 5D of wheat. Heredity
36:49–58
Loffler C, Bush R, Wiersma J (1983) Recurrent selection for grain
protein percentage in hard red spring wheat. Crop Sci 23:1097–
1101
Lott JNA, West MM (2001) Elements present in mineral nutrient
reserves in dry Arabidopsis thaliana seeds of wild type and
pho1, pho2, and man1 mutants. Can J Bot 79:1292–1296
Marschner H (1995) Mineral nutrition of higher plants, 2nd edn.
Academic Press, London
McCouch S (2004) Diversifying selection in plant breeding. PLoS
Biol 2:e347
McVittie JA, Gale MD, Marshall GA, Westcott B (1978) The intra-
chromosomal mapping of the Norin 10 and Tom Thumb dwarfing
genes. Heredity 40:67–70
Merrill AL, Watt BK (1973) Energy value of food—basis and
derivation. US Department of Agriculture Handbook No. 74
Mesfin A, Frohberg RC, Anderson JA (1999) RFLP markers
associated with high grain protein from Trititcum turgidum L.
var. dicoccoides introgressed into hard red spring wheat. Crop
Sci 39:508–513
Morgounov A, Gomez-Becerra HF, Abugalieva A, Dzhunusova M,
Yessimbekova M, Muminjanov H, Zelenskiy Y, Ozturk L,
Cakmak I (2007) Iron and zinc grain density in common wheat
grown in Central Asia. Euphytica 155:193–203
Nevo E, Korol AB, Beiles A, Fahima T (2002) Evolution of wild
emmer and wheat improvement: population genetics, genetic
resources, and genome organization of wheats progenitor,
Triticum dicoccoides. Springer, Berlin
O’Brien TP, Sammut ME, Lee JW, Smart MG (1985) The vascular
system of the wheat spikelet. Aust J Plant Physiol 12:487–512
Oury F-X, Leenhardt F, Remesy C, Chanliaud E, Duperrier B,
Balfourier F, Charmet G (2006) Genetic variability and stability
of grain magnesium, zinc and iron concentrations in bread
wheat. Eur J Agron 25:177–185
Ozkan H, Brandolini A, Torun A, Altintas S, Eker S, Kilian B, Braun
H, Salamini F, Cakmak I (2007) Natural variation and identi-
fication of microelements content in seeds of einkorn wheat
(Triticum monococcum). In: Buck HT, Nisi JE, Salomon N (eds)
Wheat production in stressed environments. Springer, Berlin, pp
455–462
Paterson AH, Lin YR, Li Z, Schertz KF, Doebley JF, Pinson SRM,
Liu SC, Stansel JW, Irvine JE (1995) Convergent domestication
of cereal crops by independent mutations at corresponding
genetic loci. Science 269:1714–1718
Pearson JN, Rengel Z (1994) Distribution and remobilization of Zn
and Mn during grain development in wheat. J Exp Bot 45:1829–
1835
Peleg Z, Saranga Y, Yazici A, Fahima T, Ozturk L, Cakmak I (2008a)
Grain zinc, iron and protein concentrations and zinc-efficiency in
wild emmer wheat under contrasting irrigation regimes. Plant
Soil 306:57–67
Peleg Z, Saranga Y, Suprunova T, Ronin YI, Roder MS, Kilian A,
Korol AB, Fahima T (2008b) High-density genetic map of
durum wheat 9 wild emmer wheat based on SSR and DArT
markers. Theor Appl Genet 117:103–115
Peleg Z, Fahima T, Krugman T, Abbo S, Yakir D, Korol AB, Saranga
Y (2009) Genomic dissection of drought resistance in durum
wheat 9 wild emmer wheat RIL population. Plant Cell Environ
(in press). doi:10.1111/j.1365-3040.2009.01956.x
Perretant MR, Cadalen T, Charmet G, Sourdille P, Nicolas P, Boeuf
C, Tixier MH, Branlard G, Bernard S (2000) QTL analysis of
bread-making quality in wheat using a doubled haploid popu-
lation. Theor Appl Genet 100:1167–1175
Peterson CV, Johnson VA, Mattern PJ (1986) Influence of cultivar
and environment on mineral and protein concentration of wheat
flour, bran, and grain. Cereal Chem 63:183–186
Prasad M, Varshney RK, Kumar A, Balyan HS, Sharma PC, Edwards
KJ, Singh H, Dhaliwal HS, Roy JK, Gupta PK (1999) A
microsatellite marker associated with a QTL for grain protein
content on chromosome arm 2DL of bread wheat. Theor Appl
Genet 99:341–345
Raboy V (2000) Low-phytic-acid grains. Food Nutr Bull 21:423–427
Raboy V, Noaman MH, Taylor GA, Pickett SG (1991) Grain phytic
acid and protein are highly correlated in winter wheat. Crop Sci
31:631–635
Ronin YI, Korol AB, Nevo E (1999) Single- and multiple-trait
mapping analysis of linked quantitative trait loci: some asymp-
totic analytical approximations. Genetics 151:387–396
Salvi S, Tuberosa R (2005) To clone or not to clone plant QTLs:
present and future challenges. Trends Plant Sci 10:297–304
Sanchez PA, Swaminathan MS (2005) Cutting world hunger in half.
Science 307:357–359
Scarth R, Law CN (1983) The location of the photoperiod gene, Ppd2and an additional factor for ear emergence time on chromosome
2B of wheat. Heredity 51:607–619
Shi R, Li H, Tong Y, Jing R, Zhang F, Zou C (2008) Identification of
quantitative trait locus of zinc and phosphorus density in wheat
(Triticum aestivum L.) grain. Plant Soil 306:95–104
Snape JW, Semikhodskii A, Fish L, Sarma RN, Quarrie SA, Galiba G,
Sutka J (1997) Mapping frost tolerance loci in wheat and
comparative mapping with other cereals. Acta Agron Hung
45:265–270
Stangoulis JCR, Huynh BL, Welch RM, Choi EY, Graham RD (2007)
Quantitative trait loci for phytate in rice grain and their
relationship with grain micronutrient content. Euphytica
154:289–294
Tanksley SD, McCouch SR (1997) Seed banks and molecular maps:
unlocking genetic potential from the wild. Science 277:1063–
1066
Uauy C, Distelfeld A, Fahima T, Blechl A, Dubcovsky J (2006) A
NAC gene regulating senescence improves grain protein, zinc,
and iron content in wheat. Science 314:1298–1301
Vreugdenhil D, Aarts MGM, Koornneef M, Nelissen H, Ernst WHO
(2004) Natural variation and QTL analysis for cationic mineral
content in seeds of Arabidopsis thaliana. Plant Cell Environ
27:828–839
Waters BM, Grusak MA (2008) Quantitative trait locus mapping for
seed mineral concentrations in two Arabidopsis thaliana
recombinant inbred populations. New Phytol 179:1033–1047
Welch RM (1999) Importance of seed mineral nutrient reserves in
crop growth and development. In: Rengel Z (ed) Mineral
nutrition of crops: fundamental mechanisms and implications.
Food Products Press, New York, pp 205–226
Welch RM, Graham RD (2004) Breeding for micronutrients in staple
food crops from a human nutrition perspective. J Exp Bot
55:353–364
WHO (2002) World Health Organization Report 2002: Reducing
risks, promoting healthy life. World Health Organization,
Geneva
Yilmaz A, Ekiz H, Gultekin I, Torun B, Barut H, Karanlik S, Cakmak
I (1998) Effect of seed zinc content on grain yield and zinc
concentration of wheat grown in zinc-deficient calcareous soils. J
Plant Nutr 21:2257–2264
Zanetti S, Winzeler M, Feuillet C, Keller B, Messmer M (2001)
Genetic analysis of bread-making quality in wheat and spelt.
Plant Breed 120:13–19
Zhang W, Chao S, Manthey F, Chicaiza O, Brevis JC, Echenique V,
Dubcovsky J (2008) QTL analysis of pasta quality using a
composite microsatellite and SNP map of durum wheat. Theor
Appl Genet 117:1361–1377