lipid class separation using upc2/ms - waters corporation · 1 waters solutions acquity upc2 system...
TRANSCRIPT
1
WAT E R S SO LU T IO NS
ACQUITY UPC2 System with MS detection
Empower 3® Software
ACQUITY UPC2 columns
K E Y W O R D S
UPC2, MS, UPC2/MSE, lipidomics,
metabolomics, method development,
convergence chromatography
A P P L I C AT IO N B E N E F I T S ■■ Provides ACQUITY UPC2™ methodology
conditions for comprehensive lipid
intra- and inter-class analysis
■■ Highlights the method parameters that
aid as method development tools for
comprehensive lipid profiling
■■ Provides a single separation technique
and a single instrumentation approach
for rapid lipids analyses
IN T RO DU C T IO N
The analysis of complex lipids has historically been a challenging task and may
require a variety of analytical techniques. Lipids are generally recognized as
hydrophobic compounds, but the properties of complex lipids containing phosphorus,
sulfur, sugar, and nitrogen have a wide polarity range. Developing separation-based
methodology utilizing a single technique is recognized as a common challenge for
scientists researching lipidomic and metabolomic applications.
Recent advances in technology have revived the exploration of supercritical
fluid chromatography (SFC) as a viable analytical technique. Research and
development focused on improvements of SFC instrumentation has provided a
holistically designed chromatographic system that utilizes liquid CO2 as a mobile
phase to leverage the chromatographic principles and selectivity of normal phase
chromatography while providing the ease-of-use of reversed phase LC (RPLC).
This new separation technique is referred to as UltraPerformance Convergence
Chromatography™ (UPC2™).
In this application note, UPC2 technology is implemented for the analysis of
lipid class separation. Method variables influencing the peak integrity and
chromatographic separation for a mixture of lipids with different degrees
of polarity are explored. The experiments were designed to understand the
chromatographic behavior of lipids in a controlled setting using a variety of
lipid extracts. Acyl chain length and a number of double bond influences were
investigated using single moiety standards. The methodology parameters were
tested using lipid extracts composed of intra-class components. The method
conditions are applied to biological lipid extracts, whereas method adjustments
are investigated to manipulate the chromatography based on the goal of the
analyst. Insights from these method variable manipulations help to scope the
development of targeted lipid profiling and screening protocols.
Lipid Class Separation Using UPC2/MSMichael D. Jones,1,3 Giorgis Isaac,1 Giuseppe Astarita,1 Andrew Aubin,1 John Shockcor,1 Vladimir Shulaev,2 Cristina Legido-Quigley,3 and Norman Smith3
1Waters Corporation, Milford, MA, USA 2Department of Biological Sciences, Center for Plant Lipid Research, University of North Texas, Denton, Texas, USA3Pharmaceutical Science Division, School of Biomedical and Health Sciences, King’s College, London, UK

2Lipid Class Separation Using UPC2/MS
E X P E R IM E N TA L
Lipid abbreviations
CER Ceramides
SM Sphingomyelin
PG Phosphatidylglycerol
PE Phosphatidylethanolamine
PC Phosphatidylcholine
LPC Lyso-Phosphatidylcholine
LPE Lyso-Phosphatidylethanolamine
Sample Description
Samples and standards were purchased from
Avanti Polar Lipids. Mix 1 and Mix 2 were
brain (porcine) extracts except LPC and PG
which were egg (chicken) extracts. Stocks
were prepared in 50:50 chloroform/methanol.
Working lipid mixtures were prepared to the
specified concentration.
Mix 1: Ceramide, SM,
(0.05 mg/mL)
PG, PE, PC, (0.1 mg/mL)
Mix 2: LPC, LPE, (0.05 mg/mL)
Mix 3: 1:1 of [mix 1] and [mix 2]
UPC2 conditions
System: ACQUITY UPC2
Columns: ACQUITY UPC2 BEH
and HSS C18 SB
Column temp.: 60 °C
Sample temp.: 10 °C
Injection volume: 1 µL
Flow rate: 1.85 mL/min
Back pressure: 1500 psi
Mobile phase A: CO2
Mobile phase B: 50:50
methanol/acetonitrile
with 1 g/L ammonium
formate
Gradient: Refer to figures for
detailed information
MS conditions
Mass spectrometers: ACQUITY® SQD and
SYNAPT® G2 MS
Ionization mode: ESI positive
Acquisition range : 100 to 1500 Da
Capillary voltage : 3.5 kV
Cone voltage : 30 V
Informatics: Empower 3 and
MassLynx® Software
3Lipid Class Separation Using UPC2/MS
R E SU LT S A N D D IS C U S S IO N
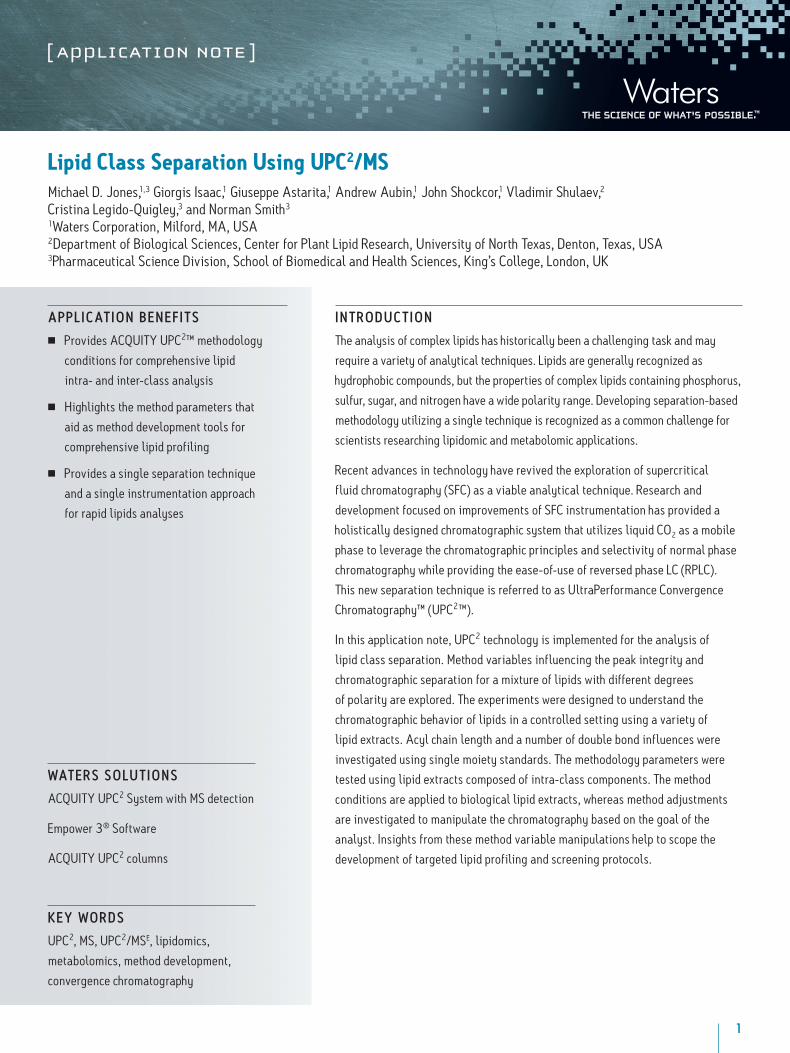
MS Optimization
The ACQUITY UPC2 System was configured with an ACQUITY single quadrupole detector (SQD) for this
preliminary investigation of chromatographic parameters. Injections of [Mix 3] were screened with different
cone and capillary voltages to determine the best operating conditions. Based on the cone voltage screening
results, 30 V was chosen for controlling overall in-source fragmentation of the optimal signal for the spectra of
L-α-phosphatidylglycerol (egg PG) to provide precursor ion and valuable fragmentation information, as shown
in Figure 1A. The optimal capillary voltage observed for all the peaks in the [Mix 3] was 3.5 to 4.0 kV, as shown
in Figure 1B. The final MS conditions used 3.5 kV capillary voltage and 30 V cone voltage.
1.569 Peak 1 - SQ 1: MS Scan 1: 300.00-1000.00 ES+, Centroid, CV=Tune
577.4 749.5
764.5
766.5
767.5
794.5Inte
nsity
0.0
1.6x10⁶
3.2x10⁶
4.8x10⁶
6.4x10⁶
1.571 Peak 1 - SQ 1: MS Scan 1: 300.00-1000.00 ES+, Centroid, CV=Tune
575.4
577.4
578.5603.4
747.4
749.4764.4
766.5
767.5792.5
Inte
nsity
0.0
9.0x10⁵
1.8x10⁶
2.7x10⁶
3.6x10⁶
1.573 Peak 1 - SQ 1: MS Scan 1: 300.00-1000.00 ES+, Centroid, CV=Tune
575.4
577.5
578.5603.4
747.5749.5766.5
Inte
nsity
0.00
2.50x10⁶
5.00x10⁶
7.50x10⁶
1.00x10⁷
1.571 Peak 1 - SQ 1: MS Scan 1: 300.00-1000.00 ES+, Centroid, CV=Tune
575.5
577.4
578.5603.5In
tens
ity
0.0
4.0x10⁶
8.0x10⁶
1.2x10⁷
1.6x10⁷
m/z350.00 420.00 490.00 560.00 630.00 700.00 770.00 840.00 910.00 980.00
20 V
30 V
40 V
50 V
Inte
nsity
1.6x10⁷
3.2x10⁷
4.8x10⁷
6.4x10⁷
Minutes1.12 1.19 1.26 1.33 1.40 1.47 1.54 1.61 1.68 1.75
1.0 kV
1.5 kV
2.0 kV
2.5 kV
3.5 kV
4.0 kV
3.0 kV
A B
Figure 1. (A) Cone voltage screening results for L-α-phosphatidylglycerol; and (B) capillary voltage screening results for L-α-phosphatidylglycerol.
4Lipid Class Separation Using UPC2/MS
Chromatographic method development
The sample preparation workflow was very convenient for use with the ACQUITY UPC2 System.
The chloroform/methanol diluent provided good solubility without any noticeable adverse effects on peak
shape. In a typical RPLC lipid analysis, the organic extract containing the lipids would have to be evaporated
and re-constituted in a more compatible solvent. When using UPC2, however, the organic extract containing
the lipids can be directly injected onto the system, thereby saving time and costs when analyzing hundreds of
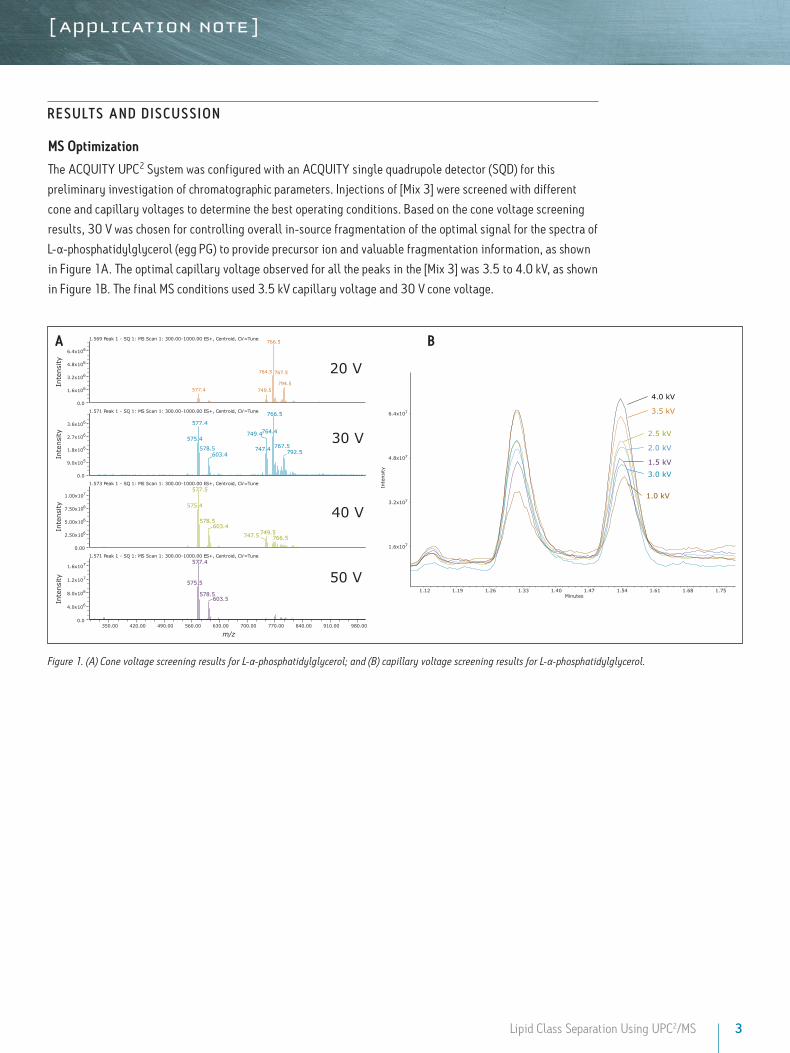
biological samples. Screening different column stationary phases typically changes selectivity during method
development. Therefore, our initial approach was to screen three stationary phases including UPC2 CSH
Fluoro-Phenyl, UPC2 BEH 2-EP, and UPC2 BEH. Optimal peak shape and selectivity was achieved on the
UPC2 BEH stationary phase for the inter-class separation of the lipid mixture, as shown in Figure 2.
Inte
nsity
7
8
8
8
Inte
nsity
7
8
8
8
Inte
nsity
7
8
8
0.0
7.0x10
1.4x10
2.1x10
2.8x10
0.0
5.0x10
1.0x10
1.5x10
2.0x10
0.0
8.0x10
1.6x10
2.4x10
3.2x10⁸
Minutes
0.00 1.20 2.40 3.60 4.80 6.00 7.20 8.40 9.60 10.80 12.00
UPC2 CSH Fluoro-Phenyl
UPC2 BEH 2-EP
UPC2 BEHFigure 2. Column screening of the [metdev] mixture of neutral and polar lipids. A 12-minute 10% to 50% B screening method was used. Due to less retentivity of the BEH 2-EP and CSH Fluoro-Phenyl columns, the gradients were modified (10% to 30% B) to adjust for comparative use of the separation space. The mobile phase co-solvent was 1 g/L ammonium formate in MeOH derived from previously published reports.1
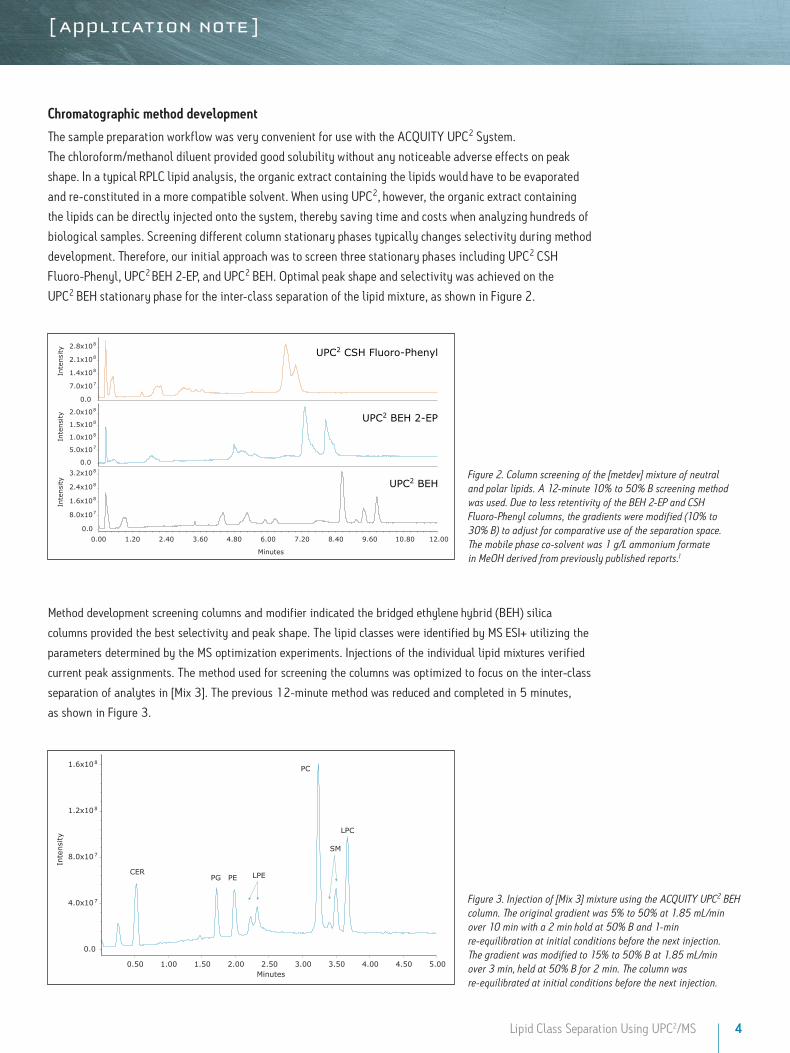
Method development screening columns and modifier indicated the bridged ethylene hybrid (BEH) silica
columns provided the best selectivity and peak shape. T he lipid classes were identified by MS ESI+ utilizing the
parameters determined by the MS optimization experiments. Injections of the individual lipid mixtures verified
current peak assignments. T he method used for screening the columns was optimized to focus on the inter-class
separation of analytes in [Mix 3]. T he previous 12-minute method was reduced and completed in 5 minutes,
as shown in Figure 3.
Inte
nsity
0.0
4.0x10⁷
8.0x10⁷
1.2x10⁸
1.6x10⁸
Minutes0.50 1.00 1.50 2.00 2.50 3.00 3.50 4.00 4.50 5.00
CERPG PE
PC
LPC
LPE
SM
Figure 3. Injection of [Mix 3] mixture using the ACQUITY UPC2 BEH column. The original gradient was 5% to 50% at 1.85 mL/min over 10 min with a 2 min hold at 50% B and 1-min re-equilibration at initial conditions before the next injection. The gradient was modified to 15% to 50% B at 1.85 mL/min over 3 min, held at 50% B for 2 min. The column was re-equilibrated at initial conditions before the next injection.

5Lipid Class Separation Using UPC2/MS
The lipid extracts purchased from Avanti provide documentation indicating various ratios of lipid intra-class
constituents present within a respective standard extract. T his was further confirmed when evaluating the mass
spectral data for the two LPE peaks observed in chromatographic trace, as shown in Figure 4. It was found that
the elution order of the molecular species within each lipid class depended on the number of double bonds on
the acyl chain. T hus, the more saturated the acyl chain, the shorter the retention time. T he acyl chain length has
no effect on the elution order with each lipid class. Interestingly, the intra-class separation of LPE and SM stan-
dard extracts is observed when using the UPC2 BEH stationary phase. T he other stationary phases that provided
broader peaks may offer a better intra-class separation of the Avanti extract standards. T his hypothesis will be
explored in future studies.
Combined - SQ 1: MS Scan 1: 300.00-1000.00 ES+, Centroid, CV=Tune
438.4
454.3
466.4
467.4
482.3
483.3
488.3
504.3
520.3
Inte
nsity
0.00
3.50x10⁵
7.00x10⁵
1.05x10⁶
1.40x10⁶
Combined - SQ 1: MS Scan 1: 300.00-1000.00 ES+, Centroid, CV=Tune
341.3
363.1372.2 462.2
464.3
465.4
480.3
482.3
483.5
502.3
504.2
Inte
nsity
0
200000
400000
600000
800000
m/z306.00 340.00 374.00 408.00 442.00 476.00 510.00 544.00 578.00 612.00
18:0m/z=482.3
18:1m/z=480.3
O
O
HOHO O
NH2
POH
O
CH3
O
O
HOHO O
NH2
POH
OCH3
Inte
nsi
ty
0.00
4.50x10⁶
9.00x10⁶
1.35x10⁷
1.80x10⁷
Minutes4.84 4.95 5.06 5.17 5.28 5.39 5.50 5.61 5.72 5.83
=49'
18:0 18:1
Figure 4. Interrogation of MS spectra for the two LPE peaks.
Manipulating retentivity
The method development process explored changes in gradient slope;
however, changes in resolution were not significant. Experiments to
manipulate retentivity were investigated. T he variable which resulted
in the greatest retentivity changes included the addition of a less
polar solvent, such as acetonitrile, to the modifier. Two experiments
were performed. T he first was conducted with the original
modifier composition of 100% methanol. T he second experiment
was conducted with modifier composition of 80% methanol and
20% acetonitrile. Both modifiers were doped with 1 g/L ammonium
formate. In general, using acetonitrile in the modifier improved
resolution, as shown in Table 1.
Peak ID 100% MeOH (RS)
80:20 MeOH:ACN (RS)
% Difference
PG – – –
PE 2.69 3.54 +31.6
LPE 1 1.96 2.74 +39.8
LPE 2 1.67 2.17 +29.9
PC 10.81 8.56 -20.8
SM (1) 2.24 2.07 -7.6
SM (2) 1.10 1.06 +45.5
LPC 1.33 1.05 +12.8
Table 1. Impact of modifier composition on lipid resolution. Ceramide was excluded due to the large amount of resolution from the other peaks of interest.
6Lipid Class Separation Using UPC2/MS
Analysis of biological samples
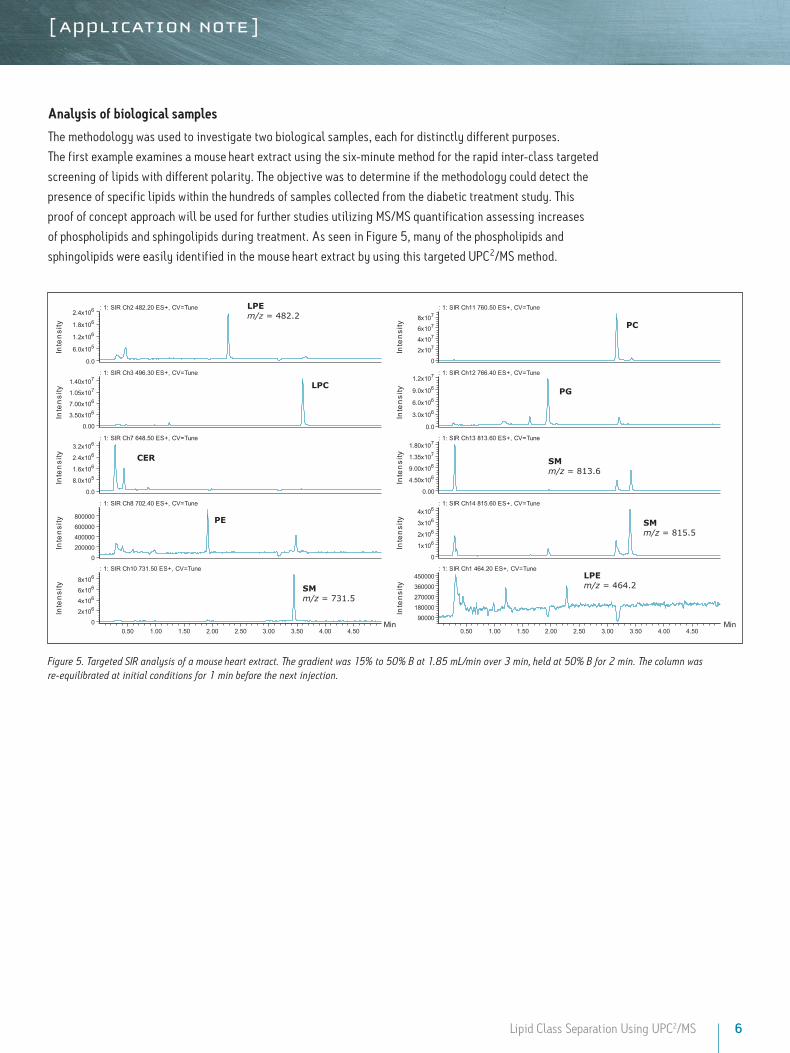
The methodology was used to investigate two biological samples, each for distinctly different purposes.
The first example examines a mouse heart extract using the six-minute method for the rapid inter-class targeted
screening of lipids with different polarity. The objective was to determine if the methodology could detect the
presence of specific lipids within the hundreds of samples collected from the diabetic treatment study. This
proof of concept approach will be used for further studies utilizing MS/MS quantification assessing increases
of phospholipids and sphingolipids during treatment. As seen in Figure 5, many of the phospholipids and
sphingolipids were easily identified in the mouse heart extract by using this targeted UPC2/MS method.
: 1: SIR Ch2 482.20 ES+, CV=Tune
Inte
nsi
ty
0.0
6.0x10⁵
1.2x10⁶
1.8x10⁶
2.4x10⁶
: 1: SIR Ch3 496.30 ES+, CV=Tune
Inte
nsi
ty
0.00
3.50x1067.00x1061.05x1071.40x107
: 1: SIR Ch7 648.50 ES+, CV=Tune
Inte
nsi
ty
0.0
8.0x1051.6x1062.4x1063.2x106
: 1: SIR Ch8 702.40 ES+, CV=Tune
Inte
nsi
ty
0200000400000600000800000
: 1: SIR Ch10 731.50 ES+, CV=Tune
Inte
nsi
ty
0
2x1064x1066x1068x106
Min Min0.50 1.00 1.50 2.00 2.50 3.00 3.50 4.00 4.50
: 1: SIR Ch11 760.50 ES+, CV=Tune
Inte
nsi
ty
0
2x1074x1076x1078x107
: 1: SIR Ch12 766.40 ES+, CV=Tune
Inte
nsi
ty
0.0
3.0x10⁶
6.0x10⁶
9.0x10⁶
1.2x10⁷
: 1: SIR Ch13 813.60 ES+, CV=Tune
Inte
nsi
ty
0.00
4.50x1069.00x1061.35x1071.80x107
: 1: SIR Ch14 815.60 ES+, CV=Tune
Inte
nsi
ty
0
1x1062x1063x1064x106
: 1: SIR Ch1 464.20 ES+, CV=Tune
Inte
nsi
ty
90000
180000
270000
360000
450000
0.50 1.00 1.50 2.00 2.50 3.00 3.50 4.00 4.50
LPEm/z = 482.2
LPEm/z = 464.2
SMm/z = 813.6
PG
PC
SMm/z = 815.5
SMm/z = 731.5
LPC
PE
CER
Figure 5. Targeted SIR analysis of a mouse heart extract. The gradient was 15% to 50% B at 1.85 mL/min over 3 min, held at 50% B for 2 min. The column was re-equilibrated at initial conditions for 1 min before the next injection.

7Lipid Class Separation Using UPC2/MS
Neutral lipids, such as acylglyceride and cholesterol esters, are characteristically non-polar. Typically, plant
metabolomic profiling distinguishes heterogeneous distribution of neutral lipids, such as triacylglycerols and
diacylgylcerols2 at different conditions. The example in Figure 6 investigates lipids present in a cotton seed oil
extract. The data was collected using MSE on a SYNAPT G2 Mass Spectrometer allowing for the characterization
of the neutral lipids by precursor and product ion alignment. During the method development process,
many neutral lipids eluted near the chromatographic void when starting the compositional gradient above
5% modifier using methanol (or methanol/acetonitrile). In this example, the UPC2/MS method was modified to
retain the neutral lipids by reducing the starting percentage of modifier. The modifier was ramped to elute the
polar lipids, known to be present as membrane lipid classes in cotton embryos.2 By using this approach, the
chromatography can be altered to provide greater retention, and often greater specificity for the neutral lipids.
From an analytical technique perspective, the elution mechanisms are conceptually similar to performing a
mobile phase gradient elution profile by liquid chromatography.
Low energy
High energy
PCDAG
NAPE
50%
2%
TAG
Figure 6. Comprehensive profiling of a cotton seed oil extract. The gradient was 2% to 5% B over 5 min, increased to 50% B over 10 min, and held at 50% B for 2 min using a flow rate of 1.85 mL/min. The column was re-equilibrated at initial conditions for 1 min before the next injection.
Waters Corporation34 Maple Street Milford, MA 01757 U.S.A. T: 1 508 478 2000 F: 1 508 872 1990 www.waters.com
Waters, ACQUITY, SYNAPT, Empower, and MassLynx are registered trademarks of Waters Corporation. UltraPerformance Convergence Chromatography, UPC2, ACQUITY UPC2, and T he Science of What’s Possible are trademarks of Waters Corporation. All other trademarks are the property of their respective owners.
©2013 Waters Corporation. Produced in the U.S.A.February 2013 720004579EN AG-PDF
CO N C LU S IO NS
A flexible universal method was developed for the analysis of
inter-class separations of neutral and amphipathetic lipids.
Since the goal of the experiment was to achieve flexible parameters
providing the separation of lipids by class, the core methodology
using the ACQUITY UPC2 BEH column, methanol/acetonitrile
modifier with ammonium formate as an additive provided the best
results. The gradient methodology and run time was adjustable
to focus on rapid screening or comprehensive profiling of lipids
in biological samples. The lipid sample preparation workflow is
suitable for UPC2. The organic phase of the biological lipid extract
can be directly injected onto the ACQUITY UPC2 System with
MS detection, thereby saving time and operating costs.
The rapid inter-class screening provided an analysis within seven
minutes including re-equilibration. The MS spectral information
confirmed instances of intra-class separation by distinguishing
between the degrees of saturation, as demonstrated for
the Lyso- Phosphatidylethanolamine separation on the
ACQUITY UPC2 BEH column. Resolution can be increased within
the chromatographic space by the addition of acetonitrile. For
this methodology, an increase of 30% to 40% resolution can be
observed between lipid classes for the majority of the analytes.
The method development knowledge gained from these
experiments build a foundation for the applicability of lipid
analysis by convergence chromatography.
References
1. Bamba T, Shimonishi N, et al. High throughput and exhaustive analysis of diverse lipids by using supercritical fluid chromatography-mass spectrometry for metabolomics. J Biosci Bioengin. 2008 May; 105(5): 460-469.
2. Horn PJ, Korte AR, Neogi PB, et al. Spatial Mapping of Lipids at Cellular Resolution in Embryos of Cotton. Plant Cell. 2012 Feb; 24(2): 622-636.