lipid eye drops containing cyclodextrin and a polymer ... eye drops containing cyclodextrin and a...
TRANSCRIPT
Lipid Eye drops Containing Cyclodextrin and a Polymer
Formulation, Characteristics and Stability
Hróðmar Jónsson
M. Sc. Thesis in Pharmacy
University of Iceland
Faculty of Pharmaceutical Sciences
School of Health Sciences
Lipid Eye drops Containing Cyclodextrin and a Polymer
Formulation, Characteristics and Stability.
Hróðmar Jónsson
M.Sc. thesis in Pharmacy
Supervisor: Þorsteinn Loftsson
Faculty of Pharmaceutical Sciences
School of Health Sciences at the University of Iceland
June 2013

Augndropar úr Sýklódextríni, Fitu og Fjölliðu
Formúlering, Eiginleikar og Stöðugleiki
Hróðmar Jónsson
Meistararitgerð í lyfjafræði
Umsjónarkennari: Þorsteinn Loftsson
Lyfjafræðideild
Heilbrigðisvísindasvið Háskóla Íslands
Júní 2013


v
This thesis is for a M.Sc. degree in pharmacy and may not be reproduced in any way without
the permission of the author
© Hróðmar Jónsson 2013
Printed by Háskólaprent
Reykjavík, Iceland 2013
vi
Author Hróðmar Jónsson
Supervisor/ Þorsteinn Loftsson, Ph. D.
Professor
Faculty of Pharmaceutical Sciences, University of
Iceland
Instructors Sergey Kurkov, Ph.D.
Post doctoral fellow
Faculty of Pharmaceutical Sciences, University of
Iceland

vii
ABSTRACT
Lipid Eye drops Containing Cyclodextrin and a Polymer.
Formulation, Characteristics and Stability
The eye is a sensory organ that makes everyday life of more convenience. Even though eyes
are considerably protected from nature’s way, eye disease and discomfort are considerably
common, especially dry eye disease. Today the most common treatment of dry eye is
palliative instead of correcting the inflammatory state associated with dry eye disease. It has
been demonstrated that ω-3 fatty acids, which can be found in large quantities in cod liver oil,
are anti-inflammatory. The intake of these fatty acids has been linked to reduced risk of dry
eye disease and, when topically applied, to reduce various indicators used to assess dry eye
disease and inflammation. Long, polyunsaturated free fatty acids have also demonstrated anti-
bacterial and -viral effect.
Cyclodextrins are cyclic oligosaccharides that have the ability to form water soluble
complexes with lipophilic drugs and at the same time improve their stability. Cyclodextrins
have been shown to form complexes with the above mentioned lipids and improve both their
solubility and stability.
The purpose of this project was to formulate eye drops that contained cod liver oil as well as
free fatty acids, stabilized with cyclodextrin. Previously it has been demonstrated that only the
parent α-, β- and γ-cyclodextrin are able to form complexes with the lipids and that a
cyclodextrin concentration of 10% w/v and 10% v/v of the lipids were optimal. Of the
cyclodextrins tested, γ-cyclodextrin gave the best results. The effect of different polymers,
with and without preservatives, on flocculation, redispersion, surface tension, viscosity and
osmolality were studied. Formulation containing preservatives with 2.5% w/v poloxamer 407
and one with 5% poloxamer were superior to others. The particle size distribution complied
with the European Pharmacopeia on particle size in eye drops and the peroxide value
indicated that the CD protected the lipids from oxidation.

viii
ÁGRIP
Augndropar úr Sýklódextríni, Fitu og Fjölliðu
Formúlering Eiginleikar og Stöðugleiki
Augun eru eitt af skynfærum líkamans sem gera daglegt líf auðveldara. Þrátt fyrir að vera
talsvert vernduð frá náttúrunnar hendi eru augnsjúkdómar og aðrir kvillar algengir meðal
einstaklinga og er augnþurrkur einna algengastur. Flest öll lyfjameðferð í dag gegn augnþurrki
felur í sér skyndilausnir í stað þess að leiðrétta það bólguástand sem tengist honum. Sýnt
hefur verið fram á að ω-3 fitusýrur, sem meðal annars er að finna í miklum magni í
þorskalýsi, eru bólguhemjandi. Inntaka á þessum fitusýrum hefur meðal annars verið tengd
við minni hættu á augnþurrki auk þess sem staðbundin notkun í augu músa dró úr
mælikvörðum sem eru notaðir eru til að meta hann. Langar, fjölómettaðar fitusýrur á fríu
formi hafa auk þess sýnt fram á bakteríu- og veiruhemjandi verkun.
Sýklódextrín eru hringlaga fásykrur sem hafa þann eiginlega að mynda vatnsleysanlegur
fléttur með torleysanlegum lyfjaefnum og um leið auka stöðugleika þeirra. Sýnt hefur verið
fram á að sýklodextrín geta myndað fléttur með þessum fituefnum og aukið bæði leysanleika
og stöðugleika þeirra.
Markmið þessa verkefnis var að þróa augndropa sem innihéldu þorskalýsi sem og fríar
fitusýrur, stöðgaðar með sýklodextríni. Áður hefur verið sýnt fram á að aðeins náttúrulegu α-,
β- og γ-sýklodextrín gætu myndað fléttur með fituefnunum og að hlutföllin 10% w/v
sýklodextrín og 10% v/v fituefni væru ákjósanlegust. Af þessum sýklodextrínum kom γ-
sýklodextrín best út. Áhrif ýmissa fjölliða, með og án rotvarnarefna, á setmyndun,
upphristanleika, yfirborðsvirkni, seigjustig og osmólastyrk var rannsakaður og var það lausn
sem innihélt rotvarnarefni og 2.5% w/v poloxamer 407 ásamt lausn sem innihélt 5%
poloxamer 407 sem kom best út. Kornastærðin uppfyllti kröfur Evrópsku lyfjskrárinnar um
kornastærð augndropa og peroxíð gildi gáfu til kynna að sýklódexdrínin vernduðu fituefnin að
hluta fyrir oxun.
ix
LIST OF ABBREVIATIONS
ALA α linolenic acid
AV Anisidine value
ARA Arachidonic acid
BAK Benzalkonium chloride
CFS Corneal fluorescein staining
CLA Conjugated linolenic acid
CMC-Na Sodium salt of carboxymethyl cellulose
cP centipoise
DHA Docosahexaenoic acid
EPA Eicosapentaenoic acid
EDTA Ethylenediaminetetraacetic acid
FA Fatty acid
HPMC Hydroxypropyl-methylcellulose
HSV Herpes simplex virus
IL Interleukin
LA Linolenic acid
N neutons
Osm osmol
PGE Prostaglandins
PUFA Polyunsaturated fatty acid
PV Peroxide value
PVA Polivinyl alcohol
PVP Polivinyl pyrrolidone
SD standard deviation
TNF – α Tumor necrosis factor α

x
TABLE OF CONTENTS
1. INTRODUCTION .............................................................................................................. 2
1.1 THE EYE ............................................................................................................................ 2
1.1.1 Anatomy of the eye ................................................................ 2
1.1.2 The meibum ................................................................................... 4
1.1.3 Dry eye .......................................................................................... 4
1.1.4 Etiology of dry eyes ....................................................................... 6
1.1.5 Prevalence and treatment of dry eye ............................................. 7
1.1.6 Drug delivery to the eye ................................................................ 7
1.1.7 Formulation standards for eye drops ............................................ 8
1.2 LIPIDS ............................................................................................................................. 10
1.2.1 Fatty acids ........................................................................... 10
1.2.2 Essential Fatty Acids ........................................................... 11
1.2.3 ω-3 and diseases ................................................................. 13
1.2.4 Fish oil ................................................................................ 14
1.2.5 Antibacterial and antiviral effects of PUFAs ..................... 16
1.3 CYCLODEXTRINS ............................................................................................................ 17
1.3.1 Structure of cyclodextrins ................................................... 17
1.3.2 Cyclodextrin complexation ................................................. 18
1.3.3 Cyclodextrin toxicology ...................................................... 20
1.3.3.1 Ophthalmic toxicology .............................................................................................. 20
1.3.4 Cyclodextrins in ophthalmic drug delivery ......................... 21
1.3.5 Cyclodextrins and lipids...................................................... 21
1.4 POLYMERS ...................................................................................................................... 23
2. AIM OF THE STUDY ..................................................................................................... 25
3. EQUIPMENTS, MATERIALS AND METHODS ........................................................ 26
3.1 EQUIPMENTS ................................................................................................................... 26
3.2 MATERIALS .................................................................................................................... 26
xi
3.3 METHODS ....................................................................................................................... 27
3.3.1 Water content determination ............................................... 27
3.3.2 Cyclodextrin solutions preparation .................................... 27
3.3.3 Deoxygenation of the CD solutions .................................... 28
3.3.4 Cyclodextrin-polymer solutions preparation ...................... 28
3.3.5 Preparation of the system of cyclodextrin, polymer and
lipids 29
3.3.6 Flocculation Test ................................................................. 29
3.3.7 Dispersion and smell ........................................................... 29
3.3.8 Surface tension .................................................................... 30
3.3.9 Viscosity .............................................................................. 30
3.3.10 Osmolality ........................................................................... 31
3.3.11 Particle size distribution ..................................................... 32
3.3.12 Peroxide value test .............................................................. 32
3.3.12.1 Lipid extraction. ........................................................................................................ 33
3.3.12.2 Titration..................................................................................................................... 34
3.3.12.3 Blending the solutions used in the titration ............................................................... 35
3.3.12.4 Statistics .................................................................................................................... 35
4. RESULTS .......................................................................................................................... 36
4.1 FORMULATIONS 1 - 29 .................................................................................................... 36
4.1.1 Water content of the CDs .................................................... 36
4.1.2 CD – lipid formulations ...................................................... 36
4.1.3 CD – polymer – lipid formulation ....................................... 37
4.1.4 Testing the formulations...................................................... 38
4.1.4.1 Flocculation test, redispersion and smell .................................................................. 38
4.1.4.2 Viscosity ................................................................................................................... 40
4.1.4.3 Surface tension .......................................................................................................... 41
4.1.4.4 Osmolality ................................................................................................................. 42
4.2 FORMULATIONS 30- 39 ................................................................................................... 42
4.2.1 CD – polymer – lipid formulation ....................................... 42

xii
4.2.2 Testing the formulations...................................................... 43
4.2.2.1 Flocculation test ........................................................................................................ 43
4.2.2.2 Surface tension .......................................................................................................... 43
4.2.2.3 Viscosity ................................................................................................................... 44
4.2.2.4 Osmolality ................................................................................................................. 44
4.3 FORMULATIONS 30 AND 33 ............................................................................................ 45
4.3.1 Particle size distribution ..................................................... 45
4.3.2 Peroxide value ..................................................................... 46
4.3.3 40-days flocculation ............................................................ 47
5. DISCUSSION .................................................................................................................... 48
5.1 CD-POLYMER-LIPID FORMULATIONS ............................................................................. 48
5.2 FORMULATIONS 6-29. ..................................................................................................... 48
5.3 FORMULATIONS 30-39. ................................................................................................... 51
5.4 FORMULATIONS 30 AND 33 ............................................................................................ 52
6. CONCLUSION ................................................................................................................. 54
7. ACKNOWLEDGEMENT ............................................................................................... 55
8. REFERENCES ................................................................................................................. 56
9. APPENDICES..................................................................................................................... B
9.1 APPENDIX A ........................................................................................................................ B
9.2 APPENDIX B ........................................................................................................................ C
9.3 APPENDIX C ....................................................................................................................... D
9.4APPENDIX D ......................................................................................................................... E
9.5 APPENDIX E ......................................................................................................................... F
9.6 APPENDIX F ........................................................................................................................ G
9.7 APPENDIX G ....................................................................................................................... H
9.8 APPENDIX H ....................................................................................................................... K
9.9 APPENDIX I ......................................................................................................................... N

xiii
TABLE OF TABLES
Table 1 A list of polymers used in combination with CD .............................................. 24
Table 2 The water content of the CDs used.................................................................... 36
Table 3 Results from the formulation of different cyclodextrins with cod liver oil and
free fatty acids ................................................................................................................ 36
Table 4 Concentrations and results from the CD – polymer – lipid formulations ......... 37
Table 5 Flocculation, redispersion and smell of the formulations ................................. 38
Table 6 Composition of re-prepared monophasic formulations ..................................... 42

xiv
TABLE OF FIGURES
Figure 1 Schematic view of the eye ................................................................................. 3
Figure 2 The cycle of dry eye ........................................................................................... 5
Figure 3 Schematic picture of the origin and fate of ω-3 and ω-6 FAs .......................... 12
Figure 4 Time dependence of Peroxide value, Anisidine Value and Totox numbers .... 15
Figure 5 Characteristics of the natural CDs.................................................................... 19
Figure 6 Illustration of how the particles were assessed. ............................................... 32
Figure 7 Stirring of the filtered polymer mud after filtering for 12 hours...................... 33
Figure 8 Appearance of formulations after being in the flocculation test for 8 days.. ... 39
Figure 9 Viscosity of the formulation in centipoises. ..................................................... 40
Figure 10 Surface tension of the formulations that were eligible for measurements ..... 41
Figure 11 Surface tension of the new formulations. ....................................................... 43
Figure 12 Viscosity of the new formulations in centipoises .......................................... 44
Figure 13 Osmolality, in milliosmoles/kg solute of the new formulations. ................... 45
Figure 14 Peroxide value of formulations 30, 33 and “pure cod liver oil plus free fatty
acids” at different conditions .......................................................................................... 46
Figure 15 40-days flocculation test ................................................................................ 47
2
1. INTRODUCTION
1.1 The eye
The eye is a complex organ that gives us the ability to see. Whether it is a simpler eye
of microorganism that can only distinguish between light and dark or a more complex
eye like that of hawk, it is usually paramount to life. As for human, although vision is
not a survival factor any more it still remains essential providing ca. 90% of all
information from surrounding environment.
1.1.1 Anatomy of the eye
The eye is one of five sensory organs of the human body and is responsible for vision.
The eyeball is about 2.5 cm in diameter with a slight projection in the front. The
eyeball sits protected in a bony hollow cavity where it is surrounded by fibrous tissue,
muscles and soft layer of fat. The lacrimal gland, which is located behind the upper
eyelid, produces tears that lubricate the eye with the help of the eyelid, as well as
nourishing and cleaning it off foreign substances (Harvard Medical School, 2010). As
well as helping to lubricate the eye, the eyelids protect the vulnerable ocular surface
from physical injury (Benitez-Del-Castillo, 2012). The normal mean tear volume is
6,5µl (Scherz, Doane, & Dohlman, 1974). The wall surrounding the eye is made up of
three distinct layers. The first layer, called the surface layer, is made up of tough
collagen. It can be seen in front of the eye as both the sclera and the cornea. The middle
layer, called the uveal tract, contains the iris, ciliary body and choroid. The iris can be
seen as a pigmented segment around the pupil. Essentially a circular muscle fiber, the
iris regulates how much light enters the eye. Depending on the brightness, the
involuntary muscles relax or stretch allowing more light into the eye when it is dusk or
less light when it is bright. The choroid membrane is crowded with blood vessels
carrying oxygen and other nutrients to the nearby outer portion of the retina. The
crystalline lens, located behind the pupils and iris, focuses light rays on the thin, light
sensitive retina which is referred to as the third layer. Muscles located in the ciliary
body enable the retina to alter its shape for focusing on objects at varying distances
(Harvard Medical School, 2010; Silverthorn, 2009). Located within one of the ten layers

3
of the retina (Herzlich A A., Patel M., Sauer T C., & Chan, 2010) are cones and rods,
specialized cells that, with the help of visual pigment molecules, enable us to see. Cones
are responsible for color vision and work best in relatively bright light. About 7 million
cones are located within each eye where they are densely packed in the fovea but
quickly reduce in numbers toward the periphery of the retina. Rods can function in less
light than cones and are mainly used in peripheral vision. About 150 million rods are
located within each eye where they are evenly distributed throughout the retina
(Harvard Medical School, 2010). The cornea consists of three membranes, the
epithelium which is in contact with the tears, the inner stroma and the endothelium. The
lipophilic layered epithelium acts as a barrier to ion transport. Tight junctions located at
the epithelium prevent the diffusion of large molecules via the paracellular route but
selectively allow some smaller molecules to be absorbed. The stroma is a highly
hydrophilic layer and makes up 90% of the cornea. The endothelium maintains corneal
hydration (Le Bourlais et al., 1998).
The ciliary epithelium generates
aqueous humor generally found
between the iris and the cornea
providing water-dissolved nutrients
to the lens and carrying waste
products away from the lens,
draining into the Schlemm’s canal
(Davies, 2000; Harvard Medical
School, 2010; Silverthorn, 2009).
The clear and gel-like vitreous
humor, located behind the lens,
supports and fills the rear two-thirds
of the eyeball with a volume of about
4ml in adults. Made up, almost
entirely, of water with glucose, hyaluronic acid, collagen fibers, inorganic salts and
ascorbic acid it serves as a pathway for light coming through the lens and maintains the
shape of the eyeball (Bochot & Fattal, 2012; Silverthorn, 2009). Figure 1 shows a
schematic diagram of the most important parts of the eye.
Figure 1 Schematic view of the eye
(Davies, 2000; Rhcastilhos, 2007)

4
1.1.2 The meibum
The tear film is a highly important layer between the eye surface from one side and
either environment or the eyelid from another side. The tear film is mostly aqueous in
nature, formed from secretions of the lacrimal glands. However, although minor in
quantity, the lipids secreted from the meibomian glands are crucial to its function. The
thickness of the tear film is approximately 10µm where approximately 99% of the
thickness is occupied by an aqueous layer containing inorganic salts, small molecular
weight organic substances and biopolymers. Over the aqueous tear film is a much
thinner film containing the meibomian lipids (Tiffany, 1985) sometimes referred to as
meibum. The meibum is squeezed out of the meibomian glands during the course of an
eye blink due to contractions of nearby muscles. During sleep and periods of reduced
blinking the meibum accumulates in the ducts of the glands and can be expressed in
quantity by forced blinking (Benitez-Del-Castillo, 2012; Perry, 2008). The meibum
consists of polar and nonpolar lipids. The polar lipids act as a surfactant to help spread
the nonpolar lipids over the aqueous part of the tear film. Healthy meibum is vital for
healthy ocular surface, as the lipids in the meibum help to spread and stabilize the tear
film, prevent the contamination of the tear film by sebum, help seal the apposed lid
margins during sleep, lubricate the eye during blinking and last but not least, slow down
the evaporation of the aqueous tear component (Goto, 2003; Tiffany, 1985). Production
of meibum is regulated by a number of endogenous substances, including androgens,
progestin, estrogen, corticotrophin-releasing hormone, substance P and the autonomic
nervous system (Perry, 2008). Goblet cells and conjunctival epithelial cells also aid in
the protection of the ocular surface by their ability to secrete mucin (Stern, Gao,
Siemasko, Beuerman, & Pflugfelder, 2004).
1.1.3 Dry eye
As we proceed into life we are more susceptible to various disorder of the body. With
increased age the appearance and function of the eye change. Eyelid muscles weaken
and the skin becomes thinner. Eyelashes and eyebrows become thinner and tear
production slows down. Meibum secretion decreases which could result in increased
evaporation of the tear film (Harvard Medical School, 2010).

5
The ocular surface is one of the most fragile ones on the human body, yet it is
challenged by many factors such as different air currents, low humidity, foreign bodies
and attacks by microorganisms. To cope with these challenges the ocular surface and its
individual components, especially the tear film, are in a highly dynamic state and share
feedback mechanisms which results in simultaneous reaction to cope with these
challenges. Tear production is essential for sustaining the health of the ocular surface as
they help to cleanse, lubricate and nourish the eye as well as providing physical
protection against infection (Rolando & Zierhut, 2001). Ocular surface disorders, dry
eye disease in particular, are the leading reason for visits to eye care professionals. The
cause of dry eye, sometimes referred to as keratoconjunctivitis sicca meaning “dry
inflammation of the cornea and conjunctiva” in Latin , can be diverse (Fig. 2) and can
rely upon both underlying conditions and external assaults (Baudouin, 2001). Not
shown on the picture is the hypothesis that some medication, and poly pharmacy in
particular, can be the cause of dry eye (Fraunfelder, Sciubba, & Mathers, 2012).
Compared to normal individuals with a mean tear volume of about 6,5µl, dry eye
patients had a moderate decrease or a mean of 4,8µl (Scherz et al., 1974).
Figure 2 The cycle of dry eye (Baudouin, 2001)
6
1.1.4 Etiology of dry eyes
Dry eye disease can be distinguished into two forms, aqueous or tear deficient dry eye
in which the primary etiology is reduction in the amount of tears produced and
evaporative dry eye in which tear production is sufficient but evaporation due to
deficiency of the lipid layer reduces the effectiveness of the tear film. Aqueous deficient
dry eye can further be classified to Sjögren’s syndrome dry eye, autoimmune disorder
affecting both the lacrimal and salivary glands, and non-Sjögren’s syndrome which
include other causes of tear deficiency (Baudouin, 2001). The usual cause of
evaporative dry eye is obstruction of the meibomian glands, resulting in deficiency of
the lipid layer that allows faster evaporation of moisture than the lacrimal glands can
compensate for, from the eye surface. This is referred to as meibomian gland
dysfunction (Foulks et al., 2012; Rolando & Zierhut, 2001). A lack of tear production or
reduced amount of tears due to increased evaporation exposes the ocular surface to the
risk of damage caused by environmental factors. Due to the desiccating environment, a
chronic inflammatory state arises at both the ocular surface and at the lacrimal glands.
This chronic inflammatory state leads to secretion of inflammatory cytokines from the
lacrimal gland and the ocular surface (Stern et al., 2004). Epithelial cells may
independently produce interleukin (IL)-1α, IL-6, IL-8 and tumor necrosis factor-α
(TNF-α), all of which are inflammatory cytokines or chemokine, and might participate
in or amplify immune-based inflammation (Baudouin, 2001; Stern et al., 2004). T-cells
are activated, resulting in the release of inflammatory mediators, causing further
inflammation and damage to the ocular surface. As the disease progresses, tear
production diminishes due to infiltration of lymphocytes which amplify the immune
response with the secretion of more inflammatory cytokines, impairment of the
conjunctival epithelium, dysfunction or destruction of the lacrimal glands and loss of a
reflex tear response to sensory nerve impulses (Stern et al., 2004). In addition, these
inflammatory mediators might inhibit neural signals of the lacrimal glands, depriving
the gland of the stimulation needed for its maintenance, progressing its destruction
(Zoukhri, Hodges, & Dartt, 1998).

7
1.1.5 Prevalence and treatment of dry eye
The prevalence of dry eye increases with age. Epidemiological studies have reported
more than 6% of the population over 40 to suffer from dry eye with the prevalence
increasing to 15% of the population over the age of 65 (McCarty, Bansal, Livingston,
Stanislavsky, & Taylor, 1998; Schein, Munoz, Tielsch, Bandeen-Roche, & West, 1997).
A recent online study conducted in the U-S-A by Allergan on 9034 individuals who
were listed on the Harris Interactive Online dry eye panel, found out that 48% of the
individuals regularly experienced dry eye symptoms (Patel, Watanabe, Strauss, &
Dubey, 2011).
The most common treatment of dry eye is the use of artificial tears or eye drops.
Traditional therapies for dry eye are palliative, their purpose is not to correct the
underlying disease but only replace or conserve the patient’s tears. Artificial tears have
diverse composition that may include cellulose ethers, carbomers, polyvinyl alcohol
(PVA), sodium hyaluronate, polivinil pyrrolidone (PVP) and a number of different
lipids. Applying artificial tears up to 4 times per day can successfully manage mild
cases of dry eye. In the case of moderate dry eye, applying unpreserved artificial tears
up to 12 times per day as well as unpreserved lubricating ointment at bedtime might
manage the symptoms. In the case of severe dry eye, additional therapy will be needed
such as tear-conserving therapies (Calonge, 2001). Preservatives in eye drops,
especially the most commonly used benzalkonium chloride (BAK), have been linked to
toxic effects in laboratory experiments and clinical studies. BAK has been shown to
cause tear film instability, loss of mucin producing goblet cells and disruption of the
corneal epithelium barrier (Harvard Medical School, 2010). In the same Allergen dry
eye study mentioned above, 63% stated that over-the-counter artificial tears are only
just or not at all successful in managing their symptoms (Patel et al., 2011).
1.1.6 Drug delivery to the eye
Drug delivery to the eye is a bothersome task due to various barriers. Topical
application in the form of eye drops is the most common method used to treat both the
outside of the eye, such as dry eyes, and to provide intraocular treatment with
absorption through the cornea, such as glaucoma (Gipson, 2004). Precorneal factors
8
such as short contact time of the drug (1-2 min) due to lacrimal fluid production
followed by drainage into either the nasolacrimal ducts or conjunctiva, and blinking,
induce a rapid elimination of the topically applied drug solution (Ahmed & Patton,
1985). The three layered cornea also limits the absorption with the epithelium limiting
the absorption of hydrophilic drugs and the stroma limiting the absorption of lipophilic
drugs. Mucins secreted to protect the ocular surface also forms a hydrophilic layer over
the tears (Le Bourlais et al., 1998). Conjunctival drug absorption into the eye is limited
due to rich blood flow and large surface area, which can cause a significant systemic
absorption (Ahmed & Patton, 1985). Blood-retinal barriers and blood-aqueous barriers
express tight junctions which limit drug penetration from the systemic bloodstream into
the intraocular environment (Barar, Javadzadeh, & Omidi, 2008). Systemic
administration of drugs will thus, in most cases, not be able to reach therapeutic levels
in the eye and orally administered drugs will not reach therapeutic levels in the eye
unless given in very high dose. These high doses could result in systemic side effects
(Gaudana, Ananthula, Parenky, & Mitra, 2010). Periocular and intravitreal
administration have become increasingly more common since they partly overcome the
inefficient drug delivery related to topical and systemic dosing to the posterior segment
of the eye. However these routes are not very patient compliant and may result in
tedious side effects (Gaudana et al., 2010).
1.1.7 Formulation standards for eye drops
Physiological conditions of the eye, physico-chemical properties of the drug and the eye
preparation formulation all have an impact on the effectiveness, tolerance and stability
of the eye drops. (Kråmer, 2002).
Viscosity is an important factor. If the eye drops are too liquid the contact time and
therefore bioavailability is too low. However, if they are too viscous they can reduce the
patients’ vision, and therefore are only suitable for application before night. A viscosity
of about 20 centipoises (cP) has been considered optimum viscosity for contact time,
where higher viscosity offers no advantage with respect to drug contact and usually
leaves a residue on the margin of the eyelid. Numerous polymers can be used to
increase the viscosity of solutions, for example methylcellulose, hydroxyethylcellulose,

9
hydroxypropylmethylcellulose, PVA and PVP (Kråmer, 2002). pH is an important
factor since it determines the rate of drug dissociation and penetration into the cornea as
well as bioavailability. Ideally, ophthalmic solutions should have the same pH as the
lacrimal fluid (7.4), but pH values from 7 to 9 are tolerated by the eye without marked
irritation. The buffer capacity of the lacrimal fluid (0.01 ml) should not be exceeded due
to increased tear production and eye movement, resulting in increased eye drop
clearance (Kråmer, 2002). The lacrimal fluid is isotonic (i.e. has the same tonicity) with
blood with 287 mOsm/l (Kråmer, 2002). Ideally, an ophthalmic solution should have
the same tonicity values as the lacrimal fluid but the eye can tolerate a rather broad
range of tonicity from ~205-683 mOsm/l (USP, 1995). It should be noted that this
information is relatively old and may have changed. The surface tension of the lacrimal
fluid ranges from 40 to 50 mN/m. Low surface tension provides good spreading effect
on the cornea possibly improving the contact between the drug and corneal epithelium
(Ammar, Salama, Ghorab, & Mahmoud, 2009). The particle size distribution in eye
drops has to meet defined standards according to the European Pharmacopeia. No more
than 20 particles may have a maximum dimension greater than 25 µm, not more than
two of these may have a maximum dimension greater than 50 µm and none above 90
µm (Council of Europe, 2013).
10
1.2 Lipids
Lipids are biomolecules made up of hydrogen, carbon and oxygen and defined as fatty
acids (FA) and their derivatives. They can be characterized by the fact that they are
nonpolar and consequently poorly soluble in water. Lipids are technically called fats if
they are solid at room temperature and oils if they are liquid at room temperature
(Silverthorn, 2009). Lipids have diverse function in the human body. While most of
them end up serving as a source of energy in the form of triglycerides, some of the
lipids represent as FA, fat-soluble vitamins or are even converted into prostaglandins
(PGE) or steroids (Harvey, 2011).
1.2.1 Fatty acids
FAs are carboxylic acids possessing a massive hydrocarbon skeleton. The carboxyl
group is known to be ionized at physiological pH.
FAs are called saturated if there are no double bonds between carbons,
monounsaturated if there is one double bond and polyunsaturated (PUFA) if there are
two or more double bonds. For each double bond, the molecule has two fewer hydrogen
atoms attached to the carbon chain. The more saturated the FA is, the more likely it is to
be a solid at room temperature (Silverthorn, 2009). The double bounds of PUFAs are
rarely conjugated and almost always in the cis-configuration. The cis-configuration
restricts rotation and introduces a rigid bend in the hydrocarbon chain, resulting in
interference with the tight packing in organic membranes (Lehninger, Nelson, & Cox,
2008). There are two ways of naming FAs. The standard one designates the carboxyl
carbon the number 1. The number of carbon atoms is written followed by the number of
double bonds, denoted X:Y. The position of double bonds is designated with delta (∆)
followed by a superscript of the lower numbered carbon in the double bond. Linoleic
acid (LA), for example, is 18:2(∆9,12
). The other one, which is only used when naming
PUFAs, assigns the methyl carbon the number 1 as well as omega (ω). The position(s)
of the double bond(s) are indicated relative to the ω carbon. Therefore, a PUFA
containing a double bond between carbons 3-4 is referred to as ω-3 FA (Lehninger et
al., 2008).

11
1.2.2 Essential Fatty Acids
Humans require certain FAs, namely ω-3 and ω-6, but do not have the enzymatic
capacity to synthesize them, thus they have to be obtained from the diet. α-linolenic acid
(ALA 18:3(∆9,12,15
)), an ω-3 FA, is a precursor for eicosapentaenoic acid (EPA
20:5(∆5,8,11,14,17
)) and docosahexaenoic acid (DHA 22:6(∆4,7,10,13,16,19
) (Lehninger et al.,
2008) whereas LA, an ω-6 acid, is the precursor for, most notably, arachidonic acid
(ARA 20:4(∆5,8,11,14
)) (Macsai, 2008). The conversion from the shorter parent FAs to
the longer downstream FAs involve a series of elongation enzymes that add two carbon
units to the backbone and desaturation enzymes that insert double bonds into the
molecule (Arterburn, Hall, & Oken, 2006).
Increased dietary intake of ω-3 PUFAs results in increased incorporation of those FAs
into inflammatory cell phospholipids. The incorporation occurs in a dose-respondent
fashion and is partly at the expense of ARA. ARA acts as a substrate for
cyclooxygenase and 5-lipoxygenase in the synthesis of thromboxanes, prostaglandins
and leukotrienes, collectively known as eicosanoids. Eicosanoids are known to be
involved in modulating the intensity and duration of inflammatory response. The ω-3
PUFA EPA competes with ARA as a substrate for cyclooxygenase and 5-lipoxygenase,
decreasing the production of pro-inflammatory prostaglandins and leukotrienes (Calder,
2006; Funk, 2001; Surette, 2008). ω-3 PUFAs have also shown to be effective at
reducing the generation of TNF-α, IL-6, IL-8 and expression of various adhesion
molecules through decreased activation of nuclear factor κ-light-chain-enhancer of
activated B cells, sometimes only referred to NFκB (Calder, 2006). Additionally, ω-3
PUFAs especially DHA have been linked to the production of resolvins, anti-
inflammatory mediators that moderate the time course and magnitude of inflammatory
processes (Fig. 3). It should be noted however that the precursor ALA does not appear
to exert anti-inflammatory effect at accomplishable intakes (Calder, 2006; Rand &
Asbell, 2011).

12
Figure 3 Schematic picture of the origin and fate of ω-3 and ω-6 FAs. Resolvins are also derived from EPA
(Roncone, Bartlett, & Eperjesi, 2010).
It has been demonstrated that the high ratio of ω-6 to ω-3 in the diet leads to
overproduction of pro-inflammatory PGE2 and underproduction of PGE1 and PGE3
(Calder, 2003). The optimal dietary ratio should be between 1:1 and 4:1, seen in the
Mediterranean diet rich in cold-water fish and natural oils. The typical dietary ratio of
Americans and Northern Europeans is from 10:1 and 30:1 (Lehninger et al., 2008;
Macsai, 2008). This high ratio in the Western diet has been blamed by some to be the
cause of the high prevalence of cardiovascular diseases, autoimmune diseases and
cancer. Dietary intake of the ω-3 FAs may shift the body to more anti-inflammatory
state resulting in decreased prevalence of these diseases (Simopoulos, 1991).
Food rich in ω-3 FAs include oils from certain plants such as flaxseed or canola oil, in
fish such as halibut, herring, mackerel, salmon and tuna, and fish oils such as cod liver
oil. The composition of ω-3 FAs is different between plant oils and fish where plant oils
mostly contain ALA but fish and fish oil a bigger proportion of EPA and DHA. Food
rich in ω-6 include grains, meat and the seeds of most plants. ALA and LA compete for
the same enzymes to be converted into the longer chained EPA and ARA. Because of
this competition, and the fact that the ratio between ALA and ARA is undesirable,
conversion of ALA to EPA (and then to DHA) is low, with exact figures in the range of
1-15% (Covington, 2004; Emken, Adlof, & Gulley, 1994). Since ALA does not appear

13
to exert any anti-inflammatory effects and the rate of conversion is low, consumption of
fish or fish oils is a better source of EPA and DHA than plant oils.
1.2.3 ω-3 and diseases
The effects of ω-3 supplementation on both meibomian gland dysfunction and/or
evaporative dry eye have been carried out although only one was found. In that study
patients were randomly assigned to either the placebo group, which received olive oil,
or the study group, which received 6 grams (g) of flaxseed oil. This is equivalent to 3.3
g of ω-3 FAs since only 55% of the oil is ω-3. The study was carried out over the course
of 1 year to minimize seasonal changes. 30 individuals reached the primary endpoint, 7
were lost to follow up and 1 was removed from the study due to the diagnosis of
Sjögren’s syndrome. At the end of one year, improvements in dry eye symptoms and
overall ocular health were observed. The flaxseed group had a decrease in saturated FAs
in the meibum and significant improvement in the Ocular Surface Disease Index
compared to the placebo group. (Macsai, 2008). Perhaps if fish oil, which has high
levels of EPA and DHA, would have been used instead of flaxseed oil, which has low
levels of EPA and DHA, better results could have been obtained. To maximize patient
compliance, flaxseed oil was used instead of fish oil which sometimes has a “fishy”
aftertaste.
The Woman’s Health Study is a randomized, double blind, placebo controlled trial
examining the use of low-dose aspirin and vitamin E for primary prevention of
cardiovascular disease and cancer. At their 4 year follow up questionnaire they were
asked if they had been diagnosed by a clinician to have a dry eye, where about 4.7% of
the study population had. The authors discovered that woman with higher ω-3 FA intake
had decreased risk of dry eye as compared to those who had lower intakes, and the ω-6
to ω-3 ratio was associated with significantly greater risk for dry eye (Miljanovic et al.,
2005). The effects of topically applied ALA (ω-3), LA (ω-6) and an ALA/LA
combination on a murine model have been studied. For control they used the vehicle or
a placebo. The total daily dosage was 1µl of 0.2% concentration in a solution with
compatible surfactants given for 10 days. Corneal fluorescein staining (CFS) was
evaluated, the number and maturation of CD11b, a trans membrane protein expressed in
inflammation found on numerous cells that are part of the immune system, were

14
determined both at the center of the eye and the periphery as an indicator of
inflammation, and a real time polymerase chain reaction was used to quantify the
expression of various inflammatory cytokines at days 5 and 10. Treatment with ALA
alone resulted in a significant decrease in CFS compared with the vehicle and untreated
control. CFS stains dead or degenerated corneal epithelial cells and therefore is a good
indicator of corneal epithelial damage. The number of CD11b+ cells in the center of the
eye was found to be significantly decreased in the ALA group compared to all other
groups. ALA treatment also decreased corneal IL-1α and TNF-α and conjunctival TNF-
α. The authors speculate why the combined treatment with ALA and LA had no positive
effect, neither clinically nor cellularly, and wonder if the ratio was not high enough to
offset the pro-inflammatory status already present in the eye (Rashid, 2008)
ω-3 FAs may also be important in preventing or treating a number of cardiovascular
diseases (Kris-Etherton, Harris, & Appel, 2002; Lecerf, 2009; Riediger, Othman, Suh,
& Moghadasian, 2009), asthma (Villani, Comazzi, De Maria, & Galimberti, 1998),
rheumatoid arthritis (Calder & Zurier, 2001; Cleland, James, & Proudman, 2003; James
& Cleland, 1997) and depression (Freeman et al., 2006). The motivation on the research
into the ω-3 FAs has resulted in the approval of Omacor® used to lower very high
triglyceride levels. The drug contains both ethyl esters of EPA and DHA (FDA, 2004).
1.2.4 Fish oil
Fish oil, produced either from the meat of the fish or its liver, is an important source of
EPA and DHA and other long-chain ω-3 PUFAs. Fish oils are characterized by their
high degree of unsaturation, the long-chain ω-3 type PUFAs and the great number and
variety of FAs present in the triacylglycerols (Haraldsson & Hjaltason, 2001). More
than 50 different FAs are present in a typical fish oil which include C14-C24, saturated,
monounsaturated, polyunsaturated, ω-3, ω-6, branched, odd-numbered and so forth. The
origin of the important ω-3 PUFAs is in the lipids of photosynthetic microalgae which
are eaten by the fish (Sargent, McEvoy, & Bell, 1997). FAs in the form of
triacylglycerol are in most abundance in the fish oil with small amounts of mono- and
diacyl-glycerol and other minor nontriacylglycerol substances. Refinement of the oil
aims at reducing these small and minor amounts since they may influence the flavor and
odor qualities of the oil as well as its stability (Haraldsson & Hjaltason, 2001). When

15
producing fish oil from fish meat or fish liver, a variety of impurities can be found.
Protein, dirt and rust are considered insoluble impurities and tend to precipitate out of
the oil during storage which can affect the stability of the oil. Saponification in the oil
removes moisture, which could lead to deterioration in storage. Unsaponifiable
materials include free cholesterol and vitamins A and D. While the vitamins are usually
not removed, free cholesterol is removed by vacuum stripping of the oil. Heavy metals
are removed by refining, trace metals by degumming and refining and chlorinated
hydrocarbons must remain within regulatory limits (Haraldsson & Hjaltason, 2001). A
number of analyses indicate the
quality of commercial fish oil.
First of all, dark colored oils
indicate the oil might contain
impurities or have been
overheated during refining. Acid
values, also known as
neutralization number or acid
number, indicate the quantity of
carboxylic acid groups in a
chemical compound, in this case free FAs. High acid values indicate poor quality of the
oil. Peroxide value (PV) reflects recent oxidation and anisidine value (AV) reflects
oxidation that has taken place in the past. However, these two values do not represent
overall rancidity; PVs follow an (inverse) parabola curve and AVs are delinquent to rise
until considerable oxidation has occurred, see Figure 4. Totox value expresses a
relationship between the PV and AV (Haraldsson & Hjaltason, 2001) (PV × 2 + AV)
and is used more commonly for indicating overall oxidation of the oil (Miller, 2012).
The double bonds in unsaturated fats play a role in autoxidation, where PUFAs are more
susceptible to oxidation than monounsaturated FAs. The autoxidation occurs
preferentially adjacent to a double bond in unsaturated FAs (Simic, 1981) and is
initiated by hydrogen abstraction from allylic or bis-allylic position, leading to
oxygenation and the formation of peroxyl radicals. In the presence of more PUFAs, the
peroxyl radical abstracts hydrogen to generate PUFA hydroperoxides which are prone
to further transformations by free radical routes (Gardner, 1989). Crude fish oil always
Figure 4 Time dependence of Peroxide value (PV), Anisidine Value
(AV) and Totox numbers (Miller, 2012)

16
contains some natural antioxidant such as vitamin E and astaxanthin. During processing
these natural antioxidants are removed which results in less stability due to oxidation.
Thus, antioxidants are usually added to the oil after processing where blends of various
forms of tocopherols are commonly used. Lipid oxidation and rancidity is usually
caused by light, heat, oxygen or enzymatic activity (Haraldsson & Hjaltason, 2001).
1.2.5 Antibacterial and antiviral effects of PUFAs
The antibacterial effects of PUFAs longer than 15 carbons in length have been reported.
The antibacterial effects are primarily effective against Gram-positive bacteria, but
activity against Gram-negative bacteria has also been reported (Kenny et al., 2009;
Shin, Bajpai, Kim, & Kang, 2007). The exact anti-bacterial mechanism has not been
determined but numerous possible mechanisms have been proposed. They include for
example specific inhibition of FabI, a catalyzer in the final and rate limiting step in FA
biosynthesis, inhibition of glucosyltransferases, interference with energy metabolism or
that the PUFAs inhibit all major bacterial biosynthetic pathways (Kenny et al., 2009).
The degree of unsaturation and oxidation has been directly linked to the antibacterial
effects of PUFAs (Rybin et al., 2000). The antiviral effects of free FAs have been
reported. In a study comparing the antiviral effects of PUFA’s, a 1% FA extract from
cod liver oil resulted in a 4.7 log reduction in HSV-1 concentration (Loftsson et al.,
1998). Another study, comparing the monounsaturated FAs oleic- and palmitoleic-acid,
as well as monoglycerides, medium and long chained monounsaturated FAs and fatty
alcohols, showed a significant reduction (2-4.5 log scale) in herpes simplex virus (HSV)
type 1 and 2 compared to control groups (Hilmarsson, Kristmundsdóttir, & Thormar,
2005).
17
1.3 Cyclodextrins
Cyclodextrins (CD) are manufactured by bacterial fermentation of starch followed by
product purification. First believed to be discovered in 1891 by a French scientist
named A. Villiers, the different CDs were not isolated until years later. The isolation
step was tiresome which resulted in high prices. With the biotechnological advances in
the early 1970s came new ways to produce CD and high-grade CDs were available at
affordable prices (Loftsson & Brewster, 2010).
1.3.1 Structure of cyclodextrins
Cyclodextrins are cyclic oligosaccharides consisting of six (α-CD), seven (β-CD), eight
(γ-CD) or more D-glucopyranose units linked with α-(1,4) bonds. CDs consisting of
more than eight glucopyranose units are of relatively little importance in pharmaceutical
industry and will not be discussed here. Due to chair structure of the glucopyranose
units the CD molecule is shaped like a truncated cone with the primary hydroxyl (-OH)
groups extending from the narrow edge and the secondary hydroxyl groups from the
wider edge. The hydroxyl groups extending from the edges of the molecule give the CD
a hydrophilic outer surface while the inner cavity, lined with carbons and ethereal
oxygen of the glucose residue, is rather lipophilic. However, due to high crystal lattice
energy and intra-molecular hydrogen bonding between C-2 and C-3 hydroxyl groups,
the aqueous solubility of parent CDs and their complexes is limited, especially for βCD
(Loftsson & Brewster, 1996; Jozsef Szejtli, 1989; J. Szejtli, 1998). The low solubility
has been overcome by creating CD derivatives, which are of pharmaceutical interest and
include hydroxypropylated-βCD and -γCD (HPβCD and HPγCD), randomly
methylated-βCD (RMβCD) and sulfobutyl ether βCD sodium salt (SBEβCD) (Loftsson
& Brewster, 2011). The physicochemical properties of the derivatives depend on the
structure, location and number of the substituents (Loftsson & Brewster, 2010). The CD
derivatives also have different hydrophobic cavity volume compared to the parent
molecules (Del Valle, 2004).
Natural CDs are more resistant towards starch hydrolyzing enzymes and non-enzymatic
hydrolysis than the linear oligosaccharides. In aqueous solutions, non-enzymatic
hydrolysis of the α-acetal linkages produces glucose maltose and linear

18
oligosaccharides. The derivatives are degraded at similar speed with ring opening the
dominant pathway. CDs are slowly hydrolyzed by α-amylase found in human saliva and
pancreatic juice. The rate depends on ring size and fraction of free CD, with bigger
rings being more susceptible to hydrolysis. After ingestion, α- and β-CD are digested by
bacteria in the colon whereas γ-CD is almost completely digested in the digestive tract
(Loftsson & Brewster, 2010)
1.3.2 Cyclodextrin complexation
The lipophilic microenvironment in the cavity of CD gives it the ability to form
inclusion complex with lipophilic nonpolar structure or substructures of a guest
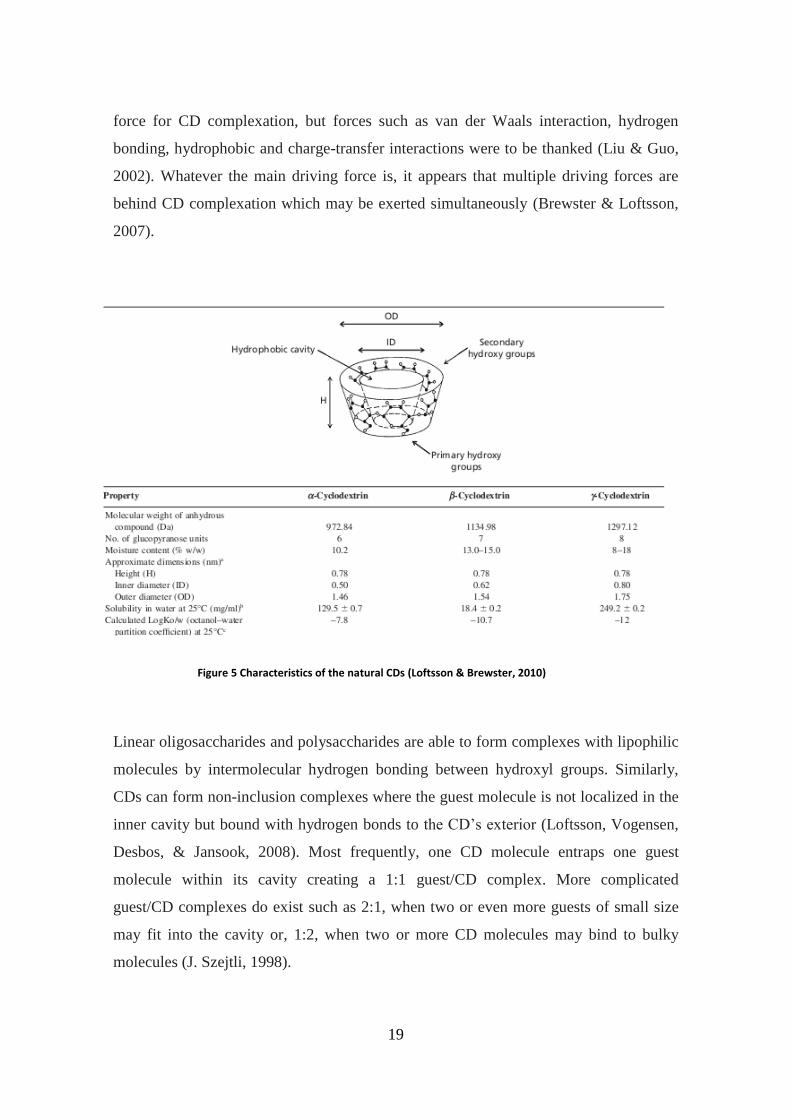
molecule. The ability of CD to form an inclusion complex is determined by two factors.
The first one is steric and relates to relative size of the CD molecule and that of the
guest molecule or a substructure of it. As can be seen in Figure 5, height of the three
parent CD molecules is identical but the number of glucose units determines the internal
diameter and thus its volume. Based on the dimensions, α-CD can normally complex
low molecular weight molecules or compounds with aliphatic side chains, β-CD can
typically complex aromatics and heterocycles while γ-CD can form stable complexes
with larger molecules such as steroids or macrocycles. The second one relates to
thermodynamic interactions. For a complex to form a net driving force must be able to
pull the guest molecule into the CD cavity. These driving forces relate to both the CD
and the guest as well as the solvent (Del Valle, 2004). During complex formation no
covalent bonds are formed or broken and complexes are easily dissociated in aqueous
solution since equilibrium exists between free guest molecules and the ones bound
within the CD cavity (Loftsson & Brewster, 1996). Water molecules located within the
CD cavity do not satisfy their hydrogen-bonding potential and have higher enthalpy
than bulk water molecules in the aqueous environment. The main driving force in
complex formation was believed to be the replacement of these high enthalpy water
molecules with more hydrophobic guest molecules (Loftsson & Brewster, 1996; J.
Szejtli, 1998). This replacement attains apolar-apolar association between CD and the
guest molecule, and decreases the ring strain of the CD molecule resulting in a more
stable, lower energy state (J. Szejtli, 1998). However, recently it was reported that the
replacement of high enthalpy water molecules with guest molecules is not the driving
19
force for CD complexation, but forces such as van der Waals interaction, hydrogen
bonding, hydrophobic and charge-transfer interactions were to be thanked (Liu & Guo,
2002). Whatever the main driving force is, it appears that multiple driving forces are
behind CD complexation which may be exerted simultaneously (Brewster & Loftsson,
2007).
Linear oligosaccharides and polysaccharides are able to form complexes with lipophilic
molecules by intermolecular hydrogen bonding between hydroxyl groups. Similarly,
CDs can form non-inclusion complexes where the guest molecule is not localized in the
inner cavity but bound with hydrogen bonds to the CD’s exterior (Loftsson, Vogensen,
Desbos, & Jansook, 2008). Most frequently, one CD molecule entraps one guest
molecule within its cavity creating a 1:1 guest/CD complex. More complicated
guest/CD complexes do exist such as 2:1, when two or even more guests of small size
may fit into the cavity or, 1:2, when two or more CD molecules may bind to bulky
molecules (J. Szejtli, 1998).
Figure 5 Characteristics of the natural CDs (Loftsson & Brewster, 2010)

20
1.3.3 Cyclodextrin toxicology
Lipinski’s rule of five states that any molecule with less than 5 hydrogen bond donors,
less than 10 hydrogen bond acceptors, a molecular mass over 500 and an octanol-water
partition coefficient lower than 5 is not readily absorbed (Lipinski, Lombardo, Dominy,
& Feeney, 2001). CDs violate three of these criteria: they contain a significant number
of both hydrogen bond acceptors and donors and have molecular weight in the range of
973-2163 Dalton. Thus their oral bioavailability is generally below 4%. CDs that are
absorbed intact are furthermore rapidly excreted in the urine (Loftsson & Brewster,
2010). Toxicological studies have demonstrated that orally administered CDs are
practically non-toxic due to the fact that they are unable to permeate lipophilic
membranes such as gastrointestinal mucosa and skin, with the exception of RMβCD
which has higher bioavailability due to increased lipophilicity (Del Valle, 2004;
Loftsson & Brewster, 2010). All of the CDs and CD derivatives except βCD and
RMβCD can be used in parenteral formulations but only two, HPβCD and SBEβCD, are
approved by the Food and Drug Administration for intravenous injection (Stella & He,
2008). βCD and RMβCD have low aqueous solubility and adverse effects (Loftsson &
Brewster, 2010). When tested in animals, γ-CD was found to be virtually nontoxic when
given intravenously (Loftsson & Duchêne, 2007).
1.3.3.1 Ophthalmic toxicology
Loftsson proposed three possible mechanism in which CDs could cause irritation or
damage to the ocular surface after topical application: First, it is possible that small
fraction of the more lipophilic CDs may penetrate into the cornea, conjunctiva, sclera or
other eye surface tissue. However, the more hydrophilic CDs, such as HPβCD, have
been found to be non-irritating. Secondly, the CDs may be able to extract components
from the cornea or other ocular membranes. Nevertheless, after a complex formation
between the CD and the guest molecule, their ability to interact with biological
membranes is greatly reduced and usually only seen in vivo at relatively high
concentrations. At last, aqueous eye drops containing large proportion of CD (12-25%)
given to dry eye patient results in the formation of crust in the eyelids with consequent
irritation. When given to patients with normal tear production no irritation was

21
observed. HPβCD, the most commonly used CD in ophthalmic drug delivery, has been
shown to be well tolerated at high concentrations (Loftsson. & Jarvinen, 1999).
1.3.4 Cyclodextrins in ophthalmic drug delivery
The fact that higher concentration of free CD in solution leads to a lower flux over
biological membranes and increased concentration of CDs does not increase the
absorption of water soluble drug molecules in solution has led to the conclusion that the
main mechanism of enhanced transcorneal drug delivery is not the disruption of cell
membrane. In eye drop solutions, CDs act as true carriers by hiding the hydrophobic
substructure of the guest molecule inside their cavity from the aqueous environment.
CDs carry the guest molecule through the aqueous-mucin layer to the surface of the
ocular barrier (the cornea or conjunctiva), where the guest molecule can partition into
the lipophilic membrane (Loftsson. & Jarvinen, 1999). Irritation is a common drawback
of many commercially sold ophthalmic eye drops due to high drug concentrations or
irritating additives. By forming inclusion complexes with the irritating guest molecules,
CDs might be able to mask these irritating characteristics (Loftsson. & Jarvinen, 1999).
Like mentioned before, drug delivery to the eye with eye drop solutions is the most
common and preferred route. Usually, eye drop solutions contain drug molecules
dissolved in water. In aqueous environment, drug molecules are subject to chemical
degradation which reduces potency and formation of possibly harmful degradation
products. Stability can be increased with adjustment of pH and optimization of storage
conditions. Additionally, CDs can be used to increase stability in aqueous eye drop
solutions. With inclusion of the labile drug substructure, the CDs can shield it from
reactive molecules and thus decrease the rate of hydrolysis, oxidation, steric re-
arrangement, racemization and, possibly, enzymatic degradation (Loftsson. & Jarvinen,
1999).
1.3.5 Cyclodextrins and lipids
Lipids are extremely sensitive to oxidation and have a very limited solubility in water -
factors that limit their uses considerably. Antioxidants are well known agents that can
be used to slow down this oxidation. CDs are another agent that has gained considerable
attention to slow down the oxidation by forming inclusion complexes. The
22
characteristic of CD complex depends on both the nature of the CDs (α-, β-, γ-CD or a
derivative) and that of the FA (number of double bonds and chain length). When testing
the oxidative protecting effects of CD, an experiment carried out in 2011 showed a
significant difference when comparing the oxidation of conjugated linolenic acid (CLA)
to CLA/β-CD complex. With no antioxidants present, about 97% of the CLA was
oxidized after 40 minutes compared to less than 1% in the CLA/β-CD complex. And
still after 250 hours, about 35% of the CLA still remained (Ying, Ming-Li, Yan-Hua, &
Hua-Jie, 2011). When comparing different CDs, a study in 2000 showed that
microencapsulation of CLA with CDs completely protected the FA against oxidation.
The protective oxidative effects were in the order α-CD > β-CD > γ-CD (Kim et al.,
2000). In concordance with that, a study in 2002 came to the conclusion that the
oxidative protecting effects of CDs were inversely proportional to their size (Park et al.,
2002). On the contrary, a study in 1993 showed no significant differences between the
stabilizing effects of α- and β-CD when studying the oxidation of LA/CD complex
(Szente, Szejtli, Szemán, & Kató, 1993). Inclusion of FAs into CDs increases their
water solubility. The increase is proportionally higher for longer FAs (C12) than for
those who are shorter (C6), even though their water solubility is still very low compared
to their shorter comrades. When forming inclusion complexes with FAs, it has been
shown that the CD with the narrowest cavity, α-CD, has the highest affinity for both
short (≤C8) and long (≥C12) chain FAs. This can be explained by the fact that a shorter
distance between atoms of host and guest molecules results in stronger interaction.
However, this affinity does not translate directly to an increase in solubility because β-
CD has been shown to be superior in increasing water solubility of C10-C11 FAs and at
least equally successful to α-CD for C12 FAs. Supposedly, this can be attributed to the
fact that the C10-C11 FAs are slightly twisted inside the β-CD cavity leading to better
molecular interactions. Due to the narrow cavity in α-CD there isn’t enough room for
that twist. Starting with C12, part of the chain is outside the cavity for both α- and βCD.
Unfortunately, the authors did not include γ-CD to their review (Duchêne, Bochot, Yu,
Pépin, & Seiller, 2003). For fatty acids C16-C18 in length, γ-CD was superior to the other
two parent CDs in complexation and provided the best stabilization against auto-
oxidation (Regiert, Wimmer, & Moldenhauer, 1996). The solubility enhancement data
of several C18-C22 FAs with methyl and hydroxypropyl βCDs derivatives showed that
23
increasing number of double bonds within a FA molecule results in a more stable
inclusion complex. This might be due to the more compact geometry and non-linear
structure of the FA which provides a better fitting into the CD cavity (Szente et al.,
1993).
The effect of pH of the solution and temperature has been tested. The equilibrium
constant between free and complexed FA (K1) was used to assess the effects, defined as
K1
where [FA-CD] is the concentration of the fatty acid-cyclodextrin complex, [FA]f is the
concentration of free fatty acid and [CD]f is the concentration of cyclodextrin. The
effects of pH on K1 were obvious. When the pH was increased from around 7.5 to 9.5
the equilibrium constant K1 decreased from a steady 11,000 M-1
to 1,000M-1
. The
authors conclude that this is due to titration of the FAs carboxy group. As it turns out,
the mean value of K1 is very close to the pKa 7.9 of the LA. A likely explanation is that
the protonated carboxyl group of the FA forms hydrogen bond with one of the
hydrophilic groups of the CD at pH below the pKa. Based on nuclear magnetic
resonance imaging, it is probably the hydroxyl group at position 6. Increase of
temperature resulted in an increase in K1, which is normally not seen due to the fact that
hydrogen bonds are usually weakened by heat. A likely explanation is that higher
temperature resulted in an increase in protonated species rather than stronger hydrogen
bonds (Lopez-Nicolas, Bru, Sanchez-Ferrer, & Garcia-Carmona, 1995)
1.4 Polymers
Polymers are additives used widely in pharmaceutical systems for numerous objectives,
i.e. as suspending, emulsifying and flocculating agents, adhesives, and for packaging
and coating materials. Polymers are made up of repeating monomer units with a high
molecular weight. Their chemical reactivity depends on the chemistry of their monomer
units, but their properties depend mainly on how the monomers are assembled together.
Nearly all polymers exist with a range of molecular weight and for convenience the
reported molecular weight of a polymer is the average molecular weight. Water soluble
polymers have the capability to increase the viscosity of solvents at low concentrations,

24
to swell in solutions and sometimes even to adsorb at surfaces (Florence & Attwood,
2003). However they are primarily used to stabilize the system they are intended to be
used in. A list of the polymers used in this project in combination with CD can be found
in Table 1.
Table 1 A list of polymers used in combination with CD. CMC-Na = Carboxymethylcellulose Sodium, HPMC = Hydroxypropylmethylcellulose, PVA – Polyvinyl Alcohol, PVP
= Polyvinyl Pyrrolidone (Aldrich, 2012, 2013; BASF, 2010; LMS, 2006; LubrizolCorporation, 2013; ScienceLab, 2005)
Polymer Monomer Structure
Poloxamer 407
Ethylene oxide and propylene oxide
Carbomer 974 P Acrylic Acid
CMC-Na Cellulose-O-CH2-COONa
HPMC C6O5-R3
PVA CH2CHOH
PVP C6H9NO

25
2. AIM OF THE STUDY
The aim of this study is to formulate stable, monophasic aqueous eye drops from CD,
lipids, and polymer. The characteristics relevant to eye drops are assessed and the
stability as well as protective effects of these formulations are evaluated.

26
3. EQUIPMENTS, MATERIALS AND METHODS
3.1 Equipments
Equipment Model Manufacturer
Moisture analyzer MX50 A&D
Autoclave - Astell
Light microscope BH2 Olympus
Water purification system Q Gard Millipore
Purelab Option - Elga
Rotavapor REII Buchi
Scale AG 285 & PJJ60 Mettler Toledo
Shaker GmbH KS-15 kontrol Edmund Bühler
Sonicator 8892 Cole-Parmer
Vapor Pressure Osmometer K7000 Knauer
Viscosity meter DV1 Prime Brookfield
Water bath Polystat Cole-Parmer
3.2 Materials
Chemical Batch number Manufacturer
Acetic acid - isooctane solution* - Lýsi
-cyclodextrin - Cavamax® W6 Pharma 60P304 Wacker Chemie AG
Bensalkonium Chloride S32836-516 Sigma Aldrich
β-cyclodextrin - Cavamax® W7 Pharma 70P093 Wacker Chemie AG
Carbopol 974 CC61NAB896 Noveon
Carboxymethylcellulose-Sodium 6356A ICN
Chloroform SZBC073MV Sigma Aldrich
Cod liver oil PC0079102 Lýsi
Cod liver oil CPC2121202 Lýsi
Distilled water - Elga
Free fatty acids from hydrolysis 15.1.2010 Lýsi
γ-cyclodextrin Cavamax® W8 Pharma 80P241 Wacker Chemie AG
Hydroxypropylmethylcellulose 87F0148 Sigma Aldrich
Lutrol F-127 47-0646 BASF
Methanol SZBC1903V Sigma Aldrich
Nitrogen 1066 Ísaga
Poly(vinyl)alcohol 124K0052 Sigma
Polyvinylpyrrolidone 65H0040 Sigma
Potassium Iodide 50620 Riedel De Haën Potassium Iodide SZBC0500V Sigma Aldrich Purified water - Millipore
Sodium Chloride 80650 Sigma Aldrich

27
Sodium Thiosulphate solution* - Lýsi
Starch solution* - Lýsi
Titriplex III (EDTA) 630 KD2158618
Merck
*Solutions were donated by Lýsi hf.
3.3 Methods
3.3.1 Water content determination
MX-50 moisture analyzer was used to measure the water content of the parent CDs.
About 1 gram of CD was spread evenly onto the plate to ensure reproducible results, the
analyzer was closed and the halogen lamp turned on at a pre-defined temperature of
130°C to ensure water evaporation. The analyzer simultaneously computes the weight
of the water that evaporates and expresses it in percentages of the original weight. The
measurement automatically stops when the change is less than 0.1% per minute. Water
content of each CD was performed at least in triplicate
3.3.2 Cyclodextrin solutions preparation
Earlier research performed at the Faculty of Pharmaceutical Sciences, University of
Iceland suggests that the parent CDs, compared to their derivatives, are more suitable
for forming inclusion complexes with the lipids. To get a, for example, 10% w/v
solution, one must take into account the water content of the CDs as well as the
proportion of CD and lipids. The proportion that has shown the best result is 9:1
CD:lipid (Geirsson, 2008). For a 50 ml α-CD solution with an original water content of
9.8%, the amount in grams (g) is calculated
Amount of α-CD =
( ) (
) = 6.16 g
The amount of CD was then weighed exactly and dissolved in water. To help with the
dissolving process, the CD solutions were put into a sonicator until fully dissolved.

28
3.3.3 Deoxygenation of the CD solutions
To prevent the oxidation of both the cod liver oil and the free fatty acids, the aqueous
CD solution was deoxygenated. This was done by allowing nitrogen to bubble through
air steel stone that distributes the nitrogen out into the CD solution for at least 2 hours
and shielding it against further contact with oxygen using parafilm. This was done
before adding the polymers into the solution because deoxygenating each solution
independently would have been too time consuming and resulted in the formation of
considerable amount of foam that could have overflowed the glassware (Hákonarson,
2009). This overflow could have resulted in the loss of polymers as well as CD from the
solutions.
3.3.4 Cyclodextrin-polymer solutions preparation
The water soluble polymers (and preservatives in some cases) were weighed and placed
into a 50 ml volumetric flask. One to two different concentrations of each polymer were
used, both with and without preservatives. This was done to see the effect of the
preservatives on the formulation. For example, in the case of 50 ml of 2.5% w/v Lutrol
solution, the amount of polymer in grams is calculated
Amount of polymer =
(
)
= 1.39 g
Due to Lutrols physicochemical properties (Kojarunchitt, Hook, Rizwan, Rades, &
Baldursdottir, 2011), the polymer and the CD solution were refrigerated before
merging. This was done to solubilize Lutrol. Blending of the other polymers was
executed by simply mixing the CD solution with the polymers at room temperature.
Before the CD solution was added to the polymers, nitrogen was sprayed into the
volumetric flask to get rid of the oxygen. Then the flasks were put on the shaker for one
day to let the polymers solubilize in the CD solution. Each flask was filled to 80% of
the final volume because some of the polymers swell during solubilization and the lipids
still remained to be combined with the solution.

29
3.3.5 Preparation of the system of cyclodextrin, polymer and lipids
When the CD-polymer solutions were fully solubilized, lipids from the cod oil were
ready to be mixed into the solutions. The free fatty acids were kept in the freezer to
protect them from heat and light and needed to be heated to liquid in a water bath before
mixing. The proportion of CD-polymer solution, cod liver oil and free fatty acids was
always the same in every sample. The proportions were:
I- 1/100 Free fatty acids
II- 9/100 Cod liver oil
III - 90/100 CD-polymer solution
II was measured and poured into the volumetric flask containing III. Then I was
measured and poured into the same flask. I turns to a solid at room temperature which
could affect the final volume of the sample. To prevent that, I was heated occasionally
in a water bath throughout the mixing process. When I, II and III were merged in the
volumetric flask, CD solution was added until the volume was exactly 50 ml, then
nitrogen was sprayed over it and they were mixed together and poured into an oxygen-
free 100 ml jug made of light-protective brown glass. The jugs were shaken at rotation
speed 250 for 1 week to promote complexation. When the samples had to be opened for
a measurement, nitrogen was sprayed over before closing.
3.3.6 Flocculation Test
The flocculation test was performed using an in-house method. After having been in a
shaker for at least 1 day and shaken vigorously before insertion, 10 ml of each solution
were poured in a 10-ml measuring cylinder. Observations were made periodically for 8
days.
3.3.7 Dispersion and smell
Dispersion was determined by both intensity and length of shaking. The solution was
shaken until uniformity had been achieved. The intensity and time of shaking were
given a value between 1 and 5, where 1 represents a solution that is redispersed easily
and 5 is a solution which was difficult to redisperse. The smell was objective of the

30
smeller and was made by simply smelling the formulations and giving it a score of 1,
representing no cod liver oil, to 6, representing strong cod liver oil smell.
3.3.8 Surface tension
A digital Tensiometer K9 (Krüss) with a roughened platinum plate was used to measure
the surface tension of the samples. Before every measurement, the glass cell and the
platinum plate had to be rinsed, cleaned and then ignited in the flame of Bunsen burner
to destroy any surface-active substance left on their surface. Prior to use, the plate was
wetted with water to make the contact angle close to 0°. The surface tension is
calculated with the equation
σ =
where σ is surface tension, F is force acting on the balance, L is wetted length and θ is
contact angle. The contact angle is virtually 0°, and therefore the value cos θ is close to
zero, only the measured force and length of the plate need to be taken into consideration
(KRÜSS, 2013). The sample, about 20-40 mL, was poured into the sample vessel and
inserted into the sample support. The sample stage is then raised by means of the coarse
stage adjustment and the device reset to zero when the plate was just above the sample.
The sample stage is raised again and when the plate has just touched the sample a
reference mark is set. Then the sample stage is raised again about 5mm and then
lowered back to the reference mark. This is done so no buoyancy error occurs during
measurement. After the tensiometer had stopped fluctuating the value was read. Before
measuring the samples, water with a surface tension of approximately 72 mN/m
(Vargaftik, 1983) was used to calibrate the equipment.
3.3.9Viscosity
A Brookfield DV1 Prime visco meter supplied with a S40 or S52 spindle and a
thermostated cell was used to measure the viscosity of the solutions. The S40 spindle
was used for the less viscous solution while the S52 for the more viscous solutions. The
Brookfield viscometers employ the principle of rotational viscometry, where the torque
required to turn a spindle in a fluid indicates the viscosity of the fluid. In the Brookfield
31
viscometer, the spindle is moved through a calibrated spring and the deflection of the
spring measures the viscous drag of the fluid against the spindle, which is proportional
to viscosity (Brookfield, 2013). First, the gap between the solution and the spindle had
to be set at a defined distance with the sample cup attached. This was done my moving
the micrometer adjustment ring until the yellow light flickered, then move the sliding
reference marker to the nearest dash and then move the micrometer adjustment ring one
dash to the left. 1 ml was then applied at the center of the sample cup and attached to the
viscometer. A care had to be taken not to move the micrometer adjustment ring while
attaching the sample cup. The measurements were carried at 25 (± 0.2)°C with a
minimum torque of 10%. If the torque was considerably higher than 10%, the spindle
speed was decreased to give a torque value closest to 10%. The sample cup was cleaned
with a paper tissue between samples. The samples were stirred before measurement to
ensure uniformity. The viscometer was calibrated using a standard with appropriate
viscosity.
3.3.10 Osmolality
A K7000 Knauer Pressure Osmometer was used to determine the osmolality of the
samples. The vapor pressure osmometer is based on the principle that the vapor pressure
of any solution is lower than the vapor pressure of a pure solvent. The replacement of a
drop of pure solvent with one that contains solute leads to a vapor pressure difference
between the two droplets. To compensate for this, the pure solvent’s vapor that is
already saturated in the gas phase condenses on the solution droplet until the vapor
pressure is balanced. Condensation leads to an increase of droplets temperature. This
temperature difference between the reference and sample thermistors is always
proportional to the number of particles/number of moles dissolved in the solution
(GmBh, 2007). Before measurement, pure solvent must be placed into the glass beaker
located inside the cell. To promote vapor saturation, paper wetted with solvent, in this
case water, is also placed inside the beaker, the cell cover is attached and the cell closed,
the head thermostat closed and all the syringes installed to their ports to maintain
25.0°C inside the cell. To make sure the vapor saturation inside the cell was sufficient,
the osmometer was left running overnight before measurements began. An aqueous
NaCl solution with 400 milliosmoles per kilogram of solvent (mOsmol/kg) was used as

32
a standard. When measuring it is important to keep the pure solvent drop and the sample
drop similar in size and allow a couple of drops to flow over the thermistor probe before
measuring a new sample.
3.3.11 Particle size distribution
The particle size was measured using an Olympus BH2 light microscope with DPlan
100X lens from Olympus. The eyepiece power was 10X, therefore giving total
magnification of 1000X. The eyepiece
scale was calibrated with 1mm stage
micrometer from Olympus with intervals
equal to 0.01mm. Single interval of
eyepiece scale corresponded to 0.1
intervals of the stage micrometer, equal
to 1.0 μm. Each sample was prepared in
the following way: small droplet of the
formulation was introduced onto an
object plate followed by application of
a cover glass to spread the sample
evenly. The sample was then inserted
into the micrometer and the particle size assessed, counting each particle as the plate
was moved from left to right, down few millimeters and then right to left to ensure no
particle was counted twice, see Figure 6. The particle size distribution was determined
from observations of more than 200 particles per sample.
3.3.12 Peroxide value test
To assess the PV, formulations were prepared as discussed before and shaken for 1
week. The formulations and lipids without any formulation were kept at different
conditions for a period of 4 weeks. The conditions were:
Figure 6 Illustration of how the particles were assessed to
ensure none were counted twice.
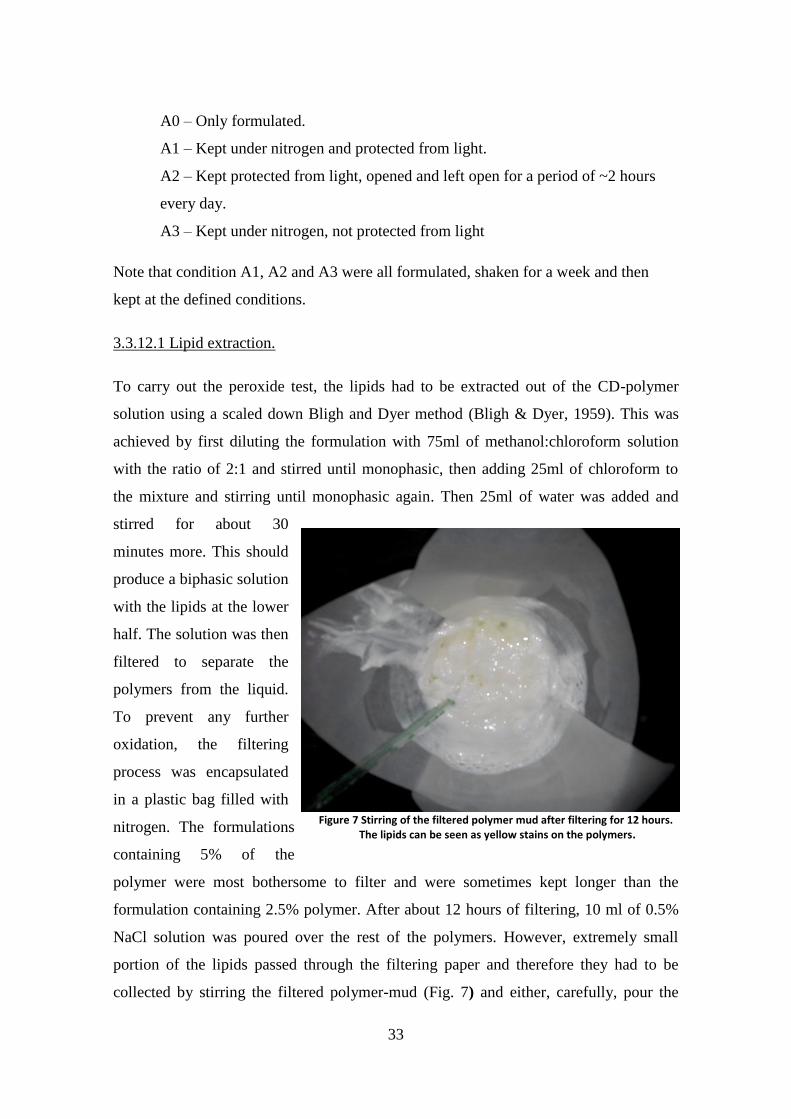
33
A0 – Only formulated.
A1 – Kept under nitrogen and protected from light.
A2 – Kept protected from light, opened and left open for a period of ~2 hours
every day.
A3 – Kept under nitrogen, not protected from light
Note that condition A1, A2 and A3 were all formulated, shaken for a week and then
kept at the defined conditions.
3.3.12.1 Lipid extraction.
To carry out the peroxide test, the lipids had to be extracted out of the CD-polymer
solution using a scaled down Bligh and Dyer method (Bligh & Dyer, 1959). This was
achieved by first diluting the formulation with 75ml of methanol:chloroform solution
with the ratio of 2:1 and stirred until monophasic, then adding 25ml of chloroform to
the mixture and stirring until monophasic again. Then 25ml of water was added and
stirred for about 30
minutes more. This should
produce a biphasic solution
with the lipids at the lower
half. The solution was then
filtered to separate the
polymers from the liquid.
To prevent any further
oxidation, the filtering
process was encapsulated
in a plastic bag filled with
nitrogen. The formulations
containing 5% of the
polymer were most bothersome to filter and were sometimes kept longer than the
formulation containing 2.5% polymer. After about 12 hours of filtering, 10 ml of 0.5%
NaCl solution was poured over the rest of the polymers. However, extremely small
portion of the lipids passed through the filtering paper and therefore they had to be
collected by stirring the filtered polymer-mud (Fig. 7) and either, carefully, pour the
Figure 7 Stirring of the filtered polymer mud after filtering for 12 hours. The lipids can be seen as yellow stains on the polymers.
34
lipids off or use a pipette to collect them. The solution containing the lipids was placed
into a separatory funnel and the lower half, containing the lipids, extracted into a round
bottom flask. The round bottom flask was then installed onto a rotavapor to remove
solvents, leaving only the lipids for the peroxide test.
3.3.12.2 Titration
PV is the most widely used method to measure the extent of primary oxidation in oils.
When measuring the PV, the sample is treated in a solution of acetic acid and a suitable
organic solvent (isooctane in this case) and then subsequently with a solution of
potassium iodide, KI. The iodide ion reacts with the hydroperoxide (ROOH), resulting
in iodine liberation, according to the reactions:
KI + CH3COOH HI + CH3COOK
ROOH + 2HI ROH + H2O + I2
The base produced is taken up by the excess acetic acid. The liberated iodine is then
titrated with a solution of sodium thiosulphate (Na2S2O3) using a starch indicator
(International Fragrance Association, 2011) , according to the reaction:
2NaS2O3+ I2 (purple) Na2S4O6 + 2NaI
(colourless)
Due to small volumes of lipids extracted from the formulations, a mini-peroxide test,
developed by Þormóður (Geirsson, 2008) was used. In the mini-peroxide test 0.3 – 0.5
grams of lipids were dissolved in 10 ml of acetic acid:isooctane (3:2) solution, followed
by 0.2ml of potassium iodide. The reaction was stopped after 60 ±1 second and at least
3 rotational swings. Then 6ml of water was added to stop the reaction and subsequently
1.2 ml of starch. The solution was then titrated with a 0.001 M sodium thiosulphate
solution until no color is observed. It is important that the titration is executed swiftly
and the flask is moved with rotational swings during titration.

35
The equation used to calculate the PV is:
PV (milliequivalents O2/kg sample) =
Where C is molarity of the titrant, expressed as moles/liter
V is volume of titrant used, in ml
W is weight of the lipids, in g.
3.3.12.3 Blending the solutions used in the titration
All of the solutions were prepared as specified in standard operating procedure EBL 5-
40-BL by Lýsi hf. The potassium iodide solution was prepared by dissolving 100 g of
potassium iodide in 70 ml of water. To ensure dissolution, the solution was sonicated
for a few minutes, and to ensure saturation, a few potassium iodide crystals were put
into the solution afterwards. The solution expires two weeks after preparation. The
starch indicator is prepared by measuring 8 g of potato starch dissolved in 4 liters of
boiling deionized water. After a few seconds of boiling, 5 grams of salicylic acid is
added to the solution. The solution expires three months after preparation. The acetic
acid:isooctane solution is prepared by mixing 3 portions of acetic acid with 2 portions
of isooctane. The solution expires five years after preparation. The sodium thiosulphate
solution is prepared by dissolving 1 ampule of 1M sodium thiosulphate in 1 liter of
water, creating a 0.1M solution. The solution is then diluted to give the desired molar
concentration.
The acetic acid:isooctane solution, the starch indicator and the sodium thiosulphate were
all generously donated by Lýsi hf.
3.3.12.4 Statistics
Excel was used to calculate the T-test between the formulations. A two tailed t-test for
unequal variances was used and for a difference to be statistical, the p-value had to be
lower than 0.05 (α=0.05).
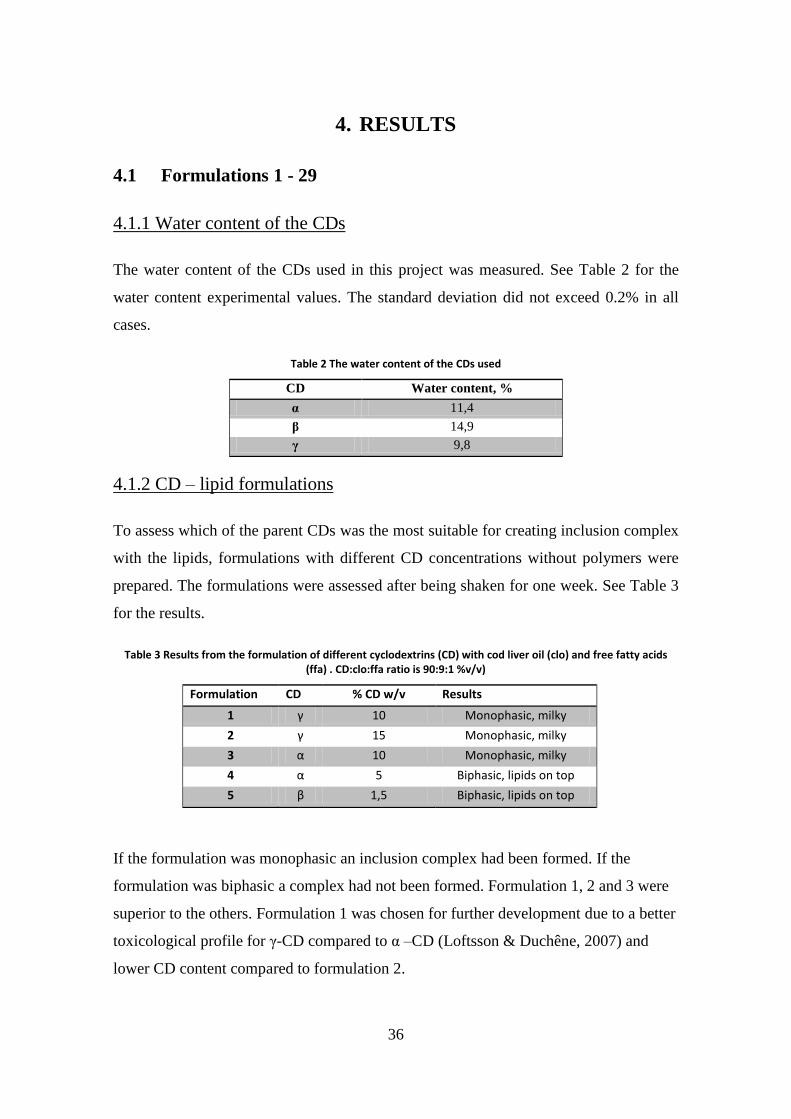
36
4. RESULTS
4.1 Formulations 1 - 29
4.1.1 Water content of the CDs
The water content of the CDs used in this project was measured. See Table 2 for the
water content experimental values. The standard deviation did not exceed 0.2% in all
cases.
Table 2 The water content of the CDs used
CD Water content, %
α 11,4
β 14,9
γ 9,8
4.1.2 CD – lipid formulations
To assess which of the parent CDs was the most suitable for creating inclusion complex
with the lipids, formulations with different CD concentrations without polymers were
prepared. The formulations were assessed after being shaken for one week. See Table 3
for the results.
Table 3 Results from the formulation of different cyclodextrins (CD) with cod liver oil (clo) and free fatty acids (ffa) . CD:clo:ffa ratio is 90:9:1 %v/v)
Formulation CD % CD w/v Results
1 γ 10 Monophasic, milky
2 γ 15 Monophasic, milky
3 α 10 Monophasic, milky
4 α 5 Biphasic, lipids on top
5 β 1,5 Biphasic, lipids on top
If the formulation was monophasic an inclusion complex had been formed. If the
formulation was biphasic a complex had not been formed. Formulation 1, 2 and 3 were
superior to the others. Formulation 1 was chosen for further development due to a better
toxicological profile for γ-CD compared to α –CD (Loftsson & Duchêne, 2007) and
lower CD content compared to formulation 2.

37
4.1.3 CD – polymer – lipid formulation
To find which of the polymers had the best stabilizing effect on the CD- lipid solutions,
a number of formulations containing different polymers in various concentrations were
prepared with and without preservatives. If the formulation contained preservatives they
were always identical: 0.02% w/v benzalkonium chloride (BAK) and 0.1% w/v
ethylenediaminetetraaceticd acid (EDTA). This was done to see the effects of
preservatives on a number of factors. See Table 4 for the formulation ingredients. All of
the formulations contained the same amount of NaCl, 5.5% w/v.
Table 4 Concentrations and results from the CD – polymer – lipid formulations (CD:clo:ffa: 90:9:1 (%v/v)) containing 5.5% w/v NaCl. If Y for preservatives, it contained 0.02% v/w BAK and 0.1% EDTA. CD – cyclodextrin,
Clo – cod liver oil, ffa – free fatty acids, CMC-Na – sodium salt of carboxymethylcellulose, HPMC – hydroxypropyl methylcellulose, PVA – polyvinyl alcohol, PVP – polyvinyl pyrrolidone, Y – yes, N - no
Formulation Polymer Polymer ratio (%w/v)
Preservatives Results
6 Lutrol 2,5 Y Monophasic
7 Lutrol 2,5 N Monophasic
8 Lutrol 5 Y Monophasic
9 Lutrol 5 N Monophasic
10 Carbomer 974 P
1 Y Fatty droplets on top
11 Carbomer 974 P
1 N Fatty droplets on top
12 Carbomer 974 P
0,5 Y Fatty droplets on top
13 Carbomer 974 P
0,5 N Fatty droplets on top
14 CMC-Na 1,5 Y Monophasic
15 CMC-Na 1,5 N Monophasic
16 CMC-Na 0,75 Y Monophasic
17 CMC-Na 0,75 N Monophasic
18 HPMC 1,5 Y Monophasic
19 HPMC 1,5 N Monophasic
20 HPMC 0,75 Y Monophasic
21 HPMC 0,75 N Monophasic
22 PVA 1,4 Y Monophasic
23 PVA 1,4 N Monophasic
24 PVP 2 Y Fatty layer on top
25 PVP 2 N Fatty layer on top
26 Lutrol + HPMC 1,5 + 1 Y Monophasic
27 Lutrol + HPMC 1,5 + 1 N Monophasic
28 None - Y Monophasic
29 None - N Monophasic

38
4.1.4 Testing the formulations
4.1.4.1 Flocculation test, redispersion and smell
Flocculation test was carried out over the course of 192 hours or 8 days as described
above. For simplification the data represented here do not show the degree of
flocculation but only when flocculation occurs. After the flocculation had been
determined, redispersion was assessed. The redispersion values represent the intensity
and length of shaking to get a uniform suspension. The values are in the range of 1 – 5.
Smell is given in the range of 1-6. See Table 5 for results. For the complete flocculation
data and breakdown of how the flocculation was built up, refer to appendix A.
Table 5 Flocculation, redispersion and smell of the formulations redispersion is combined from the intensity and length of shaking. Smell is objective of the observer. NA indicates that no flocculation occurred.
Formulation Hours after flocculation occurs I Smell
6 30 2 1
7 22 1 3
8 22 1 3
9 72 1 1
10 NA 1 6
11 72 2 6
12 0.5 1 6
13 5 1 6
14 NA * 1
15 NA * 2
16 NA * 2
17 NA * 4
18 5 5 4
19 1.5 2 4
20 22 3 3
21 5 2 3
22 22 5 4
23 22 4 3
24 þ5 2 3
25 0.5 1 4
26 192 1 2
27 96 1 6
28 22 1 2
29 0.5 5 4

39
Even though no flocculation was observed in formulation number 10, fatty droplets had
lined the inside of the cylinder after 22 hours. The asterisk at formulations 14-17
indicate that they were incredibly viscous and when shaking them for redispersion (even
though there was nothing to 39otovapor39d) the formulation did not move at all. Figure
6 shows the appearance of five formulations after 8 days in the flocculation test.
Figure 8 Appearance of formulations, from left to right, 9, 10, 14, 18 and 29 after being in the flocculation test for 8 days. The red circle indicate phase separations in formulation 9, 18 and 29 and fatty droplets on the inside of
the cylinder in formulation 10.
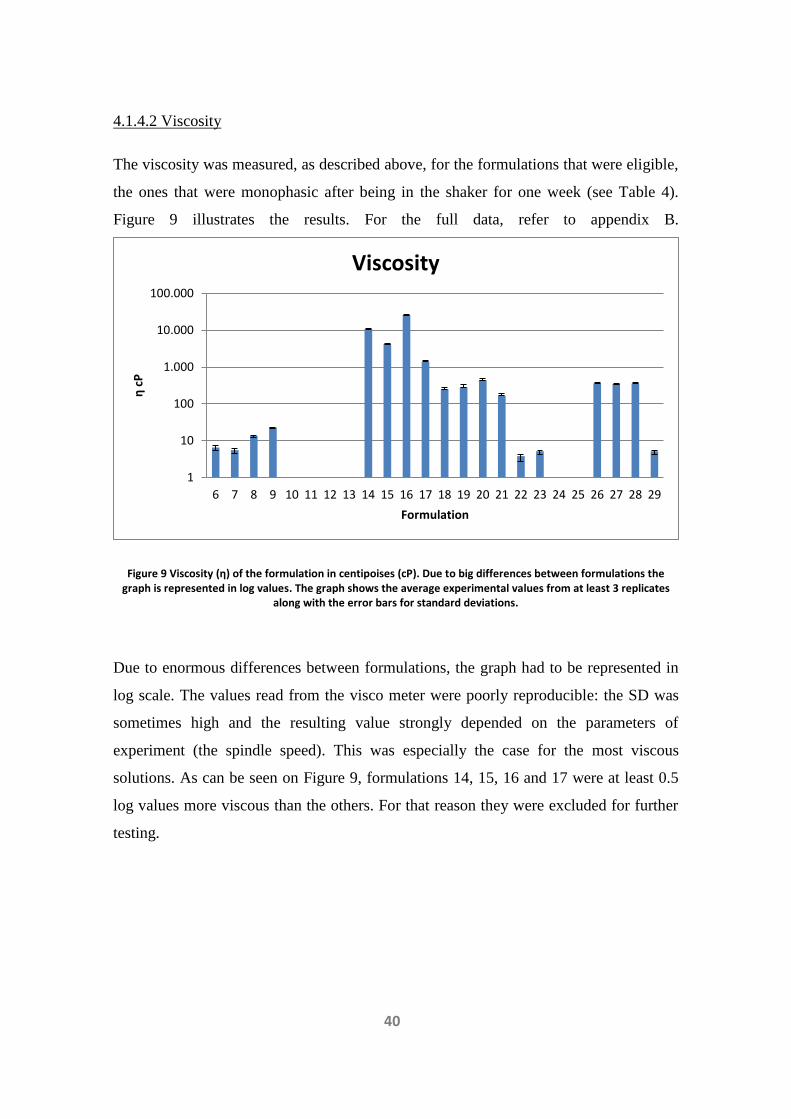
40
4.1.4.2 Viscosity
The viscosity was measured, as described above, for the formulations that were eligible,
the ones that were monophasic after being in the shaker for one week (see Table 4).
Figure 9 illustrates the results. For the full data, refer to appendix B.
Figure 9 Viscosity (η) of the formulation in centipoises (cP). Due to big differences between formulations the graph is represented in log values. The graph shows the average experimental values from at least 3 replicates
along with the error bars for standard deviations.
Due to enormous differences between formulations, the graph had to be represented in
log scale. The values read from the visco meter were poorly reproducible: the SD was
sometimes high and the resulting value strongly depended on the parameters of
experiment (the spindle speed). This was especially the case for the most viscous
solutions. As can be seen on Figure 9, formulations 14, 15, 16 and 17 were at least 0.5
log values more viscous than the others. For that reason they were excluded for further
testing.
1
10
100
1.000
10.000
100.000
6 7 8 9 10 11 12 13 14 15 16 17 18 19 20 21 22 23 24 25 26 27 28 29
η c
P
Formulation
Viscosity
40
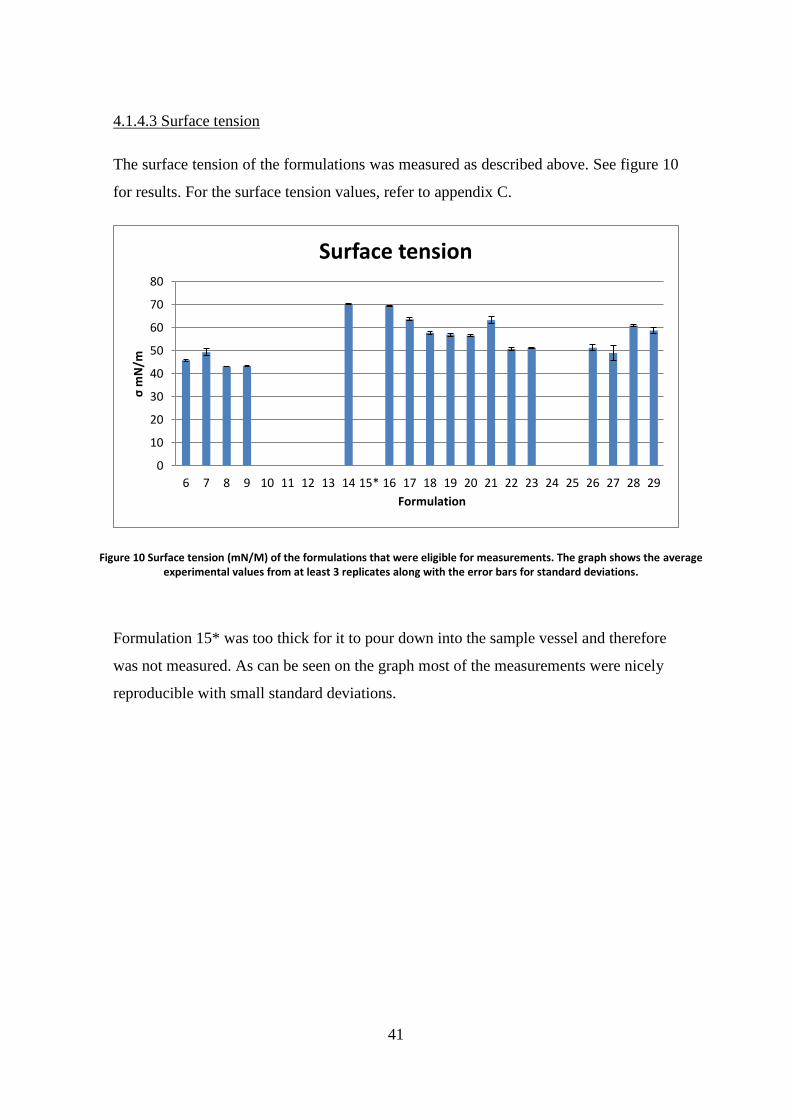
41
4.1.4.3 Surface tension
The surface tension of the formulations was measured as described above. See figure 10
for results. For the surface tension values, refer to appendix C.
Formulation 15* was too thick for it to pour down into the sample vessel and therefore
was not measured. As can be seen on the graph most of the measurements were nicely
reproducible with small standard deviations.
Figure 10 Surface tension (mN/M) of the formulations that were eligible for measurements. The graph shows the average experimental values from at least 3 replicates along with the error bars for standard deviations.
0
10
20
30
40
50
60
70
80
6 7 8 9 10 11 12 13 14 15* 16 17 18 19 20 21 22 23 24 25 26 27 28 29
σ m
N/m
Formulation
Surface tension
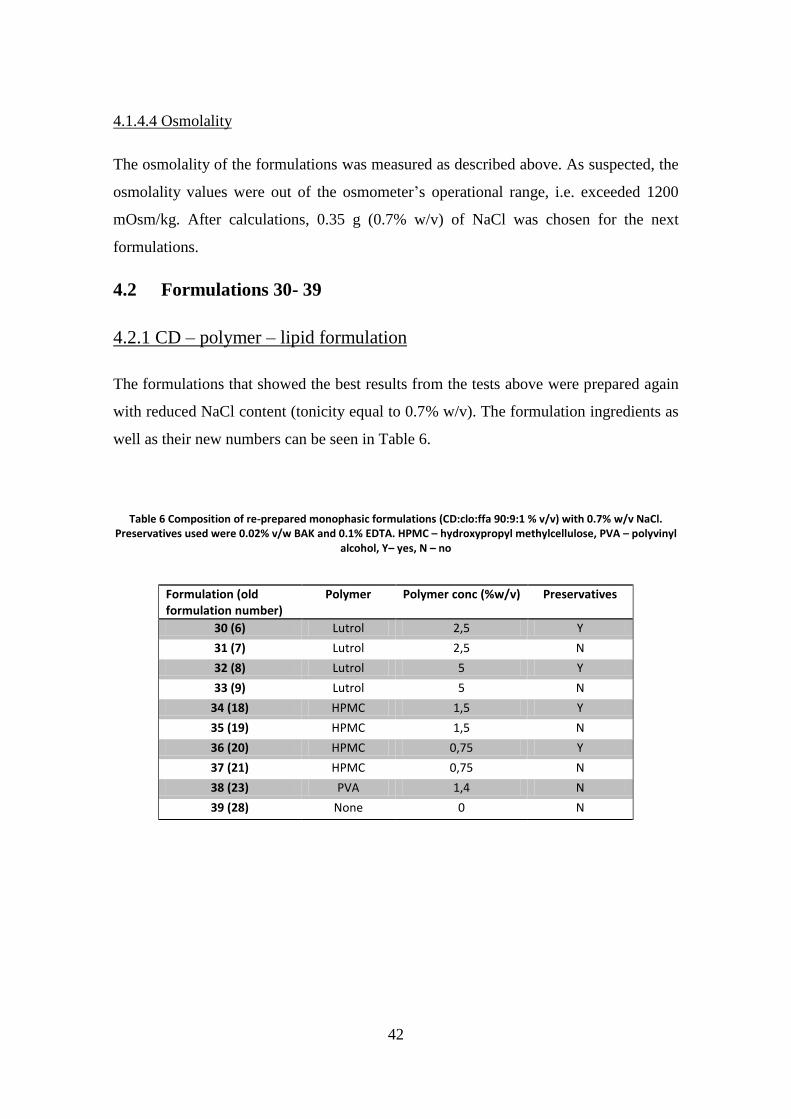
42
4.1.4.4 Osmolality
The osmolality of the formulations was measured as described above. As suspected, the
osmolality values were out of the osmometer’s operational range, i.e. exceeded 1200
mOsm/kg. After calculations, 0.35 g (0.7% w/v) of NaCl was chosen for the next
formulations.
4.2 Formulations 30- 39
4.2.1 CD – polymer – lipid formulation
The formulations that showed the best results from the tests above were prepared again
with reduced NaCl content (tonicity equal to 0.7% w/v). The formulation ingredients as
well as their new numbers can be seen in Table 6.
Table 6 Composition of re-prepared monophasic formulations (CD:clo:ffa 90:9:1 % v/v) with 0.7% w/v NaCl. Preservatives used were 0.02% v/w BAK and 0.1% EDTA. HPMC – hydroxypropyl methylcellulose, PVA – polyvinyl
alcohol, Y– yes, N – no
Formulation (old formulation number)
Polymer Polymer conc (%w/v) Preservatives
30 (6) Lutrol 2,5 Y
31 (7) Lutrol 2,5 N
32 (8) Lutrol 5 Y
33 (9) Lutrol 5 N
34 (18) HPMC 1,5 Y
35 (19) HPMC 1,5 N
36 (20) HPMC 0,75 Y
37 (21) HPMC 0,75 N
38 (23) PVA 1,4 N
39 (28) None 0 N
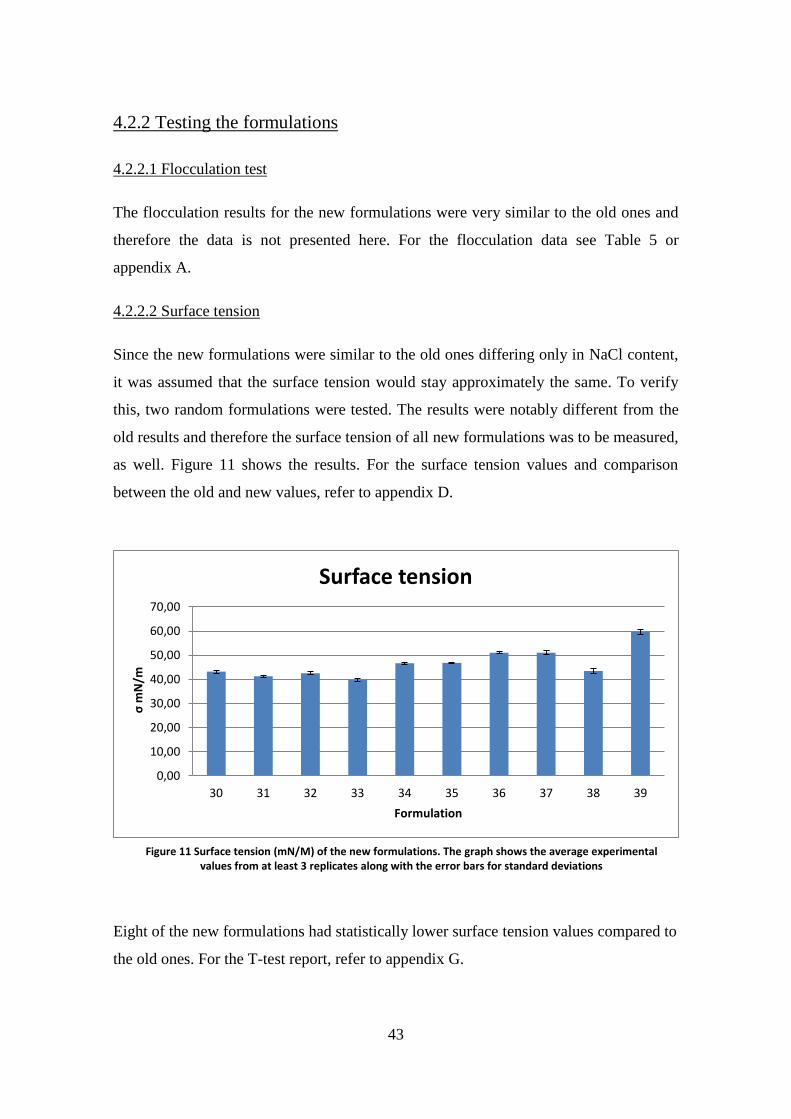
43
4.2.2 Testing the formulations
4.2.2.1 Flocculation test
The flocculation results for the new formulations were very similar to the old ones and
therefore the data is not presented here. For the flocculation data see Table 5 or
appendix A.
4.2.2.2 Surface tension
Since the new formulations were similar to the old ones differing only in NaCl content,
it was assumed that the surface tension would stay approximately the same. To verify
this, two random formulations were tested. The results were notably different from the
old results and therefore the surface tension of all new formulations was to be measured,
as well. Figure 11 shows the results. For the surface tension values and comparison
between the old and new values, refer to appendix D.
Eight of the new formulations had statistically lower surface tension values compared to
the old ones. For the T-test report, refer to appendix G.
0,00
10,00
20,00
30,00
40,00
50,00
60,00
70,00
30 31 32 33 34 35 36 37 38 39
σ m
N/m
Formulation
Surface tension
Figure 11 Surface tension (mN/M) of the new formulations. The graph shows the average experimental values from at least 3 replicates along with the error bars for standard deviations

44
4.2.2.3 Viscosity
Due to big differences in viscosity values between the new and old formulations
obtained from two random formulations, all of them were measured as well. See Figure
12 for results.
Figure 12 Viscosity (η) of the new formulations in centipoises (cP). The graph shows the average experimental values from at least 3replicates along with the error bars for standard deviations.
Again, the SD is relatively big and appears to grow as the viscosity increases. The
difference between the old and new formulations as well as the data from the viscosity
measurements can be seen in appendix E.
4.2.2.4 Osmolality
The osmolality values were measured as described above. See figure 13 for results and
appendix F for the osmolality values.
0,00
50,00
100,00
150,00
200,00
250,00
300,00
350,00
30 31 32 33 34 35 36 37 38 39
η c
P
Formulation
Viscosity

45
Figure 13 Osmolality, in milliosmoles/kg solute (mOsm/kg) of the new formulations. The graph shows the average experimental values from at least 3 replicates along with the error bars for standard deviations.
To proceed with the formulation testing, two of eight formulations were decided to be
selected based on the experimental data generated by this step. As stated above, a
formulation with viscosity around 20 has been considered ideal. Based on that,
formulations 34, 35, 36, 37 and 39 can be excluded. The surface tension values are all
quite similar and none can be excluded on the basis of that information. Datum from the
flocculation test points out that formulation 31, 32 and 38 are less stable then the two
others. Therefore, formulations 30 and 33 were chosen for further testing.
4.3 Formulations 30 and 33
4.3.1 Particle size distribution
The particle size distribution was assessed as described above. At maximum
magnification no individual particles could be identified. Scrutinizing the samples
carefully, it was concluded that there was a swarm of extremely small particles, piled
upon each other. Determination of the size of these particles seemed impossible using
available lightscope. Since the particles were much smaller than one interval in the
eyepiece scale, it was concluded that all of the particles were smaller than 1µm, which
perfectly satisfies the European Pharmacopeia requirements.
0,00
50,00
100,00
150,00
200,00
250,00
300,00
350,00
400,00
30 31 32 33 34 35 36 37 38 39
mO
sm/k
g
Formulation
Osmolality

46
4.3.2 Peroxide value
The results from the PV test can be seen in Figure 14. For the distinct values, refer to
appendix H.
Figure 14 Peroxide value (meq O2/kg sample) of formulations 30, 33 and “pure cod liver oil plus free fatty acids” at different conditions. Point zero = before formulation, A0 = formulated and shaken for 1 week, A1 = formulated
and kept protected from light and oxygen for 4 weeks, A2 = formulated and kept for 4 weeks protected from light, A3 = formulated and kept for 4 weeks protected from oxygen
As can be seen on Figure 14 all of the samples began at the same time, point zero. At
first formulation 30 protected the lipids best but after that skyrocketed compared to the
others. Formulation 33 seems to be the leader at protecting the lipids from oxidation.
The difference between formulation 30 and “pure cod liver oil plus free fatty acids” was
statistically relevant at condition A0. Formulation 33 was statistically lower at
conditions A0 and A2. Additionally, formulation 30 was statistically lower at condition
A0 compared to formulation 33, and formulation 33 statistically lower than formulation
30 at condition A2. For the T-test reports, please refer to appendix I.
0,00
10,00
20,00
30,00
40,00
50,00
60,00
70,00
80,00
90,00
Point zero A0 A1 A2 A3
Pe
roxi
de
Val
ue
Condition
Oxidation
30
33
No formulation

47
4.3.3 40-days flocculation
Figure 15 shows a 40-days flocculation test for formulations 30 and 33.
As can be seen on figure 15, a small fraction of the lipids in formulation 30 is not
complexed with the CDs and sits on top as a yellow fatty layer (circled by a red ring). In
opposite, the lipids in formulation 33 seem to be fully complexed with the CDs.
However, a clear border between the sediment and supernatant can be seen which seems
to be vacant of free lipids. Nevertheless, it can be readily redistributed by shaking.
Figure 15 40-days flocculation test. From left, formulations 31 and 33. The red circles indicate phase separation.

48
5. DISCUSSION
5.1 CD-polymer-lipid formulations
Blending of the polymer solutions went smoothly. The method used was obtained from
Fífa Konráðsdóttir, a Ph.D. student and is partly based on a method Bochot et al used to
produce small beads of α-CD and soy oil (Bochot et al., 2007). It appears that the
container the formulation is shaken in for a week to form the complex contributes to the
complex formation. When a smaller container was used for shaking, a formulation with
a fatty layer on top was produced at the end of shaking whereas, in a bigger container,
this layer did not form. Perhaps, container geometry affects noticeably the mixing
intensity and consequently the kinetics of complexation between ingredients.
The CD concentration in formulations 3 and 5 (10% α-CD and 1.5% β-CD respectively)
were chosen as approaching to their solubility (Loftsson & Brewster, 2010). To ensure
full dissolution before use, they were sonicated and heated to increase the solubility.
This was especially important for α- and β-CD. Only the parent CDs were assessed for
their complexing abilities since earlier research conducted at the Faculty of
Pharmaceutical Sciences, University of Iceland indicated the CD derivatives are not
able to form inclusion complexes with the lipids (Geirsson, 2008).
Previous research suggested that α- and γ-CD are superior to β-CD in creating a lipid-
CD complex (Duchêne et al., 2003). The results obtained in the given project supported
this suggestion. The reasion is probably β-CDs low solubility profile, meaning that the
ratio between the CD and lipids is not optimal. Formulation 1 (10% w/v γ-CD), was
chosen for further work since γ-CD has a better toxicological profile compared to α-CD
(Loftsson & Duchêne, 2007) and since lower CD content in comparison to formulation
2 (15% w/v γ-CD) diminishes risk of crust formation on the eyelids of dry eye patients,
leading to irritation (Loftsson. & Jarvinen, 1999).
5.2 Formulations 6-29.
The majority of the polymers used were able to co-produce a monophasic solution with
the CD and the lipids. Polivinyl pyrrolidone (formulations 24 and 25) however failed

49
completely and carbomer 974P (formulations 10-13) was not successful. They were
therefore excluded from further testing with the exception of flocculation, redispersion
and smell test. To facilitate solubilization and limit possible alterations, Lutrol was
refrigerated before mixing with the CD solutions. This is due to Lutrol’s
physicochemical properties: the polymer turns into a gel at relatively low temperatures
(Dumortier, Grossiord, Agnely, & Chaumeil, 2006).
The flocculation data give a representation of how stable the suspensions are and
therefore also the complexes. For formulations 14-17 no flocculation occurred, probably
due to enormous thickness. This viscosity can be traced back to the use of “high
viscosity” CMC-Na instead of CMc-Na of “low” or “medium” viscosity. It is
foreseeable that the values obtained from flocculation, redispersion, surface tension and
osmolality on high viscosity CMC-Na would have been different if the lower viscous
CMC-Na polymers had been used. From the data obtained it seems that a relationship
takes place: as the formulations take longer to flocculate, redispersion becomes easier.
These two are important factors; ideally the formulations should stay monophasic for as
long as possible and redispersion should be relatively easy to ensure a monophasic
solution is readily available. The nature of different layers in the formulation test should
also be considered (appendix A). It is obvious that a monophasic solution is superior to
a two- or a three-layered solution, but a two layered solution containing a water layer on
top of a suspension layer is more desirable to a fatty layer on top of a precipitate. In the
first one, a complex still exists between the lipids and the CD, while in the latter it does
not. It should also be noted that the smell is objective of the observer and varies from
person to person. However it is important to assess the smell as people do not like the
„fishy“smell of the cod liver oil, as well as of the free fatty acids. The formulations that
smell the least are therefore superior to the ones that smell the most. A clinical trial
involving marine lipids suppositories revealed that the cod liver oil smell was
troublesome to two thirds of the participants (Ormarsson et al., 2012). Whether the
same would be the case for eye drops is unknown but has to be considered likely since
they can easily reach the nasal cavity through tear ducts.
The viscosity of the solutions was quite different, ranging from about 5 to 25.000 cP. As
stated above, increased viscosity offers prolonged contact time and therefore
50
bioavailability. However, if the viscosity is too high, patients’ vision is compromised.
Additionally, as the viscosity becomes too high it becomes harder for the CD-drug
complex to partition from the bulk of the media towards, for example, the ocular barrier.
Therefore, a viscosity of about 20 cP has been considered optimal (Kråmer, 2002) and
the formulations that lay around that value are therefore superior to the ones that do not.
The values from the viscosity measurements were not very reproducible as can be
concluded from a rather large SD. The values should be treated deliberately since they
are dependent on experimental parameters, such as the spindle speed. No conclusion can
be made whether the preservatives increased viscosity or not. The formulations
containing the preservatives were more viscous in five cases and less viscous in four
cases.
The surface tension values were quite reproducible as the SD was small. Formulation 15
could not be poured down into the sample vessel due to high viscosity. It is however
strange since there are two formulations that are more viscous than formulation 15. The
reason behind this is unknown, but perhaps a little more patience could have made it
work. No conclusion can be made whether preservative increases or decreases surface
tension. The formulations containing the preservatives had higher surface tension values
in four cases and lower values in four cases.
The fact that the formulations had osmolality values over 1200 mOsm/kg was not a
surprise. A 5.5% w/v NaCl (57.5 g/mole), corresponds to 2.77 g or 0.048 moles of NaCl
in 50 ml of water. To calculate osmolality, the amount of solvent has to be taken into
the equation as well as the total number of dissolved particles with account for their
dissociation. The amount of solvent is 50ml, i.e. 0.05kg, and NaCl is known to fully
dissociate into two ions (Na+ and Cl
-):
= 1.926 mOsm/kg, which
is far above the maximum detection limit for the osmo meter. There is no specific
reason why the formulations had such a large quantity of NaCl other than
thoughtlessness during the formulation. To correct these mistakes, the formulations had
to be remade with less NaCl than before. As stated above, blood and tear osmolality is
287 mOsm/kg (Kråmer, 2002). Osmolality depends on a number of factor, one of them
being the molar concentration of dissolved solute (US Pharmacopeia, 2006). As the
other ingredients in the formulation were a part of the dissolved solute, NaCl was not

51
the only part responsible for the high osmolality but definitely the biggest one.
Therefore, it was decided that a formulation with 0.35 g of NaCl in a 50 ml formulation,
a little hypotonic to tear osmolality, or 243 mOsm/kg, would be chosen for the next
formulations.
5.3 Formulations 30-39.
The formulations chosen to be remade were the ones that had the best results from the
tests above. The formulations containing the CMC-Na polymer (formulations 14-17)
were too viscous and therefore were rejected along with the already excluded
formulations containing PVP (formulations 24 and 25) and carbomer 974P
(formulations 10-13). Formulation 22 was rejected due to high redispersion score as
well as strong smell, formulations 26 and 27 due to high viscosity values and, finally,
formulation 29 due to low stability, high redispersion score and bad smell.
Comparing the surface tension values from the new formulations and the old ones it
turns out the new formulation values are all lower than the old formulation values,
ranging from 0.5 mN/m to 20.1. The surface tension values of new formulations are all,
except formulations 8/32 and 28/39 (old number/new number), statistically lower
(α=0.05) than those of old formulations containing more NaCl. This decrease is due to
Coulombic attraction that draws the ions together and away from the surface, and is in
agreement with previous results (Bhatt, Chee, Newman, & Radke, 2004). A comparison
between the old and new values can be seen in appendix D and the T-test reports in
appendix G.
When comparing the viscosity values of the new formulations with those of the old
ones, no specific trend is revealed as the values fluctuate in relation to each other, see
appendix E.
The measured osmolality values were somewhat hypertonic (average of all formulations
329 mOsm/kg) compared to the calculated value of 243 mOsm/kg. The values are
satisfactory even though they are higher than desired. This is explained by the presence
of other ingredients (like CD, polymer, preservatives) contributing to the total
osmolality. By optimizing the NaCl concentration an ideal osmolality could be derived
but due to lack of time these minor modifications were not performed.

52
5.4 Formulations 30 and 33
The particle size distribution revealed no particles bigger than 1 µm. These results
therefore perfectly comply with the European Pharmacopeia. The available light
microscope operation range was not enough to identify individual particles of such
small size, magnification of at least 10.000 would be sufficient.
Initially, lipid extraction seemed problematic, largely due to failure of lipids to pass
through the filtering paper. However, after a couple of attempts, the lipids were poured
off, and the extraction went smoothly. The amount of lipids extracted, as a ratio of
lipids added to the formulation was surprisingly high. Based on the density of cod liver
oil, ~0.90 g/ml (Loveridge, 2002) the ratio extracted exceeded 100% in some cases (see
appendix H). This means that a considerable amount of impurities, i.e. polymers or
solvents, were present during the execution of the PV. This skews the results from the
peroxide testing, as it would decrease the PV since less-than-calculated amount of lipids
were being titrated. In addition, it seemed as two thirds of the bottles in conditions A2
with formulation 33 titration number 3 (see appendix H) had undissolved free fatty
acids at the end of the titration. This could have led to lower PVs. However, compared
to the other bottles containing formulation 33 in conditions A2, the results were similar.
A number of other factors could also have skewed the results from the titration. The
lack of experience of the investigator, imprecise dilution of the titrant and the conditions
it was kept which could maybe have led to deterioration. Therefore the results should be
taken with some precaution.
The lipids are already oxidized considerably before the encapsulation process, as can be
seen with the PV at point zero. Þormóður assessed the PV of cod liver oil before
encapsulation and got a considerably lower value of roughly 5 (Geirsson, 2008) while
Lýsi hf states that its cod liver oil has a maximum PV of 10 (Lýsi, 2013). The increased
oxidation measured in this study could be, aside from the factors mentioned above, due
to age of cod liver oil used in this project or inappropriate storage conditions.
The peroxide values in conditions A0 showed that both formulations protected the lipids
from oxidation. Both had statistically lower values assuming two tailed test for unequal
53
variences, formulation 30 with a p-value of 1.64*10-07
compared to lipids kept without
any formulation and formulation 33 with a p-value of 1.8*10-5
. In conditions A2 and A3
something was going on which seemed difficult to interpret. The lipids with no
formulation had lower PV than formulation 30. These results are in contrast with
published data showing that the CDs protect fatty acids from oxidation (Geirsson, 2008;
Kim et al., 2000; Ying et al., 2011). It is possible however that during extraction of the
lipids, considerable oxidation occurred which increased the PV. The plastic bag might,
for example, not been sealed perfectly and/or the heat that was applied with the
rotovapor could have increased the oxidation. As can be seen with the 40-days
flocculation test, a portion of the lipids was not in a complex with the CD anymore. It is
plausible that this could have contributed to increased oxidation of the lipids; compared
to when they had been sealed in a complex with the CD. However, no fatty layer was
observed when extraction of the lipids began so that is apparently not the case.
Additionally it is possible that the lipids without formulation had oxidized so much that
the peroxide values were beginning to decrease, but as discussed in the introduction the
PV follows an inverse parabolic curve. For a complete picture of the oxidation, AV
should be measured and the totox number derived but unfortunately this was out of the
scope of this project. At conditions A2, formulation 33 gave statistically lower PV value
than the lipids without any formulation with a p value equal to 0.014. Additionally, PV
value of formulation 30 was statistically lower in conditions A0 compared to
formulation 33 (p=1.55*10-5
) while PV value of formulation 33 was statistically lower
than that of formulation 30 at conditions A2 (p=8.2*10-6
). Visually though, formulation
33 appeared to be a leader at protecting these lipids.
The 40 day flocculation test showed that formulation 33 was more stable than
formulation 30. The fact that the lipids were, partly, not in a complex with the CD in
formulation 3 after this time could lead to increased oxidation and therefore damaged
product.

54
6. CONCLUSION
It appears that α- and γ-CD at 10% w/v are equally effective in forming a CD-lipid
complex and are superior to β-CD in doing so. γ-CD is however considered to be a
better candidate for eye drop formulation due to a better toxicological profile. From the
results it can be concluded that a combination of γ-CD, and certain polymers are able to
produce a stable, monophasic formulation with cod liver oil and free fatty acids. The
majority of the polymers tested were able to co-produce monophasic solutions with the
lipids and CD.
Two formulations appeared superior to the others after testing the flocculation,
redispersion, smell, surface tension, viscosity and osmolality; one containing 2.5% w/v
poloxamer 407 with 0.02% BAK and 0.1% EDTA w/v, and the other 5% poloxamer
407. Both formulations had optimal viscosity, were relatively stable toward
flocculation, were easily redistributed after standing for an extended period of time,
masked the cod liver oil smell and had an acceptable osmolality value. These two
formulations also complied with the particle size distribution of the European
Pharmacopeia for eye drops. The peroxide values indicate that the CDs might protect
the lipids from oxidation even though the evidence obtained in this project on that was
not conclusive.
Continued research is needed, to see whether or not the CDs protect the lipids from
oxidation, and to what extent, and to see how much the flux of the lipids to, for
example, the cornea of the eye is.

55
7. ACKNOWLEDGEMENT
I would like to thank my supervisor Þorsteinn Loftsson for read through of the thesis
and Dr. Sergey Kurkov for his help during the project and read trough of the thesis.
I would like to thank Dr. Maria Dolores for good advices through the project, Ph.D
students Sunna Jóhannsdóttir and Ingólfur Magnússon for companionship and great tips,
Fífa Konráðsdóttur for helping with preparing the formulations and great tips on the
peroxide value test and Auður Ágústsdóttir for helping finding the right glassware.
I would like to extend my gratitude to Lýsi hf for generously donating vital solutions for
the peroxide test.
I would like to thank both my family and friends for support for the last five years.
Last but not least, I would like to thank my fellow students for the past five years as
they have been both educational and loads of fun.

56
8. REFERENCES
Ahmed, I., & Patton, T. F. (1985). Importance of the noncorneal absorption route in
topical ophthalmic drug delivery. Investigative Ophthalmology & Visual
Science, 26(4), 584-587.
Aldrich, S. (2012). Safety Data Sheet for PVP. MSDS Retrieved 12.03.2013, from
http://www.sigmaaldrich.com/MSDS/MSDS/DisplayMSDSPage.do?country=IS
&language=en&productNumber=PVP40&brand=SIAL&PageToGoToURL=htt
p%3A%2F%2Fwww.sigmaaldrich.com%2Fcatalog%2Fproduct%2Fsial%2Fpvp
40%3Flang%3Den
Aldrich, S. (2013). Safety Data Sheet for HPMC. MSDS Retrieved 12.03.13, from
http://www.sigmaaldrich.com/MSDS/MSDS/DisplayMSDSPage.do?country=IS
&language=en&productNumber=56340&brand=SIGMA&PageToGoToURL=ht
tp%3A%2F%2Fwww.sigmaaldrich.com%2Fcatalog%2Fproduct%2Fsigma%2F
56340%3Flang%3Den
Ammar, H. O., Salama, H. A., Ghorab, M., & Mahmoud, A. A. (2009). Nanoemulsion
as a potential ophthalmic delivery system for dorzolamide hydrochloride. AAPS
PharmSciTech, 10(3), 808-819.
Arterburn, L. M., Hall, E. B., & Oken, H. (2006). Distribution, interconversion, and
dose response of n−3 fatty acids in humans. The American journal of clinical
nutrition, 83(6), S1467-1476S.
Association, I. F. (2011). IFRA Analytical Method: Determination of the Peroxide
Value http://www.ifraorg.org/en-us/analytical_methods_1. Belgium:
International Fragrance Association.
Barar, J., Javadzadeh, A. R., & Omidi, Y. (2008). Ocular novel drug delivery: impacts
of membranes and barriers. Expert Opinion on Drug Delivery, 5(5), 567-581.
BASF. (2010). Technical Information - Lutrol L and Lutrol F-Grades. Technical
Information Retrieved 12.03.13, from http://www.pharma-
ingredients.basf.com/Statements/Technical%20Informations/EN/Pharma%20Sol
utions/03_100102e_Lutrol%20L%20and%20Lutrol%20F-Grades.pdf
Baudouin, C. (2001). The Pathology of Dry Eye. Survey of Ophthalmology, 45,
Supplement 2(0), S211-S220.
Benitez-Del-Castillo, J. M. (2012). How to promote and preserve eyelid health. Clinical
Ophthalmology, 6, 1689-1698.
Bhatt, D., Chee, R., Newman, J., & Radke, C. J. (2004). Molecular simulation of the
surface tension of simple aqueous electrolytes and the Gibbs adsorption
equation. Current Opinion in Colloid & Interface Science, 9(1–2), 145-148.

57
Bligh, E. G., & Dyer, W. J. (1959). A rapid method of total lipid extraction and
purification. Canadian journal of biochemistry and physiology, 37(8), 911-917.
Bochot, A., & Fattal, E. (2012). Liposomes for intravitreal drug delivery: a state of the
art. Journal of controlled release: official journal of the Controlled Release
Society, 161(2), 628-634.
Bochot, A., Trichard, L., Le Bas, G., Alphandary, H., Grossiord, J. L., Duchene, D., &
Fattal, E. (2007). alpha-Cyclodextrin/oil beads: an innovative self-assembling
system. International Journal of Pharmaceutics, 339(1-2), 121-129.
Brewster, M. E., & Loftsson, T. (2007). Cyclodextrins as pharmaceutical solubilizers.
Advanced drug delivery review, 59(7), 645-666.
Brookfield. (2013). Company history - When viscosity is measured Retrieved
27.2.2013, 2013, from
http://www.brookfieldengineering.com/company/company-history.asp
Calder, P. C. (2003). N-3 polyunsaturated fatty acids and inflammation: from molecular
biology to the clinic. Lipids, 38(4), 343-352.
Calder, P. C. (2006). n-3 polyunsaturated fatty acids, inflammation, and inflammatory
diseases. American journal of clinical nutrition, 83(6 Suppl), 1505S-1519S.
Calder, P. C., & Zurier, R. B. (2001). Polyunsaturated fatty acids and rheumatoid
arthritis. Current opinion in clinical nutrition and metabolic care, 4(2), 115-121.
Calonge, M. (2001). The Treatment of Dry Eye. Survey of Ophthalmology, 45,
Supplement 2(0), S227-S239.
Cleland, L. G., James, M. J., & Proudman, S. M. (2003). The role of fish oils in the
treatment of rheumatoid arthritis. Drugs, 63(9), 845-853.
Covington, M. B. (2004). Omega-3 fatty acids. American family physician, 70(1), 133-
140.
Davies, N. M. (2000). Biopharmaceutical considerations in topical ocular drug delivery.
Clinical and experimental pharmacology and physiology, 27(7), 558-562.
Del Valle, E. M. M. (2004). Cyclodextrins and their uses: a review. Process
Biochemistry, 39(9), 1033-1046.
Duchêne, D., Bochot, A., Yu, S.-C., Pépin, C., & Seiller, M. (2003). Cyclodextrins and
emulsions. International Journal of Pharmaceutics, 266(1–2), 85-90.
Dumortier, G., Grossiord, J., Agnely, F., & Chaumeil, J. (2006). A Review of
Poloxamer 407 Pharmaceutical and Pharmacological Characteristics.
Pharmaceutical Research, 23(12), 2709-2728.

58
Emken, E. A., Adlof, R. O., & Gulley, R. M. (1994). Dietary linoleic acid influences
desaturation and acylation of deuterium-labeled linoleic and linolenic acids in
young adult males. Biochimica et Biophysica Acta - Lipids and Lipid
metabolism, 1213(3), 277-288.
Europe, C. o. (2013). European pharmacopeia (7 ed.). Strasbourg: Council of Europe.
FDA. (2004). Omacor® Retrieved 13.03.2013, from
http://www.accessdata.fda.gov/drugsatfda_docs/label/2004/21654lbl.pdf
Florence, A., T., & Attwood, D. (2003). Polymers and macromolecules
Physicochemical Principles of Pharmacy (pp. 273-326). London, Great Britain:
Pharmaceutical Press.
Foulks, G. N., Nichols, K. K., Bron, A. J., Holland, E. J., McDonald, M. B., & Nelson,
J. D. (2012). Improving Awareness, Identification, and Management of
Meibomian Gland Dysfunction. Ophthalmology, 119(10, Supplement), S1-S12.
Fraunfelder, F. T., Sciubba, J. J., & Mathers, W. D. (2012). The role of medications in
causing dry eye. Journal of ophthalmology, 2012, 285851.
Freeman, M. P., Hibbeln, J. R., Wisner, K. L., Davis, J. M., Mischoulon, D., Peet, M., . .
. Stoll, A. L. (2006). Omega-3 fatty acids: evidence basis for treatment and
future research in psychiatry. the journal of clinical psychiatry, 67(12), 1954-
1967.
Funk, C. D. (2001). Prostaglandins and leukotrienes: advances in eicosanoid biology.
Science, 294(5548), 1871-1875.
Gardner, H. W. (1989). Oxygen radical chemistry of polyunsaturated fatty acids. Free
Radical Biology and Medicine, 7(1), 65-86.
Gaudana, R., Ananthula, H. K., Parenky, A., & Mitra, A. K. (2010). Ocular drug
delivery. AAPS PharmSciTech, 12(3), 348-360.
Geirsson, T. (2008). Þróun og framleiðsla þurrdufts úr þorskalýsi fyrir töfluslátt. M.Sc,
University of Iceland, Reykjavík.
Gipson, I. K. (2004). Distribution of mucins at the ocular surface. Experimental Eye
Research, 78(3), 379-388.
GmBh. (2007). User manual for Vapor Pressure Osmometer. Berlin, Germany.
Goto, E., Endo, K., Suzuki, A., Fujikura, Y., Matsumoto, Y., & Tsubota, K. (2003).
Tear evaporation dynamics in normal subjects and subjects with obstructive
meibomian gland dysfunction. Investigative ophthalmology & visual science,
44(2), 533-539.
Haraldsson, G. G., & Hjaltason, B. (2001). Fish oils as sources of important
polyunsaturated fatty acids. Structured and modified lipids, 313-350.

59
Harvard Medical School. (2010). The Aging Eye: Preventing and treating eye disease.
In L. Fine, Heier, J. (Ed.), Harvard Medical School Special Health Report.
Harvard Health Publications: Harvard Medical School
Harvey, R. A., & Ferrier, D. (2011). Biochemistry. Philadelphia: Lippincott.
Hákonarson, K. (2009). Kerfi sýklódextrína og fituefna úr þorskalýsi - áhrif fjölliða,
frostþurrkun, töflusláttur og geymsluþolspróf. M.Sc, University of Iceland,
Reykjavík.
Herzlich A A., Patel M., Sauer T C., & Chan, C., C. (2010). Retinal anatomy and
pathology. In Q. Nguyen, D., Rodrigues, E, B., Farah, M, E., Mieler, W, F.
(Ed.), Retinal pharmacotherapy (pp. 5-14). NA: Saunders Elsevier.
Hilmarsson, H., Kristmundsdóttir, T., & Thormar, H. (2005). Virucidal activities of
medium- and long-chain fatty alcohols, fatty acids and monoglycerides against
herpes simplex virus types 1 and 2: comparison at different pH levels. APMIS,
113(1), 58-65.
James, M. J., & Cleland, L. G. (1997). Dietary n-3 fatty acids and therapy for
rheumatoid arthritis. Seminars and arthritis and rheumatism, 27(2), 85-97.
Kenny, J. G., Ward, D., Josefsson, E., Jonsson, I.-M., Hinds, J., Rees, H. H., . . .
Horsburgh, M. J. (2009). The <italic>Staphylococcus aureus</italic> Response
to Unsaturated Long Chain Free Fatty Acids: Survival Mechanisms and
Virulence Implications. PLoS ONE, 4(2), e4344.
Kim, S. J., Park, G. B., Kang, C. B., Park, S. D., Jung, M. Y., Kim, J. O., & Ha, Y. L.
(2000). Improvement of oxidative stability of conjugated linoleic acid (CLA) by
microencapsulation in cyclodextrins. Journal of agricultural and food chemistry,
48(9), 3922-3929.
Kojarunchitt, T., Hook, S., Rizwan, S., Rades, T., & Baldursdottir, S. (2011).
Development and characterisation of modified poloxamer 407 thermoresponsive
depot systems containing cubosomes. International Journal of Pharmaceutics,
408(1-2), 20-26.
Kråmer, I., Haber, M., Duis, A. (2002). Formulation Requirements for the Ophthalmic
Use of Antiseptics. In Behrens-Baumann (Ed.), Antiseptic Prophylaxis and
Therapy in Ocular Infections. Principles, Clinical Practice, and Infection
Control (Vol. 33, pp. 85-94). Switserland: Karger.
Kris-Etherton, P. M., Harris, W. S., & Appel, L. J. (2002). Fish Consumption, Fish Oil,
Omega-3 Fatty Acids, and Cardiovascular Disease. Circulation, 106(21), 2747-
2757.
KRÜSS. (2013). The plate method Retrieved 27.2.2013, from
http://www.kruss.de/en/theory/measurements/surface-tension/plate-method.html

60
Le Bourlais, C., Acar, L., Zia, H., Sado, P. A., Needham, T., & Leverge, R. (1998).
Ophthalmic drug delivery systems—Recent advances. Progress in Retinal and
Eye Research, 17(1), 33-58.
Lecerf, J. M. (2009). Fatty acids and cardiovascular disease. Nutrition reviews, 67(5),
273-283.
Lehninger, A., Nelson, D., & Cox, M. (2008). Lehninger Principles of Biochemistry: W.
H. Freeman.
Lipinski, C. A., Lombardo, F., Dominy, B. W., & Feeney, P. J. (2001). Experimental
and computational approaches to estimate solubility and permeability in drug
discovery and development settings. Advanced drug delivery reviews, 46(1–3),
3-26.
Liu, L., & Guo, Q.-X. (2002). The Driving Forces in the Inclusion Complexation of
Cyclodextrins. Journal of inclusion phenomena and macrocyclic chemistry,
42(1-2), 1-14.
LMS. (2006). Material Safety Data Sheet for CMC-Na. MSDS Retrieved 12.03.13,
from http://www.products-for-mining.com/index_files/m2.pdf
Loftsson, T., & Brewster, M. E. (1996). Pharmaceutical applications of cyclodextrins. 1.
Drug solubilization and stabilization. Journal of Pharmaceutical Sciences,
85(10), 1017-1025.
Loftsson, T., & Brewster, M. E. (2010). Pharmaceutical applications of cyclodextrins:
basic science and product development. The Journal of pharmacy and
pharmacology, 62(11), 1607-1621.
Loftsson, T., & Brewster, M. E. (2011). Pharmaceutical applications of cyclodextrins:
effects on drug permeation through biological membranes. The Journal of
pharmacy and pharmacology, 63(9), 1119-1135.
Loftsson, T., & Duchêne, D. (2007). Cyclodextrins and their pharmaceutical
applications. International Journal of Pharmaceutics, 329(1–2), 1-11.
Loftsson, T., Thormar, H., ÓLafsson, J. H., Gunnarsdóttir, T. M., Hjaltason, B., &
Gudmundsson, G. (1998). Fatty Acid Extract From Cod-liver Oil: Activity
Against Herpes Simplex Virus and Enhancement of Transdermal Delivery of
Acyclovir In-vitro. Pharmacy and Pharmacology Communications, 4(6), 287-
291.
Loftsson, T., Vogensen, S. B., Desbos, C., & Jansook, P. (2008). Carvedilol:
solubilization and cyclodextrin complexation: a technical note. AAPS
PharmSciTech, 9(2), 425-430.
Loftsson., & Jarvinen, T. (1999). Cyclodextrins in ophthalmic drug delivery. Advanced
drug delivery review, 36(1), 59-79.

61
Lopez-Nicolas, J. M., Bru, R., Sanchez-Ferrer, A., & Garcia-Carmona, F. (1995). Use
of 'soluble lipids' for biochemical processes: linoleic acid-cyclodextrin inclusion
complexes in aqueous solutions. The Biochemical journal, 308 ( Pt 1), 151-154.
Loveridge. (2002). Safety data sheet for Cod Liver Oil Retrieved 29.4.2013, from
http://www.jmloveridge.com/cosh/Cod%20Liver%20Oil.pdf
LubrizolCorporation. (2013). Material Safety Data Sheet for Carbopol 974P. MSDS
Retrieved 12.03.13, from
http://www.lubrizol.com/msds/MSDS.aspx?L=941&c=1942&p=CBP1053
Lýsi. (2013). Cod liver oil Retrieved 21.4.13, from
http://www.lysi.eu/BulkProducts/CodLiverOil/
Macsai, M. S. (2008). The role of omega-3 dietary supplementation in blepharitis and
meibomian gland dysfunction. Transactions of the American Ophthalmological
Society, 106, 336-356.
McCarty, C. A., Bansal, A. K., Livingston, P. M., Stanislavsky, Y. L., & Taylor, H. R.
(1998). The epidemiology of dry eye in Melbourne, Australia. Ophthalmology,
105(6), 1114-1119.
Miljanovic, B., Trivedi, K. A., Dana, M. R., Gilbard, J. P., Buring, J. E., & Schaumberg,
D. A. (2005). Relation between dietary n-3 and n-6 fatty acids and clinically
diagnosed dry eye syndrome in women. American journal of clinical nutrition,
82(4), 887-893.
Miller, M. (2012). Oxidation of food grade oils Retrieved 13.03.2013, from
http://www.oilsfats.org.nz/library.htm
Ormarsson, O. T., Geirsson, T., Bjornsson, E. S., Jonsson, T., Moller, P., Loftsson, T.,
& Stefansson, E. (2012). Clinical trial: marine lipid suppositories as laxatives.
Marine Drugs, 10(9), 2047-2054.
Park, C. W., Kim, S. J., Park, S. J., Kim, J. H., Kim, J. K., Park, G. B., . . . Ha, Y. L.
(2002). Inclusion complex of conjugated linoleic acid (CLA) with cyclodextrins.
Journal of agricultural and food chemistry, 50(10), 2977-2983.
Patel, V. D., Watanabe, J. H., Strauss, J. A., & Dubey, A. T. (2011). Work productivity
loss in patients with dry eye disease: an online survey. Current medical research
and opinion, 27(5), 1041-1048.
Perry, H. D. (2008). Dry eye disease: pathophysiology, classification, and diagnosis.
The American journal of managed care, 14(3), S79-87.
Pharmacopeia, U. (2006). General Chapters - Osmolality and Osmolarity. In H. Pappa
(Ed.), Us Pharmacopeia (Vol. 31, pp. 2718). USA.
Rand, A. L., & Asbell, P. A. (2011). Nutritional supplements for dry eye syndrome.
Current opinion in ophthalmology, 22(4), 279-282.

62
Rashid, S., Jin, Y., Ecoiffier, T., Barabino, S., Schaumberg, D, and Dana, M. (2008).
Topical omega-3 and omega-6 fatty acids for treatment of dry eye. Archives of
Ophthalmology, 126(2), 219-225.
Regiert, M., Wimmer, T., & Moldenhauer, J. P. (1996). Application of γ-cyclodextrin
for the stabilization and/or dispersion of vegetable oils containing triglycerides
of polyunsatured acids. Journal of inclusion phenomena and molecular
recognition in chemistry, 25(1-3), 213-216.
Rhcastilhos. (2007). Schematic diagram of the human eye Retrieved 10.12.12, from
http://en.wikipedia.org/wiki/File:Schematic_diagram_of_the_human_eye_en.sv
g
Riediger, N. D., Othman, R. A., Suh, M., & Moghadasian, M. H. (2009). A Systemic
Review of the Roles of n-3 Fatty Acids in Health and Disease. Journal of the
American Dietetic Association, 109(4), 668-679.
Rolando, M., & Zierhut, M. (2001). The Ocular Surface and Tear Film and Their
Dysfunction in Dry Eye Disease. Survey of Ophthalmology, 45, Supplement
2(0), S203-S210.
Roncone, M., Bartlett, H., & Eperjesi, F. (2010). Essential fatty acids for dry eye: A
review. Contact Lens and Anterior Eye, 33(2), 49-54.
Rybin, V. G., Shul’gina, L. V., Kuklev, D. V., Byval’tseva, T. M., Blinov, Y. G.,
Davletshina, T. A., & Akulin, V. N. (2000). Activity of a new antimicrobial
preparation from fish oils from various sources: Effects of different factors.
Applied Biochemistry and Microbiology, 36(4), 425-428.
Sargent, J. R., McEvoy, L. A., & Bell, J. G. (1997). Requirements, presentation and
sources of polyunsaturated fatty acids in marine fish larval feeds. Aquaculture,
155(1–4), 117-127.
Schein, O. D., Munoz, B., Tielsch, J. M., Bandeen-Roche, K., & West, S. (1997).
Prevalence of dry eye among the elderly. The American journal of
Ophthalmology, 124(6), 723-728.
Scherz, W., Doane, M., & Dohlman, C. (1974). Tear volume in normal eyes and
keratoconjunctivitis sicca. Albrecht von Graefes Archiv für klinische und
experimentelle Ophthalmologie, 192(2), 141-150.
ScienceLab. (2005). Material Safety Data Sheet for PVA. MSDS Retrieved 12.03.2013,
from http://www.sciencelab.com/msds.php?msdsId=9927396
Shin, S. Y., Bajpai, V. K., Kim, H. R., & Kang, S. C. (2007). Antibacterial activity of
eicosapentaenoic acid (EPA) against foodborne and food spoilage
microorganisms. LWT - Food Science and Technology, 40(9), 1515-1519.
Silverthorn, D., U. (2009). Sensory Phisology. In E. W (Ed.), Human Physiology. San
francisco: Pearson education.

63
Simic, M. G. (1981). Free radical mechanisms in autoxidation processes. Journal of
Chemical Education, 58(2), 125.
Simopoulos, A. P. (1991). Omega-3 fatty acids in health and disease and in growth and
development. American journal of clinical nutrition, 54(3), 438-463.
Stella, V. J., & He, Q. (2008). Cyclodextrins. Toxicologic pathology, 36(1), 30-42.
Stern, M. E., Gao, J., Siemasko, K. F., Beuerman, R. W., & Pflugfelder, S. C. (2004).
The role of the lacrimal functional unit in the pathophysiology of dry eye.
Experimental Eye Research, 78(3), 409-416.
Surette, M. E. (2008). The science behind dietary omega-3 fatty acids. CMAJ:
Canadian Medical Association Journal, 178(2), 177-180.
Szejtli, J. (1989). Downstream processing using cyclodextrins. Trends in Biotechnology,
7(7), 170-174.
Szejtli, J. (1998). Introduction and General Overview of Cyclodextrin Chemistry.
Chemical reviews, 98(5), 1743-1754.
Szente, L., Szejtli, J., Szemán, J., & Kató, L. (1993). Fatty acid-cyclodextrin complexes:
Properties and applications. Journal of inclusion phenomena and molecular
recognition in chemistry, 16(4), 339-354.
Tiffany, J. M. (1985). The role of meibomian secretion in the tears. Transactions of the
ophthalmological societies in the United Kingdom, 104 ( Pt 4), 396-401.
USP. (1995). U.S PHARMACOPEIA - Pharmaceutical Dosage Forms USP29 (pp.
1945-1946). The National Formulary; Rockville, MD, USA The United States
Pharmacopeial Convention Inc.
Vargaftik, N., B,. Volkov, B, N,. Viljak L, D,. (1983). International Tables of the
Surface Tension of Water. Physical Chemistry, 12(3), 817-820.
Villani, F., Comazzi, R., De Maria, P., & Galimberti, M. (1998). Effect of dietary
supplementation with polyunsaturated fatty acids on bronchial hyperreactivity in
subjects with seasonal asthma. Respiration, 65(4), 265-269.
Ying, C., Ming-Li, H., Yan-Hua, Z., & Hua-Jie, W. (2011). Improvement of oxidative
stability of conjugated linolenic acid by complexation with beta-cyclodextrin.
Micro & Nano Letters, IET, 6(10), 874-877.
Zoukhri, D., Hodges, R. R., & Dartt, D. A. (1998). Lacrimal Gland Innervation Is Not
Altered with the Onset and Progression of Disease in a Murine Model of
Sjögren's Syndrome. Clinical Immunology and Immunopathology, 89(2), 126-
133.

B
9. Appendices
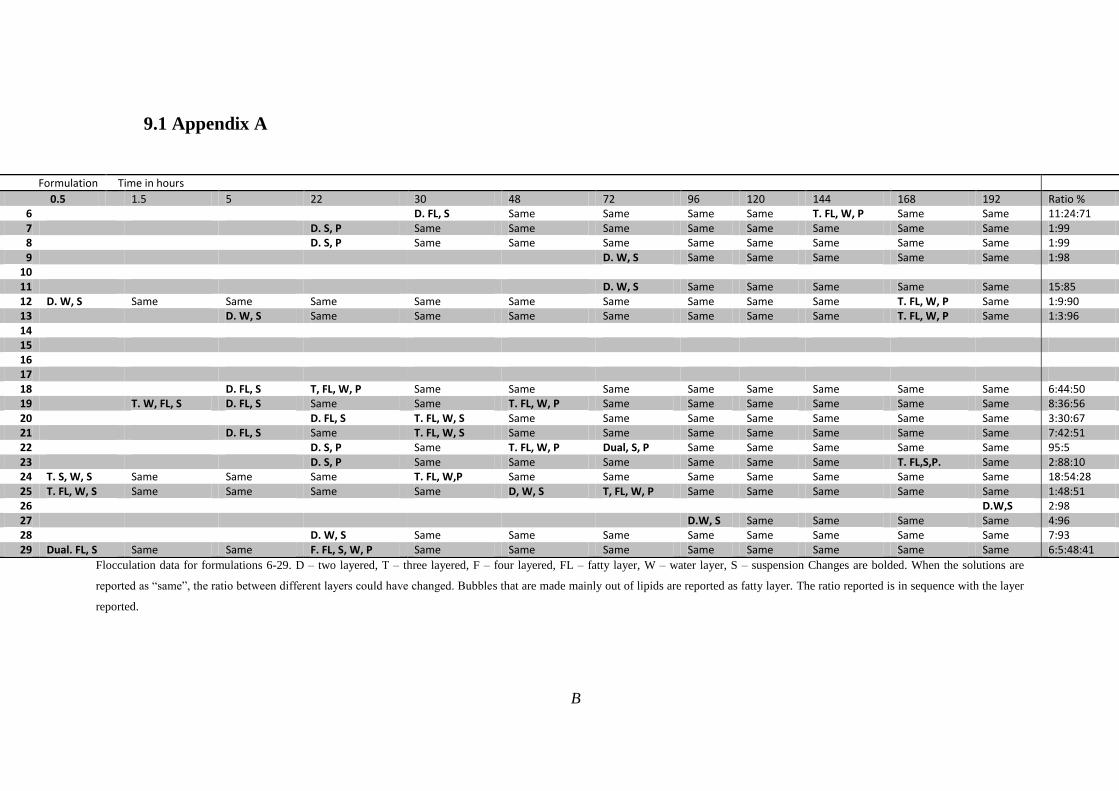
B
9.1 Appendix A
Flocculation data for formulations 6-29. D – two layered, T – three layered, F – four layered, FL – fatty layer, W – water layer, S – suspension Changes are bolded. When the solutions are
reported as “same”, the ratio between different layers could have changed. Bubbles that are made mainly out of lipids are reported as fatty layer. The ratio reported is in sequence with the layer
reported.
Formulation Time in hours
0.5 1.5 5 22 30 48 72 96 120 144 168 192 Ratio % 6 D. FL, S Same Same Same Same T. FL, W, P Same Same 11:24:71 7 D. S, P Same Same Same Same Same Same Same Same 1:99 8 D. S, P Same Same Same Same Same Same Same Same 1:99 9 D. W, S Same Same Same Same Same 1:98
10 11 D. W, S Same Same Same Same Same 15:85 12 D. W, S Same Same Same Same Same Same Same Same Same T. FL, W, P Same 1:9:90 13 D. W, S Same Same Same Same Same Same Same T. FL, W, P Same 1:3:96 14 15 16 17 18 D. FL, S T, FL, W, P Same Same Same Same Same Same Same Same 6:44:50 19 T. W, FL, S D. FL, S Same Same T. FL, W, P Same Same Same Same Same Same 8:36:56 20 D. FL, S T. FL, W, S Same Same Same Same Same Same Same 3:30:67 21 D. FL, S Same T. FL, W, S Same Same Same Same Same Same Same 7:42:51 22 D. S, P Same T. FL, W, P Dual, S, P Same Same Same Same Same 95:5 23 D. S, P Same Same Same Same Same Same T. FL,S,P. Same 2:88:10 24 T. S, W, S Same Same Same T. FL, W,P Same Same Same Same Same Same Same 18:54:28 25 T. FL, W, S Same Same Same Same D, W, S T, FL, W, P Same Same Same Same Same 1:48:51 26 D.W,S 2:98 27 D.W, S Same Same Same Same 4:96 28 D. W, S Same Same Same Same Same Same Same Same 7:93 29 Dual. FL, S Same Same F. FL, S, W, P Same Same Same Same Same Same Same Same 6:5:48:41

C
9.2 Appendix B
Viscosity of formulations 6-29
Table B 1Viscosity of formulations 6-29. SD – standard deviation. RPM –rounds per minute
Formulation Viscosity (cP)
#1 #2 #3 #4 Average SD Torque Spindle Speed (RPM)
6 8,14 6,21 6,07 5,84 6,57 0,92 14,25 6
7 5,65 5,1 6,17 5,29 5,55 0,41 12,08 6
8 12,69 13,32 14,13 13,77 13,38 0,54 14,73 3
9 22,41 22,95 22,95 22,77 0,25 25,30 1,5
10
11
12
13
14 10.169 11.724 10.148 10.680,33 738,03 34,97 0,3
15 4.157 4.157 4.367 4.227,00 98,99 13,90 0,3
16 23.711 26.790 26.910 25.803,67 1.480,55 85,40 0,3
17 1.178 1.522 1.441 1.380,33 146,84 22,67 1,5
18 279 222 248 249,83 23,14 26,53 0,3
19 338 282 221 280,50 47,78 32,10 0,3
20 475,2 401 466 447,27 33,21 43,67 0,3
21 199,3 172 145 147,2 165,83 21,97 16,73 0,3
22 4,73 3,61 3,64 3,27 3,81 0,55 14,10 12
23 5,01 5,31 5,21 5,18 0,12 10,30 6
24
25
26 362,9 338,8 371,6 357,77 13,87 40,90 0,3
27 351,6 341,9 343,1 345,53 4,32 39,33 0,3
28 334,9 372,6 358,5 355,33 15,55 40,47 0,3
29 4,99 5,49 5,1 5,19 0,21 11,63 6
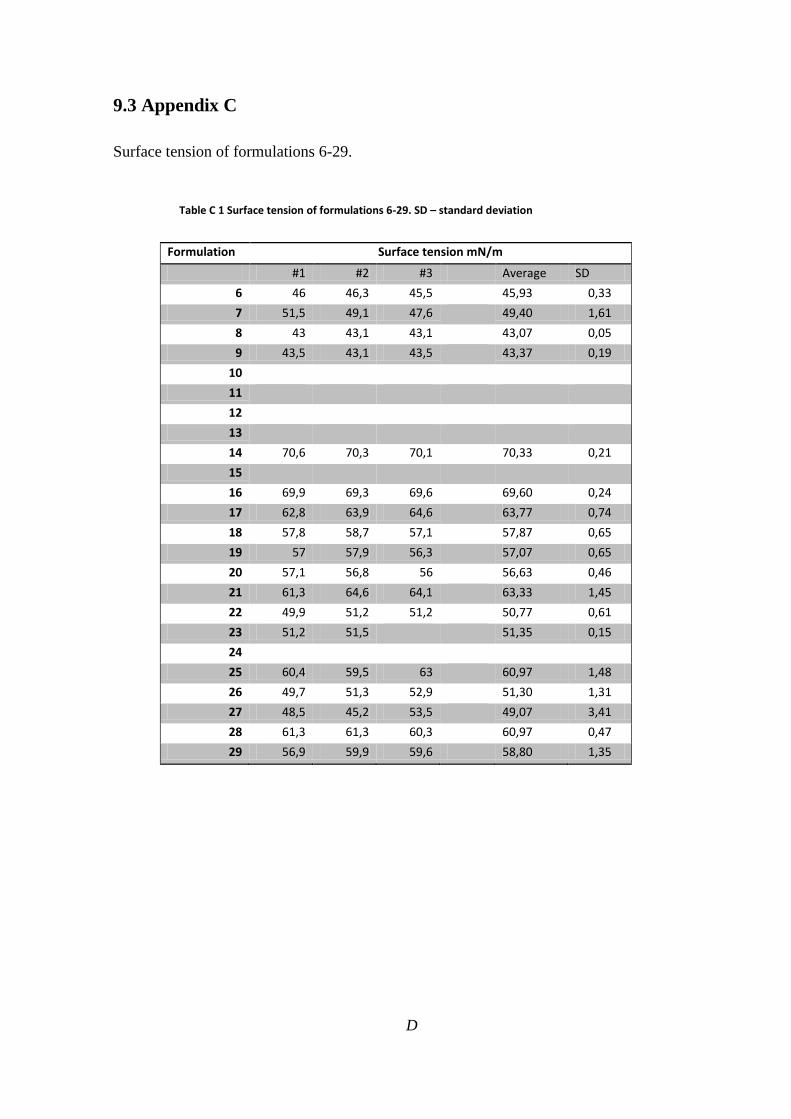
D
9.3 Appendix C
Surface tension of formulations 6-29.
Table C 1 Surface tension of formulations 6-29. SD – standard deviation
Formulation Surface tension mN/m
#1 #2 #3 Average SD
6 46 46,3 45,5 45,93 0,33
7 51,5 49,1 47,6 49,40 1,61
8 43 43,1 43,1 43,07 0,05
9 43,5 43,1 43,5 43,37 0,19
10
11
12
13
14 70,6 70,3 70,1 70,33 0,21
15
16 69,9 69,3 69,6 69,60 0,24
17 62,8 63,9 64,6 63,77 0,74
18 57,8 58,7 57,1 57,87 0,65
19 57 57,9 56,3 57,07 0,65
20 57,1 56,8 56 56,63 0,46
21 61,3 64,6 64,1 63,33 1,45
22 49,9 51,2 51,2 50,77 0,61
23 51,2 51,5 51,35 0,15
24
25 60,4 59,5 63 60,97 1,48
26 49,7 51,3 52,9 51,30 1,31
27 48,5 45,2 53,5 49,07 3,41
28 61,3 61,3 60,3 60,97 0,47
29 56,9 59,9 59,6 58,80 1,35

E
9.4Appendix D
Surface tension of formulations 30-39 and comparison between them and the old
formulation.
Table D 1 Full data for the surface tension for the new formulations and comparison between the old and new values. SD – standard deviation, RPM – rounds per minute
Formulation Surface tension mN/m
#1 #2 #3 Average SD Old formulation number
Average of the old formulation
Difference between the old value and the new value
30 43,5 43,7 42,4 43,20 0,57 6 45,93 2,73
31 41,5 40,8 41,5 41,27 0,33 7 49,40 8,13
32 43,2 41,9 42,6 42,57 0,53 8 43,07 0,50
33 40,6 39,7 38,7 39,67 0,78 9 43,37 3,70
34 47 46,8 46,2 46,67 0,34 18 57,87 11,20
35 46,5 47,3 46,8 46,87 0,33 19 57,07 10,20
36 50,8 51,7 50,6 51,03 0,48 20 56,63 5,60
37 50,6 50,4 52,1 51,03 0,76 21 63,33 12,30
38 42 44 44,5 43,50 1,08 23 51,35 7,85
39 58,6 60,8 59,3 59,57 0,92 28 60,97 1,40

F
9.5 Appendix E
Viscosity of formulations 30-39 and comparison between them and the old formulation.
Table E 1 Viscosity of formulations 30-39 and comparison between them and the old formulations SD – standard deviation. RPM – rounds per minute, Difference – difference between the old formulation value and the new formulation value
Formulation Viscosity (cP) Viscosity (cP)
#1 #2 #3 #4 Average SD Torque Spindle speed (RPM)
Old formulation number
Average of the old formulation
Difference
30 5,82 5,36 5,57 5,58 0,19 10,93 6 6 6,81 1,22
31 5,4 4,9 4,7 5,00 0,29 10,93 6 7 5,64 0,64
32 19,8 19,3 18,1 17 18,55 0,71 20,12 3 8 13,38 -5,17
33 27,3 27,1 28,9 27,77 0,81 15,27 1,5 9 22,77 -5,00
34 396 399 382 392,33 7,41 40,72 0,3 18 249,83 -142,50
35 352,4 408,5 407,7 394,2 390,70 26,26 40,30 0,3 19 280,50 -110,20
36 169 185 178,6 177,53 6,58 20,76 0,3 20 447,27 269,73
37 122,3 110,2 114 115,50 5,05 11,93 0,3 21 172,03 56,53
38 5,1 6,1 5,5 5,57 0,41 11,65 6 23 5,18 -0,39 39 172 169 177 172,67 3,30 19,07 0,3 28 355,33 182,67

G
9.6 Appendix F
Osmolality of solutions 30-39.
Table F 1 Osmolality values for formulations 30-39. SD- standard deviation
Osmolality mOsm/kg
Formulation #1 #2 #3 #4 Average SD
30 299,25 297,15 298,20 294,00 297,15 2,27
31 304,50 312,33 314,94 315,81 311,90 5,15
32 351,48 345,39 325,38 348,87 342,78 11,87
33 312,33 327,12 331,47 329,73 325,16 8,74
34 317,06 332,00 339,47 341,96 332,62 11,21
35 344,52 347,13 331,47 351,48 343,65 8,61
36 365,40 363,66 369,75 362,79 365,40 3,10
37 335,82 338,43 370,62 341,96 346,71 16,14
38 319,29 325,38 322,77 322,77 322,55 2,50
39 304,50 294,06 307,11 301,89 301,89 5,64
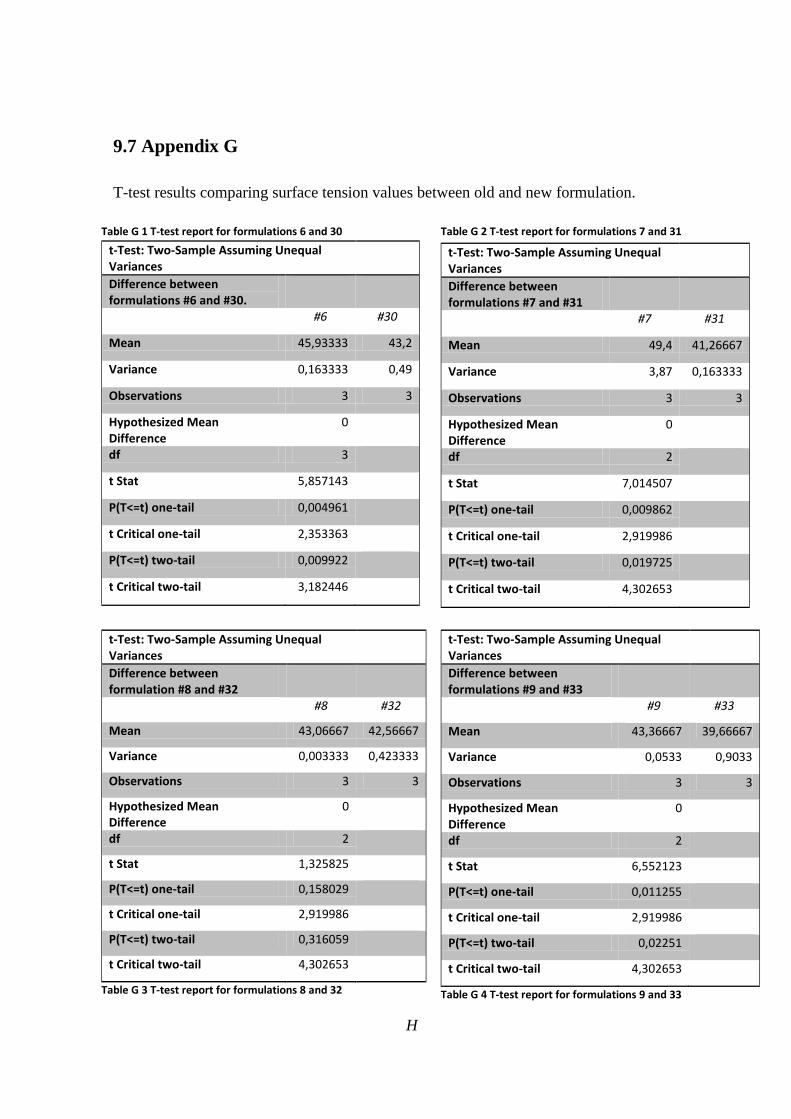
H
9.7 Appendix G
T-test results comparing surface tension values between old and new formulation.
Table G 1 T-test report for formulations 6 and 30
t-Test: Two-Sample Assuming Unequal Variances
Difference between formulations #6 and #30.
#6 #30
Mean 45,93333 43,2
Variance 0,163333 0,49
Observations 3 3
Hypothesized Mean Difference
0
df 3
t Stat 5,857143
P(T<=t) one-tail 0,004961
t Critical one-tail 2,353363
P(T<=t) two-tail 0,009922
t Critical two-tail 3,182446
Table G 2 T-test report for formulations 7 and 31
t-Test: Two-Sample Assuming Unequal Variances
Difference between formulations #7 and #31
#7 #31
Mean 49,4 41,26667
Variance 3,87 0,163333
Observations 3 3
Hypothesized Mean Difference
0
df 2
t Stat 7,014507
P(T<=t) one-tail 0,009862
t Critical one-tail 2,919986
P(T<=t) two-tail 0,019725
t Critical two-tail 4,302653
t-Test: Two-Sample Assuming Unequal Variances
Difference between formulation #8 and #32
#8 #32
Mean 43,06667 42,56667
Variance 0,003333 0,423333
Observations 3 3
Hypothesized Mean Difference
0
df 2
t Stat 1,325825
P(T<=t) one-tail 0,158029
t Critical one-tail 2,919986
P(T<=t) two-tail 0,316059
t Critical two-tail 4,302653
Table G 3 T-test report for formulations 8 and 32
t-Test: Two-Sample Assuming Unequal Variances
Difference between formulations #9 and #33
#9 #33
Mean 43,36667 39,66667
Variance 0,0533 0,9033
Observations 3 3
Hypothesized Mean Difference
0
df 2
t Stat 6,552123
P(T<=t) one-tail 0,011255
t Critical one-tail 2,919986
P(T<=t) two-tail 0,02251
t Critical two-tail 4,302653
Table G 4 T-test report for formulations 9 and 33

I
t-Test: Two-Sample Assuming Unequal Variances
Difference between formulations #18 and #34
#18 #34
Mean 57,86667 46,66667
Variance 0,643333 0,173333
Observations 3 3
Hypothesized Mean Difference
0
df 3
t Stat 21,46625
P(T<=t) one-tail 0,000111
t Critical one-tail 2,353363
P(T<=t) two-tail 0,000221
t Critical two-tail 3,182446
Table G 5 T-test report for formulations 18 and 34
t-Test: Two-Sample Assuming Unequal Variances
Difference between formulations #19 and #35
#19 #35
Mean 57,06667 46,86667
Variance 0,643333 0,163333
Observations 3 3
Hypothesized Mean Difference
0
df 3
t Stat 19,67043
P(T<=t) one-tail 0,000144
t Critical one-tail 2,353363
P(T<=t) two-tail 0,000287
t Critical two-tail 3,182446
Table G 6 T-test report for formulations 19 and 35
Table G 7 T-test report for formulations 20 and 36
t-Test: Two-Sample Assuming Unequal Variances
Difference between formulations #20 and #36
#20 #36
Mean 56,63333 51,03333
Variance 0,323333 0,343333
Observations 3 3
Hypothesized Mean Difference
0
df 4
t Stat 11,87939
P(T<=t) one-tail 0,000144
t Critical one-tail 2,131847
P(T<=t) two-tail 0,000288
t Critical two-tail 2,776445
Table G 8 T-test report for formulatins 21 and 37
t-Test: Two-Sample Assuming Unequal Variances
Difference between formulations #21 and #37
#21 #37
Mean 63,33333 43,2
Variance 3,163333 0,49
Observations 3 3
Hypothesized Mean Difference
0
df 3
t Stat 18,24449
P(T<=t) one-tail 0,00018
t Critical one-tail 2,353363
P(T<=t) two-tail 0,000359
t Critical two-tail 3,182446

J
Table G 10 T-test report for formulations 23 and 38
t-Test: Two-Sample Assuming Unequal Variances
Difference between formulations #23 and #38
#23 #38
Mean 52,06667 43,5
Variance 1,563333 1,75
Observations 3 3
Hypothesized Mean Difference
0
df 4
t Stat 8,151545
P(T<=t) one-tail 0,000616
t Critical one-tail 2,131847
P(T<=t) two-tail 0,001233
t Critical two-tail 2,776445
t-Test: Two-Sample Assuming Unequal Variances
Difference between formulations #28 and #39
#28 #39
Mean 60,96667 53,63333
Variance 0,333333 18,80333
Observations 3 3
Hypothesized Mean Difference
0
df 2
P(T<=t) one-tail 0,050485
t Critical one-tail 2,919986
P(T<=t) two-tail 0,100969
t Critical two-tail 4,302653
Table G 9 T-test report for formulations 28 and 39.
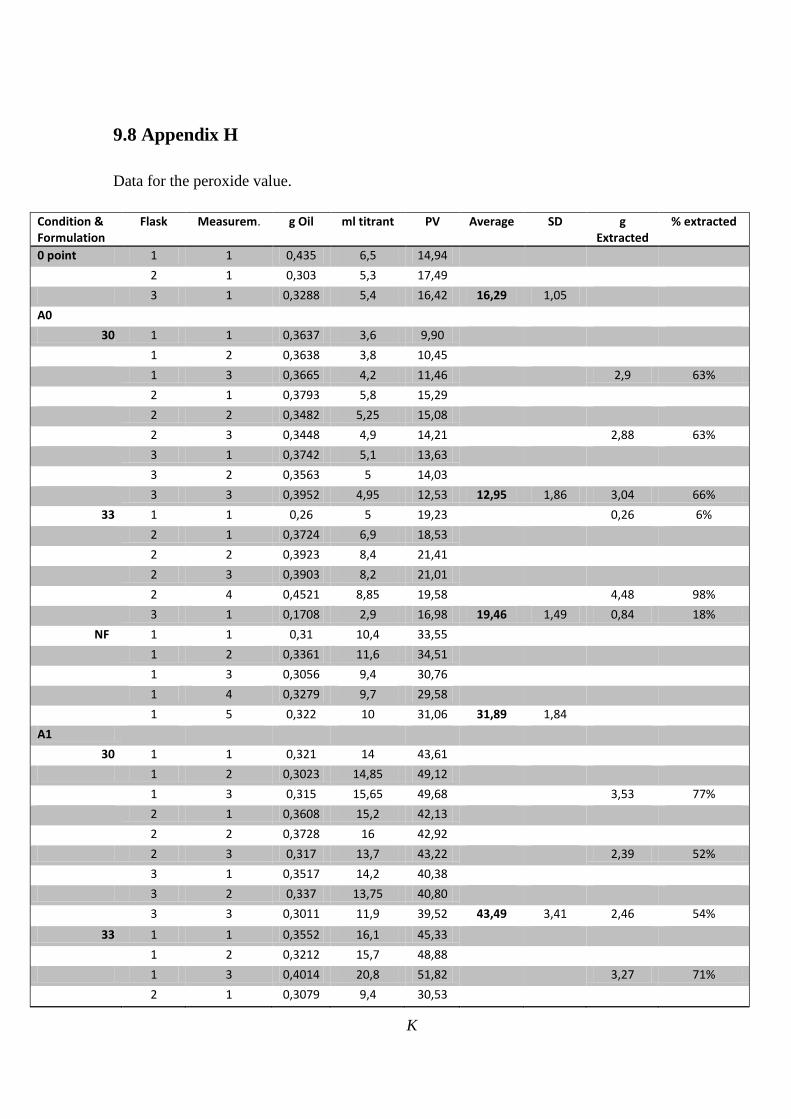
K
9.8 Appendix H
Data for the peroxide value.
Condition & Formulation
Flask Measurem. g Oil ml titrant PV Average SD g Extracted
% extracted
0 point 1 1 0,435 6,5 14,94
2 1 0,303 5,3 17,49
3 1 0,3288 5,4 16,42 16,29 1,05
A0
30 1 1 0,3637 3,6 9,90
1 2 0,3638 3,8 10,45
1 3 0,3665 4,2 11,46 2,9 63%
2 1 0,3793 5,8 15,29
2 2 0,3482 5,25 15,08
2 3 0,3448 4,9 14,21 2,88 63%
3 1 0,3742 5,1 13,63
3 2 0,3563 5 14,03
3 3 0,3952 4,95 12,53 12,95 1,86 3,04 66%
33 1 1 0,26 5 19,23 0,26 6%
2 1 0,3724 6,9 18,53
2 2 0,3923 8,4 21,41
2 3 0,3903 8,2 21,01
2 4 0,4521 8,85 19,58 4,48 98%
3 1 0,1708 2,9 16,98 19,46 1,49 0,84 18%
NF 1 1 0,31 10,4 33,55
1 2 0,3361 11,6 34,51
1 3 0,3056 9,4 30,76
1 4 0,3279 9,7 29,58
1 5 0,322 10 31,06 31,89 1,84
A1
30 1 1 0,321 14 43,61
1 2 0,3023 14,85 49,12
1 3 0,315 15,65 49,68 3,53 77%
2 1 0,3608 15,2 42,13
2 2 0,3728 16 42,92
2 3 0,317 13,7 43,22 2,39 52%
3 1 0,3517 14,2 40,38
3 2 0,337 13,75 40,80
3 3 0,3011 11,9 39,52 43,49 3,41 2,46 54%
33 1 1 0,3552 16,1 45,33
1 2 0,3212 15,7 48,88
1 3 0,4014 20,8 51,82 3,27 71%
2 1 0,3079 9,4 30,53

L
2 2 0,3081 11 35,70
2 3 0,4042 13,2 32,66 3,81 83%
3 1 0,3195 12,5 39,12
3 2 0,3028 12,1 39,96
3 3 0,3055 12,1 39,61 40,40 19,73 4,61 100%
NF 1 1 0,3685 18 48,85
1 2 0,3346 14,2 42,44
1 3 0,31 13 41,94
1 4 0,3147 14,6 46,39
1 5 0,388 18 46,39
1 6 0,4191 22 52,49 46,42 3,62
A2
30 1 1 0,3938 31 78,72
1 2 0,3961 30 75,74
1 3 0,3177 22,5 70,82 4,29 94%
2 1 0,315 24,5 77,78
2 2 0,3195 25,25 79,03
2 3 0,3224 24 74,44 4,47 97%
3 1 0,3263 30 91,94
3 2 0,3257 29,5 90,57
3 3 0,3358 31,2 92,91 81,33 7,78 3,90 85%
33 1 1 0,34 19,5 57,35
1 2 0,3474 20,5 59,01
1 3 0,34 11,5 33,82 5,03 110%
2 1 0,3312 21 63,41
2 2 0,3021 18 59,58
2 3 0,424 24,5 57,78 5,71 124%
3 1 0,303 17 56,11
3 2 0,329 20 60,79
3 3 0,508 25 49,21 55,23 8,41 5,32 116%
NF
1 1 0,3382 26 76,88
1 2 0,3388 22 64,94
1 3 0,3487 23,6 67,68
1 4 0,3193 20,4 63,89
1 5 0,329 19,4 58,97
1 6 0,3494 19,2 54,95
1 7 0,3273 21,5 65,69
1 8 0,3404 22,3 65,51
1 9 0,3435 24 69,87 65,37 5,86
A3
30 1 1 0,3975 18 45,28
1 2 0,3525 14,35 40,71 2,02 0,44
2 1 0,44 17 38,64
2 2 0,3415 12,65 37,04
2 3 0,2205 9,15 41,50 1,87 0,41

M
3 1 0,3598 10,5 29,18
3 2 0,3925 11,5 29,30
3 3 0,3182 7,4 23,26 35,61 7,06 2,28 0,50
33 1 1 0,316 10,6 33,54
1 2 0,1471 6,15 41,81 3,41 0,74
2 1 0,3019 3,1 10,27
2 2 0,3214 6,4 19,91
2 3 0,3303 4,8 14,53 3,68 0,80
3 1 0,3765 11 29,22
3 2 0,4375 13 29,71
3 3 0,338 10,2 30,18 26,15 9,77 4,90 1,07
NF 1 1 0,3165 12,8 40,44
1 2 0,3196 8,7 27,22
1 3 0,3343 9,4 28,12
1 4 0,3239 10,5 32,42
1 5 0,3028 9,5 31,37
1 6 0,3352 10,2 30,43
1 7 0,3274 10,7 32,68
1 8 0,3243 9,7 29,91
1 9 0,3836 12,5 32,59 31,69 3,59
Table H 1 Data for the peroxide values for formulations 41 and 44 and no formulations in conditions A0, A1, A2 and A3.
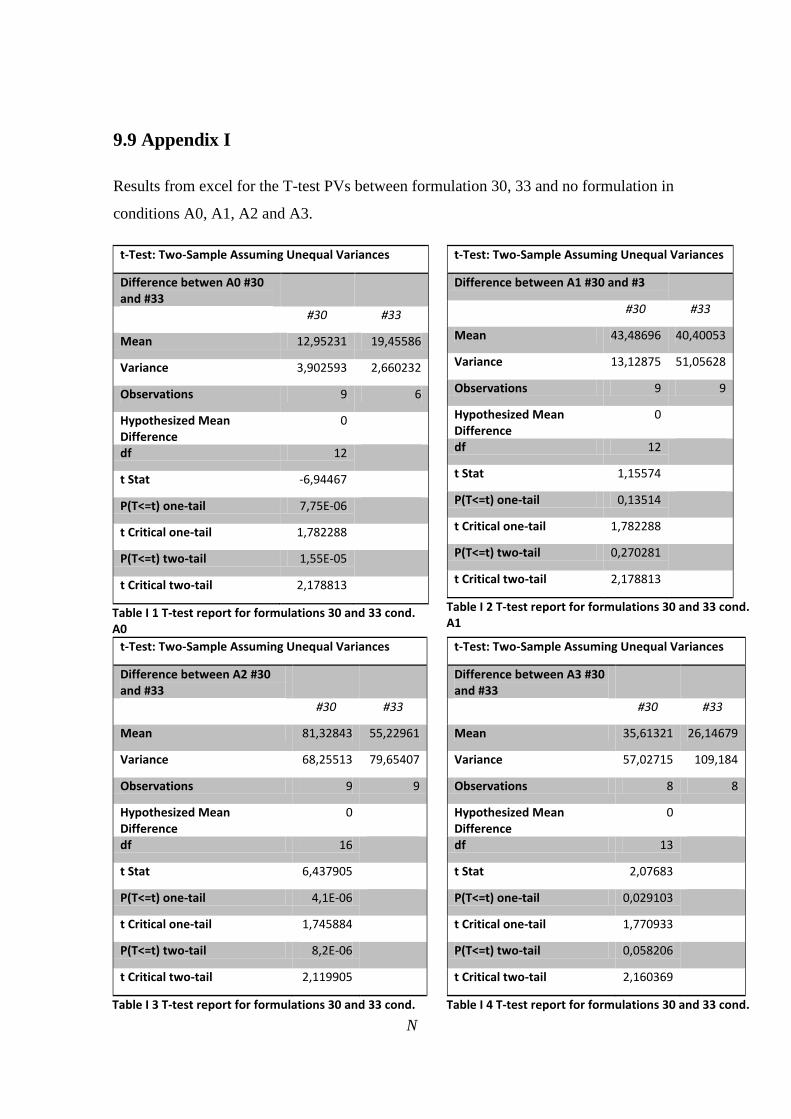
N
9.9 Appendix I
Results from excel for the T-test PVs between formulation 30, 33 and no formulation in
conditions A0, A1, A2 and A3.
t-Test: Two-Sample Assuming Unequal Variances
Difference betwen A0 #30 and #33
#30 #33
Mean 12,95231 19,45586
Variance 3,902593 2,660232
Observations 9 6
Hypothesized Mean Difference
0
df 12
t Stat -6,94467
P(T<=t) one-tail 7,75E-06
t Critical one-tail 1,782288
P(T<=t) two-tail 1,55E-05
t Critical two-tail 2,178813
Table I 1 T-test report for formulations 30 and 33 cond. A0
t-Test: Two-Sample Assuming Unequal Variances
Difference between A1 #30 and #3
#30 #33
Mean 43,48696 40,40053
Variance 13,12875 51,05628
Observations 9 9
Hypothesized Mean Difference
0
df 12
t Stat 1,15574
P(T<=t) one-tail 0,13514
t Critical one-tail 1,782288
P(T<=t) two-tail 0,270281
t Critical two-tail 2,178813
Table I 2 T-test report for formulations 30 and 33 cond. A1
t-Test: Two-Sample Assuming Unequal Variances
Difference between A2 #30 and #33
#30 #33
Mean 81,32843 55,22961
Variance 68,25513 79,65407
Observations 9 9
Hypothesized Mean Difference
0
df 16
t Stat 6,437905
P(T<=t) one-tail 4,1E-06
t Critical one-tail 1,745884
P(T<=t) two-tail 8,2E-06
t Critical two-tail 2,119905
Table I 3 T-test report for formulations 30 and 33 cond.
t-Test: Two-Sample Assuming Unequal Variances
Difference between A3 #30 and #33
#30 #33
Mean 35,61321 26,14679
Variance 57,02715 109,184
Observations 8 8
Hypothesized Mean Difference
0
df 13
t Stat 2,07683
P(T<=t) one-tail 0,029103
t Critical one-tail 1,770933
P(T<=t) two-tail 0,058206
t Critical two-tail 2,160369
Table I 4 T-test report for formulations 30 and 33 cond.

O
A2 A3
t-Test: Two-Sample Assuming Unequal Variances
Difference between A0 #30 and "No formulation"
#30 No formuluation
Mean 12,95231 31,89184
Variance 3,902593 4,233421
Observations 9 5
Hypothesized Mean Difference
0
df 8
t Stat -16,7383
P(T<=t) one-tail 8,21E-08
t Critical one-tail 1,859548
P(T<=t) two-tail 1,64E-07
t Critical two-tail 2,306004
Table I 5 T-test report for formulations 30 and Nf cond. A0
t-Test: Two-Sample Assuming Unequal Variances
Difference between A1 #30 and "No formulation"
#30 No formulation
Mean 43,48696 46,41658
Variance 13,12875 15,74764
Observations 9 6
Hypothesized Mean Difference
0
df 10
t Stat -1,44978
P(T<=t) one-tail 0,088873
t Critical one-tail 1,812461
P(T<=t) two-tail 0,177747
t Critical two-tail 2,228139
Table I 6 T-test report for formulations 30 and Nf cond A1
t-Test: Two-Sample Assuming Unequal Variances
Difference between A2 #30 and "No formulation"
#30 No formulation
Mean 81,32843 65,37438
Variance 68,25513 38,75694
Observations 9 9
Hypothesized Mean Difference
0
df 15
t Stat 4,626748
P(T<=t) one-tail 0,000165
t Critical one-tail 1,75305
P(T<=t) two-tail 0,000329
t Critical two-tail 2,13145
Table I 7 T-test report for formulations 30 and nf, cond A2
t-Test: Two-Sample Assuming Unequal Variances
Difference between A3 #30 and "No formulation"
#30 No formulation
Mean 35,61321 31,68683
Variance 57,02715 14,56212
Observations 8 9
Hypothesized Mean Difference
0
df 10
t Stat 1,327631
P(T<=t) one-tail 0,106904
t Critical one-tail 1,812461
P(T<=t) two-tail 0,213809
t Critical two-tail 2,228139
Table I 8 T-test report for formulations 30 and nf, cond A3

P
t-Test: Two-Sample Assuming Unequal Variances
Difference between A0 #33 and "No formulation"
#33 No formulation
Mean 18,71359 31,89184
Variance 10,37855 4,233421
Observations 6 5
Hypothesized Mean Difference
0
df 9
t Stat -8,21008
P(T<=t) one-tail 8,99E-06
t Critical one-tail 1,833113
P(T<=t) two-tail 1,8E-05
t Critical two-tail 2,262157
Table I 9 T-test report for formulations 33 and Nf, cond A0
t-Test: Two-Sample Assuming Unequal Variances
Difference between A1 #33 and "No formulation"
#33 No formulation
Mean 40,40053 46,41658
Variance 51,05628 15,74764
Observations 9 6
Hypothesized Mean Difference
0
df 13
t Stat -2,08851
P(T<=t) one-tail 0,028494
t Critical one-tail 1,770933
P(T<=t) two-tail 0,056988
t Critical two-tail 2,160369
Table I 10 T-test report for formulations 33 and Nf, cond A1
Table I 11T-test report for formulations 33 and Nf, cond A2
t-Test: Two-Sample Assuming Unequal Variances
Difference between A2 #33 and "No formulation"
#33 No formulation
Mean 55,22961 65,37438
Variance 79,65407 38,75694
Observations 9 9
Hypothesized Mean Difference
0
df 14
t Stat -2,79684
P(T<=t) one-tail 0,007134
t Critical one-tail 1,76131
P(T<=t) two-tail 0,014269
t Critical two-tail 2,144787
Table I 12 T-test report for formulations 33 and Nf, cond A3
t-Test: Two-Sample Assuming Unequal Variances
Difference between A3 #33 and "No formulation"
#33 No formulation
Mean 26,14679 31,68683
Variance 109,184 14,56212
Observations 8 9
Hypothesized Mean Difference
0
df 9
t Stat -1,41792
P(T<=t) one-tail 0,094948
t Critical one-tail 1,833113
P(T<=t) two-tail 0,189896
t Critical two-tail 2,262157