liquidity risk. diamond & dybvig model game theory in many economic situations, agents returns...
TRANSCRIPT

Liquidity Risk

Diamond & Dybvig ModelGame Theory
• In many economic situations, agents returns depend on the actions of other agents. In such a situation, agents must think strategically.
• Economists use game theory to describe such situations.
• John (“A Beautiful Mind”) Nash developed a concept called the Nash equilibrium.

Nash Equilibrium
• A Nash equilibrium occurs when every player in a game is playing their best strategy given the strategy that the other players play.
• Economists believe that outcomes of strategic situations are likely to be well-described by Nash equilibrium.– Since every individual in a Nash eq. is playing there
best strategy given the actions of others, no one has any incentive to change their strategy individually.

Bank Depositors Game
• Banks have very illiquid assets (loans) and obligations to repay their depositors in full at any time.
• If all of the depositors at a bank withdraw their funds at the same time, the bank will have to sell their loans at a discount, and they will not have enough funds to pay all of their depositors.
• If all of their depositors keep their money in the bank, most banks will be able to repay all of their depositors with interest.
• Thus, the payoff to any individual depositor depends on what other depositors decide to do.
Bank Run Game: Withdraw or Don’t Withdraw
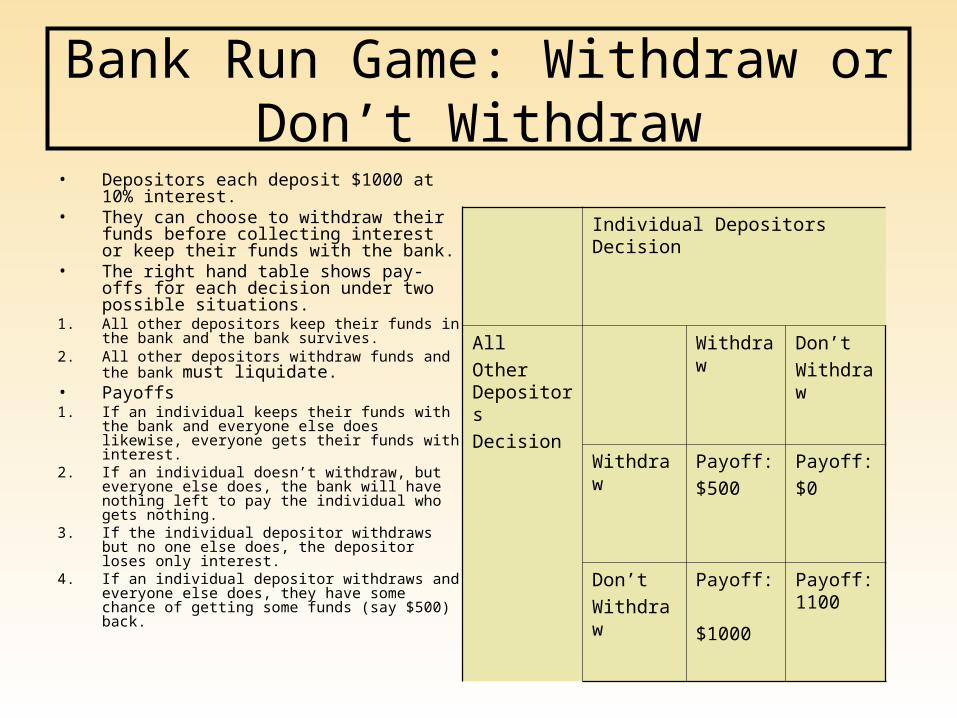
• Depositors each deposit $1000 at 10% interest.
• They can choose to withdraw their funds before collecting interest or keep their funds with the bank.
• The right hand table shows pay-offs for each decision under two possible situations.
1. All other depositors keep their funds in the bank and the bank survives.
2. All other depositors withdraw funds and the bank must liquidate.
• Payoffs1. If an individual keeps their funds with the bank
and everyone else does likewise, everyone gets their funds with interest.
2. If an individual doesn’t withdraw, but everyone else does, the bank will have nothing left to pay the individual who gets nothing.
3. If the individual depositor withdraws but no one else does, the depositor loses only interest.
4. If an individual depositor withdraws and everyone else does, they have some chance of getting some funds (say $500) back.
Individual Depositors Decision
All
Other Depositors
Decision
Withdraw Don’t
Withdraw
Withdraw Payoff:
$500
Payoff:
$0
Don’t
Withdraw
Payoff:
$1000
Payoff: 1100

Bank Deposit Game has Multiple Equilibria
• If no one else withdraws their funds, the best strategy of any individual is not to withdraw their funds.
• Thus, a situation in which no-one withdraws their funds and the bank pays interest to all is a Nash Equilibria.
• If everyone withdraws their funds, an individuals best strategy is to withdraw before everyone else does.
• Thus, a bank run, a situation in which everyone withdraws their funds and a bank is forced to liquidate its assets is also a Nash equilibrium.

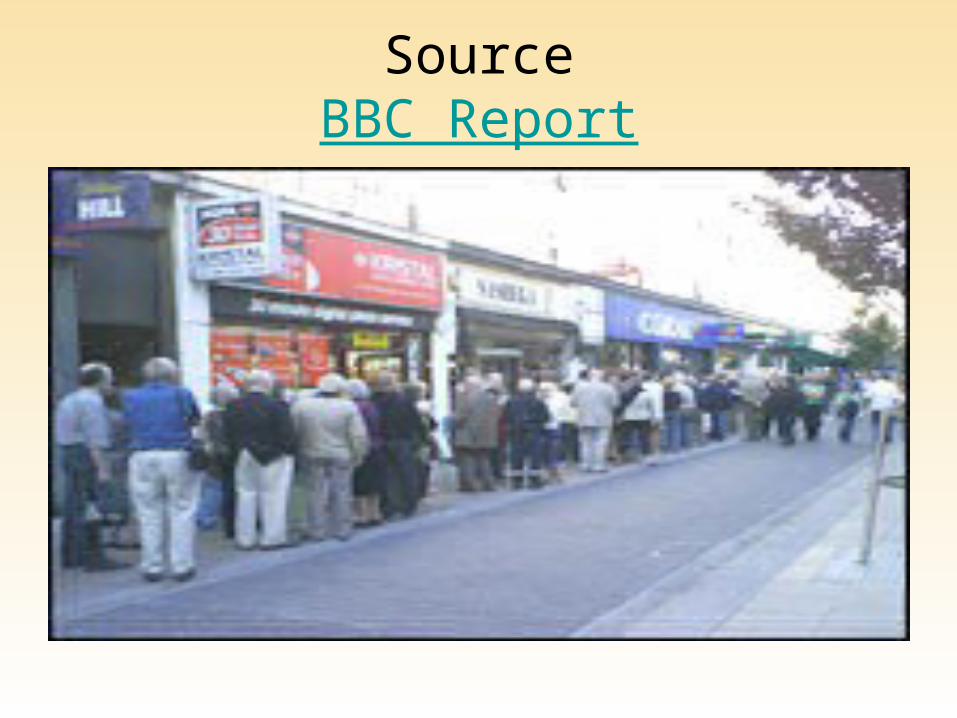
Bank Runs
• The phenomenon in which all depositors compete to withdraw their funds at the same time is called a bank run or a bank panic.
• Depositors lack complete information about the value of banks assets.
• If depositors believe that there is a significant fraction of loans which will not be repaid, depositors may have an incentive to immediately withdraw funds.
• Bank deposits are first come, first serve. If you withdraw your funds before the bank declares losses you may not suffer at all.
• Further, even if you believe that banks assets are sound you may have an incentive to immediately withdraw, if you believe that other depositors will also withdraw their funds.

Northern Rock
• Northern Rock is a British bank with a particular funding profile.
• The bank lends heavily in mortgage market and raises a large share of its funds in commercial paper market and other volatile liabilities.
• In late 2007, with turmoil in commercial paper market, depositors began to doubt whether they would get their funds back.

Effects of Lender of Last Resort
• The confidence brought by the knowledge that the central bank will provide liquidity in the case of a bank run, can actually reduce the chance that a bank run will occur.
• Conversely, the fears of depositors of bankruptcies are an important source of discipline in the economy. A lender of last resort may encourage depositors to ignore the excessive risk taking of their banks, encouraging banks to take excessive risks.
• Lenders of last resort encourages moral hazard.

Liquidity is a product of banks
• Banks are profitable as an enterprise through their access to relatively cheap funding from core deposits.
• Depositors are willing to lend money to banks at low interest rates because the banks offer unique liquidity services that facilitate regular transactions and protect liquidity position of depositors wealth.
• But if banks are unreliable in providing liquidity services, their access to cheap funding and ultimately their profits will disappear.

Demand Accounts Savings Accounts Time Deposits
Unit Cost
Monthly Income /
Expenses Unit Cost
Monthly Income /
Expenses Unit Cost
Monthly Income /
Expenses Income Interest Income (estimated 7.5% earnings credit) $ 29.47 $ 34.04 $ 121.84 Non-Interest Income Service Charges $ 2.80 $ 0.44 $ 0.11 Penalty Fees $ 4.32 $ 0.28 $ 0.27 Other $ 0.63 $ 0.16 $ 0.05 Total Non-Interest Income $ 7.75 $ 0.88 $ 0.42 Expenses Activity Charges Deposit - Electronic $ 0.0089 $ 0.02 $ 0.0502 $ 0.01 $ 0.1650 $ 0.1296 Deposit - Non Electronic $ 0.2219 $ 0.66 $ 0.7777 $ 0.46 $ 3.1425 $ 2.2016 Withdrawal - Electronic $ 0.1073 $ 0.43 $ 0.4284 $ 0.07 $ 0.5400 $ 0.2840 Withdrawal - Non Electronic $ 0.2188 $ 3.63 $ 0.7777 $ 0.39 $ 1.4933 $ 0.5875 Transit Check Deposited $ 0.1600 $ 1.71 $ 0.5686 $ 1.09 Transit Check Cashed $ 0.2562 $ 0.50 Account Opened $ 9.46 $ 0.20 $ 33.63 $ 0.53 $ 5.78 $ 1.73 Account Closed $ 5.67 $ 0.07 $ 20.18 $ 0.26 $ 3.38 $ 1.02 On-Us Checks Cashed $ 0.2412 $ 0.42 Account Maintenance (Truncated) monthly $ 2.42 $ 1.67 $ 4.10 $ 3.56 $ 1.99 $ 1.99 Account Maintenance (Non truncated) monthly $ 8.60 $ 7.03 Official check issued $ 1.02 Total Activity Expense $ 16.34 $ 6.37 $ 7.94 Net Indirect Expense $ 4.35 $ 1.81 $ 18.38 Total Non-Interest Expense $ 20.69 $ 8.18 $ 26.32 Interest Expense 1.25% $ 5.38 2.96% $ 13.45 5.18% $ 69.79 Total Expense $ 26.07 $ 21.63 $ 96.11 Net Income (expense) Before Earnings Credit $ (18.32) $ (20.75) $ (95.69) Net Revenue Per Month $ 11.15 $ 13.29 $ 26.16 Average Account Balance $5,515.00 $5,557.00 $19,495.00 Average Annual Net Costa 4.66% 4.57% 5.89% Average Interest Cost 1.37% 2.96% 4.30% Average Non-interest Cost 5.27% 1.80% 1.62% Average Non-interest Income 1.97% 0.19% 0.03% a Required reserves are assumed to be 10 percent for demand accounts and zero for others. Float is assumed to be 5
percent for demand accounts, 2 percent for savings accounts and zero for time accounts. Source: Functional Cost and Profit Analysis, Based on data furnished by participating banks in twelve Federal Reserve Districts, 1999 National Average Report,

Liquidity Services
• Banks provide a number of liquidity services– Cash Withdrawal
– Checking– Electronic Payments– Electronic Transfers
These require Interbank transactions:
Payments between banks

Cash Demand is relatively predictable, though subject to
seasonal factors.
21-Mar-1999 2-Aug-2000 15-Dec-2001 29-Apr-2003 10-Sep-2004 23-Jan-2006
170000
160000
150000
140000
130000
120000
110000
100000
90000
80000
HK: Monetary Base: Before Discount Window: Certificates of IndebtednessHKD mn HK Currency
subject to sharp annual rises in demand.
Source: HKMA, CEIC

Transactions at Hong Kong Interbank Clearance Ltd.
Jan 2006: HK$12trillion (approx.)Aggregate Transactions/Aggregate Clearing Balances
0.00
5000.00
10000.00
15000.00
20000.00
25000.00
30000.00
35000.00
Jan-
00
May
-00
Sep-0
0
Jan-
01
May
-01
Sep-0
1
Jan-
02
May
-02
Sep-0
2
Jan-
03
May
-03
Sep-0
3
Jan-
04
May
-04
Sep-0
4
Jan-
05
May
-05
Sep-0
5
Rat
io
Checks5%
Transfer79%
Electronic Payment
16%
Large and Volatile Fluctuations in Transactions Volume and Available Reserves

Interbank Transactions
• Most payments (by value) are done through checks, credit cards, debit cards, and electronic transfers.
• Final settlement of these transactions will be done through the accounts that banks hold at the HKMA, called clearing balances.
• Unlike USA, banks face no minimum reserve requirement on accounts at central bank. Only requirement is must meet obligations.

Daily Liquidity Management
• Banks are able to borrow intraday liquidity interest free from the central bank.
• Banks may borrow overnight liquidity from:– Other banks at HIBOR rate – Central bank discount window
• Discount Window Rate: 150 points above base rate

• Hong Kong InterBank Offered Rate: The rate on which one bank deposits money at another reason for short-term lending.
Dec-1984 Dec-1987 Dec-1990 Dec-1993 Dec-1996 Dec-1999 Dec-2002 Dec-2005
16
14
12
10
8
6
4
2
0
HK: Interbank Offered Rate: 3 Month% pa

Repo Operations
• Borrowing from central bank and other short-term interbank borrowing is done with repo operations with Exchange Fund Paper. .
• Repurchase Agreements: A technique for short-term lending. A “borrower” will sell government securities to a lender and simultaneously agree to repurchase them at a later date at a higher price thereby paying interest.

Exchange Fund Bills• Exchange Fund Bills and Notes are Hong Kong dollar
debt securities issued by the Hong Kong Monetary Authority (HKMA). The Exchange Fund Bills and Notes constitute direct, unsecured, unconditional and general obligations of the Hong Kong SAR
• The Exchange Fund Bills and Notes Issuance Programme ensures the supply of a significant amount of high quality Hong Kong dollar debt paper, which can be employed as trading, investment and hedging instruments. – Authorized Institutions that maintain Hong Kong dollar clearing
accounts with the HKMA can use their holdings of Exchange Fund papers to borrow overnight Hong Kong dollar from the Discount Window.
• An active primary and secondary market for the trading of Exchange Fund Bills and Notes, and the establishment of a reliable benchmark yield curve for up to 10 years has facilitated the development of a sophisticated Hong Kong dollar debt market.
Source: HKMA Website

Liquidity Ratio:• All authorized institutions in Hong Kong are required to
meet a minimum monthly average liquidity ratio of 25%. This is calculated as the ratio of liquefiable assets (e.g. marketable debt securities and loans repayable within one month subject to their respective liquidity conversion factors) to qualifying liabilities (basically all liabilities due within one month).
-GUIDE TO HONG KONG MONETARY AND BANKING TERMS
Liquidity Ratio
43 43.5 44 44.5 45 45.5 46 46.5 47 47.5
2004
2003
Hang Seng BEA

Determinants of Banks Liquidity
• Banks will have a set of liquid assets (cash, securities, etc.) and illiquid assets (loans, tangible & intangible)
• Deposits/Liabilities are divided into two types1.Core Deposits Checking & Savings Accounts, MMDA,
Small Time Deposit
2.Non Core Funding Large Time Deposit/Jumbo CDs, Borrowings, Bond Securities, etc.
– Volatile Liabilities: Short-term (Maturity < 1 Year) Non-Core
Liquidity Risk & Profits
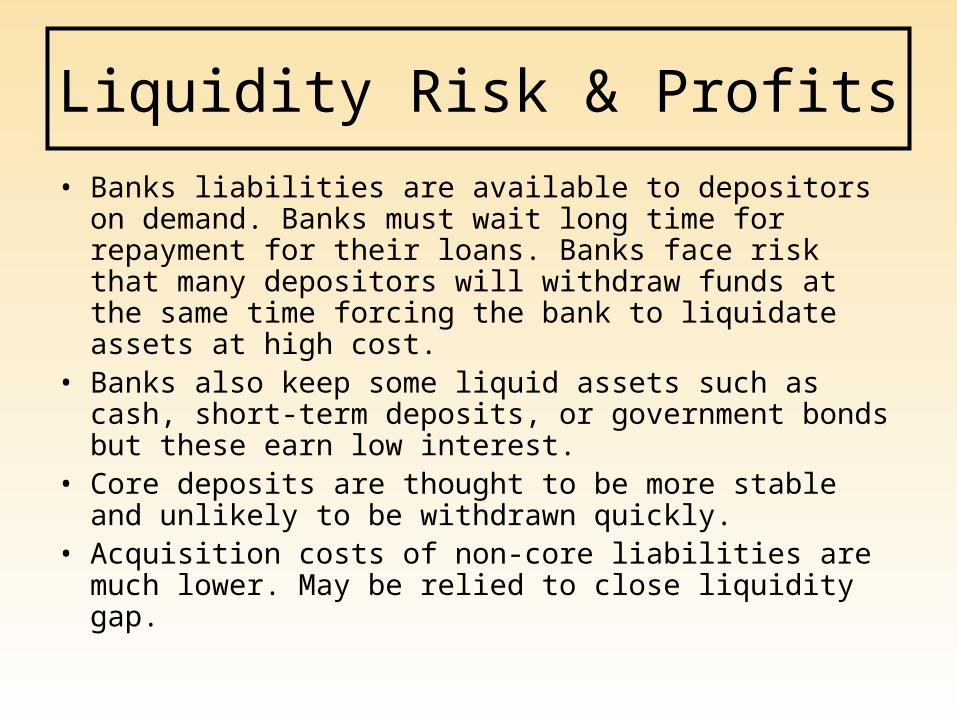
• Banks liabilities are available to depositors on demand. Banks must wait long time for repayment for their loans. Banks face risk that many depositors will withdraw funds at the same time forcing the bank to liquidate assets at high cost.
• Banks also keep some liquid assets such as cash, short-term deposits, or government bonds but these earn low interest.
• Core deposits are thought to be more stable and unlikely to be withdrawn quickly.
• Acquisition costs of non-core liabilities are much lower. May be relied to close liquidity gap.

Measuring Liquidity RiskAsset Indicators
• Loans are the least liquidity type of asset. Banks with relatively high amounts of loans are illiquid. – Net Loans to Assets,
• Banks facing a liquidity shortfall sell short-term securites for cash. Firms with lots of such securities are relatively liquid. – Short-Term Investments to Assets.– Cash to Assets
See Page 5 & 10 of UBPR

Liabilities Indicators
• Core Deposits are the most stable and least likely to leave unpredictably. Short-term non-core funding is the least stable
– Core Deposits to Assets– S.T. Non Core Funding to Assets
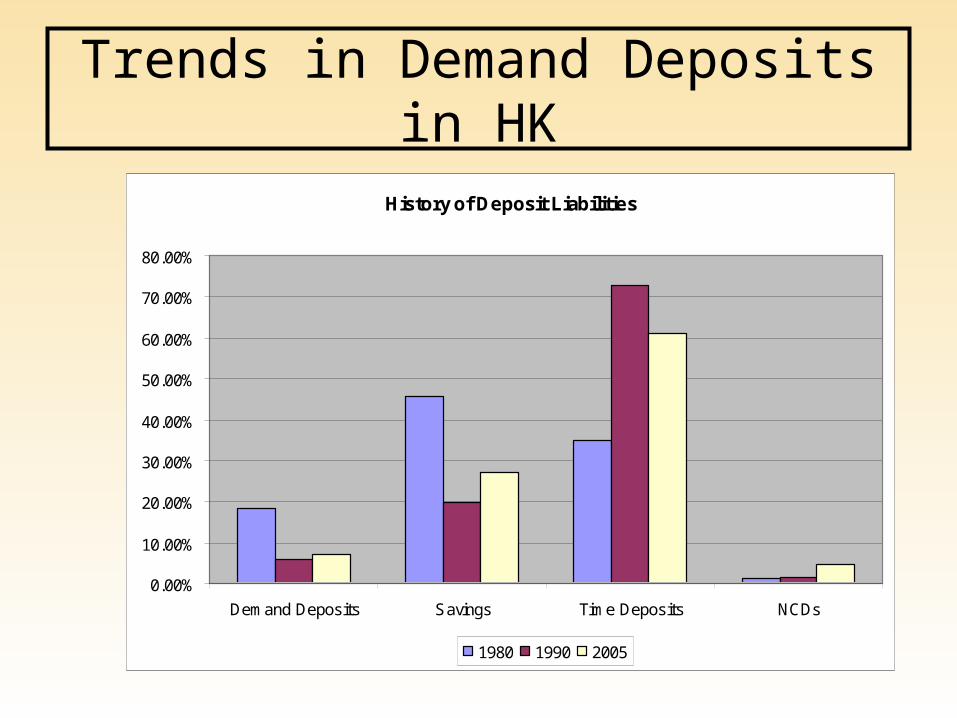
Trends in Demand Deposits in HK
History of Deposit Liabilities
0.00%
10.00%
20.00%
30.00%
40.00%
50.00%
60.00%
70.00%
80.00%
Demand Deposits Savings Time Deposits NCDs
1980 1990 2005

Structure of LiabilitiesLiabilities Bank of East Asia 2004Deposits from Banks 5.39%Demand Deposits 6.72%Savings Deposits 27.46%Time Depocits 58.08%NCDs 2.35%
Maturity Structure of Time Deposits - Bank of East Asia 2004
0.00%
10.00%
20.00%
30.00%
40.00%
50.00%
60.00%
70.00%
80.00%
90.00%
100.00%
Demand 3 Months 3Mo-1Year 1-5 Years
Banks can control the flow of deposits by offering only products with specific maturities and minimum balances and varying the relative rates paid according to these terms.

Loan-Deposit Ratio
• Headline measure of liquidity is ratio of Net Loans to Deposits. Fraction of stable funding which is being used to finance illiquid assets. As this increases, stable funding is used up and the bank becomes less liquid.
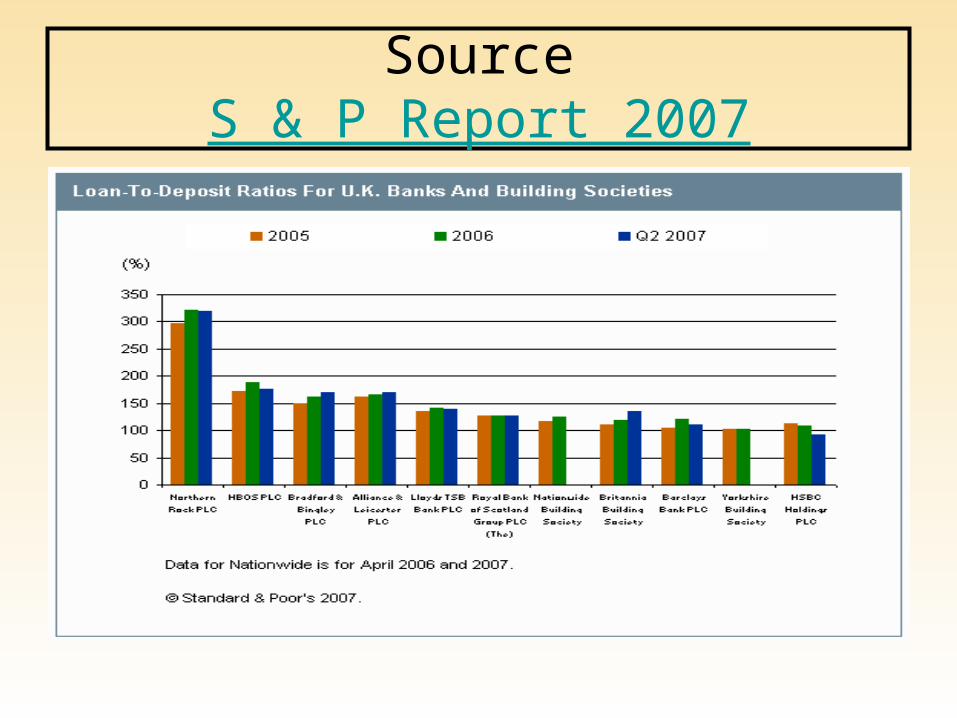
SourceS & P Report 2007

Measure of Dependence
Noncore Dependence is a key indicator of potential liquidity problems.
Fraction of illiquid assets which are being financed by
Noncore Dependence =
(S.T.) Noncore Funding - Short - term Investments
Long - term Assets

Liquidity Risk Measures
UBPR HSBC USA vs. Banks w/ Assets > US$10B
0
10
20
30
40
50
60
70
80
90
100
Loan/Deposit NonCore Dependence S.T. NonCore Dependence
%
HSBC
PG1

Banks and Liquidity
• Liquidity Deficit = Gap between liquid liabilities and assets– Banking firms especially likely to face a liquidity
deficit because of mortgage lending (non-liquid assets) and short-term deposits (liquid liabilities) [Maturity Mismatch]
– Reliance on Time Deposits which are sensitive to changes on interest rates relative to other assets or on risk relative to other assets.

Strategies for Liquidity ManagementI. Asset management
• Asset Conversion Strategy: Maintain an inventory of liquid assets convertible to cash.– Liquid assets must have – ready market, – reasonably steady price– or, reversible so original investment can be
easily obtained.

Strategies for Liquidity ManagementLiability management
• Borrowed Liability Strategy: Maintain lines of credit to make up for temporary cash short-falls.
• Accessing money market requires some prior planning and potentially lines of credit.
• Sources of funds– Borrowing in Interbank market– Issuing large CD’s to money market mutual funds or
large depositors. (Brokered deposits)– Borrowing from central bank.

Liquidity Planning
1. Short-term Planning: Maintaining balances at central bank for transactions.
2. Long-term Planning: A. Forecast liquidity needs over next 1-2 years
B. Identify Liquidity Gap
C. Compare Potential Funding Sources and Extraordinary Funding Needs

Loan Securitization
• Much of a banks business is making standardized loans to particular borrowers (mortgage, student loan, auto, etc.)
• Banks may face liquidity risk because it is difficult to quickly find customers for loans.
• Public policy decision to encourage this type of retail lending by creation of Government Sponsored Enterprises.– Pioneered by FNMA, GNMA, FHLMC in USA– HKMC begun in 1997

HKMC Mortgage Backed Securities homepage
•HKMC Hong Kong Mortgage Corporation
•SPC: Special Purpose Corporation

Issuing Banks are often best customers for mortgage securities

Reading List
• Douglas Diamond, Spring 2007, Banks and Liquidity Creation: A Simple Exposition of the Diamond & Dybvig Model
Richmond FED
• Goodstadt, Leo F, 2007, Profits, politics and panics : Hong Kong's banks and the making of a miracle economy, 1935-1985