listeria monocytogenes escherichia coli staphylococcus aureus · 3 growth of listeria...
TRANSCRIPT
Non-TCS Cheeses, Supporting Document #1, 45 pages total
1
Running head: pathogen growth on cheese 1
2
Growth of Listeria monocytogenes, Salmonella spp., Escherichia coli O157:H7, and 3
Staphylococcus aureus on Cheese during Extended Storage at 25°C 4
Wan Mei Leong1, Renae Geier1, Sarah Engstrom2, Steve Ingham3, Barbara Ingham1*, Marianne 5
Smukowski4. 6
1Department of Food Science, University of Wisconsin-Madison, 1605 Linden Drive, Madison, 7
WI 53706 8
2RTech Laboratories, Land O’Lakes, P.O. Box 64101, St. Paul, MN 55164 9
3Division of Food Safety, Wisconsin Department of Agriculture, Trade and Consumer 10
Protection, P.O. Box 8911, Madison, WI 53708 11
4Center for Dairy Research, University of Wisconsin-Madison, 1605 Linden Drive, Madison, WI 12
53706 13
Key words: pathogen growth, cheese, storage, Escherichia coli O157:H7, Salmonella, Listeria 14
monocytogenes, Staphylococcus aureus, FDA Food Code 15
*Corresponding author: Barbara H. Ingham, Professor, Department of Food Science, University 16
of Wisconsin-Madison, 1605 Linden Drive, Madison, WI 53706. Phone: (608) 263-7383. Fax: 17
(608) 262-6872. Email: [email protected] 18
*Submited to the Journal of Food Protection. January 24, 2014 19

Non-TCS Cheeses, Supporting Document #1, 45 pages total
2
ABSTRACT 20
A potentially hazardous food (PHF) requires time/temperature control to maintain safety. 21
The US Food and Drug Administration would classify most cheeses as PHF based on pH and aw, 22
and a product assessment would be required to evaluate safety for >6 h storage at 21°C. We 23
tested the ability of 67 market cheeses to support growth of Listeria monocytogenes (LM), 24
Salmonella spp. (SALM), Escherichia coli O157:H7 (EC), and Staphylococcus aureus (SA) over 25
15-day storage at 25°C. Hard (Asiago and Cheddar), semi-hard (Colby and Havarti), and soft 26
cheeses (Mozzarella and Mexican-style) were among types tested, and included some reduced-27
sodium and reduced-fat types. Single-pathogen cocktails were prepared and individually 28
inoculated onto cheese slices (~105CFU/g). Cocktails were comprised of 10 strains of LM, six of 29
SALM, or five of EC or SA. Inoculated slices were vacuum packaged and stored at 25˚C for < 30
15 days, with surviving inocula enumerated every three days. Salt-in-the-moisture phase 31
(%SMP), calculated from measured moisture (%) and salt (%), titratable acidity (%), pH, and aw 32
were measured. Pathogens did not grow on 53 cheeses, while 14 cheeses supported growth of 33
SA, six of SALM, four of LM, and three of EC. Of the cheeses supporting pathogen growth, all 34
supported growth of SA, ranging from 0.57 to 3.08 log CFU/g (avg. 1.70 log CFU/g). Growth of 35
SALM, LM, and EC ranged from 1.01 to 2.05 log CFU/g (avg. 2.05 log CFU/g), 0.60 to 2.68 log 36
CFU/g (avg. 1.60 CFU/g), and 0.41 to 2.90 log CFU/g (avg. 1.69 CFU/g), respectively. Cheese 37
pH and %SMP most affected pathogen growth, with pH having a dominant effect. Pathogen 38
growth/no-growth varied within some cheese types or lots. Except for Swiss-type cheeses, mold-39
or bacterial-ripened cheeses, and cheeses made with non-bovine milk where insufficient data 40
exists, the pathogen growth/no-growth interface could be modeled and boundary conditions 41
established for safe, extended storage (<25°C) of cheeses based on pH and %SMP. 42
Non-TCS Cheeses, Supporting Document #1, 45 pages total
3
INTRODUCTION 43
Temperature-dependent storage of most cheeses has three major roles – to allow for 44
curing/ripening of cheeses that contain added or indigenous bacteria and enzymes, to prevent 45
quality defects, and to control pathogen growth (3). The 2009 US Food and Drug Administration 46
(FDA) Food Code (40) defines a potentially hazardous food as a food that requires 47
time/temperature control to limit the growth of pathogenic microorganisms or toxin formation. In 48
this publication, potentially hazardous foods are also designated as Time/Temperature Control 49
for Safety (TCS) foods. This latter designation has been adopted in the 2013 Food Code (45). In 50
both versions of the Food Code, foods with a pH of <4.2 and any aw, or aw of <0.88 and any pH 51
are not considered potentially hazardous. Foods considered potentially hazardous, unless shown 52
to be safe by a product assessment, fall into one of the following categories: aw > 0.88 and pH 53
>5.0, aw >0.90-0.92 and pH >4.6, or aw >0.92 and pH >4.2. The Food Code indicates that TCS 54
foods must be maintained at <5°C, or, if placed outside refrigeration, can be stored for up to 6 h 55
at a temperature no greater than 21°C, after which the product must be discarded. 56
The composition of many cheeses, when evaluated using the Food Code criteria, places 57
them into the category of TCS foods, thus limiting the ability of retailers to market the cheeses 58
under room-temperature conditions which could enhance cheese flavor and aroma (12). The 59
Food Code-mandated time and temperature control may also limit industry flexibility in the 60
transportation, handling, and storage of cheeses. It has, however, been suggested that the 61
biochemical changes that occur during cheese ripening create an environment hostile for 62
pathogen growth, and that time/temperature control of some cheese is primarily needed to 63
maintain the organoleptic quality of cheese, not to maintain safety (3). Bishop and Smukowski 64
conducted a thorough review of the literature available up until 2006 and recommended that 65

Non-TCS Cheeses, Supporting Document #1, 45 pages total
4
cheeses meeting certain criteria, e.g. cheeses manufactured in the US with pasteurized or heat-66
treated milk (>63°C for >16 sec), cheeses manufactured following Good Manufacturing 67
Practices and under the principles of HACCP (Hazard Analysis and Critical Control Points), and 68
cheeses manufactured meeting standards of identity outlined in 21 CFR (Code of Federal 69
Regulations) part 133 (43), should be exempted from refrigeration requirements during ripening, 70
storage, shipping, and display (3). Bishop and Smukowski recommended that the following 71
cheeses could meet these criteria: Asiago (medium and old), Cheddar, Colby, Feta, Monterey 72
Jack, Muenster, Parmesan, Pasteurized process, Provolone, Romano, and Swiss/Emmentaler. 73
In order to establish whether a particular food, e.g. cheese, can be exempted from TCS-74
requirements, the Food Code allows processors or retailers to conduct a microbial challenge 75
study in order to assess the ability of a food product to inhibit pathogenic bacterial growth or 76
inactivate these microorganisms. The Food and Drug Administration (FDA) has outlined 77
parameters for conducting such challenge studies (44). 78
When experts consider the major microbiological hazards across the food supply, the risk 79
of bacterial illness from dairy products such as milk and cheese can be attributed primarily to 80
Listeria monocytogenes, Yersinia entercolitica, Campylobacter spp., and non-typhoidal 81
Salmonella spp. (2). Between 1990 and 2011, there were 105 reported foodborne illness 82
outbreaks in the US, with over 2000 illnesses, linked to cheese/cheese products in the US (11). 83
Pathogens linked to these cheese-related outbreaks included Salmonella spp. (37 outbreaks), 84
Listeria monocytogenes (16 outbreaks), pathogenic Escherichia coli (6 outbreaks), 85
Staphylococcus aureus (4 outbreaks), Norovirus (21 outbreaks), Campylobacter spp. (9 86
outbreaks), and Brucella spp. (5 outbreaks) (11). Among the 105 outbreaks, 17 were linked to 87
cheeses made with pasteurized milk, 30 were linked to cheese made with raw milk, and the 88

Non-TCS Cheeses, Supporting Document #1, 45 pages total
5
pasteurization status of cheeses involved in the remaining 58 outbreaks was unspecified. The 89
pathogenic bacteria primarily responsible for foodborne illness outbreaks linked to cheese 90
manufactured with pasteurized milk were L. monocytogenes, Salmonella spp., and E. coli 91
O157:H7. Cheeses implicated in these outbreaks included process cheese, Mozzarella, and 92
Mexican-style cheeses (7, 11). The low incidence of S. aureus-linked outbreaks related to cheese 93
is presumed to be due to the low incidence of this pathogen in pasteurized milk, and the growth 94
characteristics of this bacterium (21). However, S. aureus is commonly carried by humans and 95
thus could contaminate cheese during post-pasteurization handling (16). S. aureus is also the 96
bacterial pathogen considered to have the highest tolerance to reduced-moisture conditions or 97
increased salt concentration (22), and therefore could be considered a target pathogen in 98
determining the safety of cheese contaminated post-processing and stored for extended periods 99
of time at room temperature. 100
The goal of this project was to evaluate survival of strains of L. monocytogenes, 101
Salmonella spp., E. coli O157:H7, and S. aureus on natural market cheeses during extended 102
storage at 25°C, and to determine the effect of cheese compositional factors such as pH, aw, and 103
%salt on pathogen survival. Pathogen-survival data from laboratory research and data from 104
published literature were then combined in order to model the boundary conditions for pathogen 105
growth / no-growth during storage of cheese at room temperature. 106
107
Non-TCS Cheeses, Supporting Document #1, 45 pages total
6
MATERIALS AND METHODS 108
Cheeses. Sixty-seven cheeses were purchased from local retail establishments or 109
obtained directly from the manufacturer and stored at 4°C. Cheeses studied were Asiago (aged, 110
young), Brick (2 brands), Cheddar (mild, regular, sharp), Cheddar-Mozzarella, Colby, Colby-111
Jack, Farmer’s, Feta, Gouda, Gruyere, Havarti (2 brands), Jack (goats’ milk), Monterey Jack, 112
Muenster (2 brands), Parmesan, Pepper Jack (2 brands), Provolone (mild, regular; 2 brands 113
sharp), Provolone-Mozzarella, Queso Blanco, Queso Fresco, Queso Quesadilla, String cheese (2 114
brands), Swiss (Baby, 2 brands; Lacey, regular), reduced-fat cheeses (Cheddar, Colby-Jack, 115
Provolone) and reduced-sodium cheeses (Colby Jack, Provolone). Where a type of cheese was 116
tested more than once, tested cheeses were from different brands and/or from different 117
production dates of the same brand. All cheeses were manufactured in the United States from 118
pasteurized milk (Table 1, 2). 119
Proximate analysis. The cheeses tested in this study were characterized by % moisture, 120
% salt, and aw at the beginning of each trial. Changes in both % titratable acidity (%TA) and pH 121
were anticipated over time; thus pH was measured on pathogen-inoculated cheeses at every 122
sampling time (days 0, 3, 6, 9, 12 and 15), and %TA was measured on un-inoculated cheeses on 123
days 0, 6 and 15. Duplicate trials were performed for each compositional analysis, and average 124
values were reported. 125
Moisture (%) was determined using a standard method (4) by drying a representative 3-g 126
sample at 100°C for 5 h in a vacuum oven maintained at -98kPa throughout the drying process 127
(M.D.O. Vacuum Oven, Model 3623, Lab-Line Instrument Inc., Melrose Park, IL). Salt (%) was 128
determined by titration of chloride using the silver titration standard method (4). For each trial, a 129
Non-TCS Cheeses, Supporting Document #1, 45 pages total
7
representative 5-g sample was diluted with distilled water 1:20 (w/v) and % chloride was 130
determined according to the standard method using a Model M926 Chloride Analyzer (Nelson 131
Jameson, Marshfield, WI). The % chloride content was automatically calculated by the analyzer 132
and expressed as mg%/liter of sodium chloride, which was converted to % salt by multiplying 133
the appropriate dilution and conversion factors. Salt (%) and moisture (%) of an individual 134
cheese sample were used to calculate % salt-in-moisture-phase (%SMP) using Equation 1: 135
%SMP = (% salt x 100) / (% salt + % moisture) (1) 136
Water activity (aw) was determined for each cheese at the beginning of each trial using an 137
AquaLab LITE water activity meter (Decagon Devices Inc., Pullman, WA) according to a 138
standard method (1). Titratable acidity (%) was monitored during storage (days 0, 6, and 15) 139
according to a standard method (4). Briefly, for each cheese/trial, one sample (10.0 + 0.5 g) that 140
had been manually crumbled was automatically blended with 50-ml distilled water and titrated 141
using a Model DL22 Automatic Titrator (Mettler Toledo, Schwerzenbach, Switzerland), which 142
was set to calculate % titratable acidity (%TA) using the molecular weight of lactic acid. To 143
determine the impact, if any, of the presence of inoculum bacteria or growth of indigenous 144
bacteria on cheese pH, the surface pH was measured for individual inoculated cheese slices at 145
each sampling time (days 0, 3, 6, 9, 12, and 15) using an Accumet AB15 pH meter equipped 146
with a flat surface combination electrode (Fisher Scientific, Itasca, IL). 147
Inoculum preparation. Ten strains of L. monocytogenes, six strains of Salmonella spp., 148
five strains of E. coli O157:H7, and five strains of S. aureus, representing a wide variety of 149
sources and serotypes, were used in this study (Table 3). Stock cultures were maintained at 150
−20ºC in brain heart infusion broth (BHIB; Difco, Becton Dickinson, Sparks, MD) with 10% 151

Non-TCS Cheeses, Supporting Document #1, 45 pages total
8
(wt/vol) added glycerol (Fisher). Fresh working cultures were prepared monthly by thawing 152
stock cultures and streaking for isolation as follows: L. monocytogenes on Listeria Selective agar 153
(LSA; Oxoid, Ogdensburg, NY) with added Listeria Selective Supplement (Oxford formulation, 154
Oxoid), Salmonella and E. coli O157:H7 on modified Levine’s Eosin Methylene Blue agar (m-155
LEMB), prepared from lactose-free LEMB agar (Difco) with the addition of 10 g/liter D-sorbitol 156
(Fisher) and 5 g/liter NaCl (Fisher); and S. aureus on Baird-Parker agar (BP; Difco) with added 157
egg yolk Tellurite enrichment (Difco). Working culture plates were incubated for 24 h at 35°C 158
for Salmonella spp. and E. coli O157:H7, and 48 h at 35°C for L. monocytogenes and S. aureus, 159
whereupon all cultures were observed for consistent colony morphology and stored at 4°C for 160
<40 days. Inoculation cultures were prepared for individual strains by transferring a single 161
colony of each strain into a separate tube containing 9 ml of Nutrient broth (NB; Difco) for L. 162
monocytogenes, or BHIB for Salmonella spp., E. coli O157:H7 and S. aureus. Preliminary 163
cheese challenge studies showed better survival of L. monocytogenes over 15 days at 25°C on 164
Cheddar and Swiss cheeses when inocula had been grown in NB, while the other three pathogens 165
survived better on cheeses when inocula had been grown in BHIB (n=2, data not shown). 166
Following incubation for 20 to 24 h at 35ºC, 1 ml of stationary-phase culture of each strain for a 167
designated pathogen (108 CFU/ml for L. monocytogenes, and 109 CFU/ml for Salmonella spp., E. 168
coli O157:H7, and S. aureus) was transferred to a sterile 9-ml tube to produce a single-pathogen, 169
multi-strain cocktail. Each pathogen cocktail was mixed by vortexing and diluted, as necessary, 170
to produce a starting inoculum cocktail of 107 CFU/ml. Pathogen levels in the cocktails were 171
estimated by plating the inocula on brain heart infusion agar (BHIA; Difco) and incubating at 172
35°C for 24 h. 173
Non-TCS Cheeses, Supporting Document #1, 45 pages total
9
Sample inoculation. The working surface of a biosafety cabinet was sterilized with 70% 174
(v/v) ethanol and covered with aluminum foil prior to cheese inoculation. Cheese slices (approx. 175
25-30 g, approx 70-80cm2) were placed on the aluminum foil aseptically, six cheese slices per 176
trial. An aliquot (0.1ml) of a single-pathogen cocktail (107 CFU/ml) was pipetted onto each of 177
the six cheese slices. An L-shaped spreader was used to evenly distribute the inoculum over the 178
surface of the six slices, then samples were left to air-dry under the hood for 15 min to allow 179
bacterial attachment and evaporation of excess liquid. The aw values of control and air-dried 180
inoculated samples were not significantly different (n=3; p>0.05; data not shown). Inoculated 181
cheese slices were folded into half, with the inoculated cheese surfaces facing inward. Folded 182
cheese samples were weighed, then individually vacuum-packaged in standard retail barrier bags 183
(B-2175; Cryovac Food Packaging and Food Solutions, Duncan, SC) and stored at 25°C for up 184
to 15 days. Oxygen transmission rate for the bags was 3-6 cm3/m2 at 40˚F in 24 h. The initial 185
inoculum level on each cheese slice was ~105 CFU/g. 186
Sampling and enumeration. Packaged cheese samples were analyzed following 187
inoculation (time 0) and throughout storage for up to 15 days. Every three days, one cheese slice 188
per pathogen was removed from incubation, the storage/barrier bag was aseptically opened, and 189
Butterfield’s phosphate diluent (BPD; Nelson Jameson, Marshfield, WI) was added to create a 190
1:10 (w/w) dilution. The cheese/diluent mixture was stomached in the bag (AES Smasher, AES 191
Chemunex, Bruz, France) for 2 min at high speed. Stomached samples were serially diluted in 192
BPD, and 0.1-ml portions were spread-plated onto LSA, m-LEMB, m-LEMB, and BP for 193
cheeses inoculated with L. monocytogenes, Salmonella spp., E. coli O157:H7, and S. aureus, 194
respectively. A preliminary trial confirmed better recovery of Salmonella spp. by plating on m-195
LEMB rather than on Xylose Lysine Desoxycholate agar (XLD; Difco), and better recovery of E. 196
Non-TCS Cheeses, Supporting Document #1, 45 pages total
10
coli O157:H7 by plating on m-LEMB rather than on Sorbitol MacConkey agar (SMAC; Difco). 197
Inoculated samples were also spread-plated on deMan-Rogosa-Sharpe agar (MRS; Difco) at 0, 6, 198
and 15 days to monitor changes in lactic acid bacteria (LAB) populations during storage, and to 199
thereby investigate the impact, if any, of indigenous, starter, or adjunct bacterial growth on 200
inoculum survival. The m-LEMB spread-plates were incubated 24 h at 35ºC, LSA and BP plates 201
48 h at 35ºC, and MRS plates 72 h at 35ºC, after which time counts were recorded for each plate, 202
with countable plate counts converted to log CFU/g. On m-LEMB, typical colonies of E. coli 203
O157:H7 appear colorless to pink, while colonies of Salmonella spp. are dark red-black with 204
metallic green sheen. Colonies of S. aureus are typically shiny black and surrounded with clear 205
zone on BP agar. L. monocytogenes colonies are normally grey in color surrounded by black halo 206
on LSA. Data were used to calculate Δlog CFU/g, relative to time 0, over the 15-day storage 207
period for each pathogen/cheese combination. 208
Literature data search and selection. To provide additional data to augment our 209
product assessment, data from published literature were combined with data from this study. In 210
searching for relevant published studies, keywords including, but not limited to, “pathogen, 211
survival, cheeses, temperature, pH, salt” were entered into online scientific databases. Reference 212
lists of publications were also screened for relevant studies with appropriate data. Published 213
challenge studies that met the following criteria were selected: (i) the inoculated cheeses were 214
made with pasteurized cow’s milk, (ii) the cheeses were inoculated with at least one of the 215
pathogens: L. monocytogenes, Salmonella, E. coli O157:H7, or S. aureus, (iii) the pathogen(s) 216
was inoculated on the finished cheese, and (iv) inoculated cheeses were stored at 20-30˚C. 217
Studies with surface-ripened, mold-ripened, Swiss, or processed cheeses, or cheese made with 218
non-bovine milk were excluded. Of 155 studies published between 1959 and 2012 and which 219

Non-TCS Cheeses, Supporting Document #1, 45 pages total
11
investigated pathogen behavior in or on cheeses, six published studies met the criteria (14, 24, 220
25, 33, 34, 39). From each publication, the following information was extracted: type of cheese, 221
temperature and length of storage, type and number of pathogen strains, composition (all 222
available information for pH, aw, % moisture, %SMP, % TA) of cheeses and behavior (growth 223
vs. no-growth) of pathogen(s) (Table 4). 224
Evaluating compositional characteristics affecting pathogen growth. The relationship 225
between compositional factors and behavior of pathogens on cheeses was explored. 226
Compositional factors of cheese: moisture (%), initial pH, %SMP, aw, and initial TA (%), were 227
paired, i.e. one compositional factor as “x” and one as “y”, and a growth vs. no-growth outcome 228
was plotted for each cheese as a function of the x and y values to analyze the influences of the 229
paired compositional factors on pathogen growth. Values of compositional factors were 230
normalized to a 100-point scale before plotting as follows: for each compositional factor, the 231
minimum value of the data set was subtracted from the observed value and the total was divided 232
by the range of the values and multiplied by 100 to obtain the normalized value, as shown in 233
Equation 2. 234
Normalized value = [(value – minimum value)/range] x 100 (2) 235
In this analysis, a “growth” result was indicated for a cheese when the Δ-log CFU/g for 236
any cheese/pathogen combination over the 15-day storage period was a positive value that 237
exceeded the pathogen-specific plating variability: 0.39, 0.41, 0.27, and 0.25 log CFU/g for L. 238
monocytogenes, Salmonella spp. E. coli O157:H7 and S. aureus, respectively. The growth / no- 239
growth outcome plot from each pair of compositional factors was inspected and compared with 240
predictions from a logistic regression equation (SAS 9.2, SAS Institute, Cary, NC). A model at 241

Non-TCS Cheeses, Supporting Document #1, 45 pages total
12
P=0.05 based on the variables pH and %SMP was generated according to the method of 242
McMeekin et al. (29) (Figure 1). 243
RESULTS AND DISCUSSION 244
In this study, 67 cheese samples, representing a variety of national brands, were tested for 245
their ability to support pathogen growth during extended storage at 25°C (Table 1, 2). Cheeses 246
were manufactured using pasteurized milk in facilities meeting applicable federal and state food 247
safety regulatory requirements. Cheeses met a standard of identity, where applicable. Among the 248
67 cheese samples tested, 52 were duplicate samples of cheeses from different lots/production 249
dates of the same brand. The majority of cheeses that were tested in this study would be labeled 250
as ‘hard’ or ‘semi-hard’ cheeses according to FDA classification (43), and were expected to be 251
safe for extended room-temperature storage due to reduced moisture level and low pH. Trials on 252
‘soft’ cheeses with higher moisture were also included in this study in order to clarify 253
compositional differences affecting pathogen growth/no-growth outcomes. Inoculated cheeses 254
were vacuum packaged to prevent mold growth and moisture loss which could inhibit pathogen 255
growth. 256
The FDA, in its guide to microbial challenge testing, notes that it can be important to 257
evaluate a range of intrinsic factors which can influence the safety of a food during its intended 258
shelf life (44). Compositional factors in cheese that could influence pathogen behavior were 259
analyzed: surface pH (Day 0, 3, 6, 9, 12, 15), % moisture, % salt, and aw (Day 0); and % TA 260
(Day 0, 6, 15). Change in lactic acid bacteria (LAB) count was determined on Day 0, 6, and 15. 261
Across all cheese samples, moisture content ranged from a low of 32.07% to a high of 57.64%, 262
for one lot of Gruyere and Feta cheese, respectively. Salt content ranged from 0.33% for one lot 263
Non-TCS Cheeses, Supporting Document #1, 45 pages total
13
of Lacey Swiss to 3.30% for Queso Blanco. Salt-in-moisture phase (%SMP) was calculated from 264
% moisture and % salt (Equation 1) with values ranging from 0.73% for one lot of Lacey Swiss 265
to 7.21% for one lot of Parmesan. Water activity (aw) varied little across the cheese samples 266
tested, ranging from 0.96 to 0.99, except for Parmesan (average aw=0.93) (Table 1). 267
Cheese pH measured at the surface, ranged from 4.33 to 6.49 for Feta (average of two 268
lots) and Queso Fresco, respectively (Table 1, 2) on Day 0. Over the 15-day storage period, 269
change in pH ranged from -1.44 to +0.53 pH units, for Queso Fresco and Baby Swiss (average of 270
4 lot), respectively, with most cheeses exhibiting only slight change in pH. To quantify the 271
amount of organic acid present in each cheese at the beginning of storage and to determine the 272
effect, if any, of storage on changes in organic acid level, % TA was measured (Table 1, 2). The 273
%TA across the cheeses tested ranged from 0.26% to 2.83% for Queso Blanco and Feta (average 274
of 2 lots), respectively, at the beginning of storage. Change in %TA over storage was not clearly 275
linked with change in pH and bacterial survival (data not shown). Change in LAB count in 276
cheese samples was estimated during extended storage at 25°C storage (Table 1, 2). LAB count 277
on Day 0 across the cheeses ranged from 2.00 to 8.08 log CFU/g for one lot of Pepper Jack and 278
Monterey Jack, respectively. Initial LAB counts on similar cheese samples from different brands, 279
or different lots of the same brand, could vary widely. The Day 0 count for LAB on different 280
lots of Provolone (reduced-fat) (Brand 3) varied by 3.25 log CFU/g between purchase dates. 281
Similarly, one sample of Provolone (Brand 3) had one of the lowest Day 0 LAB counts, 2.70 log 282
CFU/g, while another sample of a different brand of Provolone (Brand 4) had one of the highest 283
initial LAB counts, 7.70 log CFU/g. The Day 0 LAB counts for the two samples of Brand 3 284
Provolone were 2.70 log CFU/g and 3.78 log CFU/g, and these rose to 5.40 log CFU/g and 7.19 285
log CFU/g, respectively; equivalent to a Δ-log of 2.70 and 3.41 log CFU/g, respectively. The 286

Non-TCS Cheeses, Supporting Document #1, 45 pages total
14
LAB count for the one lot of Brand 4 Provolone increased by one order of magnitude, from 7.70 287
log CFU/g (Day 0) to 8.70 log CFU/g (Day 15). Throughout the storage period and across all 288
cheese samples tested, changes in LAB count ranged from -2.92 CFU/g for one lot of Parmesan 289
to +5.66 log CFU/g for one lot of Pepper Jack (Brand 4). Of the 67 cheese samples tested, LAB 290
population increased on storage in 47 cheese samples tested. LAB count was relatively constant 291
(0< Δlog <0.3 log CFU/g) in 7 cheese samples tested, and declined (Δ log > -0.3 log CFU/g) in 292
13 other cheese samples during storage. 293
Cheeses were tested for their ability to support growth of L. monocytogenes, Salmonella 294
spp., E. coli O157:H7, and S. aureus (Table 1, 2). Pathogens did not grow on 53 cheese samples 295
over the 15 days (Table 1), while 14 cheese samples supported growth of S. aureus, six of 296
Salmonella, four of L. monocytogenes, and three of E. coli O157:H7 (Table 2). The pattern of 297
pathogen survival for each cheese lot was consistent over storage except for Queso Quesadilla 298
(Table 2). We observed growth of S. aureus (+0.57 log CFU/g) at Day 6 on Queso Quesadilla 299
however by Day 15 we noted a decrease in pathogen population (overall Δ log =-0.40 log 300
CFU/g). Of the cheese samples which did support pathogen growth, all supported growth of S. 301
aureus, ranging from 0.57 to 3.08 log CFU/g (avg. 1.62 log CFU/g across all 14 cheeses). 302
Growth of L. monocytogenes, Salmonella spp., and E. coli O157:H7, ranged from 0.60 to 2.68 303
log CFU/g (avg. 1.60 log CFU/g), 1.01 to 3.02 log CFU/g (avg. 2.05 log CFU/g), and 0.41 to 304
2.90 log CFU/g (avg. 1.69 CFU/g), respectively. Cheese samples which supported growth of S. 305
aureus included Farmer’s, Gruyere (2 lots), Jack (goat’s milk), Muenster (Brand 6), Provolone 306
(Brand 3; 2 lots), reduced-sodium Provolone (2 lots), Queso Blanco, Queso Fresco, and 2 brands 307
of String cheese. The six cheeses that supported growth of Salmonella spp. included: Gruyere (2 308
lots), Jack (goats’ milk), Muenster (Brand 6), Queso Fresco, and one brand of String cheese 309
Non-TCS Cheeses, Supporting Document #1, 45 pages total
15
(Brand 14). The four cheeses that supported growth of L. monocytogenes included: Gruyere (one 310
lot), Queso Blanco, Queso Fresco, one brand of String cheese (Brand 14), and the three cheeses 311
that supported growth of E. coli O157:H7 included: Muenster (Brand 6), Queso Fresco, and 312
String (Brand 14). 313
Among the cheeses which supported pathogen growth at some point during the 15-day 314
storage period, seven supported only the growth of S. aureus: Farmer’s, Provolone (Brand 3; 2 315
trials), reduced-sodium Provolone (Brand 6; 2 trials), String cheese (Brand 6) and Queso 316
Quesadilla (at Day 6 sampling point only) (Table 2). Three cheeses supported the growth of S. 317
aureus and one other pathogen: one lot of Gruyere and Jack (goats’ milk) cheese each supported 318
the growth of S. aureus and Salmonella, while Queso Blanco supported the growth of S. aureus 319
and L. monocytogenes. Two cheeses supported the growth of three pathogens: one lot of Gruyere 320
supported the growth of L. monocytogenes, Salmonella spp, and S. aureus, and one lot of 321
Muenster (Brand 6) supported the growth of Salmonella spp., E. coli O157:H7, and S. aureus 322
(Table 2). There were two cheeses which supported growth of all four pathogens, Queso Fresco 323
and one brand of String cheese (Brand 14). 324
Salmonella spp., L. monocytogenes and E. coli O157:H7 have, in recent years, been 325
implicated in foodborne illness outbreaks linked to cheeses made with pasteurized milk (7, 11). 326
S. aureus has not often been associated with foodborne illness outbreaks linked to cheese, even 327
though this pathogen is generally linked to foods, like cheese, which are often hand-manipulated 328
during processing and packaging (8, 42). We included S. aureus in the study design not only 329
because of its link to poor sanitation and post-processing contamination but also because it is the 330
pathogen most likely to grow in or on foods with reduced moisture and/or low aw (21). For 331
ready-to-eat food products, the FDA has established a zero-tolerance policy for L. 332

Non-TCS Cheeses, Supporting Document #1, 45 pages total
16
monocytogenes, Salmonella spp., and E. coli O157:H7, due to the potentially low infectious dose 333
of E. coli O157:H7 and Salmonella spp, and the high mortality rate (15-30%) associated with L. 334
monocytogenes infections (41). Although none of these pathogens should be present in finished 335
cheeses made from pasteurized or heat-treated milk, the composition of a cheese supporting 336
growth of any of these bacteria during extended room-temperature storage presents an 337
unacceptable risk. A zero-tolerance policy is not in place for S. aureus in ready-to-eat foods 338
because staphylococcal food poisoning occurs as a result of ingestion of a preformed enterotoxin 339
which is only produced in amounts sufficient to cause illness as a result of extended temperature 340
abuse and growth of the pathogen to a high concentration (~105 CFU) (30). Thus a cheese with 341
compositional characteristics allowing growth of S. aureus during storage is also an unacceptable 342
risk. For these reasons, growth of four target pathogens: L. monocytogenes, Salmonella spp., E. 343
coli O157:H7, and S. aureus, as post-processing contaminants on cheeses was investigated. 344
Pathogen strains used in this study represented a variety of sources and serotypes (Table 345
3). The strains of L. monocytogenes and Salmonella spp. had been screened in previous research 346
in our laboratory to confirm tolerance to salt and pH conditions typical of cheese (13). Strains of 347
E. coli O157:H7, Salmonella spp., and S. aureus were exposed to acid during inoculum 348
preparation in BHIB, as a pH drop of ~ 1 unit was observed during overnight incubation. L. 349
monocytogenes was grown in NB, with no acid production or pH drop during inoculum 350
preparation. Where it occurred, the slight exposure to acid during inoculum preparation was 351
unlikely to have led to acid adaptation of strains. Therefore, the key characteristic of strains 352
selected for use in this study was their human or animal/animal-product origin, making these 353
strains perhaps representative of organisms to be found in a food processing or handling 354
environment. 355

Non-TCS Cheeses, Supporting Document #1, 45 pages total
17
Growth of L. monocytogenes was observed on four cheese samples: Gruyere, Queso 356
Blanco, Queso Fresco, and one brand of String cheese (Brand 14) (Table 2), ranging from 0.60 to 357
2.68 log CFU/g. Growth of L. monocytogenes on Muenster (Brand 6, 0.17 log CFU/g) and 358
String (Brand 6, 0.22 log CFU/g) did not exceed the plating variability for the pathogen (0.39 log 359
CFU/g) and ‘growth’ was not declared. Genigeorgis et al. studied the survival of L. 360
monocytogenes on 11 different types of market cheeses stored at 30°C (14). Pathogen growth 361
was observed only on Hispanic-style cheeses: Queso Fresco, Queso Ranchero, and Queso 362
Panela, and ranged from 0.38 to 3.18 log CFU/g (14). Uhlich et al. observed an increase of more 363
than 5 log CFU/g of L. monocytogenes on Queso Blanco stored at 25°C for up to 6.25 days (39). 364
In the present study, we observed growth of L. monocytogenes on one brand of String cheese 365
(Brand 14) that slightly exceeded the plating variability, i.e. the observed growth of 0.60 log 366
CFU/g exceeded the plating variability of 0.39 log CFU/g. Genigeorgis et al. (14) did not 367
observe growth of L. monocytogenes on String cheese, instead noting a drop in L. 368
monocytogenes population of 2.36 log CFU/g over 9 days at 30°C. The String cheese that 369
Genigeorgis et al. tested had similar pH and %SMP values to the cheese sample that we 370
evaluated, but an unknown level of LAB. The String cheese sample in our study allowing some 371
growth of pathogen simultaneously supported a dramatic increase in LAB population, from 4.87 372
log CFU/g at Day 0 to 8.86 log CFU/g by Day 15 (Table 2). 373
Growth of L. monocytogenes was not observed on 63 samples of cheese tested (Table 1, 374
2), many of the cheeses which did not support pathogen growth would be classified as ‘hard’ or 375
‘semi-hard’ cheeses based on FDA classification (43) and may be suitable for extended room 376
temperature storage. Shrestha et al. (33) did not observe growth of L. monocytogenes on a range 377
of Cheddar-type cheeses stored at 21°C for 30 days, with counts of L. monocytogenes dropping 378
Non-TCS Cheeses, Supporting Document #1, 45 pages total
18
by < 1.1 log CFU/g during storage. We also observed a slight decrease in the population of L. 379
monocytogenes on mild, reduced-fat, and sharp Cheddar cheeses during storage at 25° (Table 1). 380
Pathogen populations decreased from 0.00 to 0.76 log CFU/g across samples and Cheddar 381
cheese-type tested. Genigeorgis et al. also reported a decrease of L. monocytogenes population 382
on mild Cheddar cheeses during storage (14). Similarly, Genigeorgis et al. evaluated the growth 383
of L. monocytogenes on Monterey Jack, Colby, Provolone, Muenster, and Feta cheeses during 384
storage, and observed a decrease in pathogen population of >1-2 log CFU/g in all cases. In our 385
study, we noted an average decrease in pathogen population of 0.2 log CFU/g for Colby, 4.74 log 386
CFU/g for Feta, 1.83 log CFU/g for Monterey Jack, 0.25 log CFU/g for Muenster (Brand 3), and 387
0.99 log CFU/g for several different types of Provolone (regular, mild, sharp) (Table 1, 2). Two 388
lots of Provolone (Brand 3) which supported growth of S. aureus did not support the growth of 389
L. monocytogenes (Table 2). One brand of Muenster (Brand 6) appeared to support a slight 390
growth of L. monocytogenes during storage (0.17 log CFU/g), but this was found not to exceed 391
the plating variability associated with this pathogen (0.39 log CFU/g), and thus ‘no growth’ was 392
declared. 393
Growth of Salmonella was observed on six cheeses: Gruyere, Jack (goat’s milk), 394
Muenster (Brand 6), Queso Fresco, and String (Brand 14), ranging from 1.01 to 3.02 log CFU/g 395
over 15 days. Slight growth of Salmonella was also observed for Brand 6 of String cheese (0.39 396
log CFu/g) but this was below the plating variability for this pathogen (0.41 log CFU/g), and 397
therefore counted as ‘no growth.’ Kasrazadeh and Genigeorgis (25) studied the growth of 398
Salmonella inoculated onto sliced Queso Fresco stored at 20°C. They noted rapid growth, a lag 399
time of 2.5-3.5 h and a generation time of 1.65-2.17 h, for Salmonella on Queso Fresco. We 400
observed an increase in Salmonella concentration of 3.02 log CFU/g on Queso Fresco stored at 401

Non-TCS Cheeses, Supporting Document #1, 45 pages total
19
25°C over 15 days. This was the highest level of Salmonella growth observed over all 67 cheese 402
samples tested. 403
There were 61 cheeses which did not support the growth of Salmonella in this study. 404
Shrestha et al. (34) examined the survival of Salmonella on a range of Cheddar-type cheeses 405
stored for up to 30 days at 21°C. Cheddar cheese manufactured to standards of pH and salt was 406
comminuted, inoculated with Salmonella spp., and stored at 21°C for up to 30 days. Salmonella 407
spp. counts decreased significantly at 21°C for all cheese-types. We evaluated the survival of 408
Salmonella spp. on mild, reduced-fat, and sharp Cheddar cheeses and observed average 409
decreases of 0.3, 1.12, and 1.26 log CFU/g, respectively, for the brands tested. Growth of E. coli 410
O157:H7 was observed on three cheeses: Muenster (Brand 6), Queso Fresco, and String (Brand 411
14), ranging from 0.41 log CFU/g (Muenster) to 2.90 log CFU/g (Queso Fresco) over 15 days. 412
Kasrazadeh and Genigeorgis (24) also observed rapid growth of E. coli O157:H7 on Queso 413
Fresco stored at 20°C. There were 64 cheese samples in this study which did not support the 414
growth of this pathogen. 415
The survival pattern for pathogens on cheeses was consistent during storage, with the 416
exception of the survival of S. aureus on Queso Quesadilla which increased by 0.57 log CFU/g 417
on Day 6 of storage, but decreased by 0.40 log CFU/g relative to the time-zero level by Day 15. 418
In all other cases, pathogen growth/no-growth was consistent, displaying an increase or decrease 419
over the 15-day storage period. LAB count increased in 47 of 67 cheeses tested in this study. 420
With one exception, cheeses which supported pathogen growth also supported LAB growth. 421
LAB count decreased in Jack (goat’s milk) cheese which supported growth of Salmonella (+2.50 422
log CFU/g) and S. aureus (+1.62 log CFU/g); otherwise LAB count increased from 1.54 to 4.47 423
log CFU/g in cheeses which supported pathogen growth. The level of inoculum on each cheese 424
Non-TCS Cheeses, Supporting Document #1, 45 pages total
20
slice at time 0 averaged 4.7 log CFU/g (n=268). This level allowed for accurate enumeration of 425
growth or death without reaching the limits of research methodology. This inoculum level could 426
have placed pathogens at a level to effectively compete with active indigeneous organisms. LAB 427
count on Day 0 averaged 5.03 log CFU/g for cheeses which supported pathogen growth (n=14, 428
Table 2). While previous studies have shown that initial inoculum level does not affect the 429
survivability or growth kinetics of pathogens (6, 26, 46), a higher proportion of S. aureus 430
compared to LAB may aid in the survival of this particular pathogen (17). Although growth of S. 431
aureus is reported to be weak when a high load of competitive bacteria, e. g. lactic acid bacteria 432
(LAB) is present, increasing the proportion of S. aureus to LAB has been shown to aid in 433
survival of this pathogen (17, 23). 434
The change in pH on storage among cheeses that supported pathogen growth showed no 435
clear trend, remaining the same (Δ pH < 0.3 units) in 7 samples, and increasing in 6 samples 436
(Table 2). Cheese samples that supported pathogen growth had %TA which ranged from 0.26 % 437
to 1.67 % at the beginning of storage (Table 2); while cheese samples which did not support 438
pathogen growth had %TA ranging from 0.66% to 2.86% at the beginning of storage (Table 1). 439
Change in %TA over storage (data not shown) had no apparent relationship with the change of 440
pH and LAB count. Among cheeses that supported pathogen growth, LAB count increased in all 441
but one sample (Jack (goats’ milk cheese)), with an increase ranging from 1.54 log CFU/g for 442
one lot of reduced sodium Provolone to 4.43 log CFU/g for Farmer’s cheese. Correlation 443
between changes in pH and LAB count in cheeses was weak (r2=0.25). 444
A total of 53 cheeses did not support the growth of any pathogen tested. These cheeses 445
were most notably characterized by lower pH; there was little difference in % moisture and 446
%SMP between these cheeses and those that supported pathogen growth. When cheese samples 447
Non-TCS Cheeses, Supporting Document #1, 45 pages total
21
were separated into roughly equal groups by initial pH value: 4.29 - 5.20 (29 cheeses), 5.21 – 448
5.40 (18 cheeses), and 5.41 – 6.50 (20 cheeses), it was readily apparent that pathogen growth 449
was better supported on higher pH cheeses. With the exception of Provolone (Brand 3; pH 5.15) 450
and reduced-sodium Provolone (pH 5.15), cheeses with Day 0 pH ranging from 4.8-5.2 did not 451
support growth of any pathogens (Table 1). Feta was the most acidic cheese tested (average pH 452
4.33, n=2 lots), and pathogen viability on this cheese type decreased over time more than for any 453
other cheese with average reductions of 4.74 log CFU/g for L. monocytogenes, 4.82 log CFU/g 454
for Salmonella spp., 4.34 log CFU/g for E. coli O157:H7, and 3.84 log CFU/g for S. aureus. As 455
pH increased to 5.21 - 5.40, four of 18 cheeses supported growth: Provolone (Brand 3; 1 lot), 456
reduced-sodium Provolone (1 lot), String cheese (Brand 6) and Queso Quesadilla; all supporting 457
the growth of S. aureus (average 1.14 log CFU/g across all 3 cheeses), but no other pathogen 458
(Table 2). In the pH range 5.41 - 6.50, eight cheeses supported pathogen growth: Jack (goats’ 459
milk) (pH 5.41), String (Brand 14, pH 5.44), Farmer’s (pH 5.46), Muenster (pH 5.48), Gruyere 460
(2 lots; pH 5.68; 6.28), Queso Blanco (pH 6.37), and Queso Fresco (pH 6.49). Pathogen growth 461
on Queso Fresco was the greatest across all cheeses - tested; this was also the cheese with the 462
highest initial pH. Cheeses with an initial pH >5.46 supported growth of at least one pathogen, 463
with the exception of Swiss-style cheeses (Baby Swiss, Swiss, Lacey Swiss – pH range 5.50 – 464
6.02), and one lot of Havarti (pH 5.49) which did not support growth. Optimal pH for growth of 465
S. aureus is between pH 6.0 and 7.0, with pH 4.0 as the reported minimum for growth (20). 466
Minimum pH values for growth that have been reported for L. monocytogenes, Salmonella spp., 467
E. coli O157:H7 are 4.39, 4.20, and 4.40, respectively (20). Only Feta cheese (pH 4.29, 4.38) 468
was below the reported minimum pH for growth of any of the pathogens tested. 469

Non-TCS Cheeses, Supporting Document #1, 45 pages total
22
The average moisture content for cheese samples which supported growth (43.11%) 470
varied little from moisture content for cheese samples which did not support growth (40.38%) 471
(Table 1 ,2). An even narrower difference in -average SMP was observed between cheeses which 472
supported growth (3.76%) and cheeses which did not support growth (3.52%) (Table 1, 2), 473
however the range of values in each category (growth/no-growth) was much wider, ranging from 474
0.73 to 7.21 %SMP for cheese samples which did not support growth, and from 2.26 to 6.56 475
%SMP for cheese samples that did. The greater growth potential that we observed for S. aureus 476
on cheeses could be attributed, in part, to the high salt-tolerance of this pathogen. Nunheimer and 477
Fabian reported that some strains of S. aureus are able to tolerate up to 20% NaCl (31). 478
Sutherland et al. (36) reported growth of S. aureus in BHIB with pH 4.48 and 8.5% NaCl at 479
25˚C. Ingham et al. reported greater tolerance of S. aureus than of L. monocytogenes to high salt- 480
and low aw in meat products stored at 21°C (19). 481
Where applicable, we tested cheeses from different brands, or from different lots within 482
the same brand, to allow us to determine lot-to-lot or brand-to-brand variation for a similar type 483
of cheese. For example, Muenster cheese from two manufacturers was tested; cheese from one 484
brand (Brand 6, Table 2) supported growth of three pathogens, S. aureus, Salmonella spp., and E. 485
coli O157:H7 (+0.41 to +1.77 log CFU/g;), while Muenster cheese from a different brand (Brand 486
3, Table 1) did not support growth of any pathogen (-0.00 to -0.75 log CFU/g). Among ten 487
Provolone cheeses tested (mild, sharp, regular (3 lots from 2 brands), reduced-fat (2 lots), 488
reduced-sodium (2 lots), and a Provolone-Mozzarella blend), six cheeses (2 lots of reduced-fat, 489
regular, sharp, mild, and Provolone-Mozzarella blend) did not support growth of any pathogen 490
(Table 1). The contribution of pH, %SMP, and other inhibitory compounds present in cheese, 491
such as metabolites of LAB and the presence of free fatty acids may have varied from lot-to-lot, 492

Non-TCS Cheeses, Supporting Document #1, 45 pages total
23
brand-to-brand, and between cheese types, resulting in differences in pathogen growth during 493
non-refrigerated storage. The effect of these factors on microbial survival has been shown to be 494
highly dependent on the concentration of inhibitory compound and the species and strain of both 495
LAB and pathogen (10, 15, 17, 35). The apparent inconsistencies in pathogen growth patterns 496
observed for cheeses of a similar type supports the assertion that it may be compositional 497
characteristics, more than cheese type, that determine the likelihood of pathogen growth on a 498
sample of cheese. 499
The compositional factors of pH, %SMP, aw, and %TA were paired in all combinations 500
and a pathogen growth / no-growth outcome for each cheese was plotted as a function of each 501
pair of factors. Plotting growth / no-growth outcome as a function of pH and %SMP, combined 502
with logistic regression, created a growth / no-growth interface that could be used to clearly 503
differentiate cheeses which inhibited pathogen growth from those that allowed pathogen growth 504
(Figure 1). A similar approach using other pairs of compositional factors was not successful in 505
generating a clear growth / no-growth interface (data not shown). These results are consistent 506
with those of Oh et al. who evaluated the effect of compositional factors of low-sodium Cheddar 507
cheeses on the growth of strains of Salmonella spp., L. monocytogenes, S. aureus, and Shiga 508
toxin-producing E. coli (STEC). In a model low-sodium Cheddar-cheese extract, STEC survived 509
significantly better than the other three pathogens. Principal component analysis indicated that 510
STEC survival was primarily determined by pH, and not by % salt or % lactate (32). 511
The eight Swiss-style cheese samples tested did not fit the pattern established by data 512
from the other cheeses tested. These Swiss-style cheeses had the lowest %SMP (0.73-1.87%) of 513
all cheeses tested, a relatively high pH (5.36-6.02), and a high aw (0.98-0.99). Despite 514
compositional factors which seem to be permissive for growth, none of the Swiss-style cheeses 515
Non-TCS Cheeses, Supporting Document #1, 45 pages total
24
supported pathogen growth. Leyer and Johnson reported poorer survival of Salmonella spp. on 516
Swiss cheeses than on Cheddar and Mozzarella (27). Swiss-style cheeses are unique among the 517
types of cheeses that we tested due to the addition of propionic acid bacteria added as an adjunct 518
culture in cheese manufacture. The added propionic acid bacteria can produce metabolites with 519
antimicrobial properties, such as propionic acid, acetic acid, and diacetyl (9). Studies have shown 520
greater antimicrobial properties linked to propionic acid (pKa=4.87) as compared to lactic acid 521
(pKa=3.86) (37). The results of our study would suggest that target pathogens will not grow on 522
Swiss-style cheeses during extended storage at 25°C, but the safety of such cheeses should be 523
evaluated independently from cheeses which are fermented using only lactic acid-producing 524
bacteria. Similarly, research suggests that the ability of pathogens to grow on bacterial surface-525
ripened or mold-ripened should be evaluated independently from cheeses manufactured without 526
these ripening adjuncts. Bacterial surface-ripened and mold-ripened cheeses have added cultures 527
that are capable of growing and altering the environment for pathogen growth. Growth of added 528
bacterial and/or mold cultures can result in the production of antimicrobial compounds (e.g. 529
bacteriocins) which could hinder pathogen growth, but can also lead to lactate metabolism which 530
can subsequently increase cheese pH and enhance pathogen growth (5). Genigeorgis et al. found 531
a significant reduction of L. monocytogenes (> -2.36 log CFU/g) when inoculated onto 532
Limburger, a bacterial surface-ripened cheese (14). While the high pH of Limburger (pH 7.2) 533
would suggest that this cheese could support pathogen growth, the growth of smear bacteria 534
results in extensive lipolysis which produces a high concentration of free fatty acids, which are 535
compounds known to have antimicrobial activity (35). Goats’ milk cheese may also contain high 536
levels of free fatty acids. Woo et al. evaluated the free fatty acid content in a variety of cheeses 537
and concluded that Blue, Swiss, Limburger, and goats’ milk cheeses contained high 538
Non-TCS Cheeses, Supporting Document #1, 45 pages total
25
concentrations of free fatty acids (47). Thus, we conclude that surface-ripened cheeses, mold-539
ripened cheeses, and non-cow’s milk cheeses, along with Swiss-style cheeses should be 540
evaluated separately, perhaps by group, and more data gathered in order to assess their suitability 541
for extended non-refrigerated storage. 542
Water activity (aw) and pH are the two criteria used in the FDA Food Code to determine 543
the shelf stability of food products (45). However, %SMP can be seen as a more appropriate 544
factor than aw in assessing the likelihood of pathogen survival on cheese. In addition to salt, other 545
solutes in cheese such as non-protein nitrogen-containing compounds and products released 546
during proteolysis, could contribute to the reduction of aw, yet these compounds may not play a 547
role in inhibiting pathogen growth (28). Tapia et al. (38) suggested that the usefulness of 548
measured aw as an indicator of microbial safety or stability is diminished by the ‘specific solute 549
effect’; that is that the solute in the food matrix dramatically alters the minimum aw for microbial 550
growth. Hilderbrand (18) supported %SMP as a more reliable factor than aw in determining 551
bacterial growth in smoked fish. In addition, %SMP is routinely determined and has historically 552
been used in the cheese industry as a measure of product quality. Our search of published 553
literature indicated that other researchers investigating survival of pathogens as post-processing 554
contaminants on cheese routinely monitored %SMP (14, 24, 25, 33, 34, 39), while only a few 555
studies investigating pathogen survival on cheese considered the impact of product aw (33, 34, 556
39). Furthermore we identified that pH and %SMP were the two compositional factors which 557
could be used to clearly differentiate cheeses which supported pathogen growth from those that 558
inhibited growth (Figure 1), while the compositional factors of pH and aw were not similarly 559
effective. 560

Non-TCS Cheeses, Supporting Document #1, 45 pages total
26
Of the 67 market cheeses studied, 53 did not support the growth of L. monocytogenes, 561
Salmonella, E. coli O157:H7, or S. aureus and could safely be kept at < 25°C for an extended 562
period of time. The risk of pathogen growth for those cheeses which supported growth can be 563
characterized as follows: S. aureus (growth on 14 of 14 cheeses supporting pathogen growth) >> 564
Salmonella (growth on 6 of 14) > L. monocytogenes (growth on 4 of 14) > E. coli O157:H7 565
(growth on 3 of 14). Of several intrinsic compositional factors associated with cheese, i.e. pH, aw, 566
%SMP, and %TA, cheese pH has the clearest effect on pathogen growth. Laboratory data was 567
combined with relevant published research in order to expand our product assessment. Pathogen 568
growth/no-growth outcomes for 82 cheeses, 56 cheeses tested in our laboratory and 26 cheeses 569
for which published results were available in the literature, were plotted on a graph with axes of 570
pH and %SMP. Logistic regression analysis generated a P=0.05 boundary line, which indicated a 571
clear differentiation between cheese compositions (in terms of pH and %SMP) which supported 572
pathogen growth and those which did not. Data from Swiss-type cheeses, mold-or bacterial-573
ripened cheeses, or cheeses made with non-bovine milk were excluded from this analysis due to 574
insufficient data or lack-of-fit. The growth/no-growth interface established by the logistic 575
regression line clearly shows that many common cheese types, if made from pasteurized cows’ 576
milk in compliance with US regulatory standards, can safely be considered non-TCS foods. Non-577
TCS cheeses should be described in terms of pH and %SMP rather than cheese-type or brand, 578
and would include cheeses with pH/%SMP values more restrictive than any of the following 579
combinations drawn from Figure 1 (in order of increasing pH): <4.60/>0.24; 4.61-4.70/0.25-580
0.91; 4.71-4.80/0.92-1.58; 4.81-4.90/1.59-2.24; 4.91-5.00/2.25-2.91; 5.01-5.10/2.92-3.58; 5.11-581
5.20/3.59-4.25; 5.21-5.30/4.26-4.92; 5.31-5.40/4.93-5.59; 5.41-5.50/5.60-6.26; and 5.51-582
5.60/6.27-6.93. More research would be necessary to develop boundary conditions for safe, 583
Non-TCS Cheeses, Supporting Document #1, 45 pages total
27
extended room-temperature storage of cheeses not covered in this model, including Swiss-type 584
cheeses, bacterial surface-ripened or mold-ripened cheeses, cheeses made from non-bovine milk, 585
or cheeses made from unpasteurized milk. 586
587
ACKNOWLEDGEMENTS 588
This research was funded by a grant from the Wisconsin Milk Marketing Board with 589
support from the National Institute of Food and Agriculture, United States Department of 590
Agriculture, under WIS01584. The authors acknowledge support of Ms. Engstrom from the Land 591
O’Lakes Scholarship Fund 2010-2011. The authors wish to thank those companies in Wisconsin 592
which donated cheese to this project. 593
594
595
596
597
598
599
600
601
602
603
604
605
606
607
Non-TCS Cheeses, Supporting Document #1, 45 pages total
28
REFERENCES 608
1. Association of Official Analytical Chemists. 2000. Official Methods of Analysis. AOAC, 609
Arlington, VA. 610
2. Batz, M. B., S. Hoffman, and M. Jr. J. Glenn. Ranking the disease burden of 14 pathogens in 611
food sources in the United States using attribution data from outbreak investigations and 612
expert elicitation. J. Food Prot. 75:1278-1291. 613
3. Bishop, J.R., and M. Smukowski. 2006. Storage temperatures necessary to maintain cheese 614
safety. Food Prot. Trends. 26: 714-724. 615
4. Bradley, R.L., E. Arnold, D.M. Barbano, R.G. Semerad, D.E. Smith, and B.K. Vines. 1992. 616
Chemical and physical methods, p. 433–531. In R. T. Marshall (ed.), Standard methods for 617
the examination of dairy products, 16th ed. American Public Health Association, 618
Washington, D.C. 619
5. Brennan, N.M., T. Cogan, M. Loessner, and S. Scherer. 2004. Bacterial surface-ripened 620
cheeses, p. 206-208. In P. F. Fox , P. McSweeney, T. Cogan, and T. Guinee (ed.), Cheese: 621
chemistry, physics, and microbiology, vol. 2. Major cheese groups. 3rd ed. Elsevier Ltd, 622
London, England. 623
6. Buchanan, R. L., J. L. Smith, C. McColgan, B.S. Marmer, M. Golden, and B. Dell. 1993. 624
Response surface model for the effects of temperature, pH, sodium chloride, and sodium 625
nitrite on the aerobic and anaerobic growth of Staphylococcus aureus 196E. J. Food Safety. 626
13: 159-175. 627
7. Centers for Disease Control and Prevention. 2013. Foodborne outbreak online database. 628
Available at: http://www.cdc.gov/foodborneoutbreaks/ Accessed 12 November 2013. 629

Non-TCS Cheeses, Supporting Document #1, 45 pages total
29
8. Centers for Disease Control and Prevention. 2010. National center for emerging and zoonotic 630
infectious disease: Foodborne, waterborned, and mycotic diseases.Available at: 631
http://www.cdc.gov/nczved/divisions/dfbmd/diseases/staphylococcal/ Accessed 12 632
November 2013. 633
9. Chamba, J. F. and F. Irlinger. 2004. Secondary and adjunct culture, p. 191-207. In P. F. Fox , 634
P. McSweeney, T. Cogan, and T. Guinee (ed.), Cheese: chemistry, physics, and 635
microbiology, vol. 1. General aspect. 3rd ed. Elsevier Ltd, London, England. 636
10. Charlier, C., M. Cretenet, S. Even, and Y. L. Loir. 2009. Interactions between 637
Staphylococcus aureus and lactic acid bacteria: An old story with new perspectives. Int. J. 638
Food Microbiol. 131: 30-39. 639
11. Center for Science in the Public Interest. 2013. Outbreak alert! Database. Available at 640
https://www.cspinet.org/foodsafety/outbreak/pathogen.php Accessed 12 November 2013. 641
12. Drake, M. A., M. D. Yates, and P. D. Gerard. 2005. Impact of serving temperature on trained 642
panel perception of Cheddar cheese flavor attributes. J. Sens. Stud. 20:147–155. 643
13. Engstrom, S. 2012. Evaluating the risk of Listeria monocytogenes and Salmonella spp. 644
growth on semi-soft and hard cheeses stored without refrigeration. M.S. Thesis, University of 645
Wisconsin-Madison, Madison, WI. 646
14. Genigeorgis, C., M. Carniciu, D. Dutulescu, and T. B. Farver. 1991. Growth and survival of 647
Listeria monocytogenes in market cheeses stored at 4 to 30˚C. J. Food Prot. 54:662-668. 648
15. Gotlieb, C.T., L. E. Thomsen, H. Ingmer, P. H. Mygind, H. H. Kristensen, and L. Gram. 649
2008. Antimicrobial peptides effectively kill a broad spectrum of Listeria monocytogenes and 650
Staphylococcus aureus strains independently of origin, sub-type, or virulence factor 651
expression. BMC Microbiol: 8:205-305. 652

Non-TCS Cheeses, Supporting Document #1, 45 pages total
30
16. Gutierrez, D., S. Delgado, D. Vazquez-Sanchez, B. Martinez, M. Lopez Cabo, A. Rodriguez, 653
J. J. Herrera and P. Garcia. 2012. Incidence of Staphylococcus aureus and analysis of 654
associated bacterial communities on food industry surfaces. J. Appl. Environ. Microbiol. 655
78:8547-8554. 656
17. Haines, W. and L. G. Harmon. 1973. Effect of selected lactic acid bacteria on growth of 657
Staphylococcus aureus and production of enterotoxin. J. Appl. Microbiol. 25: 436-441. 658
18. Hilderbrand, K. 2001. Fish smoking procedures for forced convection smokehouses. Oregon 659
State University. 660
19. Ingham, S. C., G. Searls, S. Mohanan, and D. R. Buege. 2006. Survival of Staphylococcus 661
aureus and Listeria monocytogenes on vacuum-packaged beef jerky and related products 662
stored at 21˚C. J. Food Prot. 69: 2263-2267. 663
20. International Commission on Microbiological Specifications for Food. 1980. Microbial 664
ecology of foods: factors affecting life and death of microorganisms, vol.6. Academic Press, 665
Orlando, Florida. 666
21. International Commission on Microbiological Specifications for Food. 1998. 667
Microorganisms in foods: microbial ecology of food commodities, vol. 6. Blackie Academic 668
& Professional, London, England. 669
22. Jay, J.M. 1992. Modern food microbiology, 4th ed. Chapman & Hall, New York, NY. 670
23. Kao, C. T., and W.C. Frazier. 1966. Effect of lactic acid bacteria on growth of 671
Staphylococcus aureus. J. Appl. Microbiol. 14: 251-255. 672
24. Kasrazadeh, M., and C. Genigeorgis. 1995. Potential growth and control of Escherichia coli 673
O157:H7 in soft Hispanic type cheese. Int. J. Food Microbiol. 25:289-300. 674

Non-TCS Cheeses, Supporting Document #1, 45 pages total
31
25. Kasrazadeh, M., and C. Genigeorgis. 1994. Potential growth and control of Salmonella in 675
soft Hispanic type cheese. Int. J. Food Microbiol. 22:127-140. 676
26. Koenig, S., and E. H. Marth. 1982. Behavior of Staphylococcus aureus in cheddar cheese 677
made with sodium chloride or a mixture of sodium chloride and potassium chloride. J. Food 678
Prot. 45:996–1002 679
27. Leyer, G.L., and E. Johnson. 1992. Acid adaptation promotes survival of Salmonella spp. in 680
cheese. Appl. Environ. Microbiol. 58:2075-2080. 681
28. Marcos, A., M. Alcala, F. Leon, J. Fernandez-Salguero, and M. A. Esteban. 1979. Water 682
activity and chemical composition of cheese. J. Dairy Sci 64: 622-626. 683
29. McMeekin, T.A., K. Presser, D. Ratkowsky, T. Ross, M. Salter, and S. Tienungoon. 2000. 684
Quantifying the hurdle concept by modelling the bacterial growth/no growth interface. 685
International J. of Food Microbio. 55:93-98. 686
30. National Advisory Committee on Microbiological Criteria for Foods. 2010. Parameters for 687
determining inoculated pack/challenge study protocols. J. Food Prot.73:140-202. 688
31. Nunheimer, T. D., and F. W. Fabian. 1940. Influence of organic acids, sugars and sodium 689
chloride on strains of food poisoning staphylococci. Am. J. Publ. Health 30: 1040-1049. 690
32. Oh, J. H., E. Vinay-Lara, R. McMinn Jr., K. A. Glass, M. A. Johnson, and J. L. Steele. 2014. 691
Evaluation of compositional factors of low-sodium Cheddar cheeses on the growth of 692
pathogens in a model system. In preparation. (change to submitted later after confirm) 693
33. Shrestha, S., J.A. Grieder, D.J. McMahon, and B.A. Nummer. 2011. Survival of Listeria 694
monocytogenes introduced as a post-aging contaminant during storage of low-salt Cheddar 695
cheese at 4, 10, and 21˚C. J. Dairy Sci. 94:4329-4335. 696
Non-TCS Cheeses, Supporting Document #1, 45 pages total
32
34. Shrestha, S., J.A. Grieder, D.J. McMahon, and B.A. Nummer. 2011. Survival of Salmonella 697
Serovars introduced as a post-aging contaminant during storage of low-salt Cheddar cheese 698
at 4, 10, and 21˚C. J. Food Sci 76:616-621. 699
35. Stratford, M., and T. Eklund. 2003. Organic acids and esters, p. 48-76. In N.J. Rusell and 700
G.W. Gould (eds.) Food preservatives. 2nd ed. Kluwer Academic/Plenum Publishers, New 701
York, NY. 702
36. Sutherland, J.P., A. J. Bayliss, and T. A. Roberts. 1994. Predictive modeling of growth of 703
Staphylococcus aureus: the effects of temperature, pH and sodium chloride. J. Food 704
Microbiol. 21: 217-236. 705
37. Taniguchi, M., H. Nakazawa, O. Takeda, T. Kaneko, K. Hoshino, and T. Tanaka. 1998. 706
Production of a mixture of antimicrobial organic acids from lactose by co-culture of 707
Bifidobacterium longum and Propionibacterium freudenreichii. Biosci. Biotechnol. Biochem. 708
62: 1522-1527. 709
38. Tapia, M.S., S. M. Alzamora, and Jorge Chirife. 2007. Effects of water activity (aw) on 710
microbial stability: as a hurdle in food preservation. In Water Activty in Foods: 711
Fundamentals and Applications. G. V. Barbosa-Canoas, A.J. Fontana, S.J. Schmidt, and T.P. 712
Labuza (eds). Blackwell Publishing and Institute of Food Technologists. Ames, Iowa. 713
39. Uhlich, G.A., J.B. Luchansky, M.L. Tamplin, F.J. Molina-Corral, S. Anandan, and A.C.S. 714
Porto-Fett. 2006. Effect of storage temperature on the growth of Listeria monocytogenes on 715
Queso Blanco slices. J. Food Safety 26: 202-214. 716
40. U.S. Food and Drug Administration. 2009. FDA Food Code 2009. Chapter 1. Purpose and 717
definitions. Available at: 718

Non-TCS Cheeses, Supporting Document #1, 45 pages total
33
http://www.fda.gov/Food/GuidanceRegulation/RetailFoodProtection/FoodCode/ucm186464.719
htm Accessed 12 November 2013. 720
41. U.S. Food and Drug Administration. 2012. Bad bug book: Handbook of foodborne 721
pathogenic microorganisms and natural toxins. 2nd ed. Available at: 722
http://www.fda.gov/Food/FoodborneIllnessContaminants/CausesOfIllnessBadBugBook/ 723
Accessed 12 November 2013. 724
42. U.S. Food and Drug Administration. 2001. Bacteriological analytical manual. Chapter 12: 725
Staphylococcus aureus. . Available at: 726
http://www.fda.gov/Food/FoodScienceResearch/LaboratoryMethods/ucm071429.htm 727
Accessed 12 November 2013. 728
43. U.S. Food and Drug Administration. 2013. Cheese and related cheese products. 729
Requirements for specific standardized cheese and related products under the Federal Food, 730
Drug and Cosmetic Act. 21 Code of Federal Regulations 133. Available online: 731
http://www.accessdata.fda.gov/scripts/cdrh/cfdocs/cfcfr/CFRSearch.cfm?CFRPart=133 732
Accessed 12 November 2013. 733
44. U.S. Food and Drug Administration. 2013. Evaluation and definition of potentially hazardous 734
foods. Chapter 6. Microbiological challenge testing. Available at: 735
http://www.fda.gov/Food/FoodScienceResearch/SafePracticesforFoodProcesses/ucm094154.736
htm Accessed 12 November 2013. 737
45. U.S. Food and Drug Administration. 2013. FDA Food Code 2013. Available at: 738
http://www.fda.gov/food/guidanceregulation/retailfoodprotection/foodcode/ucm374275.htm 739
Accessed 12 November 2013. 740
Non-TCS Cheeses, Supporting Document #1, 45 pages total
34
46. Vora, P., A. Senecal, and D. Schaffner. 2003. Survival of Staphylococcus aureus ATCC 741
13565 in intermediate moisture foods is highly variable. Risk Analysis. 23:229-236 742
47. Woo, A.H., S. Kollodge, and R. C. Lindsay. 1984. Quantification of major free fatty acids in 743
several cheese varieties. J. Dairy Sci. 67:874-878. 744

Non-TCS Cheeses, Supporting Document #1, 45 pages total
35
Table 1. Composition of natural cheeses that did not support growth of L. monocytogenes, Salmonella spp., E. coli O157:H7, and S. 745
aureus and pathogen survival (Δlog CFU/g) during storage for 15-days at 25°C. 746
Cheesea Brand % Moistureb
% Saltc %SMPd pHf %TAg LAB counth Pathogen survival (Δlog CFU/g)i
awe 0 d 15 d 0 d 0 d 15 d LM SALM EC SA
Asiago (Young) 1 36.00 1.71 4.53 0.96 5.36 5.21 2.16 7.36 6.87 -2.05 -3.74 -2.12 -1.13 Asiago (Young) 1 38.63 1.83 4.52 0.96 5.12 5.01 2.82 7.79 7.40 -2.26 -2.12 -0.68 -1.07 Asiago (Aged) 10 38.84 0.96 2.41 0.97 5.15 4.98 1.78 6.22 7.16 -2.92 -2.79 -3.70 -3.53 Asiago (Aged) 10 43.30 1.94 4.29 0.97 5.09 5.06 2.02 6.02 6.94 -3.84 -3.63 -1.59 -2.67
Baby Swiss 5 38.36 0.61 1.57 0.98 5.77 6.28 -j 7.07 7.50 -0.71 -1.38 -1.98 -0.62 Baby Swiss 5 36.25 0.69 1.87 0.98 5.79 6.32 - 6.94 8.05 -0.67 -0.76 -0.75 -1.15 Baby Swiss 9 37.21 0.62 1.64 0.99 5.55 6.04 - 7.19 7.72 -1.00 -2.43 -1.27 -0.79 Baby Swiss 9 35.58 0.65 1.79 0.99 5.71 6.27 - 7.35 7.72 -0.39 -1.45 -0.61 -1.02
Brick 11 40.39 1.52 3.63 0.96 5.43 4.90 1.29 7.23 7.66 -0.40 -0.71 -0.38 -0.74 Brick 11 41.21 1.95 4.52 0.97 5.30 4.98 0.90 7.19 7.82 -0.32 -0.70 -0.40 -0.98 Brick 2 38.28 1.52 3.82 - 5.25 5.37 1.07 6.33 8.08 -0.09 -0.22 -0.42 -0.79
Cheddar (Mild) 3 37.34 1.57 4.04 0.96 5.09 5.00 1.89 7.41 6.78 -0.70 -0.88 -0.30 -0.43 Cheddar (Mild) 3 36.59 1.77 4.61 0.97 5.09 5.06 1.44 7.39 6.81 -0.76 -1.00 -0.80 -0.17
Cheddar (Reduced-Fat) 6 40.26 1.60 3.82 0.97 5.19 5.11 1.15 5.35 6.21 -0.13 -0.65 -0.43 -1.28 Cheddar (Reduced-Fat) 6 44.00 1.66 3.64 0.98 4.99 5.27 0.90 5.52 5.79 -0.69 -0.57 -0.55 -0.97
Cheddar (Sharp) 3 36.34 1.78 4.67 0.96 5.27 5.27 1.69 4.30 6.39 -0.35 -0.75 -0.96 -1.19 Cheddar (Sharp) 3 36.57 1.32 3.48 0.97 5.19 5.28 1.71 4.63 5.84 0.00 -1.03 -0.59 -1.34
Cheddar-Mozzarella 6 40.09 1.62 3.88 - 5.19 5.33 1.42 6.99 6.24 -0.09 -0.27 -0.31 -0.48 Colby 4 35.96 1.61 4.28 0.96 5.45 5.61 1.09 5.76 7.39 -0.39 -0.50 -0.21 -0.57 Colby 4 40.14 1.60 3.83 0.97 5.30 5.47 1.78 5.91 6.38 -0.11 -0.63 -0.24 -0.39
Colby Jack 5 36.13 1.42 3.78 0.96 5.17 5.10 1.26 7.19 7.19 -0.20 -0.97 -0.80 -0.46 Colby Jack 5 36.85 1.35 3.53 0.98 5.01 5.40 1.37 7.70 7.38 -0.44 -0.59 -0.08 -0.46
Colby Jack (Reduced-Fat) 6 43.96 1.64 3.60 0.97 5.29 5.00 1.09 5.79 7.68 0.02 -0.90 -0.76 -1.12 Colby Jack (Reduced-Fat) 6 46.00 1.76 3.69 0.97 5.08 5.11 1.39 4.52 6.91 -0.56 -0.74 -0.73 -1.05 Colby Jack (Reduced-Na) 6 36.30 1.26 3.35 0.97 5.11 5.03 1.48 4.52 6.91 -0.17 -0.46 -1.03 -1.09 Colby Jack (Reduced-Na) 6 36.45 1.13 3.01 0.98 5.09 5.17 0.89 4.12 5.40 -0.69 -0.96 -0.39 -0.64
Feta 3 57.10 2.35 3.95 0.99 4.29 4.60 2.80 4.80 6.57 -4.58 -4.71 -4.60 -2.93 Feta 3 57.64 1.72 2.90 0.98 4.38 4.53 2.86 3.30 3.40 -4.89 -4.94 -4.07 -4.74
Gouda 6 41.15 1.62 3.79 0.97 5.28 5.25 0.88 7.29 7.38 -0.51 -0.32 -0.23 -0.83

Non-TCS Cheeses, Supporting Document #1, 45 pages total
36
Gouda 6 41.08 1.39 3.27 0.97 5.30 5.28 1.24 7.40 7.48 -0.44 -0.46 -0.34 -0.79 Havarti 3 37.79 1.33 3.40 0.97 5.49 5.52 1.08 6.88 7.26 -0.25 -0.61 -0.21 -0.73 Havarti 3 38.17 1.20 3.05 0.98 5.34 5.59 0.66 6.88 7.20 -0.51 +0.21 k -0.29 +0.01k Havarti 6 41.32 1.27 2.98 - 5.11 5.26 1.40 8.28 7.75 -0.16 -0.61 -0.37 -0.70
Monterey Jack 5 45.10 1.87 3.98 0.98 5.15 5.20 2.41 8.08 8.16 -1.03 -0.91 -0.33 -0.37 Monterey Jack 5 35.45 1.64 4.42 0.97 5.08 5.11 2.28 8.06 7.98 -2.63 -1.17 -0.91 -0.66
Muenster 3 42.20 1.63 3.72 0.97 5.20 5.28 1.27 6.90 7.80 -0.49 -0.25 -0.24 0.00 Muenster 3 41.94 1.75 4.01 0.98 5.29 5.12 0.74 7.11 6.26 -0.10 -0.75 -0.45 -0.46 Parmesan 8 32.44 2.52 7.21 0.93 5.41 5.36 1.40 6.92 4.00 -0.88 -1.45 -1.25 -0.59 Parmesan 8 32.70 2.35 6.70 0.92 5.45 5.40 1.48 5.31 7.23 -1.51 -1.66 -1.86 -1.80
Pepper Jack 4 36.13 1.58 4.19 0.98 5.11 4.76 2.12 2.00 7.66 -0.85 -3.87 -0.81 -1.09 Pepper Jack 4 38.69 1.60 3.97 0.97 4.93 5.12 1.94 4.69 7.14 -2.86 -3.40 -3.25 -3.58 Pepper Jack 3 40.42 1.64 3.90 0.97 5.14 5.12 1.53 4.65 7.30 -2.39 -2.32 -2.10 -0.72 Pepper Jack 3 38.27 1.54 3.87 0.97 5.21 5.15 1.45 8.25 7.39 -0.62 -0.73 -0.35 -0.30 Provolone 4 42.15 1.38 3.17 - 5.24 4.97 1.81 7.70 8.70 -1.34 -0.97 -0.16 -0.72
Provolone (Mild) 8 43.05 2.08 4.61 - 5.18 5.22 1.80 5.53 6.70 -0.50 -1.84 -0.57 -0.71 Provolone (Sharp) 10 40.02 1.72 4.12 - 5.09 5.17 2.20 6.43 7.45 -1.59 -2.83 -1.27 -1.73
Provolone (Reduced-Fat) 3 48.98 1.43 2.84 0.97 4.97 4.67 1.83 6.95 7.98 -2.80 -2.23 -0.62 -1.55 Provolone (Reduced-Fat) 3 52.71 1.35 2.50 0.98 4.98 4.94 - 3.70 7.94 -0.56 -0.95 -0.24 -0.97
Provolone-Mozzarella 6 42.26 1.68 3.82 - 5.38 5.33 1.61 7.67 7.28 -0.25 -0.19 -0.17 -0.68 Swiss 6 38.57 0.52 1.33 0.98 5.36 5.50 - 5.95 6.59 -1.20 -1.11 -0.73 -2.32 Swiss 6 36.91 0.64 1.70 0.99 5.50 5.80 - 5.28 6.19 -0.93 -1.30 -0.36 -1.20
Swiss (Lacey) 5 45.17 0.33 0.73 0.99 6.02 5.87 - 7.00 8.18 -0.43 -1.19 -0.46 -1.02 Swiss (Lacey) 5 45.92 0.37 0.80 0.99 5.65 5.94 - 7.92 5.70 -1.83 -1.21 -0.31 -1.06
747
a Cheeses were national brands obtained from local retail outlets or directly from manufacturers. Qualifying descriptive information, e.g. ‘mild,’ 748
‘sharp’ is reproduced where provided on the package. 749
bMoisture content (%) of cheese sample on Day 0, n=2. 750
c % salt of cheese sample on Day 0, n=2. 751
d % salt-in-moisture phase (%SMP) of cheese sample on Day 0. Calculated from % moisture and % salt of the same cheese. 752
Non-TCS Cheeses, Supporting Document #1, 45 pages total
37
e Water activity (aw) of cheese sample on Day 0. 753
f pH of cheese slice surface on Day 0 and Day 15, n=2. 754
g % titratable acidity (%TA) of cheese sample on Day 0 and Day 15, n=2. 755
h DeMan-Rogosa-Sharpe (MRS) agar count for lactic acid bacteria (LAB) on Day 0 and Day 15 (log CFU/g), n=2. 756
i Survival of pathogen LM=L. monocytogenes, SALM=Salmonella spp., EC=E. coli O157:H7, and SA=S. aureus. (+) indicates 757
growth, (-) indicates no-growth. 758
j not determined. 759
k Growth of pathogen did not exceed plating variability: 0.39, 0.41, 0.27, 0.25 log CFU/g for L. monocytogenes, Salmonella spp., E. 760
coli O157:H7and S. aureus, respectively. 761
Non-TCS Cheeses, Supporting Document #1, 45 pages total
38
762
Cheesea Brand % Moistureb
% Saltc
% SMPd aw
e pHf % TAg LAB counth Pathogen survival (Δlog CFU/g)i
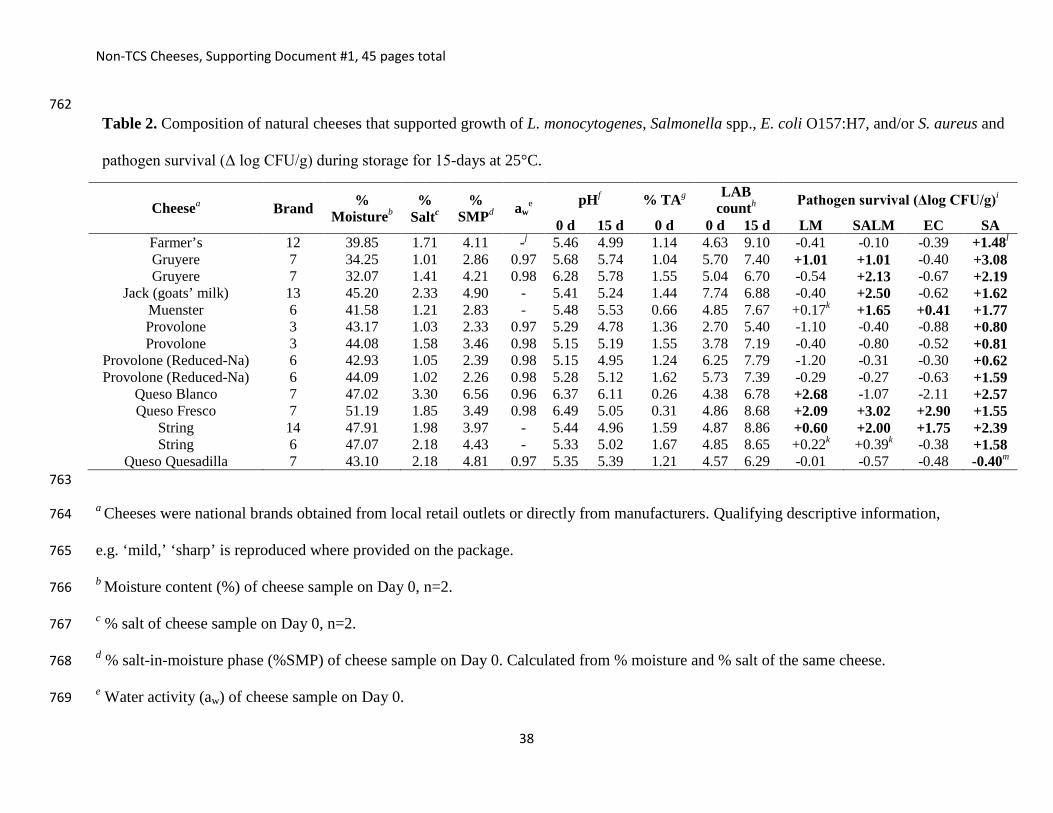
0 d 15 d 0 d 0 d 15 d LM SALM EC SA Farmer’s 12 39.85 1.71 4.11 -j 5.46 4.99 1.14 4.63 9.10 -0.41 -0.10 -0.39 +1.48l
Gruyere 7 34.25 1.01 2.86 0.97 5.68 5.74 1.04 5.70 7.40 +1.01 +1.01 -0.40 +3.08 Gruyere 7 32.07 1.41 4.21 0.98 6.28 5.78 1.55 5.04 6.70 -0.54 +2.13 -0.67 +2.19
Jack (goats’ milk) 13 45.20 2.33 4.90 - 5.41 5.24 1.44 7.74 6.88 -0.40 +2.50 -0.62 +1.62 Muenster 6 41.58 1.21 2.83 - 5.48 5.53 0.66 4.85 7.67 +0.17k +1.65 +0.41 +1.77 Provolone 3 43.17 1.03 2.33 0.97 5.29 4.78 1.36 2.70 5.40 -1.10 -0.40 -0.88 +0.80 Provolone 3 44.08 1.58 3.46 0.98 5.15 5.19 1.55 3.78 7.19 -0.40 -0.80 -0.52 +0.81
Provolone (Reduced-Na) 6 42.93 1.05 2.39 0.98 5.15 4.95 1.24 6.25 7.79 -1.20 -0.31 -0.30 +0.62 Provolone (Reduced-Na) 6 44.09 1.02 2.26 0.98 5.28 5.12 1.62 5.73 7.39 -0.29 -0.27 -0.63 +1.59
Queso Blanco 7 47.02 3.30 6.56 0.96 6.37 6.11 0.26 4.38 6.78 +2.68 -1.07 -2.11 +2.57 Queso Fresco 7 51.19 1.85 3.49 0.98 6.49 5.05 0.31 4.86 8.68 +2.09 +3.02 +2.90 +1.55
String 14 47.91 1.98 3.97 - 5.44 4.96 1.59 4.87 8.86 +0.60 +2.00 +1.75 +2.39 String 6 47.07 2.18 4.43 - 5.33 5.02 1.67 4.85 8.65 +0.22k +0.39k -0.38 +1.58
Queso Quesadilla 7 43.10 2.18 4.81 0.97 5.35 5.39 1.21 4.57 6.29 -0.01 -0.57 -0.48 -0.40m
763
a Cheeses were national brands obtained from local retail outlets or directly from manufacturers. Qualifying descriptive information, 764
e.g. ‘mild,’ ‘sharp’ is reproduced where provided on the package. 765
b Moisture content (%) of cheese sample on Day 0, n=2. 766
c % salt of cheese sample on Day 0, n=2. 767
d % salt-in-moisture phase (%SMP) of cheese sample on Day 0. Calculated from % moisture and % salt of the same cheese. 768
e Water activity (aw) of cheese sample on Day 0. 769
Table 2. Composition of natural cheeses that supported growth of L. monocytogenes, Salmonella spp., E. coli O157:H7, and/or S. aureus and
pathogen survival (Δ log CFU/g) during storage for 15-days at 25°C.

Non-TCS Cheeses, Supporting Document #1, 45 pages total
39
f pH of cheese slice surface on Day 0 and Day 15, n=2. 770
g % titratable acidity (%TA) of cheese sample on Day 0 and Day 15, n=2. 771
h DeMan-Rogosa-Sharpe (MRS) agar count for lactic acid bacteria (LAB) on Day 0 and Day 15 (log CFU/g), n=2. 772
i Survival of pathogen LM=L. monocytogenes, SALM=Salmonella spp., EC=E. coli O157:H7, and SA=S. aureus. (+) indicates 773 growth, (-) indicates no-growth. 774
j not determined. 775
k Growth of pathogen did not exceed plating variability: 0.39, 0.41, 0.27, 0.25 log CFU/g for L. monocytogenes, Salmonella spp., E. 776 coli O157:H7 and S. aureus, respectively 777
l Bolded numbers indicate growth beyond the pathogen-plating variability. 778
m Growth (+ 0.57 log CFU/g) at Day 6 sampling; no net growth over 15-day storage period779

Non-TCS Cheeses, Supporting Document #1, 45 pages total
40
Table 3. Pathogen strains used in laboratory cheese challenge studies. 780
781
aStrain designation provided by Collection. 782
bCollection: FRI = Food Research Institute, University of Wisconsin-Madison, Madison, Wisc.; 783
ATCC = American Type Culture Collection, Manassas, Va.; FSL = Food Safety Laboratory, Dr. 784
Katherine Boor, Cornell University, Ithaca, N.Y.; NMDH = New Mexico Department of Health, 785
Santa Fe, N.M.; VT = Vermont Institute for Artisan Cheese, Dr. D.J. D’Amico, University of 786
Vermont, Burlington, Vt.; FPL= Food Pathogen Laboratory, Dr. Barbara Ingham, University of 787
Wisconsin-Madison, Madison, Wisc. 788
Inoculum Serotype Straina Collectionb Sourcec
Listeria monocytogenes
4b LM 101 FRI Hard salami 4b LM 310 FRI Goat cheese 4b ATCC 43256 ATCC Mexican-style cheese, Calif. (1985 outbreak strain) 4b ATCC 43257 ATCC Mexican-style cheese, Calif. (1985 outbreak strain) 4b ATCC 51414 ATCC Raw milk, Massachusetts 4b ATCC 51776 ATCC Cheese, Belgium 4b ATCC 51777 ATCC Cheese, Belgium 4b ATCC 51778 ATCC Cheese, Belgium 4b Scott A FRI Clinical 1/2a V7 FRI Raw milk
Salmonella spp. Cerro FSL R8-370 FSL Bovine Typhimurium FSL S5-433 FSL Bovine Newport FSL S5-436 FSL Bovine Agona FSL S5-517 FSL Human Typhimurium FSL S5-536 FSL Human Newport FSL S5-639 FSL Human
Escherichia coli O157:H7
O157:H7 FRIK 22 FRI Unknown O157:H7 FRIK 2000 FRI Bovine O157:H7 F5854 FRI Cheese curds (1998 outbreak strain) O157:H7 039732 NMDH Gouda cheese (2010 outbreak strain) O157:H7 CWD EC1 VT Farmstead goat cheese
Staphylococcus aureus
I FPL Raw milk J FPL Raw milk FRI 100 FRI Cake FRI 1007 FRI Genoa sausage ATCC 25923 ATCC Clinical

Non-TCS Cheeses, Supporting Document #1, 45 pages total
41
c Source provided by Collection. 789
790
791
792
793
794
795
796
797
798
799
800
801
802
803
804
805
806

Non-TCS Cheeses, Supporting Document #1, 45 pages total
42
Table 4. Data from published research selected to augment laboratory product assessment. 807
a pH values of cheeses at initial sampling point of experiment 808
Reference Pathogen No. of strains Cheese Storage
(days) Temp (˚C) pHa %SMPb aw Growth/Deathc
31 Salmonella 9 Queso Fresco -d 20 6.60 1.64 - LTe:2.5 - 3.5h GT: 1.65 - 2.17 h
30 E. coli O157:H7 2 Queso Fresco - 20 6.60 1.61 - LT: 3 - 3.45 h
GT: 2.33 - 2.56 h
42 L. monocytogenes 5 Cheddar 30 21
5.06 1.70 0.98 -1.11 5.30 1.80 0.97 -0.48 5.66 5.00 0.95 -0.14 5.28 4.80 0.95 -0.96
43 Salmonella spp. 5 Cheddar 30 2 1
5.06 1.70 0.98 -3.2 5.30 1.80 0.97 -3.9 5.66 5.00 0.95 -3.8 5.28 4.80 0.95 -3.5
48 L. monocytogenes 5 Queso Blanco 6.25 25 6.80 4.53 0.97 > 5.00
17 L. monocytogenes 5
Queso Fresco 3 30 6.60 6.60 - +0.39 Queso Fresco 6 30 6.60 4.50 - +0.95 Queso Fresco 3 30 6.50 6.15 - +0.74
Queso Ranchero 1 30 6.20 4.10 - +2.60
Queso Panela 3 30 6.20 2.50 - +1.81 Queso Panela 1 30 6.70 3.95 - +3.18 Queso Panela 3 30 6.60 3.48 - +0.79
Cotija 8 30 5.60 9.60 - > -2.00 Cotija 6 30 5.50 12.50 - > -2.00
Monterey Jack 4 30 5.00 3.00 - > -1.40 Monterey Jack 13 30 5.20 2.72 - > - 2.09 Mild Cheddar 4 30 4.90 2.60 - > -1.26 Mild Cheddar 7 30 5.20 4.49 - > -2.09
Colby 9 30 5.50 4.93 - > -2.36 String Cheese 9 30 5.50 4.24 - > -2.36
Provolone 9 30 5.60 4.62 - > -2.36 Muenster 9 30 5.50 3.80 - > -2.36
Domestic Feta 4 30 4.30 7.50 - > -2.04 Domestic Feta 4 30 4.30 2.20 - > -2.04

Non-TCS Cheeses, Supporting Document #1, 45 pages total
43
b Certain publications stated %SMP as % brine, which was calculated using the same equation as 809
in this study (Equation 1). For publications that included both %moisture and % salt, % SMP 810
was calculated using Equation 1. 811
c Behavior of pathogen over storage, expressed as ∆log CFU/g or LT/GT. 812
d Not specified. 813
e LT: Lag time (h); GT: generation time (h). 814
815
816
817
818
819
820
821
822
823
824
825
826
827
828
829
830
Non-TCS Cheeses, Supporting Document #1, 45 pages total
44
Figure legend. 831
Figure 1. Growth (Δ) or No-Growth (x) of Listeria monocytogenes, Salmonella spp., 832
Escherichia coli O157:H7, and Staphylococcus aureus on cheeses stored at 20-30˚C based on 833
cheese pH (Day 0) and %SMP (salt-in-moisture-phase). Data from published research (n=26; 834
Table 4) and this study (n=55). Solid line represents the growth/no-growth interface (P=0.05). 835
836
837
838
839
840
841
842
843
844
845

Non-TCS Cheeses, Supporting Document #1, 45 pages total
45
846
847
848
849