little creek naval amphibious base chesapeake bay … · 2020-04-09 · little creek naval...
TRANSCRIPT
LITTLE CREEK NAVALAMPHIBIOUS BASECHESAPEAKE BAY
SHORELINE
PART 1Shoreline ManagementPlan Update - 2002
Shoreline Studies ProgramVirginia Institute of Marine ScienceCollege of William & MaryGloucester Point ,Virginia 2005
PART 2Beach and Dune Impactsof the Proposed ShorelineManagement Plan - 2004
LITTLE CREEK NAVAL AMPHIBIOUS BASECHESAPEAKE BAY SHORELINE
Shoreline Management Plan Update - 2002
By
C. Scott Hardaway, Jr.Donna A. MilliganGeorge R. Thomas
Linda M. Meneghini
For
U.S. Army Corps of EngineersNorfolk District
Norfolk, Virginia
&
U.S. NavyLittle Creek NAB

1-i
TABLE OF CONTENTS
Table of Contents . . . . . . . . . . . . . . . . . . . . . . . . . . . . . . . . . . . . . . . . . . . . . . . . . . . . . . . . . . . . 1-i
List of Figures . . . . . . . . . . . . . . . . . . . . . . . . . . . . . . . . . . . . . . . . . . . . . . . . . . . . . . . . . . . . . . 1-ii
List of Tables . . . . . . . . . . . . . . . . . . . . . . . . . . . . . . . . . . . . . . . . . . . . . . . . . . . . . . . . . . . . . . 1-iv
I Introduction . . . . . . . . . . . . . . . . . . . . . . . . . . . . . . . . . . . . . . . . . . . . . . . . . . . . . . . . . . 1-1A. Purpose . . . . . . . . . . . . . . . . . . . . . . . . . . . . . . . . . . . . . . . . . . . . . . . . . . . . . . . . 1-1B. Background . . . . . . . . . . . . . . . . . . . . . . . . . . . . . . . . . . . . . . . . . . . . . . . . . . . . 1-1
II Original Plan Summary . . . . . . . . . . . . . . . . . . . . . . . . . . . . . . . . . . . . . . . . . . . . . . . . . 1-2A. Coastal Setting . . . . . . . . . . . . . . . . . . . . . . . . . . . . . . . . . . . . . . . . . . . . . . . . . . 1-2B. Physical Setting Summary . . . . . . . . . . . . . . . . . . . . . . . . . . . . . . . . . . . . . . . . . 1-2C. Shoreline Management Strategies . . . . . . . . . . . . . . . . . . . . . . . . . . . . . . . . . . . 1-4D. Plan Summary . . . . . . . . . . . . . . . . . . . . . . . . . . . . . . . . . . . . . . . . . . . . . . . . . . 1-4
III Approach and Methodology for Plan Update . . . . . . . . . . . . . . . . . . . . . . . . . . . . . . . . 1-6A. Limits of the Study Area . . . . . . . . . . . . . . . . . . . . . . . . . . . . . . . . . . . . . . . . . . 1-6B. Data Preparation and Surveys . . . . . . . . . . . . . . . . . . . . . . . . . . . . . . . . . . . . . . 1-6
IV Results . . . . . . . . . . . . . . . . . . . . . . . . . . . . . . . . . . . . . . . . . . . . . . . . . . . . . . . . . . . . . . 1-8A. Beach Profiles . . . . . . . . . . . . . . . . . . . . . . . . . . . . . . . . . . . . . . . . . . . . . . . . . . 1-8B. Shore Modeling . . . . . . . . . . . . . . . . . . . . . . . . . . . . . . . . . . . . . . . . . . . . . . . . . 1-8C. Management Plan Update . . . . . . . . . . . . . . . . . . . . . . . . . . . . . . . . . . . . . . . . . 1-9
V Discussion and Recommendations . . . . . . . . . . . . . . . . . . . . . . . . . . . . . . . . . . . . . . . 1-10
VI References . . . . . . . . . . . . . . . . . . . . . . . . . . . . . . . . . . . . . . . . . . . . . . . . . . . . . . . . . . 1-11

1-ii
LIST OF FIGURES
Figure 1. Study site location with 2002 aerial imagery showing Little Creek NAB’sshoreline. Shoreline aerial imagery copyrighted 2002 Commonwealth of Virginia. . . . . . . . . . . . . . . . . . . . . . . . . . . . . . . . . . . . . . . . . . . . . . . . . . . . . 1-13
Figure 2. Aerial photo showing the breakwater project at the Officer’s Beachand the entire Little Creek Shore. . . . . . . . . . . . . . . . . . . . . . . . . . . . . . . . . . . 1-14
Figure 3. Non-rectified 1976 aerial photo showing MHW positions in 1852, 1949, 1958, 1971, and 1974 by Hardaway et al. (1997). . . . . . . . . . . . . . . . . . 1-15
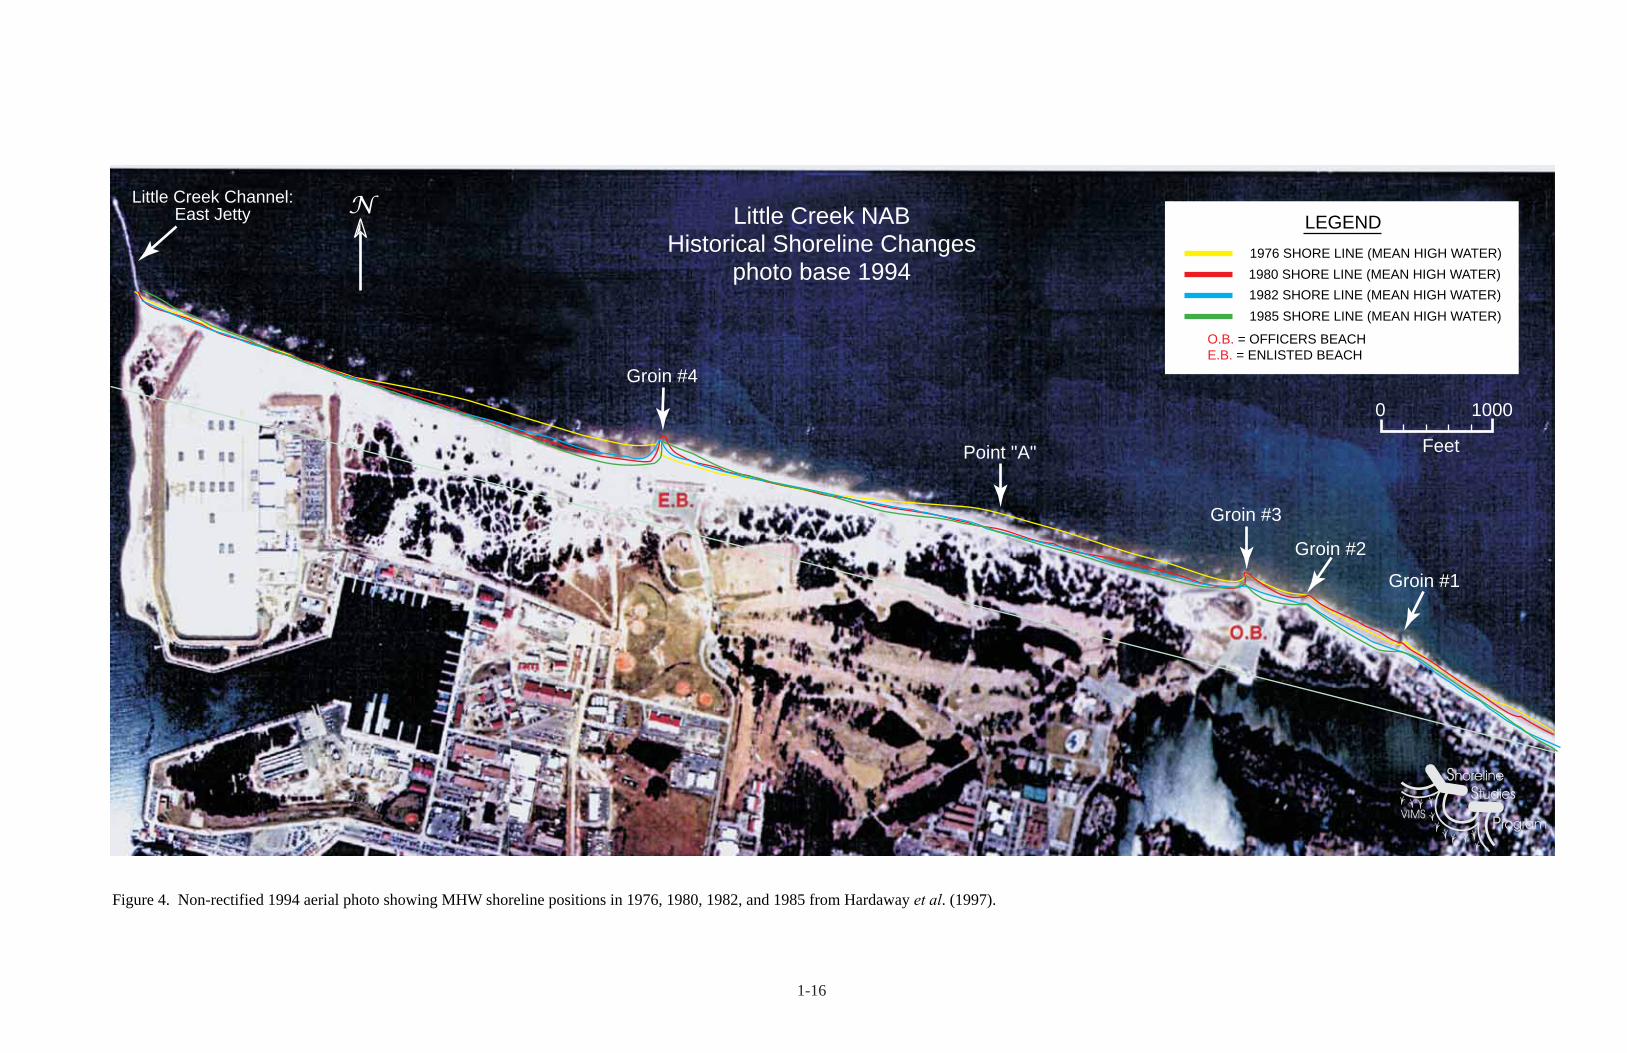
Figure 4. Non-rectified 1994 aerial photo showing MHW positions in 1976, 1980, 1982, and 1985 by Hardaway et al. (1997). . . . . . . . . . . . . . . . . . . . . . . 1-16
Figure 5. Non-rectified aerial photography showing the structural components of theshoreline management plan as shown by Hardaway et al. (1997). . . . . . . . . . 1-17
Figure 6. Non-rectified aerial photography showing the location of beach cross-sectionalprofiles taken at Little Creak in 1996 and 2002. . . . . . . . . . . . . . . . . . . . . . . . 1-18
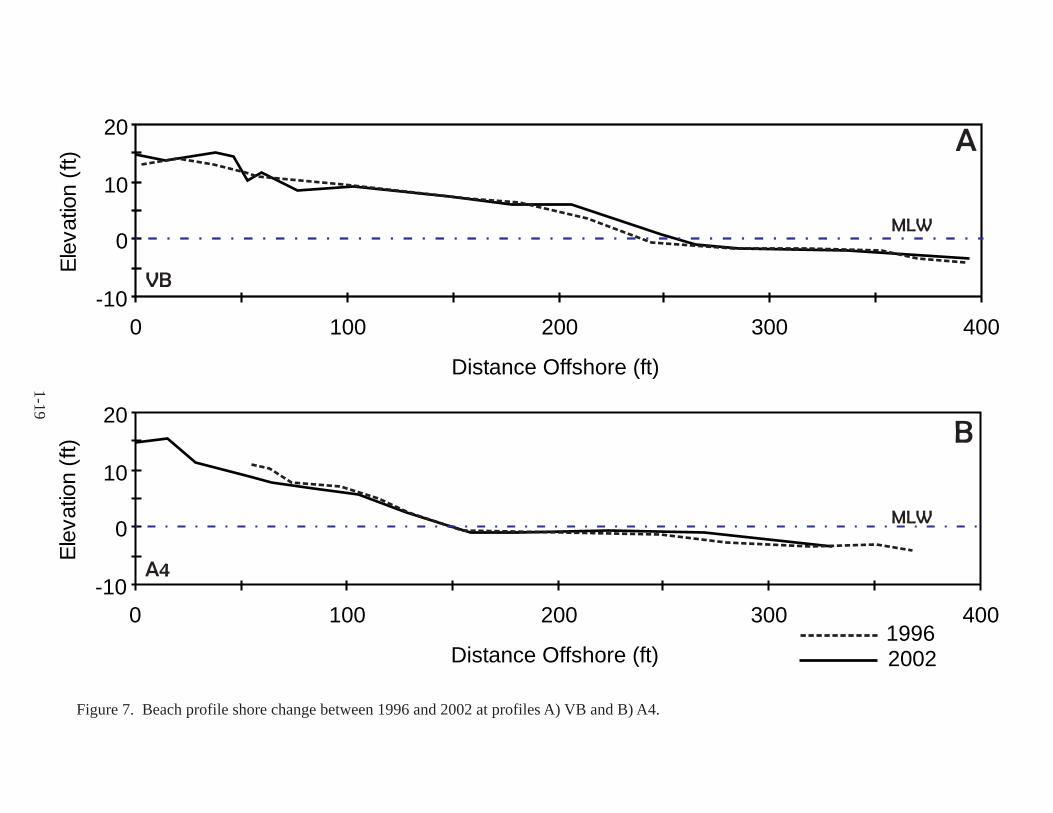
Figure 7. Beach profile shoreline change between 1996 and 2002 at profile A) VB and B) A4. . . . . . . . . . . . . . . . . . . . . . . . . . . . . . . . . . . . . . . . . . . . . . . 1-19
Figure 7. Beach profile shoreline change between 1996 and 2002 at profile C) A and D) AP. . . . . . . . . . . . . . . . . . . . . . . . . . . . . . . . . . . . . . . . . . . . . . . . . 1-20
Figure 7. Beach profile shoreline change between 1996 and 2002 at profile E) A3 and F) A2. . . . . . . . . . . . . . . . . . . . . . . . . . . . . . . . . . . . . . . . . . . . . . . . 1-21
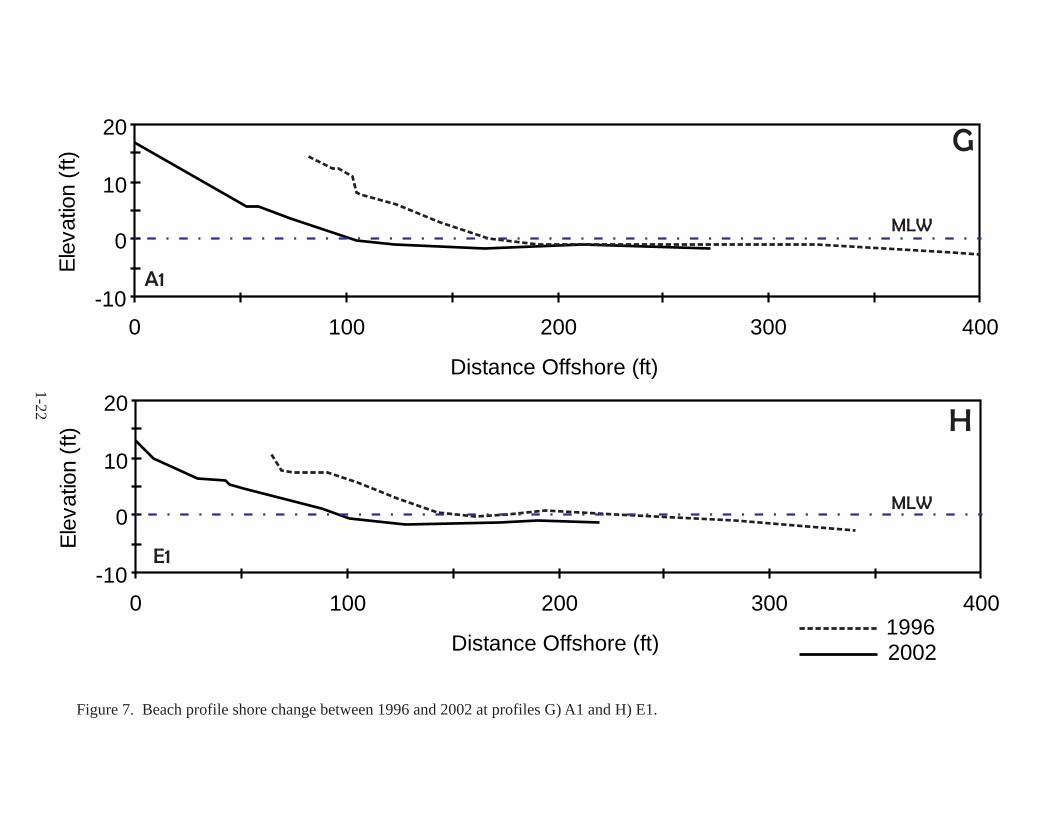
Figure 7. Beach profile shoreline change between 1996 and 2002 at profile G) A1 and H) E1. . . . . . . . . . . . . . . . . . . . . . . . . . . . . . . . . . . . . . . . . . . . . . . . 1-22
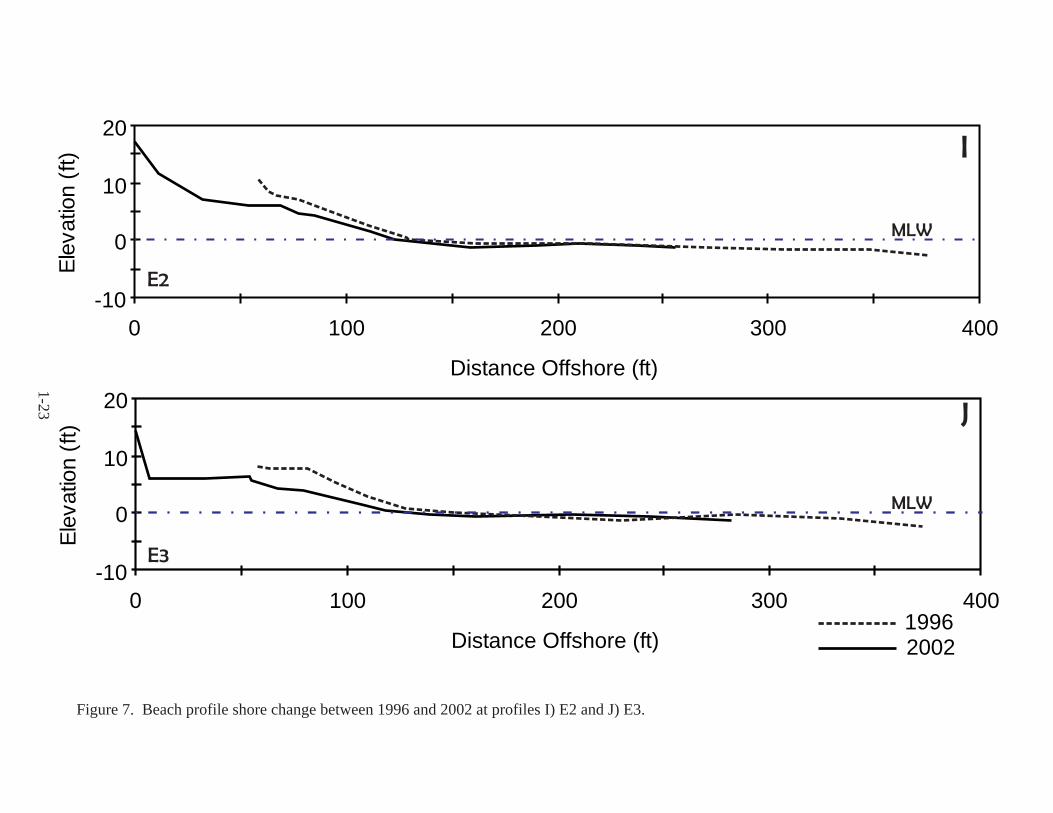
Figure 7. Beach profile shoreline change between 1996 and 2002 at profile I) E2 and J) E3. . . . . . . . . . . . . . . . . . . . . . . . . . . . . . . . . . . . . . . . . . . . . . . . . 1-23
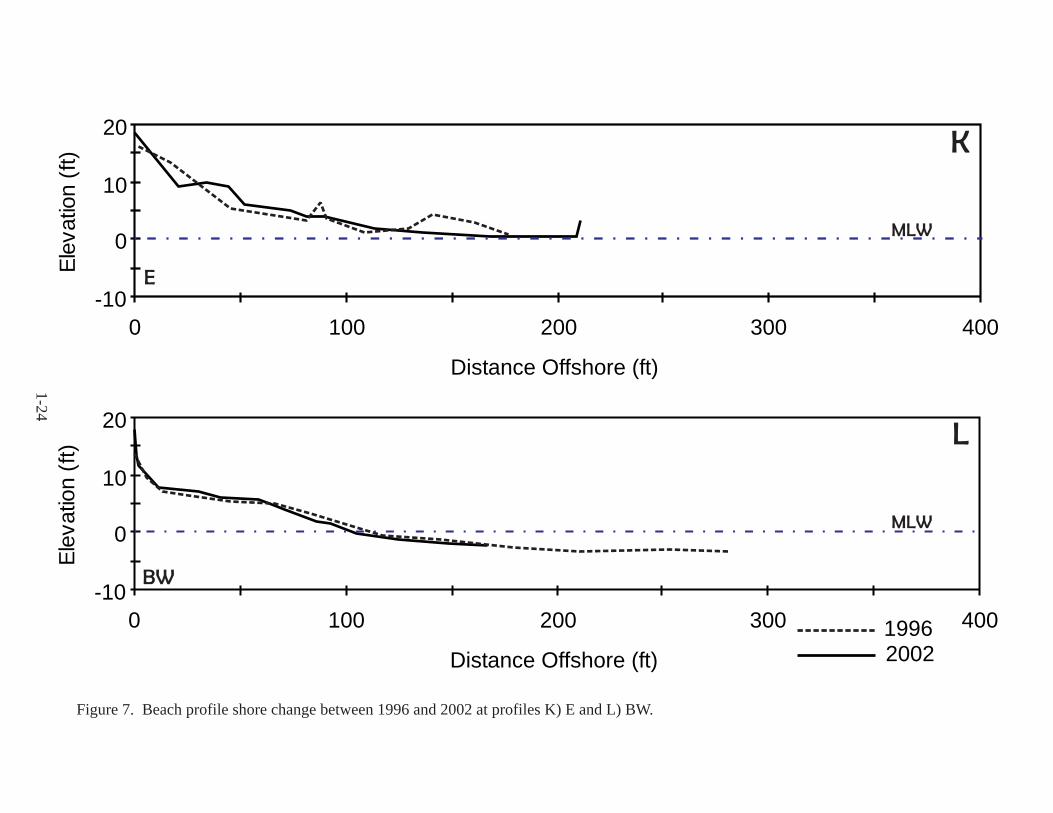
Figure 7. Beach profile shoreline change between 1996 and 2002 at profile K) E and L) BW. . . . . . . . . . . . . . . . . . . . . . . . . . . . . . . . . . . . . . . . . . . . . . . . 1-24
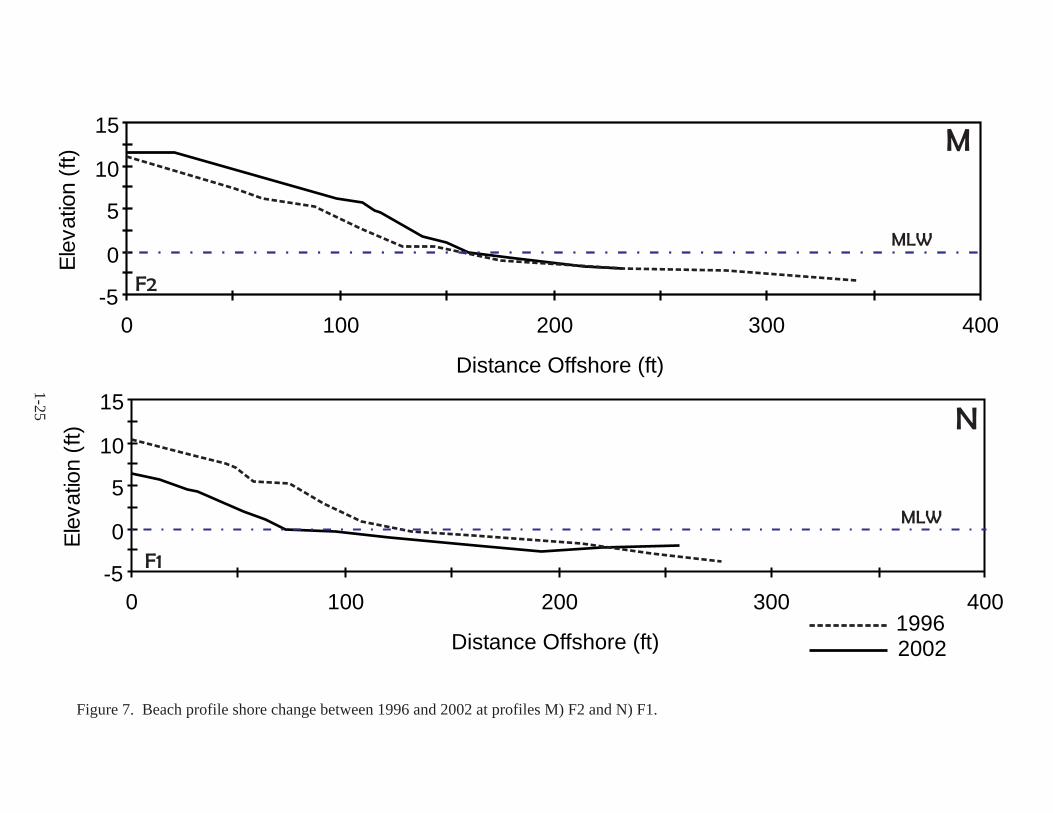
Figure 7. Beach profile shoreline change between 1996 and 2002 at profile M) F2 and N) F1. . . . . . . . . . . . . . . . . . . . . . . . . . . . . . . . . . . . . . . . . . . . . . . . 1-25
Figure 7. Beach profile shoreline change between 1996 and 2002 at profile O) E4 and P) D2. . . . . . . . . . . . . . . . . . . . . . . . . . . . . . . . . . . . . . . . . . . . . . . . 1-26

1-iii
Figure 7. Beach profile shoreline change between 1996 and 2002 at profile Q) D1. . . . 1-27
Figure 8. GENESIS results from the A) original management plan and B) the updated 2002 management plan. . . . . . . . . . . . . . . . . . . . . . . . . . . . . . . . . . . . 1-28
Figure 9. Shoreline Management Plan suggested structures for Little Creek NAB’s shoreline. . . . . . . . . . . . . . . . . . . . . . . . . . . . . . . . . . . . . . . . . . . . . . . . 1-29

1-iv
LIST OF TABLES
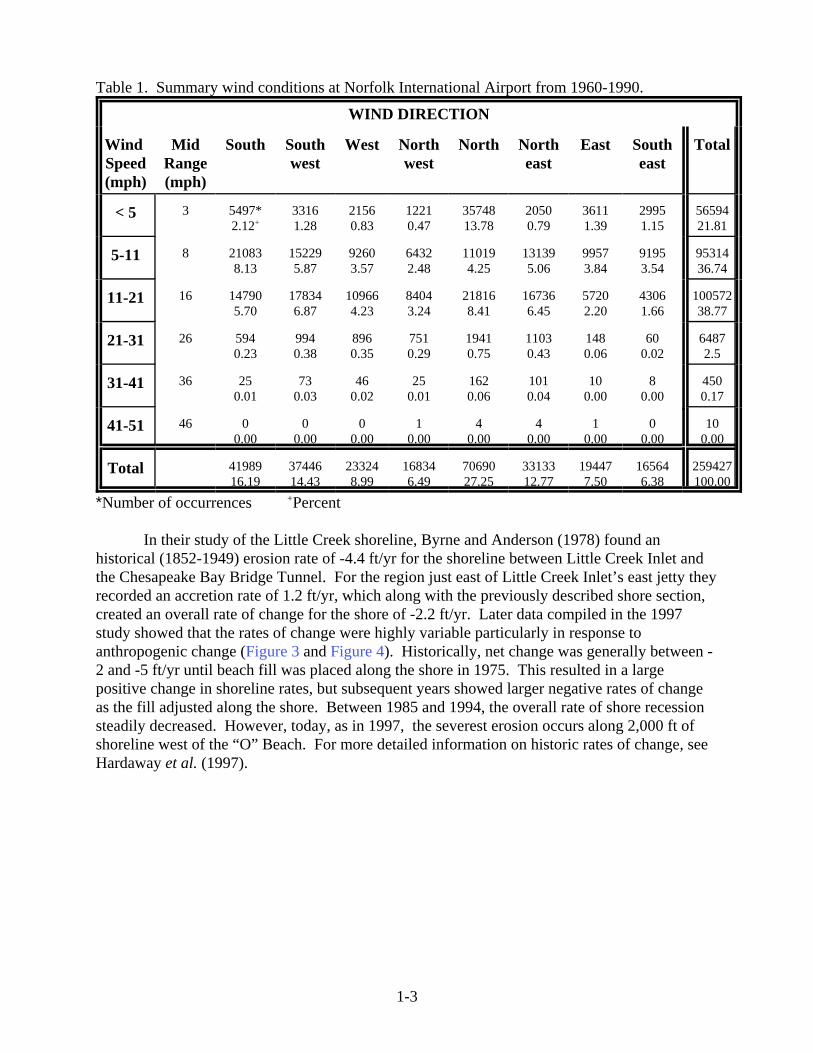
Table 1. Norfolk International Airport wind data summary. . . . . . . . . . . . . . . . . . . . . . . 1-3
Table 2. Location of Little Creek profiles and control benchmark positions. . . . . . . . . . 1-7

1-1
I. Introduction
A. Purpose
Little Creek Naval Amphibious Base (NAB) is located in Virginia Beach, Virginia. It’sshoreline along the southern Chesapeake Bay extends from Little Creek Inlet eastwardapproximately 1.5 miles to the NAB’s eastern boundary. In 1997, a study and report entitled“LITTLE CREEK NAVAL AMPHIBIOUS BASE, CHESAPEAKE BAY SHORELINE,SHORELINE MANAGEMENT PLAN and OFFICER’S BEACH SHORE PROTECTIONEVALUATION” was produced by VIMS’s Shoreline Studies Program (Hardaway et al., 1997). The purpose of that report was to assess the rates and patterns of beach change along theChesapeake Bay shoreline at Little Creek NAB in order to develop a shoreline management plan,particularly for the Officer’s Beach (“O” Beach). Field surveys, historical aerial imagery,empirical models and computer models were used to address these objectives. Planrecommendations resulted in the construction of a headland breakwater system and revetments atthe “O” Beach as well as a series of proposed breakwaters along the length of the Little CreekNAB coast.
The purposes of the current effort is to update the Hardaway et al. (1997) study and todetermine if additional management strategies should be implemented. Elements of the previousreport will be presented to provide a background perspective and to bring the reader up-to-date. Generally, the shoreline subreach just west of the “O” Beach has continued to erode from theexisting revetment westward toward the Enlisted Beach (“E” Beach). This trend was prevalentprior to 1997 and was predicted to continue in the previous study. The question is how long willthis trend continue and what impact will it have on the Base’s shoreline, particularly the Bay-fronting primary dune system which is eroding along much of the coast? In addition, this studyshould determine the net impacts of the breakwater installation at the “O” Beach and it willprovide a framework for the next step in the shore management of the reach.
B. Background
The Little Creek NAB shoreline resides in a larger reach of shore that extends from CapeHenry westward to Willoughby Spit (Figure 1). Specifically, Little Creek NAB lies within adiscreet subreach that is bounded by Lynnhaven Inlet on the east and Little Creek Inlet and itsassociated jetties on the west. Impacts to this reach include the creation and maintenance ofLittle Creek Inlet, maintenance dredging of Lynnhaven, periodic beach nourishment within thesubreach from material related to dredging of both inlets, and the installation of groins andbreakwaters on the Bay shoreline of Little Creek NAB.
At the “O” Beach, breakwaters and revetments were installed in 1998 (Figure 2). Thesestructures were designed to maintain a beach at the “O” Beach yet allow some transport in theirlee and along the outer boundary. This is often a difficult practice, and potential impacts to theimmediate downdrift coast were expected.

1-2
II. Original Plan Summary
A. Coastal Setting
Wind data analysis for resultant wave conditions showed that the onshore wave climatealong the southern shore of the Chesapeake Bay is characterized by low to medium wave energy;the waves are directed from the northern sector often at an angle of approximately 10o to 30o tothe coast. Thirty years of wind data (1960-1990) at Norfolk International Airport (Table 1)showed that, for those components impacting the Little Creek NAB shore, the northerly andnortheasterly directions are dominant. This analysis did not account for swell or shelf-originating wind waves that impact NAB (Hardaway et al., 1997).
The mean tide range at Little Creek NAB is 2.7 feet with a spring tide range of 3.2 feet. Tidal currents acting along the southern shorelines of Chesapeake Bay were evaluated byLudwick (1987), Das (1974), and Fleischer et al. (1977). Each study indicates that sedimenttransport along the nearshore region, including the area off Little Creek, is influenced by tidalcurrents. Fleischer et al. (1977) concluded that current velocities and bottom sediment erosionand transport tend to increase, from Little Creek westward toward Willoughby Spit, as thecurrent floods. Ebb flow tends to spread out as it leaves Hampton Roads thus losing velocity andcompetence. Therefore, along the Little Creek shoreline, flooding mean tidal currents add aslightly westward component to the overall littoral drift system.
The historical occurrence of storm-related high water levels was determined by the U.S.Army Corps of Engineers as they have listed the annual maximum elevation of water surfaceeach year since 1928 for a gage at Fort Norfolk (U.S. Army Corps of Engineers, 1983). Theestimated 10 year, 20 year, and 50 year storm water elevation at MSL are 5.7 ft, 6.5 ft, and 7.5 ft,respectively. Boon et al. (1978) statistically determined storm surge frequency for bothextratropical and tropical storm events. From their report, it was determined that in the HamptonRoads area, the storm surge levels above MSL for 10 year, 25 year, 50 year and 100 year eventsare 4.5 ft, 4.8 ft, 5.5 ft, and 6.1 ft, respectively. An obvious discrepancy exists between the twodata sources due to differences in their calculation methods. In reality, true storm surgesprobably lie somewhere between the two data sources but neither can be discounted in anycalculations for which storm surge is used.
B. Physical Setting Summary
The physical setting of Little Creek shoreline has been influenced by a variety of man-made activities that, along with an active wave climate and consequent littoral processes, havemade significant impacts on shore change. The net direction of littoral, or sand transport, in thesubreach, is to the west with a minor reversal just west of Lynnhaven Inlet. Maintenancedredging of Lynnhaven Inlet has occurred over the years, along with the occasional placement ofsandy dredge material along the Ocean Park shoreline where it is subsequently transportedwestward and offshore. These dredge deposits have undoubtably worked their way toward theBase shoreline as part of the overall littoral transport system. The Little Creek channel, jetties,and groins have all acted to modify the natural littoral processes which has brought the shoremorphology to its present state where significant erosion occurs along the eastern third of LittleCreek’s shoreline.
1-3
Table 1. Summary wind conditions at Norfolk International Airport from 1960-1990.
WIND DIRECTION
Wind Speed(mph)
MidRange(mph)
South Southwest
West Northwest
North Northeast
East Southeast
Total
< 5 3 5497*2.12+
33161.28
21560.83
12210.47
3574813.78
20500.79
36111.39
29951.15
5659421.81
5-11 8 210838.13
152295.87
92603.57
64322.48
110194.25
131395.06
99573.84
91953.54
9531436.74
11-21 16 147905.70
178346.87
109664.23
84043.24
218168.41
167366.45
57202.20
43061.66
10057238.77
21-31 26 5940.23
9940.38
8960.35
7510.29
19410.75
11030.43
1480.06
600.02
64872.5
31-41 36 250.01
730.03
460.02
250.01
1620.06
1010.04
100.00
80.00
4500.17
41-51 46 00.00
00.00
00.00
10.00
40.00
40.00
10.00
00.00
100.00
Total 4198916.19
3744614.43
233248.99
168346.49
7069027.25
3313312.77
194477.50
165646.38
259427100.00
*Number of occurrences +Percent
In their study of the Little Creek shoreline, Byrne and Anderson (1978) found anhistorical (1852-1949) erosion rate of -4.4 ft/yr for the shoreline between Little Creek Inlet andthe Chesapeake Bay Bridge Tunnel. For the region just east of Little Creek Inlet’s east jetty theyrecorded an accretion rate of 1.2 ft/yr, which along with the previously described shore section,created an overall rate of change for the shore of -2.2 ft/yr. Later data compiled in the 1997study showed that the rates of change were highly variable particularly in response toanthropogenic change (Figure 3 and Figure 4). Historically, net change was generally between -2 and -5 ft/yr until beach fill was placed along the shore in 1975. This resulted in a largepositive change in shoreline rates, but subsequent years showed larger negative rates of changeas the fill adjusted along the shore. Between 1985 and 1994, the overall rate of shore recessionsteadily decreased. However, today, as in 1997, the severest erosion occurs along 2,000 ft ofshoreline west of the “O” Beach. For more detailed information on historic rates of change, seeHardaway et al. (1997).

1-4
C. Shoreline Management Strategies
Four basic approaches to shoreline management were discussed in Hardaway et al.,(1997): 1) No action; 2) Defend an erosional area with defensive structures such as bulkheads,seawalls or revetments; 3) Maintain and/or enhance existing shore zone features such as beachand dunes which presently offer limited protection; or 4) Create a shore zone system of beachesand dunes, using headland control with stone breakwaters.
In general, headland control was the recommended strategy in the original managementplan. Most often headlands are created with large breakwaters. Headland control is a conceptthat allows long stretches of shoreline to be addressed in a more cost/effective way. It is eitheraccomplished by accentuating existing features or by creating permanent headlands that willallow adjacent, relatively wide embayments to become stable. The headland approach cangreatly reduce the cost of managing the shoreline reach by reducing the linear feet of structurenecessary and by increasing the residency of associated beach nourishment. However, shorechange between headlands will continue and may be accentuated as the shore planform adjuststoward dynamic equilibrium.
The shoreline management plan was developed with input from the Navy and was thefirst step in addressing beach stability to provide for long-term shoreline protection andrecreation, while maintaining an environment suitable for military training (Figure 5). Byutilizing the geomorphic shore planforms that have evolved through time, the Plan proposedheadland control through enhancement of the existing groin features with stone breakwaters andthe addition of structures at strategic points. A “leaky” system was proposed to minimizedowndrift impacts. This would be accomplished with the use of low profile breakwaters thatwill allow sand to attach at a reduced elevation so that limited transport could occur. They werealso broad in order to attenuate wave energy during storms. Finally, the plan called for theattachment of spurs to several groins in place of construction of some breakwaters, along withgroin and revetment rehabilitation at the “O” Beach.
D. Plan Summary
The shoreline at Little Creek NAB has been retreating, for the most part, since at least1852. To reduce sand movement into Little Creek’s dredged channel, Inlet jetties were built inthe late 1920s. In order to combat erosion, four groins were constructed in the early 1970s. These groins segmented the shoreline and, in some areas, served to at least reduce erosion for atime. In other areas, particularly at the “E” Beach, sand was trapped updrift of this groin, whilethe downdrift shoreline retreated as it adjusted toward a new equilibrium. In 1994, a stonerevetment was built just west of the “O” Beach in order to address erosion along that section ofshore.
Integration of results from an analysis of historical shoreline trends, wave climateanalysis, shoreline change modeling, and the Navy’s long- and short-term goals resulted in thedevelopment of a Shoreline Management Plan for the Little Creek NAB (Hardaway et al., 1997). This plan intended to enhance the existing groins with spur breakwaters and provide twoseparate structures between the “O” and “E” beaches which would provide headland controlalong the whole length of the Base’s shore.

1-5
In 1998, shore structures 5 and 6 (breakwater/spur) and 8 and 9 (revetments) wereinstalled (Figure 5). The update of the shore management plan was developed in coordinationwith the U. S. Army Corps of Engineers (Norfolk District), the Navy, and VIMS in order toassess shore change since 1998 and to determine whether additional coastal structures wereneeded to maintain the shoreline.

1-6
III. Approach and Methodology for Plan Update
A. Limits of the Study Area
The shore reach between Lynnhaven and Little Creek Inlets was the main focus of thestudy performed in 1997 (Hardaway et al., 1997). However, to better understand the processesoccurring in the study area, the overall study area was extended to include the shore from CapeHenry to Little Creek Inlet (Figure 1). This shore management plan update includes LittleCreek’s Chesapeake Bay shoreline with focus on the reach between the “O” Beach and the “E”Beach.
B. Data Preparation and Surveys
Field survey data, historical aerial photos, and computer modeling were used to addressthe aforementioned report objectives. Historic and recent aerial images also were evaluated tomap changes in shoreline position. Profile data was taken at locations set in the original plan(Figure 6). However, because of erosion at the site, many of the profiles had to be reset fartherinland. The locations in 1996 and 2002 are listed in Table 2. The 1996 profiles were correctedto the 2002 benchmarks, and the two sets of data were plotted in cross-section to show shorelinechange.
For the update report, data developed in the original plan were used as input to computermodels. In Hardaway et al. (1997), the hydrodynamic forces existing along the NAB beacheswere evaluated using RCPWAVE, a computer model developed by the US Army Corps ofEngineers (Ebersole et al., 1986). RCPWAVE is a linear wave propagation model designed forengineering applications. This model computes changes in wave characteristics that resultnaturally from refraction, shoaling, and diffraction over complex shoreface topography. To thisfundamental linear theory based model, oceanographers at VIMS added routines which estimatewave energy dissipation due to bottom friction in the bottom boundary layer (Wright et al.,1987).
These wave data were input to GENESIS, a computer model used in the analysis ofshoreline change (Hanson and Kraus, 1989 and Gravens et al., 1991). The GENESIS runsutilized the original calibration and verification data. The initial input shoreline was the same asthat used in the original modeling effort, 9 August 1996. Additional GENESIS modelingscenarios were run based on the construction of breakwaters at the “O” Beach. All coefficientsand parameters remained the same; only structure length and locations varied from the originalGENESIS runs to the newer runs. For more information on all data, see Hardaway et al. (1997).

1-7
Table 2. Location of Little Creek profiles and control benchmark positions. Horizontalcoordinates are in Virginia State Grid (South), NAD 83, feet. Vertical elevations are relative toNOS MLW in feet.
1996 2002
Name Northing Easting Elevation Northing Easting ElevationNAB1 3,503,861 12,173,113 17.57
SAMENAB2 3,504,036 12,172,410 25.57
NAB11 3,504,867 12,168,183 15.43
NAB12 3,504,882 12,167,563 22.14
VB 3,505,187 12,167,039 13.51 3,505,184 12,167,019 15.76
A4 3,505,147 12,167,708 8.99 3,505,092 12,167,690 15.96
A 3,505,020 12,168,072 16.75 3,505,027 12,168,067 11.98
AP - - - 3,504,900 12,168,527 18.22
A3 3,504,879 12,168,977 9.01 3,504,820 12,168,959 16.04
A2 3,504,781 12,169,517 8.91 3,504,712 12,169,516 18.26
A1 3,504,705 12,169,977 8.81 3,504,623 12,169,960 17.02
E1 3,504,502 12,170,620 8.70 3,504,439 12,170,597 14.21
E2 3,504,321 12,171,248 8.80 3,504,262 12,171,237 17.72
E3 3,504,191 12,171,674 8.76 3,504,133 12,171,645 15.67
E 3,504,218 12,172,326 17.41 3,504,216 12,172,325 18.49
BW 3,504,206 12,172,364 8.25 3,504,193 12,172,381 7.16
F2 3,504,154 12,172,527 6.23* 3,504,128 12,172,515 6.16*
F1 3,504,115 12,172,650 5.58* 3,504,084 12,172,617 6.29*
E4 3,504,073 12,172,783 6.88 3,504,057 12,172,760 9.80
D2 3,504,061 12,172,888 8.33 3,504,041 12,172,861 16.09
D1 3,503,735 12,173,537 9.05 3,503,679 12,173,509 25.69
* Temporary Benchmarks

1-8
IV. Results
A. Profiles
The beach profile comparisons are shown in Figures 7A-7Q. Comparison of shorelineposition from field surveys shows continued erosion along most of the coast between “E” Beachand the Base’s east boundary. In particular, the subreach from Point A (Profile A1) to the “O”Beach revetment has areas eroding at greater than 10 ft/yr.
The morphologic shoreline trends between “E” Beach and Point A show accretion justeast of Groin #4 (Profile VB, Figure 7A), no change at Profile A4 (Figure 7B), slight erosion atA (Figure 7C) and progressively increasing erosion toward Point A which itself (Profile A1,Figure 7G) is eroding at -10.5 ft/yr. The high erosion rates continue to E1 (Figure 7H), decreaseto -1.7 ft/yr at E2 (Figure 7I), then increase again to -5 ft/yr at E3 (Figure 7J) which is adjacentto the revetment. The result is that the subtle cape feature, prominent in 1997 and before, isbeing sheared off as the shore reach responds to the “E” Beach and “O” Beach Headlands. Thequestion now is how long and how far will this erosional pattern continue?
At the “O” Beach, the shore is continuing to adjust to the installation of the breakwatersas sand accretes at F2 (Figure 7M) and erodes at F1 (Figure 7N). What was once a relativelystraight beach, has a formed into an embayment. Once the beach is in dynamic equilibrium, littleshore change should occur. In an analysis of the reach on the western end of NAB, whichextends from the “E” Beach to Little Creek Inlet and its associated jetties, it was determined thatlittle has changed in the same time period judging from recent and historic trends and aqualitative comparison of low-level vertical aerial photography taken in 1997 and 2002.
B. Shore Modeling
Results of GENESIS and Tombolos runs performed in 1997 generally predict the currenttrend of the westward offset adjacent to “O” Beach. Model Tombolos over-predicted the rateprobably because of the limiting boundaries placed on that analysis. It was emphasized byHardaway et al. (1997) that this trend would have to be addressed in the future and proposed atthat time measures to be phased in when needed (Figure 5). These measures included addingstructures 3 and 4 and possibly structure 2 to further the process of segmenting the coast withstrategically placed headland breakwaters to bring it into more dynamic equilibrium. Beachnourishment was also a part of this scheme.
GENESIS was run for several proposed scenarios that would address the changes takingplace at Little Creek’s shore in response to the installation of the breakwaters at the “O” Beach. Figure 8 shows the final run that indicated the best shore conditions as well as the final resultfrom the original management plan. The structures show predicted shore planform adjustmentsthat bring the coast into dynamic equilibrium. This assumes a continued input of littoral materialfrom the east.

1-9
C. Management Plan Update
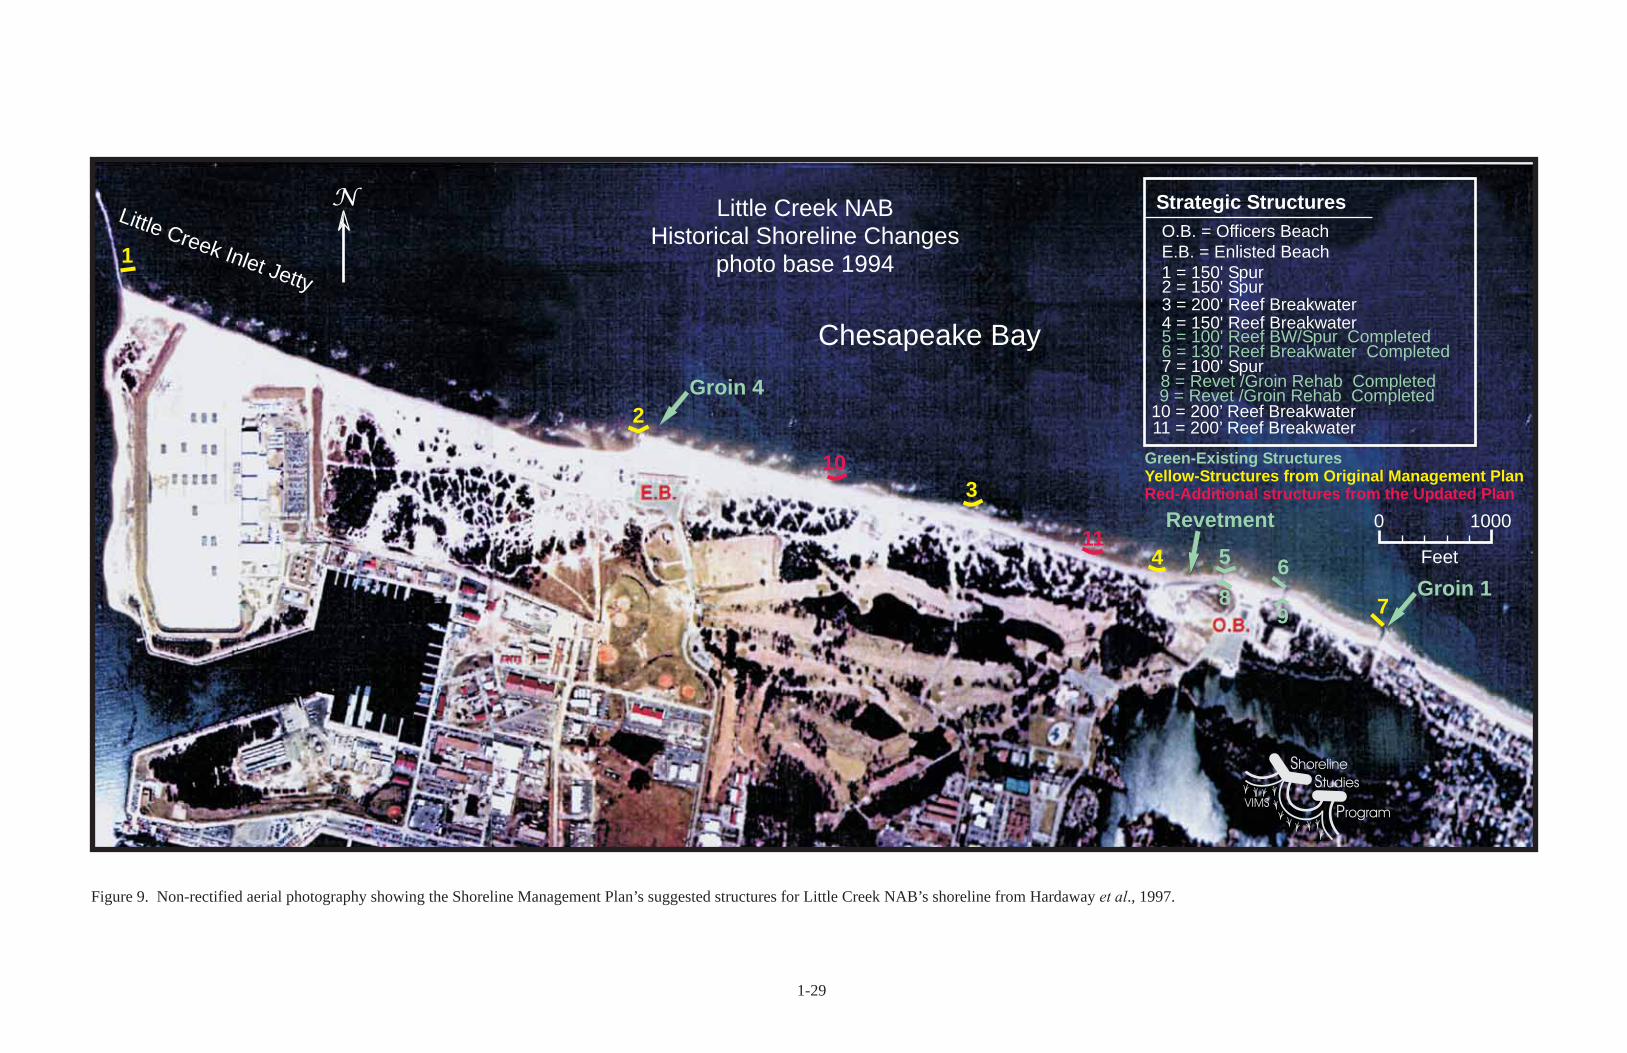
The suggested structures for the updated Shoreline Management Plan are shown inFigure 9. These are the result of the profiling and modeling effort performed for this report. Theupdated plan calls for the addition of structures #10 and #11 which are 200 ft breakwater units. The addition of structure #2 should also be considered but is not presently a priority because theexisting groin is preforming as a major headland feature.
1-10
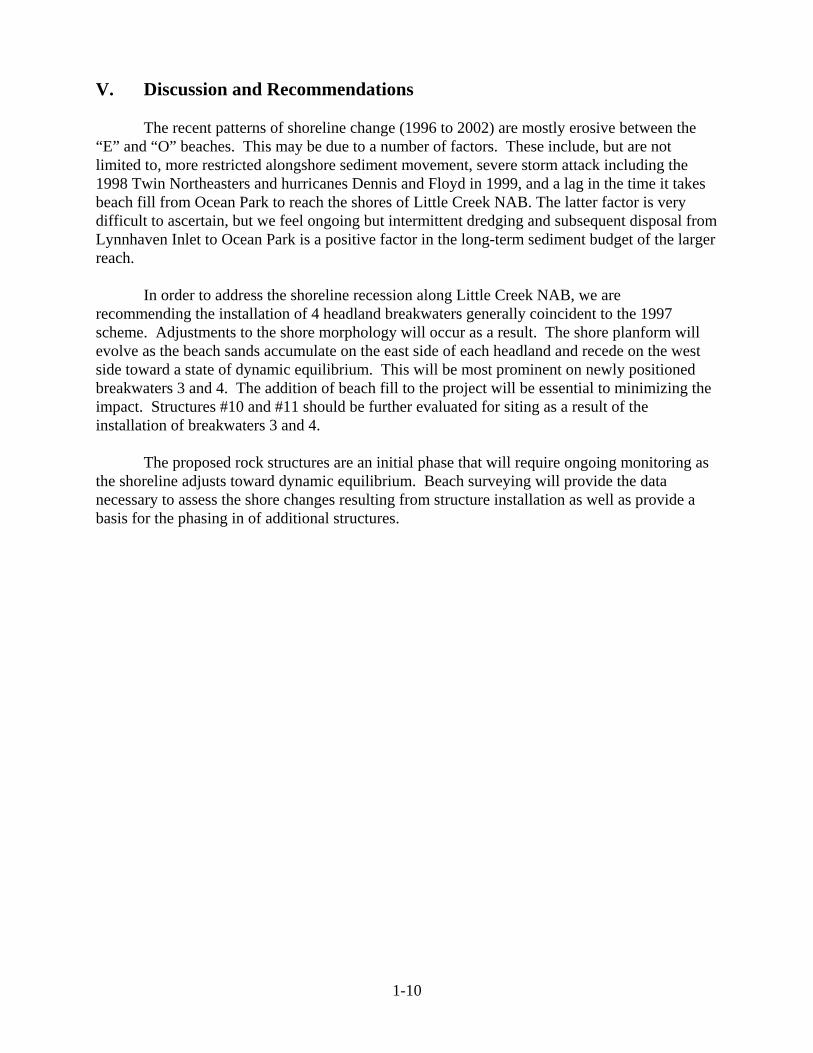
V. Discussion and Recommendations
The recent patterns of shoreline change (1996 to 2002) are mostly erosive between the“E” and “O” beaches. This may be due to a number of factors. These include, but are notlimited to, more restricted alongshore sediment movement, severe storm attack including the1998 Twin Northeasters and hurricanes Dennis and Floyd in 1999, and a lag in the time it takesbeach fill from Ocean Park to reach the shores of Little Creek NAB. The latter factor is verydifficult to ascertain, but we feel ongoing but intermittent dredging and subsequent disposal fromLynnhaven Inlet to Ocean Park is a positive factor in the long-term sediment budget of the largerreach.
In order to address the shoreline recession along Little Creek NAB, we arerecommending the installation of 4 headland breakwaters generally coincident to the 1997scheme. Adjustments to the shore morphology will occur as a result. The shore planform willevolve as the beach sands accumulate on the east side of each headland and recede on the westside toward a state of dynamic equilibrium. This will be most prominent on newly positionedbreakwaters 3 and 4. The addition of beach fill to the project will be essential to minimizing theimpact. Structures #10 and #11 should be further evaluated for siting as a result of theinstallation of breakwaters 3 and 4.
The proposed rock structures are an initial phase that will require ongoing monitoring asthe shoreline adjusts toward dynamic equilibrium. Beach surveying will provide the datanecessary to assess the shore changes resulting from structure installation as well as provide abasis for the phasing in of additional structures.

1-11
VI. References
Boon, J. D., C. S. Welch, H. S. Chen, R. J. Lukens, C. S. Fang, and J. M. Zeigler, 1978. A StormSurge Model Study: Volume I. Storm Surge Height-Frequency Analysis and ModelPrediction for Chesapeake Bay. Special Report No. 189 in Applied Marine Science andOcean Engineering, Virginia Institute of Marine Science, College of William and Mary,Gloucester Point, Virginia, 155 pp.
Byrne, R. J. and G. L. Anderson, 1978. Shoreline Erosion in Tidewater Virginia. SRAMSOENumber 111. Virginia Institute of Marine Science, College of William and Mary,Gloucester Point, Virginia, 102 pp.
Das, M. M., 1974. Beach Erosion Study - Little Creak Naval Amphibious Base, Virginia. Technical Report TR-248, Department of the Navy, Naval Oceanographic Office,Washington, D.C., 69 pp.
Ebersole, B. A., M. A. Cialone, and M. D. Prater, 1986. RCPWAVE - A Linear WavePropagation Model for Engineering Use. U.S. Army Corps of Engineers Report, CERC-86-4, 260 pp.
Fleischer P., G. J. McRee, and J. J. Brady, 1977. Beach Dynamics and Erosion Control, OceanView Section, Norfolk, Virginia. Technical Report No. 50, Institute of Oceanography,Old Dominion University, Norfolk, Virginia, 185 pp.
Gravens, M. B., N. C. Kraus, and H. Hanson, 1991. GENESIS: Generalized Model forSimulating Shoreline Change, Report 2. Technical Report, CERC-89-19, Department ofthe Army, U.S. Army Corps of Engineers, Washington, D.C., 345 pp. + app.
Hanson, H., and N. C. Kraus, 1989. GENESIS: Generalized Model for Simulating ShorelineChange. Technical Report, CERC-89-19. Coastal Engineering Research Center,Waterways Experiment Station, U.S. Army Corps of Engineers, Vicksburg, Mississippi,185 pp. + app.
Hardaway, C. S., Jr., D. A. Milligan, J. P.-Y Maa, and G. R. Thomas, 1997. Little Creek NavalAmphibious Base Chesapeake Bay Shoreline, Shoreline Management Plan and Officer’sBeach Shore Protection Evaluation. Technical Report, Virginia Institute of MarineScience, College of William & Mary, Gloucester Point, Virginia.
Ludwick, J. C., 1987. Mechanics of Sand Loss from an Estuarine Groin System Following anArtificial Sand Fill. Department of Oceanography Technical Report 87-2, Old DominionUniversity, Norfolk, Virginia, 89 pp.
Wright, L. D., C. S. Kim, C. S. Hardaway, Jr., S. M. Kimball, and M. O. Green, 1987. Shorefaceand Beach Dynamics of the Coastal Region from Cape Henry to False Cape, Virginia. Technical Report, Virginia Institute of Marine Science, College of William and Mary,Gloucester Point, Virginia.
1-12
U.S. Army Corps of Engineers, 1983. Willoughby Spit and vicinity, Norfolk, Virginia,Hurricane Protection and Beach Erosion Control Study. Feasibility Report and FinalImpact Statement, Parts 1 and 2, Supporting Documentation.
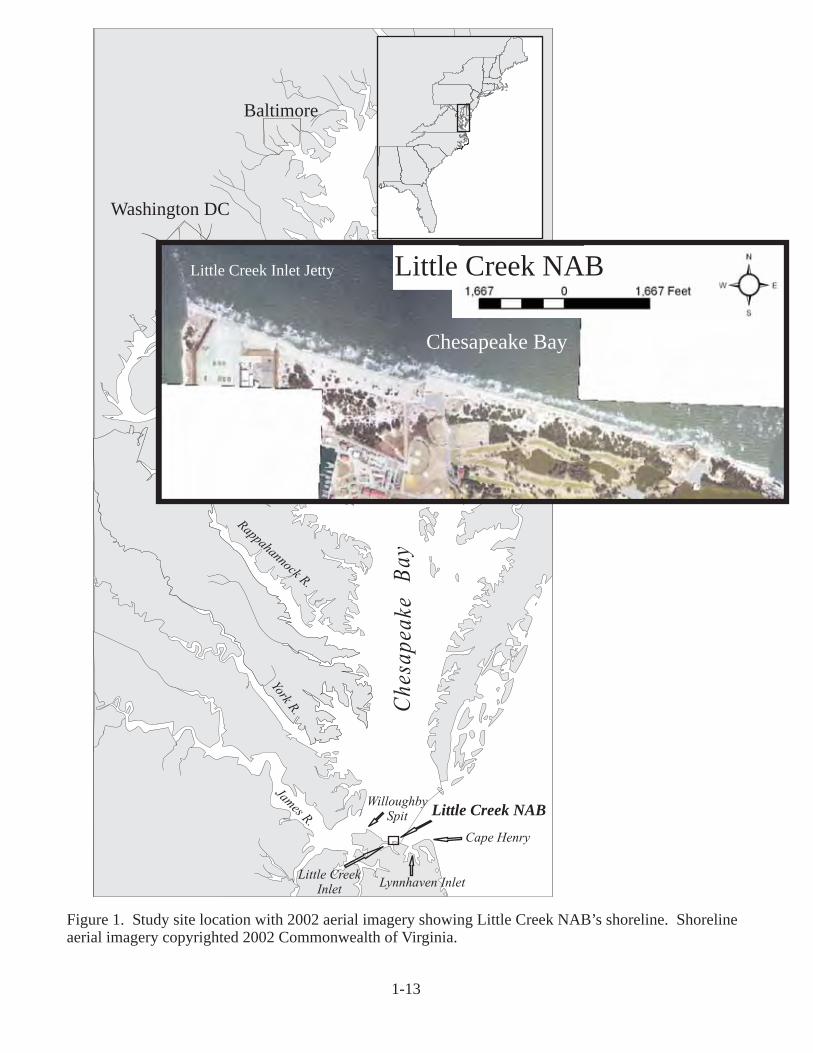
Figure 1. Study site location with 2002 aerial imagery showing Little Creek NAB’s shoreline. Shoreline
aerial imagery copyrighted 2002 Commonwealth of Virginia.
1-13
Baltimore
Washington DC
Pc
otoma R.
RappahannockR.
YorkR.
James R.
Ch
esa
pea
keB
ay
Little Creek NAB
Cape Henry
Little CreekInlet
Lynnhaven Inlet
Little Creek Inlet Jetty
Chesapeake Bay
Little Creek NAB
WilloughbySpit

Figure 2. Aerial photo showing the breakwater project at the Officer’s Beach and the entire
Little Creek shore (photo date 12 June 2002).
Shoreline
Studies
ProgramVIMS
1-14
Officer’sBeach
Breakwaters-1998
Enlisted Beach
Little Creek Inlet
Groin #1
Point A
Revetment-1994Existing
Revetment-1998
Revetment-1998

Little Creek Channel:East Jetty
Groin #4 Point "A"
Groin #1
Feet
0 1000
Little Creek NAB
Historical Shoreline Changes
photo base 1976
NLEGEND
1852 SHORE LINE (MEAN HIGH WATER)
1949 SHORE LINE (MEAN HIGH WATER)
1958 SHORE LINE (MEAN HIGH WATER)
1971 SHORE LINE (MEAN HIGH WATER)
1974 SHORE LINE (MEAN HIGH WATER)
Groin #3Groin #2
Shoreline
Studies
ProgramVIMS
Figure 3. Non-rectified 1976 aerial photo showing MHW shoreline positions in 1852, 1949, 1958, 1971, and 1974 from Hardaway . (1997).et al
1-15
Little Creek Channel:East Jetty
Groin #4
Point "A"
Groin #3
Groin #2
Groin #1
Feet
0 1000
Little Creek NABHistorical Shoreline Changes
photo base 1994
LEGEND
1976 SHORE LINE (MEAN HIGH WATER)
1980 SHORE LINE (MEAN HIGH WATER)
1982 SHORE LINE (MEAN HIGH WATER)
1985 SHORE LINE (MEAN HIGH WATER)
O.B. = OFFICERS BEACH
E.B. = ENLISTED BEACH
N
Figure 4. Non-rectified 1994 aerial photo showing MHW shoreline positions in 1976, 1980, 1982, and 1985 from Hardaway . (1997).et al
Shoreline
Studies
ProgramVIMS
1-16

Feet
0 1000
Little Creek NABHistorical Shoreline Changes
photo base 1994
N
1
2
3
4 5
89
6
7
Strategic Structures
O.B. = Officers Beach
E.B. = Enlisted Beach
1 = 150' Spur
2 = 150' Spur
3 = 200' Reef Breakwater
4 = 150' Reef Breakwater
5 = 100' Reef BW/Spur
6 = 130' Reef Breakwater
7 = 100' Spur
8 = Revet /Groin Rehab
9 = Revet /Groin Rehab
Figure 5. Non-rectified aerial photography showing the structural components of the shoreline management plan as shown by Hardaway (1997).et al.
Shoreline
Studies
ProgramVIMS
1-17

N
VB
NAB12 NAB11
A4A
APA3
A2
A1
E1
E2
E3EBW
NAB2
NAB1
F2F1
E4 D2
D1
Figure 6. Non-rectified aerial photography showing the location of beach cross-sectional profiles taken at Little Creek in 1996 and 2002.
19962002
Profile Location in
Photo Base 1994 DOQQ
Shoreline
Studies
ProgramVIMS
1-1
8
-10
0
10
20
0 100 200 300 400
Ele
vatio
n(f
t)
Distance Offshore (ft)
VB
-10
0
10
20
0 100 200 300 400
Ele
vatio
n(f
t)
Distance Offshore (ft)
A4
20021996
A
B
Figure 7. Beach profile shore change between 1996 and 2002 at profiles A) VB and B) A4.
1-1
9
MLW
MLW

-10
0
10
20
0 100 200 300 400
Ele
vatio
n(f
t)
Distance Offshore (ft)
-10
0
10
20
0 100 200 300 400
Ele
vatio
n(f
t)
Distance Offshore (ft)
A
AP
20021996
C
D
Figure 7. Beach profile shore change between 1996 and 2002 at profiles C) A and D) AP.
1-2
0
MLW
MLW
Not surveyed in 1996

-10
0
10
20
0 100 200 300 400
Ele
vatio
n(f
t)
Distance Offshore (ft)
-10
0
10
20
0 100 200 300 400
Ele
vatio
n(f
t)
Distance Offshore (ft)
A3
A2
20021996
E
F
Figure 7. Beach profile shore change between 1996 and 2002 at profiles E) A3 and F) A2.
1-2
1
MLW
MLW
-10
0
10
20
0 100 200 300 400
Ele
vatio
n(f
t)
Distance Offshore (ft)
A1
-10
0
10
20
0 100 200 300 400
Ele
vatio
n(f
t)
Distance Offshore (ft)
E1
20021996
G
H
Figure 7. Beach profile shore change between 1996 and 2002 at profiles G) A1 and H) E1.
1-2
2
MLW
MLW
E2
-10
0
10
20
0 100 200 300 400
Ele
vatio
n(f
t)
Distance Offshore (ft)
-10
0
10
20
0 100 200 300 400
Ele
vatio
n(f
t)
Distance Offshore (ft)
E3
20021996
E2
I
J
Figure 7. Beach profile shore change between 1996 and 2002 at profiles I) E2 and J) E3.
1-2
3
MLW
MLW
-10
0
10
20
0 100 200 300 400
Ele
vatio
n(f
t)
Distance Offshore (ft)
-10
0
10
20
0 100 200 300 400
Ele
vatio
n(f
t)
Distance Offshore (ft)
E
BW
20021996
K
L
Figure 7. Beach profile shore change between 1996 and 2002 at profiles K) E and L) BW.
1-2
4
MLW
MLW
-5
0
5
10
15
0 100 200 300 400
Ele
vatio
n(f
t)
Distance Offshore (ft)
-5
0
5
10
15
0 100 200 300 400
Ele
vatio
n(f
t)
Distance Offshore (ft)
F2
F1
20021996
M
N
Figure 7. Beach profile shore change between 1996 and 2002 at profiles M) F2 and N) F1.
1-2
5
MLW
MLW

-10
0
10
20
0 100 200 300 400
Ele
vatio
n(f
t)
Distance Offshore (ft)
-10
0
10
20
0 100 200 300 400
Ele
vatio
n(f
t)
Distance Offshore (ft)
E4
D2
20021996
O
P
Figure 7. Beach profile shore change between 1996 and 2002 at profiles O) E4 and P) D2.
1-2
6
MLW
MLW

Distance Offshore (ft)
-10
0
10
20
0 100 200 300 400
Ele
vatio
n(f
t)
D1
Q
MLW
20021996
Figure 7. Beach profile shore change between 1996 and 2002 at profile Q) D1.
1-2
7

1-28
Figure 8. GENESIS modeling for the structural components of the A) originial 1997 management plan and B) the updated 2002 management plan.
BGroin
1
Groin2
O Beach East BWGroin
3O Beach West BW
0 500 1000 1500 2000 2500 3000 3500 4000 4500
Distance Alongshore (m)
0
Dis
tan
ce
Offsh
ore
(m)
Initial Shore
Calculated Shore
Groins
Revetment
Proposed Breakwater
Rev
etm
ent
Little
Cre
ek
Inle
tJe
tty
12
103 411 8 9
5 6
7
100
200
300
400
500
0
A
100
200
300
400
500
0
Dis
tan
ce
Offsh
ore
(m)
Existing Breakwater
Groin4
Feet
0 1000
Little Creek NABHistorical Shoreline Changes
photo base 1994
N
1
2
3
4 5
89
6
7
Strategic Structures
O.B. = Officers Beach
E.B. = Enlisted Beach
1 = 150' Spur2 = 150' Spur3 = 200' Reef Breakwater4 = 150' Reef Breakwater5 = 100' Reef BW/Spur Completed6 = 130' Reef Breakwater Completed7 = 100' Spur8 = Revet /Groin Rehab Completed9 = Revet /Groin Rehab Completed
10
11
10 = 200’ Reef Breakwater11 = 200’ Reef Breakwater
Figure 9. Non-rectified aerial photography showing the Shoreline Management Plan’s suggested structures for Little Creek NAB’s shoreline from Hardaway ., 1997.et al
Shoreline
Studies
ProgramVIMS
1-29
Green-Existing StructuresYellow-Structures from Original Management PlanRed-Additional structures from the Updated Plan
Groin 1
Revetment
Groin 4
Chesapeake Bay
Little Creek Inlet Jetty

LITTLE CREEK NAVAL AMPHIBIOUS BASE
CHESAPEAKE BAY SHORELINE
Beach and Dune Impacts of the Proposed Shoreline Management Plan - 2004
By
C. Scott Hardaway, Jr.Donna A. MilliganGeorge R. Thomas
Linda M. Meneghini
For
Geo-Marine, Inc.Newport News and ACC Program Office
Newport News, Virginia

2-i
TABLE OF CONTENTS
Table of Contents . . . . . . . . . . . . . . . . . . . . . . . . . . . . . . . . . . . . . . . . . . . . . . . . . . . . . . . . . . . . 2-i
List of Figures . . . . . . . . . . . . . . . . . . . . . . . . . . . . . . . . . . . . . . . . . . . . . . . . . . . . . . . . . . . . . . 2-ii
List of Tables . . . . . . . . . . . . . . . . . . . . . . . . . . . . . . . . . . . . . . . . . . . . . . . . . . . . . . . . . . . . . . 2-iii
I Introduction . . . . . . . . . . . . . . . . . . . . . . . . . . . . . . . . . . . . . . . . . . . . . . . . . . . . . . . . . . 2-1A. Purpose . . . . . . . . . . . . . . . . . . . . . . . . . . . . . . . . . . . . . . . . . . . . . . . . . . . . . . . . 2-1B. Background . . . . . . . . . . . . . . . . . . . . . . . . . . . . . . . . . . . . . . . . . . . . . . . . . . . . 2-1C. Shoreline Management Strategies . . . . . . . . . . . . . . . . . . . . . . . . . . . . . . . . . . . 2-2D. Geo-Marine: Beaches and Dunes Management Unit . . . . . . . . . . . . . . . . . . . . 2-3
II Approach and Methodology . . . . . . . . . . . . . . . . . . . . . . . . . . . . . . . . . . . . . . . . . . . . . 2-4A. Limits of the Study Area . . . . . . . . . . . . . . . . . . . . . . . . . . . . . . . . . . . . . . . . . 2-4B. Shoreline Impacts Assessment . . . . . . . . . . . . . . . . . . . . . . . . . . . . . . . . . . . . . . 2-4
III Results . . . . . . . . . . . . . . . . . . . . . . . . . . . . . . . . . . . . . . . . . . . . . . . . . . . . . . . . . . . . . . 2-5A. Shoreline Plan . . . . . . . . . . . . . . . . . . . . . . . . . . . . . . . . . . . . . . . . . . . . . . . . . . 2-5B. Shoreline Impacts of Updated Shore Plan . . . . . . . . . . . . . . . . . . . . . . . . . . . . . 2-5
IV Discussion and Recommendations . . . . . . . . . . . . . . . . . . . . . . . . . . . . . . . . . . . . . . . . 2-6
V References . . . . . . . . . . . . . . . . . . . . . . . . . . . . . . . . . . . . . . . . . . . . . . . . . . . . . . . . . . . 2-7

2-ii
LIST OF FIGURES
Figure 1. Study site location with 2002 aerial imagery showing Little Creek NAB’sshoreline. Shoreline aerial imagery copyrighted 2002 Commonwealth of Virginia. . . . . . . . . . . . . . . . . . . . . . . . . . . . . . . . . . . . . . . . . . . . . . . . . . . . . . 2-8
Figure 2. Non-rectified aerial photos showing the Shoreline Management Plan’s suggestedstructures for Little Creek NAB’s Shoreline from Hardaway et al. (1997). . . . 2-9
Figure 3. Impacts to the Little Creek A) vegetative communities and B) training routes after implementation of the proposed structures. . . . . . . . . . . . . . . . . . . . . . . . 2-10
Figure 4. Detail of a typical shoreline management plan with habitat enhancement. . . . 2-11

2-iii
LIST OF TABLES
Table 1. Habitat change due to placement of proposed structures. . . . . . . . . . . . . . . . . . 2-5
2-1
I. Introduction
A. Purpose
Little Creek Naval Amphibious Base (NAB) is located in Virginia Beach, Virginia. It’sshoreline along the southern Chesapeake Bay extends from Little Creek Inlet eastwardapproximately 1.5 miles to the NAB’s eastern boundary. In 1997, a study and report entitled“LITTLE CREEK NAVAL AMPHIBIOUS BASE, CHESAPEAKE BAY SHORELINE,SHORELINE MANAGEMENT PLAN and OFFICER’S BEACH SHORE PROTECTIONEVALUATION” was produced by VIMS’s Shoreline Studies Program (Hardaway et al., 1997). The purpose of that report was to assess the rates and patterns of beach change along theChesapeake Bay shoreline at Little Creek NAB in order to develop a shoreline management plan,particularly for the Officer’s Beach (“O” Beach). Field surveys, historical aerial imagery,empirical models and computer models were used to address these objectives. Planrecommendations resulted in the construction of a headland breakwater system and revetments atthe “O” Beach as well as a series of proposed breakwaters along the length of the Little CreekNAB coast.
In 2002, an update to the shoreline management plan was performed (Hardaway et al.,2004). The purposes of that effort were to update the Hardaway et al. (1997) study and todetermine if additional management strategies should be implemented. Elements of the previousreport were presented to provide the background perspective and bring the reader up-to-date. Generally, the shoreline subreach just west of the “O” Beach has continued to erode from theexisting revetment westward toward the Enlisted Beach (“E” Beach). This trend was prevalentprior to 1997 and was predicted to continue in the previous study. The question is how long willthis trend continue and what impact will it have on the Base’s shoreline, particularly the Bay-fronting primary dune system which is eroding along much of the coast?
This report attempts to detail the potential impacts to Little Creek NAB Chesapeake Baycoast if the updated management plan is implemented. It was determine that the impact will beto the shoreline position and consequently to the associated beach/dune system. Themanagement recommendations of the updated plan are to create headland features with largestone breakwaters and to allow the adjacent coast to continue to recede toward dynamicequilibrium. Dynamic equilibrium is a concept whereby shoreline embayments, whether naturalor man-made, will attain a state where the shore planform is stable given the input and output oflittoral sands. In the case of Little Creek NAB, the input of sand from ongoing beachnourishment efforts west of Lynnhaven Inlet is a significant factor.
B. Background
The Little Creek NAB shoreline resides in a large reach of shore that extends from CapeHenry westward to Willoughby Spit (Figure 1). Specifically, Little Creek NAB lies within adiscreet subreach that is bounded by Lynnhaven Inlet on the east and Little Creek Inlet and itsassociated jetties on the west. Impacts to this reach include the creation and maintenance ofLittle Creek Inlet, maintenance dredging of Lynnhaven, periodic beach nourishment within thesubreach from material related to dredging of both inlets, and the installation of groins andbreakwaters on the Bay shoreline of Little Creek NAB.

2-2
Byrne and Anderson (1978) found an erosion rate of 4.4 ft/yr for a shoreline whichextended from 0.8 miles east of Little Creek Inlet to the Chesapeake Bay Bridge Tunnel. Theyalso found that the shoreline from Little Creek Inlet’s east jetty to 0.3 miles further east isaccreting at a rate of 1.2 ft/yr. A detailed analysis of the Virginia Beach shoreline in this regionby Owen et al. (1978) described accretion rates along the shoreline fronting the noise berm westto the jetty. These final conclusions were reached in their report. There was little or no changealong the shoreline between the berm and the “E” Beach. From the “E” Beach to the west edgeof the golf course, moderate erosion occurred. The remaining stretch of Little Creek’s shorelinehad severe erosion (Owen et al., 1978). Today, as in 1997, the most severe erosion occurs along2,000 ft of shoreline west of the “O” Beach.
The net direction of littoral or sand transport in the subreach is to the west with a minorreversal just west of Lynnhaven Inlet. Maintenance dredging of Lynnhaven Inlet has occurredover the years and, occasionally, sandy dredge material is placed along the Ocean Park shorelinewhere it is subsequently transported westward and offshore. These dredge deposits have workedtheir way toward the Base shoreline as part of the overall littoral transport system. The LittleCreek channel, jetties, and groins have all acted to modify the natural littoral processes and havebrought the shore morphology to its present state where significant erosion occurs along theeastern third of the Little Creek shoreline.
C. Shoreline Management Strategies
There are four basic approaches to shoreline management: 1) No action; 2) Defend anerosional area with a defensive structures such as bulkheads, seawalls or revetments; 3) Maintain and/or enhance existing shore zone features such as beach and dunes that presentlyoffer limited protection; or 4) Create a shore zone system of beaches and dunes, generally usingheadland control with stone breakwaters.
A management strategy based on the first approach listed above may be appropriate inareas where no property improvements are threatened by erosion and/or the shoreline is stable oraccretional; although accretion in the form of a spit or a widening beach may pose problems tonavigation or access to the waterfront. Defending an erosional area generally means protectingupland structures threatened by erosion and not the beach in front of the structure. Defensivestructures such as seawalls and revetments can, in some cases, increase erosion rates in front ofthem and, in many cases, alter the natural beach profile. Approaches 3 and 4 are similar in thatthe shore zone system is either maintained or created along an entire shoreline reach. Generally,this is accomplished with groins, breakwaters and/or headland control with beach nourishment ormaintaining beach features being part of this approach.
Headland control is a concept that can allow long stretches of shoreline to be addressedin a more cost/effective way. It is accomplished by accentuating existing features or creatingpermanent headlands that allow adjacent, relatively wide embayments to become stable. Thiscan greatly reduce the cost of managing the shoreline reach by reducing the linear feet ofstructure necessary and by increasing residency of associated beach nourishment.
Headlands generally are created with breakwaters. Offshore breakwaters are consideredan “offensive” strategy to shoreline erosion control since they address the impinging wavesbefore they reach the shore. However, breakwaters, groins, seawalls and beach nourishment all
2-3
may play a part in developing a shoreline protection system. The dimensions and position of anyshore protection system are dependent on wave climate, costs, type of shore being protected andwhat level of protection is desired (i.e. design storm surge and wave height).
The use of breakwaters for headland control has been tested repeatedly in the ChesapeakeBay. Since 1981, over 60 attached or headland breakwater systems have been built in theChesapeake Bay for the purposes of shoreline erosion control and maintaining recreationalbeaches. Hardaway et al. (1991) evaluated 15 breakwater systems in terms of numerousparameters including breakwater length, gap, distance offshore and the indentation of theadjacent embayments. These breakwater installations have shown that a stable beach planformcan exist with subtidal attachments. The advantage to a subtidal attachment is that wetlandhabitat is increased in the breakwater’s lee, while beach stability is not compromised.
Of the four aforementioned shoreline management strategies, the use of headland controlis the most appropriate for the greater than 2 miles of shoreline at NAB. The proposed shorelinemanagement plan was developed with input from the Navy and is the first step in addressingbeach stability for long term shoreline protection and recreation while maintaining anenvironment suitable for military training.
D. Geo-Marine: Beaches and Dunes Management Unit
In 2000, Geo-Marine, Inc. produced a report entitled “Ecological Assessment of theBeaches and Dunes Management Unit at Naval Amphibious Base Little Creek, Virginia Beach,Virginia” which detailed the vegetative communities along the Little Creek NAB Bay shorelinewhich included beaches, dunes, and maritime forest. The report showed additional shorelineelements such as the boundaries of the training beaches, training routes, wetlands, infrastructure,research plots, and dune management schemes. The Geo-Marine report was used as our basis indetermining the potential impacts to the beach/dune system if the proposed shorelinemanagement plan update is initiated.

2-4
II. Approach and Methodology
A. Limits of the Study Area
The shore reach between Lynnhaven and Little Creek Inlets were analyzed in detail in1997 (Hardaway et al., 1997). However, in this report, the overall study area has been extendedto include the shoreline from Cape Henry to Little Creek Inlet (Figure 1). The shoremanagement plan update includes the NAB’s Chesapeake Bay shoreline while focusing on thereach between the “O” Beach and the “E” Beach which is an area of recent erosion.
B. Shoreline Impacts Assessment
Results of the VIMS’s updated shoreline management plan suggests that the placement ofoffshore breakwaters at strategic locations between the “O” Beach and the “E” Beach (Figure 2). This plan included two additional structures to those proposed in the 1997 report (#10 and #11). This plan was overlain onto two maps produced by Geo-Marine 1) vegetative communities and2) vehicle training routes (Figure 3A and 3B). The predicted stable shore planform wassuperimposed onto each map based on GENESIS shoreline modeling in the updated plan.
The areas of impact to the beach, dune and vegetative communities were calculated usingArcView 3.3. The impacts to the vehicle training routes were qualitatively assessed. The Geo-Marine data were based on geo-rectified aerial photography taken in 1996. Substantial shorelinechange has occurred along sections of the study area since 1996. In addition, one of theassumptions used in the update plan is that beach nourishment shall be ongoing along theshoreline west of Lynnhaven Inlet from the inlet dredging. Reduction in the transport of littoralsands onto the Little Creek coast may result in increased bay offsets which would move theshore planform landward.
2-5
III. Results
A. Shoreline Plan
The updated shoreline plan (Hardaway et al., 2004), from east to west, begins at structure#4 which is proposed to reduce the flanking west of the existing revetment. The original plan(Hardaway et al., 1997) placed the next structure at position #3. Ground surveys between 1996and 2002 showed this area to be eroding at up to 10 ft/yr. Shoreline equilibrium would proceedfar into the beach, dune, woodlands and maritime forest. Therefore, an additional structure (#11)was inserted to reduce the long size of the embayment while creating two bays along the samereach.
The original plan (1997) placed shore structure #3 at what was called Point A, whichappears as a slight turn or cape feature alongshore. The idea was to allow shore equilibrium toproceed between structure #3 and “E” Beach where the existing broken concrete groin would beenhanced with a spur/breakwater (structure #2). Once again, a very long stretch of shoreline wasto be allowed to evolve toward equilibrium and in order to further segment the shore, anotherstructure was proposed, structure #10. Additional structures could be added, however, these mayalter the nature of the training beaches beyond what the Navy desires.
B. Shoreline Impacts of Updated Shore Plan
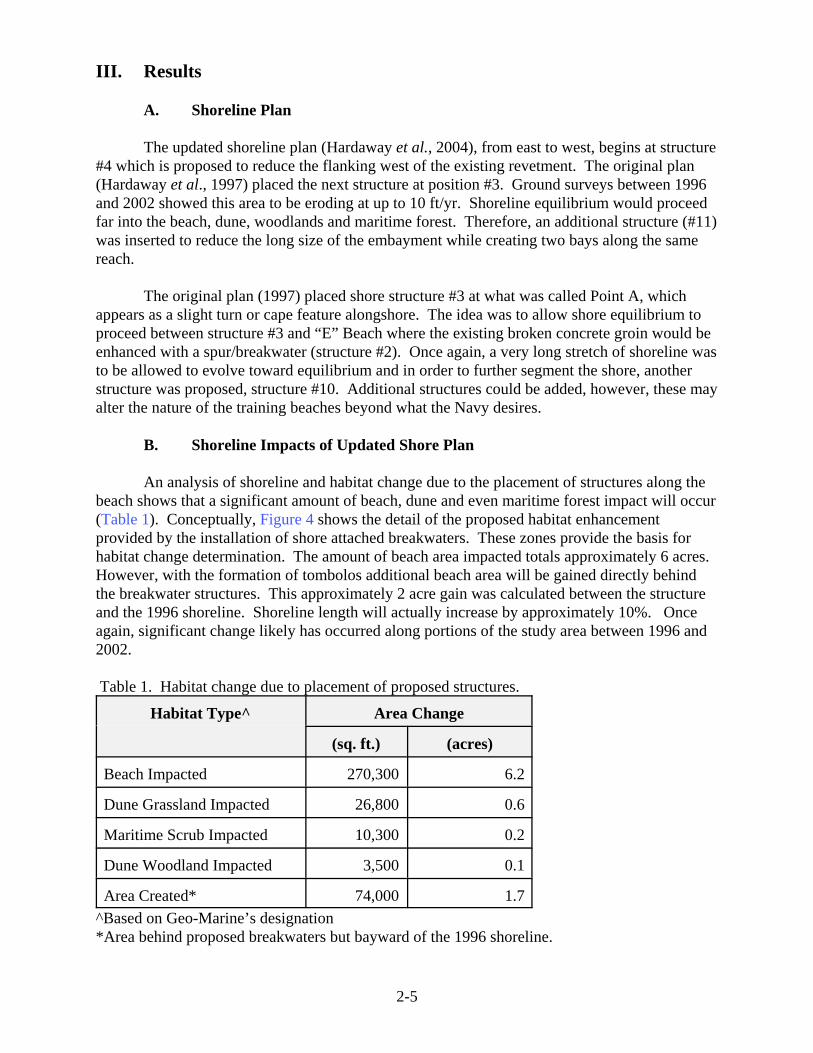
An analysis of shoreline and habitat change due to the placement of structures along thebeach shows that a significant amount of beach, dune and even maritime forest impact will occur(Table 1). Conceptually, Figure 4 shows the detail of the proposed habitat enhancementprovided by the installation of shore attached breakwaters. These zones provide the basis forhabitat change determination. The amount of beach area impacted totals approximately 6 acres. However, with the formation of tombolos additional beach area will be gained directly behindthe breakwater structures. This approximately 2 acre gain was calculated between the structureand the 1996 shoreline. Shoreline length will actually increase by approximately 10%. Onceagain, significant change likely has occurred along portions of the study area between 1996 and2002.
Table 1. Habitat change due to placement of proposed structures.
Habitat Type^ Area Change
(sq. ft.) (acres)
Beach Impacted 270,300 6.2
Dune Grassland Impacted 26,800 0.6
Maritime Scrub Impacted 10,300 0.2
Dune Woodland Impacted 3,500 0.1
Area Created* 74,000 1.7^Based on Geo-Marine’s designation*Area behind proposed breakwaters but bayward of the 1996 shoreline.

2-6
IV. Discussion and Recommendations
The recent patterns of shoreline change (1996 to 2002) are mostly erosive which mayresult from a number of factors, including but not limited to, more restricted alongshore sedimentmovement, severe storm attack including the 1998 Twin Northeasters and hurricanes Dennis andFloyd in 1999, and the lag time it takes beach fill from Ocean Park to reach the shores of NABLittle Creek. The latter factor is very difficult to ascertain, but we feel intermittent but ongoingdredging from Lynnhaven Inlet and subsequent disposal in Ocean Park will factor into the long-term sediment budget of the larger reach.
The shoreline plan update creates a series of headlands and pocket beaches along muchof the Little Creek NAB coast. The beaches and dunes areas between “O” Beach and “E” Beachwill not be lost but reformed into curvilinear embayments. In fact, the actual length of shorelinewill increase by approximately 10%. Impacts to the vegetative communities is not insignificant,but with time, displaced dune and woodland features could migrate toward the areas of thetombolos or even be part of the design. Similar features have been incorporated into othershoreline management plans. Even though, small areas of maritime forest may be impacted,these could initially be enhanced behind each headland structure. Finally, no infrastructure isthreatened and training areas will not be lost but realigned as the shoreline moves towardequilibrium. In this vehicle routes may have to be altered to accommodate the evolving shoreplanform.

2-7
V. References
Byrne, R. J. and G. L. Anderson, 1978. Shoreline Erosion in Tidewater Virginia. SRAMSOENumber 111. Virginia Institute of Marine Science, College of William and Mary,Gloucester Point, Virginia, 102 pp.
Hardaway, C. S., Jr., and J. R. Gunn, 1991. Headland breakwaters in Chesapeake Bay. Proceedings: Coastal Zone ‘91, Long Beach, California, p. 1267-1281.
Hardaway, C. S., Jr., D. A. Milligan, J. P.-Y Maa, and G. R. Thomas, 1997. Little Creek NavalAmphibious Base Chesapeake Bay Shoreline, Shoreline Management Plan and Officer’sBeach Shore Protection Evaluation. Technical Report, Virginia Institute of MarineScience, College of William & Mary, Gloucester Point, Virginia.
Hardaway, C. S., Jr., D. A. Milligan, G. R. Thomas, and L. M. Meneghini, 2004. Little CreekNaval Amphibious Base Chesapeake Bay Shoreline, Shoreline Management Plan Update. Technical Report, Virginia Institute of Marine Science, College of William & Mary,Gloucester Point, Virginia.
Owen, D. W., L. Morgan, and N. M. Sturm, 1978. Shoreline Situation Report - City of Virginia Beach. SRAMSOE Number 163. Virginia Institute of Marine Science, College ofWilliam and Mary, Gloucester Point, Virginia, 91 pp.

Figure 1. Study site location with 2002 aerial imagery showing Little Creek NAB’s shoreline. Shoreline
aerial imagery copyrighted 2002 Commonwealth of Virginia.
2-8
Baltimore
Washington DC
Pc
otoma R.
RappahannockR.
YorkR.
James R.
Ch
esa
pea
keB
ay
Little Creek NAB
Cape Henry
Little CreekInlet
Lynnhaven Inlet
Little Creek Inlet Jetty
Chesapeake Bay
Little Creek NAB
WilloughbySpit

Feet
0 1000
Little Creek NABHistorical Shoreline Changes
Photo Base 1994
N
1
2
3
4 5
89
6
7
Strategic Structures
O.B. = Officers Beach
E.B. = Enlisted Beach
1 = 150' Spur2 = 150' Spur3 = 200' Reef Breakwater4 = 150' Reef Breakwater5 = 100' Reef BW/Spur Completed6 = 130' Reef Breakwater Completed7 = 100' Spur8 = Revet /Groin Rehab Completed9 = Revet /Groin Rehab Completed
10
11
10 = 200’ Reef Breakwater11 = 200’ Reef Breakwater
Figure 2. Non-rectified aerial photos showing the Shoreline Management Plan’s suggested structures for Little Creek NAB’s shoreline from Part 1 of this report.
Shoreline
Studies
ProgramVIMS
Noise Berm
Golf Course
2-9
Green-Existing StructuresYellow-Structures from Original Management PlanRed-Additional structures from the Updated Plan
Chesapeake Bay
Little Creek Inlet Jetty

ExistingRevetment
2
10
11
4
2
10
3
11
4
ExistingRevetment
Figure 3. Impacts to the Little Creek A) vegetative communities and B) training routes after implementation of the proposed structures (data from Geo-Marine, 2000).
2-10
A
B
Existing BW
Existing BW
Existing BW
Existing BW
3
Vegetative Communities
Sand
Evergreen Maritime Forest
Dune Woodland
Dune Grassland
Beach
Maritime Scrub
Interdunal Wetland
Overwash Grassland
Infrastructure
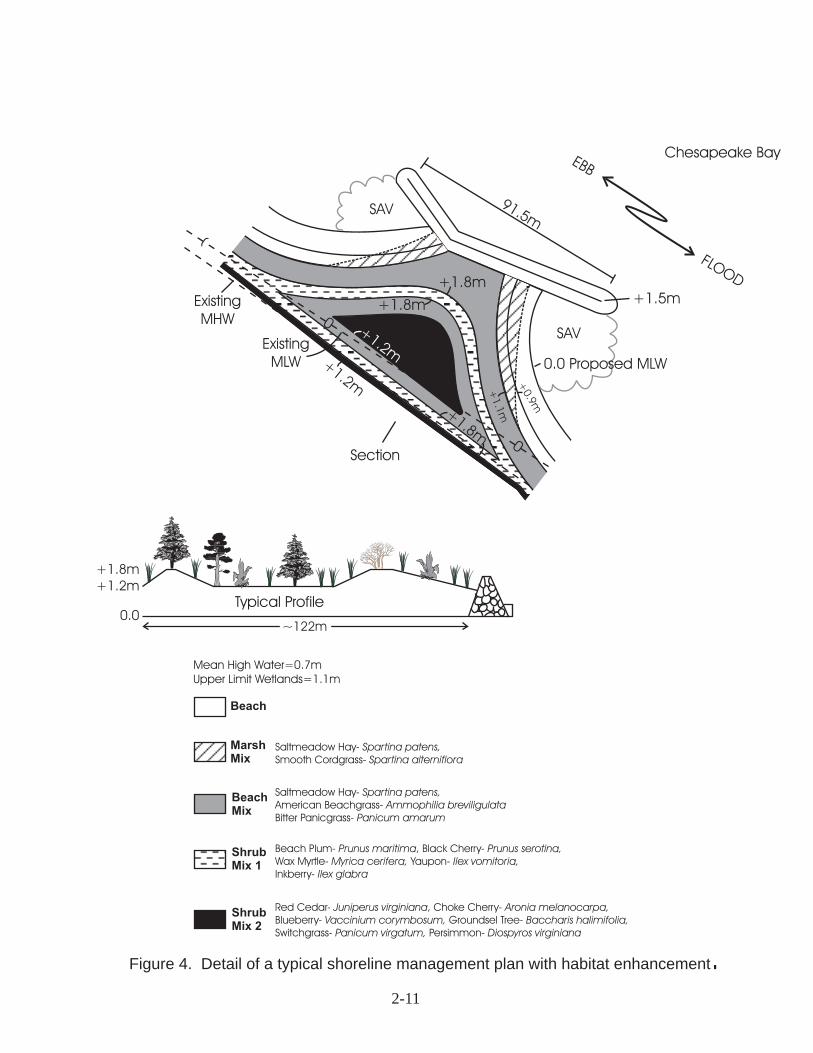
Mean High Water=0.7m
Upper Limit Wetlands=1.1m
Saltmeadow Hay-
Smooth Cordgrass-
Spartina patens,
Spartina alterniflora
Saltmeadow Hay- Spartina patens,
Ammophilia breviligulata
Panicum amarum
American Beachgrass-
Bitter Panicgrass-
Marsh
Mix
Beach
Beach
Mix
Shrub
Mix 1
Shrub
Mix 2
Beach Plum- , Black Cherry-
Wax Myrtle- Yaupon-
Inkberry-
Prunus maritima Prunus serotina,
Myrica cerifera, Ilex vomitoria,
Ilex glabra
Red Cedar- , Choke Cherry-
Blueberry- Groundsel Tree-
Switchgrass- Persimmon-
Juniperus virginiana Aronia melanocarpa,
Vaccinium corymbosum, Baccharis halimifolia,
Panicum virgatum, Diospyros virginiana
Typical Profile0.0
+1.2m
+1.8m
~122m
Figure 4. Detail of a typical shoreline management plan with habitat enhancement.
91.5mSAV
Existing
MHW
Existing
MLW
Section
+1.5m
SAV
+1.2m
+1.8m
+1.2m
0
0
0
0+1.8m
+1.1
m
+0.9
m+1.8m
Chesapeake BayEBB
FLOOD
0.0 Proposed MLW
2-11