liverpool commercial office market review 2012
DESCRIPTION
Liverpool Commercial Office Market Review 2012TRANSCRIPT

Exch
ange
Sta
tion
LIVERPOOL COMMERCIALOFFICE MARKET REVIEW 2012
Liverpool Commercial Office Market Review 2012_MC 25/02/2013 10:22 Page 1

Combining the Central Business District and the city fringe and out-of-town markets reveals totalLiverpool City Region office market take-up in 2012 was 534,730 sq ft, up 40 per cent from 2011.
Total city centre office take-up in 2012 was 259,602 sq ft, virtually unchanged from 2011.
A surge in demand from Liverpool's now fast-growing creative, media and digital sector - and acautious return to activity by the public sector - largely explain the sharply improved CityRegion office market.
The out-of-town office market staged an impressive recovery, with take-up growing three foldfrom 63,684 sq ft in 2011 to 209,200 sq ft in 2012.
The creative, media and digital sector accounted for take-up of 16.5 per cent of office take-up inthe Liverpool City Region, with total sq ft let almost three times higher than in 2011.
Shipping and distribution - historically important to Liverpool's economy - continues to exercise apowerful influence on the city's office market. Total take-up from the shipping and distributionsector in the Central Business District was 34,697 sq ft (13 per cent of take-up), making it thesecond largest occupational category after the professional services sector.
The combined professional and financial share of Central Business District take-up in 2012 was33.8 per cent (87,616 sq ft), down on the 60.4 per cent (162,060 sq ft) reported in 2011. Theircombined share of take up of the entire Liverpool City Region office market is now 20.5 per centof take-up (109,432 sq ft).
Wavertree area has become the out-of-town market's outstanding office success story, with take-up surging for the second year in a row. Take-up was four times higher than in 2011, totalling86,014 sq ft. This follows 47 per cent growth in 2011.
A total of 209,051 sq ft of Grade A office space is empty and ready for occupation inLiverpool’s CBD.
On the preferred measure of Grade A and B, the Central Business District vacancy rate hasnarrowed to 12.6 per cent.
SUM
MAR
Y
LIVERPOOL JOHN LENNON
AIRPORT
M62
M57
M58
M6
BOOTLE
WATERLOO
OUT OF TOWNKNOWSLEY
OUT OF TOWNST HELENS
RIVER MERSEY
CITY FRINGE
CITYCENTRE
OUT OF TOWNWAVERTREE
OUT OF TOWNNORTH LIVERPOOL
OUT OF TOWNSOUTH LIVERPOOL
LIVERPOOL CITY REGION MAP
Liverpool Commercial Office Market Review 2012_MC 25/02/2013 10:22 Page 2

…to the Commercial Office Market Review for 2012.
Professional Liverpool, Liverpool Vision and The Commercial District BIDare pleased to once again report on the activities that have occurred inthe office market for Liverpool and its regions over the last calendar year.
As usual the information has been researched on a structured and objectivebasis compiled from data sourced from the property agent members ofProfessional Liverpool with help from some of the region’s major stakeholders.Various refinements have been made this year including the re-grading ofoffices and the introduction of a user category for ‘Shipping and Distribution’ toprovide a more focused and detailed analysis. The figures show a surprisingupturn in overall take up for the City region of 40% on 2011 with the out of townmarket improving three fold. The market has also revealed a greater diversity oftake up than for 2011. The hiatus in development provides cause for concernalong with the continuing need to attract inward investment and moresubstantial occupiers. The market is challenging but last year has shownpositive signs upon which Liverpool and its regions can build with the rightlevel of commitment.
We hope that the review provides not only a useful source of reference foranalysis on previous years but a valuable insight into the current market.
Our thanks go to all parties involved in the review who have been accredited atthe end of this report.
We would welcome your feedback.
WELCOME...
STUART KEPPIEChairman, ProfessionalLiverpool Property Group
MAX STEINBERGChief Executive,Liverpool Vision
DAVID GUESTChair, The CommercialDistrict BID
property group
Liverpool Commercial Office Market Review 2012_MC 25/02/2013 10:22 Page 3

OFFICE TAKE-UP IN THE CENTRAL BUSINESSDISTRICT FOR 2012Total Central Business District (CBD) officetake-up in 2012 was 259,602 sq ft, littlechanged from the 268,298 sq ft reported in2011. Both are healthily above 2010 (207,515 sqft) and 2008 (245,000 sq ft) suggesting a returnto a stable, sustainable market after severalyears of disruption.
The year offered further evidence of the breadth ofthe economic recovery underway in the city. In 2012it was more true than ever that demand is no longerdominated by the public sector, or professionals -although these sectors remain important - but nowcomes evenly from several business sectorsincluding shipping, media and creative, the financialservices sector and call centres. There is alsoevidence that smaller businesses are growing intonew office space. 2012 saw 61 deals, up from 44 in2011, with more than two-thirds taking suites ofbetween 1,000 and 5,000 sq ft.
The year was notable for the lack of a single largertransaction over 30,000 sq ft. In 2012 the largestsingle letting was 22,500 sq ft, compared to 94,000sq ft in 2011.
OFFICE TAKE-UP OVERALL Combining the Central Business District cityfringe and the out-of-town markets reveals totalLiverpool City Region office market take-up in2012 was 534,730 sq ft, a jump of 40 per centcompared with 2011.
The total represents a substantial gearshift for theCity Region's office market, and for its economycompared with the previous two years. The total of511,238 sq ft compares with 382,592 sq ft in 2011and the broadly similar 393,441 sq ft of 2010..
OFFICE TAKE-UP FOR 2012 IN THE CITY FRINGE Total city fringe office take-up in 2012 was 65,928,up 30 per cent on 2011.
The network of historic terraces and modernconversions close to the city centre has long beenpopular with Liverpool's creative, media and digitalsector whose strong return to growth in 2012 (after apause in 2011) has driven demand in the city fringe.
Creative media and digital industries have generallyaccounted for between one fifth and one third of thetotal annual take-up in the city fringe, but have nowaccelerated to 37 per cent of the city fringe officetake-up as the sector matures.
This return to rapid growth now means creative,media and digital take-up easily eclipses theprofessional services sector (12 per cent) as thearea's largest single source of demand for officespace. The professional sector accounted for just 12per cent take-up in 2012 compared to 26.9 per centof take up in 2011. However, it is now clear that 2011represented an unusually active year forprofessionals, both in the city fringe and in the citycentre. Professional take-up in the city fringe 2012was broadly similar to that in 2010 (7,852 sq ft in2012, compared to 7,058 sq f in 2010) and thisprobably represents baseline demand.
300,000
225,000
150,000
75,000
0
2011
2012
SQ FT
YEAR
268,
298
259,
602
600,000
500,000
400,000
300,000
0
2011
2012
SQ FT
YEAR
382,
592
Public SectorProfessionalFinancial
3.03%
11.91%
0%
TOTAL TAKE-UP (%)TrainingCreativeOther
3.34%
36.69%
45.03%
LIVERPOOL COMMERCIAL OFFICE MARKET REVIEW 2012
511,
238
3.03%
45.03%
36.69%
11.91% 3.34%
No 1 Tithebarn(largest office letting)
Liverpool Commercial Office Market Review 2012_MC 25/02/2013 10:22 Page 4

OFFICE TAKE-UP OUT-OF-TOWN IN 2012Demand for suites in Liverpool’s out-of-town officemarkets staged an impressive recovery in 2012.
Office take-up in the business parks of North andSouth Liverpool, Wavertree, and Knowsley, and inthe more mixed markets of St Helens andBootle/Waterloo, totalled 209,200 sq ft, substantiallyup on the 131,000 sq ft recorded in both 2009 and2010, and cruising ahead of the modest 63,684 sq ftrecorded in 2011.
Greater flexibility from landlords, and realism fromtenants, has helped boost performance after theshock delivered by a poor out-of-town performancein 2011.
As usual the popular Wavertree sub market proveditself the most resilient and best equipped toachieve growth, turning 2011's 19,504 sq ft take-upinto 109,506 sq ft in 2012. Growth in this submarketwas driven by the resurgence of the creative, mediaand digital sector, which accounted for 34 per centof Wavertree's take-up in 2012. A surprising returnto the market by the public sector also helped boosttake-up in Wavertree. Public sector take-up inWavertree in 2012 was 32,888 sq ft (30 per cent).
South Liverpool and Knowsley both saw expansionin 2012, with the creative, media and digital sectormaking a perhaps surprising break into SouthLiverpool's business parks (taking 8,072 sq ft) andthe public sector making a powerful return in theKnowsley market as Merseycare signed up for34,500 sq ft.
Two emerging markets - Bootle/Waterloo north ofthe city centre, and St Helens to the south-west -are now coming into focus, thanks to a second yearof unique research. Both suggest immature but fast-changing office districts with medium-term scopefor developers and investors.
St Helens performed well in 2011, with total take-upof 22,312 sq ft. This level of activity was more mutedin 2012 with take up of 14,929 sq ft, with a matchingdrop in availability.
Take-up in Bootle/Waterloo has risen from 16,638 sqft (2011) to 22,378 sq ft (2012). The sub-market hasseen a dramatic increase in availability to 239,846sq ft in 2012 (up from 89,377 sq ft in 2011), largelydue to secondary Grade C public sectoraccommodation now coming onto the market.
OFFICE TAKE-UP TRENDS IN THE CENTRALBUSINESS DISTRICT Total city centre office take-up in 2011 was259,602 sq ft, a modest fall on 268,298 sq ftrecorded in 2012. The five year average is now300,000 sq ft (2008-2012 inclusive), showingthe city centre's office market still performing alittle below normal. However, it was striking that2012 saw an appreciably larger number ofdeals - 61 in 2012 compared to 44 in 2011 -providing evidence of a broader-based return tooccupier confidence in the city centre officemarket.
The Liverpool office market usually sees a handful ofdeals above 30,000 sq ft - but 2010 and 2012 havebeen the exception. The largest transactions werefor 22,500 sq ft and 22,123 sq ft respectively.
The pace of deal making closely reflected national -and global - economic trends. The unsettling Eurocrisis of late 2011 continued into the first quarter of2012, during which deal-making was sparse. Thepace quickened in the second half of the year, with35 of the 62 deals completed on or after 1st June.
600,000
500,000
400,000
300,000
200,000
100,000
0
2008
2009
2010
2011
2012
SQ FT
YEAR
268,
298
207,
515
519,
274
245,
289
LIVERPOOL COMMERCIAL OFFICE MARKET REVIEW 2012
259,
602
V7 Kings Business Park (largest out of town letting)
South LiverpoolWavertreeKnowsleyNorth LiverpoolBootle / WaterlooCity FringeSt Helens
10.30%39.80%12.38%
0%8.13%
23.96%5.43%
AREA (%)
39.80%8.13%
10.30%
12.38%
23.96%
5.43%
Liverpool Commercial Office Market Review 2012_MC 25/02/2013 10:22 Page 5
LIVERPOOL COMMERCIAL OFFICE MARKET REVIEW 2012
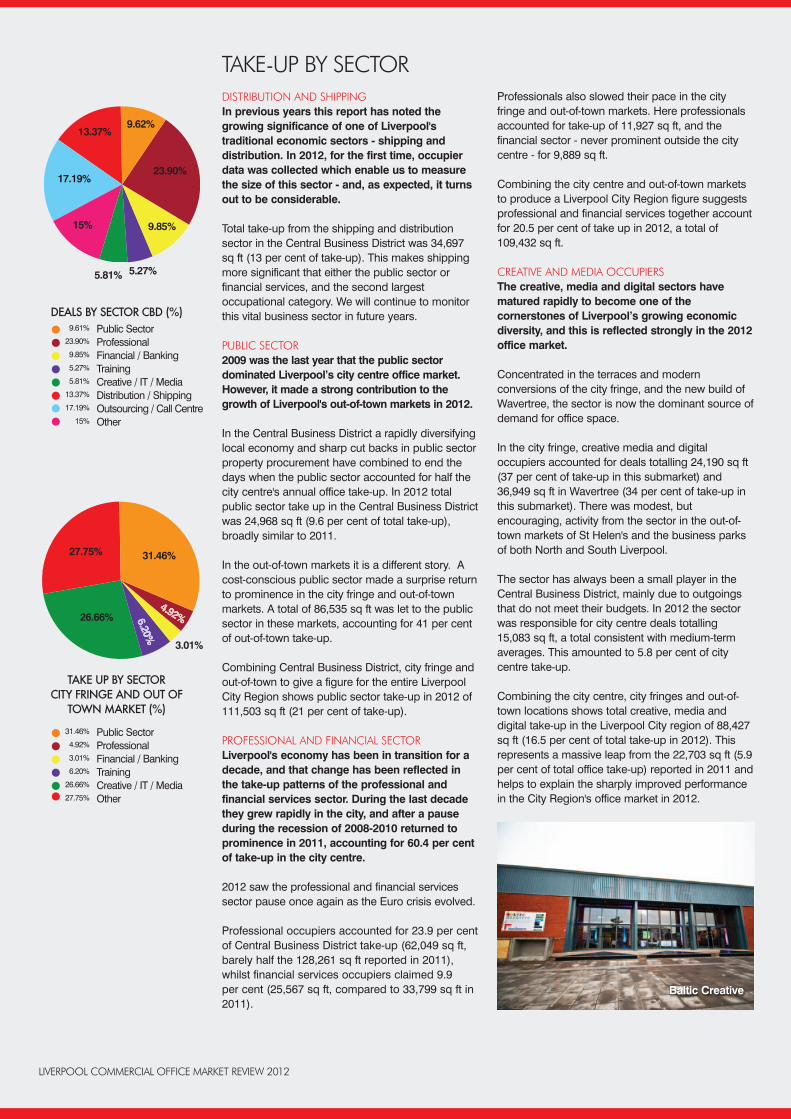
TAKE-UP BY SECTORDISTRIBUTION AND SHIPPINGIn previous years this report has noted thegrowing significance of one of Liverpool'straditional economic sectors - shipping anddistribution. In 2012, for the first time, occupierdata was collected which enable us to measurethe size of this sector - and, as expected, it turnsout to be considerable.
Total take-up from the shipping and distributionsector in the Central Business District was 34,697sq ft (13 per cent of take-up). This makes shippingmore significant that either the public sector orfinancial services, and the second largestoccupational category. We will continue to monitorthis vital business sector in future years.
PUBLIC SECTOR 2009 was the last year that the public sectordominated Liverpool’s city centre office market.However, it made a strong contribution to thegrowth of Liverpool's out-of-town markets in 2012.
In the Central Business District a rapidly diversifyinglocal economy and sharp cut backs in public sectorproperty procurement have combined to end thedays when the public sector accounted for half thecity centre's annual office take-up. In 2012 totalpublic sector take up in the Central Business Districtwas 24,968 sq ft (9.6 per cent of total take-up),broadly similar to 2011.
In the out-of-town markets it is a different story. Acost-conscious public sector made a surprise returnto prominence in the city fringe and out-of-townmarkets. A total of 86,535 sq ft was let to the publicsector in these markets, accounting for 41 per centof out-of-town take-up.
Combining Central Business District, city fringe andout-of-town to give a figure for the entire LiverpoolCity Region shows public sector take-up in 2012 of111,503 sq ft (21 per cent of take-up).
PROFESSIONAL AND FINANCIAL SECTOR Liverpool's economy has been in transition for adecade, and that change has been reflected inthe take-up patterns of the professional andfinancial services sector. During the last decadethey grew rapidly in the city, and after a pauseduring the recession of 2008-2010 returned toprominence in 2011, accounting for 60.4 per centof take-up in the city centre.
2012 saw the professional and financial servicessector pause once again as the Euro crisis evolved.
Professional occupiers accounted for 23.9 per centof Central Business District take-up (62,049 sq ft,barely half the 128,261 sq ft reported in 2011),whilst financial services occupiers claimed 9.9 per cent (25,567 sq ft, compared to 33,799 sq ft in2011).
Professionals also slowed their pace in the cityfringe and out-of-town markets. Here professionalsaccounted for take-up of 11,927 sq ft, and thefinancial sector - never prominent outside the citycentre - for 9,889 sq ft.
Combining the city centre and out-of-town marketsto produce a Liverpool City Region figure suggestsprofessional and financial services together accountfor 20.5 per cent of take up in 2012, a total of109,432 sq ft.
CREATIVE AND MEDIA OCCUPIERS The creative, media and digital sectors havematured rapidly to become one of thecornerstones of Liverpool’s growing economicdiversity, and this is reflected strongly in the 2012office market.
Concentrated in the terraces and modernconversions of the city fringe, and the new build ofWavertree, the sector is now the dominant source ofdemand for office space.
In the city fringe, creative media and digitaloccupiers accounted for deals totalling 24,190 sq ft(37 per cent of take-up in this submarket) and36,949 sq ft in Wavertree (34 per cent of take-up inthis submarket). There was modest, butencouraging, activity from the sector in the out-of-town markets of St Helen's and the business parksof both North and South Liverpool.
The sector has always been a small player in theCentral Business District, mainly due to outgoingsthat do not meet their budgets. In 2012 the sectorwas responsible for city centre deals totalling15,083 sq ft, a total consistent with medium-termaverages. This amounted to 5.8 per cent of citycentre take-up.
Combining the city centre, city fringes and out-of-town locations shows total creative, media anddigital take-up in the Liverpool City region of 88,427sq ft (16.5 per cent of total take-up in 2012). Thisrepresents a massive leap from the 22,703 sq ft (5.9per cent of total office take-up) reported in 2011 andhelps to explain the sharply improved performancein the City Region's office market in 2012.
Public SectorProfessionalFinancial / BankingTrainingCreative / IT / MediaDistribution / ShippingOutsourcing / Call CentreOther
9.61%
23.90%
9.85%
5.27%
5.81%
13.37%
17.19%
15%
DEALS BY SECTOR CBD (%)
13.37%
17.19%
15%
9.62%
23.90%
9.85%
5.81% 5.27%
Baltic Creative
Public SectorProfessionalFinancial / BankingTrainingCreative / IT / MediaOther
31.46%
4.92%
3.01%
6.20%
26.66%
27.75%
TAKE UP BY SECTOR CITY FRINGE AND OUT OF
TOWN MARKET (%)
27.75%
26.66%
31.46%
3.01%
Liverpool Commercial Office Market Review 2012_MC 25/02/2013 10:22 Page 6

OFFICE SUPPLY IN THE CITY CENTRE Using the preferred measure of Grade A and B,whilst overall vacancy rates in the CentralBusiness District have changed little over the lastdecade, the detail reveals an increasinglymodern, lettable office stock.
Global figures are not revealing, thanks to the city'slarge reservoir of historic, and difficult to let, buildings.At December 2012 a total of 7.2m sq of office spaceof all ages and qualities was recorded in the CentralBusiness District, a figure virtually unchanged since2007. Of this total our census shows 2.43m sq ftavailable. This represents an increase from 1.96m sq ft in 2011, explained partly by a re-assessment ofa re-basing of the census, and partly by the failure ofa weakened residential sector to recycle much of theolder unlettable stock.
However, the supply of Grade A space empty andready for occupation has declined sharply, down to209,051 sq ft (2011: 257,283 sq ft) as newdevelopment is absorbed. The supply of goodGrade B office space is also down, standing at700,851 sq ft (2011: 759,067 sq ft).
A re-basing of the census for 2012 resulted in anumber of older properties being moved into lowergrades. The result is a large stock of floorspace ofmarginal or limited economic use. A total of 1.3msq ft is either pre-war or dates from the 1950s,whilst a further 611,619 sq ft dates from the 1960s
and 1970s and is nearing the end of its economiclife. In busier markets much of this space would beredeveloped or converted to other uses. Indeed,hotel conversion/redevelopment accounted for110,000 sq ft in 2012. Expressed another way, 63per cent of available office space is either unlettableGrade D space, or largely outdated Grade C.
If Grade D office space (638,095 sq ft for whichthere is effectively no market) is excluded from ouranalysis then the “wide” measure of the CBDvacancy rate is 25 per cent (2011: 23.5 per cent)
Alternatively, the “narrow” measure of the CBDvacancy rate (which also excludes 890,943 sq ft ofGrade C office stock) produces a vacancy ratenarrowing to 12.6 per cent (2010: 14.2 per cent).
OFFICE SUPPLY: CITY FRINGE AND OUT-OF-TOWN The city fringe market saw a rise in the supply ofoffice space available and ready for occupation.
In November 2011 we recorded total city fringeavailability at 318,906 sq ft, but in 2012 this rose to422,144 sq ft, despite a busy year of lettings. This isin part explained by consolidation of floorspacesome larger users who then released surplusaccommodation (Abbey National and the localprimary care trust, for example). Simultaneouslyconversion from industrial to office use, particularlyin the South Docks,contributed to morethan 40,000 sq ftbecoming available asoffice floorspace.
Elsewhere, in the out-of-town market theNovember 2012 censusof office availabilityshows 1.1m sq ft ofoffice space available
compared with 907,128 sq ft in 2011, an increase of18 per cent. This is the third year in which supplyhas increased since 2009.
We calculate that 345,816 sq ft of Grade A officespace is available and ready for occupation in theout-of-town and city fringe markets, sharply down onthe 431,950 sq ft reported in 2011. The largest singlesource of supply is South Liverpool (212,000 sq ft)yet Wavertree, by far the most successful market,has nil supply for the second year in succession.
Grade AGrade BGrade CGrade D
8.57%28.74%36.53%26.16%
GRADES A-D (%)
LIVERPOOL COMMERCIAL OFFICE MARKET REVIEW 2012
36.53%
26.16%
8.57%
28.74%
South LiverpoolWavertreeKnowsleyNorth LiverpoolBootle / WaterlooSt HelensCity fringe
17.25%22.45%8.50%5.30%
15.70%3%
27.8%
OFFICE AVAILABILITY (%)
27.80%
17.25%
15.70%
3%
22.45%
8.50%
5.30%
Mann Island(Grade A offices completed in 2012)
Meridian Business Village
Liverpool Commercial Office Market Review 2012_MC 25/02/2013 10:22 Page 7

Words by David Thame.Designed and produced by Move Publishing Ltd.
NOTE ON TERMINOLOGYFor the purposes of this research, Grade A space was defined as officespace completed since 1st January 2008; Grade B space as office spacecompleted before 1st January 2008 or other accommodation recentlyrefurbished or due to be refurbished Grade C as unrefurbished but ready foroccupation. Grade D is office space which could not be occupied withoutsubstantial refurbishment, and where no plans exist for such refurbishment.
ACCREDITATIONThis report has been compiled by members of the Property Group ofProfessional Liverpool with assistance from Liverpool Vision and theCommercial District BID.
Our special thanks go to:
CONTACT INFORMATIONProfessional LiverpoolTel: 0151 224 1855. Email: [email protected]
Liverpool VisionTel: 0151 600 2900. Email: [email protected]
Commercial District BIDTel: 0151 600 2984. Email: [email protected]
TAKE-UP BY SIZE OF OCCUPIERThe revival at the grass-roots of Liverpool'seconomy is most apparent in the market forsmaller suites where 2012 saw a continuedsharp improvement in activity. We calculate that54 per cent of all transactions in the city centrewere for suites under 2,500 sq ft. Thiscompares with 47 per cent in 2011.
Not only was more floorspace transacted in smallerdeals, but the number of smaller deals alsoincreased. The total number of transactions forsuites under 5,000 sq ft was 33 in 2011, but rose to45 in 2012.
Although the proportion of floorspace occupied bylarge transactions changed relatively little between2011 and 2012, the number of larger deals grew.Total deals between 5,000 sq ft and 30,000 sq ftincreased from 11 in 2011, to 16 in 2012. It is in thissector, dominated by larger professional andcorporate occupiers, that the changing economicmake-up of the city centre market is being felt.
The city centre saw eight deals above 10,000 sq ft in2012, exceeding some expectations when we considerthat there were 10 such deals in the boom year of 2007and just three in the recession year of 2009.
0-10001001-25002501-5000
31%23%20%
2012 DEALS BY AREA IN SQ FT (%)5001-10,00010,001-20,00020,000+
13%8%5%
TAKE-UP BY GRADE OF OFFICE Liverpool’s city centre office market continuesto be dominated by occupiers' search for cost-effective office space.
In the Central Business District take up of Grade Boffice space - defined as refurbished office spaceover 5 years old - accounted for 86.5 per cent of allfloorspace let during 2012 (224,940 sq ft). This isbarely changed from the 84.6 per reported in 2011.
However, occupier interest in the city's large stockof budget Grade C floorspace appears to bedwindling. Take-up in the Central Business Districtis down from 5.3 per cent in 2011 to 3.7 per cent in2012 (9,811 sq ft).
The take-up of Grade A space tends to fluctuatewildly in what has often been a supply-led market,varying between extremes as widely separated as 3per cent in 2008 and 32 per cent in 2009. In 2012,
total Grade A take-up accounted for 9.7 per cent offloorspace let in the Central Business District.
Take-up in the substantial out-of-town market is byno means as heavily dominated by newly-built orGrade A floorspace as some might expect, partlythanks to the strictly limited supply of new buildingsince 2008. In 2012 22 per cent of out-of-townoffice floorspace was let in Grade A buildings.
Grade B space accounted for 50 per cent of out-of-town take-up, with the Grade C market claiming anunusually high 28 per cent due to the Grade C -heavy make-up of the Wavertree market, whichdoes not offer tenants the choice of occupyingGrade A space.
Take-up in the city fringe market - with its rich mixof properties - is inevitably dominated by Grade Bfloorspace (73 per cent).
Grade AGrade BGrade C
9.65%
86.65%
3.70%
DEALS BY GRADE OFBUILDING IN CBD (%)
86.65%
9.65%
3.70%
31%
23%20%
13%
8%
5%
Liverpool Commercial Office Market Review 2012_MC 25/02/2013 10:22 Page 8