lkueh.files.wordpress.com · web viewassign variables. make a table of values showing evan’s...
TRANSCRIPT
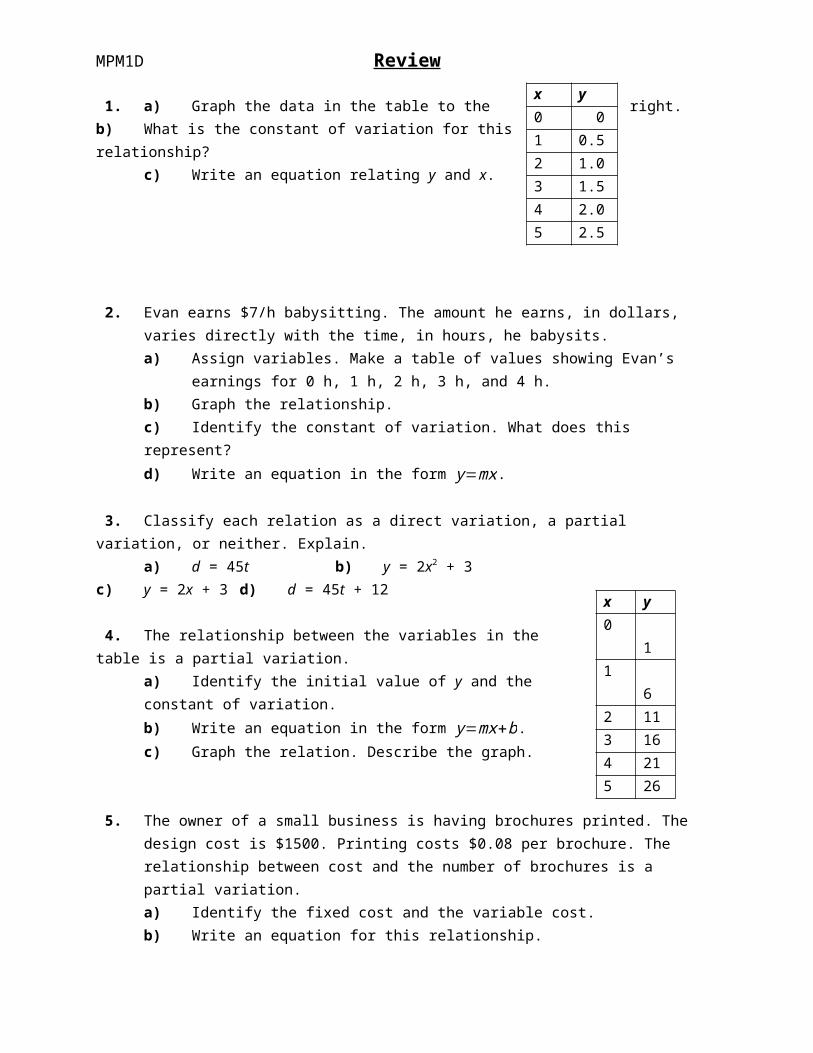
MPM1D Review
1. a) Graph the data in the table to the right.b) What is the constant of variation for this relationship?
c) Write an equation relating y and x.
2. Evan earns $7/h babysitting. The amount he earns, in dollars, varies directly with the time, in hours, he babysits.a) Assign variables. Make a table of values showing Evan’s earnings for 0 h, 1 h, 2 h, 3 h,
and 4 h.b) Graph the relationship.c) Identify the constant of variation. What does this represent?d) Write an equation in the form y=mx.
3. Classify each relation as a direct variation, a partial variation, or neither. Explain.a) d = 45t b) y = 2x2 + 3
c) y = 2x + 3 d) d = 45t + 12
4. The relationship between the variables in the table is a partial variation.a) Identify the initial value of y and the constant of variation.b) Write an equation in the form y=mx+b.c) Graph the relation. Describe the graph.
5. The owner of a small business is having brochures printed. The design cost is $1500. Printing costs $0.08 per brochure. The relationship between cost and the number of brochures is a partial variation.a) Identify the fixed cost and the variable cost.b) Write an equation for this relationship.c) What is the total cost for 800 brochures?
6. Find the slope of each line segment.a) b)
x y0 01 0.52 1.03 1.54 2.05 2.5
x y0 11 62 113 164 215 26

7. Calculate the slope of each line segment.
a) EF b) GH c) JK
8. One endpoint of line segment AB is A(3, 4). The slope of this line segment is
23 . Find possible
coordinates for B.
9. It took 8 min to fill a 52-L bucket.a) What is the rate of change of the volume of water?b) Graph the volume of water in the bucket over time.
10. Tom and Ana ran a race. The graph shows the distance each person ran in 10 s.
Who ran faster? How much faster?

11. Use first differences. Is each relation linear or non-linear?a) b)x y x y0 –1 0 01 2 1 –22 5 2 –43 8 3 –64 11 4 –85 14 5 –10
12. a) Make a table comparing the side length of a square to its perimeter for side lengths 1, 2, 3, 4, and 5.
b) Is the relationship between side length and perimeter linear or non-linear?
13. Represent the relation y = x + 2 using numbers, a graph, and words.
Answers are on Ms. Kueh’s Website lkueh.wordpress.com

Answer 1. a)
b)12 c)
y = 12x
2. a) b)Time, t
Earnings, E
0 01 72 143 214 28
c) 7; the amount Evan earns each hour he babysitsd) y = 7x
3. a) direct variationb) neitherc) partial variationd) partial variation
4. a) 1; 5b) y = 5x + 1c)

The graph intersects the y-axis at (0, 1). As the x-values increase by 1, the y-values increase by 5.
5. a) fixed cost: $1500variable cost: $0.08 times the number of brochures
b) C = 0.08n + 1500c) $1564
6. a)−25 b) 5
7. a) b) c) 8. Answers may vary. Possible answer: B(6, 6) 9. a) 6.5 L/min
b)
10. Tom; 1 m/s11. a) linear
b) linear12. a)
Side Length
Perimeter
1 42 83 124 165 20
b) linear

13.x y0 21 32 43 54 6
The length of a rectangle is 2 more than its width.