lncs 7573 - salient object detection: a benchmarkilab.usc.edu/publications/doc/borji_etal12eccv.pdf1...
TRANSCRIPT

Salient Object Detection: A Benchmark
Ali Borji, Dicky N. Sihite, and Laurent Itti
Department of Computer Science, University of Southern Californiahttp://ilab.usc.edu/~borji
Abstract. Several salient object detection approaches have been pub-lished which have been assessed using different evaluation scores anddatasets resulting in discrepancy in model comparison. This calls for amethodological framework to compare existing models and evaluate theirpros and cons. We analyze benchmark datasets and scoring techniquesand, for the first time, provide a quantitative comparison of 35 state-of-the-art saliency detection models. We find that some models performconsistently better than the others. Saliency models that intend to pre-dict eye fixations perform lower on segmentation datasets compared tosalient object detection algorithms. Further, we propose combined mod-els which show that integration of the few best models outperforms allmodels over other datasets. By analyzing the consistency among the bestmodels and among humans for each scene, we identify the scenes wheremodels or humans fail to detect the most salient object. We highlightthe current issues and propose future research directions.
1 Introduction
Visual saliency is the ability of a vision system (human or machine) to selecta certain subset of visual information for further processing. This mechanismserves as a filter to select only the interesting information related to currentbehaviors or tasks to be processed while ignoring irrelevant information.
Recently, salient object detection has attracted a lot of interest in computervision as it provides fast solutions to several complex processes. Firstly, it detectsthe most salient and attention-grabbing object in a scene, and then it segmentsthe whole extent of that object. The output usually is a map where the intensityof each pixel represents the probability of that pixel belonging to the salientobject. This problem in its essence is a segmentation problem but slightly differsfrom the traditional general image segmentation. While salient object detectionmodels segment only the salient foreground object from the background, generalsegmentation algorithms partition an image into regions of coherent properties.Salient object detection methods also differ from other saliency models that aimto predict scene locations where a human observer may fixate. Since saliencymodels, whether they address segmentation or fixation prediction, both generatesaliency maps; they are interchangeably applicable.
The value of saliency detection methods lies in their applications in many fieldsincluding: object detection and recognition [30][9], image compression [59], video
A. Fitzgibbon et al. (Eds.): ECCV 2012, Part II, LNCS 7573, pp. 414–429, 2012.c© Springer-Verlag Berlin Heidelberg 2012

Salient Object Detection: A Benchmark 415
summarization [60], and photo collage [20][17]. A comparison of some image re-targeting techniques (some based on salient object detection [13][35]) is availableat: http://people.csail.mit.edu/mrub/retargetme/.
Some work has been published on quantitative evaluation of general segmen-tation algorithms [44][48]1. To the authors’ best knowledge, such attempt forbenchmarking salient object segmentation methods has not been reported. Un-fortunately, these methods have often been evaluated on different datasets, whichin some cases are small and not easily accessible. The lack of published bench-marks causes discrepancy in quantitative comparison of competing models. Notonly does a benchmark allow researchers to compare their models with other al-gorithms, but it also helps identify the chief factors affecting performance. Thiscould result in an even faster performance improvement.
2 Related Works
Here we provide a short summary of the main trends in saliency detection. Theinterested reader can refer to the extensive reviews for more details [67][61].
As a pioneer, Itti et al. [2] derived bottom-up visual saliency using center-surround differences across multi-scale image features. Ma and Zhang [51] pro-posed an alternative local contrast method using a fuzzy growth model. Harel etal. [3] used graph algorithms and a measure of dissimilarity to achieve efficientsaliency computation with their Graph Based Visual Saliency (GBVS) model.Liu et al. [33] used conditional random field to learn regions of interest us-ing three features: multi-scale contrast, center-surround histogram, and colorspatial-distribution. More recently, Goferman et al. [15] simultaneously modeledlocal low-level clues, global considerations, visual organization rules, and high-level features to highlight salient objects along with their contexts. Zhai andShah [12] defined pixel-level saliency by contrast to all other pixels. However,for efficiency they used only luminance information, thus ignoring distinctiveclues in other channels. Achanta et al. [16] proposed a frequency-tuned methodthat directly defines pixel saliency using the color differences from the averageimage color. Visual saliency is equated to discrimination in [62] and extendedto bottom-up mechanism in the pre-attentive biological vision. Spectral com-ponents in an image have been explored to detect visual saliency [5][34][56]. InHou and Zhang [5], the gist of the scene is represented with the average Fourierenvelope and the differential spectral components are used to extract salient re-gions. This is replaced by the phase spectrum of the Fourier transform in [34]because it is more effective and computationally efficient. Some researchers in-cluding Bruce and Tsotsos [4] and Zhang et al. [10] attempted to define visualsaliency based on information theory. Some others have further used graph-cutor grab-cub algorithms to refine borders of their saliency maps and count forsalient object contours [23][13]. While some methods define visual saliency in alocal way (e.g., Itti et al. [2], SEO [8], GBVS [3], AWS [7], and DAKlein [25]),
1 http://www.wisdom.weizmann.ac.il/$\sim$vision/Seg_Evaluation_DB

416 A. Borji, D.N. Sihite, and L. Itti
some others are based on global rarity of image regions over the entire scene(e.g., AIM [4], SUN [10], HouNIPS [6], HouCVPR [5], and RC [13]).
Object-based theories of attention propose that humans attend to objectsand high-level concepts. Inspired by these cognitive findings, some models (e.g.,Judd et al. [1]) have used object detectors such as faces, humans, animals, andtext to detect salient locations. Some models address saliency detection in thespatio-temporal domain by employing motion, flicker, optical flow (e.g., [65]), orinterest points learned from the image regions at fixated locations (e.g., [63]).Since the research in this area is rather new and the few existing models are intheir early phases, thus we leave their quantitative evaluation for the future.
Recently a new trend called active visual segmentation has emerged with theintention to segment a region that contains a fixation point (Mishra et al. [49]).Their framework combines monocular cues (color/intensity/texture) with stereoand/or motion, in a cue-independent manner. Similarly, Siagian and Koch [50]also proposed a new approach for active segmentation by combining boundaryand region information. We consider adding them to promote this new trend.
3 The Salient Object Detection Benchmark
Saliency Detection Models. In this work, as the initial seed, we focus on thosemodels that are easily accessible, attained good accuracies, or have been highlyreferred. Software for some models was already available online. For others, wecontacted their creators for the code; the authors then either sent us the sourcecode to compile or the executables. Some authors, however, preferred to runtheir models on our stimuli and hence send us back the saliency maps. In orderto achieve a thorough model comparison, we intend to open an online challengewhere modelers could contribute by submitting their results.
We compare three categories of models: 1) those aiming to detect and segmentthe most salient object in a scene (emphasized more here), 2) active segmentationapproaches, and 3) models that address fixation prediction. Table 1 shows thelist of models from the first two categories, and table 2 shows category 3.
Datasets. We choose 5 benchmark datasets based on the following criteria: 1)being widely-used, 2) having size and stimulus variety, and 3) containing differentbiases such as number of annotators, number of salient objects, and center-bias.Due to specialty of various datasets, it is likely that model rankings may differacross datasets. Hence, to come up with a fair comparison, it is recommendedto run models over several datasets and draw objective conclusions. A model isconsidered to be good, if it performs well over almost all datasets.
Fig. 1 provides explanation of the 5 datasets used here as well as sampleimages of the five smallest and largest objects from each. Fig. 2 shows MeanAnnotation Position: MAP = (1/UV )
∑Uu=1
∑Vv=1 suv averaged over U images
and annotated bounding boxes of V subjects (suv). There is a strong center-biasin the single-object datasets, most probably due to the tendency of photogra-phers to frame interesting objects at the image center [11]. Similarly, there aretwo peaks (at the left and the right) in the images with two salient objects

Salient Object Detection: A Benchmark 417
Table 1. Compared salient object detection models (checked) sorted chronologically.Abbreviations: {M: Matlab, C: C/C++, S: Sent saliency maps}. w and h: imagewidth/height. DB shows the datasets that we have results over them. JiaLiSal is ap-plied to 100 and 1000 images of ASD and MSRA, respectively. max X : Preserve theaspect ratio while resizing the bigger dimension to X.
# Acronym (Model) Ref. Pub/Year Code Resolution DB Avl.
1 IO: Inter-observer model - - M w × h All �2 MAP: Mean Annotation Position - - M 500 × 500 All �3 MZ: Ma and Zhang [51] ACM-M/2003 S w × h ASD �4 LC: Zhai and Shah [18] ACM-M/2006 C w × h All �5 salLiu: Liu et al. [33] CVPR/2007 M max 200 All �6 AC: Achanta et al. [14] ICVS/2008 M w × h All �7 MSSS: Achanta and Susstrunk [55] ICIP/2009 M w × h All �8 FTS: Achanta et al. [16] CVPR/2009 M w × h All �9 EDS: Rosin [19] PR/2009 C w × h All �10 Gopalakrishnan et al. [34] CVPR/2009 - - - -11 Marchesotti et al. [35] ICCV/2009 - - - -12 Valenti: Valenti et al. [40] ICCV/2009 S w × h ASD/MSRA �13 Goferman: Goferman et al. [15] CVPR/2010 M max 250 All �14 PMehrani: Mehrani and Veksler [23] BMVC/2010 S w × h ASD/SED1 �15 Rahtu et al. [29] ECCV/2010 - - - -16 Khuwuthyakorn et al. [28] ECCV/2010 - - - -17 Zhang et al. [21] IEEE TOM/2010 - - -18 JiaLiSal: Jia Li et al. [36] IJCV/2010 S [w h]/16 ASD/MSRA �19 LiuICIP: Liu et al. [53] ICIP/2010 S w × h ASD �20 MichalGazit: Gazit et al. [37] ECCV-W/2010 M w × h All �21 DAKlein: Klein and Frintrop [25] ICCV/2011 S w × h All �22 MengW: M. Wang et al. [18] CVPR/2011 S w × h ASD �23 Feng et al. [22] ICCV/2011 - - - -24 Deng and Luo [39] OE/2011 - - - -25 Lu et al. [24] ICCV/2011 - - - -26 L. Wang et al. [26] ICCV/2011 - - - -27 SVO: Chang et al. [27] ICCV/2011 M w × h All �28 CBsal: Jiang et al. [31] BMVC/2011 M w × h All �29 RC: M.M. Cheng et al. [13] CVPR/2011 C w × h All �30 HC: M.M. Cheng et al. [13] CVPR/2011 C w × h All �31 Materias: Li et al. [36] BMVC/2011 M w × h All �32 LiuIETIP: Liu et al. [42] IEEE TIP/2011 S w × h ASD �33 Mishra: Mishra et al. [49] PAMI/2011 C w × h All �34 SRS1: Siagian and Koch [50] Submitted. C w × h All �
Table 2. Compared saliency models originally developed for eye fixation prediction
# Acronym (Model) Ref. Pub/Year Code Resolution DB Avl.1 ITTI: Itti et al. [2] PAMI/1998 C w/16× h/16 All �2 ITTI98: Itti et al. (maxNorm) [2] PAMI/1998 C w/16× h/16 All �3 AIM: Bruce and Tsotsos [4] NIPS/2005 M w/2× h/2 All �4 GBVS: Harel et al. [3] NIPS/2006 M w × h All �5 HouCVPR: Hou and Zhang [5] CVPR/2007 M 64 × 64 All �6 HouNIPS: Hou and Zhang [6] NIPS/2008 M w × h All �7 SUN: Zhang et al. [10] JOV/2008 M w/2× h/2 All �8 PQFT: Guo and Zhang [56] TIP/2009 M 400 × 400 All �9 SEO: Seo and Milanfar [8] JOV/2009 M w × h All �10 AWS: Diaz et al. [7] ACIVS/2009 M w/2× h/2 All �11 Judd: Judd et al. [1] ICCV/2009 M w × h All �
(SED2). Fig. 2.a shows entropy of images. ASD and MSRA contain more clut-tered scenes. Histogram of normalized object sizes (object size/image size) isplotted in Fig. 2.b. It shows there are few images with large objects in thesedatasets. Objects usually range from small to medium size, about 30% of thewhole image (with MSRA containing larger objects on average). Fig. 2.c showssubject agreement for an image which is defined as:

418 A. Borji, D.N. Sihite, and L. Itti
r =2
n(n− 1)
n−1∑
i=1
n∑
j=i+1
|si ∩ sj||si ∪ sj| (1)
where si and sj are annotations of the i− th and j− th subjects (of n subjects).Above score has the well-defined lower bound of 0 when there is no overlap insegmentations of users and upper-bound of 1 when they have perfect overlap.As Fig. 2 shows, subjects have higher agreement over MSRA, SED1, and SED2datasets (about 70% of r values are above 0.9) compared to the SOD dataset.
Proposed Combined Models. Since different models are based on differ-ent hypotheses and algorithms, it is likely that combining evidences from themmay enhance the saliency detection accuracy. Here, we investigate such an idea.Let p(xf ) represent the probability of an image pixel x being part of the salientforeground object (i.e., 2D normalized saliency map [0 1]). Let p(xf |Mi) be suchevidence from the i − th model. Assuming independence among models (i.e.,p(xf |Mi,Mj) ∝ p(xf |Mi)p(xf |Mj)), then a Naive Bayesian evidence accumula-tion would be:
p(xf |M1,M2, · · · ,MK) ∝ 1
Z
K∏
k=1
p(xf |Mk) (2)
where K is the number of models and Z is chosen in a way that the final mapis a probability density function (pdf). Since, a very small value by only a singlemodel suppresses all evidences from the other models in the multiplication case(Eq. 2), we also consider another combination scheme using linear summation:
p(xf |M1,M2, · · · ,MK) ∝ 1
Z
K∑
k=1
G(p(xf |Mk))
(3)
where G(x) is one of three combination functions: 1) identity (i.e.,G(x) = x), 2)exp(x), and 3) −1/log(x). We chose exp and −1/log functions to avoid negativevalues and weigh the highly salient regions more, assuming that models are moreaccurate at the peaks of their saliency maps.
Evaluation Scores. Similar to [16], we calculate the precision-recall (PR)curve by varying a threshold on the intensity values [0:0.05:1] and generating a bi-nary saliency map. Since MSRA dataset has bounding boxes, we first fit a rectan-gle to the thresholded saliency map, fill it, and then calculate scores using bound-
ing boxes. We also report the F-Measure defined as: Fβ = (1+β2)Precision×Recallβ2Precision+Recall .
Here, as in [16] and [13], we use β2 = 0.3 to weigh precision more than recall.We also calculate the ROC and AUC (Area Under ROC Curve) results from truepositive rates and false positive rates obtained during the calculation of PR.
4 Experiments and Results
Baseline Models.We implemented two simple yet powerful baseline models: 1)MAP explained in Sec. 3 and Fig. 2, and 2) Human Inter-observer (IO) ’model’which is the aggregated map of annotations by other subjects (excluding the oneunder test) for each image. The IO model provides an upper bound for othermodels since humans usually agree in annotating the most salient object.

Salient Object Detection: A Benchmark 419
ASD SED1 SED2 SODMSRA
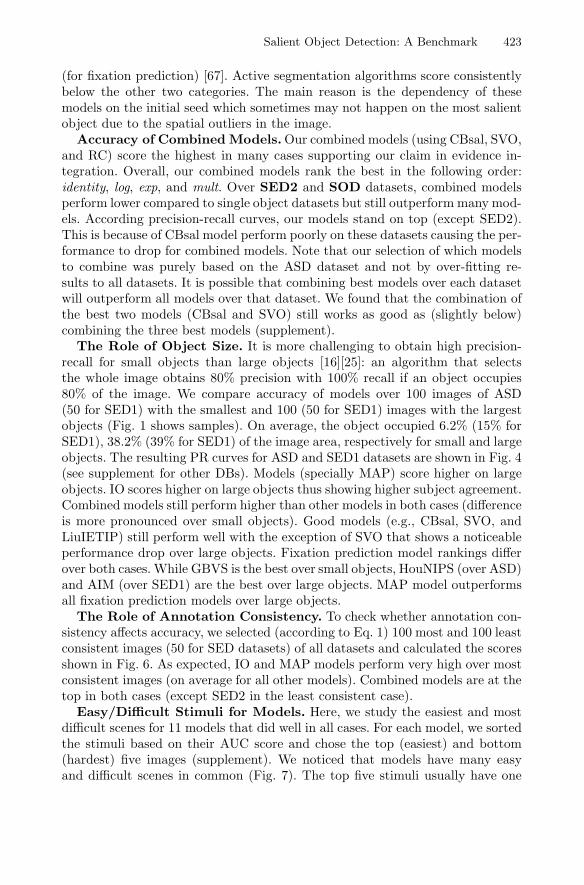
Fig. 1. Sample images from the datasets. Top row shows the five smallest ob-jects and bottom row shows the five largest objects from each dataset. 1)ASD [16]: This dataset contains 1,000 images from the MSRA dataset. Authorshave manually segmented the salient object (contour) within the user-drawn rect-angle to obtain binary masks. Link: http://ivrgwww.epfl.ch/$\sim$achanta/ . 2)MSRA [33]: This dataset (part B of the original dataset) includes 5,000 im-ages containing labeled rectangles from nine users drawing a rectangular shapearound what they consider the most salient object. There is a large variationamong images including natural scenes, animals, indoor, outdoor, resolution, etc.Link: http://research.microsoft.com/en-us/um/people/jiansun/SalientObject/
salient object.htm . 3) SED [47]: This dataset contains two parts. The first one,single object database(SED1), has 100 images containing only one salient objectsimilar to the ASD. But in the second one, two objects database(SED2), thereare two salient objects in each image (100 images). Our purpose in employing thisdataset is to evaluate the accuracy of models when there is more than one ob-ject in a scene is to evaluate accuracy of models over more complex stimuli. It isstill not clear how the models developed over single-object datasets will scale upin more general cases. Each of one-object and two-object datasets contain 100 im-ages. Link: http://www.wisdom.weizmann.ac.il/$\sim$vision/Seg_Evaluation_DB.4) SOD [46]: This dataset is a collection of salient object boundariesbased on the Berkeley Segmentation Dataset (BSD). Seven subjects areasked to choose the salient object(s) in 300 images. This dataset con-tains many images with several objects making it challenging for models.Link: http://elderlab.yorku.ca/$\sim$vida/SOD/index.html . Another interestingdataset called Imgsal contains both human fixations and tagging of objects with dif-ferent sizes. Link: http://www.cim.mcgill.ca/$\sim$lijian/database.htm.

420 A. Borji, D.N. Sihite, and L. Itti
Fig. 2. a) histogram of image entropy (inset: location prior MAP), b) distribution ofnormalized object sizes, c) distribution of annotators agreement (0 � r � 1). Note thatthe ASD dataset has only one annotator.
Fig. 3 shows precision-recall, F-measure, ROC curves, and AUC values for allmodels over five datasets. Model rankings using F-measure usually do not matchwith the other scores (although very similar). Therefore, we focus on drawingconclusions based on ROC, AUC, and PR scores as they are more consistent.
Accuracy of Baseline Models. There is still a large gap between existingmodels and the IO over all datasets which indicates room for improvement. TheIO model performs lower on the SOD. This also could be verified from Fig. 2where subjects show less agreement since there is no unique salient object inmany images. MAP model stands somewhere in the middle, better than somemodels indicating that a simple center-biased model could capture a lot of salientregions. MAP performs the lowest on the SED2 because two objects do notalways happen at exact locations of the two left and right peaks of the MAPmodel. Random predictor, a map with the value for each pixel taken uniformlyrandom from the range [0 1], scores 0.5 on AUC and provides a theoreticallower-bound for models. All models perform above chance level in all cases.
Model Rankings. Table 3 shows the best four models from salient objectdetection and fixations prediction categories over 5 datasets. Based on averagerankings using AUC, SVO, Goferman, CBsal, and RC rank as the top four inorder. For fixation prediction, on average the four best models are: GBVS, AIM,HouNIPS, and AWS. Among salient object detection models, SRS1, Michal-Gazit, Mishra, and EDS usually rank at the bottom over datasets. LC and ACmodels also perform poorly using AUC and PR. SalLiu is a good model in termsof AUC score and F-measure but not PR. This might be due to the binary natureof its saliency maps. Goferman is usually good using AUC but not as good usingPR. Low performance of MichalGazit is probably due to its very sparse maps.MAP model does well over SOD dataset indicating existence of center-bias. Ourresults show that SOD is the most difficult dataset for models (they perform

Salient Object Detection: A Benchmark 421
SED2
SOD
SED1
Precision-Recall (PR)
ASD
F-measure ROC AUC
MSR
A
Fig. 3. PR, F-measure, ROC, and AUC scores of saliency models: Top row for eachdataset shows saliency segmentation and bottom row shows fixation prediction models.mult indicates multiplication of models, and identity, log, exp indicate linear summationof identity, logarithmic, and exponential functions, respectively (see text).

422 A. Borji, D.N. Sihite, and L. Itti
poorly and score on a narrow band) while ASD and MSRA (the biggest datasetwith rectangular annotations) datasets are the easiest ones.
MAP model ranks in the middle among fixation prediction models. On SOD,MAP model works very well, right below the best model, repeatedly indicatinghigh center bias in this dataset (Fig. 2). Using F-measure AIM consistentlyranks above other models. ITTI and PQFT rank at the bottom over all datasets.The ITTI98 model is based on the same principles of the ITTI model but usesmaxNorm normalization: For each feature map, find the global max M and theaverage m of all other local maxima. Then, weigh the map by (M −m)2. Pleaserefer to [67] for a full investigation of fixation prediction models.
Table 3. Model rankings over categories and datasets using AUC. Gof. = Goferman.
# Salient object detection models Fixation prediction models
ASD MSRA SED1 SED2 SOD ASD MSRA SED1 SED2 SOD
1 CBsal CBsal Gof. RC SVO GBVS GBVS AIM AWS GBVS
2 LiuICIP SVO SVO Gof. Gof. HouNIPS HouNIPS GBVS GBVS MAP
3 SVO Gof. CBsal HC MAP AIM AIM MAP SEO AIM
4 LiuIETIP RC PMehrani SVO RC AWS MAP HouNIPS AIM HouNIPS
AS
DS
ED
1
Fig. 4. Accuracy of models over small and large objects from ASD and SED1 datasets
Models built originally for fixation prediction, on average, perform lower thanmodels specifically built to detect and segment the most salient object in a scene.Best fixation prediction models perform better than poor saliency detection mod-els. Why does performance accuracy of the two categories of approaches differover segmentation datasets? The reason lies on the amount of true positives vs.false positives. Segmentation approaches try to generate white salient regions tocapture more of the true positives. On the other hand, fixation prediction modelsare very selective and generate few false positives (there are not many fixationson the image). In a separate study, we noticed that fixation prediction mod-els perform better than the saliency detection models over eye fixation datasets
Salient Object Detection: A Benchmark 423
(for fixation prediction) [67]. Active segmentation algorithms score consistentlybelow the other two categories. The main reason is the dependency of thesemodels on the initial seed which sometimes may not happen on the most salientobject due to the spatial outliers in the image.
Accuracy of Combined Models.Our combined models (using CBsal, SVO,and RC) score the highest in many cases supporting our claim in evidence in-tegration. Overall, our combined models rank the best in the following order:identity, log, exp, and mult. Over SED2 and SOD datasets, combined modelsperform lower compared to single object datasets but still outperform many mod-els. According precision-recall curves, our models stand on top (except SED2).This is because of CBsal model perform poorly on these datasets causing the per-formance to drop for combined models. Note that our selection of which modelsto combine was purely based on the ASD dataset and not by over-fitting re-sults to all datasets. It is possible that combining best models over each datasetwill outperform all models over that dataset. We found that the combination ofthe best two models (CBsal and SVO) still works as good as (slightly below)combining the three best models (supplement).
The Role of Object Size. It is more challenging to obtain high precision-recall for small objects than large objects [16][25]: an algorithm that selectsthe whole image obtains 80% precision with 100% recall if an object occupies80% of the image. We compare accuracy of models over 100 images of ASD(50 for SED1) with the smallest and 100 (50 for SED1) images with the largestobjects (Fig. 1 shows samples). On average, the object occupied 6.2% (15% forSED1), 38.2% (39% for SED1) of the image area, respectively for small and largeobjects. The resulting PR curves for ASD and SED1 datasets are shown in Fig. 4(see supplement for other DBs). Models (specially MAP) score higher on largeobjects. IO scores higher on large objects thus showing higher subject agreement.Combined models still perform higher than other models in both cases (differenceis more pronounced over small objects). Good models (e.g., CBsal, SVO, andLiuIETIP) still perform well with the exception of SVO that shows a noticeableperformance drop over large objects. Fixation prediction model rankings differover both cases. While GBVS is the best over small objects, HouNIPS (over ASD)and AIM (over SED1) are the best over large objects. MAP model outperformsall fixation prediction models over large objects.
The Role of Annotation Consistency. To check whether annotation con-sistency affects accuracy, we selected (according to Eq. 1) 100 most and 100 leastconsistent images (50 for SED datasets) of all datasets and calculated the scoresshown in Fig. 6. As expected, IO and MAP models perform very high over mostconsistent images (on average for all other models). Combined models are at thetop in both cases (except SED2 in the least consistent case).
Easy/Difficult Stimuli for Models. Here, we study the easiest and mostdifficult scenes for 11 models that did well in all cases. For each model, we sortedthe stimuli based on their AUC score and chose the top (easiest) and bottom(hardest) five images (supplement). We noticed that models have many easyand difficult scenes in common (Fig. 7). The top five stimuli usually have one
424 A. Borji, D.N. Sihite, and L. Itti
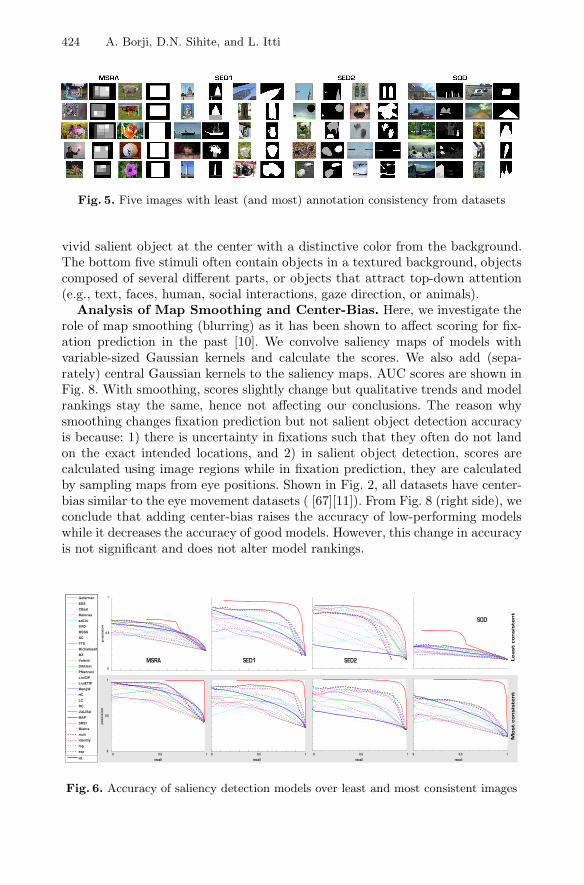
Fig. 5. Five images with least (and most) annotation consistency from datasets
vivid salient object at the center with a distinctive color from the background.The bottom five stimuli often contain objects in a textured background, objectscomposed of several different parts, or objects that attract top-down attention(e.g., text, faces, human, social interactions, gaze direction, or animals).
Analysis of Map Smoothing and Center-Bias. Here, we investigate therole of map smoothing (blurring) as it has been shown to affect scoring for fix-ation prediction in the past [10]. We convolve saliency maps of models withvariable-sized Gaussian kernels and calculate the scores. We also add (sepa-rately) central Gaussian kernels to the saliency maps. AUC scores are shown inFig. 8. With smoothing, scores slightly change but qualitative trends and modelrankings stay the same, hence not affecting our conclusions. The reason whysmoothing changes fixation prediction but not salient object detection accuracyis because: 1) there is uncertainty in fixations such that they often do not landon the exact intended locations, and 2) in salient object detection, scores arecalculated using image regions while in fixation prediction, they are calculatedby sampling maps from eye positions. Shown in Fig. 2, all datasets have center-bias similar to the eye movement datasets ( [67][11]). From Fig. 8 (right side), weconclude that adding center-bias raises the accuracy of low-performing modelswhile it decreases the accuracy of good models. However, this change in accuracyis not significant and does not alter model rankings.
Mo
st
co
nsis
ten
tL
ea
st
co
nsis
ten
t
SED1 SED2
SOD
MSRA
Fig. 6. Accuracy of saliency detection models over least and most consistent images
Salient Object Detection: A Benchmark 425
Fig. 7. Left) Easiest stimuli for 11 best models (Fig. 3), Right) Most difficult stimuli
Smoothing Adding center-bias
Fig. 8. Left: scores of models for maps smoothed with 2 Gaussian kernel sizes over ASDdataset. Right: model accuracy by adding Gaussian center-bias to center of a map.
ASD dataset
Arb
itra
ry d
ime
nsio
n 2
Arbitrary dimension 1
Fig. 9. Measuring modelsimilarities
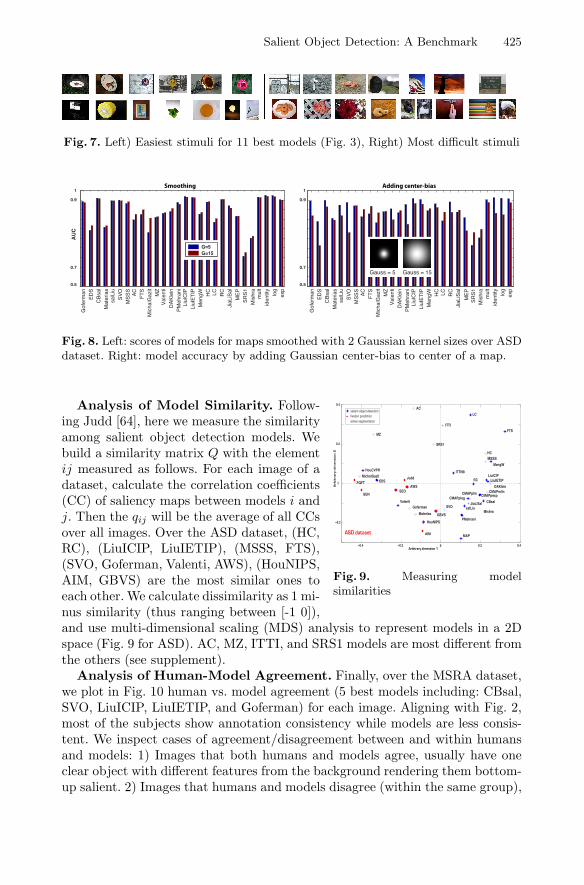
Analysis of Model Similarity. Follow-ing Judd [64], here we measure the similarityamong salient object detection models. Webuild a similarity matrix Q with the elementij measured as follows. For each image of adataset, calculate the correlation coefficients(CC) of saliency maps between models i andj. Then the qij will be the average of all CCsover all images. Over the ASD dataset, (HC,RC), (LiuICIP, LiuIETIP), (MSSS, FTS),(SVO, Goferman, Valenti, AWS), (HouNIPS,AIM, GBVS) are the most similar ones toeach other. We calculate dissimilarity as 1 mi-nus similarity (thus ranging between [-1 0]),and use multi-dimensional scaling (MDS) analysis to represent models in a 2Dspace (Fig. 9 for ASD). AC, MZ, ITTI, and SRS1 models are most different fromthe others (see supplement).
Analysis of Human-Model Agreement. Finally, over the MSRA dataset,we plot in Fig. 10 human vs. model agreement (5 best models including: CBsal,SVO, LiuICIP, LiuIETIP, and Goferman) for each image. Aligning with Fig. 2,most of the subjects show annotation consistency while models are less consis-tent. We inspect cases of agreement/disagreement between and within humansand models: 1) Images that both humans and models agree, usually have oneclear object with different features from the background rendering them bottom-up salient. 2) Images that humans and models disagree (within the same group),

426 A. Borji, D.N. Sihite, and L. Itti
Fig. 10. Analysis of human model agreement over MSRAdataset
usually are not easy todefine the most salientobject. Salient objectshave several parts ina crowded background.The most interestingcase is when humans(within) disagree withmodels agree (and viceversa). 3) Images forwhich models disagreeusually have textured backgrounds with salient objects sharing similar featureswith the background. However, this does not disrupt the top-down mechanismsby which humans decide the most salient object. 4) Images that humans dis-agree but models agree, usually contain salient objects with multiple parts anddifferent features from the background. This makes detecting the salient objectwith several parts easy for models but difficult for humans. Overall, there arenot many cases for which humans disagree.
5 Conclusions
Based on the extensive experiments over 5 datasets, we conclude that SVO [27],Goferman [15], CBsal [31], RC [13], and Liu et al. [53][52] (LiuICIP and LiuI-ETIP) work better than the others overall. Salient object detection models (Ta-ble 1) perform better than fixation prediction models (Table 2). Map smoothingis not a big challenge to scoring as opposed to the fixation prediction. SODhas 300 images and is the hardest dataset for models which encourages furthereffort in the future. Many models share the easiest and the most difficult stim-uli. Although model rankings remain the same over small and large objects,model accuracy is higher over large objects. Further, models work better onthe most consistent images. Scenes containing objects in textured and clutteredbackgrounds are challenging for many models. There are cases where the level ofagreement on salient object is low among humans but high for the models. Anal-ysis of model similarity shows that some models use different saliency detectionmechanisms. Focusing on these models may inspire further development.
We showed that a simple integration scheme generalizes well across datasets. Itsuggests using more sophisticated combination techniques (e.g., by selecting andcombining different models) which may enhance accuracies. While most of themodels try to correctly segment the object regions, only recentlyresearchers (e.g., [46]) have started to account for image boundary. Contem-porary saliency detection datasets suffer from the drawback that they containimages with few (oftentimes one) close-up objects. Future work should investi-gate collecting datasets with more variety including cluttered scenes with mul-tiple objects. Majority of existing models are only applicable to static images.Further research is needed to scale up current models or build new models in

Salient Object Detection: A Benchmark 427
the spatio-temporal domain. Models have different implementation languages(C++, Matlab) which makes analysis of computational complexity challenging.While previous progress is promising, further work is needed to bridge the ex-isting gap among current models and human performance. To ease this processand initiate a collaborative effort, we share our results, data, and software in ourwebsite.
References
1. Judd, T., Ehinger, K., Durand, F.: Learning to predict where humans look. In:ICCV (2009)
2. Itti, L., Koch, C., Niebur, E.: A model of saliency-based visual attention for rapidscene analysis. IEEE Trans. PAMI 20(11), 1254–1259 (1998)
3. Harel, J., Koch, C., Perona, P.: Graph-based visual saliency. In: NIPS (2006)4. Bruce, N.D.B., Tsotsos, J.K.: Saliency based on information maximization. In:
NIPS (2005)5. Hou, X., Zhang, L.: Saliency detection: A spectral residual approach. In: CVPR
(2007)6. Hou, X., Zhang, L.: Dynamic attention: Searching for coding length increments.
In: NIPS (2008)7. Garcia-Diaz, A., Fdez-Vidal, X.R., Pardo, X.M., Dosil, R.: Decorrelation and Dis-
tinctiveness Provide with Human-Like Saliency. In: Blanc-Talon, J., Philips, W.,Popescu, D., Scheunders, P. (eds.) ACIVS 2009. LNCS, vol. 5807, pp. 343–354.Springer, Heidelberg (2009)
8. Seo, H.J., Milanfar, P.: Static and space-time visual saliency detection by self-resemblance. Journal of Vision 9, 1–27 (2009)
9. Walther, D., Koch, C.: Modeling attention to salient proto-objects. Neural Net.(2006)
10. Zhang, L., Tong, M.H., Marks, T.K., Shan, H., Cottrell, G.W.: SUN: A Bayesianframework for saliency using natural statistics. JOV (2008)
11. Tatler, B.W.: The central fixation bias in scene viewing: selecting an optimal view-ing position independently of motor bases and image feature distributions. J. Vi-sion 14(7) (2007)
12. Zhai, Y., Shah, M.: Visual attention detection in video sequences using spatiotem-poral cues. ACM Multimedia (2006)
13. Cheng, M.M., Zhang, G.X., Mitra, N.J., Huang, X., Hu, S.M.: Global contrastbased salient region detection. In: CVPR (2011)
14. Achanta, R., Estrada, F.J., Wils, P., Susstrunk, S.: Salient Region Detection andSegmentation. In: Gasteratos, A., Vincze, M., Tsotsos, J.K. (eds.) ICVS 2008.LNCS, vol. 5008, pp. 66–75. Springer, Heidelberg (2008)
15. Goferman, S., Zelnik-Manor, L., Tal, A.: Context-aware saliency detection. In:CVPR (2010)
16. Achanta, R., Hemami, S., Estrada, F., Susstrunk, S.: Frequency-tuned salient re-gion detection. In: CVPR (2009)
17. Wang, J., Sun, J., Quan, L., Tang, X., Shum, H.Y.: Picture collage. In: CVPR(2006)
18. Wang, M., Konrad, J., Ishwar, P., Jing, Y., Rowley, H.: Image saliency: from in-trinsic to extrinsic context. In: CVPR (2011)
19. Rosin, P.L.: A simple method for detecting salient regions. Pattern Rec. (2009)

428 A. Borji, D.N. Sihite, and L. Itti
20. Goferman, S., Tal, A., Zelnik-Manor, L.: Puzzle-like collage. In: EuroGraphics(2010)
21. Zhang, W., Wu, Q.M.J., Wang, G., Yin, H.: An adaptive computational model forsalient object detection. IEEE Trans. on Multimedia 12(4) (2010)
22. Feng, J., Wei, Y., Tao, L., Zhang, C., Sun, J.: Salient object detection by compo-sition. In: ICCV (2011)
23. Mehrani, P., Veksler, O.: Saliency segmentation based on learning and graph cut.In: BMVC (2010)
24. Lu, Y., Zhang, W., Lu, H., Xue, X.: Salient object detection using concavity con-text. In: ICCV (2011)
25. Klein, D.A., Frintrop, S.: Center-surround divergence of feature statistics for salientobject detection. In: ICCV (2011)
26. Wang, L., Xue, J., Zheng, N., Hua, G.: Automatic Salient object extraction withcontextual cue. In: ICCV (2011)
27. Chang, K.Y., Liu, T.L., Chen, H.T., Lai, S.H.: Fusing generic objectness and visualsaliency for salient object detection. In: ICCV (2011)
28. Khuwuthyakorn, P., Robles-Kelly, A., Zhou, J.: Object of Interest Detection bySaliency Learning. In: Daniilidis, K., Maragos, P., Paragios, N. (eds.) ECCV 2010,Part II. LNCS, vol. 6312, pp. 636–649. Springer, Heidelberg (2010)
29. Rahtu, E., Kannala, J., Salo, M., Heikkila, J.: Segmenting Salient Objects fromImages and Videos. In: Daniilidis, K., Maragos, P., Paragios, N. (eds.) ECCV2010, Part V. LNCS, vol. 6315, pp. 366–379. Springer, Heidelberg (2010)
30. Kanan, C., Cottrell, G.: Robust classification of objects, faces, and flowers usingnatural image. In: CVPR (2010)
31. Jiang, H., Wang, J., Yuan, Z., Liu, T., Zheng, N., Li, S.: Automatic salient objectsegmentation based on context and shape prior. In: BMVC (2011)
32. Li, J., Tian, Y., Huang, T., Gao, W.: A dataset and evaluation methodology forvisual saliency in video. In: Int. Conf. on Multimedia and Expo., pp. 442–445 (2009)
33. Liu, T., Sun, J., Zheng, N., Tang, X., Shum, H.: Learning to detect a salient object.In: CVPR (2007)
34. Gopalakrishnan, V., Hu, Y., Rajan, D.: Random walks on graphs to model saliencyin images. In: CVPR (2009)
35. Marchesotti, L., Cifarelli, C., Csurka, G.: A framework for visual saliency detectionwith applications to image thumbnailing. In: ICCV (2009)
36. Li, J., Levine, M.D., An, X., He, H.: Saliency detection based on frequency andspatial domain analysis. In: BMVC (2011)
37. Holtzman-Gazit, M., Zelnik-Manor, L., Yavneh, I.: Salient edges: A multi scaleapproach. In: ECCV, Workshop on Vision for Cognitive Tasks (2010)
38. Luo, Y., Yuan, J., Xue, P., Tian, Q.: Saliency Density Maximization for ObjectDetection and Localization. In: Kimmel, R., Klette, R., Sugimoto, A. (eds.) ACCV2010, Part III. LNCS, vol. 6494, pp. 396–408. Springer, Heidelberg (2011)
39. Deng, Q., Luo, Y.: Edge-based method for detecting salient objects. Opt. Eng. 50(2011)
40. Valenti, R., Sebe, N., Gevers, T.: Image saliency by isocentric curvedness and color.In: ICCV (2009)
41. Zhang, Q., Liu, H., Shen, J., Gu, G., Xiao, H.: An improved computational ap-proach for salient region detection. Journal of Computers (2010)
42. Li, H., Ngan, K.N.: A co-saliency model of image pairs. IEEE Trans. Image Process(2011)
43. Ge, F., Wang, S.: New benchmark for image segmentation evaluation. Journal ofElectronic Imaging 16(3) (2007)

Salient Object Detection: A Benchmark 429
44. Estrada, F.J., Jepson, A.D.: Benchmarking image segmentation algorithms. IJCV(2009)
45. Ancuti, C.O., Ancuti, C., Bekaert, P.: CVPR (2011)46. Movahedi, V., Elder, J.H.: Design and perceptual validation of performance mea-
sures for salient object segmentation. In: POCV (2010)47. Alpert, S., Galun, M., Basri, R., Brandt, A.: Image segmentation by probabilistic
bottom-up aggregation and cue integration. In: CVPR (2007)48. Ge, F., Wang, S., Liu, T.: Image-segmentation evaluation from the perspective of
salient object extraction. In: CVPR (2006)49. Mishra, A.K., Aloimonos, Y., Fah, C.L., Kassim, A.: Active visual segmentation.
IEEE Trans. PAMI (2011)50. Siagian, C., Koch, C.: Salient segmentation using contours and region growing
(submitted)51. Ma, Y.F., Zhang, H.J.: Contrast-based image attention analysis by using fuzzy
growing. ACM Multimedia, 374–381 (2003)52. Liu, Z., Xue, Y., Yan, H., Zhang, Z.: Efficient saliency detection based on Gaussian
models. IET Image Processing 5(2), 122–131 (2011)53. Liu, Z., Xue, Y., Shen, L., Zhang, Z.: Nonparametric saliency detection using kernel
density estimation. In: ICIP, pp. 253–256 (2010)54. Li, J., Tian, Y., Huang, T., Gao, W.: Probabilistic multi-task learning for visual
saliency estimation in video. IJCV 90(2), 150–165 (2010)55. Achanta, R., Susstrunk, S.: Saliency detection for content-aware image resizing. In:
ICIP (2009)56. Guo, C., Zhang, L.: A novel multiresolution spatiotemporal saliency detection
model and Its applications in image and video compression. IEEE Trans. on ImageProcessing (2010)
57. Huang, T.H., Cheng, K.Y., Chuang, Y.Y.: A collaborative benchmark for regionof interest detection algorithms. In: CVPR (2009)
58. Masciocchi, C.M., Mihalas, S., Parkhurst, D., Niebur, E.: Everyone knows what isinteresting: salient locations which should be fixated. Journal of Vision (2009)
59. Itti, L.: Automatic Foveation for Video Compression using a neurobiological modelof visual attention. IEEE Trans. Image Process (2004)
60. Ma, Y., Hua, X., Lu, L., Zhang, H.: A generic framework of user aattention modeland its application in video summarization. IEEE Trans. Multimedia (2005)
61. Borji, A., Itti, L.: State-of-the-art in visual attention modeling. IEEE Trans. Pat-tern Anal. Mach. Intell (2012)
62. Gao, D., Vasconcelos, N.: Discriminant saliency for visual recognition from clut-tered scenes. In: NIPS (2004)
63. Kienzle, W., Franz, M.O., Scholkopf, B., Wichmann, F.A.: Center-surround pat-terns emerge as optimal predictors for human saccade targets. J. Vision (2009)
64. Judd, T.: Understanding and predicting where people look. Phd Thesis, MIT (2011)65. Itti, L., Dhavale, N., Pighin, F.: SPIE (2003)66. Koehler, K., Guo, F., Zhang, S., Eckstein, M.: Vision Science Society (2011)67. Borji, A., Sihite, D.N., Itti, L.: Quantitative analysis of human-model agreement
in visual saliency modeling: a comparative study. IEEE Trans. Image Processing(2012)