loading control - novus biologicals · pdf fileloading controls 1 a loading control is...
TRANSCRIPT

Learn more | novusbio.comLearn more | novusbio.com
Novus-lu-2945 Loading ControlHandbook

Common Loading Control Proteins for Western Blot
kDa Whole Cell Cytoskeletal Mitochondrial Nuclear Serum
120 Viniculin
110
75 Transferrin
65 Lamin B1
60 HSP60
Alpha-tubulin Alpha-tubulin HDAC1
50 Beta-tubulin Beta-tubulin
Actin Actin
40 Beta-actin Beta-actin
35 GAPDH
VDCA1/porin PCNA
25
20 Cyclophilin B Cofilin
15 COX IV Histone H3
Introduction to Loading Controls
How to Normalize Your Western Blot Data
What to Consider When Using a Loading Control Antibody Detection Range Concentration Stripping and Reprobing
Summary: Attributes of an Effective Loading Control Protein
Protocols for Probing Loading Control Expression
Method 1: Stripping and Reprobing Method 2: Cutting the Membrane
1
2
3-5
6
7-8
TABLE OF CONTENTS

Learn more | novusbio.com
Introduction to Loading Controls
1
A Loading Control is Important for Data Normalization
Western blotting is a common laboratory technique used to detect and quantify target protein expression in a complex cell or tissue lysate. This technique provides a semi-quantitative method for the comparison of relative target protein levels across multiple samples. To generate accurate expression data by Western blot analysis, a loading control protein is required. Loading controls provide a means to ensure equal protein loading across wells, as well as a reference point for data normalization.
Prior to western blot analysis, the total amount of sample protein is measured using a biochemical assay (e.g. Bradford, BCA, etc.). Total protein measurements are then used to load equivalent amounts of protein across all wells of the gel. Equal protein loading is required to make accurate comparisons of target protein expression data. Despite experimental measures to prevent unequal loading, subsequent protocol steps, including uneven transfer from gel to membrane, can affect total sample protein. To verify equal loading of the gel and even transfer from gel to membrane, a second control is often required.
A loading control protein confirms equal sample loading and gel-to-membrane transfer. Following target protein detection, a loading control protein is detected and its expression is used to mathematically compensate for sample-to-sample variation. Normalized expression is then compared across samples to confirm that changes in protein of interest expression represent real differences and are not the result of differences in total protein abundance from sample-to-sample.
A LOADING CONTROL PROTEIN ALLOWS COMPARISON OF TARGET PROTEIN LEVELS ACROSS MULTIPLE SAMPLES

Learn more | novusbio.comLearn more | novusbio.com 2
How to Normalize Your Western Blot Data
Normalizing Western Blot Data
Data normalization is required to accurately compare target protein expression across multiple samples in Western blot analysis. To normalize target protein expression, the band intensity of each sample is determined by densitometry. Next, the intensity of the target protein is divided by the intensity of the loading control protein. This calculation adjusts the expression of the protein of interest to a common scale and reduces the impact of sample-to-sample variation. Relative target protein expression can then be compared across all lanes to assess changes in target protein expression across samples.
IMAGES FOR NORMALIZATION SECTION
3652
= 36=52
XLANE 1
2046
= 22.6=52
XLANE 2
247
= 2.2=52
XLANE 3
36= 1.0=
36LANE 1
36= 0.63=
22.6LANE 2
= 0.06=2.2
LANE 3
FOLD DIFFERENCE =
36
* *
Normalized Density(each lane)
Normalized Density(lane 1)
*Target Protein Loading Control
(each lane)
Loading Control(lane 1)( ) x
*
Target
Control
36 20 2
46 4752
NORMALIZED DENSITY =
Step 1Determine the intensity of each
band using densitometry software
Step 2Normalize the target protein levels
to the loading control protein
Step 3Compare relative target protein
levels across samples
Normalizing Western Blot Data: After band intensity is determined by densitometry software, the loading control protein is used to normalize target protein expression. To normalize expression, multiply the density of the target protein in each lane by the ratio of loading control density from the control sample (lane 1) to the loading control density of other lanes. The fold change can then be calculated by dividing the normalized expression from each lane by the normalized expression of the control sample in lane 1.
Note: Expression data determined by Western blot analysis is semi-quantitative. Protein abundance is expressed relative to the loading control protein and does not indicate the absolute amount of target protein in your sample.
* The first lane is loaded with the control sample. Data in lane 1 should be used to normalize expression
data in lanes 2 and 3.
Learn more | novusbio.com 23
What to Consider When Using a Loading Control Antibody
Detection Range and Gel Overloading
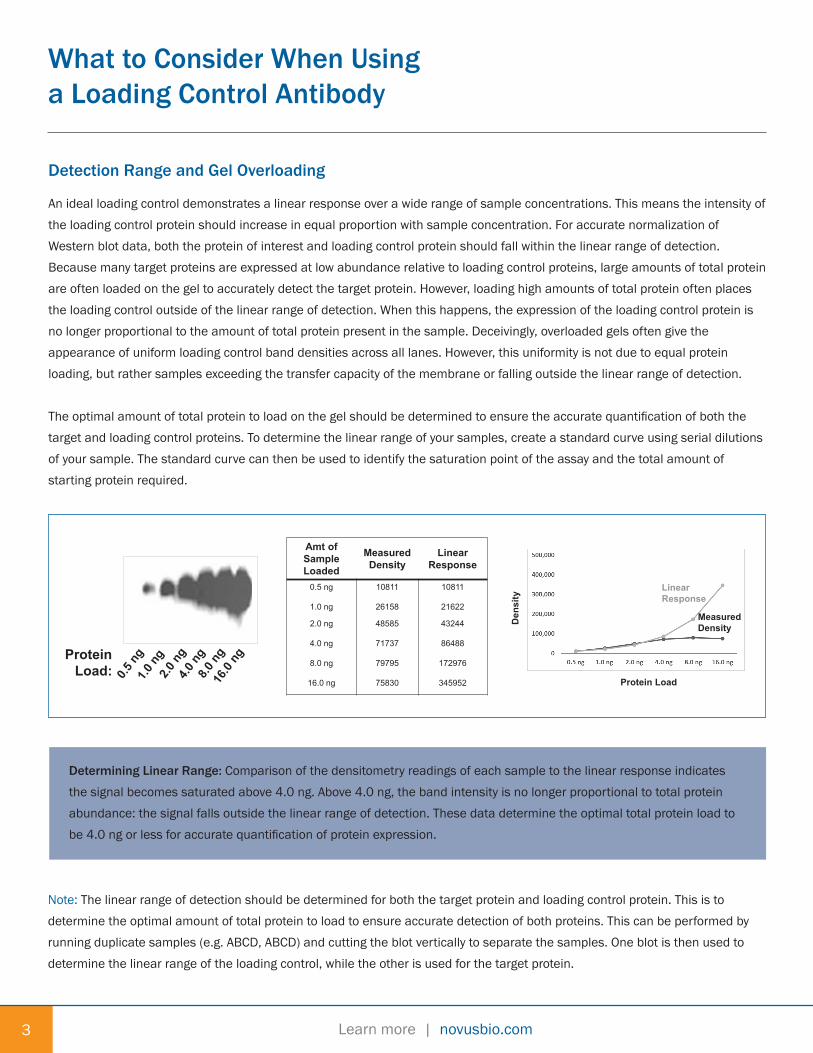
An ideal loading control demonstrates a linear response over a wide range of sample concentrations. This means the intensity of the loading control protein should increase in equal proportion with sample concentration. For accurate normalization of Western blot data, both the protein of interest and loading control protein should fall within the linear range of detection. Because many target proteins are expressed at low abundance relative to loading control proteins, large amounts of total protein are often loaded on the gel to accurately detect the target protein. However, loading high amounts of total protein often places the loading control outside of the linear range of detection. When this happens, the expression of the loading control protein is no longer proportional to the amount of total protein present in the sample. Deceivingly, overloaded gels often give the appearance of uniform loading control band densities across all lanes. However, this uniformity is not due to equal protein loading, but rather samples exceeding the transfer capacity of the membrane or falling outside the linear range of detection.
The optimal amount of total protein to load on the gel should be determined to ensure the accurate quantification of both the target and loading control proteins. To determine the linear range of your samples, create a standard curve using serial dilutions of your sample. The standard curve can then be used to identify the saturation point of the assay and the total amount of starting protein required.
Note: The linear range of detection should be determined for both the target protein and loading control protein. This is to determine the optimal amount of total protein to load to ensure accurate detection of both proteins. This can be performed by running duplicate samples (e.g. ABCD, ABCD) and cutting the blot vertically to separate the samples. One blot is then used to determine the linear range of the loading control, while the other is used for the target protein.
Determining Linear Range: Comparison of the densitometry readings of each sample to the linear response indicates the signal becomes saturated above 4.0 ng. Above 4.0 ng, the band intensity is no longer proportional to total protein abundance: the signal falls outside the linear range of detection. These data determine the optimal total protein load to be 4.0 ng or less for accurate quantification of protein expression.
Protein Load:
Amt of Sample Loaded
MeasuredDensity
Linear Response
0.5 ng 10811 10811
1.0 ng 26158 21622
2.0 ng 48585 43244
4.0 ng 71737 86488
8.0 ng 79795 172976
16.0 ng 75830 345952
Linear Response
MeasuredDensity
Protein Load
Den
sity
IMAGES FOR DETECTION RANGE SECTION Protein
Load:
Amt of Sample Loaded
MeasuredDensity
Linear Response
0.5 ng 10811 10811
1.0 ng 26158 21622
2.0 ng 48585 43244
4.0 ng 71737 86488
8.0 ng 79795 172976
16.0 ng 75830 345952
Linear Response
MeasuredDensity
Protein Load
Den
sity
IMAGES FOR DETECTION RANGE SECTION
Protein Load:
Amt of Sample Loaded
MeasuredDensity
Linear Response
0.5 ng 10811 10811
1.0 ng 26158 21622
2.0 ng 48585 43244
4.0 ng 71737 86488
8.0 ng 79795 172976
16.0 ng 75830 345952
Linear Response
MeasuredDensity
Protein Load
Den
sity
IMAGES FOR DETECTION RANGE SECTION
Learn more | novusbio.comLearn more | novusbio.com 2 4
What to Consider When Using a Loading Control Antibody
Concentration Dependence and Expression Consistency
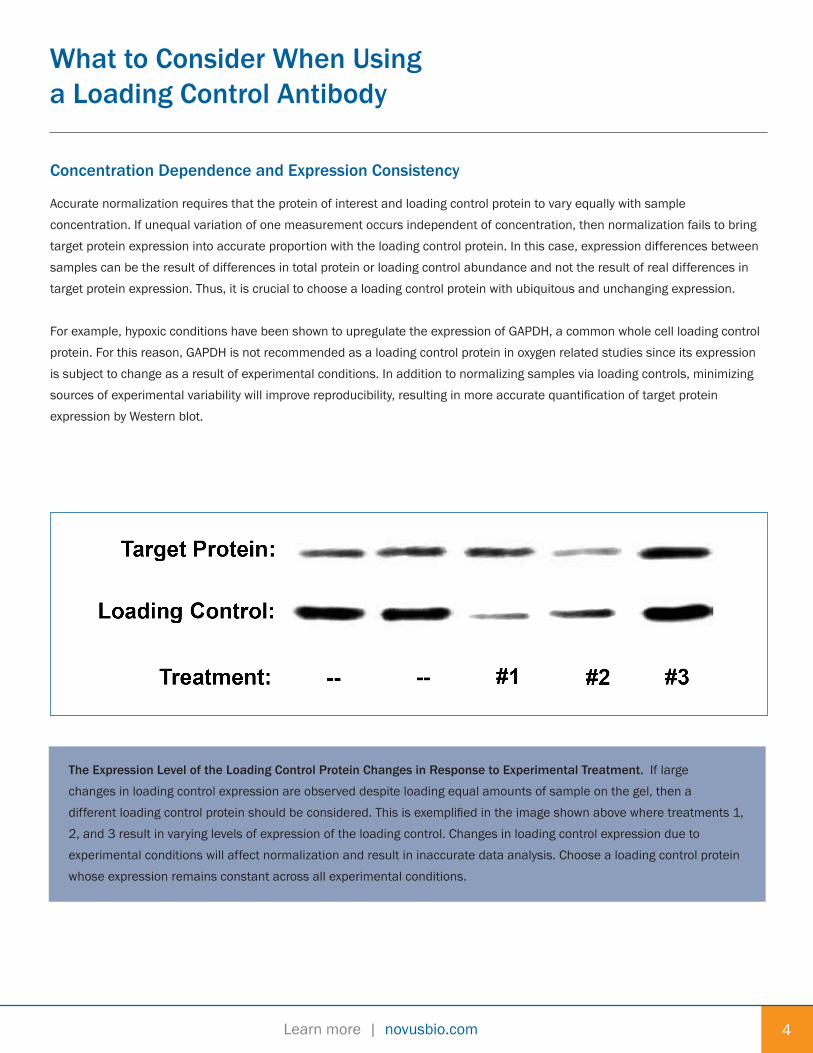
Accurate normalization requires that the protein of interest and loading control protein to vary equally with sample concentration. If unequal variation of one measurement occurs independent of concentration, then normalization fails to bring target protein expression into accurate proportion with the loading control protein. In this case, expression differences between samples can be the result of differences in total protein or loading control abundance and not the result of real differences in target protein expression. Thus, it is crucial to choose a loading control protein with ubiquitous and unchanging expression.
For example, hypoxic conditions have been shown to upregulate the expression of GAPDH, a common whole cell loading control protein. For this reason, GAPDH is not recommended as a loading control protein in oxygen related studies since its expression is subject to change as a result of experimental conditions. In addition to normalizing samples via loading controls, minimizing sources of experimental variability will improve reproducibility, resulting in more accurate quantification of target protein expression by Western blot.
The Expression Level of the Loading Control Protein Changes in Response to Experimental Treatment. If large changes in loading control expression are observed despite loading equal amounts of sample on the gel, then a different loading control protein should be considered. This is exemplified in the image shown above where treatments 1, 2, and 3 result in varying levels of expression of the loading control. Changes in loading control expression due to experimental conditions will affect normalization and result in inaccurate data analysis. Choose a loading control protein whose expression remains constant across all experimental conditions.

Learn more | novusbio.com5
What to Consider When Using a Loading Control Antibody
Stripping and Reprobing
A common method to determine expression of a loading control protein is stripping and reprobing. Following detection of the protein of interest, the membrane is stripped of antibodies, then reprobed with a loading control specific antibody. In this method, it is important that all antibody is stripped from the membrane to ensure generation of accurate loading control expression data. Residual antibody on the blot may result in artifacts which may impact loading control expression data. Moreover, blot stripping can result in significant loss of sample protein from the membrane, which could impact expression data and normalization calculations. After stripping, but before reprobing, the membrane should be tested to verify the first set of antibodies was completely removed. To confirm complete antibody removal, the membrane should be washed, blocked, and then stained with secondary antibody. If stripping was complete, then the secondary antibody will remain unbound and produce no detection signal. If signal is detected, then the stripping conditions must be optimized. Often small changes in incubation time or temperature are sufficient to remove the remaining antibody. However, a stronger stripping buffer may be necessary in certain cases for antibodies which are difficult to remove.
BEFORESTRIPPING
AFTERSTRIPPING
BEFORESTRIPPING
AFTERSTRIPPING
UNDER-STRIPPING OVER-STRIPPING
Insufficient Stripping: A primary antibody was used to probe expression of a target protein. Following target protein detection, the blot was stripped to remove antibodies, and then reprobed with HRP-conjugated secondary antibody to confirm complete stripping. The signal generated post-stripping demonstrates the stripping process was incomplete. Residual antibody left on the membrane bound the HRP conjugated secondary antibody, producing chemiluminescent signal.
Excessive Stripping: A primary antibody was used to probe expression of a target protein. Following target protein detection, the blot was stripped to remove antibodies, and then reprobed with the same target protein-specific antibody. The lower signal generated post-stripping demonstrates protein sample was stripped from the membrane. Unequal stripping of protein sample across lanes can result in inaccurate normalization. Special care should be taken when stripping blots consisting of samples from multiple sample types.
RESULTResidual antibody on the membrane results in signal as a result of incomplete stripping
RESULTLoss of proteinfrom the membrane as a result of over-stripping
Note: See page 7 for a general stripping and reprobing protocol.
BEFORESTRIPPING
AFTERSTRIPPING
BEFORESTRIPPING
AFTERSTRIPPING
UNDER-STRIPPING OVER-STRIPPING
Blot stripped and reprobed with HRP-conjugated secondary antibody
Blot stripped and reprobed with primary and secondary antibody
Learn more | novusbio.comLearn more | novusbio.com 6
Summary: Attributes of an Effective Loading Control Protein
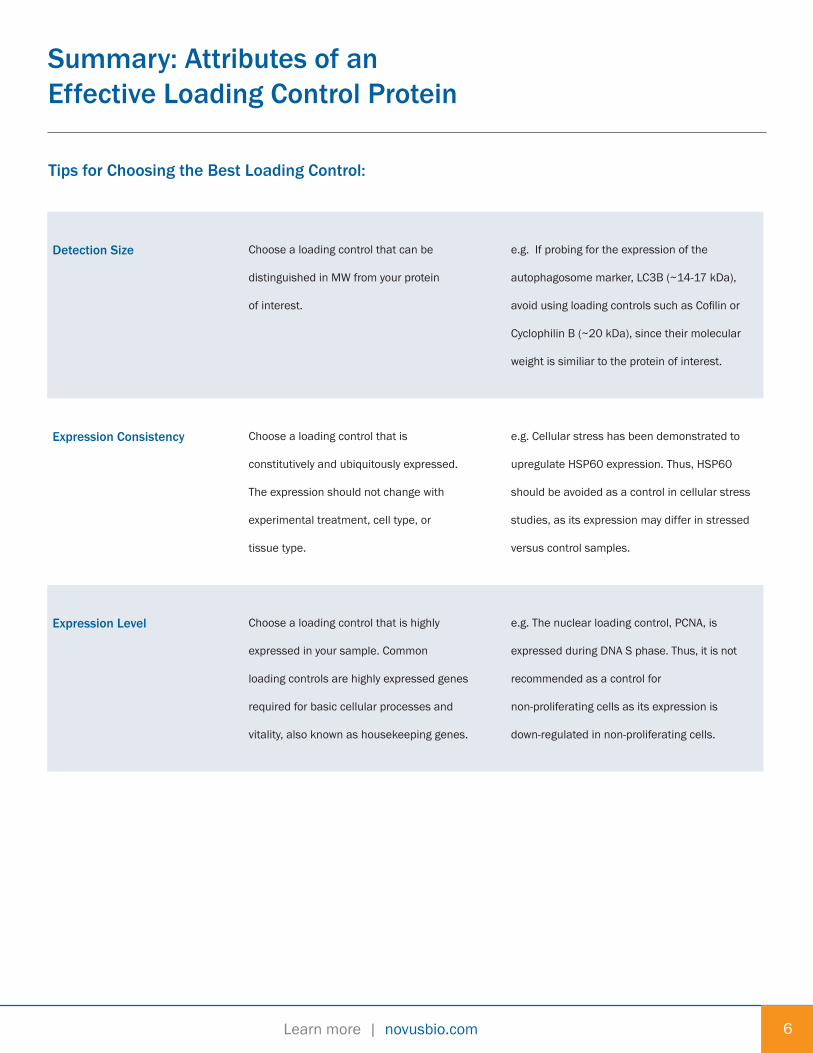
Tips for Choosing the Best Loading Control:
Detection Size
Choose a loading control that can be
distinguished in MW from your protein
of interest.
e.g. If probing for the expression of the
autophagosome marker, LC3B (~14-17 kDa),
avoid using loading controls such as Cofilin or
Cyclophilin B (~20 kDa), since their molecular
weight is similiar to the protein of interest.
Expression Consistency
Choose a loading control that is
constitutively and ubiquitously expressed.
The expression should not change with
experimental treatment, cell type, or
tissue type.
e.g. Cellular stress has been demonstrated to
upregulate HSP60 expression. Thus, HSP60
should be avoided as a control in cellular stress
studies, as its expression may differ in stressed
versus control samples.
Expression Level
Choose a loading control that is highly
expressed in your sample. Common
loading controls are highly expressed genes
required for basic cellular processes and
vitality, also known as housekeeping genes.
e.g. The nuclear loading control, PCNA, is
expressed during DNA S phase. Thus, it is not
recommended as a control for
non-proliferating cells as its expression is
down-regulated in non-proliferating cells.
Learn more | novusbio.com7
Probing Loading Control ExpressionMethod 1: Stripping and Reprobing
PROTOCOL
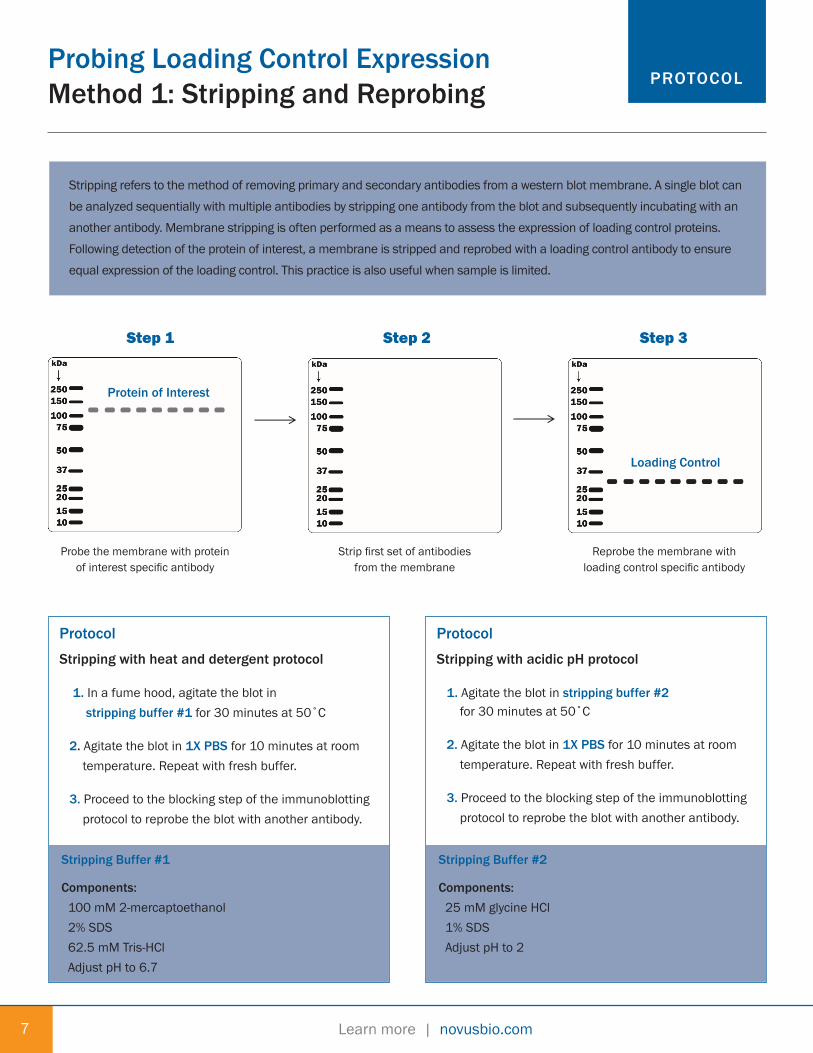
Stripping refers to the method of removing primary and secondary antibodies from a western blot membrane. A single blot can be analyzed sequentially with multiple antibodies by stripping one antibody from the blot and subsequently incubating with an another antibody. Membrane stripping is often performed as a means to assess the expression of loading control proteins. Following detection of the protein of interest, a membrane is stripped and reprobed with a loading control antibody to ensure equal expression of the loading control. This practice is also useful when sample is limited.
IMAGES FOR PROTOCOL SECTION
Step 1 Step 2 Step 3
Probe the membrane with protein of interest specific antibody
Strip first set of antibodies from the membrane
Reprobe the membrane with loading control specific antibody
Protein of Interest
Loading Control
Protocol
Stripping with heat and detergent protocol
1. In a fume hood, agitate the blot in stripping buffer #1 for 30 minutes at 50˚C
2. Agitate the blot in 1X PBS for 10 minutes at room temperature. Repeat with fresh buffer.
3. Proceed to the blocking step of the immunoblotting protocol to reprobe the blot with another antibody.
Stripping Buffer #1
Components: 100 mM 2-mercaptoethanol 2% SDS 62.5 mM Tris-HCl Adjust pH to 6.7
Protocol
Stripping with acidic pH protocol 1. Agitate the blot in stripping buffer #2 for 30 minutes at 50˚C
2. Agitate the blot in 1X PBS for 10 minutes at room temperature. Repeat with fresh buffer.
3. Proceed to the blocking step of the immunoblotting protocol to reprobe the blot with another antibody.
Stripping Buffer #2
Components: 25 mM glycine HCl 1% SDS Adjust pH to 2
Learn more | novusbio.comLearn more | novusbio.com
kDa
25015010075
50
37
25201510
8
Probing Loading Control ExpressionMethod 2: Cutting the Membrane
PROTOCOL
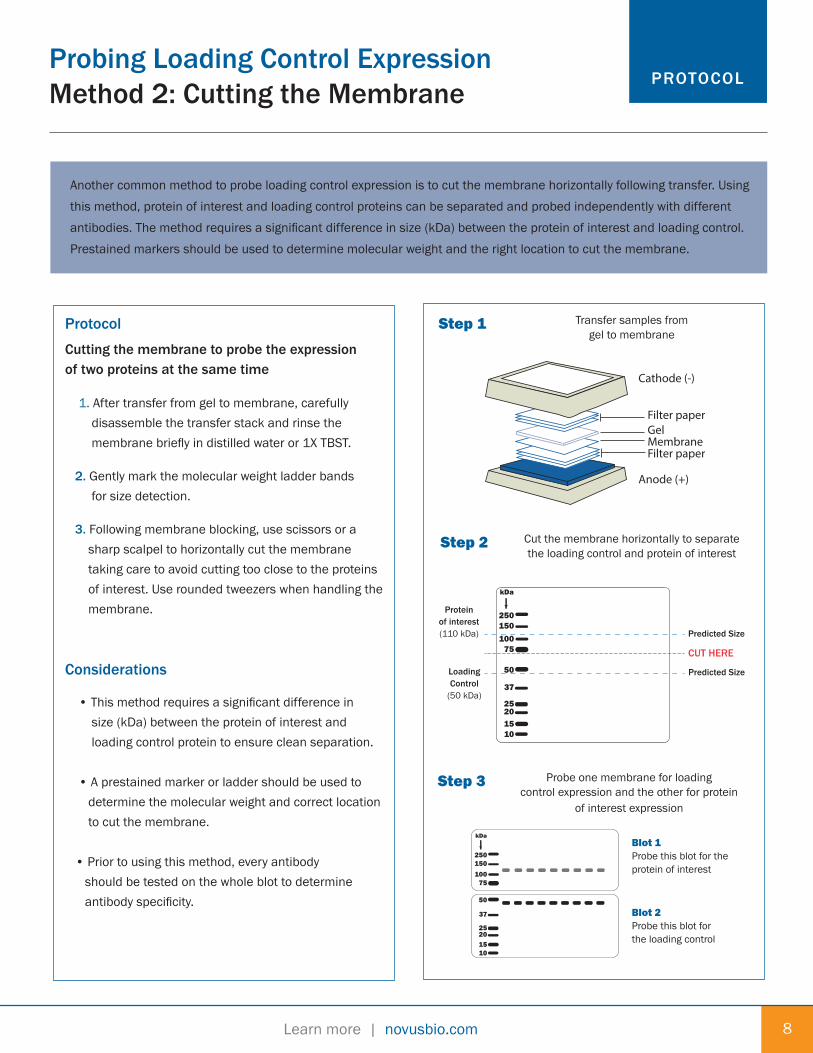
Another common method to probe loading control expression is to cut the membrane horizontally following transfer. Using this method, protein of interest and loading control proteins can be separated and probed independently with different antibodies. The method requires a significant difference in size (kDa) between the protein of interest and loading control. Prestained markers should be used to determine molecular weight and the right location to cut the membrane.
Protocol
Cutting the membrane to probe the expression of two proteins at the same time
1. After transfer from gel to membrane, carefully disassemble the transfer stack and rinse the membrane briefly in distilled water or 1X TBST.
2. Gently mark the molecular weight ladder bands for size detection.
3. Following membrane blocking, use scissors or a sharp scalpel to horizontally cut the membrane taking care to avoid cutting too close to the proteins of interest. Use rounded tweezers when handling the membrane.
Considerations
• This method requires a significant difference in size (kDa) between the protein of interest and loading control protein to ensure clean separation.
• A prestained marker or ladder should be used to determine the molecular weight and correct location to cut the membrane.
• Prior to using this method, every antibody should be tested on the whole blot to determine antibody specificity.
Cathode (-)
Filter paperGelMembraneFilter paper
Anode (+)
Step 1 Transfer samples from gel to membrane
Step 2 Cut the membrane horizontally to separate the loading control and protein of interest
Step 3 Probe one membrane for loading control expression and the other for protein
of interest expression
Blot 1Probe this blot for the protein of interest
Blot 2Probe this blot for the loading control
Proteinof interest(110 kDa)
LoadingControl
(50 kDa)
Predicted Size
Predicted Size
CUT HERE
kDa
25015010075
50
37
25201510

Learn more | novusbio.comBR_LoadingControls_101416
Global [email protected] bio-techne.com/find-us/distributors TEL +1 612 379 2956North America TEL 800 343 7475 Europe | Middle East | Africa TEL +44 (0)1235 529449China [email protected] TEL +86 (21) 52380373
bio-techne.com
Tocri-2945
For research use or manufacturing purposes only. Trademarks and registered trademarks are the property of their respective owners.
R&D Systems develops and manufactures high-quality proteins and serves as a world leader in immunoassays. R&D Systems also produces quality antibodies, antibody arrays, stem cell and cell culture products, and cell selection and detection products, serving the life science and diagnostics industry. rndsystems.com Novus Biologicals licenses, manufactures, and markets antibodies to over 20,000 unique targets to support a wide array of research areas. Novus is built on honesty, collaboration and strong relationships and continues to provide quality tools that accelerate research. Every product is backed by our 100% guarantee. novusbio.com Tocris Bioscience is the leading supplier of high performance tools for life science research. The Tocris range of small molecules and peptides includes novel and exclusive receptor ligands, ion channel modulators, enzyme inhibitors, caged compounds, fluorescent probes, and screening libraries. tocris.com ProteinSimple develops and commercializes proprietary systems and consumables for protein analysis that ultimately help reveal new insights into the true nature of proteins. Making protein analysis more quantifiable and affordable, their comprehensive portfolio of tools includes Simple Western™ and Simple Plex™ platforms that quantify protein expression and iCE and MFI® systems that probe the structure and purity of protein-based therapeutics. proteinsimple.com