localized teacher supply and demand in arkansas: an
TRANSCRIPT

University of Arkansas, FayettevilleScholarWorks@UARK
Theses and Dissertations
8-2018
Localized Teacher Supply and Demand inArkansas: An Exploration of the Supply andDemand of Teachers in Arkansas School DistrictsLeesa M. ForemanUniversity of Arkansas, Fayetteville
Follow this and additional works at: http://scholarworks.uark.edu/etd
Part of the Education Policy Commons
This Dissertation is brought to you for free and open access by ScholarWorks@UARK. It has been accepted for inclusion in Theses and Dissertations byan authorized administrator of ScholarWorks@UARK. For more information, please contact [email protected], [email protected].
Recommended CitationForeman, Leesa M., "Localized Teacher Supply and Demand in Arkansas: An Exploration of the Supply and Demand of Teachers inArkansas School Districts" (2018). Theses and Dissertations. 2832.http://scholarworks.uark.edu/etd/2832

Localized Teacher Supply and Demand in Arkansas: An Exploration of the Supply and Demand
of Teachers in Arkansas School Districts
A dissertation submitted in partial fulfillment
of the requirements for the degree of
Doctor of Philosophy in Education Policy
by
Leesa Foreman
Portland State University
Bachelor of Arts in Social Sciences, 1997
Portland State University
Master of Science in Special Education, 1999
August 2018
University of Arkansas
This dissertation is approved for recommendation to the Graduate Council.
___________________________________
Gary W. Ritter, Ph.D.
Dissertation Director
___________________________________
Patrick J. Wolf, Ph.D.
Committee Member
___________________________________
Robert Maranto, Ph.D.
Committee Member
Abstract
There have been widespread reports of an impending teacher shortage crisis in the U.S.
for more than 30 years. In the U.S., there are claims of a widespread national shortage while
research indicates teacher shortages are specific to certain subjects and schools. Part of the
reason for the conflicting accounts is how shortage is identified and what information is used to
assess it. In this study, I test whether a uniform teacher shortage exists across the state of
Arkansas. I hypothesize that, rather than a universal shortage, teacher shortages are more likely
to occur in certain regions and subjects. I examine the characteristics of districts with the most
favorable teaching supply and those with the greatest teaching need using descriptive and
multivariate analysis of data collected from district surveys along with administrative data. In
this study, “supply” is defined as the ratio of applications to vacancies and “need” is defined as
the ratio of vacancies to full-time equivalent (FTE) certified classroom teachers. This is the third
study to use applicants to identify teacher supply, and the first to assess teacher need or shortages
in this way. Results indicate teacher supply and need are unequally distributed across the state;
there is no uniform teacher shortage statewide. Regarding teacher supply, I find district size,
region, and urbanicity appear to drive supply. Teacher supply is most favorable for large
districts with student enrollments greater than 3,500, districts in the Northwest, and suburban and
city districts. Regarding teacher need, I find urbanicity and region contribute most to need and
the need appears greatest for districts in cities, and districts in the Central and Southeast regions.
Teacher need does not appear to be significantly influenced by district educational success,
teacher salary, or district growth. Looking at the relationship between teacher supply and need, I
find three clear relationships. In the Central and Southeast regions, there is lower teacher supply

and greater teacher need. In urban districts, there is both greater teacher supply and need. In
higher poverty districts, there is significantly less teacher supply and more teacher need.

©2018 by Leesa M. Foreman
All Rights Reserved

Acknowledgments
I would first like to extend special thanks to my dissertation committee: Gary Ritter,
Patrick Wolf, and Bob Maranto. Gary, you have been a constant source of encouragement and
positivity. Thank you for your valuable feedback and suggestions, and your sense of humor.
Pat, I can always count on you to catch any mishap ADAA mishaps - thank you for your keen
eye. Bob, thank you for your generosity and diligence in helping me get published. You all care
deeply about your students and we know it.
A special thanks also goes out to two individuals who were instrumental in helping me
complete certain tasks as part of this dissertation: Sarah McKenzie and Charlene Reid. Sarah,
thank you for all of your help with developing the survey, helping me practice for the defense,
and for talking me off the ledge when I needed it. Charlene, thank you for your Excel wizardry
and patience with my million little questions.
I would also like to extend special thanks to three women who mentored and inspired me
to embark on this doctoral journey: Nina Buchanan, Heather Nakakura, and Jackie Temple.
Nina, I know for certain I never would have applied for or been accepted to this program if it
weren’t for you. Thank you for believing in me. Heather, you amaze me by all the things you
manage to do, and do well, while keeping a smile on your face. Thank you for your support and
encouragement even when my leaving made things more difficult for you. Jackie, you showed
me it’s never too late to pursue your goals. Without your example, I would never have
considered pursuing a Ph.D.
To my cohort, Kaitlin Anderson, Beth (Yujie) Sude, and Dany (M. Danish) Shakeel, I am
honored to have shared this experience with you. We will always be family. Thank you for the
friendship, laughs, and good food. I hope you conquer the world and achieve all your dreams.

I would also like to extend thanks to the EDRE faculty – Jay Greene, Bob Costrell, Gema
Zamarro, Jon Mills, and Julie Trivitt. Thank you for your wisdom and expertise. I am truly
fortunate to have had the opportunity to learn with you.
To the EDRE students, staff, and alumni, I have learned something from each of you and
am delighted to have joined you on this journey. Thank you for your help and support, your
friendship, and high fives near and far. I look forward to all of your future successes.
To my family and friends, you helped keep me going and your support has been
invaluable. Through the laughter and tears I know I can count on you. I am so very grateful for
you all.

Dedication
This dissertation is dedicated to my grandmother, Margaret Foreman More, and all of my
former students. I wish you could be here to share this with me. “No one can ever take your
education away.” You inspire me to do better every day.

Table of Contents
Chapter 1: Introduction ...............................................................................................................1
Motivation ....................................................................................................................................1
Study Purpose ...............................................................................................................................2
Chapter 2: Review of the Literature ...........................................................................................5
Teacher Labor Market ..................................................................................................................6
Teacher Shortages ........................................................................................................................9
Arkansas Teacher Shortages ......................................................................................................17
Literature Review .......................................................................................................................20
Purpose of the Study ..................................................................................................................27
Contribution to the Literature .....................................................................................................27
Chapter 3: Methods ....................................................................................................................28
Data ............................................................................................................................................28
Analytic Sample .........................................................................................................................32
Descriptive Analysis ..................................................................................................................40
Multivariate Analysis .................................................................................................................41
Limitations .................................................................................................................................44
Chapter 4: Results.......................................................................................................................46
Teacher Supply ...........................................................................................................................46
Teacher Need ..............................................................................................................................78
Teacher Supply and Teacher Need ...........................................................................................106
Chapter 5: Conclusion ..............................................................................................................110
Discussion of the Findings .......................................................................................................110
Policy Implications/Recommendations ....................................................................................111
Further Research ......................................................................................................................114
References ...................................................................................................................................116
Appendices ..................................................................................................................................124
Appendix A: Supply Using Enrollment ...................................................................................124
Appendix B: Supply by District Percent Hispanic, Black Students ......................................126
Supply by District Percent Hispanic ........................................................................................126
Supply by District Percent Black .............................................................................................128
Appendix C: Race/Ethnic Diversity (%White) of Small Districts.........................................130

Appendix D: Comparison of Descriptive Ratios and Simple Regression .............................131
Appendix E: Variation in Supply by Region ...........................................................................132
Appendix F: Supply Using Teacher Salary (Categorical) ......................................................135
Appendix G: Supply Using Log District Growth ....................................................................138
Appendix H: Supply by Subgroups Analyses .........................................................................140
Supply by School Level ...........................................................................................................140
Supply by Subject Areas ..........................................................................................................143
Appendix I: Need Using Enrollment .......................................................................................147
Appendix J: Need by Subgroups Analyses .............................................................................148
Need by School Level ..............................................................................................................148
Need by Subject Areas .............................................................................................................151
Appendix K: Approved IRB ....................................................................................................155
K1. Institutional Review Board Approval ................................................................................155
K2. IRB Protocol ......................................................................................................................156
K3. Data Share Agreement – ADHE and UAF ........................................................................168
Appendix L: Approved Protocols .............................................................................................176
L1. Protocol for Initial District Interviews for Survey Development ......................................176
L2. Protocol for Survey Participation ......................................................................................177
L3. Protocol for Interviews with Teacher Preparation Programs .............................................178
Appendix M: Instruments .........................................................................................................179
M1. Districts’ Interview Questions for Survey Development ..................................................179
M2. Teacher Preparation Programs’ Interview Questions .......................................................182
M3. Initial Survey (Approved) .................................................................................................183
M4. Actual District Survey ......................................................................................................189
M5. Actual Short Survey ..........................................................................................................207

List of Tables
Table 1: State Reports of Teacher Supply and Demand (Continued - Alaska-Delaware) ....21
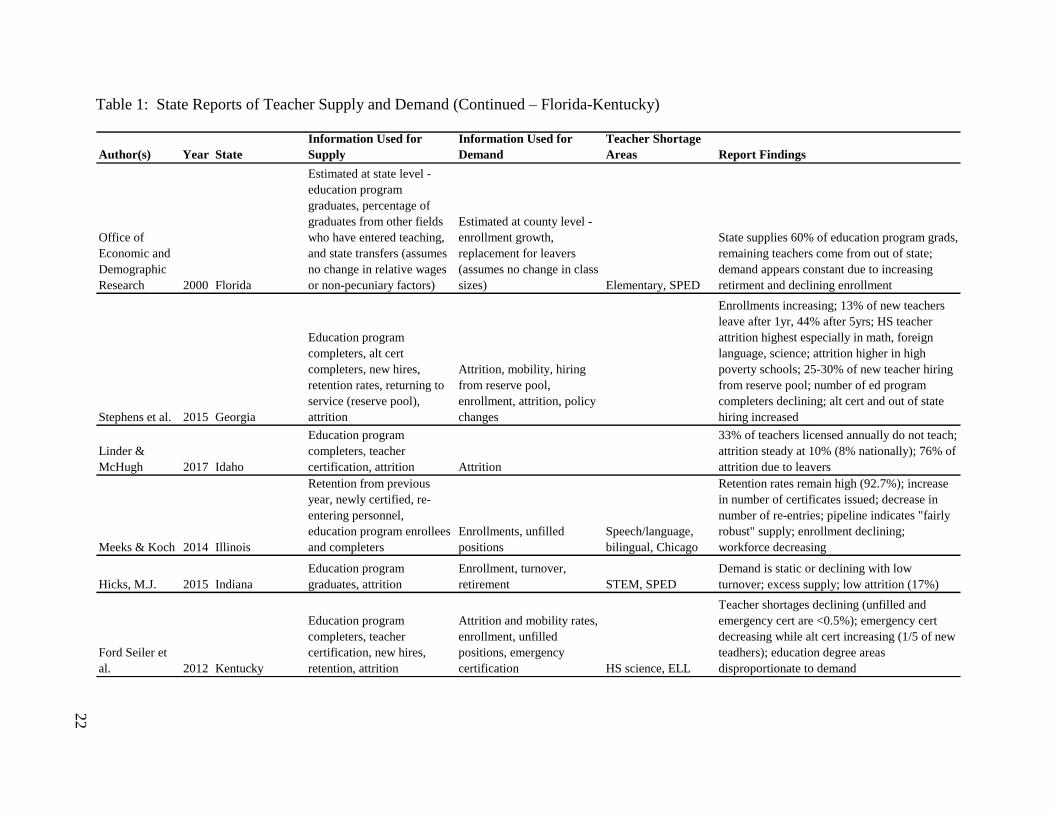
Table 1: State Reports of Teacher Supply and Demand (Continued - Florida-Kentucky) ..22
Table 1: State Reports of Teacher Supply and Demand (Continued - Maryland-
New Hampshire)...............................................................................................................23
Table 1: State Reports of Teacher Supply and Demand (Continued - New York-
South Carolina) ................................................................................................................24
Table 1: State Reports of Teacher Supply and Demand (Continued - Tennessee-
Wisconsin) .........................................................................................................................25
Table 2: Survey Response Rates .................................................................................................30
Table 3: Descriptive Statistics of Categorical Variables of Interest: Analytic Sample vs.
All Districts, 2016-17 ........................................................................................................35
Table 4: Descriptive Statistics of Continuous Variables of Interest: Analytic Sample vs.
All Districts, 2016-17 ........................................................................................................36
Table 5: Analytic Sample Equivalency (Categorical Variables) .............................................37
Table 6: Analytic Sample Equivalency (Continuous Variables) .............................................38
Table 7: District Demographics: Analytic Sample, Non-Respondents by District Size,
2016-17 ..............................................................................................................................39
Table 8: District Demographics: Analytic Sample, Non-Respondents by Urbanicity,
2016-17 ..............................................................................................................................39
Table 9: District Demographics: Analytic Sample, Non-Respondents by Region,
2016-17 ..............................................................................................................................40
Table 10: Teacher Supply by Enrollment Decile ......................................................................49
Table 11: Teacher Supply by District Size ................................................................................50
Table 12: Teacher Supply by Urbanicity ...................................................................................53
Table 13: Teacher Supply by District Growth (5-year) Quintile ............................................54
Table 14: Teacher Supply by Region .........................................................................................57
Table 15: Teacher Supply by District Poverty Rate (FRL) Quintile ......................................58
Table 16: Teacher Supply by District Race/Ethnicity (White) Quintile .................................60
Table 17: Teacher Supply by District Educational Success Indicator Quintile .....................63
Table 18: Teacher Supply by District Average Teacher Salary (BA,0-years) Quintile ........64
Table 19: Summary of Teacher Supply Indicators ...................................................................66
Table 20: Correlations: Variables Associated with Supply .....................................................68
Table 21: Predictors of Supply ...................................................................................................70
Table 22: Teacher Supply by School Level (Raw Differences) ................................................74
Table 23: Teacher Supply by Subject Area (Raw Differences) ...............................................76
Table 24: Teacher Need by Enrollment Decile ..........................................................................81
Table 25: Teacher Need by District Size ....................................................................................82
Table 26: Teacher Need by Urbanicity ......................................................................................84
Table 27: Teacher Need by District Growth (5-year) Quintile ................................................86
Table 28: Teacher Need by Region.............................................................................................87
Table 29: Teacher Need by District Poverty Rate (FRL) Quintile ..........................................89
Table 30: Teacher Need by District Race/Ethnicity (White) Quintile ....................................90
Table 31: Teacher Need by District Educational Success Indicator Quintile ........................92
Table 32: Teacher Need by District Average Teacher Salary (BA,0-years) Quintile ............93
Table 33: Summary of Teacher Need Indicators ......................................................................95
Table 34: Correlations: Variables Associated with Need .........................................................97
Table 35: Predictors of Need .......................................................................................................99
Table 36: Teacher Need by School Level (Raw Differences) .................................................103
Table 37: Teacher Need by Subject Area (Raw Differences) ................................................104
Table 38: Supply by Need..........................................................................................................108
Table A1: Predictors of Supply: Log Enrollment and Categorical Enrollment ..................125
Table B1: Teacher Supply by District Race/Ethnicity - Hispanic (Quintile) .......................126
Table B2: Teacher Supply by District Race/Ethnicity - Hispanic (Quintile), Excluding
Northwest Region Districts ...........................................................................................127
Table B3: Teacher Supply by District Race/Ethnicity - Black (Quintile).............................128
Table B4: Teacher Supply by District Race/Ethnicity - Black (Category) ...........................129
Table C1: Race/Ethnic Diversity (%White) of Small Districts .............................................130
Table D1: Example Comparison of Descriptive Supply Ratios and Simple Regression
Coefficients - District Size .............................................................................................131
Table E1: Mean Teacher Supply by Region (Unweighted) ....................................................134
Table F1: Teacher Supply by Teacher Salary – BA, 0 years (Categorical)..........................135
Table F2: Predictors of Supply: Continuous vs Categorical Teacher Salary .....................137
Table G1: Predictors of Supply: District Growth Percentage vs. Log District Growth

Percentage ......................................................................................................................139
Table H1: Predictors of Elementary Teacher Supply ............................................................140
Table H2: Predictors of Middle School Teacher Supply ........................................................141
Table H3: Predictors of High School Teacher Supply ...........................................................142
Table H4: Predictors of Math & Science Teacher Supply (Middle School) .........................143
Table H5: Predictors of Math & Science Teacher Supply (High School) ............................144
Table H6: Predictors of English/Language Arts & Social Studies Teacher Supply
(Middle School) ..............................................................................................................145
Table H7: Predictors of English/Language Arts & Social Studies Teacher Supply
(High School) ..................................................................................................................146
Table I1: Predictors of Need: Log Enrollment and Categorical Enrollment .......................147
Table J1: Predictors of Elementary Teacher Need .................................................................148
Table J2: Predictors of Middle School Teacher Need ............................................................149
Table J3: Predictors of High School Teacher Need ................................................................150
Table J4: Predictors of Math & Science Teacher Need (Middle School) .............................151
Table J5: Predictors of Math & Science Teacher Need (High School) .................................152
Table J6: Predictors of English/Language Arts & Social Studies Teacher Need
(Middle School) ..............................................................................................................153
Table J7: Predictors of English/Language Arts & Social Studies Teacher Need
(High School) ..................................................................................................................154

List of Figures
Figure 1: Map of Arkansas School District Respondents ........................................................31
Figure 2: Distribution of District Enrollment, 2016-17 ............................................................33
Figure 3: Education Regions of Arkansas .................................................................................47
Figure 4: Average Teacher Supply by Enrollment Decile .......................................................50
Figure 5: Average Teacher Supply by District Size ..................................................................51
Figure 6: Average Teacher Supply by Urbanicity ....................................................................53
Figure 7: Average Teacher Supply by District Growth (5-year) Quintile ..............................55
Figure 8: Arkansas Teacher Preparation Programs ................................................................56
Figure 9: Average Teacher Supply by Region ..........................................................................57
Figure 10: Average Teacher Supply by District Poverty Rate (FRL) Quintile......................59
Figure 11: Average Teacher Supply by District Race/Ethnicity (White) Quintile ................61
Figure 12: Average Teacher Supply by District Educational Success Indicator Quintile ....63
Figure 13: Average Teacher Supply by District Average Teacher Salary (BA,0-years)
Quintile..............................................................................................................................65
Figure 14: Average Teacher Supply by School Level (Raw Differences) ...............................75
Figure 15: Average Teacher Supply by Subject Area (Raw Differences) ..............................76
Figure 16: Average Teacher Need by Enrollment Decile .........................................................82
Figure 17: Average Teacher Need by District Size ...................................................................83
Figure 18: Average Teacher Need by Urbanicity .....................................................................85
Figure 19: Average Teacher Need by District Growth (5-year) Quintile ...............................86
Figure 20: Average Teacher Need by Region ............................................................................88
Figure 21: Average Teacher Need by District Poverty Rate (FRL) Quintile .........................89
Figure 22: Average Teacher Need by District Race/Ethnicity (White) Quintile ...................91
Figure 23: Average Teacher Need by District Educational Success Indicator Quintile .......92
Figure 24: Average Teacher Need by District Average Teacher Salary (BA,0-years)
Quintile..............................................................................................................................94
Figure 25: Average Teacher Need by School Level (Raw Differences) ................................103
Figure 26: Average Teacher Need by Subject Area (Raw Differences) ................................105
Figure 27: Supply by Need ........................................................................................................107
Figure A1: Distribution of Log Enrollment, 2016-17 .............................................................124
Figure B1: Average Teacher Supply by District Race/Ethnicity - Hispanic (Quintile) ......126

Figure B2: Average Teacher Supply by District Race/Ethnicity - Hispanic (Quintile),
Excluding Northwest Region Districts .........................................................................127
Figure B3: Average Teacher Supply by District Race/Ethnicity - Black (Quintile) ............128
Figure B4: Average Teacher Supply by District Race/Ethnicity - Black (Quintile) ............129
Figure E1: Distribution of Teacher Supply – Northwest Region ..........................................132
Figure E2: Distribution of Teacher Supply – Northeast Region ...........................................132
Figure E3: Distribution of Teacher Supply – Central Region ...............................................133
Figure E4: Distribution of Teacher Supply – Southwest Region ..........................................133
Figure E5: Distribution of Teacher Supply – Southeast Region ...........................................134
Figure F1: Distribution of Teacher Salary, 2016-17 ...............................................................135
Figure F2: Average Teacher Supply by Teacher Salary – BA, 0 years (Categorical) .........136
Figure G1: Distribution of Log District Growth, 2016-17 .....................................................138

1
Chapter 1: Introduction
There have been widespread reports of an impending teacher shortage crisis in the U.S. for more
than 30 years. The U.S. is not alone when it comes to concerns of teacher shortages; many other
countries also struggle with meeting teaching needs. In fact, all industrialized countries face
challenges in ensuring a sufficient supply of teachers to meet the demand (Ladd, 2007; OECD,
2005). Teacher supply may vary by country depending on salary levels and structure, and the
entry requirements into teaching (Ladd, 2007; OECD, 2005; 2017). Teacher demand may vary
based on the school-age population and student-teacher ratio (Ladd, 2007; OECD, 2005; 2017).
As in the U.S., throughout the world shortages are common in cities and rural areas, and in math
and science (Ladd, 2007).
In the U.S., there are perceptions of a widespread national shortage while research
indicates teacher shortages are specific to certain subjects and schools. Part of the reason for the
conflicting accounts is how “teacher shortage” is identified and the information used to assess it.
Shortages can be influenced by a number of factors from the supply side (an increasing number
of retirees, turnover and attrition, or a decline in enrollment in preparation programs) and the
demand side (increasing student enrollment, reductions in class size, or the desire to re-staff
schools to pre-recession levels). Many factors can influence the lack of alignment between the
demand for, and availability of, teachers in Arkansas as well.
Motivation
The Arkansas Department of Education (ADE) reports statewide teacher shortage areas each
school year. The ADE references the decline in the number of enrollees in education preparation

2
programs as particular cause for concern. However, a review of the number of education
program “completers” over the past ten years suggests that the trend in program graduates has
remained constant and is somewhat positive. It is possible that there could be a shortage in some
regions and subjects but a surplus in others. I would expect there to be a surplus of teachers in
the Northwest and a shortage of teachers in the Southeast, as well as a surplus of elementary
teachers and shortage of math and science teachers. Furthermore, continuing to have persistent
shortage areas over time suggests there may be an issue with the way in which shortages are
being identified and/or the means by which they are addressed.
The state’s primary strategy to address shortages has been to increase supply by
increasing recruitment into education preparation programs and offering incentives such as
bonuses and loan forgiveness. Arkansas should consider additional information when assessing
teaching supply and demand, and defining shortages. In particular, information on the number of
applications and vacancies, along with turnover and retention, should be collected at the district
level rather than the state level. This would aid in identifying exactly where the need is and
inform strategies to address that need. It is one thing to focus on increasing the overall supply of
teachers, it is another thing to get teachers to where they are needed most. In this study, I
identify the distribution of teacher supply and need at the district-level looking at the
characteristics of districts in an effort to understand how the issue of teacher shortage might
differ across different settings.
Study Purpose
This study focuses on the teacher quantity shortage rather than the teacher quality shortage. The
purpose of this research is to test whether a uniform teacher shortage exists across the state of

3
Arkansas. If so, there should be similar numbers of vacancies in similar subjects across districts
of varying sizes, urbanicity, and regional locations. I hypothesize that, rather than a uniform
shortage, teacher shortages are more likely to occur in certain regions and subjects. I further
examine whether there is a surplus of elementary and English/language arts teachers as the
literature indicates. I expect to find more applications for elementary than middle or high school,
and more for English/language arts than math and science teachers.
In this study, I conduct descriptive analyses of the teacher labor market in Arkansas to
identify what the true level of need is statewide, and where shortages are actually occurring. Of
particular interest is the teaching need and supply in districts with greater numbers of low
income and minority students. Multivariate regression is used to identify the characteristics of
districts with the greatest need and those with the most favorable teaching supply. The analysis
includes data collected from semi-structured phone interviews, online surveys, and district
administrative data which includes demographics, academic performance, and teacher salaries.
In this study, I specifically address the following questions:
1. What are the characteristics of districts that have the most favorable teaching supply?
2. Does supply differ by school level or subject?
3. What are the characteristics of districts that have the greatest need for teachers?
4. Does need differ by school level or subject?
In this study, “supply” is defined as the ratio of applications to vacancies and “need”1 is
defined as the ratio of vacancies to full-time equivalent staff. This is the third study to use
information on the teacher application pool to assess teacher shortages or identify teacher supply
1 The term “need” is used interchangeably with “demand” throughout the paper.

4
and need in this way. The findings are intended to help inform recruiting and hiring practices of
districts around the state and aid the Arkansas Department of Education in identifying which
areas are in greatest need.
In Chapter 2, I review the literature related to the teacher labor market and teacher
shortages in the U.S., and specifically in Arkansas. The data and methodology are discussed in
Chapter 3. In Chapter 4, the results are presented first for supply and then need. Finally, a
discussion of the findings, policy implications, and recommendations are provided in Chapter 5.

5
Chapter 2: Review of the Literature
There is widespread belief, fueled by ongoing media reports, of an impending teacher shortage
crisis in the U.S. The phrase "teacher shortage" has increased in media coverage in the U.S.
“from about 275 mentions in 2011 to 3,977 in 2016” (Dee & Goldhaber, 2017, p. 3). Teacher
shortage reports often refer to the growing student population, looming teacher retirements of
baby boomers, and decreasing enrollment in educator preparation programs as causes for
concern. This impending crisis has been impending and a crisis for more than 30 years (Cross,
2016).
Critical to addressing the problem is clearly analyzing where shortages exist rather than
incorrectly assuming there is a global or overall teacher shortage. Shortages can be influenced
by a number of factors from the supply side (an increasing number of retirees, turnover and
attrition, or a decline in enrollment in preparation programs) and the demand side (increasing
student enrollment, reductions in class size, or the desire to re-staff schools to pre-recession
levels) in the teacher labor market. Many factors can influence the lack of alignment between
the demand for and availability of teachers. To better understand the issues and factors that
contribute to the problem, in the next section I discuss the unique and important characteristics of
teacher labor markets that affect the supply of and demand for teachers.2
2 In researching the literature on teacher labor markets and teacher shortage, an initial database
search included JSTOR, EBSCO, ERIC, Web of Science, and Google Scholar using the search
terms “teacher shortage”, “teacher labor market”, “teacher supply and demand”, “Arkansas
teacher shortage”, “Arkansas teacher labor market”, and “Arkansas teacher supply and demand”.
From the sources found in these searches, additional sources were identified using their
references.

6
Teacher Labor Market
There are several unique and important characteristics of teacher labor markets that affect the
supply of and demand for teachers, including workforce demographics, the market’s localized
nature, competition from within and outside the sector, the compensation structure, and the
options available to address shortages. The teacher labor market is different from other labor
markets as it is highly unionized, based mostly in the public (non-profit) sector, and the
workforce is predominantly female, white, with almost all having college degrees (Belfield,
2005; Loeb & Reininger, 2004). Additionally, the labor market for teachers does not respond to
increases in the price of skill the way it does in non-teaching professions due to the salary
structure (Eide et al., 2004), and compensation is not commensurate with college graduates in
other fields (Konoske-Graf et al., 2016). Teacher salaries and alternative labor market options
affect both the quantity and quality of the teacher workforce (Eide et al., 2004). Because there
are limited opportunities to vary pay due to uniform salary schedules, teachers seek other
benefits related to better working conditions (Belfield, 2005).
Another unique feature of the teacher labor market is that it is highly localized with
hiring decisions largely made by school level leaders (Engel & Cannata, 2015). Geographic
proximity matters both to prospective teachers and employers (Engel & Cannata, 2015). On the
supply side, teachers make decisions about which districts and schools to apply to, and whether
or not to take positions that are offered (Engel & Cannata, 2015). Research shows that teachers
tend to seek and find jobs close to home, where they grew up, to their training institutions, and
their student teaching placements (Boyd et al., 2005; Cannata, 2010; Engel & Cannata, 2015;
Goldhaber et al., 2014; Krieg et al., 2016; Malatras et al., 2017; Podgursky, 2006; Reininger,
2012). On the demand side, district and school leaders decide who to make offers to among the

7
applicant pool and some districts have residency requirements (Engel & Cannata, 2015).
However, there is little research on the process principals use to hire teachers (Engel & Cannata,
2015). It is unclear if shortages persist due to the decisions made by teachers or administrators
(Engel et al., 2014; Hanushek et al., 2004). Shortages will further be influenced by variations in
salary offered by competing districts in geographically constrained markets (Hanushek et al.,
2004).
In the teacher labor market, school districts compete not only with each other but in
dozens of labor markets including the private and nonprofit sectors (especially for math and
science teachers) (Schug & Holohan, 2004). Shortages in some subjects and surpluses in others
can be attributed to salary schedules, which set one salary for all teachers as if they had the same
marketable skills and same opportunity costs, or other opportunities available in the working
world (Schug & Holohan, 2004). Opportunity wages affect both entry and exit into the
profession (Hanushek et al., 2004). Salaries specified by the salary schedule set both a price
floor and a price ceiling. The price floor attracts those with fewer opportunities in other fields
and more people into the field than there are positions (e.g. elementary teachers) (Schug &
Holohan, 2004). The price ceiling discourages those from entering education who have better
opportunities in other markets (e.g. math or technology teachers) (Schug & Holohan, 2004).
It is expected that labor markets that systematically pay below market rates to those with
higher opportunity costs, those with alternative employment options, would have higher turnover
(Schug & Holohan, 2004). The inability to reward individuals relative to their opportunity costs
and skill is a constraint on the efficient use of teacher inputs (Belfield, 2005). Those with the
highest opportunity costs outside of teaching are most likely to leave (Eide et al., 2004), and
opportunity costs for teachers in different subjects differ substantially (Murnane & Steele, 2007).

8
Shortages will occur as those with greater opportunities find positions outside of education.
Additionally, those in surplus areas will be shifted to shortage areas as administrators are forced
to hire the readily available teachers from the surplus pool, resulting in a reduction in quality
and, potentially, a mismatch of teacher training to the topics they are required to teach (Schug &
Holohan, 2004). School districts often respond to shortages by filling positions with out of field
or ineffective teachers rather than leaving them vacant (Murnane & Steele, 2007).
Teacher labor market equilibrium occurs when the number of teachers willing to teach is
equal to the number of positions offered to these teachers by districts (Murnane & Steele, 2007).
Supply and demand theory defines shortage as any imbalance between labor demand and supply
– the inability to fill vacancies at current wages with individuals qualified for those positions
(Ingersoll & May, 2011; Sutcher et al., 2016). To address shortages, supply needs to increase
and/or demand needs to decrease. Districts can respond to shortages by any combination of
recruiting more teachers, increasing class sizes, or reducing turnover and attrition.
Organizational theory suggests some employee turnover is good, however, high levels of
turnover are both a cause and effect of ineffectiveness and low performance (Ingersoll, 2001;
2003). Although turnover in education is less than it is in many other industries (Bureau of
Labor Statistics, 2018; Malatras et al., 2017; Papay, n.d.), there is no definitive benchmark on
employee attrition across countries or professions in the U.S. (Behrstock-Sherratt, 2016). Yet
the revolving door of teacher turnover is costly to districts, schools, and students in terms of
money, time, school culture, and effectiveness. To expect there to be no vacancies or attrition is
unrealistic. The question then is, what level of shortage is acceptable or expected? There is no
definitive answer. Despite the fact that we will never know the optimal level of teacher turnover,

9
it remains worthwhile to examine the extent to which turnover and teacher demand varies across
different types of districts.
Teacher Shortages
The national policy debate on whether a national teacher shortage exists is muddled by the
variation in reporting. There may well be areas of teacher shortage across the country, but to
refer to it as a national shortage seems incorrect. Some researchers find support for a universal
shortage while others find evidence that teacher shortages are specific to certain subjects and
schools. Part of the reason for these conflicting reports is how shortage is being identified and
what information is being used to assess it.
Universal Shortage?
There is evidence suggesting that teacher shortages are widespread nationally. Both insufficient
supply and excess demand drive the discussion. Insufficient teacher supply is supported by the
fact that fewer high school graduates appear to be interested in education as a major and fewer
college students are interested in careers in teaching (Aragon, 2016; USDOE, 2015).
Additionally, many educator preparation programs have seen declining enrollments in the last
decade (Malatras et al., 2017; Sutcher et al., 2016). Specifically, teacher preparation program
enrollments have declined by a third and program graduates have declined by almost a quarter,
between 2009 and 2014 (Sutcher et al., 2016).
Rather than insufficient supply, some researchers argue that teacher shortages are driven
by excess demand caused by attrition (leavers) and turnover (movers) (Ingersoll, 2001). While
retirements account for a small proportion of total turnover, about half of turnover is attributed to
teachers transferring or moving to other schools (Ingersoll, 2001; 2003). Regardless of the

10
reason, movers and leavers have the same effect at the school level - decreasing staff that needs
to be replaced (Ingersoll, 2003). Shortages result when the demand increases due to large
numbers of teachers leaving (Ingersoll, 2001). Research indicates that the rate of teacher
turnover has historically been higher than turnover in many other occupations such as nursing,
which is also predominantly female with persistent staffing problems (Ingersoll, 2001; 2002;
2003).
However, teacher turnover is not the only driver of demand. Teacher demand is driven
by student enrollment, class size policy, fiscal capacity, and wage level as well (Murnane &
Steele, 2007). The number of new teacher hires is estimated to increase by 29% between 2011
and 2022 to meet growing student enrollments (Hussar & Bailey, 2014). Class size reductions
further increase the demand for new teachers (Ingersoll, 2003), as do the efforts of districts to
return to pre-recession staffing levels (Sutcher et al., 2016). Shrinking teacher supply and
growing teacher demand along with the “revolving door” problem contribute to a state of
perpetual shortage (Russell, 2005; Sutcher et al., 2016). The research related to the factors of
supply and demand suggest a widespread national shortage.
Localized Shortages?
Contrary to the research supporting a universal teacher shortage nationally, other researchers find
evidence that there is no global or overall teacher shortage, but instead a shortage of teachers in
certain subjects and locales experienced by every state. In fact, there is evidence there are more
than enough teachers produced annually and the demand related to turnover has remained steady.
Sufficient supply is supported by the steady increase in the number of new teacher candidates
since the 1980s (Cowan et al., 2016; Dee & Goldhaber, 2017; Ingersoll, 2003; Russell, 2005).
Even though only about half of teachers who complete preparation programs are hired in public

11
schools in a typical year, the supply of new teacher graduates exceeds the number of new hires
nationally (Cowan et al., 2016; Dee & Goldhaber, 2017; Ingersoll, 2003). In addition, the
“reserve pool”, which includes delayed entrants and former teachers who left but later return,
also contributes to overall supply (Ingersoll, 2003; Murnane & Steele, 2007).
Regarding teacher demand, studies find teacher turnover rates have improved and been
fairly stable since 2004-05 with a 5-year attrition rate of about 17%, and half of those expected to
return (Di Carlo, 2015; Raue & Gray, 2015). More recent research indicates the rate of turnover
in education is improving and is less than in other industries (Bureau of Labor Statistics, 2018;
Malatras et al., 2017; Papay, n.d.), with reports of fewer teacher shortages in 2011-12 than in
1999-00 (Aragon, 2016; Hussar & Bailey, 2014).
Rather than a universal national shortage, teacher shortages are specific to grades or
subjects, districts, schools, or geographic regions (Dee & Goldhaber, 2017; Murnane & Steele,
2007; Murphy et al., 2003). Shortages are typically concentrated in urban and rural districts,
districts serving economically disadvantaged students, and districts with large numbers of
minority students (Dee & Goldhaber, 2017; Ingersoll, 2001; Malatras et al., 2017; Murphy et al.,
2003). Additionally, there have been annual shortages in special education, science, and English
as a second language (ESL) in almost every state since 1990 (Cross, 2016; Malatras et al., 2017;
Sutcher et al., 2016; Weiss, 2018). As shortages are unevenly distributed across schools and
districts, it appears incorrect to assume there is an overall universal teacher shortage.

12
Identification and Assessment Challenges
Part of the confusion related to this policy debate can be explained by the information being used
and how teacher shortage is being identified. In terms of supply, there are differences when
using education program enrollee, candidate, or graduate data. The number of students reported
as enrolled in education programs will differ depending on whether that information is based on
students who have applied and been accepted to education programs or on those who have
declared education as their major. Additionally, candidates may have completed the
requirements of licensure but not yet graduated. If supply reflects the number of individuals
willing and able to teach (Behrstock-Sherratt, 2016), a surplus of teachers being trained does not
mean there are enough graduates produced for each field (Ingersoll, 2003). In other words, the
aggregate number of teachers is not as important as the number of teachers per field and
geographic area. Furthermore, teacher recruitment will not solve staffing problems if issues
related to teacher retention are not addressed (Ingersoll, 2001).
In terms of demand, if demand represents the number of teachers a district wishes to
employ (Behrstock-Sherratt, 2016), vacancy information is useful to collect. How a district
defines a vacant position and when that information is reported will matter. A vacant position
could be any position filled by a new teacher, and include teacher movement within schools. Or
a vacant position might only include positions that are advertised, or those left unfilled.
Moreover, vacancy rates will differ depending on whether that information is collected before
the end of a school year, over the summer, or at the start of the following school year. Districts
can define vacancies very differently (Barnum, 2018) and some states like Arizona and Indiana
do not even track teacher vacancies (Will, 2016). What’s more, it is unclear how many unfilled

13
teaching positions or long-term substitutes are employed by districts at the start of the school
year (Murnane & Steele, 2007; Murphy et al., 2003).
Further adding to the confusion is the fact that “teacher shortage” is not clearly or
consistently identified or assessed, and can be indicated by a variety of factors. Determinations
of teacher shortages may be based solely on evaluations of decreasing supply, indications of
increasing demand, or differences between supply and demand. Estimates for supply could be
based on the number of teacher preparation program students enrolled, new teacher
certifications, the number of anticipated retirees, the number of unemployed certified teachers, or
the number of applications per vacancy (Behrstock-Sherratt, 2016; Lindsay et al., 2016).
Assessments of demand might be derived from the number of vacancies a district has, the
number of vacancies to full-time teaching staff, the number of teachers needed to maintain
student-teacher ratios, the number of emergency credentials, or the number of teachers leaving
the profession (Behrstock-Sherratt, 2016; Lindsay et al., 2016). The methods used to examine
teacher supply and demand depend on the questions being asked and the available data sources
(Lindsay et al., 2016). Data on vacancies is not readily available and application data is not
usually collected at all.
The U.S. Department of Education (Cross, 2016) provides some guidance by defining a
“teacher shortage area” as a specific grade, subject, or geographic area in which the state
determines there is an inadequate supply of elementary or secondary school teachers. In
determining shortage areas, unfilled positions, positions filled by alternative, temporary, or
emergency certification, and positions filled by teachers teaching out of their field of preparation
are all included (Cross, 2016, p. 3). This definition for teacher shortage focuses more on unmet
demand and leaves the determination of adequate supply to the State to define. Even with this

14
guidance, it is not clear what evidence constitutes a shortage (Dee & Goldhaber, 2017).
Depending on the information being used to measure teacher shortages, research outcomes and
reporting on the issue will vary. For example, if we count program graduates, this approach
leads to a very high number in the supply category and would lead researchers to say that there is
no shortage. However, if instead we only count applicants for open positions, this approach
would lead to a lower number and thus we would be more likely to find shortages.
Distribution Considerations
In addition to looking at the quantity of teaching need, the distribution of teaching need should
be considered as well (Murphy et al., 2003; Russell, 2005). Teachers have historically been
inequitably sorted across schools with less-qualified teachers in high-poverty, high-minority, and
low-performing schools (Hanushek et al., 2004; Loeb & Reininger, 2004; Murnane & Steele,
2007). High-poverty schools have higher turnover rates than affluent schools (Ingersoll, 2001;
Malatras et al., 2017). There are higher turnover rates in schools with higher proportions of
minority students (Loeb & Reininger, 2004). Urban schools have more turnover than rural or
suburban schools (Ingersoll, 2002). Southern and western states also tend to have greater teacher
shortages (Murphy et al., 2003). As the nation's population has grown more diverse, the
demographic composition of the teacher workforce has remained predominantly white and less
diverse (Ingersoll & May, 2011; Konoske-Graf et al., 2016; Murnane & Steele, 2007; Murphy et
al., 2003).
Not only should we consider the inequitable distribution of teachers by geographic area,
the distribution of teachers by content areas should also be examined. The demand for STEM
(science, technology, engineering, and math) and special education teachers is and has been
greater than that for elementary, English, and social studies teachers (Cowan et al., 2016). In

15
fact, National Center for Education Statistics data indicates there have been annual shortages
since 1990 (NCES) in special education, science, and ESL in almost every state (Hussar &
Bailey, 2014; Malatras et al., 2017). Meanwhile, education programs in many states are
overproducing candidates in low-demand subjects (Aragon, 2016; Behrstock-Sherratt, 2016).
Effect on Teacher Quality
In addition to the distribution of teaching need, the impact teacher shortages have on the
quality of teachers should also be taken into account. Sutcher et al. (2016) note that there are
currently not enough qualified applicants for teaching positions to meet the demand in all
locations and fields. Thousands of teachers were hired on emergency or temporary credentials in
2015 and 2016 (Sutcher et al., 2016), and considering the number of teachers teaching out of
field, there may be more of a teacher quality shortage than a teacher quantity shortage (Murphy
et al., 2003), particularly in math, science, special education, and ESL. Although there is not
much evidence that teacher certification matters, it may matter more for these areas of chronic
teacher shortage (Goldhaber, 2002; Maranto & McShane, 2012; Wayne & Youngs, 2003).
Teacher shortages force school systems to lower certification standards (Stotsky, 2015) or hire
under-qualified individuals to fill openings resulting in lower school performance (Ingersoll,
2003). In addition, the localized nature of hiring may exacerbate the unequal distribution of
teachers across schools (Engel & Cannata, 2015). Attracting high quality applicants will require
the profession to differentiate the pay structure, offer incentives, and/or improve workplace
conditions.

16
Possible Remedies
Much of the research related to the teacher labor market tends to focus on the characteristics and
policy levers associated with influencing teacher supply, in particular, focusing on how supply
can be maximized through greater recruitment and demand reduced through increased retention.
Faced with teacher shortages, schools and districts can respond by increasing class sizes, re-
allocating specialized/support staff, assigning teachers from other fields, hiring uncredentialed
teachers or substitutes, or canceling classes (Barnum, 2018). All of these options may reduce (or
enhance) teacher quality and negatively (or positively) impact student achievement and success.
To alleviate teacher shortages, the primary strategy has been to increase the supply of
new teachers into (or back to) the profession. These efforts include recruiting more teachers into
education programs and alternative certification programs (Dee & Goldhaber, 2017; Malatras et
al., 2017; Podgursky, 2016), initiating “grow your own” approaches (Yaffe, 2016), providing
easier licensing reciprocation between states (Dee & Goldhaber, 2017; Eide et al., 2004), hiring
earlier (Dee & Goldhaber, 2017), offering incentives (e.g. signing bonus, loan forgiveness), and
increasing compensation (Hanushek et al., 2004; Murnane & Steele, 2007). Increasing
compensation through universal pay increases is often discussed but is not likely to be very
effective or cost-efficient (Dee & Goldhaber, 2017; Podgursky, 2006), and potentially could
increase the retention of both high- and low-quality teachers (Hanushek et al., 2004).
Yet efforts focused only on recruitment fail to address retention issues (Aragon, 2016).
"Pouring more water into the bucket will not be the answer if the holes are not first patched"
(Ingersoll, 2003, p.17). As the main reasons for teacher attrition have to do with job
dissatisfaction related to compensation, preparation, lack of support, and working conditions
(Ingersoll, 2001; Ingersoll & May, 2011; Malatras et al., 2017; Sutcher et al., 2016), these issues

17
must be addressed as well. Policies targeted to address attrition and turnover have included
implementing mentorship/induction programs (Konoske-Graf et al., 2016), improving workplace
conditions (e.g. facilities, materials) (Belfield, 2005), and providing more opportunities for
advancement (Aragon, 2016; Malatras et al., 2017). Purposeful student teaching placement
could further influence the distribution of teacher quality across districts by giving schools and
districts an early look at prospective teachers and connecting hard-to-staff schools with highly
qualified candidates (Goldhaber et al., 2014; Krieg et al., 2016; Maier & Youngs, 2009). In
combination, these strategies may induce teachers to stay and/or attract more, better teachers.
The evidence supports a “national” teacher shortage if one considers it to be a shortage of
teachers in certain subjects and locales experienced by every state rather than a universal
shortage of teachers in all grades and subjects. It appears there is enough overall supply to meet
demand (Weiss, 2018), however, the misconception that the overall supply of teachers needs to
increase persists (Cowan et al., 2016). The specific type and nature of teacher shortage areas,
specifically looking at the mismatch between the areas of need and the fields of the teachers
being produced, is needed to better inform policy responses (Cowan et al., 2016; Weiss, 2018).
As the teacher labor market tends to be local (Engel & Cannata, 2015; Podgursky, 2006), it is
important to examine shortages at the local level rather than at a national level. How the
problem is identified will inform policy recommendations and suggested remedies.
Arkansas Teacher Shortages
Turning to the local context of this study, I examine the issue of teacher shortages in Arkansas.
The Arkansas Department of Education (Pfeffer & Servedio, 2015) uses its own supply and
demand formula to identify shortage areas. Teacher supply focuses on the pipeline of incoming

18
teachers and uses the number of students enrolled in educator preparation programs3 as well as
the number of first time licenses issued (Pfeffer & Servedio, 2015). Using 2015 data, the most
recent Arkansas Educator Preparation Performance Report indicates greater decreases in the
number of program enrollees than program completers, with 36.3% fewer teachers enrolled in
traditional and alternative education programs (ADE, 2016b; 2017a). For demand, the ADE uses
the number of classes taught by long-term substitutes or teachers out of their area of licensure,
and the number of teachers who retired in the previous year or who have the potential to retire in
the near future (Pfeffer & Servedio, 2015). Shortage area scores are calculated, based on the
supply and need factors, and shortage areas identified if the score for need is greater than supply
(Pfeffer & Servedio, 2015). The following critical academic shortage areas have been identified
for the 2016-17 school year: agriculture science and technology, art, computer science, family
and consumer science, French, library media, mathematics, physical science (chemistry,
physics), Spanish, and special education (ADE, 2016a; Cross, 2016; Pfeffer & Servedio, 2015).
I have concerns that this methodology for identifying teacher shortages does not make
use of all the relevant information affecting both supply and demand. For supply, the ADE
should consider using the number of education program completers, which more accurately
reflects those able to fill vacant positions, rather than focusing on the number of program
enrollees, which can fluctuate depending on when and what information is being used. For
demand, student enrollment rates and teacher turnover should be included as well. In particular,
demand calculations appear only to account for teacher replacement and do not factor in growing
enrollments (Pfeffer & Servedio, 2015). Student enrollment in public elementary and secondary
schools in Arkansas is projected to increase by 1.6% by 2022, with most of the growth expected
3 Educator preparation programs include both traditional and alternative certification routes.

19
in grades 9-12 (Hussar & Bailey, 2014). Between 2004-05 and 2014-15, student enrollment in
the state grew by 4.5% while the total number of certified teachers employed grew by 3.4%
(ADE, 2016b). Without factoring in growing enrollments, teacher need will remain higher than
estimated. In addition, non-retirement attrition and turnover are not factored into demand, even
though approximately 15% of teachers leave the profession after the first year, 31% after three
years, and 36% after five years (ADE, 2016b).4
Arkansas reflects trends seen at the national level. As with the rest of the nation, not all
education program graduates in Arkansas receive a teaching license or actually end up teaching
(Office for Education Policy, 2005). The number of teachers produced each year falls short of
the number hired in Arkansas public schools (ADE, 2017a). Of those enrolled in education
programs, only 63% were preparing for licenses in critical shortage areas (ADE, 2016b). The
biggest factor contributing to teacher shortages in Arkansas appears to be teachers teaching out
of their licensure area, leaving the state, or not teaching at all (Office for Education Policy,
2005). Furthermore, teachers seem to be concentrated in urban areas or college towns around the
state, near to where they received their training (Barnett & Blankenship, 2005).
Policies implemented to address teacher shortages in the state are primarily focused on
attracting teachers (increasing supply) rather than retaining teachers (decreasing demand). Most
superintendents believe greater resources (funds) are needed to attract highly-qualified teachers
(Barnett & Blankenship, 2005). As some schools are more concerned with filling vacancies than
with the quality of the candidates, with administrators finding themselves in the position to have
to hire whoever applies, focusing on increasing (and possibly redistributing) the teaching supply
4 District level retention does not factor in teacher movement between schools within a district
(ADE, 2016b).
20
in the state makes sense (Maranto & Shuls, 2012). Incentives to attract teachers to critical
shortage areas have included grants and student loan forgiveness programs (ADE, 2016b; Office
for Education Policy, 2005). Additional incentives are offered to draw teachers to hard-to-staff
areas and can include moving expenses for particular regions (geographic areas), bonuses for
working in high-priority districts, and bonuses for teaching in STEM fields (ADE, 2016b).
However, new strategies to address teacher retention are identified as part of Arkansas’ Every
Student Succeeds Act Plan (ADE, 2017b). These strategies include providing advanced
licensure levels to retain effective teachers and personalized mentoring support related to the
teacher evaluation system (ADE, 2017b; Howell, 2017).
Literature Review
As this study focuses on the teacher labor market in Arkansas, I review other state studies on
teacher supply and demand to examine how they have evaluated and reported this information. I
began with the state evaluations included in the works by Aldeman (2018) and Behrstock-
Sherratt (2016), which provided 19 state reports. Next, I conducted a Google search for each of
the remaining U.S. states using each state’s name, “teacher supply and demand” or “teacher
shortage”, and “.gov” to find any other reports generated by states. This search yielded eight
additional states for a total of 27 state reports addressing teacher supply, demand, supply and
demand, and/or shortages. A summary of these reports is presented in Table 1.
I find a lot of variation in the focus and information used by states to examine teacher
supply and demand. One state focused only on the supply side (New York), two states focused
only on the demand side (Alaska and Nebraska), and only 16 of the 27 states specifically
discussed teacher shortage areas. To examine teacher supply, most states used information on
education program participants (enrollees, candidates, or completers), teacher certification, new

21
Table 1: State Reports of Teacher Supply and Demand (Alaska–Delaware)
Author(s) Year State
Information Used for
Supply
Information Used for
Demand
Teacher Shortage
Areas Report Findings
Hill &
Hirshberg 2013 Alaska Turnover rates
Turnover has declined slightly but not
significantly; annual turnover rates vary widely
among rural districts (7-52%); less turnover of
teachers with <10yr experience if trained in
state; 80% who leave, leave school system
entirely; 64% of teachers hired from outside
state
Pfeffer &
Servedio 2015 Arkansas
Ed program enrollment,
newly licensed, license areas
Long-term substitutes, out
of field assignments,
retirements, projected
retirements
Math, science,
SPED, computer
science, foreign
language, art, ag
science, consumer
science
About 10% expected retirement, more licenses
in non-shortage areas
Suckow & Lau 2017 California
New teacher credentials, ed
program enrollment, alt cert
enrollment
Estimated teacher hires,
waivers issued
Increase in initial teaching credentials; increase
in number of teaching permits has decreased
number of fully-credentialed teachers (by 1%)
Reichardt et al. 2003 Colorado
Information on existing
workforce, new hires,
attrition
Enrollment and growth
rates, teacher retirement,
attrition, transfer rates, ratio
of school-age-population-to-
teachers by county (similar
to a pupil-teacher ratio)
Foreign language,
SPED
Enrollment increasing but varies by region;
number of teachers increasing faster than
enrollment; retirement increasing but attrition
steady (11% leavers, 11% movers)
Connecticut
State Dept. of
Education 2012 Connecticut
Total number of certified
positions (past 5 yrs),
median number of
applicants, teacher
certification
Vacancies - total number of
available positions (past 5
yrs), unfilled positions, long-
term substitutes
Bilingual, SPED,
math, science,
speech/language,
foreign language
Shortage areas fairly consistent; little change in
total number of positions, vacancies; number of
vacancies declined somewhat but median
number of applicants per position increased
Sherretz et al. 2013 Delaware New hires and attrition
Attrition, vacancies,
retirement projections
Foreign language,
HS math & science
Teacher hires decreased but hiring occurring
earlier; 41% hired are new to teaching;
increase in teachers leaving with 7% of
teachers expected to retire
21
22
Table 1: State Reports of Teacher Supply and Demand (Continued – Florida-Kentucky)
Author(s) Year State
Information Used for
Supply
Information Used for
Demand
Teacher Shortage
Areas Report Findings
Office of
Economic and
Demographic
Research 2000 Florida
Estimated at state level -
education program
graduates, percentage of
graduates from other fields
who have entered teaching,
and state transfers (assumes
no change in relative wages
or non-pecuniary factors)
Estimated at county level -
enrollment growth,
replacement for leavers
(assumes no change in class
sizes) Elementary, SPED
State supplies 60% of education program grads,
remaining teachers come from out of state;
demand appears constant due to increasing
retirment and declining enrollment
Stephens et al. 2015 Georgia
Education program
completers, alt cert
completers, new hires,
retention rates, returning to
service (reserve pool),
attrition
Attrition, mobility, hiring
from reserve pool,
enrollment, attrition, policy
changes
Enrollments increasing; 13% of new teachers
leave after 1yr, 44% after 5yrs; HS teacher
attrition highest especially in math, foreign
language, science; attrition higher in high
poverty schools; 25-30% of new teacher hiring
from reserve pool; number of ed program
completers declining; alt cert and out of state
hiring increased
Linder &
McHugh 2017 Idaho
Education program
completers, teacher
certification, attrition Attrition
33% of teachers licensed annually do not teach;
attrition steady at 10% (8% nationally); 76% of
attrition due to leavers
Meeks & Koch 2014 Illinois
Retention from previous
year, newly certified, re-
entering personnel,
education program enrollees
and completers
Enrollments, unfilled
positions
Speech/language,
bilingual, Chicago
Retention rates remain high (92.7%); increase
in number of certificates issued; decrease in
number of re-entries; pipeline indicates "fairly
robust" supply; enrollment declining;
workforce decreasing
Hicks, M.J. 2015 Indiana
Education program
graduates, attrition
Enrollment, turnover,
retirement STEM, SPED
Demand is static or declining with low
turnover; excess supply; low attrition (17%)
Ford Seiler et
al. 2012 Kentucky
Education program
completers, teacher
certification, new hires,
retention, attrition
Attrition and mobility rates,
enrollment, unfilled
positions, emergency
certification HS science, ELL
Teacher shortages declining (unfilled and
emergency cert are <0.5%); emergency cert
decreasing while alt cert increasing (1/5 of new
teadhers); education degree areas
disproportionate to demand
Maryland State
Dept. of
Education 2017 Maryland
New hires, teacher attrition,
projected education program
graduates, candidates, and
enrollees, retired/rehired
School age population,
enrollment, attrition
ELL, foreign
language, math,
science
Enrollment declined; teacher-student ratio
steady; attrition increased (7%) at/below
nation; early career retention improved; ed
program grads is constant (though enrollment
decreasing); conditional certifications
decreased
22

23
Table 1: State Reports of Teacher Supply and Demand (Continued – Maryland-New Hampshire)
Author(s) Year State
Information Used for
Supply
Information Used for
Demand
Teacher Shortage
Areas Report Findings
Maryland State
Dept. of
Education 2017 Maryland
New hires, teacher attrition,
projected education program
graduates, candidates, and
enrollees, retired/rehired
School age population,
enrollment, attrition
ELL, foreign
language, math,
science
Enrollment declined; teacher-student ratio
steady; attrition increased (7%) at/below
nation; early career retention improved; ed
program grads is constant (though enrollment
decreasing); conditional certifications
decreased
Levin et al. 2015 Massachusetts
New hires, transfers,
retention
Enrollment, teacher-student
ratios
Enrollment decreasing; slower expected rate of
decline in supply (<2%) leading to eventual
surplus; new teachers decreased but teacher
transfers (across districts, out of state)
increased
Nguyen &
Onstad 2017 Minnesota
New licenses, transfers,
retention from previous year,
returning to service, attrition
Enrollment, teacher-student
ratios, attrition, vacancies
Increase in number of full-time teachers;
enrollment increased; retirements increased;
15% leave after 1 yr, 26% after 3 yrs
Katnik, P. 2017 Missouri Teacher certification
Enrollment and attrition
based on national data,
unfilled positions
SPED, elementary,
speech/language,
math, science, ELL,
foreign language
Initial certifications decreasing; teaching
assignments increasing due to increasing
enrollment; shortages in certain subjects and
geographic areas
Watson et al. 2017 Montana
Education program
graduates
Projected ed workforce
supply-demand gap
Oversupply of elementary and MS teachers;
undersupply of HS teachers and counselors
Nebraska
Dept. of
Education 2018 Nebraska
Enrollment, unfilled
positions
ELA, science, SPED,
speech/language,
foreign language
Most unfilled positions in the SE (27%) and
largest districts (>10,000); main reasons for
unfilled positions - no appplicants, no qualified
applicants
Cook Smith &
Mackin 2006 New Hampshire
Education program
completers, teacher
certification, attrition Attrition
Math and science,
SPED
Workforce relatively stable; more novice
teachers; most new teachers come from state
programs; increases in alt cert; supply appears
to be adequate in elementary and social studies
though few seeking credentials in critical need
areas
Engage NY 2013 New York
Education program
completers (not those
already working as
teachers), alt cert
Bilingual, ELL,
foreign language,
math, reading,
science, SPED
Decrease in ed program completers; decrease
in new teachers hired; most new hires in
charters; half of completers in elementary
23

24
Table 1: State Reports of Teacher Supply and Demand (Continued – New York-South Carolina)
Author(s) Year State
Information Used for
Supply
Information Used for
Demand
Teacher Shortage
Areas Report FindingsHill & 2013 Alaska Turnover rates Turnover has declined slightly but not
Engage NY 2013 New York
Education program
completers (not those
already working as
teachers), alt cert
Bilingual, ELL,
foreign language,
math, reading,
science, SPED
Decrease in ed program completers; decrease
in new teachers hired; most new hires in
charters; half of completers in elementary
Zagorsky et al. 2013 Ohio New teacher license holders
Enrollment, reduced FTE,
retirement, posted
vacancies
Fewer teachers needed due to declining birth
rates; high levels of retirement will continue
but level off; over 25% of new teachers
licensed in early childhood or P-3, few in math
& science; 1/6 with ed degrees never licensed
Berg-Jacobson
& Levin 2015 Oklahoma
Education program
completers, certification
areas
Enrollment, teacher-student
ratio, teacher mobility
ELA, social studies,
science; HS more
than MS
Ed program completers most commonly
elementary, early childhood, ELA; alt certs
declined while emergency certs increased; out
of state hires constant; reserve pool has
increased; leavers have increased; expect
completers to decline; demand expected to
grow minimally (due to enrollment and teacher-
student ratio increases); supply expected to
vary by region
Oregon Dept.
of Education 2015 Oregon
Education program
completers, first time
licenses
Job postings, hiring fairs,
provisional licenses
Varies by subject,
region
Decrease in ed program completers but
increase in first-time licenses (attributed to out
of state) has led to surplus; low rate of
provisional licenses
Garrett, J. 2018 South Carolina
New teachers entering,
attrition Attrition, unfilled positions
Increasing vacancies and departures;
decreasing hires from ed programs (-25%);
increasing hires from alt cert and out of state;
increase in unfilled positions; attrition and
movers about same; 22% leavers are first year
teachers
Bruce et al. 2009 Tennessee
Retention, attrition, reserve
pool
Enrollment and teacher-
student ratio (by grade
groups - K-3, 4-8, 9-12, per
LEA), mobility, attrition
ELL, music/art,
grade 8, vocational
Teachers with higher salaries more likely to
stay; teachers with less than Master's degree
more likely to stay; more experienced teachers
less likely to move but more likely to leave
(retirement); enrollments expected to grow
24

25
Table 1: State Reports of Teacher Supply and Demand (Continued – Tennessee-Wisconsin)
Author(s) Year State
Information Used for
Supply
Information Used for
Demand
Teacher Shortage
Areas Report Findings
Bruce et al. 2009 Tennessee
Retention, attrition, reserve
pool
Enrollment and teacher-
student ratio (by grade
groups - K-3, 4-8, 9-12, per
LEA), mobility, attrition
ELL, music/art,
grade 8, vocational
Teachers with higher salaries more likely to
stay; teachers with less than Master's degree
more likely to stay; more experienced teachers
less likely to move but more likely to leave
(retirement); enrollments expected to grow
Chastain et al. 2017 Washington
Education program
graduates, attrition
Enrollment, K-3 class size
reduction policy, emergency
certification, out of field
assignments, attrition
Emergency certification increasing; out of field
teaching mostly decreasing but still high in
math, science, ELA, elementary; full-day
kindergarten and K-3 class size reduction
drives elementary need; enrollment increasing;
ed program graduates decreasing, yet number
of novice teachers increasing
Goff et al. 2018 Wisconsin
Education program
completers and enrollees,
average number of
applicants for each vacancy
classification rank ordered,
applicant origin, attrition
Vacancies, emergency
credentials, mobility,
attrition, duration on job
market
High attrition among low-supply positions;
there are 2 external appicants for every 1
internal applicant for most positions, but more
1:1 for low-supply positions; increase in
emergency credentials (even with high-supply
positions)
25

26
hires, and retention. To assess teacher demand, information on teacher turnover, attrition, and
student enrollments were used most.
Of the 27 states, only Connecticut and Wisconsin included applicant information in their
measurement of teacher supply. Wisconsin used the average number of applicants for each
vacancy classification and then rank ordered positions as low-, medium-, and high- supply (Goff
et al., 2018). Additionally they examine mobility and attrition across the supply categories, and
the origin of applicants (whether internal - from within the state, or external - from outside the
state). Four states incorporated vacancy information (Delaware, Minnesota, Ohio, and
Wisconsin) as part of the evaluation of teacher demand, and only Ohio used full-time equivalent
(FTE) teaching position information as well. These exceptional cases are noted in the tables in
red font. Delaware used vacancy information to understand when positions were advertised and
how many were filled internally (Sherretz et al., 2013), and Minnesota identified unfilled
positions with their vacancy information (Nguyen & Onstad, 2017). In Ohio, vacancies are used
to track changes in employment trends and FTE is used to track the reduction in the number of
teaching positions each year (Zagorsky et al., 2013). Wisconsin used vacancy information to
determine the three supply classifications (Goff et al., 2018).
Findings from these state reports indicate a lot of variation in their scope and outcomes
for supply and demand. Several states found decreases in education program completers
(Georgia, New York, Oklahoma, Oregon, Washington) and Maryland found the supply of
program graduates to be constant. Maryland found increasing attrition, while Indiana found
attrition to be decreasing, and Colorado and South Carolina found attrition to be steady.
However, with regard to teacher shortage areas, there do appear to be some consistent trends.
Among the states that evaluated teacher shortages, there appear to be consistent shortages in

27
math, science, SPED, ELL, and foreign language. The variation in supply and demand reported
by states and the relative consistency of teacher shortage subject areas across states aligns with
the research previously discussed.
Purpose of the Study
This study focuses on the teacher quantity shortage rather than the teacher quality shortage, but
economic theory suggests that shortages can lead to decreases in quality, and this appears to be
the case in the teacher labor market. The purpose of this research is to test whether a uniform
teacher shortage exists across the state of Arkansas. I hypothesize that, rather than a uniform
shortage, teacher shortages are more likely to occur in certain regions and subjects. In addition, I
descriptively present the characteristics of districts with the most favorable teaching supply and
those with the greatest teaching need. The findings are intended to help inform recruiting and
hiring practices of districts around the state and aid the Arkansas Department of Education in
identifying which areas are in greatest need. Examining the quality of the teacher pipeline in
Arkansas is a future extension of this research.
Contribution to the Literature
This research contributes to the literature on teacher shortages in two distinct ways. First, I
examine teacher supply and demand at the district level by grade and subject using information
collected from school districts on the number of vacancies and accompanying applications.
Secondly, I define supply and demand (need) differently. In this study, “supply” is defined as
the ratio of applications to vacancies and “need” is defined as the ratio of vacancies to full-time
equivalent certified classroom teachers. This is the third study to use application information to
identify teacher supply and the first to examine teacher need and shortages in this way.

28
Chapter 3: Methods
In this study, I conduct descriptive analyses of the teacher labor market in Arkansas to identify
what the true level of need is statewide and where shortages are actually occurring, using
collected data along with administrative data. I use multivariate regression to identify the
characteristics of districts with the greatest need and those with the most favorable teaching
supply. In this chapter, I present the data and methods used in detail, describe the analytic
sample, and discuss the limitations.
The research questions I aim to answer about teacher supply and need in Arkansas include:
1. What are the characteristics of districts that have the most favorable teaching supply?
2. Does supply differ by school level or subject?
3. What are the characteristics of districts that have the greatest need for teachers?
4. Does need differ by school level or subject?
Data
Sources of data for this study include interviews with district superintendents, an online survey
given to all districts to identify the number of vacancies and applications for grade and subject
level positions, and state administrative data on district enrollment, demographics, academic
achievement, and finances.
Interviews
As a first step in developing the online survey, I conducted semi-structured interviews with
district superintendents from across the state to begin to identify the level of teacher need

29
statewide, where shortages or surpluses may be occurring, and how that need is being met. In an
effort to gather information from districts in a variety of settings, I purposefully selected districts
based on location (and somewhat on size). Seventeen districts were identified, of which eight
agreed to participate in interviews. Of the eight superintendents, two were from districts located
in the Northwest, four from the Central region, one from the Southwest, and two from the
Southeast. Two of the eight were superintendents of charter organizations. Interviews were
semi-structured and all but one was conducted over the phone in February and March 2017.
Interview questions specifically asked about the numbers of vacancies and applications by grade
and/or subjects, teacher attrition and movement, and hiring practices. The interview protocol can
be found in Appendix L and interview questions in Appendix M. From the interview process
and responses, I refined questions for the online survey to be sent out to all districts.
Online Survey
Through this survey, I aimed to gather information on the level of teacher need statewide and
where shortages or surpluses may be occurring. Informed by my discussions with
superintendents, I developed the online survey to ask the appropriate questions that district
human resource representatives could feasibly answer.5 The survey specifically asked about the
5 Three different surveys were created based on district size (small, midsize, and large) to
accommodate the variation in range of possible responses. For example, when asking about the
number of applicants per school level and subject (i.e. number of middle school math and
science position applicants) small districts were provided a survey with a 0-50 range for
responses while large districts were provided a survey with a 0-200 range for responses. The
same questions were asked in each of the surveys. The only difference between the surveys was
the number ranges provided for responses. “Small” districts were identified as those with
student enrollments less than 1,500 students, “Midsize” districts included those with student
enrollments between 1,500–3,500 students, and “Large” districts were those with student
enrollments greater than 3,500. In addition to providing a more tailored survey to districts of
varying sizes, this also allowed me to monitor response rates by district size to ensure

30
number of vacancies by grade level and subjects, the number of applications for those vacancies,
whether all vacancies were filled and how that need was met for unfilled positions, recruitment
strategies, sources for new hires, teacher preparation program partnerships, incentives, and
reasons for attrition. Of particular interest for this study are the responses regarding the number
of vacancies and applications as this information is directly tied to the way in which I define and
measure teacher supply and demand (need). I define teacher supply as the ratio of applications
to vacancies and teacher need as the ratio of vacancies to full-time equivalent classroom
positions. Survey instruments can be found in Appendix M.
I emailed surveys to every district in April 2017 and collected them through early June
2017. Paper versions of the surveys were available but never requested. Email reminders and
requests were sent weekly and personal phone calls made to districts June 1-2, 2017. Of the 262
districts surveyed, the overall response rate was 74.4%. Table 2 shows response rates by district
size. Figure 1 displays which districts around the state responded to the survey.
Table 2: Survey Response Rates
Note: A shorter survey was created and sent to the 104 districts that had not completed the
survey by the initial deadline.
representative participation. A shorter/condensed survey was also created in the last two weeks
of data collection to induce more districts to respond.
Small Midsize Large Short Total
N of Districts 179 53 30 104 262
N of Responses 106 32 20 37 195
Response Rate 59.2% 60.4% 66.7% 35.6% 74.4%
Survey Type
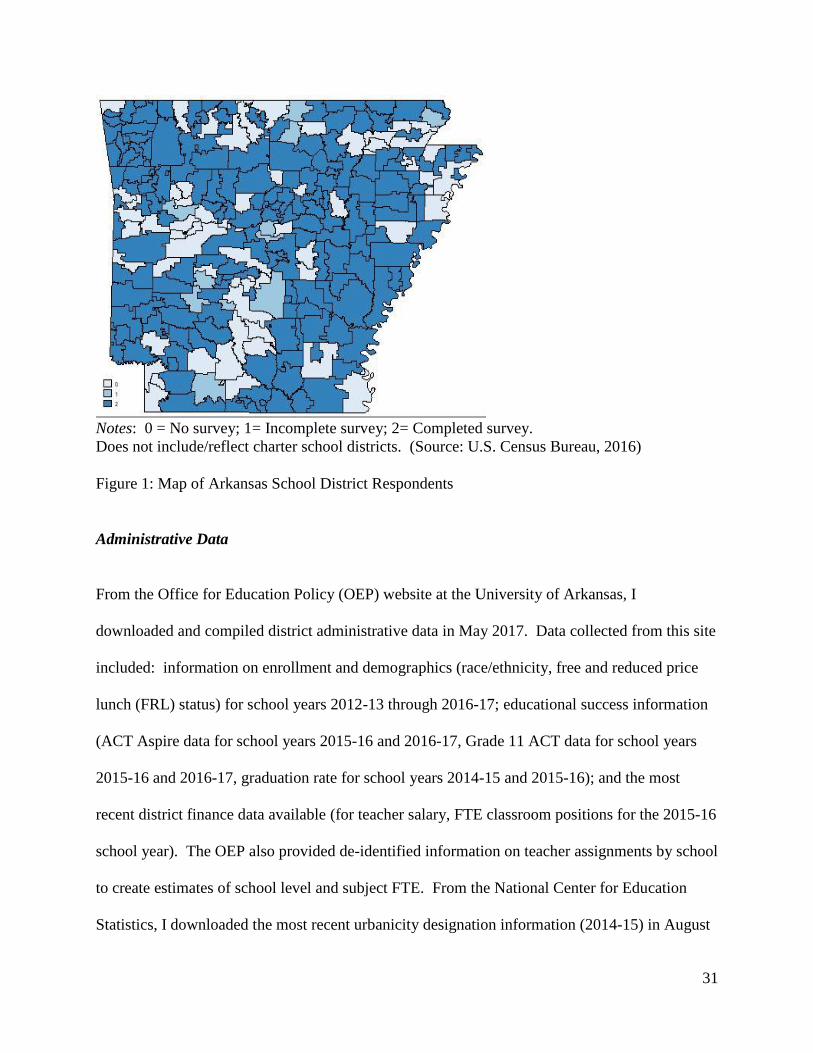
31
Notes: 0 = No survey; 1= Incomplete survey; 2= Completed survey.
Does not include/reflect charter school districts. (Source: U.S. Census Bureau, 2016)
Figure 1: Map of Arkansas School District Respondents
Administrative Data
From the Office for Education Policy (OEP) website at the University of Arkansas, I
downloaded and compiled district administrative data in May 2017. Data collected from this site
included: information on enrollment and demographics (race/ethnicity, free and reduced price
lunch (FRL) status) for school years 2012-13 through 2016-17; educational success information
(ACT Aspire data for school years 2015-16 and 2016-17, Grade 11 ACT data for school years
2015-16 and 2016-17, graduation rate for school years 2014-15 and 2015-16); and the most
recent district finance data available (for teacher salary, FTE classroom positions for the 2015-16
school year). The OEP also provided de-identified information on teacher assignments by school
to create estimates of school level and subject FTE. From the National Center for Education
Statistics, I downloaded the most recent urbanicity designation information (2014-15) in August

32
2017. Information on the state education regions (used by the OEP) comes from the Arkansas
Association of Educational Administrators.
Analytic Sample
With any analysis using self-reported data, there will be concerns of response bias. How
representative of the state as a whole are the districts that responded to the survey? Are the
districts that responded different from those that did not respond? Overall, it appears the districts
included in the sample are representative of districts statewide. In Tables 3 and 4, I examine the
characteristics of districts that responded to the survey relative to all districts in the state on the
variables of interest and, in Tables 5 and 6, I compare districts that responded to those that did
not.
Variables of Interest
The categorical variables of interest include district size, urbanicity, and region. A categorical
variable is used for district size, as the underlying distribution of enrollment is not believed to be
linear. As seen in Figure 2, the distribution of district enrollment is positively skewed with the
majority of districts having student enrollment less than 2,500 and a few with enrollment greater
than 5,000. I use the same district size categories6 used for developing and administering the
online survey, with “Small” districts as those with enrollment less than 1,500 students, “Midsize”
districts as those with enrollment between 1,500 and 3,500 students, and “Large” districts as
those with enrollment greater than 3,500 students. Urbanicity is determined by the NCES urban-
locale framework (2017b) and identifies districts as city, suburb, town, or rural. There are five
6 Size categories are informed by the distribution of district enrollments.
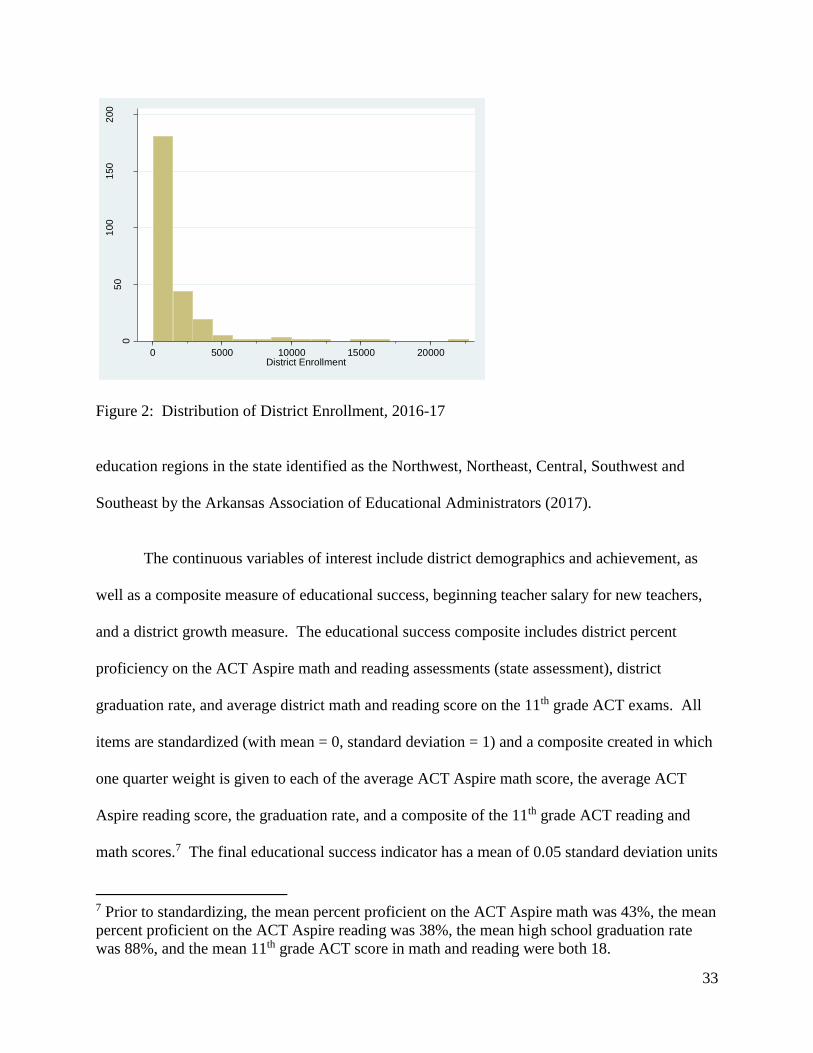
33
Figure 2: Distribution of District Enrollment, 2016-17
education regions in the state identified as the Northwest, Northeast, Central, Southwest and
Southeast by the Arkansas Association of Educational Administrators (2017).
The continuous variables of interest include district demographics and achievement, as
well as a composite measure of educational success, beginning teacher salary for new teachers,
and a district growth measure. The educational success composite includes district percent
proficiency on the ACT Aspire math and reading assessments (state assessment), district
graduation rate, and average district math and reading score on the 11th grade ACT exams. All
items are standardized (with mean = 0, standard deviation = 1) and a composite created in which
one quarter weight is given to each of the average ACT Aspire math score, the average ACT
Aspire reading score, the graduation rate, and a composite of the 11th grade ACT reading and
math scores.7 The final educational success indicator has a mean of 0.05 standard deviation units
7 Prior to standardizing, the mean percent proficient on the ACT Aspire math was 43%, the mean
percent proficient on the ACT Aspire reading was 38%, the mean high school graduation rate
was 88%, and the mean 11th grade ACT score in math and reading were both 18.
05
01
00
150
200
Fre
que
ncy
0 5000 10000 15000 20000District Enrollment

34
with a standard deviation of 0.71. The educational success indicator is only reported for districts
with all information required to create the variable. For teacher salary, I use the district salary
for new teachers with a Bachelor’s degree and no experience.8 The district growth measure was
created to account for changes in student enrollment over a 5-year period from 2012-13 to 2016-
17, relative to the first year (2012-13). Differences in enrollment between years is averaged,
divided by enrollment in 2012-13, and converted to percent. The district growth measure is
expressed in equation 1. Mean district growth for the state over the five-year period was 0.69%.
δ = {∑ Enrollment(t2-tt1)+Enrollment(t3-t2)+Enrollment(t4-t3)+Enrollment(t5-t4)
4}
÷ Enrollmentt1 * 100 (1)
Where,
δ represents district growth, and
t represents an enrollment year.
Looking at the summary statistics describing the categorical variables in Table 3, I find
the analytic sample to be representative of all districts statewide. Seventy-four percent of all
districts are included in the sample, with at least 70% district representation within each
category, with the exception of suburban districts and charter schools (both 63%). Turning to the
continuous variables of interest in Table 4, a comparison of means indicates that the districts
included in the sample are almost identical on all measures to districts statewide. On average,
the sample has greater district growth than the state overall.
8 Salary not reported for Arkansas School of the Blind, Arkansas School of the Deaf, Division of
Youth Services Schools, Arkansas Virtual Academy, and Quest Middle School of Pine Bluff.

35
Table 3: Descriptive Statistics of Categorical Variables of Interest: Analytic Sample vs. All
Districts, 2016-17
Variable
Sample
Frequency
Percent of
Sample
Arkansas
Frequency
Percent of
All Districts
Sample as
Percent of
All Districts
Dependent (Categorical)
Total 195 262 74%
District Size
1- Large (> 3,500) 23 12% 30 11% 77%
2- Mid-size (1,500-3,500) 38 19% 53 20% 72%
3- Small (< 1,500) 134 69% 179 68% 75%
Urbanicity (CCD Indicator)
1- Urban 24 12% 31 12% 77%
2- Suburb 10 5% 16 6% 63%
3- Town 45 23% 64 24% 70%
4- Rural 111 57% 144 55% 77%
Region
1- NW 56 29% 79 30% 71%
2- NE 51 26% 67 26% 76%
3- Central 38 19% 54 21% 70%
4- SW 27 14% 38 15% 71%
5- SE 23 12% 24 9% 96%
Charter 15 8% 24 9% 63%

36
Table 4: Descriptive Statistics of Continuous Variables of Interest: Analytic Sample vs. All Districts, 2016-17
Note: No FTE reported in the 2015-16 finance database for Arkansas Connections Academy, Future School of Fort Smith, and
Jacksonville North Pulaski County SD.
Variable N Mean Std. Dev. Min Max N Mean Std. Dev. Min Max
Independent
Teacher Need (Vacancies/FTE) 186 0.12 0.14 0 1.23
Teacher Supply (Applicants/Vacancies) 183 5.12 6.09 0 42.43
Vacancies 192 15.89 32.25 0 282.00
Classroom Teachers (FTE) 189 140.71 226.40 5 1,801.83 256 131.20 201.48 4.03 1,801.83
Applicants 186 93.49 258.23 0 1,727.00
Dependent (Continuous)
Enrollment 195 1,943 3,229 62 22,759 262 1,822 2,897 56 22,759
Log Enrollment 195 6.97 0.99 4.13 10.03 262 6.95 0.98 4.03 10.03
% FRL 194 66% 0.15 0.23 1.00 261 65% 0.16 0 1.00
% White 195 69% 0.28 0 0.98 262 70% 0.28 0 0.98
Educational Success Indicator (sd) 183 0.04 0.71 -2.53 1.66 243 0.05 0.71 -2.53 3.50
% Proficient ACT Aspire Math 195 43% 0.14 0 0.83 262 43% 0.14 0 0.93
% Proficient ACT Aspire Reading 195 38% 0.12 0.04 0.68 262 38% 0.12 0 0.89
Gr.11 ACT Math 186 18.03 1.28 14.30 21.40 247 18.10 1.43 14.30 27.00
Gr.11 ACT Reading 186 18.32 1.72 13.80 23.50 247 18.41 1.87 13.80 28.40
Graduation Rate 186 88% 0.12 0 1.00 246 88% 0.11 0 1.00
Base Teachr Pay (BA, 0yrs) 191 $ 34,058 3,199 29,580 47,016 257 $ 34,020 3,145 29,000 47,016
% District Growth (over 5yrs) 188 0.79% 7.87 -7.32 79.81 250 0.69% 6.99 -7.32 79.81
Analytic Sample All Districts
N/A
N/A
N/A
N/A
36

37
Next, I examine differences in characteristics between districts that responded to the
survey and those that did not. In Tables 5 and 6, I find significant differences between districts
in the sample and non-respondents for districts in the Southeast region, and marginally
significant differences for rural districts. There are no significant differences found for any other
district characteristics.
Table 5: Analytic Sample Equivalency (Categorical Variables)
Notes: *** p<0.01, ** p<0.05, * p<0.1. P-value based on chi-squared test. Most recent
urbanicity data from NCES (2014-15) does not include seven districts included in this analysis
(2016-17). Of the 7 districts, 5 are included in the analytic sample, 2 are included in non-
respondents. The most recent NCES district urbanicity information from 2014-15 identifies 290
districts in the state including charter schools. There were 262 districts in the state in the 2016-
17 school year. Of the 290 districts identified in 2014-15, 255 include demographic information
in 2016-17 and are represented here.
(Categorical Variables)
Analytic
Sample
Non-
Respondents Difference p-value
Number of Districts 195 67 128
% of All Districts (n=262) 74% 26% 49%
District Size
1- Small (< 1,500) 69% 67% 2% 0.766
2- Mid-size (1,500-3,500) 19% 22% -3% 0.733
3- Large (> 3,500) 12% 10% 1% 0.930
Urbanicity (CCD Indicator)
1- Urban 12% 10% 2% 0.877
2- Suburb 5% 9% -4% 0.131
3- Town 23% 28% -5% 0.245
4- Rural 57% 49% 8% * 0.091
Region
1- NW 29% 34% -6% 0.390
2- NE 26% 24% 2% 0.714
3- Central 19% 24% -4% 0.445
4- SW 14% 16% -3% 0.828
5- SE 12% 1% 10% ** 0.034
Charter 8% 13% -6% 0.735
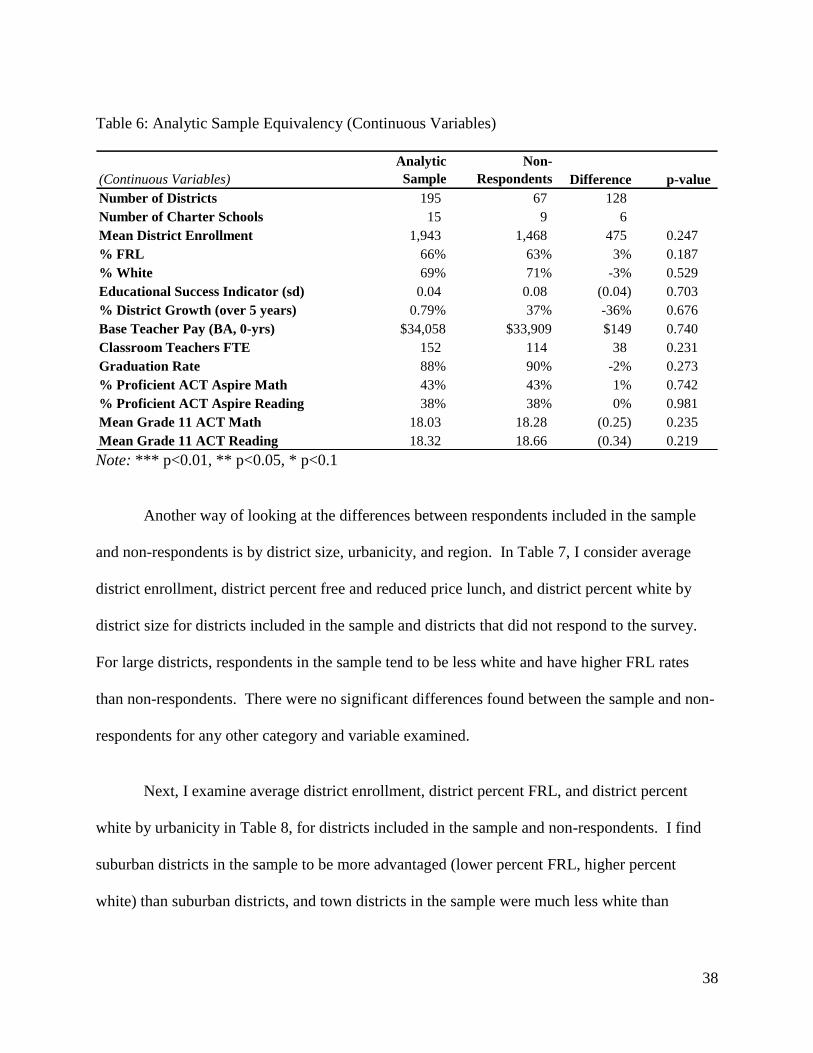
38
Table 6: Analytic Sample Equivalency (Continuous Variables)
Note: *** p<0.01, ** p<0.05, * p<0.1
Another way of looking at the differences between respondents included in the sample
and non-respondents is by district size, urbanicity, and region. In Table 7, I consider average
district enrollment, district percent free and reduced price lunch, and district percent white by
district size for districts included in the sample and districts that did not respond to the survey.
For large districts, respondents in the sample tend to be less white and have higher FRL rates
than non-respondents. There were no significant differences found between the sample and non-
respondents for any other category and variable examined.
Next, I examine average district enrollment, district percent FRL, and district percent
white by urbanicity in Table 8, for districts included in the sample and non-respondents. I find
suburban districts in the sample to be more advantaged (lower percent FRL, higher percent
white) than suburban districts, and town districts in the sample were much less white than
(Continuous Variables)
Analytic
Sample
Non-
Respondents Difference p-value
Number of Districts 195 67 128
Number of Charter Schools 15 9 6
Mean District Enrollment 1,943 1,468 475 0.247
% FRL 66% 63% 3% 0.187
% White 69% 71% -3% 0.529
Educational Success Indicator (sd) 0.04 0.08 (0.04) 0.703
% District Growth (over 5 years) 0.79% 37% -36% 0.676
Base Teacher Pay (BA, 0-yrs) $34,058 $33,909 $149 0.740
Classroom Teachers FTE 152 114 38 0.231
Graduation Rate 88% 90% -2% 0.273
% Proficient ACT Aspire Math 43% 43% 1% 0.742
% Proficient ACT Aspire Reading 38% 38% 0% 0.981
Mean Grade 11 ACT Math 18.03 18.28 (0.25) 0.235
Mean Grade 11 ACT Reading 18.32 18.66 (0.34) 0.219

39
districts that did not respond. There is a marginally significant difference found between
districts included in the sample and non-respondents for average enrollment in city districts.
Table 7: District Demographics: Analytic Sample, Non-Respondents by District Size, 2016-17
Note: No significant differences between sample and non-respondents for each category and
variable of interest.
Table 8: District Demographics: Analytic Sample, Non-Respondents by Urbanicity, 2016-17
Notes: The most recent NCES district urbanicity information (2014-15) identifies 290 districts
including charter schools. There were 262 districts in the state in the 2016-17 school year. Of
the 290 districts, 255 include demographic information in 2016-17 and are represented here.
Significant difference of p<0.1 found between sample and non-respondents for district
enrollment for city districts only.
In Table 9, I compare average district enrollment, district poverty rate (percent FRL), and
district percent white by region for survey respondents and non-respondents. Within the Central
and Southeast regions, respondents have lower percentages of white students compared to
districts that did not respond to the survey. In addition, for respondents within the Southwest
District
Size
N of
districts
Averge
District
Enrollment % FRL % White
N of
districts
Averge
District
Enrollment % FRL % White
Large 23 8,672 59% 53% 7 4,886 52% 70%
Midsize 38 2,126 61% 67% 15 2,253 61% 67%
Small 134 348 69% 72% 45 675 66% 73%
Overall 195 1,943 66% 69% 67 1,468 63% 71%
Analytic Sample Non-Respondents
Urbanicity
N of
districts
Averge
District
Enrollment % FRL % White
N of
districts
Averge
District
Enrollment % FRL % White
City 24 6,008 63% 36% 7 1,148 57% 37%
Suburb 10 4,510 47% 74% 6 4,212 55% 57%
Town 45 1,933 68% 57% 19 1,971 65% 69%
Rural 111 882 68% 82% 33 822 67% 83%
Overall 190 1,943 66% 69% 65 1,468 63% 71%
Analytic Sample Non-Respondents

40
region it appears that these districts had higher rates of poverty than districts that did not
respond. There were no significant differences found between the sample and non-respondents
for any other category and variable examined.
Table 9: District Demographics: Analytic Sample, Non-Respondents by Region, 2016-17
Note: No significant differences between sample and non-respondents for each category and
variable of interest.
Differences between district respondents and non-respondents are only marginally
significant for urban districts. Overall, districts included in the sample appear to be reasonably
representative of districts statewide.
Descriptive Analysis
I first examine the raw relationships between the factors of supply (applications to vacancies)
and the variables of interest (district size, urbanicity, region, poverty rate, racial/ethnic diversity,
educational success, beginning teacher salaries, and district growth). District size is presented in
deciles of enrollment as well as a categorical variable, urbanicity and region are described by
category, and the remaining variables are provided by quintile. The relationship between the
factors of need (vacancies to FTE classroom teaching positions) and the same variables of
interest are explored and presented in the same way.
Region
N of
districts
Averge
District
Enrollment % FRL % White
N of
districts
Averge
District
Enrollment % FRL % White
NW 56 2,450 62% 82% 23 1,453 60% 80%
NE 51 1,398 67% 80% 16 1,418 68% 78%
Central 38 3,022 62% 53% 16 1,711 60% 60%
SW 27 1,165 71% 63% 10 1,306 66% 64%
SE 23 1,050 75% 45% 2 895 72% 50%
Overall 195 1,943 66% 69% 67 1,468 63% 71%
Analytic Sample Non-Respondents

41
Multivariate Analysis
Outcome Measures (Dependent Variables)
There are two dependent variables of interest; one for supply and one for demand that are
directly derived from the district survey responses about the number of vacancies and
applications for grade level and subject positions. I define teacher “supply” as the ratio of
applications to vacancies, expressed in equation 2.
Y1= Supply Ratio = reported applications / reported vacancies (2)
Often, measures of teacher supply focus on the teacher pipeline and the number of
education program graduates entering the workforce. There are two issues with using this
method as the primary measure of supply: 1) it tends to focus on teacher supply statewide and
not at the district level; and 2) having an adequate number of new teachers statewide does not
mean they are filling positions in districts that need them most, nor does having an overall
inadequate state supply reflect surpluses that may still occur in more desirable districts. By
examining the ratio of applications to vacancies at the district level, I get a more direct, localized,
measure of teacher supply and can investigate the relationship district characteristics may have
on supply.
In addition to examining overall teacher supply, I also investigate teacher supply by
school level and subject area in the same way. For teacher supply by school level I use
application and vacancy information for elementary (K-4), middle school (5-8), and high school
(9-12) levels. For teacher supply by subject I focus on the number of applications and vacancies
reported for math and science, and language arts (and social studies) subjects.
42
For the outcome measure of teacher need (demand), I use the number of vacancies for
grade level and subject positions from the district survey responses and full-time equivalent
certified teaching staff reported from the 2015-16 district finance data. I define teacher “need”
as the ratio of vacancies to FTE, or the fraction of the teacher workforce the district needs to
replace each year, expressed in equation 3.
Y2= Need Ratio = reported vacancies / classroom teachers (3)
Unlike other measures of teacher need that focus on estimates of teacher retirees as the
driver, this measure of need reflects the demand created by both teacher turnover and changes in
student enrollment. As with supply, in addition to looking at overall teacher need, I also
examine teacher need by school level and subject area in the same way. I compiled the FTE by
school level and FTE by subject data information using de-identified information on teacher
assignments by school from the Office for Education Policy. Using this information, I was able
to link teachers to districts and use job code information included to identify grade levels and
subjects. From this job code and school assignment information, teachers were identified as
elementary (K-4), middle (5-8), or high school (9-12) based on grade assignments and math,
science, language arts, and social studies for subject assignments. While an imperfect method,
the approach provided the best means to estimate classroom teacher FTE by school level and
subject.
Independent Variables
There are several independent district characteristics that may influence the extent to which
school districts have a greater or lesser supply of teachers than other districts, which will in turn

43
be related to teacher shortages. Independent variables included in the regression model include:
district enrollment (size), urbanicity, region, poverty rate (FRL), race/ethnicity (white),
educational success indicator (composite), teacher salary (BA, 0-years), and district growth
measure (5-year average). Regression analyses statistically control for any minor differences in
demographic characteristics. District enrollment (by size), region, and urbanicity are categorical
indicator variables.
Multivariate Regression Model(s)
I conduct Ordinary Least Squares (OLS) regression analysis with heteroskedastic-robust standard
errors (Angrist & Pischke, 2009; White, 1980) to determine the characteristics of districts
associated with teacher supply and need. The same OLS models are used for both supply and
need and the fully specified models are defined in equations 4 and 5 below. In total, there are
nine models presented each for supply and need. Initially, simple models are run for district
enrollment (using the categorical variable district size), urbanicity, and region separately without
variables controlling for demographics, educational success, teacher salary, or district growth.
Next, models that include both district enrollment (district size) and region are run, both with and
without control variables. Finally, models including both region and urbanicity are run, with and
without control variables. The same models are used for the additional school level and subject
analyses.
OLS Regression Models (Supply).
Y1 = β0 + β1γ + β2θ + β3X + β4φ + β5λ + β6δ + ε (4)
OLS Regression Model (Need).
Y2 = β0 + β1γ + β2θ + β3X + β4φ + β5λ + β6δ + ε (5)
44
Where,
Y1 represents a given outcome of interest (overall supply, supply by school level, or
supply by subject area),
Y2 represents a given outcome of interest (overall need, need by school level, or need
by subject area),
γ is an indicator for district size (or urbanicity),
θ is an indicator for region,
X represents district demographic characteristics (FRL status, race/ethnicity),
φ represents district educational success,
λ represents beginning new teacher salary,
δ represents district growth, and
ε represents the error term.
Limitations
Limitations to the study include concerns regarding the accuracy and reliability of the self-
reported responses on the superintendent survey. While some districts were likely very
thoughtful and thorough in their responses regarding the number of vacancies and applications
provided, it is expected many districts offered best estimates rather than exact numbers. In
addition, not all surveys were fully completed. Of the 195 districts included in the sample and
subsequent analyses, 11 provided incomplete surveys.
There may also be concerns regarding the inclusion of charter school responses. It could
be argued that charter school districts’ needs and hiring practices are different and should not be
included. I would argue that charter districts are competing to attract teachers the same as
traditional public school districts and that many fully licensed and certified teachers find
positions in charter districts as well.9 In addition, there are relatively few charter school districts
included (15 of the 195).10 In favor of being more inclusive and using as much of the data
9 However, licensure and certification often is not required of public charter school teachers. 10 Additional analyses were conducted which excluded charter schools. There was no effect on
the outcomes or changes in significance to the findings.

45
available as possible, charter schools and incomplete survey responses are kept in the sample and
used for all analyses.
Finally, this is a descriptive study with the purpose of determining the association
between certain district characteristics and teacher supply and need in the state of Arkansas.
Causal inferences cannot be ascertained. The findings of this study are unique to the Arkansas
context for the 2016-17 school year.

46
Chapter 4: Results
The purpose of this study is to test whether a uniform teacher shortage exists across the state of
Arkansas. I hypothesize that, rather than a uniform shortage, teacher shortages are more likely to
occur in certain regions and subjects. I further examine whether there is a surplus of elementary
and English/language arts teachers as the literature indicates. I expect to find more (relative to
need) elementary than middle or high school teachers, and more English/language arts than math
and science teachers. Specifically, my objective in this study is to answer the following
questions related to teacher supply and need in Arkansas:
1. What are the characteristics of districts that have the most favorable teaching supply?
2. Does supply differ by school level or subject?
3. What are the characteristics of districts that have the greatest need for teachers?
4. Does need differ by school level or subject?
Teacher Supply
Research Question 1. What are the characteristics of districts that have the most
favorable teaching supply?
Descriptive Analysis
Which district factors drive supply? When examining the characteristics of districts that
might contribute to teacher supply, the literature suggests that district size, urbanicity, poverty,
and racial/ethnic diversity will be factors to consider (Aragon, 2016; Dee & Goldhaber, 2017;
Ingersoll, 2001; 2003; Murnane & Steele, 2007; Murphy et al., 2003). From the 2017 district

47
survey, I define “supply” as the ratio of applications over vacancies.11 As district size and
urbanicity are strongly correlated with each other and certain regions in the state are more urban
than others, I will examine these factors separately and not place them in a model
simultaneously. It is also likely that schools in different regions face different levels of teacher
supply due to the relative attractiveness of each region. For reference, the five education regions
in the state referred to are displayed in Figure 3. Therefore, I examine the extent to which
teacher supply is related to these factors as well as district poverty rate, racial/ethnic diversity,
academic educational success, beginning teacher salaries, and district growth as these may also
influence teacher supply. As many of these district characteristics may be related to each other
(e.g. district size and teacher salary, district racial/ethnic diversity and region), I present
correlations in Table 20. Initially, I examine bivariate supply relationships, however, any of
these relationships might be confounded by other factors. Subsequently, I follow up using
regression analyses to determine which consistent independent relationships remain.
(Source: Arkansas Association of Educational Administrators, 2017)
Figure 3: Education Regions of Arkansas
11 The mean unit of supply across the state is approximately 6 applicants per vacancy.

48
How is teacher supply related to district size (enrollment)?12 It is likely that larger
districts will have more positions than smaller districts due to the fact that larger districts have
more amenities and more opportunities for employment. For enrollment, I first present district
enrollment by decile and then as a categorical variable using the same district size categories as
those used for developing and administering the online survey. “Large” districts are defined as
those with enrollment greater than 3,500 students, “Midsize” districts are those with enrollment
between 1,500 and 3,500 students, and “Small” districts are those with enrollment less than
1,500 students.
Examining district enrollment by decile in Table 10, as expected, I find the largest
districts, in decile 10, have the greatest teacher supply (8.0), which is nearly twice as much as
any other decile. Districts with enrollments of between 900-1,000 students (decile 6) have the
least teacher supply at 2.9. This means that the largest districts receive 8 applications for every
vacant position while districts with 900-1,000 students get about 3 applications. Note that the
mean unit of teacher supply statewide is approximately 5 applications for every vacancy.
Districts in the remaining deciles have similar teacher supply ranging from 3.0-4.6, with most
(60%) having fewer than 4 applications per vacancy. Figure 4 shows the relationship between
the average numbers of district applications to vacancies for districts in each decile.
In addition to examining district size by enrollment decile, I also use the categorical
variable for district size in Table 11 and find similar results. Here, “large” districts again have
the greatest supply of teachers (7.9), almost double that of “small” districts (4.0) and more than
12 Regression models using enrollment as a continuous variable are included in Appendices A
and I. There is little difference in significance between using enrollment as a continuous or
categorical variable.
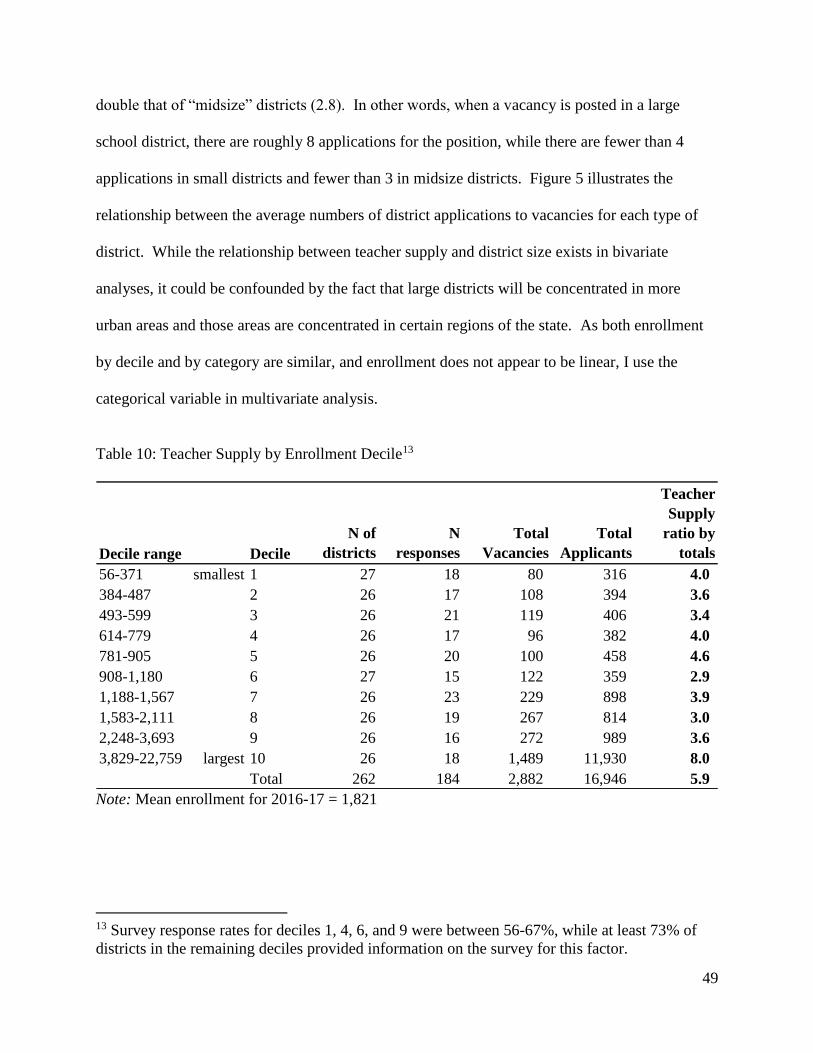
49
double that of “midsize” districts (2.8). In other words, when a vacancy is posted in a large
school district, there are roughly 8 applications for the position, while there are fewer than 4
applications in small districts and fewer than 3 in midsize districts. Figure 5 illustrates the
relationship between the average numbers of district applications to vacancies for each type of
district. While the relationship between teacher supply and district size exists in bivariate
analyses, it could be confounded by the fact that large districts will be concentrated in more
urban areas and those areas are concentrated in certain regions of the state. As both enrollment
by decile and by category are similar, and enrollment does not appear to be linear, I use the
categorical variable in multivariate analysis.
Table 10: Teacher Supply by Enrollment Decile13
Note: Mean enrollment for 2016-17 = 1,821
13 Survey response rates for deciles 1, 4, 6, and 9 were between 56-67%, while at least 73% of
districts in the remaining deciles provided information on the survey for this factor.
Decile range Decile
N of
districts
N
responses
Total
Vacancies
Total
Applicants
Teacher
Supply
ratio by
totals
56-371 smallest 1 27 18 80 316 4.0
384-487 2 26 17 108 394 3.6
493-599 3 26 21 119 406 3.4
614-779 4 26 17 96 382 4.0
781-905 5 26 20 100 458 4.6
908-1,180 6 27 15 122 359 2.9
1,188-1,567 7 26 23 229 898 3.9
1,583-2,111 8 26 19 267 814 3.0
2,248-3,693 9 26 16 272 989 3.6
3,829-22,759 largest 10 26 18 1,489 11,930 8.0
Total 262 184 2,882 16,946 5.9

50
Note: Decile 1 = Smallest, Decile 10 = Largest
Figure 4: Average Teacher Supply by Enrollment Decile
Table 11: Teacher Supply by District Size14
Note: Mean Enrollment 2016-17 = 1,821
14 Sixty seven percent of large districts and more than 70% of small and midsize districts
provided information on the survey for this factor.
4 6 6 6 5 8 10 14 17
83
18 23 19 22 23 24 39 4362
663
4.0 3.6 3.4 4.0
4.6
2.9
3.9
3.0 3.6
8.0
-
2.0
4.0
6.0
8.0
10.0
12.0
0
100
200
300
400
500
600
700
1 2 3 4 5 6 7 8 9 10
Sup
ply
Rat
io
Dis
tric
t A
ver
age
Average Teacher Supply by Enrollment Decile
Average District Vacancies Average District Applicants Teacher Supply ratio by totals
Size range
District
Size Type
N of
districts
N of
responses
Total
Vacancies
Total
Applicants
Teacher
Supply
ratio
< 1,500 Small 1 181 128 793 3,145 4.0
1,500-3,500 Midsize 2 51 36 541 1,499 2.8
> 3,500 Large 3 30 20 1,557 12,302 7.9
Total 262 184 2,891 16,946 5.9

51
Note: Small district is <1,500, Midsize is 1,500-3,500, Large is >3,500
Figure 5: Average Teacher Supply by District Size
How is teacher supply related to urbanicity? The urbanicity of a district may also
influence teacher supply (Aragon, 2016; Dee & Goldhaber, 2017; Ingersoll, 2001; 2002; 2003;
Malatras et al., 2017; Murphy et al., 2003; Will, 2016). More urban districts will be able to
attract more teachers as more people want to live in urban areas that offer more attractions and
activities. In addition, there are more educator preparation programs offered in and around the
urban areas of the state.
Urbanicity is another way to consider and measure district size, as it is related to the
population of a particular area. Using the NCES (2017b) urban-locale framework15, there are
four basic urbanicity designations for school districts: “City”, “Suburb”, “Town”, and “Rural”.
A “City” is defined as an urban area with a population of around 100,000 or more. Fayetteville
15 The most recent NCES district urbanicity information from 2014-15 identifies 290 districts in
the state including charter schools (NCES 2017a). There were 262 districts in the state in the
2016-17 school year.
6 15 7825 42
615
4.0
2.8
7.9
-
2.0
4.0
6.0
8.0
10.0
12.0
0
100
200
300
400
500
600
700
Small Midsize Large
Sup
ply
Rat
io
Dis
tric
t A
ver
age
Average Teacher Supply by District Size
Average District Vacancies Average District Applicants Teacher Supply ratio

52
School District would be an example of a district designated as “City”, as would the capital city
of Little Rock. A “Suburb” is outside a city but still within an urban area. An example of a
district designated as “Suburb” would include Farmington School District. A “Town” is
approximately 10-35 miles from a city/suburb, and Mountain Home School District would be an
example of a “Town” district. “Rural” is considered at least five miles from a city/suburb and
approximately 10 miles from a town. An example of a “Rural” district would include West Fork
School District.
In Table 12, as expected, city districts have the largest supply of teachers (8.3), more than
double that of districts in towns (3.8) and almost double that of rural districts (4.0). That is to
say, for every vacancy in city school districts, there are an average of approximately 8
applications for the position, while there are fewer than 4 applications in town and rural districts.
Figure 6 illustrates the relationship between average district vacancies and applications by
urbanicity. While this simple analysis points to a relationship between urbanicity and teacher
supply, it is certainly correlated with the fact that the majority of rural districts (74%) are small
districts, and most of the rural and small districts are concentrated in the Northwest region.

53
Table 12: Teacher Supply by Urbanicity16
Note: The most recent NCES district urbanicity information from 2014-15 identifies 290 districts
in the state including charter schools (NCES 2017a). There were 262 districts in the state in the
2016-17 school year.
Figure 6: Average Teacher Supply by Urbanicity
How is teacher supply related to district growth? It is reasonable to assume that
increases or decreases in student enrollment in a district over time will influence the number of
vacancies a district has (Lindsay et al., 2016; Murnane & Steele, 2007; Murphy et al., 2003). It
16 More than 64% of city and rural districts, and more than 50% of suburban and town districts
provided information on the survey for this factor.
NCES Urban-
Locale
Designation Type
N of
districts
N of
responses
Total
Vacancies
Total
Applicants
Teacher
Supply
ratio
City 1 36 23 985 8,171 8.3
Suburb 2 20 10 287 1,771 6.2
Town 3 75 42 675 2,550 3.8
Rural 4 159 104 632 2,542 4.0
Total 290 179 2,579 15,034 5.8
43 29 16 6
355
177
6124
8.3
6.2
3.8 4.0
-
2.0
4.0
6.0
8.0
10.0
12.0
0
50
100
150
200
250
300
350
400
City Suburb Town Rural
Sup
ply
Rat
io
Dis
tric
t A
ver
age
Average Teacher Supply by Urbanicity
Average District Vacancies Average District Applicants Teacher Supply ratio

54
may also be an indicator as to the desirability of a particular region. One would expect that
districts with more growth would have more vacancies and, thus, more applications. In contrast,
districts with decreasing student enrollments would have fewer vacancies and likely fewer
applications. It is not clear, therefore, whether the supply should go up or down related to
growth. To evaluate this, a district growth measure was created to account for changes in student
enrollment over a 5-year period from 2012-13 to 2016-17, relative to the first year (2012-13).
Looking at the quintiles of district growth in Table 13, I find that districts with the most
positive growth (quintile 5 at 11.3) had five times more teacher supply than districts with the
most negative growth (quintile 1 at 2.0). In other words, districts with the most growth saw an
average of 11 applications for each advertised vacancy. Meanwhile, districts with the greatest
decreases in enrollment saw an average of 2 applications per vacant position. Figure 7 illustrates
the relationship between average district vacancies and applications by district growth.
Table 13: Teacher Supply by District Growth (5-year) Quintile17
Notes: Mean District Growth 2012-13 to 2016-17 = 0.69%. Average growth over five years
relative to the first year, 2012-13.
17 More than 60% of districts in quintiles 2 and 4, and at least 70% of districts in the remaining
quintiles provided information on the survey for this factor.
Quintile range Quintile
N of
districts
N of
responses
Total
Vacancies
Total
Applicants
Teacher
Supply
ratio
(-7.3) - (-1.84) most - 1 50 39 420 846 2.0
(-1.81) - (-0.63) 2 50 33 495 2,047 4.1
(-0.61) - 0.302 3 50 40 568 1,883 3.3
0.309 - 1.48 4 50 30 351 1,911 5.4
1.49 - 79.8 most + 5 50 35 737 8,323 11.3
Total 250 177 2,571 15,010 5.8

55
Note: Quintile 1 = Least growth, Quintile 5 = Most growth.
Figure 7: Average Teacher Supply by District Growth (5-year) Quintile
How does teacher supply vary by region? Different regions of the state may be more
attractive or may have more opportunities available for teachers looking for positions, which
may influence the number of applications. Additionally, the literature suggests that many
teachers find positions close to home and/or in proximity to their training institutions (Barnett &
Blankenship, 2005; Boyd et al., 2005; Goldhaber et al., 2014; Krieg et al., 2016). Therefore, it is
likely that there would be increased teacher supply (driven by more applicants) in the Northwest
region, as that is where the state’s flagship university is located, and in the Central region, as
there is a concentration of teacher education institutions located there. Figure 8 illustrates the
concentration of teacher preparation institutions in these areas of Arkansas.
11 15 14 12 212262
4764
238
2.0
4.1
3.3
5.4
11.3
-
2.0
4.0
6.0
8.0
10.0
12.0
0
50
100
150
200
250
300
350
400
1 2 3 4 5
Sup
ply
Rat
io
Dis
tric
t A
ver
age
Average Teacher Supply by District Growth Quintile
Average District Vacancies Average District Applicants Teacher Supply ratio
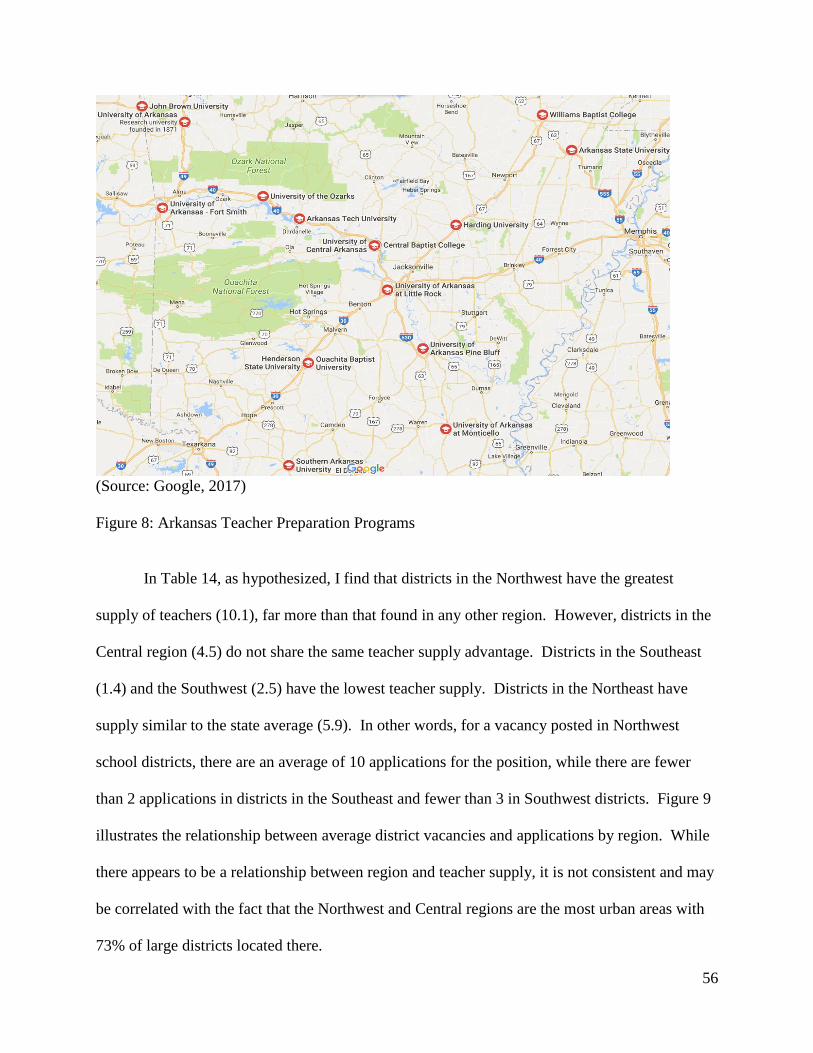
56
(Source: Google, 2017)
Figure 8: Arkansas Teacher Preparation Programs
In Table 14, as hypothesized, I find that districts in the Northwest have the greatest
supply of teachers (10.1), far more than that found in any other region. However, districts in the
Central region (4.5) do not share the same teacher supply advantage. Districts in the Southeast
(1.4) and the Southwest (2.5) have the lowest teacher supply. Districts in the Northeast have
supply similar to the state average (5.9). In other words, for a vacancy posted in Northwest
school districts, there are an average of 10 applications for the position, while there are fewer
than 2 applications in districts in the Southeast and fewer than 3 in Southwest districts. Figure 9
illustrates the relationship between average district vacancies and applications by region. While
there appears to be a relationship between region and teacher supply, it is not consistent and may
be correlated with the fact that the Northwest and Central regions are the most urban areas with
73% of large districts located there.
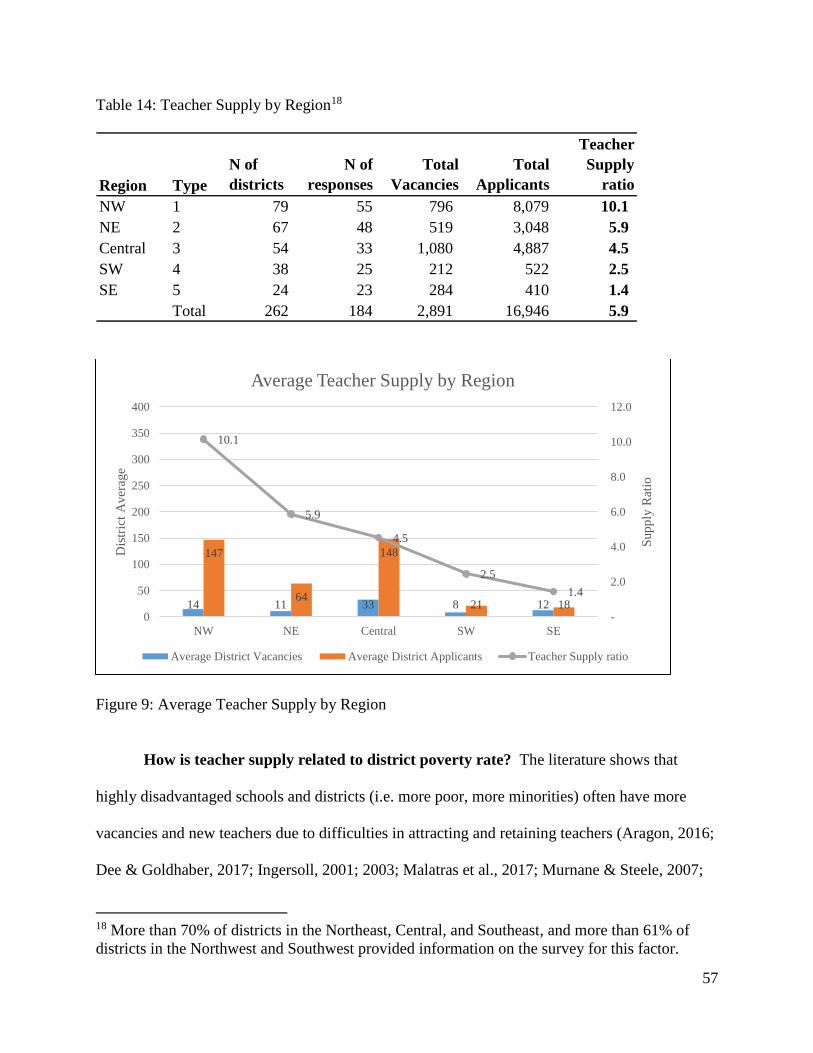
57
Table 14: Teacher Supply by Region18
Figure 9: Average Teacher Supply by Region
How is teacher supply related to district poverty rate? The literature shows that
highly disadvantaged schools and districts (i.e. more poor, more minorities) often have more
vacancies and new teachers due to difficulties in attracting and retaining teachers (Aragon, 2016;
Dee & Goldhaber, 2017; Ingersoll, 2001; 2003; Malatras et al., 2017; Murnane & Steele, 2007;
18 More than 70% of districts in the Northeast, Central, and Southeast, and more than 61% of
districts in the Northwest and Southwest provided information on the survey for this factor.
Region Type
N of
districts
N of
responses
Total
Vacancies
Total
Applicants
Teacher
Supply
ratio
NW 1 79 55 796 8,079 10.1
NE 2 67 48 519 3,048 5.9
Central 3 54 33 1,080 4,887 4.5
SW 4 38 25 212 522 2.5
SE 5 24 23 284 410 1.4
Total 262 184 2,891 16,946 5.9
14 11 33 8 12
147
64
148
21 18
10.1
5.9
4.5
2.5
1.4
-
2.0
4.0
6.0
8.0
10.0
12.0
0
50
100
150
200
250
300
350
400
NW NE Central SW SE
Sup
ply
Rat
io
Dis
tric
t A
ver
age
Average Teacher Supply by Region
Average District Vacancies Average District Applicants Teacher Supply ratio
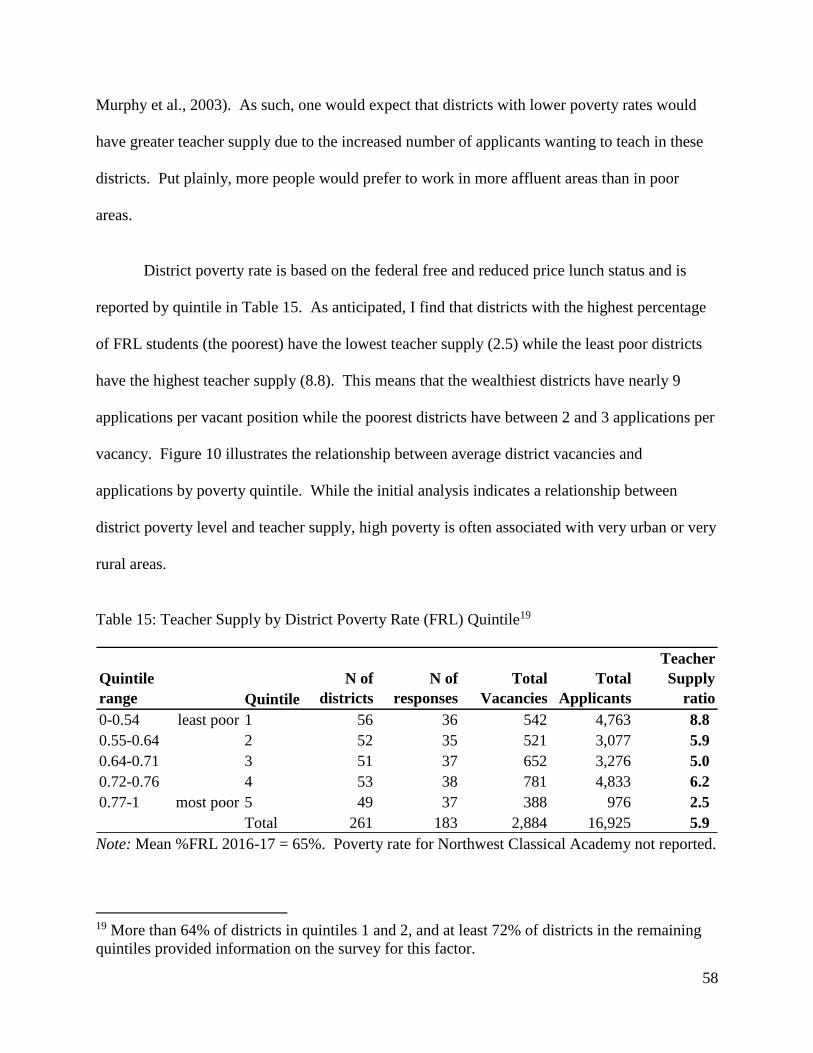
58
Murphy et al., 2003). As such, one would expect that districts with lower poverty rates would
have greater teacher supply due to the increased number of applicants wanting to teach in these
districts. Put plainly, more people would prefer to work in more affluent areas than in poor
areas.
District poverty rate is based on the federal free and reduced price lunch status and is
reported by quintile in Table 15. As anticipated, I find that districts with the highest percentage
of FRL students (the poorest) have the lowest teacher supply (2.5) while the least poor districts
have the highest teacher supply (8.8). This means that the wealthiest districts have nearly 9
applications per vacant position while the poorest districts have between 2 and 3 applications per
vacancy. Figure 10 illustrates the relationship between average district vacancies and
applications by poverty quintile. While the initial analysis indicates a relationship between
district poverty level and teacher supply, high poverty is often associated with very urban or very
rural areas.
Table 15: Teacher Supply by District Poverty Rate (FRL) Quintile19
Note: Mean %FRL 2016-17 = 65%. Poverty rate for Northwest Classical Academy not reported.
19 More than 64% of districts in quintiles 1 and 2, and at least 72% of districts in the remaining
quintiles provided information on the survey for this factor.
Quintile
range Quintile
N of
districts
N of
responses
Total
Vacancies
Total
Applicants
Teacher
Supply
ratio
0-0.54 least poor 1 56 36 542 4,763 8.8
0.55-0.64 2 52 35 521 3,077 5.9
0.64-0.71 3 51 37 652 3,276 5.0
0.72-0.76 4 53 38 781 4,833 6.2
0.77-1 most poor 5 49 37 388 976 2.5
Total 261 183 2,884 16,925 5.9

59
Note: Quintile 1 = Least poor, Quintile 5 = Most poor
Figure 10: Average Teacher Supply by District Poverty Rate (FRL) Quintile
How is teacher supply related to district racial/ethnic diversity? Highly
disadvantaged schools and districts not only have higher poverty rates but also tend to have
higher percentages of minority students (Aragon, 2016; Dee & Goldhaber, 2017; Loeb &
Reininger, 2004; Murnane & Steele, 2007; Murphy et al., 2003). As with poverty, it is probable
that there would be greater teacher supply in districts with less racial/ethnic diversity. That is,
more diverse districts will have fewer applicants. However, in Arkansas, there is an interesting
dynamic where some of the poorest districts in rural areas serve nearly all white students. Thus,
the relationship in this case is unclear.
Using the percent of white students in a district as a measure of diversity,20 presented in
quintiles, in Table 16, I find that districts with the lowest percentage of white students (quintile
20 Further examination of teacher supply by the district percentage of Hispanic and black
students is presented in Appendix B. Teacher supply is greatest in districts that are more than
15 15 18 21 10
132
88 89
127
26
8.8
5.9
5.0
6.2
2.5
-
2.0
4.0
6.0
8.0
10.0
12.0
0
50
100
150
200
250
300
350
400
1 2 3 4 5
Sup
ply
Rat
io
Dis
tric
t A
ver
age
Average Teacher Supply by District Poverty Rate (FRL)
Quintile
Average District Vacancies Average District Applicants Teacher Supply ratio

60
1) have the lowest teacher supply (4.9), however, districts with the highest percentage of white
students (quintile 5) have similar teacher supply (5.3). In other words, the least white districts
and the whitest districts both have approximately 5 applications for each vacant position. Figure
11 illustrates the relationship between average district vacancies and applications by white
quintile. Further analysis indicates that both the whitest and least white districts are also among
the smallest districts in the state. 21 Additionally, I find that the largest districts in the Northwest
are also the whitest. These reasons likely contribute to the similar rates of teacher supply.
Moreover, some of the urban districts in central Arkansas have relatively high levels of teacher
supply and serve large percentages of minority students.
Table 16: Teacher Supply by District Race/Ethnicity (White) Quintile22
Note: Mean %White 2016-17 = 70%
10% Hispanic (even when excluding districts in the Northwest region), and in districts that are
0.01-0.10% black. 21 A table summarizing the race/ethnicity (white) quintiles by small districts is included in
Appendix C. 22 More than 66% of districts in quintiles 2, 3, and 5, and more than 72% of districts in quintiles
1 and 4 provided information on the survey for this factor.
Quintile
range Quintile
N of
districts
N of
responses
Total
Vacancies
Total
Applicants
Teacher
Supply
ratio
0-0.44 least white 1 54 41 1,479 7,254 4.9
0.47-0.71 2 53 36 571 4,018 7.0
0.72-0.87 3 51 35 365 2,517 6.9
0.88-0.93 4 60 43 328 2,375 7.2
0.94-0.98 most white 5 44 29 148 782 5.3
Total 262 184 2,891 16,946 5.9

61
Note: Quintile 1 = Least White, Quintile 5 = Most White
Figure 11: Average Teacher Supply by District Race/Ethnicity (White) Quintile
How is teacher supply related to district educational success? As teachers seek
vacant positions, it is possible they may look to apply to higher achieving schools and districts
assuming higher achieving students would be easier to teach (Aragon, 2016; Hanushek et al.,
2004; Loeb & Reininger, 2004). However, it is also possible that student achievement may be
higher in districts with a steady supply or surplus of teachers. While I cannot determine the
particulars or the direction of the relationship, I can look at the association between district
student educational success and teacher supply.
To examine how teacher supply might be related to educational success, I created a
district educational success indicator that includes district percent proficiency on the ACT Aspire
math and reading assessments (state assessment), district graduation rate, and district average
math and reading score on the 11th grade ACT exams. All items were standardized and a
composite created in which one quarter weight was given to each of the average ACT Aspire
3616 10 8 5
177
112
7255
27
4.9
7.0 6.9 7.2
5.3
-
2.0
4.0
6.0
8.0
10.0
12.0
0
50
100
150
200
250
300
350
400
1 2 3 4 5
Sup
ply
Rat
io
Dis
tric
t A
ver
age
Averge Teacher Supply by Race/Ethnicity (White) Quintile
Average District Vacancies Average District Applicants Teacher Supply ratio

62
math score, ACT Aspire reading score, graduation rate, and composite of the 11th grade ACT
reading and math scores.23 The final composite has a mean of 0.05 standard deviation units with
a standard deviation of 0.71. Using this measure, I examine the extent to which the “overall
success” of a district (based on student achievement and graduation rate) is related to teacher
supply.
In Table 17, I find the relationship does not appear to be perfectly linear. Districts with
the highest educational success (quintile 5 at 10.0) have almost four times more teacher supply
than districts with the lowest educational success (quintile 1 at 2.6). That is to say, for every
vacant position in the highest achieving districts, there are an average of nearly 10 applications
for the position, while there are fewer than 3 applications per position in the lowest achieving
districts. Figure 12 illustrates the relationship between average district vacancies and
applications by educational success. While there appears to be a relationship between
educational success and teacher supply, educational success is also often related to
socioeconomic advantage and urbanicity.
23 Prior to standardizing, the mean percent proficient on the ACT Aspire math was 43%, the
mean percent proficient on the ACT Aspire reading was 38%, the mean high school graduation
rate was 88%, and the mean 11th grade ACT score in math and reading were both 18.

63
Table 17: Teacher Supply by District Educational Success Indicator Quintile24
Notes: Mean for 2016-17 = 0.05 SD. Educational Success = (0.25) ACT Aspire Math + (0.25)
ACT Aspire Reading + (0.25) Grad rate + (0.25) Gr.11 ACT Math-Reading Composite. Total
number of districts reflects those with all the data required to create an Educational Success
Indicator (composite). Districts missing graduation rate or assessments are not included.
Note: Quintile 1 = Lowest, Quintile 5 = Highest
Figure 12: Average Teacher Supply by District Educational Success Indicator Quintile
How is teacher supply related to salary offered to new teachers? Variation in teacher
salaries among districts may also influence teacher supply, with higher paying districts attracting
24 More than 65% of districts in quintiles 3 and 4, and at least 71% of districts in the remaining
quintiles provided information on the survey for this factor.
Quintile range Quintile
N of
districts
N of
responses
Total
Vacancies
Total
Applicants
Teacher
Supply
ratio
(-2.5) - (-0.47) lowest 1 49 35 779 1,991 2.6
(-0.45)- (-0.07) 2 49 36 393 2,648 6.7
(-0.06) - 0.254 3 48 31 463 2,667 5.8
0.257 - 0.542 4 49 34 310 2,028 6.5
0.548 - 3.5 highest 5 48 36 560 5,604 10.0
Total 243 172 2,505 14,938 6.0
22 11 15 9 165774
8660
156
2.6
6.7
5.8 6.5
10.0
-
2.0
4.0
6.0
8.0
10.0
12.0
0
50
100
150
200
250
300
350
400
1 2 3 4 5
Sup
ply
Rat
io
Dis
tric
t A
ver
age
Average Teacher Supply by Educational Success Indicator
Quintile
Average District Vacancies Average District Applicants Teacher Supply ratio

64
more applicants (Hanushek et al., 2004; Loeb & Reininger, 2004). As such, one would expect
the highest paying districts to have the greatest teacher supply. Looking at beginning teacher
salary (Bachelor’s degree with no experience) by quintile in Table 18, as expected, districts with
the highest teacher salary have by far the greatest teacher supply. In fact, quintile 5 (the highest
at 9.5) has almost three times more teacher supply than the remaining quintiles (between 3.0 –
3.5). This means that the highest paying districts have between 9 and 10 applications per vacant
position on average while districts in the remaining quintiles have about 3 applications per
vacancy. Figure 13 illustrates the relationship between average district vacancies and
applications by beginning teacher salary.
Table 18: Teacher Supply by Average District Teacher Salary (BA, 0-years) Quintile25
Notes: Mean Teacher Salary (BA, 0yrs) 2016-17 = $34,020. Salary not reported for Arkansas
School of the Blind, Arkansas School of the Deaf, Division of Youth Services Schools, Arkansas
Virtual Academy, and Quest Middle School of Pine Bluff.
25 More than 71% of districts in quintile 4 and between 58-69% of districts in the remaining
quintiles provided information on the survey for this factor.
Quintile range Quintile
N of
districts
N of
responses
Total
Vacancies
Total
Applicants
Teacher
Supply
ratio
$29,000 - 31,400 lowest 1 52 36 216 695 3.2
31,440 - 32,250 2 51 34 277 843 3.0
32,305 - 33,508 3 52 30 275 941 3.4
33,774 - 36,832 4 51 36 763 2,663 3.5
36,886 - 47,016 highest 5 51 30 1,191 11,337 9.5
Total 257 166 2,722 16,479 6.1

65
Note: Quintile 1 = Lowest salary, Quintile 5 = Highest salary
Figure 13: Average Teacher Supply by District Average Teacher Salary (BA, 0-years) Quintile
To recap the descriptive relationships thus far, I categorize districts as those with the least
favorable teaching supply (supply ratio less than 1.5), average teaching supply (ratio between 1.5
and 7.0), or most favorable teaching supply (ratio greater than 7.0).26 In Table 19 below, I find
26% of districts in the sample represented in the least favorable teaching supply category.
Relative to the state, over-represented in the least favorable category are small districts with
student enrollments of less than 1,500, districts in towns, districts in the Central and Southeast
regions, poorer districts, more racially diverse districts, the lowest achieving districts, and
districts with the most growth. In the most favorable teaching supply category, I find 25% of
districts in the sample represented. Relative to the state, it appears large districts with
enrollments greater than 3,500, urban and suburban districts, districts in the Northwest, wealthier
districts, whiter districts, the highest achieving districts, higher paying districts, and districts with
26 Categories determined by percentile ranking with 1.5 at the 25th percentile and 7.0 at the 75th
percentile.
6 8 9 21 4019 25 3174
378
3.2 3.0 3.4 3.5
9.5
-
2.0
4.0
6.0
8.0
10.0
12.0
0
50
100
150
200
250
300
350
400
1 2 3 4 5
Sup
ply
Rat
io
Dis
tric
t A
ver
age
Average Teacher Supply by Average District Teacher Salary
(BA, 0-yrs) Quintile
Average District Vacancies Average District Applicants Teacher Supply ratio

66
the least growth are over-represented in the most favorable category. As many of these factors
are related to each other, I turn to multivariate analysis to disentangle these relationships.
Table 19: Summary of Teacher Supply Indicators
Notes: Supply categories determined by percentile ranking with 1.5 at the 25th percentile and 7.0
at the 75th percentile. Sample Total includes all districts with supply ratios (with both application
and vacancy information). Educational success Indicator is in standard deviation units.
Multivariate Analysis
Indicators
Least
Favorable
Teacher
Supply ( <1.5)
Average
Teacher
Supply
Most
Favorable
Teacher
Supply ( >7)
Sample
Total State Total
N of Districts 48 89 46 183 262
% of Sample 26% 49% 25% 100%
Supply Range 0 - 1.45 1.5 - 6.8 7 - 42.4 0 - 42.4
Mean Supply 0.55 3.37 13.28 5.7
District Size
% Small (< 1,500) 69% 74% 61% 69% 68%
% Midsize (1,500 - 3,500) 21% 19% 15% 19% 20%
% Large (> 3,500) 10% 7% 24% 12% 11%
Urbanicity
% City 13% 11% 15% 13% 14%
% Suburb 4% 3% 11% 5% 8%
% Town 31% 18% 22% 22% 29%
% Rural 52% 64% 48% 57% 61%
Region
% NW 15% 24% 54% 29% 30%
% NE 25% 26% 24% 25% 26%
% Central 25% 21% 11% 20% 21%
% SW 13% 18% 9% 14% 15%
% SE 23% 11% 2% 12% 9%
Mean Enrollment 1,487 1,608 3,184 1,972 1,822
Mean % FRL 71% 67% 61% 66% 65%
Mean % White 58% 70% 76% 68% 70%
Mean Educational Success (sd) -0.30 0.04 0.37 0.03 0.05
Mean Beginning Teacher
Salary (BA, 0-yrs) $33,903 $33,374 $35,666 $34,092 $34,020
Mean % District Growth 1.00% 0.92% 0.47% 0.83% 0.69%

67
What is driving teacher supply? Based on the descriptive analyses presented above and
correlations in Table 20 below, it appears teacher supply is likely predicted by district size,
urbanicity, district poverty level, and district racial/ethnic diversity. Specifically, I find that
district enrollment, educational success, new teacher starting salary, percent white and district
size are significantly positively correlated with supply while poverty level is significantly
negatively correlated with supply. Urbanicity is significantly correlated with many factors
including the components of supply (significantly negatively correlated with applications and
vacancies) but not directly with supply.27 District growth does not appear to be correlated with
any other factors.
Multivariate models will be able to unpack these effects and provide more information as
to the independent relationship between these factors and teacher supply. Even so, highly
correlated variables will impact regression models which include both, and make it difficult to
determine impacts separately. To avoid such issues of multicollinearity, urbanicity and district
size will be included in separate models as they are likely driving the same variation. Enrollment
and region are somewhat related, but there is enough variation in enrollment within regions that I
will include both variables in the same models. Therefore, several models will be presented and
discussed.
27 Urbanicity is included in the correlation matrix as there is an ordinal nature to this measure.

68
Table 20: Correlations: Variables Associated with Supply
Supply
Total
Vacancies
Total
Applicants Enrollment
District
Growth Achievement
Tsalary
Ba0Yrs FRL White
District
Size Urbanicity
Supply 1
Total Vacancies 0.06 1
Total Applicants 0.51*** 0.77*** 1
Enrollment 0.29*** 0.73*** 0.73*** 1
District Growth 0.01 0.03 0.01 0.01 1
Educational Success 0.31*** -0.03 0.16** 0.11* 0.28*** 1
Tsalary Ba0Yrs 0.36*** 0.43*** 0.55*** 0.61*** 0.23*** 0.25*** 1
FRL -0.30*** -0.02 -0.15** -0.19*** -0.23*** -0.66*** -0.44*** 1
White 0.14* -0.29*** -0.15** -0.18*** 0.01 0.62*** -0.19*** -0.39*** 1
District Size 0.16* 0.63* 0.50* 0.82* 0.21* 0.13 0.58* -0.32* -0.31* 1
Urbanicity -0.12 -0.54* -0.38* -0.66* -0.04 0.13 -0.49* 0.06 -0.47* 0.48*** 1
Note: *** p<0.01, ** p<0.05, * p<0.1
68

69
Multivariate Regression Models
There are three types of multivariate regression analysis models presented in Table 21: 1)
separate models for district enrollment (using the categorical variable district size), urbanicity
and region, without variables controlling for demographics, educational success, teacher salary,
or district growth; 2) models with both district enrollment (district size) and region, with and
without control variables; and 3) models with both region and urbanicity, with and without
control variables. Results for nine regression models in total are presented.
Results of Multivariate Regression
The descriptive data suggests the main drivers of teacher supply are district enrollment (using the
categorical variable)28, urbanicity, and region. In Table 21, I examine separately simple models
for each (models 1-3). The first three individual models confirm the descriptive results.29 Model
1 examines the association between teacher supply and district enrollment (by size) and shows
that large districts receive roughly 6 more applications than small districts and 5 more
applications than midsize districts. Model 2 looks at the relationship between teacher supply and
urbanicity. Results indicate that suburban districts are more advantaged, receiving about 6 more
applications than rural districts, 2 more applications than city districts, and 4 more applications
28 Multivariate regressions using enrollment as a continuous (linear) variable are included in
Appendix A. The categorical variable for enrollment was used because enrollment is not
believed to be linear. 29 The descriptive supply (and need) ratios are based on weighted averages for each group while
the simple regressions are based on unweighted averages (treat districts in an unweighted way).
Therefore, the descriptive ratios and simple regression coefficients show slightly different
relationships. See Appendix D for an example of the descriptive and regression supply
comparisons.

70
Table 21: Predictors of Supply
Notes: Robust standard errors in parentheses; *** p<0.01, ** p<0.05, * p<0.1; Constant: Small districts, NW = Region 1, Rural. Mean
unit of supply = 5.12 (equivalent to 5 applicants per vacancy).
(1) (2) (3) (4) (5) (6) (7) (8) (9)
VARIABLES
Enrollment
(Categorical) Urbanicity Region
Enrollment
& Region
(no
controls)
Enrollment
& Region
(w/demo
controls)
Enrollment
& Region
(w/all
controls)
Region &
Urbanicity
(no
controls)
Region &
Urbanicity
(w/demo
controls)
Region &
Urbanicity
(w/all
controls)
Midsize districts (1,500-3,500) 0.900 0.921 -0.294 -0.367
(1.119) (1.056) (1.043) (1.263)
Large districts (> 3,500) 5.674** 6.574*** 5.505*** 4.631*
(2.319) (2.366) (2.054) (2.368)
City (urbanicity 1) 3.284 5.122* 6.969** 8.188**
(2.218) (2.640) (2.973) (3.534)
Suburb (urbanicity 2) 5.798** 6.342** 5.572** 5.736**
(2.711) (2.804) (2.767) (2.881)
Town (urbanicity 3) 1.347 1.825* 2.269* 2.026
(1.078) (1.082) (1.274) (1.351)
NE (Region 2) -2.447* -1.946 -1.435 -0.843 -1.634 -1.250 -0.672
(1.416) (1.327) (1.262) (1.297) (1.333) (1.275) (1.273)
Central (Region 3) -4.577*** -5.863*** -6.313*** -5.388*** -6.144*** -6.131*** -4.780***
(1.191) (1.261) (1.448) (1.610) (1.789) (1.780) (1.726)
SW (Region 4) -4.018*** -3.440*** -2.905** -2.179* -2.904** -1.892 -1.321
(1.260) (1.195) (1.162) (1.259) (1.140) (1.202) (1.291)
SE (Region 5) -5.884*** -5.086*** -4.408*** -3.738*** -5.120*** -3.329*** -2.755**
(1.206) (1.091) (1.065) (1.023) (1.124) (1.239) (1.211)
District %FRL -10.99*** -7.440 -6.474 -3.234
(4.200) (6.765) (4.604) (6.364)
District %White -1.866 -1.994 2.810 0.967
(1.655) (2.519) (2.493) (2.667)
Educational Success 1.226 1.928*
0.166 0.102
Teacher Salary BA, 0-yrs (in $1,000s) (0.202) (0.201)
0.166 0.102
District Growth (0.202) (0.201)
(0.203) (0.179)
Constant 4.277*** 3.999*** 7.916*** 6.908*** 15.65*** 7.203 6.240*** 7.881 3.088
(0.393) (0.346) (0.986) (0.803) (4.021) (8.750) (0.809) (4.966) (8.672)
Observations 183 178 183 183 182 165 178 177 165
R-squared 0.089 0.069 0.116 0.222 0.271 0.295 0.202 0.258 0.328
70

71
than town districts.30 Model 3 focuses on teacher supply and region and reveals that districts in
all regions receive fewer applications than districts in the Northwest. In fact, districts in the
Southeast receive the fewest applications with 6 fewer than districts in the Northwest, 2 fewer
than those in the Southwest and Central regions, and 3 fewer applications than districts in the
Northeast.31 Standing alone, the individual models confirm what I find in the descriptive
relationships.
As a reminder, enrollment and urbanicity are highly correlated and as both are measures
of district size, I do not include them in models together. The remaining six models combine
region with each measure of district size; models 4-6 include enrollment and region, models 7-9
include region and urbanicity. When either measure of district size (enrollment or urbanicity)
and region are included in models together, it appears the influence of district size persists. In
models 4 and 7, while the coefficients change slightly the relationships do not. In model 4, large
districts continue to have a supply advantage. In model 7, suburbs have the best advantage
followed by city and town districts. In both models, the supply disadvantage in the Northeast no
longer matters, dependent on district size.
Models where measures of district size (enrollment or urbanicity) are combined with
region are preferred. It appears that region and district size matter separately and when
combined in models together the results change somewhat but the relationships are not
undermined. Adding region and measures of district size in models together adds more
variation, provides better estimates, and increases predictive power of the models.
30 There are 20 districts identified as suburban statewide, only 10 of those are included in the
analyses. 31 The variation in teacher supply by region is presented in Appendix E.

72
In models 5 and 8, I examine the extent to which including student characteristics such as
race and poverty in the combined models influence the estimates. In these models, again the
coefficients change somewhat but the relationships do not. However, I find that poverty matters
more when using enrollment rather than urbanicity, and the supply disadvantage in the
Southwest no longer matters in the model using urbanicity. While I find the coefficient on
poverty is in the predicted direction in both models, it is not consistently significant. Race does
not appear to matter in either model. It may be that controlling for region also controls for race
as the racial compositions of regions differs a lot (see Table 9).
Finally, in models 6 and 9, I examine whether including educational success, teacher
salary,32 and district growth33 affect the estimates. Adding these new indicators marginally
improves the overall predictive power of the model and reduces the magnitude of many of the
coefficients as more variation is accounted for by the new indicators. These models hint at a
relationship between district educational success and supply as both models are nominally
positive but only one is significant. Poverty points in the expected direction but is no longer
significant. Again, race does not matter in either model.
The results of the regressions support the theme that region and district size matter,
regardless of how district size is operationalized. I consistently see the following relationships
influencing teacher supply:
large districts have a supply advantage relative to small and midsize districts;
32 Analyses using a categorical variable of teacher salary are included in Appendix F. Teacher
salary remains insignificant whether using the continuous or categorical variable. 33 Analyses using the natural log of district growth are included in Appendix G. District growth
remains insignificant whether using percentage or log percentage.

73
suburban and city districts have a supply advantage relative to rural and town
districts; and
districts in the Northwest and Northeast have greater supply than districts in the other
regions.
Other indicators included in the models mostly move in the predicted direction but some do not,
perhaps because they are sharing the same variation. The key drivers of teacher supply continue
to be district size and region.
Research Question 2. Does supply differ by school level or subject?
How does supply vary by subject and grade level? The literature indicates that teacher supply
will vary by school level and subject (Behrstock-Sherratt, 2016; Cowan et al., 2016; Cross, 2016;
Dee & Goldhaber, 2017; Ingersoll, 2001; 2003; Malatras et al., 2017; Murnane & Steele, 2007;
Murphy et al., 2003). Therefore, I examine teacher supply by elementary, middle, and high
school levels defined by the grades used in the online survey. Teacher supply for elementary
includes all applications and vacancies for kindergarten through grade 4, middle school includes
those for grades 5 through 8, and high school includes grades 9 through 12. Per the literature, I
expect to find greater teacher supply at the elementary level and more evidence of shortages at
the secondary level.
In addition to school level, I look at teacher supply by subject, in particular, math and
science compared to language arts (and social studies).34 On the survey, questions about
vacancies and applicants were asked about general subject areas rather than specific class types.
34 I assumed positions available at the middle school level would be advertised as both ‘math and
science’ or ‘language arts and social studies’ together. At the high school level, I assumed math,
science, language arts, and social studies positions would be advertised separately.

74
The subjects in the survey presented here included middle school math and science35; high
school math and science; middle school English/language arts and social studies; and high school
English/language arts. I expect to find greater teacher supply in language arts than in math and
science.
Contrary to expectations, I find greater teacher supply associated with the middle school
level (Table 22 and Figure 14). In fact, in Table 22, I find elementary and high school have the
same teacher supply while there appears to be 2 more applications per vacancy at the middle
school level.
Table 22: Teacher Supply by School Level (Raw Differences)
35 Grade 5 may or may not be included in the middle level subjects’ responses. On the survey,
questions related to grade 5 positions were asked as if those would have had a self-contained
core classroom teacher. Math and science does not include computer science or career technical
education (CTE) courses.
School Level
N of
responses
Total
Vacancies
Total
Applicants
Teacher
Supply
ratio
Elementary 156 1,406 6,149 4.4
Middle School 137 884 5,827 6.6
High School 163 1,226 5,367 4.4

75
Figure 14: Average Teacher Supply by School Level (Raw Differences)
Multivariate analyses included in Appendix H, examine the predictors of teacher supply
by school level as well. I find similar results to those in the overall analysis of teacher supply
presented above. In particular, there is a consistent teacher supply advantage for larger districts,
particularly at the middle level (Appendix Tables H1-H3). The teacher supply advantage for
suburban districts persists at the middle and high school levels, but not at the elementary level.
Again it appears that districts in the Central, Southwest, and Southeast regions are at a consistent
disadvantage, with a greater disadvantage at the middle level. For example, large districts have
almost 8 more middle level applications per position relative to small districts, suburban districts
have 9 more middle level applications per vacancy relative to rural districts, and districts in the
Southeast have 7 fewer middle level applications relative to those in the Northwest.
Turning to the relationship between subject area and teacher supply, as expected, I find
greater teacher supply associated with English/language arts than with math and science,
particularly at the middle school level (Table 23 and Figure 15). Table 23 shows the middle
9 6 8
39 43
33
4.4
6.6
4.4
-
2.0
4.0
6.0
8.0
10.0
12.0
0
10
20
30
40
50
60
70
Elementary Middle School High School
Sup
ply
Rat
io
Dis
tric
t A
ver
ge
Average Teacher Supply by School Level
Average District Vacancies Average District Applicants Teacher Supply Ratio

76
school level has a teacher supply advantage over the high school level in these subjects. In fact, I
find middle school English/language arts (and social studies) has the largest teacher supply at
10.1 while high school math and science has the lowest teacher supply at 2.8. In other words, for
every middle school English/language arts and social studies position there are an average of 10
applications while there are fewer than 3 applications per high school math and science vacancy.
Table 23: Teacher Supply by Subject Area (Raw Differences)
Figure 15: Average Teacher Supply by Subject Area (Raw Differences)
Subject
N of
responses
Total
Vacancies
Total
Applicants
Teacher
Supply
ratio
MS Math &
Science 61 174 992 5.7
HS Math &
Science 82 270 751 2.8
MS ELA & SS 52 138 1,391 10.1
HS ELA 57 124 841 6.8
3 3 3 2
16
9
27
15
5.7
2.8
10.1
6.8
-
2.0
4.0
6.0
8.0
10.0
12.0
0
10
20
30
40
50
60
70
MS Math &
Science
HS Math &
Science
MS ELA & SS HS ELA
Sup
ply
Rat
io
Dis
tric
t A
ver
age
Average Teacher Supply by Subject Area
Average District Vacancies Average District Applicants Teacher Supply ratio

77
The multivariate analyses included in Appendix H, further examine the predictors of
teacher supply by subject area. As with the examination of teacher supply by school level, I find
a teacher supply advantage for large districts, however, this advantage is not significant in
middle school math and science (Appendix Tables H4-H7). Suburban districts appear to have
greater teacher supply, but it is not significant in middle school math and science. Middle school
subjects appear to have a greater teacher supply disadvantage than high school subjects in all
regions, relative to the Northwest. In particular, districts in the Northeast, Southwest, and
Southeast see a larger significant teacher supply disadvantage for middle school math and
science. The supply disadvantage for districts in the Central, Southwest, and Southeast regions
for English/language arts and social studies is much larger at the middle school level. The
teacher supply disadvantage in the Southeast is the greatest and persists across subjects and
levels. For example, relative to small districts, large districts have almost 13 more applications
per position in the area of middle school English/language arts and social studies. Similarly,
suburban districts have 12 more applications per vacancy relative to rural districts, and districts
in the Southeast have 15 fewer applications relative to those in the Northwest for these positions
(Appendix Table H6).
In sum, these results indicate that teacher supply is most favorable at the middle school
level, which is not what was expected based on the literature. Teacher supply is also positively
associated with English/language arts (and social studies), as expected. The supply advantages
appear to be greater for large districts while the supply disadvantages seem to vary somewhat
depending on subject and region.

78
Supply Summary
I find that district size, urbanicity, and region have the most influence on teacher supply across
Arkansas. In particular, districts that have the most favorable teaching supply are larger districts
with enrollments greater than 3,500. Districts in the Northwest appear to have a significant
advantage in attracting teachers, as do urban and suburban districts. Districts that face a greater
challenge in attracting teaching supply are those in the Central, Southwest, and Southeast regions
and those in rural areas. Examining teacher supply by school level and subject area, I find the
middle school level and English/language arts have a significant advantage in attracting teachers.
Teacher Need
Research Question 3. What are the characteristics of districts that have the greatest need
for teachers?
Descriptive Analysis
Which district factors drive need? The teacher shortage literature suggests that the districts
with the highest turnover are those that are large and urban, small and rural, and those with a
higher percentage of poverty and higher percentage of minority students (Aragon, 2016; Dee &
Goldhaber, 2017; Ingersoll, 2001; 2003; Murnane & Steele, 2007; Murphy et al., 2003). As
teacher need is related to turnover, I examine the relationships between teacher need and district
enrollment (size), urbanicity, and state regions. Again using the 2017 district survey, I define
“need” as the ratio of vacancies over full time equivalent classroom teacher positions. FTE
includes the number of K-12 certified personnel employed by the district as K-12 classroom
teachers, librarians, counselors, psychologists, and other K-12 certified, non-administrative

79
employees paid from the Teacher Salary Fund (ADE, 2017c). Certified employees paid from
federal funds are not included.36 Essentially, my “need” represents what fraction of the teacher
workforce the district needs to replace each year.
As with teacher supply, I examine district size and urbanicity separately and do not place
them in a model together due to their strong correlations with each other and certain regions in
the state. Region is modeled separately as districts in different regions likely face different levels
of teacher need based on their ability to attract and retain teachers. Additionally, I look at the
extent to which teacher need is related to district poverty rate, racial/ethnic diversity, educational
success, beginning teacher salaries, and district growth, which may also influence teacher need.
Correlations for these district characteristics are presented in Table 34. As previously, I first
examine bivariate relationships between teacher need and these factors, any of which might be
confounded by other factors, and then follow up using regression analyses to determine which
consistent independent relationships remain.
How is teacher need related to district size (enrollment)?37 One would expect that
larger districts would provide more opportunities for teachers. With more opportunity, there is
likely more teacher movement and turnover resulting in a greater need for teachers. However, it
is also possible that small districts would have greater teacher need as they may have more
difficulty in attracting applicants and keeping positions filled. Once again, I present district
enrollment first by decile and then as a categorical variable.
36 The mean unit of need is approximately 0.09 vacancies per 1 FTE classroom position, or 9
vacancies per 100 classroom positions. 37 Regression models using enrollment as a continuous variable for need are included in
Appendices A and I.

80
Using district enrollment by decile in Table 24, I find the greatest teacher need is found
in the smallest districts, with districts in decile 1 having the most need (0.18). Interestingly, I
find districts in deciles 2 and 3 have about the same rate of teacher need as the largest districts in
decile 10 (0.10-0.11). The least teacher need is found in districts with enrollments of between
2,200-3,700 students in decile 9 (0.05). Note that the mean unit of teacher need statewide is
approximately 9 vacancies for every 100 full time classroom teacher positions. This means that
the smallest districts with enrollments of less than 375 students have 18 vacancies for every 100
FTE positions, or realistically for these small districts, roughly 2 vacancies for every 10
positions. In addition, districts with enrollments between 375-600 and districts with enrollments
greater than 3,700 all have 10-11 vacancies per 100 available full time teaching positions.
Figure 16 shows the relationship between the average numbers of district vacancies to full time
classroom teacher positions in each decile.
In addition to examining district size by enrollment decile, I also use the categorical
variable for district size in Table 25 and find somewhat similar results. I find that large districts
with student enrollment greater than 3,500 have the greatest teacher need (0.10). However, when
categorizing small districts as those with student enrollments less than 1,500, I find small
districts have similar teacher need (0.08) to that of midsize districts (0.07). In other words, in a
large school district there are an average of 10 vacancies for every 100 full time classroom
positions, while there are approximately 8 vacancies per 100 posts in small and midsize districts.
Figure 17 illustrates the relationship between average district vacancies and full time classroom
positions for each type of district. While initial analysis indicates a relationship between teacher
need and district size, it should be noted that large districts are concentrated in more urban areas,
and those areas are found in certain regions of the state. Although using the “small” category for
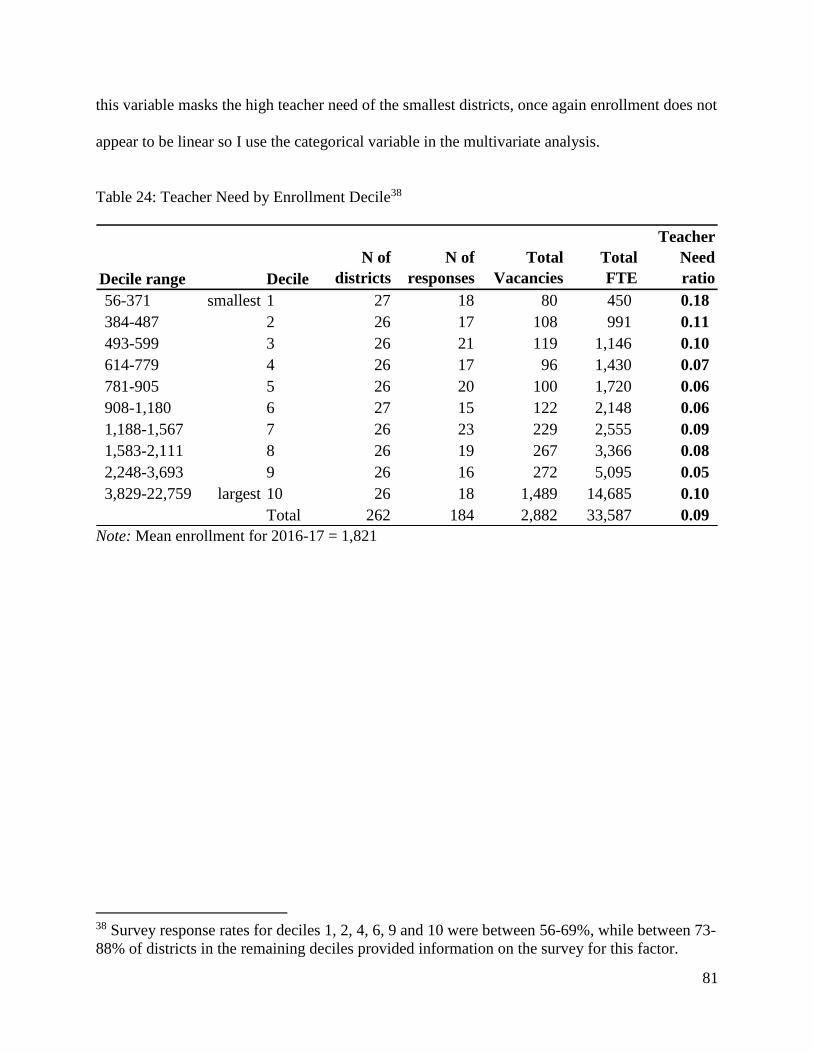
81
this variable masks the high teacher need of the smallest districts, once again enrollment does not
appear to be linear so I use the categorical variable in the multivariate analysis.
Table 24: Teacher Need by Enrollment Decile38
Note: Mean enrollment for 2016-17 = 1,821
38 Survey response rates for deciles 1, 2, 4, 6, 9 and 10 were between 56-69%, while between 73-
88% of districts in the remaining deciles provided information on the survey for this factor.
Decile range Decile
N of
districts
N of
responses
Total
Vacancies
Total
FTE
Teacher
Need
ratio
56-371 smallest 1 27 18 80 450 0.18
384-487 2 26 17 108 991 0.11
493-599 3 26 21 119 1,146 0.10
614-779 4 26 17 96 1,430 0.07
781-905 5 26 20 100 1,720 0.06
908-1,180 6 27 15 122 2,148 0.06
1,188-1,567 7 26 23 229 2,555 0.09
1,583-2,111 8 26 19 267 3,366 0.08
2,248-3,693 9 26 16 272 5,095 0.05
3,829-22,759 largest 10 26 18 1,489 14,685 0.10
Total 262 184 2,882 33,587 0.09
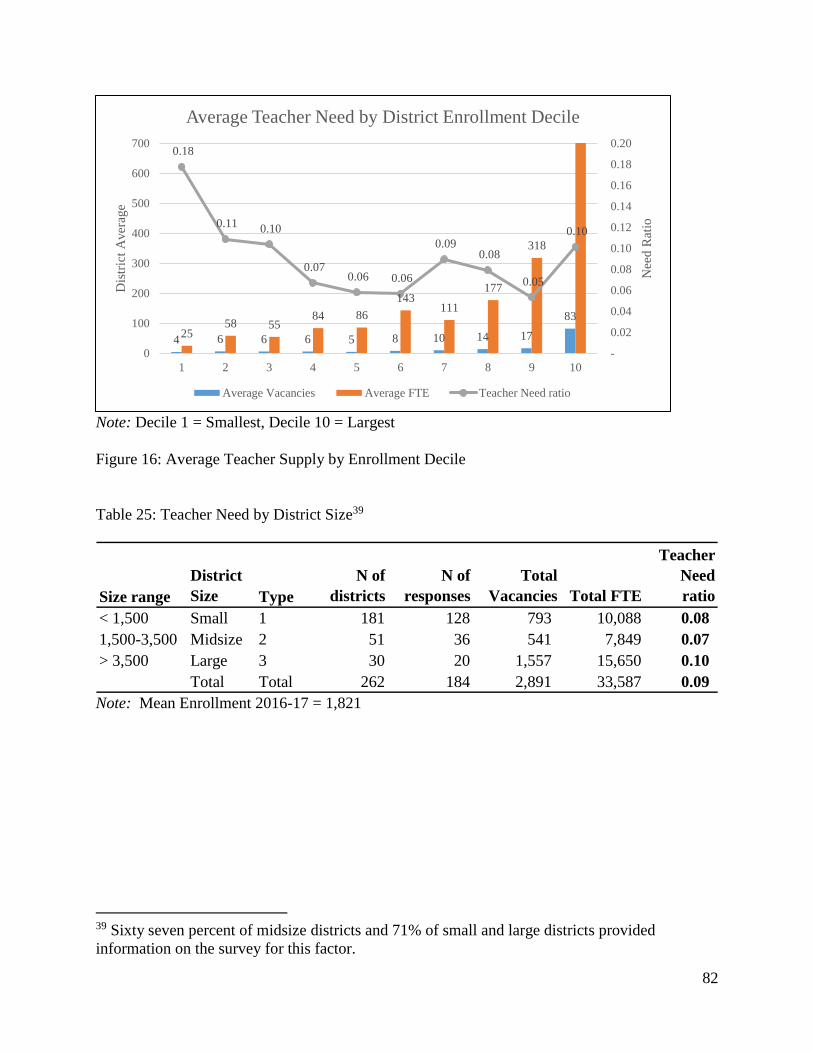
82
Note: Decile 1 = Smallest, Decile 10 = Largest
Figure 16: Average Teacher Supply by Enrollment Decile
Table 25: Teacher Need by District Size39
Note: Mean Enrollment 2016-17 = 1,821
39 Sixty seven percent of midsize districts and 71% of small and large districts provided
information on the survey for this factor.
4 6 6 6 5 8 10 14 17
83
2558 55
84 86
143111
177
318
0.18
0.11 0.10
0.07 0.06 0.06
0.09 0.08
0.05
0.10
-
0.02
0.04
0.06
0.08
0.10
0.12
0.14
0.16
0.18
0.20
0
100
200
300
400
500
600
700
1 2 3 4 5 6 7 8 9 10
Nee
d R
atio
Dis
tric
t A
ver
age
Average Teacher Need by District Enrollment Decile
Average Vacancies Average FTE Teacher Need ratio
Size range
District
Size Type
N of
districts
N of
responses
Total
Vacancies Total FTE
Teacher
Need
ratio
< 1,500 Small 1 181 128 793 10,088 0.08
1,500-3,500 Midsize 2 51 36 541 7,849 0.07
> 3,500 Large 3 30 20 1,557 15,650 0.10
Total Total 262 184 2,891 33,587 0.09

83
Note: Small district is <1,500, Midsize is 1,500-3,500, Large is >3,500
Figure 17: Average Teacher Need by District Size
How is teacher need related to urbanicity? The literature indicates teacher turnover is
higher in urban districts, which will contribute to the number of vacancies in those districts
(Aragon, 2016; Dee & Goldhaber, 2017; Ingersoll, 2001; 2002; 2003; Malatras et al., 2017;
Murphy et al., 2003). Similarly, rural districts also have difficulty attracting and retaining
teachers (Aragon, 2016; Dee & Goldhaber, 2017; Malatras et al., 2017; Murphy et al., 2003;
Will, 2016). As urbanicity designations are connected to population size, it is another way to
consider and measure district size.
In Table 26, I find that city districts have the greatest need for teachers (0.10), almost
double that of suburban districts (0.06). Districts in suburbs (0.06), towns (0.07), and rural areas
(0.07) have similar rates of teacher need. That is to say, there are 10 vacancies for every 100
teachers in city school districts, but fewer than 7 vacancies per 100 positions in suburban, town,
and rural districts. Figure 18 illustrates the relationship between average district vacancies and
6 15 78 79
218
782
0.08 0.07
0.10
-
0.02
0.04
0.06
0.08
0.10
0.12
0.14
0.16
-
100
200
300
400
500
600
700
800
Small Midsize Large
Nee
d R
atio
Dis
tric
t A
ver
age
Average Teacher Need by District Size
Average District Vacancies Average District FTE Teacher Need ratio

84
full time classroom positions by urbanicity. While this initial analysis indicates a relationship
between urbanicity and teacher need, it may also be influenced by the fact that the majority of
urban districts are located in the Central region (68%).
Table 26: Teacher Need by Urbanicity40
Note: The most recent NCES district urbanicity information from 2014-15 identifies 290 districts
in the state including charter schools (NCES 2017a). There were 262 districts in the state in the
2016-17 school year.
40 More than 64% of city and rural districts, and more than 50% of suburban and town districts
provided information on the survey for this factor.
NCES
Urban-Locale
Designation Type
N of
districts
N of
responses
Total
Vacancies Total FTE
Teacher
Need ratio
City 1 36 23 985 10,085 0.10
Suburb 2 20 10 287 4,928 0.06
Town 3 75 42 675 9,010 0.07
Rural 4 159 104 632 9,518 0.07
Total 290 179 2,579 33,540 0.08

85
Figure 18: Average Teacher Need by Urbanicity
How is teacher need related to district growth? One would expect that growing
districts would have more vacancies as new schools open, meanwhile, districts with decreasing
student enrollments would require fewer teachers, relative to the entire faculty (Lindsay et al.,
2016; Murnane & Steele, 2007; Murphy et al., 2003). Using the same district growth measure
used previously, contrary to expectation, in Table 27 I find the rate of teacher need does not
differ greatly between quintiles. Districts with the most positive growth and districts with the
most negative growth have almost the same rate of teacher need (0.08 - 0.09). This lack of
variation suggests that district growth may not greatly contribute to teacher need. However,
particular regions of the state have seen considerable district growth while other regions have not
or have seen declines in enrollment. Figure 19 illustrates the relationship between average
district vacancies and full time classroom positions by district growth.
43 29 16 6
438
493
215
92
0.10
0.06
0.07 0.07
-
0.02
0.04
0.06
0.08
0.10
0.12
0.14
0.16
0
100
200
300
400
500
600
700
800
City Suburb Town Rural
Nee
d R
atio
Dis
tric
t A
ver
age
Average Teacher Need by Urbanicity
Average District Vacancies Average District FTE Teacher Need ratio

86
Table 27: Teacher Need by District Growth (5-year) Quintile41
Notes: Mean District Growth 2012-13 to 2016-1717 = 0.69%. Average growth over five years
relative to the first year, 2012-13.
Notes: Quintile 1 = Least growth, Quintile 5 = Most growth
Figure 19: Average Teacher Need by District Growth (5-year) Quintile
How does teacher need vary by region? Regions in the state vary in the amenities and
opportunities they offer to prospective teachers. Certain regions, such as the Delta in Eastern
Arkansas, may have greater difficulty than others in attracting teacher candidates. In Table 28,
41 More than 60% of districts in quintiles 2 and 4, and at least 70% of districts in the remaining
quintiles provided information on the survey for this factor.
Quintile range Quintile
N of
districts
N of
responses
Total
Vacancies Total FTE
Teacher
Need
ratio
(-7.3) - (-1.84) most - 1 50 39 420 4,853 0.09
(-1.81) - (-0.63) 2 50 33 495 6,500 0.08
(-0.61) - 0.302 3 50 40 568 6,726 0.08
0.309 - 1.48 4 50 30 351 6,504 0.05
1.49 - 79.8 most + 5 50 35 737 8,883 0.08
Total 250 177 2,571 33,466 0.08
11 15 14 12 21124
197168
217254
0.09
0.08 0.08
0.05
0.08
-
0.02
0.04
0.06
0.08
0.10
0.12
0.14
0.16
0
100
200
300
400
500
600
700
800
1 2 3 4 5
Nee
d R
atio
Dis
tric
t A
ver
age
Average Teacher Need by District Growth Quintile
Average District Vacancies Average District FTE Teacher Need ratio

87
as anticipated, I find support for the relationship between region and teacher need. Districts in
the Central (0.11) and Southeast (0.14) regions have the greatest teacher need. The Northwest
(0.07), Northeast (0.08), and Southwest (0.06) have similar teacher need but far less than the
Central and Southeast. In other words, there are 11-14 vacancies per 100 teachers in districts in
the Central and Southeast, while there are fewer than 8 vacancies per 100 teachers in districts in
the Northwest, Northeast, and Southwest. This pattern suggests that districts in the Central and
the Southeast face greater challenges with teacher turnover than do other districts across the
state. However, the Central region is the most urban part of the state and the Southeast is one of
the most rural. Figure 20 illustrates the relationship between average district vacancies and FTE
classroom teachers by region.
Table 28: Teacher Need by Region42
42 More than 70% of districts in the Northwest and Northeast, more than 61% of districts in the
Central and Southwest, and 96% of districts in the Southeast provided information on the survey
for this factor.
Region Type
N of
districts
N of
responses
Total
Vacancies Total FTE
Teacher
Need ratio
NW 1 79 55 796 11,773 0.07
NE 2 67 48 519 6,842 0.08
Central 3 54 33 1,080 9,503 0.11
SW 4 38 25 212 3,502 0.06
SE 5 24 23 284 1,967 0.14
Total 262 184 2,891 33,587 0.09

88
Figure 20: Average Teacher Need by Region
How is teacher need related to district poverty rate? As mentioned previously, the
literature indicates that highly disadvantaged schools and districts (i.e. more poor, more
minorities) have greater difficulty attracting and retaining teachers, have the highest rates of
turnover, and thus the most teacher vacancies (Aragon, 2016; Dee & Goldhaber, 2017; Ingersoll,
2001; 2003; Loeb & Reininger, 2004; Malatras et al., 2017; Murnane & Steele, 2007; Murphy et
al., 2003). In Table 29, as expected, I show that districts with the highest percentage of FRL
students, the most poor, have the greatest rates of teacher need (4th quintile with 0.14, 5th quintile
with 0.13) while the least poor districts have the lowest rates of teacher need (1st quintile with
0.05). This means that the poorest districts have 12-13 vacancies per 100 FTE positions while
the wealthiest districts have less than 5 vacancies per 100 FTE positions. High poverty is often
associated with very urban or very rural areas. Figure 21 illustrates the relationship between
average district vacancies and FTE teaching positions by poverty quintile.
14 11 33 8 12
214
143
288
14086
0.07 0.08
0.11
0.06
0.14
-
0.02
0.04
0.06
0.08
0.10
0.12
0.14
0.16
0
100
200
300
400
500
600
700
800
NW NE Central SW SE
Nee
d R
atio
Dis
tric
t A
ver
age
Average Teacher Need by Region
Average District Vacancies Average District FTE Teacher Need ratio

89
Table 29: Teacher Need by District Poverty Rate (FRL) Quintile43
Note: Mean %FRL 2016-17 = 65%. Poverty rate for Northwest Classical Academy not
reported.
Note: Quintile 1 = Least poor, Quintile 5 = Most poor
Figure 21: Average Teacher Need by District Poverty Rate (FRL) Quintile
How is teacher need related to district racial/ethnic diversity? As stated previously, it
is likely that districts with greater racial/ethnic diversity would have greater teacher need than
those with less racial/ethnic diversity (Aragon, 2016; Dee & Goldhaber, 2017; Loeb &
43 More than 64% of districts in quintiles 1 and 2, and at least 72% of districts in the remaining
quintiles provided information on the survey for this factor.
Quintile
range Quintile
N of
districts
N of
responses
Total
Vacancies Total FTE
Teacher
Need
ratio
0-0.54 least poor 1 56 36 542 10,647 0.05
0.55-0.64 2 52 35 521 6,595 0.08
0.64-0.71 3 51 37 652 7,086 0.09
0.72-0.76 4 53 38 781 5,893 0.13
0.77-1 most poor 5 49 37 388 3,330 0.12
Total 261 183 2,884 33,551 0.09
15 15 18 21 10
296
188 192155
90
0.05
0.08
0.09
0.13
0.12
-
0.02
0.04
0.06
0.08
0.10
0.12
0.14
0
100
200
300
400
500
600
700
800
1 2 3 4 5
Nee
d R
atio
Dis
tric
t A
ver
age
Average Teacher Need by District Poverty Rate (FRL)
Quintile
Average District Vacancies Average District FTE Teacher Need ratio

90
Reininger, 2004; Murnane & Steele, 2007; Murphy et al., 2003). However, remember that
Arkansas also has some very poor rural areas with mostly white students. Using quintiles of the
percent of white students in a district as a measure of diversity, in Table 30 I find that districts
with the lowest percentage of white students (quintile 1) have the highest teacher need (0.13).
Meanwhile, districts with the highest percentage of white students (quintiles 4 and 5) have far
less teacher need. In fact, the rate of teacher need for quintile 3 (0.06), quintile 4 (0.05) and
quintile 5 (0.06) is less than half the rate of quintile 1 (0.13). Poverty rates are often related to
racial/ethnic diversity and urbanicity. Figure 22 illustrates the relationship between average
district vacancies and classroom teaching positions by white quintile.
Table 30: Teacher Need by District Race/Ethnicity (White) Quintile44
Note: Mean %White 2016-17 = 70%.
44 More than 66% of districts in quintiles 2, 3, and 5, and more than 72% of districts in quintiles
1 and 4 provided information on the survey for this factor.
Quintile
range Quintile
N of
districts
N of
responses
Total
Vacancies Total FTE
Teacher
Need
ratio
0-0.44 least white 1 54 41 1,479 11,241 0.13
0.47-0.71 2 53 36 571 7,682 0.07
0.72-0.87 3 51 35 365 5,624 0.06
0.88-0.93 4 60 43 328 6,536 0.05
0.94-0.98 most white 5 44 29 148 2,503 0.06
Total 262 184 2,891 33,587 0.09

91
Note: Quintile 1 = Least White, Quintile 5 = Most White
Figure 22: Average Teacher Need by District Race/Ethnicity (White) Quintile
How is teacher need related to district educational success? Greater teacher turnover
has been associated with schools and districts with lower academic achievement (Aragon, 2016;
Hanushek et al., 2004; Loeb & Reininger, 2004). As such, one would expect that lower
achieving districts would have greater teacher need than higher achieving districts. Employing
the same district educational success indicator used earlier, in Table 31 I find some support for
this hypothesis. Districts with the lowest educational success (quintile 1 at 0.11) have the
highest rate of teacher need. However, the remaining four quintiles of educational success have
similar lower rates of teacher need (0.06-0.07). Educational success only appears to be a factor
related to teacher need for the lowest performing districts. For every 100 positions in the lowest
achieving districts, there are 11 vacancies. Figure 23 illustrates the relationship between average
district vacancies and full time teaching positions by educational success. While there appears to
be a relationship between educational success and teacher need, poverty and urbanicity are often
36 16 10 8 5
274
213
161 152
86
0.13
0.07 0.06
0.05 0.06
-
0.02
0.04
0.06
0.08
0.10
0.12
0.14
0.16
0
100
200
300
400
500
600
700
800
1 2 3 4 5
Nee
d R
atio
Dis
tric
t A
ver
age
Average Teacher Need by Race/Ethnicity (White) Quintile
Average District Vacancies Average District FTE Teacher Need ratio

92
related to educational success. Therefore, it is uncertain to what extent district educational
success is independently associated with teacher need from this initial analysis.
Table 31: Teacher Need by District Educational Success Indicator Quintile45
Notes: Mean for 2016-17 = 0.05 SD. Educational Success = (0.25) ACT Aspire Math + (0.25)
ACT Aspire Reading + (0.25) Grad rate + (0.25) Gr.11 ACT Math-Reading Composite. Total
number of districts reflects those with the data required to create an Educational Success
Indicator (composite). Districts missing graduation rate or assessments are not included.
Notes: Quintile 1 = Lowest, Quintile 5 = Highest
Figure 23: Average Teacher Need by District Educational Success Indicator Quintile
45 More than 65% of districts in quintiles 3 and 4, and at least 71% of districts in the remaining
quintiles provided information on the survey for this factor.
Quintile range Quintile
N of
districts
N of
responses
Total
Vacancies Total FTE
Teacher
Need
ratio
(-2.50) - (-0.47) lowest 1 49 35 779 6,861 0.11
(-0.45) - (-0.07) 2 49 36 393 5,628 0.07
(-0.06) - 0.25 3 48 31 463 6,745 0.07
0.25 - 0.54 4 49 34 310 5,611 0.06
0.54 - 3.50 highest 5 48 36 560 8,511 0.07
Total 243 172 2,505 33,356 0.08
22 11 15 9 16
196156
218165
236
0.11
0.07 0.07
0.06 0.07
-
0.02
0.04
0.06
0.08
0.10
0.12
0.14
0.16
0
100
200
300
400
500
600
700
800
1 2 3 4 5
Nee
d R
atio
Dis
tric
t A
ver
age
Average Teacher Need by Eductional Success Indicator
Quintile
Average District Vacancies Average District FTE Teacher Need ratio

93
How is teacher need related to salary offered to new teachers? The variation in
teacher salaries among districts may influence the ability of districts to retain and attract teachers
(Hanushek et al., 2004; Loeb & Reininger, 2004). Teachers may leave positions for better
paying jobs or districts, or they may stay if adequately compensated. Thus, I would hypothesize
that districts with lower beginning teacher salaries would have greater teacher need. However,
in Table 32, I do not find the expected relationship between teacher salary and teacher need, as
the rate of teacher need does not differ greatly by quintile (0.06 – 0.09). That is, the lowest
paying districts and highest paying districts have nearly the same rate of teacher need. As with
district growth, this lack of variation suggests that teacher salary may not be a factor that
contributes greatly to teacher need. However, it may also be that teacher pay is endogenous with
districts paying as much as they must to reach an acceptable rate of need. Figure 24 illustrates
the relationship between average district vacancies and FTE classroom positions by beginning
teacher salary.
Table 32: Teacher Need by District Average Teacher Salary (BA, 0-years) Quintile46
Notes: Mean Teacher Salary BA0yrs 1617 = $34,020. Salary not reported for Arkansas School
of the Blind, Arkansas School of the Deaf, Division of Youth Services Schools, Arkansas Virtual
Academy, and Quest Middle School of Pine Bluff.
46 More than 58% of districts in quintiles 3 and 5, and at least 67% of districts in the remaining
quintiles provided information on the survey for this factor.
Quintile range Quintile
N of
districts
N of
responses
Total
Vacancies Total FTE
Teacher
Need
ratio
$29,000 - 31,400 lowest 1 52 36 216 2,890 0.07
31,440 - 32,250 2 51 34 277 3,353 0.08
32,305 - 33,508 3 52 30 275 4,234 0.06
33,774 - 36,832 4 51 36 763 8,566 0.09
36,886 - 47,016 highest 5 51 30 1,191 14,481 0.08
Total 257 166 2,722 33,525 0.08

94
Note: Quintile 1 = Lowest salary, Quintile 5 = Highest salary
Figure 24: Average Teacher Need by District Average Teacher Salary (BA, 0-years) Quintile
To recap the descriptive relationships for teacher need thus far, I categorize districts into
those with the greatest teacher need (need ratio greater than 0.13), average teacher need (ratio
between 0.05 and 0.13), or least teacher need (ratio less than 0.05).47 In Table 33 below, I find
29% of districts in the sample represented in the greatest teacher need category. Relative to the
state, over-represented in the greatest need category are both small districts with student
enrollments of less than 1,500 and large districts with enrollments greater than 3,500, urban
districts, districts in the Northeast, Central, and Southeast regions, poorer districts, more racially
diverse districts, the lowest achieving districts, and districts with the most growth. In the least
teacher need category, I find 22% of districts in the sample represented. Relative to the state, it
Table 33: Summary of Teacher Need Indicators
47 Categories determined by percentile ranking with 0.05 at the 25th percentile and 0.13 at the
75th percentile.
6 8 9 21 4080 99141
238
4830.07
0.08
0.06
0.09 0.08
-
0.02
0.04
0.06
0.08
0.10
0.12
0.14
0.16
0
100
200
300
400
500
600
700
800
1 2 3 4 5
Nee
d R
atio
Dis
tric
t A
ver
age
Average Teacher Need by District Average Teacher Salary
(BA, 0-yrs) Quintile
Average District Vacancies Average District FTE Teacher Need ratio

95
Notes: Need categories determined by percentile ranking with 0.05 at the 25th percentile and
0.13 at the 75th percentile. Sample Total includes all districts with need ratios (with vacancy and
FTE information). Educational Success Indicator is in standard deviation units.
appears midsize districts with enrollments between 1,500-3,500, suburban districts, districts in
the Northwest and Southwest regions, wealthier districts, whiter districts, the highest achieving
districts, and districts with high growth are over-represented in the least need category.
Beginning teacher salary does not appear to be greatly associated with teacher need. In general,
districts serving more disadvantaged students, defined in various ways, faced the greatest need
Indicators
Greatest
Teacher Need
(> 0.13)
Average
Teacher
Need
Least
Teacher Need
(< 0.05)
Sample
Total State Total
N of Districts 54 91 41 186 262
% of Sample 29% 49% 22% 100%
Need Range 0.13 - 1.23 0.05 - 0.13 0 - 0.05 0 - 1.23
Mean Need 0.24 0.09 0.03 0.09
District Size
% Small (< 1,500) 69% 67% 23% 68% 68%
% Midsize (1,500 - 3,500) 19% 19% 27% 20% 20%
% Large (> 3,500) 13% 14% 9% 12% 11%
Urbanicity
% City 20% 9% 14% 12% 14%
% Suburb 6% 5% 20% 5% 8%
% Town 26% 22% 23% 24% 29%
% Rural 44% 64% 24% 58% 61%
Region
% NW 19% 26% 35% 28% 30%
% NE 30% 26% 22% 27% 26%
% Central 22% 23% 3% 18% 21%
% SW 9% 13% 35% 14% 15%
% SE 20% 11% 9% 12% 9%
Mean Enrollment 2,060 1,989 1,891 1,988 1,822
Mean % FRL 72% 65% 61% 66% 65%
Mean % White 53% 75% 80% 69% 70%
Mean Educational Success (sd) -0.29 0.13 0.25 0.05 0.05
Mean Beginning Teacher
Salary (BA, 0-yrs) $33,940 $34,017 $34,139 $34,022 $34,020
Mean % District Growth 2.15% -0.38% 1.86% 0.82% 0.69%

96
most likely due to teacher turnover. As many of these factors are related to each other I turn to
multivariate analysis to ascertain these relationships.
Multivariate Analysis
What is driving teacher need? Looking at the correlations between the factors believed to be
associated with teacher need in Table 34, I find that district growth and poverty level are
significantly positively correlated with need, while educational success and percent white are
significantly negatively correlated with need. District enrollment, new teacher starting salary,
district size, and urbanicity do not appear to be directly correlated with need but are significantly
correlated with the components of need (vacancies and FTE positions).48 Based on the
descriptive statistics and correlations presented, it is unclear which factors will predict teacher
need when all variables are considered simultaneously.
To disentangle these relationships, multivariate analysis is needed to determine the
drivers of teacher need. The same types of models used for supply will be used for need. As
with supply, enrollment and region will be included in the same models, and region and
urbanicity will be included in the same models, but enrollment and urbanicity will not be
included in models together due to multicollinearity.
48 Urbanicity is included in the correlation matrix due to its ordinal nature.

97
Table 34: Correlations: Variables Associated with Need
Note: *** p<0.01, ** p<0.05, * p<0.1
Need
Total
Vacancies
Total
Applicants Enrollment
District
Growth Achievement
Tsalary
Ba0Yrs FRL White District Size Urbanicity
Need 1
Total Vacancies 0.16** 1
Total FTE -0.07 0.68*** 1
Enrollment -0.06 0.73*** 0.99*** 1
District Growth 0.24*** 0.03 -0.03 0.01 1
Educational Success -0.27*** -0.03 0.07 0.11* 0.28*** 1
Tsalary Ba0Yrs -0.09 0.43*** 0.55*** 0.61*** 0.23*** 0.25*** 1
FRL 0.20*** -0.02 -0.16*** -0.19*** -0.23*** -0.66*** -0.44*** 1
White -0.39*** -0.29*** -0.19*** -0.18*** 0.01 0.62*** -0.19*** -0.39*** 1
District Size 0.02 0.63* 0.82* 0.83* 0.20* 0.14 0.57* -0.34* 0.32* 1
Urbanicity -0.07 -0.55* -0.68* -0.63* -0.03 0.11 -0.48* 0.07 -0.48* 0.48 1
Note: *** p<0.01, ** p<0.05, * p<0.1
97
98
Multivariate Regression Models
As with supply, the multivariate regression analysis models include three types: 1) separate
models for district enrollment (using the categorical variable district size), urbanicity, and region,
without variables controlling for demographics, educational success, teacher salary, or district
growth; 2) models with both district enrollment (district size) and region, with and without
control variables; and 3) models with both region and urbanicity, with and without control
variables. Results for the nine regression models are presented in Table 35.
Results of Multivariate Regression
Here I examine whether the drivers of teacher supply are also driving teacher need. The
descriptive data suggests the main drivers of teacher need are district enrollment (using the
categorical variable district size)49, urbanicity, and region. Additionally, it appears that poverty
and race also influence teacher need.
In Table 35, I examine separately simple models for each (models 1-3). The first three
individual models somewhat support the descriptive results.50 Model 1 indicates that this
measure of district size (using enrollment) is not associated with teacher need; there is no
significant difference in need between large, midsize, or small districts. Model 2 looks at the
association between teacher need and urbanicity. Results show that city districts have
49 Multivariate regressions using enrollment as a continuous (linear) variable are included in
Appendix I. 50 The descriptive need (and supply) ratios are based on weighted averages for each group while
the simple regressions are based on unweighted averages (treat districts in an unweighted way).
Therefore, the descriptive ratios and simple regression coefficients show slightly different
relationships.

99
Table 35: Predictors of Need
Notes: Robust standard errors in parentheses; *** p<0.01, ** p<0.05, * p<0.1; Constant: Small districts, NW = Region 1, Rural. Mean
unit of need = 0.09 (equivalent to ~1 vacancy per 10 classroom positions).
(1) (2) (3) (4) (5) (6) (7) (8) (9)
VARIABLES
Enrollment
(Categorical) Urbanicity Region
Enrollment
& Region
(no
controls)
Enrollment
& Region
(w/demo
controls)
Enrollment
& Region
(w/all
controls)
Region &
Urbanicity
(no
controls)
Region &
Urbanicity
(w/demo
controls)
Region &
Urbanicity
(w/all
controls)
Small districts (< 1,500) - - - -
Midsize districts (1,500-3,500) -0.013 -0.011 -0.007 0.002
(0.022) (0.019) (0.024) (0.018)
Large districts (> 3,500) -0.015 -0.049 -0.075* 0.014
(0.017) (0.035) (0.045) (0.028)
City (urbanicity 1) 0.093* 0.079* 0.041 -0.031
(0.051) (0.043) (0.049) (0.025)
Suburb (urbanicity 2) 0.021 0.017 0.031 0.028
(0.037) (0.034) (0.033) (0.031)
Town (urbanicity 3) 0.014 0.006 -0.004 -0.005
(0.013) (0.012) (0.016) (0.014)
Rural (urbanicity 4) - - - -
NW (Region 1) - - - - - - -
NE (Region 2) 0.014 0.012 0.004 0.010 0.023* 0.014 0.009
(0.011) (0.012) (0.012) (0.011) (0.013) (0.011) (0.011)
Central (Region 3) 0.114** 0.123** 0.082** 0.015 0.058** 0.055** 0.019
(0.048) (0.052) (0.035) (0.016) (0.028) (0.026) (0.014)
SW (Region 4) 0.009 0.004 -0.034 -0.011 0.020 -0.005 -0.015
(0.019) (0.020) (0.025) (0.018) (0.020) (0.019) (0.017)
SE (Region 5) 0.059*** 0.053*** -0.022 0.028 0.068*** 0.027 0.021
(0.018) (0.019) (0.037) (0.020) (0.019) (0.025) (0.021)
District %FRL 0.071 0.067 0.136* 0.077
(0.076) (0.069) (0.075) (0.055)
District %White -0.171** -0.066* -0.069 -0.092**
(0.076) (0.037) (0.055) (0.040)
Educational Success 0.001 0.005
(0.012) (0.012)
Teacher Salary BA, 0-yrs (in $1,000s) -0.0002 -0.0002
(0.002) (0.002)
District Growth 0.002 0.002
(0.002) (0.002)
Constant 0.125*** 0.099*** 0.088*** 0.096*** 0.194** 0.195** 0.075*** 0.051 0.188*
(0.014) (0.006) (0.008) (0.011) (0.096) (0.097) (0.011) (0.081) (0.100)
Observations 186 184 186 186 185 178 184 183 178
R-squared 0.002 0.072 0.095 0.107 0.227 0.167 0.119 0.184 0.185
99

100
significantly greater need than districts in rural, town, or suburban areas with 9 vacancies for
every 100 classroom positions in city districts. Remember that the mean unit of overall teacher
need is 9 vacancies for every 100 positions. Model 3 examines the relationship between teacher
need and region and reveals that districts in the Central and Southeast regions have greater need
relative to districts in the Northwest, Northeast, and Southwest. In fact, districts in the Central
region have 11 vacancies per 100 full time equivalent positions relative to districts in the
Northwest, Northeast, and Southwest, and 5 more vacancies than districts in the Southeast.
Standing alone, the models using urbanicity as the measure of district size and region confirm
what I find in the descriptive relationships.
Once again, as both enrollment and urbanicity are similar measures of district size, I do
not include them in models together. The remaining six models presented combine region with
each measure of district size; models 4-6 include enrollment and region, models 7-9 include
region and urbanicity. When either measure of district size (enrollment or urbanicity) and region
are included in models together, it appears the influence of region persists and district size
diminishes. In models 4 and 7, the coefficients and relationships are similar to those seen in the
simple models. In model 4, enrollment as a measure of district size does not seem to matter. In
model 7, city districts have greater need than rural, town, or suburban districts. In both models,
teacher need is greater in the Central and Southeast regions. However, need appears to matter
more in the Northeast when using urbanicity and region together. As with the simple models, it
appears that urbanicity is a stronger indicator of district size.
In models 5 and 8, I examine the extent to which including student characteristics such as
race and poverty in the combined models influence the estimates. In these models, I find that

101
including race and poverty diminishes the association between teacher need and region,
particularly in the Southeast. However, the relationship between district size and region appears
stronger in model 5, with less teacher need found in large districts. I find the coefficients on race
and poverty in the predicted direction in both models but not consistently significant. Race
appears to matter more when using enrollment while poverty appears to matter more when using
urbanicity. It may be that race displaces region as the racial compositions of regions differ a
great deal (see Table 9).
Finally, in models 6 and 9, I examine whether including educational success, teacher
salary, and district growth affect the estimates. Adding these new indicators reduces coefficients
further as more variation is shared. District size does not matter using either measure
(enrollment or urbanicity). Region only appears to matter in the model including enrollment,
where teacher need persists in the Southeast. It appears that race (and poverty) displaces need in
the Central region when these new indicators are added. Race is more strongly associated with
teacher need in both models. Poverty points in the right direction but is only significant in the
model including urbanicity and region.
The results of the regressions indicate that urbanicity and region matter, as do race and
poverty. I consistently see the following relationships influencing teacher need:
city districts have greater teacher need;
districts in the Central and Southeast have greater need than districts in other regions;
and
higher racial/ethnic diversity and higher poverty are associated with greater need.
102
Other indicators included in the models appear to add more predictive power and reduce the
magnitude and significance of the variables mentioned above. The key drivers of teacher need
are urbanicity and region.
Research Question 4. Does need differ by school level or subject?
How does need vary by subject and grade level?51 As with supply, I examine teacher need by
elementary (K-4), middle school (5-8), and high school (9-12) levels as designated in the online
survey. I expect to find greater teacher need at the high school level, as growing student
enrollments age into secondary grades and class sizes increase further at the high school level,
more teachers are needed (Behrstock-Sherratt, 2016; Cowan et al., 2016; Cross, 2016; Dee &
Goldhaber, 2017; Ingersoll, 2001; 2003; Murphy et al., 2003). I also look at teacher need by
subject - middle school math and science52; middle school English/language arts (and social
studies); high school math and science; and high school English/language arts. I expect to find
greater teacher need in math and science than in language arts, as individuals with these degrees
have more employment opportunities, which could increase turnover in these subjects
(Behrstock-Sherratt, 2016; Cowan et al., 2016; Cross, 2016; Dee & Goldhaber, 2017; Ingersoll,
2001; 2003; Malatras et al., 2017; Murnane & Steele, 2007; Murphy et al., 2003).
As expected, I find greater teacher need associated with the high school level (Table 36
and Figure 25). However, it appears that teacher need is similar at the elementary level. At the
51 FTE by grade and subject variables were created using de-identified teacher-level data that
included grade/class assignments. 52 Math and science does not include computer science or career technical education (CTE)
courses.

103
high school level, there are 15 vacancies for every 100 full time teaching positions, while there
are 13 vacancies for every 100 positions at the elementary level.
Table 36: Teacher Need by School Level (Raw Differences)
Figure 25: Average Teacher Need by School Level (Raw Differences)
Additional analyses included in Appendix J, examine the predictors of teacher need by
school level as well. Results are somewhat similar to those in the overall analysis of teacher
need presented above. There appears to be significantly less teacher need in large and midsize
districts relative to small districts at all school levels (Appendix Tables J1-J3). Unlike the
overall analysis, there appears to be significantly less need in suburban districts relative to rural
School Level
N of
responses
Total
Vacancies Total FTE
Teacher
Need ratio
Elementary 185 1,406 10,499 0.13
Middle School 185 884 9,064 0.10
High School 185 1,226 8,440 0.15
8 5 7
5749 46
0.13
0.10
0.15
-
0.02
0.04
0.06
0.08
0.10
0.12
0.14
0.16
0
10
20
30
40
50
60
70
Elementary Middle School High SchoolN
eed
Rat
io
Dis
tric
t A
ver
age
Average Teacher Need by School Level
Average District Vacancies Average District FTE Teacher Need Ratio

104
districts, particularly at the elementary and high school levels. Furthermore, teacher need does
not appear to be associated with region, poverty level, ethnic/racial diversity, district educational
success, beginning teacher salary, or district growth at any school level.
Turning to the relationship between subject area and teacher need, contrary to
expectations, I find similar rates of teacher need associated with math and science and
English/language arts (Table 37 and Figure 26). However, teacher need is greater at the high
school level for both math and science and English/language arts than at the middle school level.
I find there are 14 vacancies per 100 FTE positions for high school math and science, while there
are 8 vacancies per 100 math and science positions at the middle school level. Similarly, it
appears there are 12 vacancies per 100 classroom teaching positions for high school
English/language arts, while there are 6 vacancies per 100 positions in middle school
English/language arts (and social studies).
Table 37: Teacher Need by Subject Area (Raw Differences)
Subject
N of
responses
Total
Vacancies Total FTE
Teacher
Need ratio
MS Math &
Science 151 174 2,168 0.08
HS Math &
Science 150 270 1,889 0.14
MS ELA & SS 153 138 2,482 0.06
HS ELA 147 124 1,001 0.12

105
Figure 26: Average Teacher Need by Subject Area (Raw Differences)
Additional analyses included in Appendix J, further examine the predictors of teacher
need by subject area. Similar to the findings by school level, I find significantly less teacher
need in large and midsize districts relative to small districts, particularly for the high school
subjects (Appendix Tables J4-J7). Additionally, there is significantly less teacher need in
suburban districts relative to rural districts, with the least need in high school math and science.
Region is associated with significantly greater teacher need for math and science. It appears
there is greater teacher need for middle school math and science teachers in the Northeast and
Southeast regions, and greater need for high school math and science teachers in the Central
region. Teacher need also appears to be associated with poverty level and high school language
arts. Teacher need does not appear to be related to ethnic/racial diversity, district educational
success, beginning teacher salary, or district growth for these subjects at any school level.
In sum, these analyses indicate that teacher need is significantly associated with district
size at all school levels and subjects with the greatest need in small districts. Furthermore, there
1 2 1 1
14 1316
7
0.08
0.14
0.06
0.12
-
0.02
0.04
0.06
0.08
0.10
0.12
0.14
0.16
0
10
20
30
40
50
60
70
MS Math &
Science
HS Math &
Science
MS ELA & SS HS ELA
Nee
d R
atio
Dis
tric
t A
ver
age
Average Teacher Need by Subject Area
Average District Vacancies Average District FTE Teacher Need ratio

106
appears to be significantly less teacher need in suburban districts across school levels and
subjects. The relationship between teacher need and region varies by subject and level, with the
greatest need found in high school math and science and English/language arts in the Central
region.
Need Summary
Examining the district characteristics believed to contribute to teacher need, I find that urbanicity
and region have the most influence. In particular, districts that have the greatest teaching need
are city districts and districts in the Central and Southeast regions. Teacher need does not appear
to be as high in districts in the Northwest, Northeast, or Southwest; moreover, it is not greatly
associated with district educational success, teacher salary, or district growth. District size and
urbanicity become a factor when looking at teacher need by school level and subject. Here, I
find the greatest teacher need in small districts and the least teacher need in suburban districts at
all school levels. Teacher need by subject appears to vary by region but appears greatest for the
high school subjects.
Teacher Supply and Teacher Need
What is the relationship between teacher supply and teacher need? One would
assume there is a relationship between teacher supply and teacher need, however, theoretically
the relationship is not clear. What kind of relationship should we find? I would expect that
districts with the least need would have greater supply as these may be more desirable districts
with fewer vacancies and more applicants. It is also possible that districts with greater need
might also have greater supply as districts in desirable areas expand and attract more applicants.

107
On the other hand, districts with the least need may also have poor supply as these districts have
little turnover and few vacancies available, so prospective teachers may not apply to districts that
are “long shots”. I would also suspect that districts with greater need might have poor supply as
these districts may have difficulty in attracting applicants, or more turnover and vacancies.
There may be a push toward both high teacher need and less teacher need. I examine the
relationship between teacher supply and teacher need below.
Looking at the raw relationship between teacher need and teacher supply depicted in the
scatterplot in Figure 27, greater teacher need appears to be associated with poor teacher supply.
However, lower teacher need also appears to be distributed across the range of supply.
Examining the correlation between teacher supply and teacher need, I find them to be modestly
(but statistically significantly) negatively associated (r(178) = -0.18, p = 0.018).
Figure 27: Supply by Need53
53 The outliers for reported need (>1.0) include two charter school districts, Capitol City
Lighthouse Academy and Little Rock Preparatory Academy. The outliers for reported supply
(>30) include Bentonville and Jonesboro School Districts.
0.5
11
.5
repo
rte
d_
ne
ed
0 10 20 30 40reported_supply
Supply by Need

108
Examining the cross-tabulation of teacher supply by teacher need in Table 38, I find
districts with the greatest need also have the least favorable supply (34%) and districts with the
least need have some of the most favorable supply (40%). Chi-squared from one-way ANOVA
indicates that teacher supply and teacher need are not independent and observed differences are
significant. While there does not appear to be much of a relationship between supply and need
based on Figure 27, the chi-squared test indicates a relationship at the tails.
Table 38: Supply by Need
Note: ‘Least’ categories include the bottom quartile, ‘Average’ categories include middle two
quartiles, ‘Most/Greatest’ categories include top quartile.
Returning to the overall results of the multivariate regressions for teacher supply and
teacher need seen previously in Tables 21 and 35, there appears to be at least three very clear
relationships. First, I find both lower teacher supply and greater teacher need for the Central and
Southeast regions. Second, there is both more teacher supply and more teacher need in urban
districts. Third, greater district poverty appears to be associated with significantly less teacher
Need
Least
Favorable
Teacher
Supply
Average
Teacher
Supply
Most
Favorable
Teacher
Supply Total
Least Teacher
Need 9 18 17 44
20% 20% 40% 25%
Average
Teacher Need 20 47 22 89
45% 51% 52% 50%
Greatest
Teacher Need 15 27 3 45
34% 29% 7% 25%
Total 44 92 42 178
100% 100% 100% 100%
Pearson chi2(4) = 13.2005 Pr = 0.010
Note: 'Least' categories include the bottom quartile, 'Average' categories include middle
two quartiles, 'Most/Greatest' categories inlcude top quartile.
Supply

109
supply and more teacher need. In addition to these supply and need relationships, there are also
clear trends seen separately for each. With regard to supply, I find large districts and suburban
districts have significantly more teacher supply while there is less teacher supply in the Southeast
region. With regard to need, it appears greater district racial/ethnic diversity is associated with
greater teacher need.
110
Chapter 5: Conclusion
The purpose of this study was to test whether a uniform teacher shortage exists across the state of
Arkansas. The literature is muddled on whether a national teacher shortage exists depending on
the information used and how it is assessed. Additionally, I examine whether there is a surplus
of elementary and English/language arts teachers as indicated by the literature. I hypothesized
that rather than a global shortage, teacher shortages are more likely to occur in certain regions
and subjects. However, I expected to find more elementary teachers than middle or high school
teachers, and more English/language arts teachers than math and science teachers.
To address these issues, I examined the characteristics of districts with the most favorable
teaching supply and those with the greatest teaching need using descriptive and multivariate
analysis. To do so, I used data on the number of vacancies and applications for positions by
grade and subjects collected from surveys of districts along with administrative data. This is the
third study to use applicant information to assess teacher shortages and the first to identify
teacher supply and need in this way. In this study, “supply” is defined as the ratio of applications
to vacancies and “need” is defined as the ratio of vacancies to full-time equivalent certified
classroom teachers.
Discussion of Findings
With regard to teacher supply, I find district size, region, and urbanicity appear to drive supply.
There does not appear to be a uniform shortage of teachers statewide. Teacher supply is most
favorable for large districts with student enrollments greater than 3,500, districts in the
Northwest, and suburban and city districts. Examining teacher supply by school level and
subject, it appears that the middle school level, not the elementary level, has the greatest supply

111
of teachers. Moreover, English/language arts positions have a significant advantage attracting
teachers, as expected.
Regarding teacher need, I find that urbanicity and region contribute most to need.
Teacher need appears greatest for districts in cities, and districts in the Central and Southeast
regions. Teacher need does not appear to be significantly influenced by district educational
success, teacher salary, or district growth. When looking at teacher need by school level and
subject, district size becomes a factor with the greatest need found in small districts and the least
teacher need found in suburban districts. The greatest need for teachers is found at the high
school level in math and science.
One expects the relationship between supply and need to be complementary. The
findings suggest teacher supply is associated with district size, region, and urbanicity, while
teacher need is related to urbanicity and region. These district characteristics will influence the
relationship between supply and need. I find three clear relationships between teacher supply
and need. In the Central region, there is lower teacher supply and greater teacher need. In urban
districts, it appears there is both greater teacher supply and need. In higher poverty districts,
there seems to be significantly less teacher supply and more teacher need.
Policy Implications/Recommendations
To address issues of teacher shortage, supply and need must first be identified. The steps
taken to address the issues will vary based on what information is being used. The remedies may
either address overall supply, overall need, a combination of both, or look at localized supply and
need and how the issues related to particular types of districts might be addressed.

112
In Arkansas, the Department of Education has identified teacher supply as the number of
students enrolled in educator preparation programs and the number of first time licenses issued
(Pfeffer & Servedio, 2015). Arkansas’ response to a trend in decreasing enrollment in educator
preparation programs, even though program completers do not appear to be decreasing, has been
to continue to recruit and offer incentives such as bonuses and student loan forgiveness. The
strategy to address overall supply focuses on only one component of teacher supply. Overall
teacher supply includes education preparation programs enrollees, completers, and the reserve
pool of teachers who are licensed but not currently teaching. A comprehensive strategy would
also consider increasing the number of education program completers and ways to attract those
in the reserve pool back into teaching.
This way of identifying supply focuses more on the overall intended (future) supply, not
on the current supply districts experience with the number of applications they receive. Issues
related to district level teacher supply may be different and must also be considered. It is one
thing to have a large supply of teachers overall, it is another thing to get them to where they are
needed most. In this study, I identify the distribution of teacher supply and need at the district
level looking at the characteristics of districts in an effort to understand how the issue of teacher
shortages might differ in different types of districts. Findings indicate that there is an unequal
distribution with regard to the supply of teachers to districts statewide. To better understand how
teacher supply is distributed across districts, the state should consider collecting application
information.
In addition to supply, how need is identified will also influence the strategies
implemented to address it. The ADE uses the number of classes taught by long-term substitutes
or teachers out of their area of licensure in a year, and the number of teachers who retired in the
113
previous year or who have the potential to retire in the near future (Pfeffer & Servedio, 2015).
This method does not account for non-retirement attrition and turnover or changes in student
enrollment. Using the current year’s information of whether need is greater than supply,
shortage areas are predicted for the following year (Pfeffer & Servedio, 2015). Arkansas does
not currently implement strategies to address need directly. The state’s primary strategy to
address demand and shortages has been to increase supply.
A more comprehensive strategy would include looking at ways to promote adding
multiple licensure areas so that teachers would not need to be teaching out of their field,
identifying the amount of and reasons for non-retirement attrition and turnover, and
implementing strategies to increase retention. Based on Arkansas’ Every Student Succeeds Act
Plan, it appears the state is beginning to consider strategies related to increasing retention which
include providing advanced licensure levels to retain effective teachers and personalized
mentoring support related to the teacher evaluation system (ADE, 2017b; Howell, 2017). Other
retention strategies to consider include mentoring, induction, support, and/or residency models
for new teachers, and opportunities to increase prestige and advancement for more experienced
teachers through participation in mentoring and leadership teams.
While increasing compensation and workplace conditions are often suggested as means
of ameliorating shortages, these may not be options available to all districts and will take time to
change. Additionally, my analyses indicate that need does not vary based on average salary
levels. To better match the existing supply of teachers to where they are needed most additional
strategies may be needed. To make it easier for applicants to find district vacancies and districts
to find applicants, a statewide online application process could be used. This approach would
also allow for the collection of vacancy and application information at the district level.

114
Examining ways to purposefully place student teachers in districts and developing more district-
university partnerships where they are limited or may not exist would also facilitate getting
teachers to where they are needed. Starting the hiring process earlier, especially for high-needs
districts, could increase both the quantity and quality of candidates as well.
Teacher supply and need are unequally distributed across the state and there are multiple
factors that contribute to both. To continue to have persistent shortage areas identified by the
state suggests that either the ways in which shortages are identified and/or the means by which
they are being addressed may not be working. Rather than focus on overall supply and overall
need (indicated by identified shortage areas), Arkansas should consider looking at the issue at a
more localized level, address the factors related to both teacher supply and need, and examine
ways to better match prospective teachers to positions.
Further Research
This study has focused on the teacher quantity shortage in Arkansas. The logical next step is to
begin to examine the teacher quality shortage. Specifically, I am interested in looking at the
quality of education preparation program graduates at different public institutions across the
state, using college entrance exam scores and high school and college grade point averages as a
proxy. Furthermore, I would like to examine which districts are served by each institution to
better understand where gaps may exist and where initiatives might be targeted, using a measure
of distance to higher education institutions, additional information collected in the district
survey, and interviews conducted with education program placement coordinators. Other
information collected from the district surveys yet to be examined includes which districts use
incentives (and what kinds) to attract teachers and how superintendents’ perceive the quality of
teachers/applicants over the past five years. Additionally, it would be interesting to examine the

115
relationship between a district’s value added and teacher supply and to look at the relationships
between teacher supply and teacher retention. It may also be interesting to identify teacher
supply and need outliers and study them qualitatively. While this study sheds more light on the
issue of teacher shortages in Arkansas, there are many questions still to be answered. Hopefully,
this study further informs the discussion and policies related to addressing the issue.

116
References
Aldeman, C. (2018). Educator supply and demand reports: Lessons for states, Bellwether
Education Partners. Available at:
https://bellwethereducation.org/sites/default/files/Bellwether_Lessons%20from%20state
%20supply%20%26%20demand%20reports_final_18_0205_v2.pdf.
Angrist, J.D., & Pischke, J.S. (2009). Mostly harmless econometrics: An empiricist’s
companion, Princeton, NJ: Princeton University Press.
Aragon, S. (2016). Teacher Shortages: What we know, teacher shortage series, Education
Commission of the States.
Arkansas Association of Educational Administrators. (2017). Map of Arkansas by educational
region. Available at: https://arkansas.schoolspring.com/.
Arkansas Dept. of Education (ADE). (2017a). Arkansas educator preparation provider report.
Available at: https://adedata.arkansas.gov/eppr/docs/State/StatewideReportApril2017.pdf.
Arkansas Dept. of Education (ADE). (2017b). Every Student Succeeds Act Arkansas state plan.
Available at:
http://www.arkansased.gov/public/userfiles/ESEA/Arkansas_ESSA_Plan_Final_rv_Janu
ary_30_2018.pdf.
Arkansas Dept. of Education (ADE). (2017c). Teacher salary schedule analysis 2016-2017,
March 21. Available at:
http://www.arkansased.gov/public/userfiles/Fiscal_and_Admin_Services/Publication%20
and%20reports/Salary%20Reports/Teacher_Salary_Schedule_Analysis_20162017_revise
d_3_20_17.pdf.
Arkansas Dept. of Education (ADE). (2016a). Critical academic licensure shortage areas for the
2016-2017 school year, Memo dated March 31. Available at:
http://adecm.arkansas.gov/Attachments/LIC-16-037--16-
17_Shortage_Areas_for_ADE_website.pdf.
Arkansas Dept. of Education (ADE). (2016b). Teacher recruitment & retention, research report
prepared for the House Interim Committee on Education and the Senate Interim
Committee on Education, April 12. Available at:
http://www.arkleg.state.ar.us/assembly/2015/Meeting%20Attachments/410/I14363/Teach
er%20Recruitment%20and%20Retention.pdf.
Barnett, J.H. & Blankenship, V. (2005). Superintendents speak out: A survey of superintendents’
opinions regarding recent school reforms in Arkansas, Journal of Educational Research
& Policy Studies, 5(1), 48-65.

117
Barnum, M. (2018). In many large school districts, hundreds of teaching positions were unfilled
as school year began, Chalkbeat, January 9.
Behrstock-Sherratt, E. (2016). Creating coherence in the teacher shortage debate: What policy
leaders should know and do, Education Policy Center at American Institutes for
Research.
Belfield, C.R. (2005). The teacher labour market in the U.S.: Challenges and reforms,
Educational Review, 57(2), 175-191.
Berg-Jacobson, A. & Levin, J. (2015). Oklahoma study of educator supply and demand: Trends
and projections, American Institutes for Research. Available at:
http://sde.ok.gov/sde/sites/ok.gov.sde/files/documents/files/15-
3778_OK%20Study%20of%20Educator%20Supply%20and%20Demand%20Final%20R
eport%20Revised%2010_12_15.pdf
Boyd, D., Lankford, H., Loeb, S., & Wyckoff, J. (2005). The draw of home: How teachers’
preferences for proximity disadvantage urban schools, Journal of Policy Analysis and
Management, 24, 113–132.
Bruce, D.J., Fox, W.F., Douglas, B.M., Reynolds, M.O., & Yang, Z. (2009). Supply and demand
for teachers in Tennessee, Center for Business and Economic Research, University of
Tennessee. Available at:
https://thec.ppr.tn.gov/THECSIS/CBERTHECReports/PDFS/Teacher%20Supply-
Demand%2012-2009.pdf
Buddin, R.J., & Zamarro, G. (2009), “Teacher qualifications and student achievement in urban
elementary schools”, Journal of Urban Economics, 66(2), 103-115.
Bureau of Labor Statistics. (2018). Job openings and labor turnover – December 2017, U.S.
Department of Labor, News Release – USDL-18-0204, February 6.
Cannata, M. (2010). Understanding the teacher job search process: Espoused preferences and
preferences in use, Teachers College Record, 112(12), 2889-2934.
Chastain, R., Flores, M., Anderson, S., & Butts, R. (2017). The teacher shortage in Washington:
Current status and actions to address it, Office of Superintendent of Public Instruction.
Available at:
https://app.leg.wa.gov/CMD/Handler.ashx?MethodName=getdocumentcontent&docume
ntId=NRoW0T3q948&att=false
Connecticut State Department of Education. (2012). Data bulletin: Designation of teacher
shortage areas for the 2012-13 school year (Fall hiring report), Division of Assessment,
Research and Technology, Bureau of Data Collection, Research and Evaluation.
Available at:
http://sdeportal.ct.gov/Cedar/Files/Pdf/Reports/Fall_Hiring_Data_Bulletin11_12.pdf

118
Cook Smith, N. & Mackin, K.J. (2006). Report on New Hampshire educators: Credentialing and
employment trends, New Hampshire Department of Education Division of Program
Support. Available at:
https://www.education.nh.gov/certification/documents/cred_employ_trends.pdf
Cowan, J., Goldhaber, D., Hayes, K., & Theobald, R. (2016). Missing elements in the discussion
of teacher shortages, Educational Researcher, 45(8), 460-462.
Cross, F. (2016). Teacher shortage areas nationwide listing 1990-191 through 2016-2017, United
States Department of Education.
Dee, T.S. & Goldhaber, D. (2017). Understanding and addressing teacher shortages in the United
States, Hamilton Project Policy Brief 2017-05, The Brookings Institution.
Di Carlo, M. (2015). Update on teacher turnover in the U.S., Albert Shanker Institute, January
22.
Eide, E., Goldhaber, D., & Brewer, D. (2004). The teacher labour market and teacher quality,
Oxford Review of Economic Policy, 20(2), 230-244.
Engage NY. (2013). Teacher supply and demand reports, Board of Regents Meeting. Available
at:
https://www.regents.nysed.gov/common/regents/files/TeacherSupplyDemandReports%5
B1%5D.pdf
Engel, M. & Cannata, M. (2015). Localism and teacher labor markets: how geography and
decision making may contribute to inequality, Peabody Journal of Education, 90(1), 84-
92.
Engel, M., Jacob, B.A., & Curran, E.C. (2014). New evidence on teacher labor supply, American
Educational Research Journal, 51(1), 36-72.
Ford Seiler, M., Nelson, D., Alexander, A., Clark, T., Landy, B., Olds, S., & Bailey, C. (2012).
Tracking teacher shortages: Trends and continuing questions, Research Report No. 395,
Office of Education Accountability, Legislative Research Commission. Available at:
http://www.lrc.ky.gov/lrcpubs/rr395.pdf
Garrett, J. (2018). South Carolina annual educator supply and demand report, Center for
Educator Recruitment, Retention, & Advancement. Available at:
https://www.cerra.org/uploads/1/7/6/8/17684955/2017-18_supply_demand_report.pdf
Goff, P., Carl, B., & Yang, M. (2018). Supply and demand for public school teachers in
Wisconsin, Working Paper No. 2018-2, Wisconsin Center for Education Research,
University of Wisconsin-Madison. Available at: https://wcer.wisc.edu/docs/working-
papers/Working_Paper_No_2018_02.pdf

119
Goldhaber, D. (2002), “The mystery of good teaching”, Education Next, Spring 2002.
Goldhaber, D., Krieg, J., & Theobald, R. (2014). Knocking on the door to the teaching
profession? Modeling the entry of prospective teachers into the workforce, Economics of
Education Review, 43, 106-124.
Google. (2017). Arkansas teacher preparation programs in Arkansas, Google Maps.
Hanushek, E.A., Kain, J.F., & Rivkin, S.G. (2004). Why public schools lose teachers, The
Journal of Human Resources, 39(2), 326-354.
Hanushek, E.A., & Rivkin, S.G. (2012). The distribution of teacher quality and implications for
policy, The Annual Review of Economics, 4, 131-157.
Hicks, M.J. (2015). Indiana’s demand & supply issues for K-12 educators, Center for Business
and Economic Research, Ball State University. Available at:
https://projects.cberdata.org/reports/TeacherSupply2015-1026.pdf
Hill, A. & Hirshberg, D. (2013). Alaska teacher turnover, supply, and demand: 2013 highlights,
Center for Alaska Education Policy Research, University of Alaska Anchorage.
Available at: http://www.alaskateacher.org/downloads/2013TeacherTurnover.pdf
Howell, C. (2017). 4-tiered teacher license in Arkansas proposed for ’19 start, Arkansas Online,
November 20.
Hussar, W.J., & Bailey, T.M. (2014). Projections of education statistics to 2022, Forty-first
edition, NCES 2014-051, National Center for Education Statistics.
Ingersoll, R.M. & May, H. (2011). The minority teacher shortage: Fact or fable?, Phi Delta
Kappan, 93(1), 62-65.
Ingersoll, R.M. (2003). Is there really a teacher shortage?, CPRE Research Reports, September
2003.
Ingersoll, R.M. (2002). The teacher shortage: A case of wrong diagnosis and wrong
prescription, NASSP Bulletin, 86(631), 16-31.
Ingersoll, R.M. (2001). Teacher turnover and teacher shortages: An organizational analysis,
American Educational Research Journal, 38(3), 499-534.
Katnik, P. (2017). Teacher workforce, Missouri Department of Elementary & Secondary
Education. Available at:
https://dese.mo.gov/sites/default/files/TeacherWorkforceFeb2017.pdf
Konoske-Graf, A., Partelow, L., & Benner, M. (2016). To attract great teachers, school districts
must improve their human capital systems, Center for American Progress.

120
Krieg, J.M., Theobald, R., & Goldhaber, D. (2016). A foot in the door: Exploring the role of
student teaching assignments in teachers’ initial job placements, Educational Evaluation
and Policy Analysis, 38(2), 364-388.
Ladd, H.F. (2007). Teacher labor markets in developed countries, The Future of Children, 17(1),
201-217.
Levin, J., Berg-Jacobson, A., Atchison, D., Lee, K., & Vontsolos, E. (2015). Massachusetts study
of teacher supply and demand: Trends and projections, American Institutes for Research.
Available at: https://www.air.org/sites/default/files/downloads/report/Massachusetts-
Study-of-Teacher-Supply-and-Demand-December-2015_rev.pdf
Linder, C. & McHugh, C.M. (2017). Idaho State Board of Education 2017 teacher pipeline
report. Available at: https://boardofed.idaho.gov/resources/2017-teacher-pipeline-report/
Lindsay, J., Wan, Y., Berg-Jacobson, A., Walston, J., & Redford, J. (2016). Strategies for
estimating teacher supply and demand using student and teacher data, REL 2017-197,
Regional Educational Laboratory Midwest.
Loeb, S. & Reininger, M. (2004). Public policy and teacher labor markets: What we know and
why it matters, The Education Policy Center at Michigan State University.
Maier, A., & Youngs, P. (2009). Teacher preparation programs and teacher labor markets,
Journal of Teacher Education, 60(4), 393-407.
Malatras, J., Gais, T., & Wagner, A. (2017). A background on potential teacher shortages in the
United States, SUNY Rockefeller Institute of Government, July 2017.
Maranto, R., & McShane, M.Q. (2012). President Obama and education reform: The personal
and the political, New York City: Palgrave Macmillan.
Maranto, R., & Shuls, J.V. (2012). How do we get them on the farm? Efforts to improve rural
teacher recruitment and retention in Arkansas, Rural Educator, 34(1), n1.
Maryland State Department of Education. (2016). Maryland teacher staffing report 2016-2018.
Available at: https://files.eric.ed.gov/fulltext/ED572300.pdf
Meeks, J.T. & Koch, C.A. (2014). Educator supply and demand in Illinois 2014 Annual Report,
Illinois State Board of Education. Available at: https://www.isbe.net/Documents/ed-
supply-demand-2014.pdf
Murnane, R.J., & Steele, J.L. (2007). What is the problem? The challenge of providing effective
teachers for all children, The Future of Children, 17(1), 15-43.

121
Murphy, P., DeArmond, M., & Guin, K. (2003). A national crisis or localized problems? Getting
perspective on the scope and scale of the teacher shortage, Education Policy Analysis
Archives, 11(23).
National Center for Education Statistics (NCES). (2017a). Elementary/secondary information
system, Arkansas school district urban-centric locale, 2014-15.
National Center for Education Statistics (NCES). (2017b). Locale classification and criteria.
Available at: https://nces.ed.gov/programs/edge/docs/LOCALE_DEFINITIONS.pdf.
Nebraska Department of Education. (2018). Teacher vacancy survey report. Available at:
https://2x9dwr1yq1he1dw6623gg411-wpengine.netdna-ssl.com/wp-
content/uploads/2018/03/2017-Teacher-Shortage-Report.pdf
Nguyen, H., & Onstad, N. (2017). 2017 report of teacher supply and demand in Minnesota’s
public schools: Fiscal year 2017 report to the legislature, Minnesota Department of
Education. Available at:
https://education.mn.gov/mdeprod/groups/educ/documents/basic/bwrl/mdyw/~edisp/mde
060019~1.pdf
OECD. (2017). Education at a glance 2017: OECD indicators, Paris: OECD Publishing.
OECD. (2005). Teachers matter: Attracting, developing and retaining effective teachers, Paris:
OECD Publishing.
Office of Economic and Demographic Research. (2000). Teacher supply and demand forecasts,
State of Florida. Available at: http://edr.state.fl.us/Content/special-research-
projects/education/teachersupply.pdf
Office for Education Policy. (2005). Teacher shortages in Arkansas, Policy Brief, 2(3).
University of Arkansas.
Oregon Department of Education. (2015). Understanding and identifying teacher shortage areas
in Oregon. Available at: https://www.ode.state.or.us/wma/researchteacher-shortage-
final-report.pdf
Papay, J. (n.d.). Aspen Institute Datasheet: The teaching workforce, The Aspen Institute.
Available at:
https://assets.aspeninstitute.org/content/uploads/files/content/docs/education/Ed_AspenT
eacherWorkforceDatasheet.pdf.
Pfeffer, I. & Servedio, F. (2015). Academic shortage areas for 2016-17, Arkansas Dept. of
Education, December 2015. Available at:
http://www.arkansased.gov/public/userfiles/HR_and_Educator_Effectiveness/HR_Educat
or_Licensure/CSA_PPT_from_Dec_2015_FINAL_with_Notes-11266.pdf.
122
Podgursky, M. (2006). Is there a “qualified” teacher shortage?, Education Next, 6(2).
Raue, K., & Gray, L. (2015). Results from the first through fifth waves of the 2007-08 beginning
teacher longitudinal study, U.S. Department of Education, NCES 2015-196.
Reichardt, R., Van Buhler, B., & Akiba, M. (2003). Teacher supply and demand in the State of
Colorado, Mid-continent Research for Education and Learning.
Reininger, M. (2012). Hometown disadvantage? It depends on where you’re from: Teachers’
location preferences and the implications for staffing schools, Educational Evaluation
and Policy Analysis, 34(2), 127-145.
Russell, A. (2005). The facts- and fictions- about teacher shortages, American Association of
State Colleges and Universities, 2(5), 2-5.
Schug, M.C. & Holahan, W.L. (2004). The case of the simultaneous teacher shortages and
surpluses: A new example for teaching about labor markets, Journal of Private
Enterprise, 19(2), 108-119.
Sherretz, K.L., Kelly, C.G., & Matos, R.A. (2013). Delaware teacher and administrator supply
and demand survey analysis report, Institute for Public Administration, University of
Delaware. Available at: http://www.ipa.udel.edu/publications/teacher_supply13.pdf
Stephens, C., Hall, T., McCampbell, C. (2015). The 2015 Georgia public P-12 teacher
workforce: A Status Report. Available at:
https://www.gapsc.com/Commission/Research_Publication/downloads/2015%20Status%
20Report.pdf
Stotsky, S. (2015). An empty curriculum: The need to reform teacher licensing regulations and
tests, Lanham, MD: Rowman & Littlefield.
Stronge, J.H., Ward, T.J., & Grant, L.W. (2011), “What makes good teachers good? A cross-
case analysis of the connection between teacher effectiveness and student achievement”,
Journal of Teacher Education, 62(4), 339-355.
Suckow, M.A. & Lau, P.P. (2017). Teacher supply in California: A report to the legislature
annual report 2015-16, Professional Services Division of the Commission on Teacher
Credentialing. Available at: https://www.ctc.ca.gov/docs/default-
source/commission/reports/ts-2015-2016-annualrpt.pdf?sfvrsn=84d346b1_4
Sutcher, L., Darling-Hammond, L., & Carver-Thomas, D. (2016). A coming crisis in teaching?
Teacher supply, demand, and shortages in the U.S., Research Brief, Learning Policy
Institute.
U.S. Census Bureau. (2016). 0.Cartographic boundary shapefiles - school districts, Arkansas.
Available at: https://www.census.gov/geo/maps-data/data/cbf/cbf_sd.html
123
U.S. Department of Education (USDOE). (2015). Enrollment in teacher preparation programs,
Office of Postsecondary Education, Higher Education Act Title II Reporting. Available
at: https://title2.ed.gov/Public/44077_Title_II_Issue_Brief_Enrollment.pdf/
Watson, A., Wagner, B., Lacy, K., Rose, E. (2017). Meeting state worker demand: Report on the
labor market outcomes for Montana colleges, Montana Department of Labor & Industry.
Available at: https://www.gfcmsu.edu/about/documents/StateCollegeReport.pdf
Wayne, A.J., & Youngs, P. (2003). Teacher characteristics and student achievement gains: A
review, Review of Educational Research, 73(1), 89-122.
Weisberg, D., Sexton, S., Mulhern, J. & D. Keeling (2009), “The widget effect”, Brooklyn, NY:
The New Teacher Project.
Weiss, S. (2018). No substitute for trained teachers, National Conference of State Legislatures,
January 1.
White, H. (1980). A heteroskedasticity-consistent covariance matrix estimator and a direct test
for heteroskedasticity, Econometrica, 48, 817-838.
Will, M. (2016). Help wanted: Teacher-shortage hot spots, Education Week, August 22.
Yaffe, D. (2016). Tackling the teacher shortage, Education Digest, 81(8), 11-15.
Zagorsky, J., Olsen, R., Hawley, J., & Gnagey, J. (2013). 2013 teacher supply and demand in
Ohio, Ohio Department of Education. Available at: http://glennweb.glenn.it.osu.edu/wp-
content/uploads/2017/07/2013-Teacher-Supply-and-Demand-in-Ohio.pdf

124
Appendices
Appendix A: Supply Using Log Enrollment
Figure A1: Distribution of Log Enrollment, 2016-17
01
02
03
04
05
0
Fre
que
ncy
4 6 8 10log_enroll1617

125
Table A1: Predictors of Supply: Log Enrollment and Categorical Enrollment
Notes: Robust standard errors in parentheses; *** p<0.01, ** p<0.05, * p<0.1; Constant: Small
districts, NW = Region 1, Rural. Mean unit of supply = 5.12 (equivalent to ~5 applicants per
vacancy).
(1) (2) (3) (4) (1) (2) (3) (4)
VARIABLES
Enrollment
(Log)
Enrollment
& Region
(no
controls)
Enrollment
& Region
(w/demo
controls)
Enrollment
& Region
(w/all
controls)
Enrollment
(Categorical)
Enrollment
& Region
(no
controls)
Enrollment
& Region
(w/demo
controls)
Enrollment
& Region
(w/all
controls)
Small districts (< 1,500) - - - -
Midsize districts (1,500-3,500) 0.900 0.921 -0.294 -0.367
(1.119) (1.056) (1.043) (1.263)
Large districts (> 3,500) 5.674** 6.574*** 5.505*** 4.631*
(2.319) (2.366) (2.054) (2.368)
Enrollment (log) 1.571** 1.480** 0.985* 0.473
(0.708) (0.658) (0.526) (0.644)
NW (Region 1) - - - - - - - -
NE (Region 2) -2.214 -1.813 -1.048 -1.946 -1.435 -0.843
(1.357) (1.276) (1.326) (1.327) (1.262) (1.297)
Central (Region 3) -4.707*** -5.555*** -4.784*** -5.863*** -6.313*** -5.388***
(1.152) (1.392) (1.460) (1.261) (1.448) (1.610)
SW (Region 4) -3.567*** -3.293*** -2.201* -3.440*** -2.905** -2.179*
(1.180) (1.147) (1.192) (1.195) (1.162) (1.259)
SE (Region 5) -5.443*** -5.211*** -3.685*** -5.086*** -4.408*** -3.738***
(1.106) (1.127) (1.143) (1.091) (1.065) (1.023)
District %FRL -11.02*** -5.091 -10.99*** -7.440
(4.101) (5.641) (4.200) (6.765)
District %White -2.803 -2.562 -1.866 -1.994
(1.773) (2.187) (1.655) (2.519)
Educational Success 1.626 1.226
(1.045) (0.997)
Teacher Salary BA, 0-yrs (in $1,000s) 0.000** 0.166
(0.000) (0.202)
District Growth -0.0200 0.169
(0.0639) (0.203)
Constant -5.842 -2.568 10.14** -4.619 4.277*** 6.908*** 15.65*** 7.203
(4.753) (4.324) (4.391) (8.887) (0.393) (0.803) (4.021) (8.750)
Observations 183 183 182 170 183 183 182 165
R-squared 0.065 0.172 0.221 0.246 0.089 0.222 0.271 0.295
Using Log Enrollment Using Categorical Enrollment

126
Appendix B: Supply by District Percent Hispanic, Black Students
Supply by District Percent Hispanic
Table B1: Teacher Supply by District Race/Ethnicity - Hispanic (Quintile)
Note: Mean %Hispanic 2016-17 = 8.1%
Figure B1: Average Teacher Supply by District Race/Ethnicity - Hispanic (Quintile)
Quintile
range Quintile
N of
districts
N of
responses
Total
Vacancies
Total
Applicants
Teacher
Supply
ratio
0-0.02 lowest% 1 59 41 316 1,085 3.4
0.03-0.04 2 71 50 404 1,392 3.4
0.05-0.06 3 41 29 322 1,262 3.9
0.07-0.10 4 40 27 764 3,295 4.3
0.11-0.61 highest% 5 51 37 1,085 9,912 9.1
Overall 262 184 2,891 16,946 5.9
Note: Mean %Hispanic 2016-17 = 0.081
8 8 11 28 2926 28 44
122
268
3.4 3.4 3.9 4.3
9.1
-
2.0
4.0
6.0
8.0
10.0
12.0
0
50
100
150
200
250
300
350
400
1 2 3 4 5
Sup
ply
Rat
io
Dis
tric
t A
ver
age
Average Teacher Supply by District Race/Ethnicity -
Hispanic (Quintile)
Average District Vacancies Average District Applicants Teacher Supply ratio

127
Table B2: Teacher Supply by District Race/Ethnicity - Hispanic (Quintile), Excluding
Northwest Region Districts
Figure B2: Average Teacher Supply by District Race/Ethnicity - Hispanic (Quintile), Excluding
Northwest Region Districts
Quintile
range Quintile
N of
districts
N of
responses
Total
Vacancies
Total
Applicants
Teacher
Supply
ratio
0-0.02 lowest% 1 59 29 264 688 2.6
0.03-0.04 2 71 36 328 1,085 3.3
0.05-0.06 3 41 25 300 976 3.3
0.07-0.10 4 40 16 664 2,628 4.0
0.11-0.61 highest% 5 51 23 539 3,490 6.5
Overall 262 129 2,095 8,867 4.2
9 9 12 42 2324 30 39
164 1522.6 3.3 3.3
4.0
6.5
-
2.0
4.0
6.0
8.0
10.0
12.0
0
50
100
150
200
250
300
350
400
1 2 3 4 5S
up
ply
Rat
io
Dis
tric
t A
ver
age
Average Teacher Supply - Hispanic (Quintile),
Excluding Northwest Districts
Average District Vacancies Average District Applicants Teacher Supply ratio

128
Supply by District Percent Black
Table B3: Teacher Supply by District Race/Ethnicity - Black (Quintile)
Note: Mean %Black 2016-17 = 18.5%
Figure B3: Average Teacher Supply by District Race/Ethnicity - Black (Quintile)
Quintile
range Quintile
N of
districts
N of
responses
Total
Vacancies
Total
Applicants
Teacher
Supply
ratio
0 lowest% 1 56 32 176 917 5.2
0.01 2 53 41 259 2,044 7.9
0.02-0.09 3 49 33 702 6,130 8.7
0.10-0.38 4 53 39 520 2,464 4.7
0.39-0.98 highest% 5 51 39 1,234 5,391 4.4
Overall 262 184 2,891 16,946 5.9
Note: Mean %Black 2016-17 = 0.185
6 6 21 13 3229 50
186
63
138
5.2
7.9 8.7
4.7 4.4
-
2.0
4.0
6.0
8.0
10.0
12.0
0
50
100
150
200
250
300
350
400
1 2 3 4 5
Sup
ply
Rat
io
Dis
tric
t A
ver
age
Average Teacher Supply by District Race/Ethnicity -
Black (Quintile)
Average District Vacancies Average District Applicants Teacher Supply ratio

129
Table B4: Teacher Supply by District Race/Ethnicity - Black (Category)
Figure B4: Average Teacher Supply by District Race/Ethnicity - Black (Quintile)
Category
range Category
N of
districts
N of
responses
Total
Vacancies
Total
Applicants
Teacher
Supply
ratio
0 lowest% 1 56 32 176 917 5.2
0.01-0.10 2 108 77 1,070 9,137 8.5
0.10-0.50 3 62 46 706 3,496 5.0
0.51-0.98 highest% 4 36 27 939 3,396 3.6
Overall 262 182 2,891 16,946 5.9
6 14 15 3529
119
76
126
5.2
8.5
5.0
3.6
-
2.0
4.0
6.0
8.0
10.0
12.0
0
50
100
150
200
250
300
350
400
0 0.01-0.10 0.10-0.50 0.51-0.98
Sup
ply
Rat
io
Dis
tric
t A
ver
age
Average Teacher Supply by District Race/Ethnicity -
Black (Category)
Average District Vacancies Average District Applicants Teacher Supply ratio

130
Appendix C: Race/Ethnic Diversity (%White) of Small Districts
Table C1: District Race/Ethnicity (White) Quintile for Small Districts Relative to All Districts
Quintile range Quintile
N of
districts
Mean %
White Min Max
N of Small
Districts
Mean %
White Min Max
% of Small
Districts in
Quintile
0-0.44 least white 1 54 0.23 108 22,759 30 0.16 108 1,462 0.56
0.47-0.71 2 53 0.61 62 15,399 32 0.60 62 1,419 0.60
0.72-0.87 3 51 0.81 336 16,609 39 0.81 336 1,454 0.76
0.88-0.93 4 60 0.91 325 10,290 38 0.91 325 1,314 0.63
0.94-0.98 most white 5 44 0.96 56 1,661 42 0.96 56 1,383 0.95
Total 262 0.70 56 22,759 181 0.69
All Districts Small Districts

131
Appendix D: Comparison of Descriptive Ratios and Simple Regression
Table D1: Example Comparison of Descriptive Supply Ratios and Simple Regression
Coefficients - District Size
Note: Simple regression coefficients added to the reference group coefficient are approximately
equivalent to the unweighted mean teacher supply.
Size range
District
Size
N of
responses
Teacher
Supply
Ratio
(weighted)
N of
responses
Mean Teacher
Supply
(unweighted)
Simple
Regression
Coefficients
Sum of Coefficients
and Reference
Group
< 1,500 Small 128 4.0 128 4.28 4.28 (reference group)
1,500-3,500 Midsize 36 2.8 33 5.18 0.90 5.18
> 3,500 Large 20 7.9 22 9.95 5.67 10.85
Total 184 5.9 183 5.12

132
Appendix E: Variation in Supply by Region
Figure E1: Distribution of Teacher Supply – Northwest Region
Figure E2: Distribution of Teacher Supply – Northeast Region
02
04
06
08
0
Pe
rcen
t
0 10 20 30 40reported_supply
02
04
06
08
0
Pe
rcen
t
0 10 20 30 40reported_supply

133
Figure E3: Distribution of Teacher Supply – Central Region
Figure E4: Distribution of Teacher Supply – Southwest Region
02
04
06
08
0
Pe
rcen
t
0 10 20 30 40reported_supply
02
04
06
08
0
Pe
rcen
t
0 10 20 30 40reported_supply

134
Figure E5: Distribution of Teacher Supply – Southeast Region
Table E1: Mean Teacher Supply by Region (Unweighted)
02
04
06
08
0
Pe
rcen
t
0 10 20 30 40reported_supply
Region
Mean Teacher
Supply
(unweighted)
25th
%ile
75th
%ile SD
NW 7.92 4.00 11.00 7.15
NE 5.47 1.45 5.66 6.87
Central 3.34 1.10 4.25 4.01
SW 3.90 1.50 5.00 4.02
SE 2.03 0.50 5.00 3.29

135
Appendix F: Supply Using Teacher Salary (Categorical)
Figure F1: Distribution of Teacher Salary, 2016-17
Table F1: Teacher Supply by Teacher Salary – BA, 0 years (Categorical)
02
04
06
0
Fre
que
ncy
30000 35000 40000 45000 50000BA: 0 years
Salary Range
Salary
Category
N of
districts
N of
responses
Total
Vacancies
Total
Applicants
Average
District
Vacancies
Average
District
Applicants
Teacher
Supply
ratio
< $31,610 Low 64 45 302 1,026 7 23 3.4
$ 31,610-36,000 Mid 126 88 1,183 3,634 13 41 3.1
> $36,000 High 67 47 1,367 12,277 29 261 9.0
Total 257 180 2,852 16,937 16 94 5.9

136
Figure F2: Average Teacher Supply by Teacher Salary – BA, 0 years (Categorical)
7 13 29 23 41
261
3.4 3.1
9.0
-
2.0
4.0
6.0
8.0
10.0
12.0
-
50
100
150
200
250
300
350
400
Low Mid High
Sup
ply
Rat
io
Dis
tric
t A
ver
age
Average Teacher Supply by Teacher Salary -
BA, 0 years (Categorical)
Average District Vacancies Average District Applicants Teacher Supply ratio

137
Table F2: Predictors of Supply: Continuous vs Categorical Teacher Salary
Notes: *** p<0.01, ** p<0.05, * p<0.1. Robust standard errors in parentheses.
Teacher Salary Continuous Teacher Salary Categorical
(6) (9) (1) (2)
VARIABLES
Enrollment
& Region
(w/all
controls)
Region &
Urbanicity
(w/all
controls) VARIABLES
Enrollment
& Region
(w/all
controls)
Region &
Urbanicity
(w/all
controls)
Midsize districts (1,500-3,500) -0.367 Midsize districts (1,500-3,500) -0.667
(1.263) (1.086)
Large districts (> 3,500) 4.631* Large districts (> 3,500) 4.725**
(2.368) (2.297)
City (urbanicity 1) 8.188** City (urbanicity 1) 7.845**
(3.534) (3.192)
Suburb (urbanicity 2) 5.736** Suburb (urbanicity 2) 4.766*
(2.881) (2.767)
Town (urbanicity 3) 2.026 Town (urbanicity 3) 2.020
(1.351) (1.315)
NE (Region 2) -0.843 -0.672 NE (Region 2) -0.762 -0.579
(1.297) (1.273) (1.321) (1.302)
Central (Region 3) -5.388*** -4.780*** Central (Region 3) -5.962*** -5.181***
(1.610) (1.726) (1.717) (1.703)
SW (Region 4) -2.179* -1.321 SW (Region 4) -2.195* -1.228
(1.259) (1.291) (1.176) (1.216)
SE (Region 5) -3.738*** -2.755** SE (Region 5) -3.662*** -2.640**
(1.023) (1.211) (1.123) (1.266)
District %FRL -7.440 -3.234 District %FRL -7.166 -2.077
(6.765) (6.364) (6.400) (6.351)
District %White -1.994 0.967 District %White -1.885 1.894
(2.519) (2.667) (2.480) (2.627)
Educational Success 1.226 1.928* Educational Success 1.054 1.574
(0.997) (0.990) (1.036) (0.997)
Teacher Salary BA, 0-yrs 0.166 0.102
(rescaled) (0.202) (0.201)
Mid-salary ($31,610-36,000) -1.353 -1.371
(0.919) (0.927)
High-salary (> $36,000) 1.399 1.416
(1.453) (1.478)
District Growth 0.169 0.131 District Growth 0.039 -0.062
(0.203) (0.179) (0.068) (0.078)
Constant 7.203 3.088 Constant 12.983** 5.447
(8.750) (8.672) (5.977) (5.931)
Observations 165 165 Observations 170 170
R-squared 0.295 0.328 R-squared 0.298 0.318
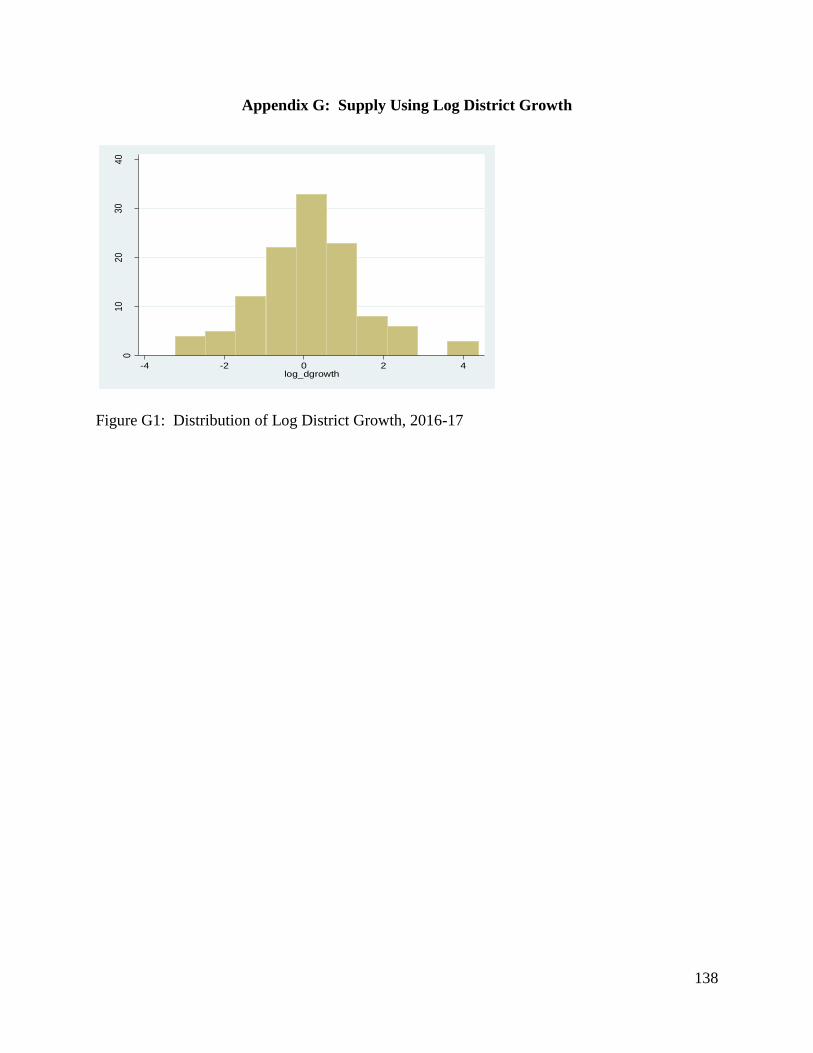
138
Appendix G: Supply Using Log District Growth
Figure G1: Distribution of Log District Growth, 2016-17
01
02
03
04
0
Fre
que
ncy
-4 -2 0 2 4log_dgrowth

139
Table G1: Predictors of Supply: District Growth Percentage vs. Log District Growth Percentage
Notes: *** p<0.01, ** p<0.05, * p<0.1. Robust standard errors in parentheses. A 1% increase in
district growth is not significantly associated with teacher supply.
Including district growth controls for districts that may be flourishing while others may be dying.
As the distribution of district growth is positively skewed, I run models using the natural log of
district growth. Regardless of which district growth variable is used, it appears that the teacher
supply advantage for large districts and suburban districts persists as does the disadvantage for
Central and SW districts, and high poverty districts.
District Growth Percentage Log District Growth Percentage
(6) (9) (1) (2)
VARIABLES
Enrollment
& Region
(w/all
controls)
Region &
Urbanicit
y (w/all
controls) VARIABLES
Enrollment
& Region
(w/all
controls)
Region &
Urbanicity
(w/all
controls)
Midsize districts (1,500-3,500) -0.367 Midsize districts (1,500-3,500) -0.557
(1.263) (2.007)
Large districts (> 3,500) 4.631* Large districts (> 3,500) 8.566**
(2.368) (4.110)
City (urbanicity 1) 8.188** City (urbanicity 1) 4.643
(3.534) (4.391)
Suburb (urbanicity 2) 5.736** Suburb (urbanicity 2) 6.690*
(2.881) (3.715)
Town (urbanicity 3) 2.026 Town (urbanicity 3) 2.243
(1.351) (2.003)
NE (Region 2) -0.843 -0.672 NE (Region 2) -0.405 0.061
(1.297) (1.273) (2.283) (2.320)
Central (Region 3) -5.388*** -4.780*** Central (Region 3) -8.216*** -6.413**
(1.610) (1.726) (2.605) (2.517)
SW (Region 4) -2.179* -1.321 SW (Region 4) -4.110*** -2.703*
(1.259) (1.291) (1.213) (1.524)
SE (Region 5) -3.738*** -2.755** SE (Region 5) -3.726 -3.567
(1.023) (1.211) (2.863) (2.807)
District %FRL -7.440 -3.234 District %FRL -15.787* -6.745
(6.765) (6.364) (8.785) (8.188)
District %White -1.994 0.967 District %White -6.413 -5.588
(2.519) (2.667) (5.097) (7.067)
Educational Success 1.226 1.928* Educational Success 0.066 0.663
(0.997) (0.990) (1.731) (1.628)
Teacher Salary BA, 0-yrs (in $1,000s)0.166 0.102 Teacher Salary BA, 0-yrs (in $1,000s)0.0111 0.457
(0.202) (0.201) (0.430) (0.351)
District Growth 0.169 0.131 District Growth 0.184 -0.389
(0.203) (0.179) (0.514) (0.455)
Constant 7.203 3.088 Constant 21.573 -1.017
(8.750) (8.672) (16.412) (15.624)
Observations 165 165 Observations 74 74
R-squared 0.295 0.328 R-squared 0.426 0.393

140
Appendix H: Supply by Subgroups Analyses
Supply by School Level
Table H1: Predictors of Elementary Teacher Supply
Notes: Robust standard errors in parentheses; *** p<0.01, ** p<0.05, * p<0.1. Constant: Small
districts, NW=Region 1, Rural. Mean unit of supply for elementary teachers = 4.37 (equivalent
to 4 applicants per vacancy). Overall mean unit of teacher supply = 5.12 (equivalent to ~5
applicants per vacancy).
(1) (2) (3) (4) (5) (6) (7) (8) (9)
VARIABLES
Enrollment
(Categorical) Urbanicity Region
Enrollment
& Region
Enrollment
& Region
(w/demo
controls)
Enrollment
& Region
(w/all
controls)
Region &
Urbanicity
Region &
Urbanicity
(w/demo
controls)
Region &
Urbanicity
(w/all
controls)
Small districts (< 1,500) - - - -
Midsize districts (1,500-3,500) -0.589 -0.390 -0.803 0.493
(0.974) (0.909) (0.923) (0.920)
Large districts (> 3,500) 5.072** 5.882*** 5.489** 7.279***
(2.117) (2.105) (2.259) (2.624)
City (urbanicity 1) 1.601 2.271 2.521 3.802
(1.804) (2.457) (2.997) (3.213)
Suburb (urbanicity 2) 5.443 5.548 5.143 4.984
(4.240) (4.498) (4.518) (4.268)
Town (urbanicity 3) 0.116 0.672 0.591 0.302
(1.278) (1.096) (1.034) (0.938)
Rural (urbanicity 4) - - - -
NW (Region 1) - - - - - - -
NE (Region 2) -1.805 -1.195 -1.087 -0.753 -1.019 -1.006 -0.518
(1.403) (1.424) (1.479) (1.515) (1.523) (1.528) (1.547)
Central (Region 3) -3.324** -4.844*** -4.874*** -3.446** -3.846* -4.111** -2.214
(1.608) (1.276) (1.604) (1.722) (1.957) (2.037) (2.185)
SW (Region 4) -4.773***-4.103*** -3.952*** -3.344*** -3.836*** -3.778*** -3.210**
(1.013) (1.075) (1.274) (1.263) (1.113) (1.353) (1.368)
SE (Region 5) -4.071** -3.146 -2.899 -3.122** -3.248* -3.111* -3.107**
(2.013) (2.076) (1.819) (1.422) (1.898) (1.675) (1.552)
District %FRL -3.340 2.399 -2.487 3.896
(3.742) (5.056) (3.886) (5.055)
District %White -0.285 1.863 -0.282 -0.422
(2.635) (2.508) (2.983) (3.197)
Educational Success 0.549 1.772
(1.052) (1.281)
Teacher Salary BA, 0-yrs (in $1,000s) -0.126 -0.276
(0.239) (0.223)
District Growth 0.349* 0.350
(0.211) (0.216)
Constant 4.670*** 4.646*** 7.524*** 6.707*** 9.218** 7.055 6.335*** 8.244* 2.601
(0.601) (0.513) (0.909) (0.997) (3.918) (10.69) (1.038) (4.533) (10.46)
Observations 156 152 156 156 155 144 152 151 144
R-squared 0.077 0.036 0.076 0.160 0.165 0.268 0.101 0.109 0.221

141
Table H2: Predictors of Middle School Teacher Supply
Notes: Robust standard errors in parentheses; *** p<0.01, ** p<0.05, * p<0.1. Constant: Small
districts, NW=Region 1, Rural. Mean unit of supply for middle school teachers = 6.6 (equivalent
to ~7 applicants per vacancy). Overall mean unit of teacher supply = 5.12 (equivalent to ~5
applicants per vacancy).
(1) (2) (3) (4) (5) (6) (7) (8) (9)
VARIABLES
Enrollment
(Categorical) Urbanicity Region
Enrollment
& Region
Enrollment &
Region
(w/demo
controls)
Enrollment &
Region (w/all
controls)
Region &
Urbanicity
Region &
Urbanicity
(w/demo
controls)
Region &
Urbanicity
(w/all
controls)
Small districts (< 1,500) - - - -
Midsize districts (1,500-3,500) -0.196 0.557 -0.688 -0.808
(1.327) (1.296) (1.236) (1.311)
Large districts (> 3,500) 7.862*** 8.907** 7.836** 6.369
(2.967) (3.438) (3.419) (3.896)
City (urbanicity 1) 4.624 5.859 7.675 8.109
(2.848) (4.345) (5.280) (6.230)
Suburb (urbanicity 2) 9.201*** 9.263** 8.453** 8.089*
(3.331) (3.822) (4.217) (4.266)
Town (urbanicity 3) 1.990 3.026 3.323 3.376
(1.973) (2.101) (2.814) (3.169)
Rural (urbanicity 4) - - - -
NW (Region 1) - - - - - - -
NE (Region 2) -2.291 -1.342 -0.799 -0.344 -1.187 -0.897 -0.228
(2.315) (2.310) (2.333) (2.380) (2.414) (2.359) (2.327)
Central (Region 3) -3.075 -5.868*** -5.555** -4.487 -5.610* -5.540* -3.016
(1.879) (2.022) (2.334) (2.752) (3.147) (3.327) (3.234)
SW (Region 4) -5.522*** -4.689*** -3.934** -3.204* -4.468** -3.510* -2.707
(1.476) (1.517) (1.598) (1.624) (1.741) (1.818) (1.796)
SE (Region 5) -7.506*** -6.128*** -5.012*** -3.763** -6.641*** -4.967** -3.187
(1.298) (1.190) (1.493) (1.541) (1.691) (2.003) (1.951)
District %FRL -9.934** -2.966 -4.981 6.707
(4.496) (7.288) (6.744) (8.726)
District %White -0.500 -1.810 3.128 0.249
(2.704) (3.034) (5.313) (4.637)
Educational Success 1.363 3.371*
(1.465) (1.750)
Teacher Salary BA, 0-yrs (in $1,000s) 0.146 0.127
(0.278) (0.362)
District Growth 0.677 0.578
(0.409) (0.374)
Constant 4.764*** 4.140*** 8.708*** 7.144*** 14.09*** 5.223 6.330*** 6.819 -3.874
(0.779) (0.516) (1.232) (1.104) (4.581) (12.81) (1.296) (9.289) (13.26)
Observations 137 134 137 137 136 127 134 133 127
R-squared 0.111 0.084 0.086 0.197 0.218 0.241 0.169 0.194 0.254

142
Table H3: Predictors of High School Teacher Supply
Notes: Robust standard errors in parentheses; *** p<0.01, ** p<0.05, * p<0.1. Constant: Small
districts, NW=Region 1, Rural. Mean unit of supply for high school teachers = 4.38 (equivalent
to 4 applicants per vacancy). Overall mean unit of teacher supply = 5.12 (equivalent to ~5
applicants per vacancy).
(1) (2) (3) (4) (5) (6) (7) (8) (9)
VARIABLES
Enrollment
(Categorical) Urbanicity Region
Enrollment
& Region
Enrollment
& Region
(w/demo
controls)
Enrollment
& Region
(w/all
controls)
Region &
Urbanicity
Region &
Urbanicity
(w/demo
controls)
Region &
Urbanicity
(w/all
controls)
Small districts (< 1,500) - - - -
Midsize districts (1,500-3,500) -0.0863 -0.0623 -0.772 -0.675
(0.804) (0.779) (0.700) (0.774)
Large districts (> 3,500) 5.795** 6.463** 5.770** 4.900
(2.598) (2.882) (2.846) (3.341)
City (urbanicity 1) 3.643 5.405 7.075* 7.419*
(2.676) (3.543) (4.123) (4.316)
Suburb (urbanicity 2) 4.678** 5.485** 5.304* 4.760*
(2.295) (2.670) (2.903) (2.697)
Town (urbanicity 3) 0.123 0.492 0.951 0.785
(0.836) (1.089) (1.244) (1.121)
Rural (urbanicity 4) - - - -
NW (Region 1) - - - - - - -
NE (Region 2) -1.390 -0.741 -0.523 -0.109 -0.295 -0.240 0.226
(1.514) (1.559) (1.560) (1.591) (1.743) (1.686) (1.712)
Central (Region 3) -2.888** -4.242*** -4.666*** -3.528** -4.734** -4.838** -3.152
(1.136) (1.171) (1.409) (1.662) (1.965) (2.044) (1.945)
SW (Region 4) -3.337*** -2.716*** -2.549** -1.893* -2.024* -1.559 -0.983
(0.912) (0.968) (1.038) (1.137) (1.092) (1.120) (1.216)
SE (Region 5) -4.901*** -3.951*** -3.830*** -2.847** -3.673*** -2.841** -2.018
(0.818) (0.811) (0.946) (1.098) (1.111) (1.183) (1.278)
District %FRL -6.179** -0.0551 -1.790 3.362
(2.642) (5.301) (3.424) (4.938)
District %White -1.338 -1.486 2.461 -0.0470
(1.665) (2.221) (2.173) (2.180)
Educational Success 0.785 1.804*
(0.817) (0.978)
Teacher Salary BA, 0-yrs (in $1,000s) 0.151 0.120
(0.161) (0.174)
District Growth 0.463 0.362
(0.292) (0.232)
Constant 3.478*** 3.349*** 6.164*** 5.232*** 10.47*** 0.961 4.679*** 3.717 -2.337
(0.360) (0.372) (0.787) (0.797) (2.370) (8.480) (0.860) (3.961) (8.808)
Observations 163 159 163 163 162 149 159 158 149
R-squared 0.111 0.069 0.080 0.200 0.218 0.235 0.164 0.187 0.250

143
Supply by Subject Area
Table H4: Predictors of Math & Science Teacher Supply (Middle School)
Notes: Robust standard errors in parentheses; *** p<0.01, ** p<0.05, * p<0.1. Constant: Small
districts, NW=Region 1, Rural. Mean unit of middle school math & science teacher supply = 5.7
(equivalent to ~6 applicants per vacancy). Overall mean unit of teacher supply = 5.12
(equivalent to ~5 applicants per vacancy).
(1) (2) (3) (4) (5) (6) (7) (8) (9)
VARIABLES
Enrollment
(Categorical) Urbanicity Region
Enrollmen
t &
Region
Enrollment
& Region
(w/demo
controls)
Enrollment
& Region
(w/controls)
Region &
Urbanicity
Region &
Urbanicity
(w/demo
controls)
Region &
Urbanicity
(w/controls)
Small districts (< 1,500) - - - -
Midsize districts (1,500-3,500) 0.193 1.730 -3.332 -4.351
(2.096) (1.594) (4.837) (5.154)
Large districts (> 3,500) 12.04 12.07 7.916 2.539
(7.597) (9.558) (5.851) (5.828)
City (urbanicity 1) 9.277 8.448 7.663 4.545
(9.482) (12.66) (12.34) (15.57)
Suburb (urbanicity 2) 6.348 4.011 -3.224 -4.375
(7.163) (4.939) (5.670) (6.418)
Town (urbanicity 3) 0.0577 0.0659 -2.048 -3.386
(2.041) (1.964) (3.115) (3.203)
Rural (urbanicity 4) - - - -
NW (Region 1) - - - - - - -
NE (Region 2) -14.44* -11.16** -8.826** -7.322** -12.25** -9.840** -8.027**
(7.207) (4.773) (3.708) (3.612) (4.776) (3.832) (3.967)
Central (Region 3) -10.68 -14.55 -11.93 -9.474 -14.72 -12.95 -9.990
(7.562) (10.03) (9.191) (9.696) (11.99) (10.20) (11.84)
SW (Region 4) -14.69** -12.98** -9.947* -8.209* -11.98*** -8.622*** -7.624**
(7.212) (6.449) (5.228) (4.763) (4.259) (3.123) (3.252)
SE (Region 5) -16.24** -12.25*** -7.415** -6.886* -13.53*** -7.075* -6.240
(7.166) (4.332) (3.622) (3.684) (4.141) (3.725) (3.976)
District %FRL -34.23 -30.18 -37.21 -30.65
(31.12) (34.11) (25.83) (33.22)
District %White -1.803 -5.737 0.295 -5.529
(9.119) (9.409) (6.257) (5.684)
Educational Success 2.216 3.330
(2.055) (3.031)
Teacher Salary BA, 0-yrs (in 1,000s) 0.434 0.358
(0.632) (0.701)
District Growth 0.218 -0.0537
(0.642) (1.139)
Constant 4.273*** 5.052*** 17.49** 13.02*** 37.25 22.55 14.75*** 38.39* 25.45
(1.093) (1.392) (7.160) (4.173) (30.19) (36.67) (4.503) (20.97) (39.45)
Observations 61 60 61 61 61 59 60 60 59
R-squared 0.099 0.053 0.149 0.215 0.268 0.278 0.179 0.262 0.284

144
Table H5: Predictors of Math & Science Teacher Supply (High School)
Notes: Robust standard errors in parentheses; *** p<0.01, ** p<0.05, * p<0.1. Constant: Small
districts, NW=Region 1, Rural. Mean unit of high school math & science teacher supply = 2.78
(equivalent to ~3 applicants per vacancy). Overall mean unit of teacher supply = 5.12
(equivalent to ~5 applicants per vacancy).
(1) (2) (3) (4) (5) (6) (7) (8) (9)
VARIABLES
Enrollment
(Categorical) Urbanicity Region
Enrollment
& Region
Enrollment
& Region
(w/demo
controls)
Enrollment
& Region
(w/controls)
Region &
Urbanicity
Region &
Urbanicity
(w/demo
controls)
Region &
Urbanicity
(w/controls)
Small districts (< 1,500) - - - -
Midsize districts (1,500-3,500) 0.198 0.362 -0.170 -0.00943
(0.638) (0.834) (0.779) (0.726)
Large districts (> 3,500) 4.493** 4.735** 4.330** 3.749
(1.722) (2.057) (1.942) (2.349)
City (urbanicity 1) 2.891 3.813 5.528 3.974
(1.807) (2.664) (3.342) (3.036)
Suburb (urbanicity 2) 5.459** 7.271*** 7.221** 8.105***
(2.491) (2.608) (2.867) (2.308)
Town (urbanicity 3) 0.553 1.081 1.573 1.467*
(0.721) (0.928) (0.965) (0.805)
Rural (urbanicity 4) - - - -
NW (Region 1) - - - - - - -
NE (Region 2) -1.435 -0.548 -0.305 -0.288 -0.451 -0.467 -0.262
(1.389) (1.668) (1.701) (1.610) (1.721) (1.686) (1.624)
Central (Region 3) -1.445 -2.437** -2.725** -2.104* -3.686** -3.757** -2.487*
(1.148) (1.146) (1.319) (1.254) (1.615) (1.670) (1.328)
SW (Region 4) -2.678*** -2.030 -1.652 -1.463 -1.767 -1.221 -1.310
(0.902) (1.226) (1.246) (1.192) (1.248) (1.339) (1.302)
SE (Region 5) -3.299*** -2.153** -1.816* -1.468 -2.478* -1.679 -1.417
(0.859) (1.041) (1.036) (1.029) (1.252) (1.449) (1.271)
District %FRL -5.397*** -0.811 -1.830 2.936
(1.963) (4.684) (2.778) (4.558)
District %White -0.454 -0.716 2.413 -1.304
(1.485) (2.624) (1.873) (2.193)
Educational Success 0.555 1.759**
(0.793) (0.803)
Teacher Salary BA, 0-yrs (in 1,000s) 0.082 0.022
(0.218) (0.204)
District Growth 0.423** 0.479***
(0.199) (0.177)
Constant 2.444*** 2.374*** 4.778*** 3.512*** 7.487*** 1.758 3.326*** 2.412 1.108
(0.274) (0.227) (0.819) (0.834) (2.028) (10.49) (0.916) (3.654) (9.428)
Observations 82 81 82 82 81 76 81 80 76
R-squared 0.206 0.150 0.089 0.276 0.315 0.381 0.265 0.317 0.428

145
Table H6: Predictors of English/Language Arts & Social Studies Teacher Supply (Middle
School)
Notes: Robust standard errors in parentheses; *** p<0.01, ** p<0.05, * p<0.1. Constant: Small
districts, NW=Region 1, Rural. Mean unit of middle school English language arts & social
studies teacher supply = 10.08 (equivalent to 10 applicants per vacancy). Overall mean unit of
teacher supply = 5.12 (equivalent to ~5 applicants per vacancy).
(1) (2) (3) (4) (5) (6) (7) (8) (9)
VARIABLES
Enrollment
(Categorical) Urbanicity Region
Enrollment
& Region
Enrollment
& Region
(w/demo
controls)
Enrollment
& Region
(w/controls)
Region &
Urbanicity
Region &
Urbanicity
(w/demo
controls)
Region &
Urbanicity
(w/controls)
Small districts (< 1,500) - - - -
Midsize districts (1,500-3,500) 2.392 5.078 -0.936 1.097
(3.526) (3.268) (3.510) (3.411)
Large districts (> 3,500) 12.77* 13.69* 6.851 8.171
(6.535) (6.946) (5.467) (6.180)
City (urbanicity 1) 12.34* 16.37* 17.09 19.93
(7.014) (8.862) (11.28) (15.47)
Suburb (urbanicity 2) 18.38 24.01* 19.93 21.85***
(15.96) (13.35) (12.41) (4.842)
Town (urbanicity 3) 4.688 4.709* 4.012 4.943
(2.965) (2.781) (2.760) (3.145)
Rural (urbanicity 4) - - - -
NW (Region 1) - - - - - - -
NE (Region 2) -6.784 -6.367 -3.436 -3.589 -7.274 -6.265 -5.300
(6.792) (5.072) (4.828) (4.198) (4.479) (4.130) (3.758)
Central (Region 3) -9.605* -12.38* -13.14** -9.470 -17.20** -15.46** -10.73
(5.440) (6.167) (5.788) (6.482) (8.312) (6.865) (6.820)
SW (Region 4) -10.50* -11.00* -8.136 -5.746 -7.897** -5.836 -2.448
(5.440) (5.476) (5.127) (5.117) (3.793) (3.553) (3.540)
SE (Region 5) -15.11*** -12.48*** -11.26*** -6.960 -11.72*** -7.187 -1.518
(5.031) (3.540) (3.603) (4.166) (3.409) (4.890) (6.782)
District %FRL -35.17 -24.22 -20.92 -12.13
(23.64) (24.88) (17.42) (27.59)
District %White -14.45* -18.80** 2.606 -6.677
(8.197) (9.161) (10.39) (9.853)
Educational Success 4.556 7.028*
(3.451) (3.680)
Teacher Salary BA, 0-yrs (in 1,000s) -0.685 -1.135
(0.753) (0.960)
District Growth 2.184** 2.244***
(0.869) (0.494)
Constant 6.108*** 4.992*** 16.56*** 12.23*** 46.68** 64.10* 11.60*** 22.26 59.48
(1.187) (0.950) (5.021) (2.961) (21.99) (37.94) (3.068) (14.91) (43.65)
Observations 52 51 52 52 52 49 51 51 49
R-squared 0.135 0.151 0.130 0.269 0.324 0.414 0.338 0.380 0.479

146
Table H7: Predictors of English/Language Arts Teacher Supply (High School)
Notes: Robust standard errors in parentheses; *** p<0.01, ** p<0.05, * p<0.1. Constant: Small
districts, NW=Region 1, Rural. Mean unit of high school English language arts teacher supply =
6.78 (equivalent to ~7 applicants per vacancy). Overall mean unit of teacher supply = 5.12
(equivalent to ~5 applicants per vacancy).
(1) (2) (3) (4) (5) (6) (7) (8) (9)
VARIABLES
Enrollment
(Categorical) Urbanicity Region
Enrollment
& Region
Enrollment
& Region
(w/demo
controls)
Enrollment
& Region
(w/controls)
Region &
Urbanicity
Region &
Urbanicity
(w/demo
controls)
Region &
Urbanicity
(w/controls)
Small districts (< 1,500) - - - -
Midsize districts (1,500-3,500) 0.449 -0.254 -1.758 -2.600
(1.706) (1.448) (1.385) (2.026)
Large districts (> 3,500) 11.29** 10.96** 9.658* 6.988
(4.961) (4.744) (4.892) (7.955)
City (urbanicity 1) 6.663 7.154 10.61 9.197
(4.707) (4.615) (6.328) (7.306)
Suburb (urbanicity 2) 7.938* 9.066** 8.658* 7.274*
(4.062) (4.066) (4.558) (4.306)
Town (urbanicity 3) -1.083 -1.872* -1.255 -0.466
(1.263) (1.111) (1.318) (1.875)
Rural (urbanicity 4) - - - -
NW (Region 1) - - - - - - -
NE (Region 2) -3.102 -0.805 -0.168 -0.295 -1.338 -1.349 -1.029
(4.113) (2.898) (3.376) (3.939) (2.901) (3.347) (3.570)
Central (Region 3) -7.979** -8.660** -8.931** -7.408* -10.55** -10.72** -7.980*
(3.564) (3.452) (3.993) (4.239) (4.109) (4.352) (4.241)
SW (Region 4) -9.898*** -6.685*** -6.028** -6.617* -6.635*** -5.019* -5.001
(3.335) (1.977) (2.877) (3.498) (2.035) (2.579) (3.069)
SE (Region 5) -10.42*** -7.175*** -5.941* -5.484 -6.752*** -4.581* -4.106
(3.331) (1.963) (3.283) (3.788) (1.929) (2.644) (3.345)
District %FRL -11.87 -13.43 -5.435 -6.432
(8.397) (16.41) (10.42) (15.27)
District %White -0.711 -8.082 4.948 -4.209
(3.005) (6.993) (5.152) (7.699)
Educational Success 2.096 3.167
(3.199) (4.237)
Teacher Salary BA, 0-yrs (in 1,000s) -0.179 -0.142
(0.532) (0.534)
District Growth 0.642 0.440
(0.391) (0.286)
Constant 4.516*** 4.833*** 12.04*** 8.864*** 17.68*** 30.55 9.313*** 8.625 20.33
(0.765) (0.828) (3.312) (1.969) (5.685) (20.07) (2.164) (9.457) (20.33)
Observations 57 56 57 57 56 53 56 55 53
R-squared 0.228 0.133 0.203 0.395 0.428 0.447 0.337 0.404 0.445

147
Appendix I: Need Using Enrollment
Table I1: Predictors of Need: Log Enrollment and Categorical Enrollment
(1) (2) (3) (4) (1) (2) (3) (4)
VARIABLES
Enrollment
(Log)
Enrollment
& Region
(no
controls)
Enrollment
& Region
(w/demo
controls)
Enrollment
& Region
(w/all
controls)
Enrollment
(Categorical)
Enrollment
& Region
(no controls)
Enrollment &
Region
(w/demo
controls)
Enrollment
& Region
(w/all
controls)
Small districts (< 1,500) - - - -
Midsize districts (1,500-3,500) -0.013 -0.011 -0.007 0.002
(0.022) (0.019) (0.024) (0.018)
Large districts (> 3,500) -0.015 -0.049 -0.075* 0.014
(0.017) (0.035) (0.045) (0.028)
Enrollment (log) -0.023* -0.027* -0.032* -0.004
(0.012) (0.014) (0.018) (0.008)
NW (Region 1) - - - - - - - -
NE (Region 2) 0.009 0.004 0.010 0.012 0.004 0.010
(0.012) (0.012) (0.011) (0.012) (0.012) (0.011)
Central (Region 3) 0.117** 0.068** 0.009 0.123** 0.082** 0.015
(0.047) (0.030) (0.013) (0.052) (0.035) (0.016)
SW (Region 4) -0.001 -0.037 -0.010 0.004 -0.034 -0.011
(0.019) (0.025) (0.018) (0.020) (0.025) (0.018)
SE (Region 5) 0.050** -0.022 0.034* 0.053*** -0.022 0.028
(0.019) (0.037) (0.020) (0.019) (0.037) (0.020)
District %FRL 0.030 0.110** 0.071 0.067
(0.082) (0.050) (0.076) (0.069)
District %White -0.180** -0.062* -0.171** -0.066*
(0.078) (0.033) (0.076) (0.037)
Educational Success 0.002 0.001
(0.011) (0.012)
Teacher Salary BA, 0-yrs 0.000 -0.000
(0.000) (0.000)
District Growth 0.001 0.002
(0.002) (0.002)
Constant 0.282*** 0.279*** 0.448** 0.094 0.125*** 0.096*** 0.194** 0.195**
(0.094) (0.101) (0.217) (0.097) (0.014) (0.011) (0.096) (0.097)
Observations 186 186 185 173 186 186 185 178
R-squared 0.025 0.128 0.244 0.211 0.002 0.107 0.227 0.167
Using Log Enrollment Using Categorical Enrollment
Notes: Robust standard errors in parentheses; *** p<0.01, ** p<0.05, * p<0.1; Constant: Small districts, NW = Region 1, Rural. Mean unit of
need = 0.09 (equivalent to ~1 vacancy per 10 classroom positions).

148
Appendix J: Need by Subgroups Analyses
Need by School Level
Table J1: Predictors of Elementary Teacher Need
Notes: Robust standard errors in parentheses; *** p<0.01, ** p<0.05, * p<0.1. Constant: Small
districts, NW=Region 1, Rural. Mean unit of need for elementary teachers = 0.13 (equivalent to
~1 vacancy per 10 classroom positions). Overall mean unit of teacher need = 0.09 (equivalent to
~1 vacancy per 10 classroom positions).
(1) (2) (3) (4) (5) (6) (7) (8) (9)
VARIABLES
Enrollment
(Categorical) Urbanicity Region
Enrollment
& Region
Enrollment
& Region
(w/demo
controls)
Enrollment
& Region
(w/all
controls)
Region &
Urbanicity
Region &
Urbanicity
(w/demo
controls)
Region &
Urbanicity
(w/all
controls)
Small districts (< 1,500) - - - -
Midsize districts (1,500-3,500) -0.210* -0.204 -0.138 -0.116
(0.125) (0.130) (0.135) (0.173)
Large districts (> 3,500) -0.290** -0.331*** -0.287* -0.005
(0.117) (0.126) (0.154) (0.192)
City (urbanicity 1) 0.023 0.044 0.211 -0.084
(0.212) (0.192) (0.183) (0.228)
Suburb (urbanicity 2) -0.247* -0.240 -0.020 -0.022
(0.142) (0.145) (0.146) (0.253)
Town (urbanicity 3) -0.177 -0.169 -0.098 -0.060
(0.139) (0.133) (0.141) (0.162)
Rural (urbanicity 4) - - - -
NW (Region 1) - - - - - - -
NE (Region 2) -0.021 -0.023 -0.062 -0.060 -0.003 -0.033 -0.073
(0.272) (0.277) (0.297) (0.284) (0.283) (0.289) (0.267)
Central (Region 3) -0.057 0.018 0.021 -0.139 -0.084 -0.046 -0.122
(0.201) (0.197) (0.132) (0.103) (0.164) (0.122) (0.092)
SW (Region 4) -0.082 -0.098 -0.159 -0.102 -0.063 -0.073 -0.120
(0.190) (0.193) (0.207) (0.212) (0.201) (0.194) (0.201)
SE (Region 5) -0.120 -0.140 -0.228 -0.055 -0.069 -0.076 -0.074
(0.172) (0.177) (0.174) (0.138) (0.179) (0.142) (0.131)
District %FRL 0.661 0.995 1.024 1.105
(0.850) (1.358) (0.859) (1.298)
District %White -0.003 0.504 0.299 0.462
(0.405) (0.487) (0.427) (0.409)
Educational Success -0.128 -0.122
(0.277) (0.294)
Teacher Salary BA, 0-yrs (in 1,000s) -0.003 -0.001
(0.027) (0.029)
District Growth 0.049 0.050
(0.037) (0.038)
Constant 0.400*** 0.376*** 0.366** 0.439** 0.017 -0.542 0.403** -0.528 -0.619
(0.115) (0.129) (0.167) (0.187) (0.712) (1.247) (0.200) (0.731) (1.231)
Observations 185 184 185 185 184 176 184 183 176
R-squared 0.011 0.007 0.001 0.014 0.020 0.034 0.008 0.018 0.033

149
Table J2: Predictors of Middle School Teacher Need
Notes: Robust standard errors in parentheses; *** p<0.01, ** p<0.05, * p<0.1. Constant: Small
districts, NW=Region 1, Rural. Mean unit of need for middle school teachers = 0.1 (equivalent
to 1 vacancy per 10 classroom positions). Overall mean unit of teacher need = 0.09 (equivalent
to ~1 vacancy per 10 classroom positions).
(1) (2) (3) (4) (5) (6) (7) (8) (9)
VARIABLES
Enrollment
(Categorical) Urbanicity Region
Enrollment
& Region
Enrollment
& Region
(w/demo
controls)
Enrollment
& Region
(w/all
controls)
Region &
Urbanicity
Region &
Urbanicity
(w/demo
controls)
Region &
Urbanicity
(w/all
controls)
Small districts (< 1,500) - - - -
Midsize districts (1,500-3,500) -0.068* -0.067* -0.050 -0.057
(0.035) (0.036) (0.047) (0.056)
Large districts (> 3,500) -0.079** -0.075** -0.063 -0.012
(0.031) (0.033) (0.048) (0.058)
City (urbanicity 1) 0.018 0.039 0.072 0.037
(0.047) (0.047) (0.051) (0.070)
Suburb (urbanicity 2) -0.089** -0.077* -0.021 0.000
(0.039) (0.042) (0.047) (0.065)
Town (urbanicity 3) -0.038 -0.044 -0.026 -0.010
(0.047) (0.047) (0.051) (0.059)
Rural (urbanicity 4) - - - -
NW (Region 1) - - - - - - -
NE (Region 2) -0.020 -0.018 -0.026 -0.027 -0.013 -0.020 -0.031
(0.061) (0.062) (0.067) (0.065) (0.064) (0.065) (0.061)
Central (Region 3) -0.047 -0.030 -0.029 -0.057 -0.057 -0.044 -0.056*
(0.051) (0.051) (0.039) (0.037) (0.043) (0.036) (0.033)
SW (Region 4) -0.038 -0.040 -0.053 -0.053 -0.030 -0.032 -0.051
(0.073) (0.073) (0.083) (0.076) (0.072) (0.084) (0.075)
SE (Region 5) 0.002 0.000 -0.021 0.004 0.018 0.017 0.009
(0.055) (0.056) (0.056) (0.052) (0.058) (0.053) (0.052)
District %FRL 0.163 0.227 0.264 0.297
(0.280) (0.429) (0.238) (0.369)
District %White -0.006 0.046 0.075 0.080
(0.106) (0.135) (0.111) (0.103)
Educational Success -0.020 -0.018
(0.063) (0.067)
Teacher Salary BA, 0-yrs (in 1,000s) -0.003 -0.005
(0.008) (0.009)
District Growth 0.010 0.010
(0.011) (0.011)
Constant 0.170*** 0.159*** 0.165*** 0.184*** 0.082 0.113 0.172*** -0.067 0.078
(0.029) (0.030) (0.043) (0.047) (0.236) (0.486) (0.051) (0.190) (0.450)
Observations 185 185 185 185 184 176 185 184 176
R-squared 0.015 0.009 0.005 0.018 0.024 0.042 0.015 0.025 0.037

150
Table J3: Predictors of High School Teacher Need
Notes: Robust standard errors in parentheses; *** p<0.01, ** p<0.05, * p<0.1. Constant: Small
districts, NW=Region 1, Rural. Mean unit of need for high school teachers = 0.15 (equivalent to
~2 vacancies per 10 classroom positions). Overall mean unit of teacher need = 0.09 (equivalent
to ~1 vacancy per 10 classroom positions).
(1) (2) (3) (4) (5) (6) (7) (8) (9)
VARIABLES
Enrollment
(Categorical) Urbanicity Region
Enrollment
& Region
Enrollment
& Region
(w/demo
controls)
Enrollment
& Region
(w/all
controls)
Region &
Urbanicity
Region &
Urbanicity
(w/demo
controls)
Region &
Urbanicity
(w/all
controls)
Small districts (< 1,500) - - - -
Midsize districts (1,500-3,500) -0.151** -0.143** -0.096 -0.081
(0.062) (0.058) (0.074) (0.086)
Large districts (> 3,500) -0.220*** -0.276*** -0.250*** -0.041
(0.052) (0.073) (0.086) (0.103)
City (urbanicity 1) -0.001 -0.050 0.038 -0.076
(0.119) (0.116) (0.152) (0.122)
Suburb (urbanicity 2) -0.174*** -0.204*** -0.069 0.008
(0.059) (0.075) (0.077) (0.097)
Town (urbanicity 3) -0.081 -0.070 -0.033 0.009
(0.080) (0.074) (0.087) (0.091)
Rural (urbanicity 4) - - - -
NW (Region 1) - - - - - - -
NE (Region 2) -0.056 -0.060 -0.088 -0.098 -0.060 -0.080 -0.114
(0.096) (0.096) (0.107) (0.107) (0.101) (0.104) (0.104)
Central (Region 3) 0.029 0.092 0.106 -0.022 0.049 0.080 -0.006
(0.121) (0.119) (0.100) (0.087) (0.104) (0.093) (0.081)
SW (Region 4) -0.026 -0.041 -0.086 -0.122 -0.035 -0.051 -0.140
(0.132) (0.133) (0.157) (0.142) (0.134) (0.159) (0.143)
SE (Region 5) -0.041 -0.061 -0.125 -0.103 -0.036 -0.059 -0.123
(0.103) (0.106) (0.114) (0.097) (0.106) (0.108) (0.100)
District %FRL 0.488 0.377 0.676 0.514
(0.440) (0.758) (0.423) (0.676)
District %White -0.003 -0.086 0.142 -0.076
(0.189) (0.220) (0.233) (0.190)
Educational Success 0.021 0.024
(0.080) (0.087)
Teacher Salary BA, 0-yrs (in 1,000s) -0.032*** -0.033**
(0.012) (0.014)
District Growth 0.027 0.030
(0.018) (0.019)
Constant 0.331*** 0.304*** 0.294*** 0.351*** 0.040 1.247 0.326*** -0.240 1.174
(0.049) (0.048) (0.088) (0.098) (0.349) (0.794) (0.105) (0.364) (0.751)
Observations 185 185 185 185 184 176 185 184 176
R-squared 0.033 0.011 0.004 0.044 0.063 0.084 0.016 0.043 0.082

151
Need by Subject Area
Table J4: Predictors of Math & Science Teacher Need (Middle School)
Notes: Robust standard errors in parentheses; *** p<0.01, ** p<0.05, * p<0.1. Constant: Small
districts, NW=Region 1, Rural. Mean unit of middle school math & science teacher need = 0.08
(equivalent to ~1 vacancy per 10 classroom positions). Overall mean unit of teacher need = 0.09
(equivalent to ~1 vacancy per 10 classroom positions).
(1) (2) (3) (4) (5) (6) (7) (8) (9)
VARIABLES
Enrollment
(Categorical) Urbanicity Region
Enrollment
& Region
Enrollment
& Region
(w/demo
controls)
Enrollmen
t & Region
(w/all
controls)
Region &
Urbanicity
Region &
Urbanicity
(w/demo
controls)
Region &
Urbanicity
(w/all
controls)
Small districts (< 1,500) - - - -
Midsize districts (1,500-3,500) -0.006 -0.015 -0.002 -0.022
(0.043) (0.043) (0.040) (0.043)
Large districts (> 3,500) -0.028 -0.005 -0.017 0.009
(0.027) (0.034) (0.045) (0.049)
City (urbanicity 1) 0.025 0.062 0.036 0.037
(0.046) (0.044) (0.053) (0.062)
Suburb (urbanicity 2) -0.100*** -0.078** -0.060 -0.049
(0.028) (0.033) (0.047) (0.046)
Town (urbanicity 3) -0.013 -0.042 -0.053 -0.047
(0.036) (0.035) (0.039) (0.039)
Rural (urbanicity 4) - - - -
NW (Region 1) - - - - - - -
NE (Region 2) 0.063 0.065* 0.053 0.053 0.075* 0.064* 0.057
(0.038) (0.039) (0.038) (0.039) (0.039) (0.038) (0.038)
Central (Region 3) 0.030 0.031 0.026 0.001 0.014 0.009 -0.009
(0.039) (0.044) (0.039) (0.038) (0.037) (0.037) (0.037)
SW (Region 4) 0.018 0.020 -0.018 -0.013 0.030 -0.004 -0.006
(0.050) (0.052) (0.056) (0.057) (0.053) (0.056) (0.061)
SE (Region 5) 0.166*** 0.167*** 0.115* 0.130* 0.185*** 0.139** 0.140*
(0.058) (0.057) (0.065) (0.067) (0.059) (0.066) (0.072)
District %FRL 0.217* 0.233 0.187 0.194
(0.123) (0.165) (0.134) (0.160)
District %White -0.060 -0.019 -0.060 -0.017
(0.086) (0.101) (0.093) (0.112)
Educational Success -0.014 -0.018
(0.034) (0.035)
Teacher Salary BA, 0-yrs (in 1,000s) -0.001 0.000
(0.006) (0.005)
District Growth -0.003 -0.005
(0.005) (0.006)
Constant 0.126*** 0.126*** 0.075*** 0.077*** -0.009 -0.025 0.077*** 0.016 -0.022
(0.020) (0.023) (0.019) (0.022) (0.134) (0.263) (0.024) (0.146) (0.256)
Observations 151 151 151 151 150 143 151 150 143
R-squared 0.002 0.015 0.074 0.075 0.108 0.142 0.101 0.127 0.155

152
Table J5: Predictors of Math & Science Teacher Need (High School)
Notes: Robust standard errors in parentheses; *** p<0.01, ** p<0.05, * p<0.1. Constant: Small
districts, NW=Region 1, Rural. Mean unit of high school math & science teacher need = 0.14
(equivalent to 1 vacancy per 10 classroom positions). Overall mean unit of teacher need = 0.09
(equivalent to ~1 vacancy per 10 classroom positions).
(1) (2) (3) (4) (5) (6) (7) (8) (9)
VARIABLES
Enrollment
(Categorical) Urbanicity Region
Enrollment
& Region
Enrollment
& Region
(w/demo
controls)
Enrollment
& Region
(w/all
controls)
Region &
Urbanicity
Region &
Urbanicity
(w/demo
controls)
Region &
Urbanicity
(w/all
controls)
Small districts (< 1,500) - - - -
Midsize districts (1,500-3,500) -0.248*** -0.263*** -0.254*** -0.223**
(0.081) (0.086) (0.092) (0.100)
Large districts (> 3,500) -0.292*** -0.375*** -0.446*** -0.238
(0.076) (0.106) (0.148) (0.170)
City (urbanicity 1) -0.081 -0.149 -0.463 -0.465
(0.150) (0.145) (0.281) (0.297)
Suburb (urbanicity 2) -0.322*** -0.376*** -0.444** -0.402**
(0.105) (0.114) (0.188) (0.180)
Town (urbanicity 3) -0.257*** -0.269*** -0.387*** -0.324**
(0.087) (0.087) (0.148) (0.145)
Rural (urbanicity 4) - - - -
NW (Region 1) - - - - - - -
NE (Region 2) 0.141 0.146 0.122 0.104 0.149 0.115 0.082
(0.149) (0.154) (0.143) (0.148) (0.151) (0.133) (0.138)
Central (Region 3) 0.247* 0.336** 0.290* 0.189 0.285** 0.240 0.150
(0.145) (0.148) (0.153) (0.179) (0.141) (0.155) (0.174)
SW (Region 4) 0.051 0.061 -0.054 -0.104 0.055 -0.124 -0.191
(0.125) (0.126) (0.157) (0.179) (0.132) (0.187) (0.209)
SE (Region 5) 0.146 0.129 -0.052 -0.048 0.195 -0.072 -0.117
(0.110) (0.116) (0.196) (0.212) (0.119) (0.224) (0.243)
District %FRL 0.399 -0.051 0.295 -0.087
(0.339) (0.558) (0.341) (0.570)
District %White -0.331 -0.558 -0.622 -0.792
(0.304) (0.466) (0.457) (0.577)
Educational Success 0.039 0.007
(0.130) (0.128)
Teacher Salary BA, 0-yrs (in 1,000s) -0.045** -0.040**
(0.018) (0.016)
District Growth 0.019 0.019
(0.021) (0.022)
Constant 0.464*** 0.465*** 0.269*** 0.352*** 0.385 2.358** 0.354*** 0.746 2.479**
(0.072) (0.078) (0.071) (0.080) (0.347) (1.086) (0.088) (0.535) (1.105)
Observations 153 153 153 153 152 144 153 152 144
R-squared 0.041 0.037 0.021 0.075 0.106 0.105 0.064 0.115 0.132

153
Table J6: Predictors of English/Language Arts & Social Studies Teacher Need (Middle School)
Notes: Robust standard errors in parentheses; *** p<0.01, ** p<0.05, * p<0.1. Constant: Small
districts, NW=Region 1, Rural. Mean unit of middle school English language arts & social
studies teacher need = 0.06 (equivalent to ~1 vacancy per 10 classroom positions). Overall mean
unit of teacher need = 0.09 (equivalent to ~1 vacancy per 10 classroom positions).
(1) (2) (3) (4) (5) (6) (7) (8) (9)
VARIABLES
Enrollment
(Categorical) Urbanicity Region
Enrollment
& Region
Enrollment
& Region
(w/demo
controls)
Enrollment
& Region
(w/all
controls)
Region &
Urbanicity
Region &
Urbanicity
(w/demo
controls)
Region &
Urbanicity
(w/all
controls)
Small districts (< 1,500) - - - -
Midsize districts (1,500-3,500) -0.001 0.003 0.020 0.012
(0.030) (0.029) (0.029) (0.033)
Large districts (> 3,500) -0.026 -0.045 -0.036 0.006
(0.027) (0.033) (0.038) (0.048)
City (urbanicity 1) 0.037 0.025 0.039 0.022
(0.040) (0.043) (0.048) (0.060)
Suburb (urbanicity 2) -0.070** -0.073** -0.043 -0.024
(0.031) (0.037) (0.043) (0.052)
Town (urbanicity 3) -0.022 -0.024 -0.015 -0.007
(0.029) (0.030) (0.029) (0.031)
Rural (urbanicity 4) - - - -
NW (Region 1) - - - - - - -
NE (Region 2) -0.036 -0.039 -0.046 -0.042 -0.030 -0.034 -0.038
(0.038) (0.038) (0.041) (0.040) (0.039) (0.040) (0.039)
Central (Region 3) 0.014 0.025 0.032 0.004 0.010 0.019 -0.001
(0.044) (0.045) (0.041) (0.045) (0.043) (0.042) (0.045)
SW (Region 4) -0.015 -0.018 -0.033 -0.023 -0.011 -0.014 -0.017
(0.054) (0.055) (0.061) (0.066) (0.057) (0.064) (0.069)
SE (Region 5) 0.007 0.002 -0.017 0.012 0.016 0.012 0.019
(0.049) (0.050) (0.055) (0.058) (0.051) (0.057) (0.060)
District %FRL 0.176 0.194 0.153 0.149
(0.117) (0.193) (0.122) (0.191)
District %White 0.013 0.034 0.041 0.036
(0.078) (0.106) (0.083) (0.111)
Educational Success 0.016 0.013
(0.056) (0.059)
Teacher Salary BA, 0-yrs (in 1,000s) -0.003 -0.003
(0.006) (0.006)
District Growth 0.000 -0.000
(0.006) (0.006)
Constant 0.099*** 0.100*** 0.104*** 0.109*** -0.017 0.044 0.108*** -0.027 0.066
(0.020) (0.022) (0.032) (0.034) (0.114) (0.263) (0.037) (0.125) (0.260)
Observations 150 150 150 150 149 142 150 149 142
R-squared 0.002 0.017 0.012 0.018 0.031 0.024 0.025 0.033 0.026

154
Table J7: Predictors of English/Language Arts Teacher Need (High School)
Notes: Robust standard errors in parentheses; *** p<0.01, ** p<0.05, * p<0.1. Constant: Small
districts, NW=Region 1, Rural. Mean unit of high school English language arts teacher need =
0.12 (equivalent to 1 vacancy per 10 classroom positions). Overall mean unit of teacher need =
0.09 (equivalent to ~1 vacancy per 10 classroom positions).
(1) (2) (3) (4) (5) (6) (7) (8) (9)
VARIABLES
Enrollment
(Categorical) Urbanicity Region
Enrollment
& Region
Enrollment
& Region
(w/demo
controls)
Enrollment
& Region
(w/all
controls)
Region &
Urbanicity
Region &
Urbanicity
(w/demo
controls)
Region &
Urbanicity
(w/all
controls)
Small districts (< 1,500) - - - -
Midsize districts (1,500-3,500) -0.175** -0.171** -0.072 -0.079
(0.082) (0.081) (0.075) (0.083)
Large districts (> 3,500) -0.255*** -0.387*** -0.299** -0.230
(0.072) (0.134) (0.122) (0.166)
City (urbanicity 1) 0.040 -0.073 0.034 -0.081
(0.126) (0.191) (0.217) (0.224)
Suburb (urbanicity 2) 0.152 0.129 0.340 0.379
(0.366) (0.395) (0.400) (0.418)
Town (urbanicity 3) -0.141 -0.160* -0.083 -0.056
(0.086) (0.092) (0.100) (0.104)
Rural (urbanicity 4) - - - -
NW (Region 1) - - - - - - -
NE (Region 2) -0.067 -0.069 -0.081 -0.076 -0.057 -0.066 -0.088
(0.100) (0.104) (0.106) (0.110) (0.102) (0.102) (0.109)
Central (Region 3) 0.214 0.321 0.400* 0.321 0.220 0.348 0.277
(0.177) (0.195) (0.213) (0.229) (0.221) (0.224) (0.218)
SW (Region 4) -0.041 -0.038 -0.065 -0.034 -0.015 -0.009 -0.030
(0.115) (0.115) (0.126) (0.130) (0.112) (0.125) (0.130)
SE (Region 5) 0.164 0.138 0.125 0.196 0.214 0.235 0.230
(0.174) (0.178) (0.209) (0.221) (0.183) (0.214) (0.224)
District %FRL 0.961*** 0.879** 1.258*** 1.221**
(0.332) (0.437) (0.389) (0.471)
District %White 0.211 0.412 0.396 0.493
(0.239) (0.341) (0.295) (0.391)
Educational Success -0.072 -0.055
(0.098) (0.095)
Teacher Salary BA, 0-yrs (in 1,000s) 0.007 -0.005
(0.016) (0.017)
District Growth 0.003 0.003
(0.020) (0.019)
Constant 0.373*** 0.329*** 0.268*** 0.336*** -0.490 -0.817 0.298*** -0.884** -0.758
(0.067) (0.068) (0.080) (0.089) (0.359) (0.852) (0.080) (0.430) (0.862)
Observations 147 147 147 147 146 140 147 146 140
R-squared 0.031 0.018 0.038 0.089 0.124 0.108 0.056 0.121 0.122

155
Appendix K: Approved IRB
K1: Institutional Review Board Approval

156
K2: IRB Protocol

157
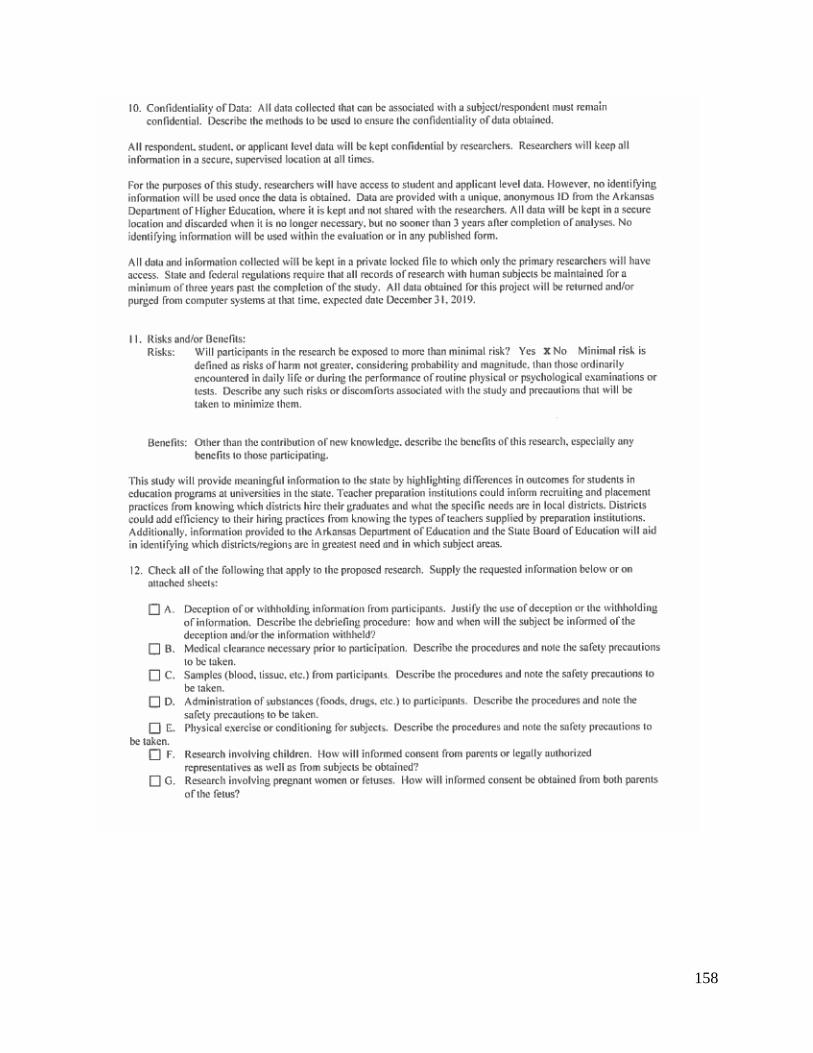
158

159

160

161

162

163

164

165

166

167

168
K3: Data Share Agreement - Arkansas Dept. of Higher Education and University of Arkansas

169

170

171

172

173

174

175

176
Appendix L: Approved Protocols
L1: Protocol for Initial District Interviews for Survey Development

177
L2: Protocol for Survey Participation

178
L3: Protocol for Interviews with Teacher Preparation Programs

179
Appendix M: Instruments
Interviews
M1: Districts’ Interview Questions for Survey Development

180

181

182
M2: Teacher Preparation Programs’ Interview Questions
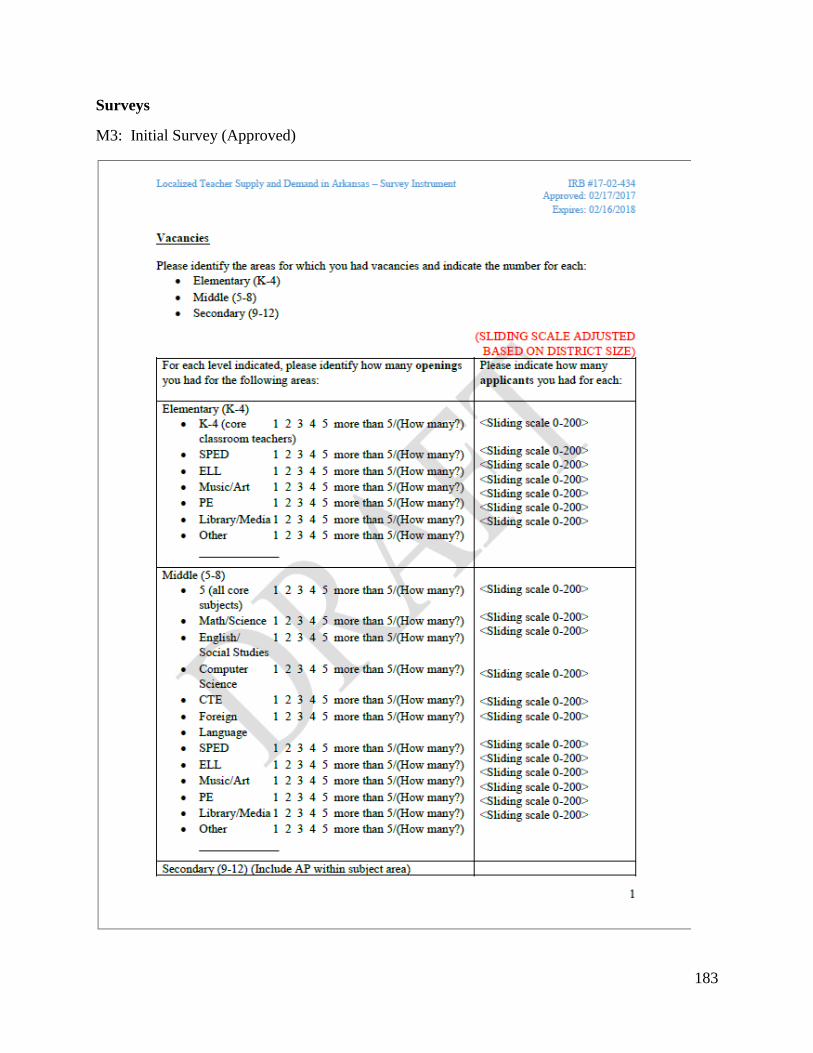
183
Surveys
M3: Initial Survey (Approved)

184

185

186

187

188

189
M4: Actual District Survey

190

191

192

193

194

195

196

197

198

199

200

201

202

203

204

205

206

207
M5: Actual Short Survey

208

209

210