logan airport health study - mass.gov · web viewin the early stages of design of the lahs, the...
TRANSCRIPT

Logan Airport Health Study
May 2014
Massachusetts Department of Public Health Bureau of Environmental Health

TABLE OF CONTENTS
EXECUTIVE SUMMARY........................................................................................................................ 1
1 PROJECT OVERVIEW.................................................................................................................... 1
1.1 BACKGROUND.................................................................................................................................................... 11.2 GOALS AND OBJECTIVES..................................................................................................................................3
2 SUMMARY OF HEALTH EFFECTS ASSOCIATED WITH EXPOSURE TO AIRPORT-RELATED AIR POLLUTANTS AND NOISE...............................................................................5
2.1 INTRODUCTION................................................................................................................................................. 52.2 SUMMARY OF HEALTH STUDIES OF AIR POLLUTION................................................................................62.3 HEALTH EFFECTS ASSOCIATED WITH EXPOSURE TO NOISE.................................................................17
3 HEALTH SURVEY DESIGN AND METHODS..........................................................................23
3.1 STUDY AREA AND SAMPLE POPULATION..................................................................................................233.2 DESIGN OF THE SURVEY INSTRUMENT......................................................................................................263.3 SURVEY ADMINISTRATION...........................................................................................................................28
4 ENVIRONMENTAL ASSESSMENT OF AIR POLLUTANTS AND NOISE ASSOCIATED WITH LOGAN AIRPORT OPERATIONS.................................................................................31
4.1 OVERVIEW...................................................................................................................................................... 314.2 AIR DISPERSION MODELING ANALYSIS OF 2005 AIRPORT EMISSIONS.............................................314.3 AIR POLLUTION EXPOSURE CATEGORIZATION.........................................................................................434.4 CONSIDERATION OF NON-AIRPORT RELATED BACKGROUND AIR POLLUTION.................................474.5 EXPOSURE TO NOISE ASSOCIATED WITH AIRPORT OPERATIONS........................................................49
5 DATA ANALYSIS.......................................................................................................................... 53
5.1 OVERVIEW...................................................................................................................................................... 535.2 SURVEY DATA PREPARATION......................................................................................................................535.3 HEALTH OUTCOME DEFINITIONS...............................................................................................................565.4 COVARIATE DEFINITIONS AND CLASSIFICATIONS....................................................................................585.5 STATISTICAL ANALYSES............................................................................................................................... 59
6 RESULTS........................................................................................................................................ 63
6.1 SURVEY RESPONSE RATES...........................................................................................................................636.2 POPULATION CHARACTERISTICS.................................................................................................................646.3 DISEASE BURDEN IN THE TOTAL STUDY AREA.......................................................................................686.4 CRUDE UNIVARIATE RESULTS: PREVALENCE OF HEALTH OUTCOMES BY AIRPORT-RELATED AIR
POLLUTION EXPOSURE AREAS....................................................................................................................716.5 ADJUSTED MULTIVARIATE REGRESSION MODELS: ASSOCIATIONS BETWEEN ADVERSE HEALTH
EFFECTS AND AIR POLLUTION EXPOSURE AREAS...................................................................................75

6.6 ADJUSTED MULTIVARIATE REGRESSION MODELS: ASSOCIATIONS BETWEEN AUDITORY HEALTH EFFECTS AND NOISE EXPOSURE AREAS....................................................................................................82
7 DISCUSSION.................................................................................................................................. 85
8 CONCLUSIONS AND RECOMMENDATIONS.......................................................................103
9 REFERENCES............................................................................................................................. 105
10 APPENDICES FOR LOGAN AIRPORT HEALTH STUDY...................................................121
LIST OF TABLES
Table 4-1. Emissions Inventory for Logan Airport, 2005 (kg/year)...............................................34
Table 4-2. Summary of Annual Average Air Pollutant Concentrations ( g/mμ 3) from Air Dispersion Modeling of 2005 Airport Operations....................................................................................38
Table 4-3. Annual Average Concentrations for NOx and PM2.5 Across the Study Area for the Major Source Categories at Logan Airport...................................................................................................41
Table 4-4. Spearman Correlations of LAHS Annual Average Pollutant Concentrations from Air Dispersion Modeling...................................................................................................................................... 44
Table 4-5. Range of Modeled Air Pollutant Concentrations Associated with the High, Medium, and Low Exposure Categories for Each Pollutant.................................................................45
Table 6-1. Basic Demographic Characteristics for the 6072 Adult Participants of the Logan Airport Health Study (LAHS) Survey, Study Area Population, and Statewide.............................65
Table 6-2. Basic Demographic Characteristics of the 2215 Child Participants of the Logan Airport Health Study (LAHS) Survey, for the LAHS study Area, and for the State Population......................................................................................................................................................................................... 67
Table 6-3. Prevalence Estimates of Respiratory and Cardiovascular Diseases Among Adults in the Logan Airport Health Study Area (2005)........................................................................................69
Table 6-4. Prevalence Estimates of Respiratory Disease Among Children in the Logan Airport Health Study Area (2005)...................................................................................................................71
Table 6-5. Prevalence Estimates of Respiratory and Cardiovascular Diseases Among Adults by Category of Modeled Airport-related Air Pollution Exposure in the Logan Airport Health Study Area (2005).................................................................................................................................................. 73

Table 6-6. Prevalence Estimates of Respiratory Disease Among Children by Category of Modeled Airport-related Air Pollution Exposure in the Logan Airport Health Study Area (2005).......................................................................................................................................................................... 74
Table 6-7. Estimated Exposure to Airport-related Air Pollution and Adjusted Odds of Respiratory and Cardiovascular Disease Among Adults Living in the Logan Airport Health Study Area (2005).................................................................................................................................................. 76
Table 6-8. Estimated Exposure to Airport-related Air Pollution and Odds of Respiratory and Cardiovascular Disease Among Adults Living in the Logan Airport Health Study Area Who Have Resided in their Respective Exposure Area for at least 1, 3, 5, or 10 years...........79
Table 6-9. Estimated Exposure to Airport-related Air Pollution and Adjusted Odds of Respiratory Disease Among Children in the Logan Airport Health Study Area (2005)..........81
Table 6-10. Estimated Exposure to Airport-related Noise and Adjusted Odds of Auditory Impairment Among Adults and Children Living in the Logan Airport Health Study Area (2005).......................................................................................................................................................................... 83
LIST OF FIGURES
Figure 3-1. The Logan Airport Health Study Area...................................................................................24
Figure 4-1. Wind rose from weather station at Logan Airport – 2005..........................................36
Figure 4-2. Modeling Domain for the LAHS...............................................................................................39
Figure 4-3. Normalized Annual Average Concentrations for NOx and PM2.5...............................40
Figure 4-4. Relative Contribution of Predicted NOx and PM2.5 Air Pollutant Concentrations Associated with Logan Airport......................................................................................................................... 42
Figure 4-5. Estimated Exposure Areas Based on Assigning High, Medium, and Low Exposure Areas to Respondents...................................................................................................................... 46
Figure 4-6. Two hundred (200) Meter Buffer of Roads with Average Daily Traffic of 20,000 Vehicles or More......................................................................................................................................................49
Figure 4-7. Massport DNL Contours for 2005 Operations at Logan Airport...............................52


EXECUTIVE SUMMARY
Background
Chapter 159 of the Acts of 2000 included a line item directive that stated “the
Director of the Bureau of Environmental Health Assessment [presently named the Bureau of
Environmental Health] of the department shall conduct an environmental risk assessment of
the health impacts of the General Lawrence Logan Airport in the East Boston section of the
city of Boston on any community that is located within a 5 mile radius of the airport and is
potentially impacted by the airport.” The 17 communities located either fully or partially
within the five-mile radius of the airport include Boston, Brookline, Cambridge, Chelsea,
Everett, Hull, Lynn, Malden, Medford, Melrose, Milton, Nahant, Quincy, Revere, Saugus,
Somerville, and Winthrop. Based upon this directive the Massachusetts Department of
Public Health, Bureau of Environmental Health (MDPH/BEH) designed and conducted the
Logan Airport Health Study (LAHS).
In the early stages of design of the LAHS, the MDPH/BEH formed a Community
Advisory Committee (CAC) composed of area residents, local health officials and technical
experts in the areas of epidemiology, biostatistics, survey design and administration, and
air modeling. With input from the CAC, the MDPH/BEH designed and implemented a cross-
sectional disease and symptom prevalence study that investigated the associations
between opportunities for exposure to airport emissions and adverse health outcomes.
Environmental exposure data included noise and air emissions. Air pollution emissions are
primarily from aircraft operations, ground service equipment, transportation vehicles on
airport property, and the airport power plant. The primary source of noise from the
airport is that of aircraft takeoff and landing operations. Three categories of health
outcomes were evaluated: respiratory, cardiovascular, and auditory effects.
ES-1

Surveyed population and health questionnaire
Following a pilot study aimed to test survey methods initiated in 2002, interviews
for the LAHS commenced in 2005. A total of 6,072 eligible residents representing
households from the 17 communities that make up the study area were interviewed. These
adult respondents also provided information for 2,215 children living in those respective
households. Therefore, the results of the LAHS represent information for 8,287 individuals
living within five miles of Logan Airport. The telephone interviews, conducted in English
and Spanish, collected information on the prevalence of targeted health outcomes as well
as relevant demographic and risk factor information. Information was collected for one
adult in each of the interviewed households and for any children aged 3-17 years.
Study participants were selected randomly so that the survey results could be
considered representative of the study area. A strategy was also employed to oversample
residents living closest to the airport to ensure an adequate sample size representing those
with the highest potential exposure. Statistical weighting methods were then employed to
account for the oversampling.
Modeled after nationally and internationally recognized health surveys, including
the Behavioral Risk Factor Surveillance System (BRFSS) and the International Study of
Asthma and Allergies in Childhood (ISAAC), the LAHS survey contained questions designed
to assess the following categories of asthma and respiratory disease: lifetime asthma,
current asthma, current asthma with medication use, probable asthma, asthma
hospitalizations, and chronic obstructive pulmonary disease (COPD). Cardiovascular
outcomes included non-fatal heart attack, angina, and coronary heart disease. Auditory
effects included adult-onset hearing impairment and tinnitus. In addition to assessing the
presence of health outcomes, the survey also included questions on risk factors associated
with the targeted health outcomes, on potential exposures inside the home and at work,
and questions reflecting demographic and socio-economic status. A ten-year residential
ES-2

history was also taken in order to provide some measure of each respondent’s length of
residency in the area.
Exposure assessment: Air pollutants
Air pollutant emissions typically associated with airport operations are largely due
to incomplete combustion of fuel from aircraft, ground service equipment, and passenger
automobiles on airport property. To estimate potential air pollution exposure specifically
from airport-related operations (and thereby exclude possible exposure from non-airport
related sources), advanced high-resolution air dispersion modeling (US FAA EDMS model
version 5.1.3) was applied to predict ambient concentrations across the study area of five
primary air pollutants (CO, NOx, PM2.5, SOx, VOCs). The air dispersion modeling was based
on 2005 emissions data, meteorological inputs, and aircraft takeoff and landing
information for over 350,000 aircraft operations (94% of total 2005 operations). The
modeling analysis also estimated emissions along flight paths up to an altitude of 3000 feet
for takeoffs and landings. Data on emissions and airport operations were provided by
Massport.
Using ArcGIS to map the 6,072 households included in the study, air pollutant
concentrations were assigned to each respondent based on inverse-distance weighting of
concentrations predicted from the air dispersion modeling. Given the very high correlation
of estimated concentrations of the five pollutants across the study area, a combined
exposure variable was developed that encompassed all pollutants. Annual average
pollutant concentrations were selected for developing cut-points for the creation of three
exposure areas estimating low, medium, and high potentials for exposure to airport-related
air pollution.
Exposure assessment: Noise
MDPH/BEH also evaluated noise exposure across the study area using noise
contours from aircraft operations provided by Massport. Using US FAA’s Integrated Noise
Model (INM), Massport models noise by considering the number of operations, types of
ES-3

aircraft operating during the day and night, use of runway configurations, and location and
frequency of flight paths to and from the runways. Massport produces annual Day-Night
Sound Level (DNL) contours that range from 60-75 dBA at five dB increments. The WHO
health-based guideline to protect against hearing impairment is 70 dBA. This guideline
value indicates that the risk for hearing impairment would be negligible for a cumulative
noise exposure below 70 dBA on a daily basis over a lifetime. Review of the 2005 INM
noise contours indicated that the 70 dBA contour did not include a sufficient number of
respondents to assign as the high noise exposure category. As a result, the 65 dBA contour
was selected as the high noise exposure area. The medium noise exposure area was
defined by households located in the 60-64 dBA noise contour and the low noise exposure
area was defined by households located outside the 60dBA noise contour.
Statistical analysis
All analyses were conducted using SUDAAN, a statistical package designed for use
with complex sampling methodologies, which incorporates weighting and variance
calculations associated with the complex random digit dialing (RDD) sample design.
Descriptive analyses were conducted separately for adults and children to assess the
frequencies (percent of the population) with various socio-demographic characteristics.
The prevalence of other potential factors (covariates) that may be associated with each
specific outcome among adults and children were also estimated. The prevalence of each
health outcome of interest was examined in the total population and among those living in
each category of estimated airport-related air pollution or noise exposure.
Multivariate analysis (multiple logistic regression) was used to assess the
association between the prevalence of targeted health outcomes and residence in low,
medium, or high exposure areas while accounting for the impact of other potentially
influential factors (confounders). Controlling for other factors known to be strong
predictors of the health outcome being investigated is a statistical method to evaluate the
association of interest, while adjusting for differences across exposure areas for other risk
ES-4

factors such as age, race, smoking status, family history of heart disease, or residential
proximity to major roadways.
Results / Conclusions
The major conclusions of the Logan Airport Health Study are as follows:
Air dispersion modeling of airport related emissions using a state-of-the-art model indicates that the highest predicted pollutant concentrations associated with airport-related operations are near the perimeter of Logan Airport and fall off rapidly with increased distance. This is a characteristic of the impact of sources that are primarily located near the ground surface.
Consistent with findings of other airport studies, modeled concentrations of air pollutants are low relative to measured background air pollution concentrations.
Evaluation of associations between airport-related pollutant concentrations and targeted health outcomes among the study area population detected some elevations in respiratory health outcomes in the high exposure area.
Specifically:
Among children, study results identified some respiratory effects indicative of undiagnosed asthma (i.e., probable asthma); children in the high exposure area were estimated to have three to four times the likelihood of this respiratory outcome compared with children in the low exposure area.
Among adult residents, individuals diagnosed with chronic obstructive pulmonary disease (COPD) were statistically significantly more likely to have lived in the high exposure area for three or more years.
There were no statistically significant differences in cardiovascular outcomes in the study population across the high, medium, and low exposure areas.
ES-5

There were no statistically significant differences with respect to hearing loss in either adults or children for those living in the high exposure area compared to the lowest exposure area.
Recommendations
The results of this study should be reviewed by Massport and others to determine mitigating steps that can be taken across the study area.
Massport has undertaken initiatives to reduce air pollution impacts within their control (e.g., providing infrastructure for compressed natural gas (CNG) fuels and electricity charging stations, Alternative Fuel Vehicle Program). Similar initiatives could be considered in consultation with local communities that would serve to further reduce the burden of indoor and outdoor sources of air pollution on residents in closest proximity to the airport.
Massport has also been working with the East Boston Neighborhood Health Center (EBNHC) to address workforce issues among Massport employees. Massport could expand these efforts with the EBNHC as well as other community health centers to better address respiratory health notably among children in closest proximity to the airport.
While air dispersion modeling indicates that the contribution from Logan Airport operations across the study area is relatively small, air pollution levels are higher in urban areas. Predicted pollutant concentrations were higher near the perimeter of the airport; thus, any methods that can be implemented to continue to reduce airport-related air pollution should be explored.
MDPH/BEH should work with communities within the high exposure area (in whole or in part) on initiatives that would serve to further reduce exacerbation of pre-existing respiratory diseases (e.g., asthma and COPD) among residents.
Specifically:
• MDPH/BEH will continue to support MassDEP’s efforts to reduce motor vehicle emissions including implementation of the Low Emissions Vehicle program and diesel engine retrofit initiatives;
• Upon request MDPH/BEH’s Indoor Air Quality (IAQ) Program staff will work with local municipalities to conduct IAQ assessments in schools and public buildings;
ES-6

• Upon request MDPH will work with local officials to address concerns that may be associated with local development initiatives;
• MDPH/BEH will collaborate with the MDPH Bureau of Community Health and Prevention’s Tobacco Cessation and Prevention Program on their efforts to work with local boards of health and tobacco-free community partnerships. These efforts enforce youth access and secondhand smoking laws and provide educational/outreach resources to support smoke-free workplace and housing programs.
ES-7

1 PROJECT OVERVIEW
1.1 BACKGROUND
The Acts of 2000 of the Massachusetts General Court included a line item directive
that stated “the Director of the Bureau of Environmental Health Assessment [presently
named the Bureau of Environmental Health] of the department shall conduct an
environmental risk assessment of the health impacts of the General Lawrence Logan Airport
in the East Boston section of the city of Boston on any community that is located within a 5
mile radius of the airport and is potentially impacted by the airport.” Given the economic
instability, the study has had varying levels of resources over the past decade. Despite
irregular funding, the Massachusetts Department of Public Health, Bureau of
Environmental Health (MDPH/BEH) conducted the Logan Airport Health Study (LAHS) to
respond to that directive.
In the early stages of design of the LAHS, the MDPH/BEH formed a Community
Advisory Committee (CAC) composed of residents, local health departments in the study
area, and technical experts in the areas of epidemiology, biostatistics, survey design and
administration, and air modeling. With input and assistance from the CAC, the MDPH/BEH
designed and implemented a cross-sectional disease and symptom prevalence study
investigating associations between potential exposure to airport emissions and adverse
health outcomes among residents living in cities and towns located within a 5-mile radius
of Logan Airport.
In order to address some of the challenges associated with conducting such a large
prevalence study and to ensure the survey design would be sophisticated enough to detect
an effect, if present, MDPH/BEH conducted a pilot study beginning in 2002. The draft
survey instrument was pilot tested with a population living near an airport in Portland,
Maine to improve the survey instrument. The refined survey instrument was again pilot
tested in 2005 with 25 randomly selected individuals located in the LAHS area to ensure
questions were clear and valid for the study area itself.
1

MDPH/BEH considered the potential health impacts on local communities of both
noise and air emissions from Logan Airport. Air pollution sources at the airport include
aircraft (takeoff, landing, taxiing, and use of auxiliary power units), ground service
equipment, passenger and commercial motor vehicle fleets operating and parking on
airport property, and the airport power plant. The primary source of noise from the
airport is that of aircraft takeoff and landing operations. After review of the scientific
literature on the health effects most frequently associated with exposure to the types of
emissions typical of airports, MDPH/BEH identified respiratory, cardiovascular, and
auditory effects as those of greatest potential public health significance. These outcomes
also appeared to be of greatest interest to residents within the five mile study area.
MDPH/BEH gathered available environmental data in the study area related to
airport operations. These included available ambient air quality monitoring data within
the 5-mile radius of the airport (e.g., the Massachusetts Department of Environmental
Protection–mandated monitoring stations for criteria air pollutants). Additionally,
MDPH/BEH acquired an abundance of data provided by Massport that is not mandated to
be reported such as complete flight path and scheduling information and detailed airport
maps.
To address both the complexity in assessing environmental impacts of airport
operations and any existing data gaps, MDPH/BEH designed a cross-sectional study to
collect information on the prevalence of targeted health outcomes and various
demographic and risk factor characteristics among residents living in the designated 5-mile
radius study area. In addition, MDPH/BEH utilized available environmental and airport
operations data to develop estimates of airport-related air pollution and noise exposure
across the study area, thus allowing for an evaluation of the possible relationships between
targeted health outcomes and these exposure opportunities.
2

1.2 GOALS AND OBJECTIVES
The overall goal of the Logan Airport Health Study was to determine whether
residents living in areas with greater potential for airport-related exposures were more
likely to experience respiratory, cardiovascular, or auditory effects compared to those
residents living in areas with lesser potential for airport-related exposures.
The primary objectives were:
To geographically stratify the study area into distinct exposure areas based
on the best available data for predicting ambient concentrations of air
pollution and noise associated with operations at Logan Airport.
To collect information on specific health outcomes (i.e., respiratory,
cardiovascular, and auditory endpoints) and other relevant information from
a statistically representative sample of residents in the study area
population.
To evaluate associations between environmental exposures arising from
airport operations and targeted health outcomes among the study
population.
To meet these objectives, four major activities were carried out:
A draft health survey was pilot-tested with a population living near an
airport in Portland, Maine in April 2002 – April 2005.
Based on the findings of the survey pilot study, a refined survey instrument
was administered to residents within a 5-mile radius of Logan Airport to
collect health outcome and relevant demographic and lifestyle data.
Available air quality data related to airport operations were compiled and air
dispersion modeling was conducted in order to estimate exposure areas
impacted by air pollution associated with Logan Airport operations.
3

Available noise modeling data were compiled and used to estimate exposure
areas impacted by noise associated with Logan Airport operations.
Logan Airport is located within metropolitan Boston with various sources of
ambient air pollution not related to the airport. Air pollutant emissions typically associated
with airport operations are largely due to incomplete combustion of fuel and are the same
as those emitted from other urban mobile sources (e.g., passenger automobiles, airport
equipment). Available environmental monitoring data do not allow for precise
apportioning of the contribution from airport sources and from other sources of air
pollution in the study area. Thus, high-resolution air dispersion modeling was applied to
predict ambient concentrations in the study area based solely on emission estimates
associated with airport operations. For exposure to noise associated with airport
operations, noise modeling of aircraft activities provided airport-related noise contours in
the study area. Development of air and noise exposure modeling was made possible in part
by Massport, who provided MDPH with access to a variety of data not mandated to be
reported by MA regulations.
4

2 SUMMARY OF HEALTH EFFECTS ASSOCIATED WITH EXPOSURE TO AIRPORT-RELATED AIR POLLUTANTS AND NOISE
2.1 INTRODUCTION
Logan Airport’s expansive aviation infrastructure contains a complex mix of
transportation-related sources of air pollution and noise. Air pollution from airport-
related activities is generated from aircraft engine emissions from passenger and cargo
planes, ground service equipment (GSE), auxiliary power units (APU), aircraft refueling,
and the airport’s power plant. Passenger, commercial, and airport fleet vehicles traveling
within the airport boundaries are also sources of air pollution at all airports. Noise is
generated primarily from aircraft landing and takeoff phases and along flight paths in the
study area. Emissions from airport operations are primarily from combustion of aviation
fuel from aircraft and combustion of diesel fuel or gasoline from mobile source emissions
(e.g., motor vehicle fleets, ground service equipment, and auxiliary power units, APUs,
power plant). Fossil-fuel combustion contains a complex mixture of oxides of nitrogen
(NOx), sulfur dioxide (SO2), volatile organic compounds (VOCs), carbon monoxide (CO),
carbon dioxide (CO2), and particulate matter (PM10, PM2.5, ultrafine particles – collectively
referred to as PM). In addition, numerous speciated VOCs, including hazardous air
pollutants (e.g., benzene), are emitted from these sources. Fuel vapors and aerosols are
also emitted during aircraft refueling, mobile source refueling, and from fuel storage tanks
located on the grounds of the airport.
A review of the scientific literature was conducted to inform the development of the
survey instrument. Based on this review, it was determined that cardiovascular,
respiratory, and auditory health effects are the primary outcomes associated with exposure
to combustion-related pollutants and noise. Thus, the primary health outcomes of interest
in the LAHS survey were cardiovascular outcomes (heart attack, angina/coronary heart
disease), respiratory outcomes (asthma, respiratory symptoms, COPD, bronchitis), and
auditory outcomes (hearing impairment, tinnitus).
5

Given the voluminous nature of the scientific literature associated with air
pollutants, the LAHS literature review focused on major scientific studies and
compendiums by the US Environmental Protection Agency (US EPA) and the World Health
Organization (WHO) on the health effects of air pollution (primarily criteria air pollutants)
and noise. References are provided at the end of this report for additional information.
2.2 SUMMARY OF HEALTH STUDIES OF AIR POLLUTION
Few studies have been conducted to evaluate the potential health effects of
exposure to airport-related emissions, specifically, but a significant body of evidence exists
in the scientific literature that links certain health outcomes with exposure to specific
pollutants contained within the complex mixtures of air pollution sources in general. For
many of these studies, ambient concentrations of PM (PM2.5, PM10, ultrafine particles) and
the gaseous co-pollutants (i.e., CO, sulfur dioxide (SO2), NO2 and ozone) are highly
correlated with certain health outcomes. Although the studies do not provide clear
evidence to distinguish impacts associated with individual pollutants or a combination of
pollutants within the complex ambient mixture as the putative agent(s), research efforts
over the past decade have focused on particulate matter as the primary pollutant of
concern (US EPA, 2009). "Particulate matter," also known as PM or particle pollution, is a
complex mixture of extremely small particles and liquid droplets. Particle pollution is
made up of a number of components, including acids (such as nitrates and sulfates),
organic chemicals, metals, and soil or dust particles. The size of particles is directly related
to possible health effects associated with exposure to air pollution because small particles
can pass through the throat and nose and enter the lungs. Once inhaled, these particles can
affect the heart and lungs and cause serious health effects. Particulate matter is
characterized by the aerodynamic size of the particles. The inhalable course fraction has
an aerodynamic diameter ranging from 10 to 2.5 micrometers. The fine particle fraction
has an aerodynamic diameter of 2.5 micrometers and smaller. Ultrafine particles are those
particles below 0.1 micrometers.
6

Ultrafine particles (UFPs) are also important to consider because they are the major
particulate fraction emitted from aircraft engines. In addition, UFPs are capable of
efficiently carrying and transporting large amounts of absorbed or condensed toxic air
pollutants into the respiratory tract (Sioutas et al., 2005). Current epidemiological
evidence supports associations between inhalation of fine (≤2.5 µm) and ultrafine (≤0.1
µm) ambient particulate matter and increases in cardiovascular and respiratory morbidity
and mortality (Delfino et al., 2005; Penn et al., 2005). Recently promulgated ambient air
standards by the US EPA for nitrogen dioxide (NO2) (US EPA, 2008) and SO2 (US EPA,
2008a) are based on studies that have demonstrated respiratory health effects from short-
term exposure to NO2 and SO2, including airway inflammation in healthy people; increased
respiratory symptoms in people with asthma, and increased visits to emergency
departments and hospital admissions for respiratory illnesses. Thus, people with heart or
lung diseases, children and older adults are the considered at-risk populations for these
health impacts.
Numerous scientific studies over the past 20 years have linked PM exposure to
cardiovascular and respiratory health effects, including: premature death in people with
heart or lung disease, nonfatal heart attacks, irregular heartbeat, aggravated asthma,
decreased lung function, and increased respiratory symptoms, such as irritation of the
airways, coughing or difficulty breathing.
CARDIOVASCULAR HEALTH OUTCOMES
According to Wilson and Culleton (2005) cardiovascular disease (CVD) is common
in the general population, affecting most adults in the US over the age of 60 years. As a
diagnostic category, CVD includes five major areas: coronary heart disease (CHD)
(manifested by myocardial infarction (MI), angina pectoris, heart failure and coronary
death); cerebrovascular disease (stroke and transient ischemic attack); and peripheral
vascular disease (PVD). Coronary heart disease (CHD) contributes approximately one-
third to one-half of the total CVD. The Framingham Heart Study reported a lifetime risk of
coronary heart disease at age 40 years was 48.6% (95% CI 45.8–51.3) for men and 31.7%
7

(29.2–34.2) for women. At age 70 years, lifetime risk was 34.9% (31.2–38.7) for men and
24.2% (21.4–27.0) for women (Lloyd-Jones et al., 1999). Most individuals with coronary
heart disease show no evidence of disease as the disease progresses before the first onset
of symptoms, which may present as angina or a MI. Angina is a symptom of CHD and
defined as chest pain or discomfort that occurs due to an inadequate supply of oxygen to
the heart muscle.
The biological mechanisms linking air pollution to heart disease involve direct
effects of air pollutants on the cardiovascular system, blood, lungs and/or indirect effects
mediated through pulmonary oxidative stress and inflammatory responses (Peters et al.,
2001). Studies on the latter topic seem to point to initiation of pulmonary and systemic
oxidative stress and inflammation with a subsequent cascade of physiological responses
that are capable of instigating cardiovascular effects (Brook et al., 2004). These effects
include, but are not limited to, myocardial infarction and angina (Brook et al., 2004).
Elderly patients, those with pre-existing cardiac or respiratory conditions, and diabetics
have been identified as the primary individuals who may be at increased risk (Katsouyanni,
2003).
Historically, the primary health outcome observed in relation to particulate matter
exposures has been mortality. In one of the first studies identifying the health impacts of
particulate matter exposure, Dockery et al. reported in the Harvard Six Cities Study that
long-term exposure to air pollutants is independently associated with cardiovascular
mortality, with PM2.5 and sulfates showing the strongest relationship to cardiovascular
disease (Dockery et al., 1993). Similar results were found in a seminal study of American
Cancer Society (ACS) data (Pope, 1995) in which long-term exposure to increases in mean
PM2.5 concentrations were associated with increases in cardiopulmonary mortality. A
follow-up study by Pope et al. in 2002 found that fine particulate and sulfur oxide–related
pollution were associated with all-cause mortality, lung cancer, and cardiopulmonary
mortality. Follow-up studies of the Six Cities Study cohort (Laden et al., 2006) and ACS
Study (Krewski et al., 2009) have also shown a decrease in mortality risk with decreases in
PM2.5 that have occurred in these study areas over the past few decades
8

Hospitalizations and emergency department (ED) visits for cardiovascular outcomes
Short-term exposure to PM2.5, particularly in patients with underlying coronary
artery diseases, has also been linked to acute coronary events, including MI (Peters et al.,
2004; Miller at al., 2007; von Klot et al., 2005), angina/other ischemic heart disease (IHD)
(Schwartz et al., 1995; Miller at al., 2007; von Klot et al., 2005; Pope et al., 2006b),
dysrhythmias (Schwartz et al., 1995; Rosenlund et al., 2008), and heart failure (Schwartz et
al., 1995).
US EPA reviewed several large multicity hospital admission and emergency
department (ED) visit studies (MCAPS, Dominici et al., 2006; SOPHIA, Metzger et al., 2004;
Peel et al., 2005; Tolbert et al., 2000; APHEA and APHEA-2, Le Tertre et al., 2002; HEAPSS,
Von Klot et al, 2005; Multicity Studies in Australia and New Zealand, Barnett et al., 2006).
They concluded that large studies from the US, Europe and Australia/New Zealand provide
support for an association between short-term increases in ambient levels of PM2.5 and
PM10 and increased risk of hospitalization for total cardiovascular disease. US EPA cited
studies showing associations between short-term increases in PM2.5 and IHD, which
represents a subset of all cardiac disease hospitalizations and is sometimes, termed
“coronary heart disease,” although the extent of the association varies considerably
between studies. This category typically includes acute myocardial infarction (MI), acute
and sub-acute forms of IHD, angina pectoris and other forms of chronic IHD. For example,
the positive associations ranged from early studies showing a 0.6% excess risk of
hospitalization for IHD per 10 µg/m3 increase in mean PM10 (Schwartz et al., 1995) to a
study in Salt Lake City, Utah (Pope et al, 1996) that found a 4.8% excess risk of acute MI or
unstable angina per 10 µg/m3 increase in PM2.5. A 2001 study in Boston by Peters et al.
found that a 10 µg/m3 increase in the 2-hour average PM2.5 levels was associated with a
17% excess risk of MI and a 10 µg/m3 increase in the 24-hour average levels was associated
with a 27% excess MI risk. In contrast, a study using the same methodology in Washington
State (Sullivan et al., 2005) found no association, although US EPA cites other studies
suggesting that substantial heterogeneity of effects are to be expected across different
locations.
9

RESPIRATORY EFFECTS ASSOCIATED WITH EXPOSURE TO AIR POLLUTANTS
Asthma is a physician-diagnosed chronic inflammatory disorder of the airways and
is one of the most common chronic diseases of childhood, affecting 4 million children
nationwide (NHLBI, 2007). Asthma is a complex disorder characterized by variable and
recurring symptoms, airflow obstruction, bronchial hyper-responsiveness, and an
underlying inflammation. In susceptible individuals, this inflammation causes recurrent
episodes of wheezing, breathlessness, chest tightness, and coughing, particularly at night or
in the early morning. These episodes are usually associated with widespread but variable
airflow obstruction that is often reversible, either spontaneously or with treatment
(NHLBI, 2010).
According to the National Asthma Education and Prevention Program Expert Panel
(2007), the development of asthma appears to involve the interplay between host factors
(particularly genetics) and environmental exposures that occur at a crucial time in the
development of the immune system. Two major factors are the most important in the
development, persistence, and possibly the severity of asthma: exposure to airborne
allergens (particularly sensitization and exposure to house-dust mite and plant pathogens
[Alternaria]) and history of viral respiratory infections (including respiratory syncytial
virus [RSV] and rhinovirus). Other environmental factors under study include: tobacco
smoke (i.e., exposure in utero is associated with an increased risk of wheezing, but a link to
subsequent development of asthma has not been established), air pollution (e.g., ozone and
particular matter) and diet (e.g., obesity or lower intake of antioxidants and omega-3 fatty
acids). The specific association of these factors with the onset of asthma has not been
clearly defined.
Hospital admissions and emergency department (ED) visits for respiratory outcomes
Epidemiological studies have reported significant positive associations between
measured ambient air pollutants, notably particulate matter, and increased respiratory-
related hospital admissions, emergency department and physician visits. As noted
previously, US EPA recently promulgated 1-hour ambient air standards for NO2 and SO2
10

based primarily on studies that found respiratory health effects. These effects include
airway inflammation in healthy people, increased respiratory symptoms in people with
asthma, and increased visits to emergency departments and hospital admissions for
respiratory illnesses.
Numerous epidemiologic studies have found excess risk for hospitalizations and ED
visits associated with exposure to PM2.5 and PM10 for all respiratory diseases combined,
COPD admissions, and larger excess risks for asthma as well as increased physician visits.
US EPA reviewed over 90 studies published since 2002 of the potential association
between PM and hospital admissions and ED visits. In studies of children, the greatest
risks observed by Barnett et al. (2005) using a 0-1 day lag, were increases in respiratory
hospital admissions of 6.4% among infants (<1 year of age) and 4.5 % among children 1-4
years of age per 10 µg/m3 increase in PM2.5. Other studies of respiratory hospitalizations
and ED visits have reported increased risk to children in association with PM2.5, PM10-2.5, and
PM10 (US EPA, 2009). In adults, a study in Atlanta (Study of Particles and Health in Atlanta,
SOPHIA) reported an excess risk of 1.3% per 10 µg/m3 increase in 24-hour average PM10
levels for ED visits for combined respiratory causes among all ages (Peel et al., 2005).
Similar findings were reported for additional years of data from the SOPHIA Study and in a
study in Idaho (Ulirsch et al., 2007). However, a study of respiratory admissions and ED
visits in Spokane, Washington found no association with any size fraction of PM (Slaughter
et al., 2005). This is consistent with the finding that air pollution is associated with hospital
admissions for respiratory diseases throughout the world but the magnitude of the effect
differs across locations (US EPA, 2009).
Hospital admissions and emergency department (ED) visits for asthma
Many studies of PM exposure and hospitalizations for asthma have found a positive
effect, but results often vary by age and PM size fraction studied. US EPA concluded that the
effect estimates from studies of PM2.5 and hospital admissions and ED visits for asthma for
10 pediatric studies are imprecise and not consistently positive across different age groups
and lag times (US EPA, 2009). However, for studies of adults or adults and children
11

combined, associations of asthma hospital admissions and ED visits with PM2.5 were
observed in most studies. For both adults and children, studies of associations with PM10
are more consistently positive. Overall, US EPA has concluded that recent studies on PM2.5
and respiratory hospitalizations and ED visits have been consistently observed. Most effect
estimates were in the range of about 1-4% increased risk of hospitalization in areas with
mean 24-hour PM2.5 concentrations between 6.1 and 22 µg/m3.
Respiratory symptoms
Multiple studies conducted throughout the world (North America, Europe, and
Germany) have established significant associations of respiratory symptoms (increase in
cough, wheeze, and bronchitis), and impairment of lung function among individuals
exposed to PM (cited in Kappos et al., 2004). A growing body of evidence indicates that a
substantial number of children and adults experiencing asthma-like symptoms are not
diagnosed with asthma (Yeatts et al., 2003, Lee et al., 2007; US EPA, 2009).
Respiratory symptoms and medication use
Epidemiologic studies of asthmatic children have observed increased respiratory
symptoms and asthma medication use in those exposed to higher concentrations of PM2.5
and PM10 (US EPA, 2009) and ozone (Millstein et al., 2004). Similar studies among
asthmatic adults are less consistent and these associations have not been demonstrated for
healthy individuals.
Respiratory health effects from other criteria pollutants
Oxides of nitrogen (NOx) is the general term that describes a mixture of highly
reactive gases that contain nitrogen and oxygen in varying amounts (e.g., nitric oxide [NO]
and nitrogen dioxide [NO2]) that affect the respiratory system. Symptoms include
wheezing, cough, reduced lung function, and increased airway responsiveness in normal
and asthmatic individuals. NOx may also be a co-factor in the tissue damage associated
with exposure to ambient levels of ozone. High indoor NOx exposure in children has been
12

linked to a reduced resistance to respiratory infections and an increased likelihood of
respiratory illness including wheezing and persistent cough (van Strien et al., 2004). NOx
emissions have also been associated with increased severity of virus-induced asthma
exacerbation (Chauhan et al., 2003) and respiratory illness in children and proximity to
roadways (Brunekreef et al., 1997).
Sulfur dioxide (SO2) is a direct respiratory irritant and contributes to the formation
of sulfate and sulfuric acid adsorbed onto particulate matter. Compared to children from
less polluted areas, children residing in industrial communities with high concentrations of
SO2 and total suspended particulates had higher lifetime prevalence of allergies, eczema,
bronchitis, wheeze, shortness of breath, and cough without cold (Heinrich, 2003).
Volatile organic compounds (VOCs) are also linked to respiratory morbidity. In
particular, the respiratory irritant acrolein and several aldehyde compounds are thought to
interact within the complex mixture of ambient pollutants to exacerbate asthma and
asthma-related symptoms (Leikauf, 2002). VOCs contribute to the formation of ozone and
airborne secondary particles. Ozone is formed in the atmosphere from the reaction of
combustion by-products - NOx, VOCs, and ultraviolet light.
Chronic obstructive pulmonary disease (COPD)
Although precise definitions vary, the American Thoracic Society (ATS) has defined
COPD as “a disease state characterized by the presence of airflow limitation due to chronic
bronchitis or emphysema; the airflow obstruction is generally progressive, may be
accompanied by airway hyperreactivity, and may be partially reversible.” COPD is a
nonspecific term that refers to a large group of lung diseases characterized by airflow
obstruction with related symptoms (e.g., chronic cough, exertion dyspnea, expectoration,
wheeze) (Mannino, 2002). Estimates of COPD prevalence primarily refer to patients with a
diagnosis of either chronic bronchitis or emphysema (Sunyer, 2001).
COPD is a leading cause of death and disability/morbidity in the United States
(Mannino, 2002). The burden of disease associated with COPD is largely underestimated
13

because a diagnosis of COPD is associated with increased risk for hospitalization and in-
hospital mortality from other common diagnoses. For example, hospital discharges with
primary or secondary COPD are more frequently diagnosed with other co-morbid
conditions, including cardiac and pulmonary vascular disease, pneumonia and thoracic
malignancies. Even in patients with severe COPD, a large number are admitted to the
hospital for other co-morbidities, with COPD labeled as a secondary diagnosis (Holguin et
al., 2005; Peel at al., 2007).
While cigarette smoking is the primary risk factor for an estimated 80-90% of COPD
cases, occupational exposures and exposure to indoor and outdoor air pollutants are also
risk factors for COPD. Other risk factors for COPD include second-hand smoke, history of
childhood respiratory infections, and heredity. COPD has been associated with smoke from
biomass fuel, history of pulmonary tuberculosis, chronic asthma, and respiratory tract
infections during childhood (Salvi et al., 2009).
Decline in lung function/airway obstruction is a hallmark of COPD and studies
suggest that ambient air pollution may play an important role in new onset and
exacerbation of COPD (MacNee et al., 2000; MacNee et al., 2003). In a review of studies
assessing the association between air pollution and COPD, Sunyer (2001) concluded that
air pollution is related to the following: the increase of self-reported diagnosis of chronic
bronchitis or emphysema as reported in two studies (NHANES and Adventist Health Air
Pollution Study); an increased prevalence of breathlessness and mucous hypersecretion as
reported in the Swiss Cohort Study on Air Pollution and Lung and Heart Diseases in Adults
(SAPALDIA) study; and lower lung function levels in adults as reported in cross-sectional
studies. A number of studies have looked at the effect of air pollution on reduced or
impaired lung function, or accelerated decline in lung function, and the majority have found
that exposure to ambient air pollutants is associated with decreased lung function (as
measured either by Forced expiratory volume in 1 second (FEV1) or Forced vital capacity
(FVC)) (Sunyer, 2001). Thus, individuals with COPD are more susceptible to the effects of
air pollution (Anzueto et al., 2007). Ambient air pollution (PM10 and PM2.5, ozone, NO2, and
SO2) has been implicated in the exacerbation of COPD symptoms and increased hospital
14

admissions primarily in the elderly (Peel et al., 2007; Ko et al., 2007; Chuang et al., 2007;
Lagorio et al., 2006; Schwela, 2000). Associations with COPD have been consistently
observed in areas with high concentrations of PM2.5 and PM10 in multicity and single city
studies in the US and Canada (US EPA, 2009).
While most of the literature related to air pollution and COPD report significant
associations between outdoor air pollution and COPD exacerbation including increased
COPD hospital admissions (NMMAPS study) and mortality (Harvard six-cities study), only a
small number of studies have evaluated the role of air pollution in the prevalence of COPD.
COPD is a complex chronic disease with an evolving definition in epidemiological studies.
The Global Initiative for Obstructive Lung Disease (GOLD) established guidelines in 2002 to
address the need to streamline the definition for epidemiological studies. The definition
recommended the use of a respiratory questionnaire and a post-bronchiodilator FEV1/FVC
ratio of <0.7 to diagnose COPD (Salvi et al, 2012).
Although smoking is a primary risk factor for COPD, findings from NHANES III study
using post-bronchodilator spirometry (ratio of (FEV1)/[FVC] <0.70) suggested that 25% of
the COPD cases in the US are in never-smokers. Similar findings were reported in the UK
and Spain (Salvi et al., 2009).
In the last decade as the concern of the burden of non-smoking COPD has increased
from such factors as worldwide use of biomass fuel (Salvi, et al., 2009), studies have found
an association between long-term exposure to air pollutants associated with traffic and
COPD diagnosis. A study of 4757 women 55 years of age living in Germany that used a
questionnaire to asses symptoms and risk factors (and the GOLD criteria to define COPD)
found that a 7 µg/m3 increase in five year mean PM10 concentrations was associated with a
5.1% decrease in FEV1, a 3.7% decrease in FVC, and a 33% increase in prevalence of COPD.
Women living less than 100 meters from a busy roadway (>10000 vehicles per day) also
had significantly decreased lung function and COPD was 1.79 times more likely (95% CI
1.06-3.02) than those living farther away. Levels of PM10 and NO2 were significantly
associated with COPD. The results were consistent with the Swiss SAPALDIA except that
15

they appear stronger, which was attributed to women being more susceptible to COPD and
respiratory symptoms caused by environmental factors than men. Another study in
Sweden also found that living closest to traffic was associated with prevalence of COPD
(Lindgren et al, 2009).
In the largest study conducted in Denmark of over 50,000 eligible subjects, of which
1786 participants had a first hospital admission for COPD, COPD incidence was associated
with the 35-year mean NO2 levels (hazard ratio, 1.08; 95% confidence interval 1.02–1.14,
per interquartile range of 5.8 μg/m3), with stronger associations in subjects with diabetes
(1.29; 1.05–1.50) and asthma (1.19; 1.03–1.38) (Andersen et al., 2011). The investigators
discussed the plausible biological mechanism of repeated inhalation injury to the lungs
from long-term exposure to air pollutants and the chronic and progressive nature of COPD.
Although epidemiological evidence demonstrates an association between air
pollution exposure and exacerbation of both asthma and COPD, a comprehensive review of existing studies of long-term exposure primarily to traffic-related pollutants and COPD among adults found that the evidence overall was suggestive but not conclusive (Schikowski et al., 2013).
SUMMARY OF HEALTH EFFECTS ASSOCIATED WITH TARGETED AIR POLLUTANTS
In the absence of specific studies of the health impacts of the complex mixture of air
pollutants emitted from airport operations, the health effects associated with targeted air
pollutants from airport operations were considered in this study. In summary, numerous
epidemiological studies have shown an association between both short-term and long-term
exposure to air pollutants, most notably particulate matter, and cardiovascular mortality as
well as non-fatal cardiac events (myocardial infarction, angina/other ischemic heart events,
dysrhythmias, and heart failure). The elderly and persons with pre-existing
cardiopulmonary diseases, including coronary heart disease, are most susceptible.
In addition, epidemiological and toxicological studies have demonstrated an
association between exposure to air pollutants and respiratory effects, notably
16

exacerbation of physician-diagnosed asthma (number of episodes, emergency department
visits, and asthma hospitalization) in both children and adults. The increase in respiratory
symptoms, including wheezing, in areas with higher pollution levels also suggest
environmental factors may be critical in the development and exacerbation of asthma and
related symptoms. Exposure to air pollution is also an environmental risk factor associated
with exacerbation and prevalence of COPD.
2.3 HEALTH EFFECTS ASSOCIATED WITH EXPOSURE TO NOISE
In addition to contributing to air pollution, airport operations also result in
significant noise. The dominant source of noise from airport-related activities is aircraft
engines. The quantitative measure typically used to assess the effect of noise on the
environment is expressed as sound energy produced over the entire noise event during a
standard time period. The method used to quantify the sound level of a transient noise
event, (e.g., from takeoff and landing of aircraft) is the Sound Exposure Level or SEL. The
SEL sums individual sound level readings over the duration of the event. For airport-
related noise assessment, the Day-Night Sound Level (DNL) sums the individual flyover
SELs over the day (24-hours) with a nighttime noise weighting of 10 decibels (dB) added to
the SEL for operations occurring from 10 pm to 7 am. Since 1974, the standard approach
for assessing exposure to environmental noise levels from aircraft operations is the time-
weighted daily average exposure index or DNL. Conceptually, the DNL represents the total
accumulation of all noise energy spread out uniformly over a 24-hour period.
STUDIES OF NOISE IMPACTS OF AIRPORTS
Auditory
Noise-Induced Hearing Loss
There is a significant body of evidence on the association between noise exposure
levels and auditory impairment such as noise-induced hearing loss (NIHL). NIHL is hearing
loss that develops slowly over a long period of time as a result of exposure to continuous or
intermittent exposure to loud noise. NIHL is a complex disorder caused by a combination
17

of environmental and genetic factors. Most of the health literature regarding NIHL is
associated with occupationally induced hearing loss (WHO, 2004, ACOEM, 2002). In
addition to occupational exposure studies, studies have reported reduced hearing ability in
adults and school-age children living close to a commercial airport (Chen et al., 1997; Chen
et al., 1993), and a military airport (Miyakita et al., 2001). Recent studies have focused on
the genetic association in humans (e.g., oxidative stress genes, inner ear potassium
recycling pathway genes, and monogenic deafness genes) for NIHL (Konigs et al., 2009,
Sliwinska-Kowalska et al., 2013).
Hearing impairment is caused by morphological changes in the inner and outer hair
cells of the cochlea, where the stereocilia become fused and bent. The symptoms of NIHL
increase gradually over time as sounds may become distorted or muffled and it may
become difficult for a person to understand speech (NIDCD, 2005). The development of
NIHL progresses through two phases. Phase one is characterized by temporary threshold
shift (TTS). This is a brief hearing loss that occurs after noise exposures and hearing is
completely restored after a rest period. After repeated exposure to noise intense enough to
produce TTS, a permanent threshold shift (PTS) will occur. This is an irreversible increase
in hearing thresholds caused by irreversible hair cell damage. Hearing loss is variable
within the population but it is not known why some individuals are more susceptible than
others (Quinn et al., 2001). There is some indication that hearing loss may be accelerated
with co-exposure to environmental chemicals and cigarette smoke (El-Shazly, 2006;
Pouryaghoub et al., 2007).
Guidelines for community noise developed by the WHO (1999), US EPA (1974), and
the National Academy of Sciences (NAS) (2005) determined independently that a
maximum exposure level to noise that is protective against NIHL are noise levels equal to
or less than 70 decibel (dB) over a 24-hour time-average period (Leq (24) <70 dBA-
weighted sound). This assumes exposure to all environmental noise does not exceed 70 dB
throughout daily activities irrespective of where and under which conditions this exposure
is received, including exposure to occupational levels of noise. With respect to community
noise impacts, WHO determined in 1999 that evidence strongly suggests that the
18

calculation methods used by the International Organization for Standardization (ISO) 1999
for occupational noise should also be applied to environmental and leisure time noise
exposures. The guideline states that health impacts are unlikely for individuals exposed to
cumulative noise exposure over a 24-hour period of less than or equal to 70 dB [Leq (24)
=<70 dBA-weighted noise]. WHO also notes that the uncertainties associated with this
assessment suggest that a margin of safety is needed when applied in a community setting.
The uncertainties associated with this guideline value that were not considered include the
(1) increased risks due to greater vulnerability of children in acquiring NIHL than adults,
(2) increase risk from an exposure when noise is combined with vibrations (as is the case
with lower frequency noise from aircraft), and (3) increased risk from exposures from
ototoxic substances (having a toxic effect on the ear or its nerve supply) including certain
chemicals (e.g., opioids, organic solvents, carbon monoxide), smoking, and having high
blood pressure or high cholesterol (Konings et al., 2009).
Tinnitus
Tinnitus is a symptom associated primarily with noise-induced hearing loss.
Tinnitus is defined as the perception of sound for which there is no external acoustic
source. It is often referred to as “ringing in the ears” and may manifest itself as a buzzing or
whistling sound. Tinnitus can be persistent or transient, and may be perceived in one or
both ears. There is a clear correlation between hearing loss and tinnitus; however, not all
persons with hearing loss have tinnitus (NAS, 2005; Henry et al., 2005). According to a
review by Henry et al. (2005), there are no uniform or reliable clinical measures for
defining the negative impact on individuals that experience tinnitus. Individuals that
experience clinically significant effects from tinnitus report a range of health problems
including sleep disturbances (in about half of individuals), and effects on cognition,
emotional status, and hearing. Hearing aides are a common type of treatment for tinnitus.
There are wide-ranging theories of the pathological mechanisms for tinnitus. The
most prevalent theories involve loss of hair cells or hair cell function, discontinuity of
activity across the auditory nerve, and disruption of the central auditory pathways (NAS,
19

2005). However, the mechanism that causes sustained tinnitus is unknown (Henry, et al.,
2005). Tinnitus may be caused by loud noise, which results in hair cell damage, certain
ototoxic medicines, or medical conditions such as nutritional status, vascular disease,
middle-ear disease, diabetes, hypertension, autoimmune disorders, and degenerative
neural disorders (Perry et al., 2000). Synergistic effects have been reported between noise,
diuretics, and common aminoglycoside antibiotics such as gentamicin (NAS, 2005).
SUMMARY OF HEALTH EFFECTS OF NOISE
In summary, there are a wide-range of health effects associated with exposure to
various levels and sources of noise including noise-induced hearing impairment,
interference with speech communication, disturbance of rest and sleep;
psychophysiological effects, mental-health effects, impairment of performance of school
children in cognitive tasks, and annoyance. Although recent studies have reported a
possible increased risk of hypertension from exposure to aircraft-related noise, this finding
still requires additional study. To date, a significant body of evidence has demonstrated an
association between high noise levels and auditory impairment (NIHL). Tinnitus is a
symptom associated primarily with noise induced hearing loss. Guidelines for community
noise levels developed by the WHO and US EPA found that auditory effects, including
noise-induced hearing loss, are not expected to occur at noise levels equal to or less than 70
dB over a 24-hour time-average period (Leq (24) <70 dB).
HEALTH STUDIES OF AIRPORT-RELATED AIR POLLUTION STUDIES
Lin et al. (2008) evaluated hospital admission rates for respiratory outcomes from
1995-2000 and residential proximity to three large New York airports (Rochester Airport
in Rochester, LaGuardia Airport in New York City, and MacArthur Airport in Long Island).
The respiratory outcomes examined were hospital admissions for asthma, chronic
bronchitis, emphysema, chronic obstructive pulmonary disease, children’s bronchitis (<4
years of age), and children’s bronchiolitis. Findings suggested that residential distance
within 5 miles of two of the three airports was associated with an increase in
hospitalization admission rates for respiratory conditions (1.96; 95% CI 1.16-3.29 for
20

Rochester and 1.68; 95% CI 1.36, 2.07 for LaGuardia) after adjusting for potential
neighborhood-level confounders from census block data (poverty level, African-American
race, Hispanic ethnicity, education less than higher school). Wind flow patterns were
analyzed to identify census block groups receiving predominant wind flow from the
airports, but this was not found to be a factor in hospitalization rates of the respiratory
outcomes studied. Due to the nature of hospitalization records, the study was limited,
however, by the lack of individual-level information on important individual-level
confounding factors, including smoking status, which may be related to respiratory
hospitalizations.
Of the two studies identified in the literature that evaluated specific health outcome
data in residents living near an airport, one of the most notable are the series of studies
conducted since the 1990’s in the communities near Schiphol Airport in the Netherlands
(Franssen et al., 2003). A broad range of self-reported health outcomes have been
evaluated using a postal survey of 11,812 residents living within approximately 2.5 miles
from Schiphol Airport (Amsterdam). The survey included questions on annoyance, sleep
disturbance, self-rated general health status, respiratory complaints, and medication use.
In general, investigators concluded that air traffic emissions contributed only a few
percentage points to local air pollution levels and that there was no evidence that air traffic
emissions contributed to respiratory disorders. In a follow-up study, the investigators
found associations between general health status, use of medication for cardiovascular
diseases or increased blood pressure, and use of sleep medications or sedatives and
aircraft noise exposure. Those residents who were severely annoyed by aircraft noise were
more likely to have poor self-perceived health and more likely to report higher blood
pressure.
21

22

3 HEALTH SURVEY DESIGN AND METHODS
3.1 STUDY AREA AND SAMPLE POPULATION
STUDY AREA
Consistent with the intent of legislative language, the study population was defined
as communities located, either fully or partially, within a 5-mile radius of the General
Lawrence Logan Airport. Based on the 2000 US census, seventeen communities, with
populations totaling over 1 million residents 18 years of age and older, are located within a
5-mile radius of Logan Airport and were, therefore, considered part of the study area
(Figure 3-1). As shown in Figure 3-1, the study area includes the airport itself and extends
outward to the geographic borders of each of the seventeen communities located within
the 5-mile radius. The communities are: Boston, Brookline, Cambridge, Chelsea, Everett,
Hull, Lynn, Malden, Medford, Melrose, Milton, Nahant, Quincy, Revere, Saugus, Somerville,
and Winthrop. Two communities directly abut the airport property, Winthrop which has
residential properties located within 800 feet to the east of the airport, and East Boston,
which immediately borders the airport to the west with some residential properties
directly abutting airport property.
SELECTION OF HOUSEHOLDS TO SURVEY (SURVEY SAMPLE)
The presence of air pollutants and noise associated with airport operations varies
greatly across the five-mile radius study area. For that reason, it was expected that
portions of the study area closer to the airport would have the potential for higher levels of
airport-related exposures than portions of the study area farther away from the airport.
In order to ensure that enough households were interviewed from all areas, those
nearer and farther from the airport, the study area was divided or “stratified” into three
distinct sections. These sections were designed to approximate areas that might experience
high, medium, and low exposures to air pollutants and noise from airport operations.
23

Figure 3-1. The Logan Airport Health Study Area
For the purpose of sample selection, proximity to the airport was considered a
sufficient proxy for exposure to airport-related emissions. The use of municipal
boundaries, zip codes, and census tracts was also incorporated into the survey design in
order to sample at the highest geographic resolution possible. The determination of
distances for each of the three areas was based on knowledge of aircraft flight paths,
atmospheric mixing of airport emissions, and modeled airport noise profiles.
The “high” exposure area included the area within a 1-mile radius of the center of
the airport. This included emissions along the flight paths of aircraft flying at an altitude of
approximately 3000 feet or less, which can contribute to ground level air pollutant
24

concentrations. The “medium” exposure area extends outward from the “high” exposure
area to the boundary at which aircraft reach an altitude of 3000 feet, which corresponds to
a ground distance of about 3-4 miles from the airport. The “low” exposure area extends
from the end of “medium” exposure area to the geographical border of the outermost
communities in the study area (approximately 4-12 miles from the airport). (These
exposure areas were refined for the final data analysis based on air dispersion modeling
results of airport-related emissions for 2005.)
Since the “high” and “medium” exposure areas cover smaller geographic areas and
contain smaller populations than the “low” exposure area, the sampling strategy aimed to
over-sample the populations in those areas, thus ensuring a sufficient number of
households were sampled in those areas to detect statistically significant differences.
SAMPLE SIZE AND STATISTICAL POWER
The LAHS sample size was based on the statistical power needed to detect an
association between air pollution exposure and heart disease prevalence. A power
calculation is a method of estimating the sample size needed to detect a statistically
significant association between exposure and a particular health outcome, using knowledge
of the rates of the disease in the population and the predicted size and strength of the
association with exposure based on previously published research. Heart disease was
selected because it was found to have a lower prevalence in Massachusetts residents
compared to asthma. Therefore, a sample size large enough to detect an elevation in heart
disease prevalence would also be sufficient for detecting elevations in asthma or other
more common health outcomes.
The sample size calculation also accounted for a study design with three exposure
areas and disproportionate stratified sampling (oversampling) in the medium and high
exposure areas, increasing the probability of detecting the presence of elevated rates of
disease in the population living closest to the airport if indeed such disease patterns exist.
Based on the power calculation, for the study to have sufficient power (80 percent, = α0.05) to detect an association between the exposure area of residence and the health
25

outcomes of interest, it was estimated that a total of 6000 participants were required,
corresponding to a total of 3000 residents in the “low” exposure area, 1500 in the
“medium” area, and 1500 in the “high” area. Again, these estimates were further refined
once the air dispersion modeling was completed.
3.2 DESIGN OF THE SURVEY INSTRUMENT
PILOT TESTING AND OVERVIEW OF THE SURVEY
The LAHS survey instrument was developed by MDPH/BEH using validated and
reliable questions from national and international health surveys, including questions on
respiratory symptoms taken from the European Community Respiratory Health Survey
(ECRHS) and the International Study of Asthma and Allergies in Childhood (ISAAC). Prior to
its use in the study, the survey instrument was pilot tested in 2002 with a population living
near an airport in Portland, Maine. Based on pilot interviews, the survey was revised to
improve question clarity, to enhance specificity of responses for some items, and to provide
a greater emphasis on confidentiality for respondents. After extensive review to confirm
satisfactory questionnaire logic and function, an additional round of pilot interviews was
conducted in 2005 with 25 randomly selected residents of the LAHS area. These
respondents were asked to complete the survey and to provide feedback on questions.
Specifically, they were asked to evaluate the clarity of questions, including any terminology
they did not understand, and whether the flow of the survey made sense or if portions of
the survey seemed confusing. Feedback from these pre-test interviews was then used to
finalize the survey instrument. The 25 pilot respondents were excluded from recruitment
efforts for the final LAHS survey.
The final survey instrument was comprised of four sections: (1) questions on the
prevalence of respiratory, cardiovascular, and auditory health endpoints, (2) questions on
risk factors associated with these outcomes, (3) questions on exposures inside the home
and at work, and (4) questions reflecting demographic and socio-economic status.
26

HEALTH OUTCOME ASSESSMENT
The selection of health outcomes to be included in the survey was based on
information gathered from a thorough review of the available scientific literature, including
published literature on air pollution and potential health impacts, as well as input obtained
from Community Advisory Committee (CAC) meetings and from residents and community
stakeholders living in the vicinity of the airport regarding their perceptions and concerns.
The primary health outcomes of interest in the survey were asthma (lifetime
asthma, current asthma, current asthma with medicine use, asthma attacks, emergency
department visits for asthma, probable asthma, respiratory symptoms, and COPD);
physician-diagnosed cardiovascular outcomes (non-fatal heart attack, angina or coronary
heart disease) and auditory effects including hearing impairment and tinnitus. In addition
to collecting information on the prevalence of these primary health outcomes, information
on the age of first event, number of events, and severity was also collected.
COVARIATE DATA COLLECTED
Risk factors for the health outcomes of interest, as reported by the American Heart
Association (AHA) and American Lung Association (ALA), were also evaluated for the LAHS
health survey. Risk factors are characteristics (e.g., age, gender) or variables (e.g., smoking,
air pollutant levels) associated with increased probability or likelihood of disease. A risk
factor may be inherited, associated with a lifestyle, or due to an environmental exposure.
Standardized questions associated with identified risk factors were taken from the
National Health and Examination Survey (NHANES), the National Health Interview Survey
(NHIS), and the Behavioral Risk Factor Surveillance System (BRFSS) survey and were
included in the LAHS questionnaire. Risk factors for respiratory outcomes include genetics,
exposure to indoor allergens (e.g., pollen, second hand cigarette smoke, dust, mold),
parental atopic or asthmatic status, obesity, and respiratory infections. The major risk
factors for cardiovascular outcomes are smoking, high blood cholesterol, high blood
pressure, physical inactivity, obesity and being overweight, and diabetes mellitus. The
health survey contained questions on all of these risk factors except genetics.
27

3.3 SURVEY ADMINISTRATION
OVERVIEW
A cross-sectional stratified telephone survey using random-digit-dial (RDD)
methods was deemed most efficient to collect health outcome data representative of a
study population of over 1 million residents. This type of survey provides data about a
population at one point in time (e.g., 2005). Most national health surveys (e.g., BRFSS) use
RDD techniques to gather information on the health status of US residents because it is a
validated cost-effective sampling technique.
RDD TELEPHONE SAMPLE
As noted previously, the sampling strategy aimed to sample a greater proportion of
residents living in the “high” and “medium” exposure areas compared to the “low” area.
This was accomplished by using GENESYS Sampling Systems, a commercial software
program that provides RDD samples. GENESYS also has the capability of identifying
telephone exchanges and linking these exchanges to geographic information such as zip
code areas.
The telephone numbers of households included in the health survey were drawn
from an initial sample of telephone numbers generated by GENESYS. This approach
ensures an equal probability of selection for every residential telephone number including
unlisted numbers. The initial RDD sample of telephone numbers was then processed using
specialized software to eliminate non-residential telephone numbers to the greatest extent
possible.
SURVEY ADMINISTRATION
Interviews were conducted using Computer-Assisted Telephone Interviewing
(CATI) technology from May to October of 2005. Interviewers were trained in interviewing
protocols and procedures. In addition, interviewers received training specific to the LAHS
28

survey instrument using an Interviewers Manual that provided the rationale for each
question of the survey. The manual was developed by MDPH/BEH after pilot-testing of the
survey.
Call attempts rotated across all seven days of the week at different times of the day
between 9 AM and 9 PM, according to industry standards. The only exceptions were
specific, scheduled appointments outside this range. A minimum of 15 call-back attempts
were made per telephone number at the screener level. Four attempts were made to
convert initial refusals, except in cases where individuals requested not to be contacted
again. To encourage participation, a brief message with a toll-free number was delivered to
answering machines on the first, third, and seventh machine-answer call attempts. In
addition, respondents who initiated the survey without completing it were re-contacted at
a date and time of their choosing to complete the survey at a later time.
Standard screening questions were used to identify eligible households and to
randomly select an eligible respondent to participate in the survey. Additional screening
questions were used to address potential selection biases. For example, one screening
question asked about the number of phone lines in the household because having more
phone lines increases the probability of being selected. By collecting this information, this
factor was able to be included as part of the complex sampling design.
To maximize the response rate, the survey administrators worked with MDPH/BEH
to develop a number of call protocol elements designed to put responders at ease, pique
interest and investment, verify the legitimacy of the caller and study, and establish trust in
the confidentiality of any information given. The protocol included a standardized and
appropriate call lead-in with an introductory statement about an “important
environmental health study” being conducted for the purpose of learning about the
respondent’s health and the health of their family “to determine if there are common health
problems” in their community. The statement explained the importance of participation in
the study in order to help represent one’s community, but did not identify Logan Airport as
the subject of the study. Contact information for MDPH/BEH as well as a toll-free number
29

for the survey administrators and the name of the survey operation manager were given.
The standardized statement also included assurances of the confidentiality of any
information provided.
Surveys were conducted in English and Spanish depending upon the spoken
language of the eligible respondent. For surveys conducted in Spanish, the respondent
requesting the Spanish interview was re-contacted by a subcontractor within a specified
period of time to complete the survey. The survey was designed to take an average of 25
minutes to complete and asked respondents to provide information about themselves and
all children that might reside in the household. When an interviewer called a sampled
household, one adult living in the household was randomly selected to be the respondent.
If children resided in the household, the respondent was asked to complete the final section
of the survey, designed to collect information for all children living in the household.
A total of 6,072 eligible residents/households were interviewed and completed
surveys about themselves and 2,215 children living in those respective households.
Completed surveys in each exposure area were tracked by mapping the street address,
nearest landmark, or zip code provided by the respondent using GIS tools in order to
ensure that the number of completed interviews per exposure area would be achieved.
30

4 ENVIRONMENTAL ASSESSMENT OF AIR POLLUTANTS AND NOISE ASSOCIATED WITH LOGAN AIRPORT OPERATIONS
4.1 OVERVIEW
As previously discussed, the lack of individual exposure data associated with airport
emissions for this study required the use of surrogates (specifically proximity to the airport
and other factors). Air dispersion modeling was performed to quantify the ambient air
pollution concentrations in the study area and improve exposure classification of the
participants. In addition, noise contours provided by Massport were used to classify noise
exposure for the health outcome data analysis.
4.2 AIR DISPERSION MODELING ANALYSIS OF 2005 AIRPORT EMISSIONS
INTRODUCTION
Air dispersion models perform mathematical simulations of atmospheric transport
and dispersion of emissions, using emission factors and meteorological information to
estimate ambient air pollution concentrations associated with a source, such as Logan
Airport. The US FAA’s Emissions and Dispersion Modeling System (EDMS) contains two
modules. The first is designed to estimate an emissions inventory, or listing, of pollutants
and the amounts emitted from each of the major airport emission sources including
aircraft, motor vehicles, and ground service equipment. The second module was developed
to model the dispersion of these emissions in air over space and time. The model in EDMS
is AERMOD and is the most advanced air dispersion model available for quantifying
ambient air pollution concentrations from airport operations. AERMOD is the preferred
model of environmental regulatory agencies when making air quality permitting decisions
in the US. The US FAA’s EDMS model has undergone several revisions over the past several
years and the most recent version (EDMS v 5.1.3) was used for the LAHS (US FAA, 2010).
Air dispersion modeling of Logan Airport operations requires both the emissions
inventory and the timing and location of emissions associated with airport operations.
31

Massport uses the emissions inventory module to calculate airport emissions on an annual
basis and reports these data in the annual Environmental Data Report (EDR). The EDRs
are a part of a series of annual environmental review documents submitted to the
Executive Office of Energy and Environmental Affairs/Massachusetts Environmental Policy
Act (MEPA) Office. They have been required since 1989 to report on the cumulative
environmental effects of Logan Airport’s operations and activities. EDRs provide a review
of environmental conditions for the reporting year compared to the previous year.
Massport also routinely logs flight operations of the exact time of every arrival and
departure of aircraft by runway and operation. Massport provided MDPH/BEH both the
emissions inventory input files to EDMS and the flight operations log for 2005 to determine
the timing of aircraft emissions throughout the year. The location of emission sources (e.g.,
ground service equipment, power plant, motor vehicles) was determined from detailed
maps obtained from Massport and an airport map embedded in US FAA’s EDMS model.
MDPH/BEH contracted with a consultant with expertise in air dispersion modeling and the
EDMS model for this component of the LAHS.
SUMMARY OF AIR POLLUTANT DISPERSION MODELING ANALYSIS
MDPH/BEH used the most advanced version of EDMS that includes the most recent
emission factors1 for quantifying source emissions, particularly for aircraft, and the most
recent version of AERMOD, which predicts ground-level air pollutant concentrations in a
specified modeling domain. AERMOD is the regulatory model that is required for
conducting dispersion modeling mandated for the permitting process for new or modified
air pollutant sources required under the New Source Review regulations of the Clean Air
Act. AERMOD is an advanced Gaussian plume type model with improvements primarily in
the characterization of how winds speeds and turbulent mixing rates vary as a function of
height above the ground surface. The US FAA upgrade to EDMS included changing the
dispersion model to AERMOD in 2006. Additional information, including the full air
1 An emission factor is a representative value that relates the quantity of a pollutant released to the atmosphere with a particular activity. These factors are usually expressed as the weight of pollutant divided by a unit weight, volume, distance, or duration of the activity emitting the pollutant (e.g., kilograms of particulate matter emitted per gallons of fuel burned). Such factors facilitate estimation of emissions from various sources of air pollution.
32

dispersion modeling analysis report, is provided in Appendix A. Descriptions of the major
modeling parameters associated with this analysis are summarized below.
Modeling domain and topographic features
The topography of the study area is relatively flat. Therefore, a radial array was
used for establishing the receptors for predicting pollutant concentrations at 10 degree
intervals. The array of rings of receptors were located at radial distances of 1, 1.25, 1.5,
1.75, 2, 2.25, 2.5,2.75, 3, 3.25, 3.5, 3.75, 4, 5, 6, 8, 10, and 12 miles from the airport center.
These receptors were assigned elevations of 1.8 meters above the ground surface and have
base elevations set at 5.59 meters above sea level. An additional 27 receptors were placed
at the aeronautical center point of Logan Airport, the Logan Statue located at the entrance
of Logan Airport, and at other specific landmarks or easily identifiable locations in the
LAHS area. Only receptors located off airport property were included in the modeling
analysis. There were a total of 635 receptors in the modeling domain.
Pollutants of concern
The pollutants modeled by EDMS for the LAHS are nitrogen oxides (NOx),
particulate matter (PM2.5)—assumed to be all particulate matter 2.5 micrometers and
smaller in aerodynamic diameter2, sulfur oxides (SOx), carbon monoxide (CO), and volatile
organic compounds (VOCs).
Emission sources
2 The primary particle sizes emitted from airport sources are PM2.5 and ultrafine particles or UFPs (i.e., particles with an aerodynamic range of 0.1 micrometers and smaller). Currently, regulations are associated with mass fraction of particulate matter only (PM2.5 and PM10). Emissions inventories do not report UFPs and UFPs are not included in air dispersion models. Massport also assumes all PM emissions at Logan Airport are PM2.5. To maintain consistency, this report will also refer to all PM emissions and air concentrations as PM2.5.
33

The primary source of information on emissions from operations at Logan Airport is
the annual emissions inventory for 2005 conducted by Massport using US FAA’s EDMS
emissions inventory module. The air pollutant sources considered in the LAHS are those
associated with the routine operations at Logan Airport. These include all aircraft
approaching and departing in the air, landings and takeoffs, aircraft movements on the
runways, taxiways, and areas near the terminals, aircraft ground support equipment
(GSE) that is needed at the terminal to load or handle arriving or departing aircraft, and
auxiliary power units (APUs) at the terminals used to energize aircraft at the terminals.
The emissions data also includes motor vehicle traffic on the Logan property, emissions
from vehicles in the parking garages and emissions from Massport‘s power boilers that
provide power or steam to the airport. Attachment 1 in Appendix A provides detailed
descriptions and spreadsheets of all input data for the emissions inventory component of
the air dispersion modeling analysis. Table 4-1 presents the 2005 emissions inventory for
Logan Airport that was modeled in this study.
Table 4-1. Emissions Inventory for Logan Airport, 2005 (kg/year)
Source Category CO NOx PM2.5 SOx VOC
Aircraft 1149808 1193034 21368 111641 434959
GSE 2262228 254757 7425 20161 79166
APUs 48849 22971 4443 3933 3267
Parking Facilities 545896 74347 1137 N/A 111635
Roadways 378889 85137 2596 N/A 37526
Stationary Sources 11382 74169 11626 115507 663
Training Fires 1371 22 375 2 216
Grand Total 4398423 1704437 48970 251244 667432
Meteorological data
34

AERMOD requires both surface and upper air meteorological data inputs. In
addition to obtaining meteorological data for 2005 from the National Weather Service
(NWS), historic meteorological data was obtained for the years 2003-2004 and 2006-2007
for the sensitivity analysis (described below). The NWS operates an Automated Surface
Observation Station (ASOS) that is located amidst several of the runways and taxiways at
Logan Airport. The ASOS station includes an anemometer at a height of 26 feet above the
ground surface, which is well placed to represent the locations of the most important
category of emissions analyzed in this study. The ASOS data includes wind speed and
direction, temperature, dew point and cloud cover. See Figure 4-1 for an example of a wind
rose for 2005 modeling runs. Upper air measurements are required by AERMOD for the
estimation of mixing depths and are taken two times per day at the National Weather
Service station located in Chatham, MA. Use of this station for this study is consistent with
federal and state guidelines.
Surface characteristics
AERMOD calculates the diffusion rates and wind speed profiles using algorithms
based upon an advanced understanding of air flow in the surface boundary layer and upon
how the flow and the turbulent diffusion rates are dependent upon three specific
parameters that characterize the ground or water surface. These parameters are the
surface roughness (roughness length), the surface reflectivity of incoming solar radiation
(albedo) and a measure of the importance of surface moisture in the transfer of heat to the
air above the surface (Bowen ratio). The values of these parameters are obtained from
land use data that was used to create maps for the study area. US EPA’s AERSURFACE
program uses United States Geological Survey (USGS) land use data through an interactive
program to calculate average values of these three surface characteristic parameters based
on latitude and longitude and estimates about seasonal vegetation and snow cover. The
surface characteristics values are input into the AERMET meteorological preprocessor to
determine the dispersion rates in the atmospheric boundary layer.
35

Figure 4-2. Wind rose from weather station at Logan Airport – 2005
36

MAJOR FINDINGS OF AIR DISPERSION MODELING ANALYSIS
Overall findings of modeling 2005 emissions
As mentioned, MDPH/BEH used the most advanced version of EDMS that includes
the most recent emission factors for quantifying source emissions, particularly for aircraft,
and the most recent version of AERMOD, which predicts ground-level air pollutant
concentrations in a specified modeling domain. There have been significant improvements
in the development of emission factors for aircraft and other airport-related sources
incorporated into EDMS. Areas of current research include quantifying ultrafine particle
emissions from aircraft, and the contribution of aircraft tires and brakes to the overall
particulate matter inventory for airports (ACRP, 2008).
AERMOD modeling runs of emissions associated with Logan Airport operations in
2005 were successfully completed and validated using established protocols and methods
(see Appendix A). In addition to the base model, sensitivity analyses for evaluating
uncertainties in the modeling results were also conducted. For example, varying
meteorological data by running the 2005 operations with 2003, 2004, 2006, and 2007
meteorological conditions resulted in concentrations that differed by only 10% from the
values produced using 2005 Base year meteorological data. The average of all four years
was within 5% of the 2005 Base year values. It should be noted that 2005 aircraft activity
was assumed in the modeling of these additional years so the differences in the results
could be attributed only to differences in meteorological conditions for these years.
Extensive review of the input data was also conducted to ensure accuracy and
completeness of data obtained from Massport that was entered into the AERMOD model.
Quality assurance of modeling runs was conducted by reviewing the AERMET quality
assurance checks of the raw observational data and extensive review of final modeling
output.
37

Air pollutant concentrations in the study area
Individual pollutants (CO, NOx, PM2.5, SOx, and VOCs) were modeled and
concentrations were obtained from each of the 635 receptors arrayed in polar grids across
the study area (see Figure 4-2). A summary of the annual average pollutant concentrations
from air dispersion modeling of 205 airport operations is presented in Table 4-2.
Table 4-2. Summary of Annual Average Air Pollutant Concentrations ( g/mμ 3) from Air Dispersion Modeling of 2005 Airport Operations
CO NOx PM2.5 SOx VOC
Annual Average 15.45 3.56 0.11 0.34 1.84
Distribution of air pollutant concentrations in the study area
The distribution of air pollutant concentration data is characterized by much higher
concentrations near the airport that fall off rapidly with increased radial distance from the
airport. This skewed distribution is consistent with the initial survey sampling design that
anticipated higher exposure areas closer to the airport. This is illustrated in Figure 4-3 that
shows the normalized annual average concentrations of NOx and PM2.5 predicted for polar
(or circular) receptors near the airport.
Air pollutant concentrations of individual source categories
The air dispersion modeling results provide information about the contribution of
each of the major source categories (e.g., aircraft, motor vehicles, power plant) to air
pollutant concentrations in the study area. The annual average concentrations for NOx and
PM2.5 for the major source categories in the modeling domain are presented in Table 4-3.
38

Figure 4-3. Modeling Domain for the LAHS
39

Figure 4-4. Normalized Annual Average Concentrations for NOx and PM2.5
40

Table 4-3. Annual Average Concentrations for NOx and PM2.5 Across the Study Area for the Major Source Categories at Logan Airport
NOx Annual Average Concentrations in Modeling Domain ( g/mμ 3)
Aircraft Gates Parking Roadways Stationary Total
Annual Average 1.65 1.08 0.25 0.54 0.05 3.6
PM2.5 Annual Average Concentrations in Modeling Domain ( g/mμ 3)
Aircraft Gates Parking Roadways Stationary Total
Annual Average 0.03 0.05 0.004 0.02 0.01 0.11
Impact of emission source locations at Logan Airport
The dispersion modeling results provide information about the relative impact of air
pollutants by source location. For example, although the emissions of NOx and PM2.5 at
Logan Airport come from sources at different locations and from sources that differ
significantly in emission levels, the EDMS modeling results show that the concentrations of
individual air pollutants are not only strongly correlated with time (hourly, daily, and
annual average values), but also with respect to geographic location of ambient air
concentrations. To evaluate the degree to which the spatial patterns of pollutant
concentrations are similar, the differences between the NOx and PM2.5 normalized
concentrations over the study area are plotted.
Figure 4-4 shows that although the maximum concentrations of both NOx and PM2. 5
occur just to the west of the airport, the higher NOx relative to PM2.5 occurs at the runway
ends and to the east of the airport. These results are attributed by the modeling to aircraft
activities in that location. The higher PM2.5 concentrations relative to NOx that occur to the
west of the airport are presumably attributed to relatively larger fraction of motor
vehicular emissions rates in those areas. Thus, operations near the terminals contribute to
the air pollution concentrations in East Boston. In contrast, the aircraft takeoffs and
landings are the largest contributor to concentrations north and east near Winthrop, and
41

near the ends of other major runways. Both sets of differences fall off rapidly to values less
than 1% with increased radial distances beyond the airport perimeter.
Figure 4-5. Relative Contribution of Predicted NOx and PM2.5 Air Pollutant Concentrations Associated with Logan Airport
42

4.3 AIR POLLUTION EXPOSURE CATEGORIZATION
As discussed previously, the emissions inventory was modeled using a standard
atmospheric dispersion modeling system to estimate air pollutant concentrations from
airport operations across the study area. The modeled concentrations of each of the five
air pollutants (CO, NOx, PM2.5, SOx, and VOCs) were highest near the airport and were
observed to decrease rapidly with increasing distance from the airport. The modeled
concentrations at each receptor were analyzed using ArcGIS Spatial Analyst to create maps
for each air pollutant’s concentrations across the study area. Geocoded household
addresses of survey respondents were overlaid with air pollutant maps to assign an air
pollutant concentration to each household using inverse distance weighting (IDW)
interpolation. IDW considers the values of sample points (receptors) and the distance separating
them (i.e., nearest neighbor) to estimate the value at each respondent address. The inverse of the
squared distance is the simplest and most commonly used format of distance-weighting, giving
higher weight to closer observations (US EPA, 2004). Given the high density of the receptor
grid, particularly close to the airport where concentrations have the most variability, IDW
interpolation provided a consistent approach for considering local-scale pollutant variability in
assigning concentrations to each of the households.
Pollutant concentrations were evaluated for several averaging times (annual
average, 24-hour maximum, and 1-hour maximum) and were found to be highly correlated
(Spearman correlation coefficients of 0.96 or higher) and geographically similar across
averaging times. In other words, for example, areas/respondents with the highest modeled
annual average NOx concentrations also had the highest modeled 24-hour and 1-hour
maximum NOx concentrations. For this reason, only annual average pollutant
concentrations were used in further analyses to categorize exposure to airport-related
pollutants in the surrounding communities. From a statistical standpoint, the annual
average is the preferred choice as it is the average of the largest number of individual
predictions at each receptor and, thus, represents the lowest variability or uncertainty
compared to other averaging times.
43

Correlation analyses of air pollutant concentrations assigned to each household also
confirmed that the annual averages of all five modeled air pollutants (CO, NOx, PM2.5, SOx,
and VOCs) were highly correlated with one another with Spearman correlation coefficients
greater than 0.99 for all associations (Table 4-4). Therefore, a combined exposure variable
was developed to categorize study participants based on their exposure to all five targeted
compounds.
Table 4-4. Spearman Correlationsa of LAHS Annual Average Pollutant Concentrations from Air Dispersion Modelingb
CO NOx PM2.5 SOx VOC
PM2.5 0.998 0.997 1.000 0.997 0.999
NOx 0.992 1.000 0.997 0.998 0.995
SOx 0.991 0.998 0.997 1.000 0.994
CO 1.000 0.992 0.998 0.991 0.999
VOC 0.999 0.995 0.999 0.994 1.000
aPearson correlation results were similarly strong. See Appendix A, Table 12.bP-values for all correlations are <0.0001.
Visualization of the concentrations of each pollutant assigned to households across
the study area using histograms revealed that the distribution of concentrations followed a
logarithmic function. Annual average concentrations of each pollutant were categorized
into three categories: high, medium, and low areas. These categories were chosen based on
the following considerations: identifying the upper distribution of pollutant concentrations,
understanding the scientific literature related to the health effects of the targeted
compounds, and weighing epidemiologic considerations (such as selecting a “low” group
that is truly low, isolating the highest exposed group as much as possible, and maintaining
sample sizes in each group that would be large enough to enable detection of any
associations present). Thus, each household was categorized as follows for exposure to
each air pollutant: the low category included all respondents whose modeled
concentrations were less than or equal to the median value (i.e., 50th percentile); the
44

medium category included all respondents whose concentrations were above the median,
but less than or equal to the 80th percentile; and the high category included all
respondents whose concentrations were above the 80th percentile. The range of modeled
air pollutant concentrations based on these cut-points and the number of respondents
assigned to the high, medium, and low exposure areas for each pollutant are presented in
Table 4-5.
Table 4-5. Range of Modeled Air Pollutant Concentrations Associated with the High, Medium, and Low Exposure Categories for Each Pollutant
Exposure Level
Number (%) Respondent
s
Range of Exposure (µg/m3)
CO NOx PM2.5 SOx VOCs
Low 3034 (50%)0.57 -
3.88
0.14 -
0.77
0.005 -
0.030.03 - 0.11
0.08 -
0.50
Medium 1834 (30%)3.88 -
11.4
0.77 -
2.470.03 - 0.09 0.11 - 0.34
0.50 -
1.53
High 1204 (20%) 11.4 - 1092.47 -
15.00.09 - 0.65 0.34 - 1.39
1.53 -
11.6
Of the 6,072 individuals in the study, 93% were assigned the same categorization
(high, medium, or low) for all five targeted air pollutants based on the cut-points described
above. Only 420 (7%) were assigned to different categories based on different pollutants;
some were categorized to both low and medium exposure groups and some were
categorized to both medium and high exposure groups. None were assigned to both low
and high categories. For the combined exposure variable, these 420 individuals were
assigned to the exposure category most represented by the five pollutants (i.e., the
exposure category assigned to three or more of the five air pollutants). The combined
exposure variable was used for all subsequent analyses of associations between health
outcomes and airport-related air pollution. The estimated exposure areas associated with
assigning high, medium, and low exposures to respondents is illustrated in a map of the
study area in Figure 4-5.
45

To further evaluate the choice of averaging time, combined exposure variables were
created for maximum 24-hour and 1-hour pollutant concentrations, as well. Using the same
percentile cut-points for high, medium, and low exposure areas, there was a 95%
agreement in respondent categorization when using annual average versus 24-hour
maximum concentrations and a 90% agreement when comparing annual average to 1-hour
maximum concentrations.
Figure 4-6. Estimated Exposure Areas Based on Assigning High, Medium, and Low Exposure Areas to Respondents
46

4.4 CONSIDERATION OF NON-AIRPORT RELATED BACKGROUND AIR POLLUTION
Exposure to air pollution from sources not associated with Logan Airport was taken
into consideration as a potential confounding factor in the analysis. Air pollutants similar
to those emitted from airport sources are present in the airshed across the study area from
sources such as vehicle exhaust, power plant emissions, and other industrial processes.
Given the variability of air pollutants across the study area and other factors that influence
exposure (e.g., activity patterns), residents living in the study area are not likely to be
equally exposed to these background air pollutants. To account for the variability of
background air pollution exposure in the analysis, two measures of air pollution exposure
were developed (see Appendix B).
First, each household respondent was assigned an annual average predicted
background PM2.5 concentration based on measurements from the ambient air monitoring
station nearest their home. The Massachusetts Department of Environmental Protection
operates air quality monitoring stations that measure and report air pollution levels across
the study area. These background air pollution levels represent a general measure of the
best available air quality data across the study area. Since air pollution monitoring data
may be influenced by both airport and non-airport related emissions, the predicted
background PM2.5 concentrations assigned to each respondent were adjusted by
subtracting the airport-related contributions of PM2.5 that were estimated for each
household using air dispersion modeling of airport operations (see Appendix B for more
details on the derivation of background pollutant concentrations for this study). The
derived background PM2.5 concentrations assigned to each household were then included
in all multivariate regression analyses (as discussed in upcoming Chapter 5) of associations
between health outcomes and estimated airport-related air pollution exposure.
47

To provide context of background concentrations, the annual average predicted
concentrations from modeled airport operations at Logan Airport assigned to each
respondent were compared to the annual average monitored PM2.5 background value
assigned to each respondent (see Table 1 in Appendix B). The ratio of predicted PM2.5
contributions from Logan Airport to the background air pollutant monitored values for all
respondents is about 0.0063. Since this ratio includes a large number of predictions at large
distances from the airport, ratios were also calculated for those households with the
highest predicted Logan Airport concentrations. These include ratios of Logan Airport to
background for the 3% of households with predicted Logan Airport PM2.5 concentrations
that exceed 50% of the maximum value and the 0.6% of households with concentrations
that exceed 75% of the maximum value. For those exceeding 50% and 75% of the
maximum predicted Logan Airport PM2.5 value, the ratio of Logan Airport contributions to
background estimates are also low (0.033 and 0.042, respectively).
Second, respondents were categorized based on their proximity to major roadways.
Recent health studies of near-roadway exposures (100-300 meters) have found increased
risk of respiratory and cardiovascular impacts (Hoffman et al, 2009; Lindgren et al, 2009).
For the purposes of this study, major roadways were defined as those having average daily
traffic of more than 20,000 vehicles (MassDOT, 2012).
Using ArcGIS spatial analyst tools, respondents located within 200 meters of a major
roadway were identified, and an indicator variable for this was included in multivariate
analyses. The map in Figure 4-6 displays the major roadways within the study area and a
200 meter buffer around them.
Figure 4-7. Two hundred (200) Meter Buffer of Roads with Average Daily Traffic of 20,000 Vehicles or More
3 See Table 12 in Appendix A. For example: Average Logan Contribution / Average Background Contribution: 0.07/12.21 =0.006.
48

4.5 EXPOSURE TO NOISE ASSOCIATED WITH AIRPORT OPERATIONS
The LAHS evaluated exposure to noise from airport operations using noise contours
developed by Massport. Since 1981, Federal Aviation Regulations (FAR) require airports to
conduct and implement an airport noise and land use compatibility plan (FAR Part 150).
These regulations also establish US FAA’s Integrated Noise Model as the noise model to be
used for analyzing aircraft noise.
49

Noise is generated primarily from aircraft operations at Logan Airport. Using US
FAA’s INM model, Massport models noise by considering the number of operations, types
of aircraft operating during the day and night, use of runway configurations, and location
and frequency of flight paths to and from the runways. Since 2002, Massport has
incorporated several enhancements to the noise modeling analysis for Logan Airport to
more accurately estimate sound propagation into surrounding neighborhoods. These
modeling enhancements include consideration of the surrounding water and terrain
characteristics, use of advanced radar data system (i.e., PASSUR) to collect radar-based
operations data, and specialized software to produce noise contours based on every
individual radar trace, which improves the spatial dispersion of the radar tracks.
US FAA regulations require that airports use annual Day-Night Sound Level (DNL)
contours to evaluate airport noise and adhere to land use guidelines. The guidelines
restrict the building of residences, schools, hospitals or churches in areas within a DNL of
65 dB or above. A DNL of 65 dB or above is considered compatible for residential land use
only if they are insulated from sound. Massport produces annual DNL contours that range
from 60-75 dB at 5 dB increments and reports the estimated number of the people residing
within various increments of modeled noise exposure (see Figure 4-7). Massport also
provides alternative noise metrics that include the “Cumulative Noise Index” (CNI) and
“Time Above” (TA) various threshold sound levels. However, since these metrics are only
reported at the monitoring stations, they do not provide sufficient spatial coverage for
assessing noise exposure across the entire study area.
Massport also operates a noise monitoring system at 30 locations around the
airport. This system separates aircraft noise events from other local sources of noise and is
limited to the measurement of airport-related noise only; it does not include background
noise levels. Thus, background noise is not incorporated into the modeled noise contours
and is explicitly subtracted from the noise monitoring data in order to be able to compare
the noise modeling with the noise monitoring data. Massport compares the noise
monitoring data to the modeling data and presents the differences between monitoring and
modeled values in the annual EDR.
50
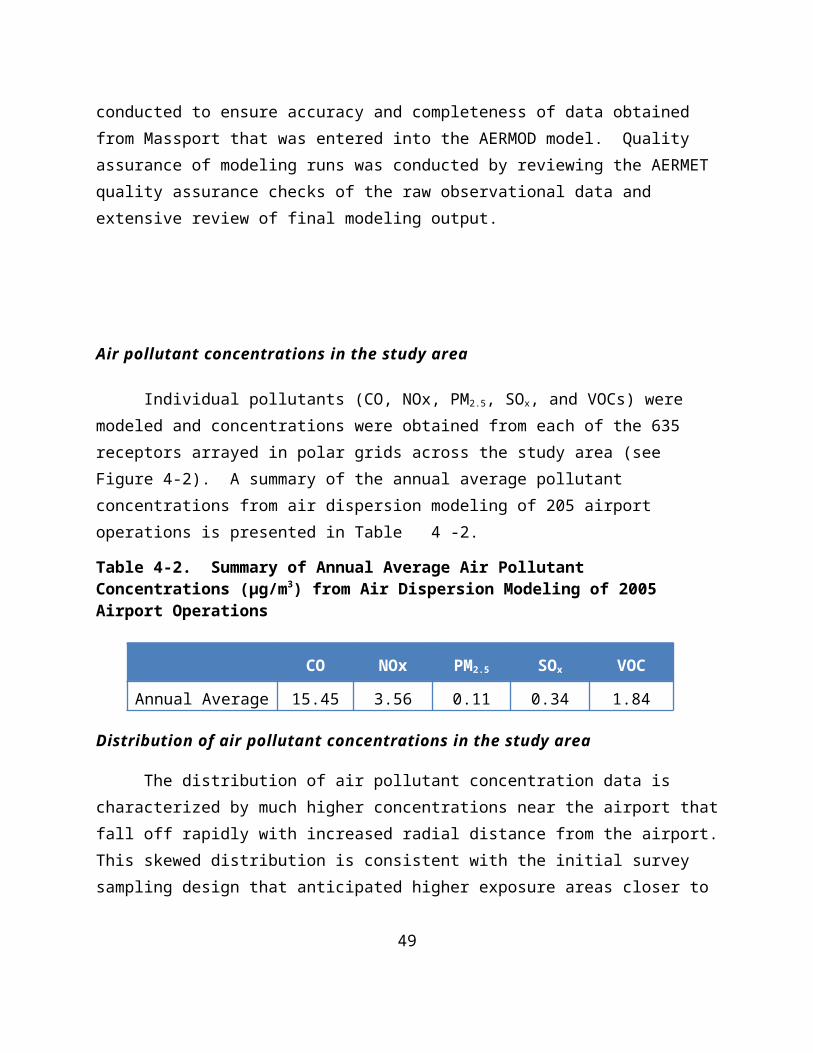
For airport-related noise, modeled noise contours were readily available from the
extensive noise assessment program that Massport implements using US FAA’s computer
modeling program (Integrated Noise Model or INM) and supplemental analysis of
measured noise levels around the airport used to implement a noise abatement program.
As discussed above, the exposure level that was deemed appropriate for assessing
the potential impacts of NIHL is the health-based guideline to protect against hearing
impairment. This guideline states that health impacts are unlikely for individuals exposed
to cumulative noise exposure over a 24-hour period of less than or equal to 70 dB [Leq(24)
=<70 dBA-weighted noise]4 (US EPA, 1974, WHO, 1999). This guideline value indicates
that the risk for hearing impairment would be negligible for a cumulative noise exposure
below 70 dB on a daily basis over a lifetime. Assuming the equal energy principle5 the
annual DNL represents the daily (24-hour) cumulative noise exposure (i.e., not average)
that has been averaged over a one-year period. The annual DNL differs from the
cumulative noise exposure metric (Leq(24)) because the DNL adds 10 dB to each nighttime
flight (i.e., each nighttime noise event as if it occurred 10 times).
Review of the 2005 noise contours indicated that the 70 dB contour did not include
a sufficient number of respondents to assign to the high noise exposure category. As a
result, the 65 dB noise contour was selected as the high exposure area, the medium
exposure area is defined by households located in the 60-64 dB noise contour, and
households located in the 59 dB and less noise contour are assigned to the low exposure
area.
Figure 4-8. Massport DNL Contours for 2005 Operations at Logan Airport
4 US EPA identified 4000 Hz as the most noise-sensitive frequency to be protected. The noise level chosen to protect against hearing loss up to and including the 96th percentile of the population, was ranked according to decreasing ability to hear at 4000 Hz.
5 The equal energy principle is the theory that the hazard to hearing is determined by the total sound energy (the product of sound intensity and duration) entering the ear each day.
51
52

5 DATA ANALYSIS
5.1 OVERVIEW
Three main classes of health outcomes (respiratory, cardiovascular, and auditory)
were evaluated among adults. For children, health outcomes evaluated included
respiratory and auditory effects. Univariate analyses were used to describe unadjusted
associations between prevalence estimates of specific health outcomes and the distribution
of social, demographic, and other characteristics of the study population. Univariate
analyses also identified potentially important covariates that were considered in
subsequent multivariate analyses.
Multivariate analysis (multiple logistic regression) was used to determine possible
associations between the prevalence of targeted health outcomes and residence in low,
medium, or high exposure areas while adjusting for potentially confounding factors. In
addition, dose-response analyses were conducted to determine the significance of
observed trends of increased prevalence of targeted health outcomes across exposure
areas.
All analyses were conducted using SUDAAN, a statistical package designed for use
with complex sampling methodologies, which incorporates weighting and variance
calculations associated with the complex RDD sample design.
5.2 SURVEY DATA PREPARATION
HANDLING OF MISSING VALUES
In instances where survey respondents refused to answer or did not know the
answer to a particular question, missing values were present in the data set. To avoid the
exclusion of these individuals in the analysis, missing values on key demographic variables
(age, sex, race, ethnicity, and household income) were replaced through imputation. Data
imputation is a standard procedure in RDD surveys that determines the likely value of a
53

given variable based upon other known characteristics, either of the respondent or of
another respondent with similar characteristics. All missing values for sex and some
missing values for race and ethnicity were logically imputed. The remaining missing values
for race and ethnicity were replaced using the “hot deck” method in which a missing value
is replaced with the value reported by a similar respondent. Lastly, regression-based
imputation was used to fill in missing values for age and household income.
With the exception of household income, which was missing for 13.6 % (n=828) of
respondents, the rate of missing values was less than 5% for the five key demographic
variables (sex = 7 (0.1%), race = 149 (2.5%), ethnicity = 51 (0.8%), age = 303 (5.0%)). A
sensitivity analysis using both the imputed and non-imputed variables for comparison was
conducted to ensure reliability of the results.
Missing values for variables other than age, sex, race, ethnicity, and household
income were not replaced. However, a few variables did have higher rates of missing
values. For example, body weight (and, therefore, BMI) was missing for 13% of adults and
household size (and, therefore, poverty income ratio or PRI) was missing for 14% of adults.
For these and other important categorical covariates with sizable amounts of missing data,
an extra category was added to indicate a missing response and retain individuals with
missing data in multivariate analyses.
SURVEY WEIGHTING METHODOLOGY
To account for complex survey designs, such as over-sampling of particular parts of
a study area, survey data are often weighted. Weighting helps to prevent any biases that
might occur because of differences between respondents and non-respondents (including
those that weren’t available for interview such as those without a working home
telephone). The probability of being selected for the study varies for different people. For
example, households with more than one telephone number have a higher probability of
being selected into the sample. Therefore, weights are created to adjust the survey data so
that it reflects a random sample of residents living in the study area and so the results can
be considered a valid representation of the entire study area population.
54

Sampling weights for each person were created to include three types of
adjustments. The “base weight” component accounts for the size of the overall survey
sample and the sizes of the “high, and “medium” exposure area oversamples relative to the
overall population of the study area. The “non-response weight” component takes into
account the probability of being selected into the study based on the probabilities of
various events occurring at each step during the survey process. These events include the
probability of having a working home telephone number, of having one’s telephone
number be included among the working residential numbers dialed as part of the RDD
sample of telephone numbers, of being the randomly selected adult in a contacted
household, and of being able and available to complete the survey. During the survey
interview, some questions are designed to collect information needed to calculate the non-
response component of the sampling weights. Answers to certain questions, for instance,
enable an estimation of the rate of telephone service interruption in the study area.
The final component of the sampling weights, referred to as a “post-stratification
weight,” is designed to correct for differences in certain characteristics (age, sex, race,
ethnicity) among survey respondents compared to the study area population as a whole.
This adjustment normalizes the demographic data of the survey sample to match the actual
demographic characteristics of the study area population. To ensure that differences in
demographics across the study area were accurately represented by the post-stratification
weighting, the study area was divided, by zip code, into 18 smaller sections so that no sub-
section contained fewer than 20 cases. Using 2000 US Census data, weights were created
to adjust demographics in each of the 18 sub-sections to the actual demographics of the
populations within those zip codes. Adjustments were made for age (18-34, 35-49, 50-64,
65+), sex (male, female), race (white, black, other), and ethnicity (Hispanic, non-Hispanic).
Finally, in order to reduce inflated design effects caused by extreme values in the
distribution of survey weights, a weight-trimming procedure was performed. Weights
larger than the chosen cut-off value of 4 times the mean of the sampling weights were
trimmed at the cut-off value. The trimmed weights were then re-distributed across the
sample to maintain the total weighted population size. This procedure resulted in weights
55

being trimmed for only a small number of subjects; 168 adults (2.8%) and 30 children
(1.4%).
5.3 HEALTH OUTCOME DEFINITIONS
RESPIRATORY
Using information gathered from the LAHS survey instrument, the prevalence of
asthma and respiratory symptoms were evaluated in a number of ways designed to capture
varying degrees of illness and the presence of diagnosed and un-diagnosed asthma.
1. Lifetime asthma: A “yes” response to the question, “Has a medical doctor ever
told you that you have asthma?”
2. Current asthma: Those with lifetime asthma who also replied “yes” to the
question, “Do you still have asthma?”
3. Current asthma with medication use: Those with current asthma, who replied
“yes” to the question, “Are you currently using medications prescribed by a
medical doctor for your asthma?”
4. Probable asthma, adults: Those who reported never being diagnosed with
asthma, but reported wheezing with dyspnea within the previous 12 months.
Wheezing was asked as, “wheezing or whistling in your chest at any time” and
dyspnea was asked as, “at all breathless when the wheezing noise was
present.”
5. Probable asthma, children: Those who reported never being diagnosed with
asthma, but were reported to have experienced “wheeze or whistle in the
chest” in the previous 12 months AND either “a dry cough at night apart from a
cough associated with a cold or chest infection” or having “sounded wheezy
during or after exercise.”
6. Asthma hospitalization: Those with current asthma were asked to report the
number of times during the previous 12 months that they either a) visited an
emergency room or urgent care center or b) were hospitalized overnight for
56

asthma. Those who reported at least one incident of either are considered to
be positive for this outcome.
Individual respiratory symptoms such as wheezing, chest tightness, and shortness
of breath were also evaluated. Children were considered to have chronic bronchitis and/or
chest infections if they were reported to have been diagnosed with bronchitis or a chest
infection by a doctor on two or more occasions in the previous 12 months. Lastly, the
prevalence of chronic obstructive pulmonary disease (COPD) was evaluated in adults. A
person was considered to have COPD if they reported ever being told by a medical doctor
that they have COPD, emphysema, or chronic bronchitis.
CARDIOVASCULAR
The prevalence of two cardiovascular outcomes was evaluated in adults, myocardial
infarction (MI) and coronary heart disease (CHD). For MI, survey respondents were asked
to report having ever been told by a medical doctor that they had a “heart attack or
myocardial infarction.” For CHD, they were asked whether they had ever been told by a
medical doctor that they have “angina or coronary heart disease.”
AUDITORY
For adults, auditory outcome questions included a follow-up component to ascertain
age at diagnosis, and only diagnoses at or after age 18 were evaluated. First, adults were
asked if a medical doctor had ever told them that they have a “hearing impairment.” Those
who reported having a hearing impairment were then asked if they currently use a hearing
aid that they began using at or after age 18. Lastly, those with tinnitus were defined as
persons who reported being told by a medical doctor that they have “tinnitus or ringing in
the ears.” For children, those with a hearing impairment were defined by a “yes” answer to
the question of a medical doctor ever having diagnosed the child with a hearing
impairment.
57

5.4 COVARIATE DEFINITIONS AND CLASSIFICATIONS
COVARIATES IN HEALTH SURVEY
The survey instrument was designed to collect information on as many factors, or
covariates, as possible that have been identified in previous studies as being possibly
related to the health outcomes of concern (i.e., respiratory, cardiovascular, and auditory).
Basic demographic factors that were considered include sex (male or female), age
(18-39, 40-69, 70+), race (black, white, other), ethnicity (Hispanic, non-Hispanic), and
Poverty Income Ratio (PIR) which is a measure of one’s household income relative to the
federal poverty guideline for one’s household size. If a PIR is less than 1.0 then the
household’s income is below the federal poverty guideline. If a PIR is 2.0 then the
household’s income is twice the federal poverty guideline. PIR was categorized as follows:
<1, 1-1.99, 2-3.5, 3.5+. Other characteristics considered include educational attainment,
marital status, body mass index (BMI), smoking status (current, former, or never), gastro-
esophageal reflux disease (GERD), alcohol intake, and binge drinking, which was defined as
having five or more drinks on any one occasion during the previous 30 days.
Two occupational exposure measures were considered: reported current workplace
exposure to dust, gas, or chemical fumes and reported lifetime exposure to loud noise at
work for a duration of 3 months or more. A number of variables were considered that
measure potential exposure in the home to various respiratory irritants. These include
potential exposure in the home to: secondhand smoke; NO2 from gas stoves, fireplaces,
kerosene space heaters, etc.; mold; allergens from the presence of pets or cockroaches; and
chemicals such as pesticides, paint, paint stripping, or polyurethane. Respondents were
also asked about the presence of Massport soundproofing on their homes. Several
cardiovascular risk factors were considered including high cholesterol, high blood
pressure, diabetes, and family history of heart disease.
Lastly, a 10-year residential history was taken in order to provide some measure of
each respondent’s length of residency in the area. Respondents were asked to give the
58

location and year of move-in for their current residence and each previous residence in
which they had lived since at least 1995. Notably, this section of the survey was one of the
least completed sections as many people expressed reservations about providing
residential location information. However, we were able to consider length of residence in
the current home for 98% of respondents. In sensitivity analyses, final regression models
were re-run after excluding residents who reported having lived in their current exposure
area (based on current and previous residential address) for less than 1, 3, 5, and 10 years.
5.5 STATISTICAL ANALYSES
DESCRIPTIVE STATISTICS
Descriptive analyses were conducted separately for adults and children to assess
the frequencies (percent of the population) with various socio-demographic
characteristics. The prevalence of other potential factors (covariates) that may be
associated with each specific outcome among adults and children were also estimated.
UNIVARIATE ANALYSES
The prevalence of each health outcome of interest was examined in the total
population and among those living in each category of estimated airport-related air or
noise pollution exposure. Differences across exposure areas for the crude, unadjusted,
prevalence of each outcome were examined by chi-square tests, which were calculated
using SUDAAN survey procedures to account for complex survey design and sample
weighting.
MULTIVARIATE ANALYSES / MODEL-BUILDING
Multiple logistic regression analyses were conducted to examine the associations
between each health outcome of interest and exposure to airport-related air or noise
pollution while controlling for potentially confounding variables. Regression models were
developed to adjust for covariates known to be strong predictors of the health outcome
59

being investigated and/or those found to have a meaningful impact on the exposure-
disease association (defined as a change in the odds ratio (OR) of 10% or more). By
including these additional factors in the regression models, results were adjusted for
potential confounding and the influence other factors may have on any potential
relationships between exposure and a particular health outcome was removed.
All adult respiratory, cardiovascular, and auditory models were adjusted for age,
sex, race, ethnicity, PIR, educational attainment, and smoking status. Respiratory and
cardiovascular outcome models were also adjusted for estimated non-airport-related
residential PM2.5 concentrations and residential proximity (<200 meters) to a major road
(see Section 4.4 for more details). Additionally, respiratory outcome analyses were
adjusted for household indoor smoking, and cardiovascular outcome analyses were
adjusted for family history of heart disease, high blood cholesterol, hypertension, and
diabetes. These variables were chosen a priori based on information in the scientific
literature regarding demographic predictors and risk factors of respiratory, cardiovascular,
and auditory diseases.
Additional covariates were also examined in a backwards elimination confounding
assessment performed as follows. The association between exposure and disease was
assessed in regression models adjusting for all base model variables (those selected a
priori) and all potential confounders. Next, each potential confounder was removed, one-
by-one, from the full model and the resulting OR for the association between exposure and
disease was compared to the OR from the full model. The potential confounder whose
removal was found to cause the least change in the OR (up to a maximum of 10%) was
removed and the process was begun again, this time using the reduced model as the “full”
model in the test. This process was repeated until only those variables causing a change in
effect of 10% or more remained.
The confounding assessment resulted in the inclusion of binge drinking in both
cardiovascular outcome models; the inclusion of BMI, alcohol intake, GERD, and potential
exposure to household chemicals in the asthma hospitalization models; the inclusion of
60

potential exposure to household chemicals in COPD models; and the inclusion of
occupational noise exposure in auditory outcome models. Massport soundproofing was
evaluated as a confounder in adult auditory analyses but was not found to be influential.
Variables included a priori for all children’s respiratory and hearing impairment
models were age, sex, PIR, maternal education, and household indoor smoking.
Respiratory outcome models were also adjusted for estimated non-airport-related
residential PM2.5 concentrations and residential proximity (<200 meters) to a major road
(see Section 4.4 for more details). The confounding assessment performed as described
above resulted in respiratory models being adjusted for the presence of household NO2
sources, household allergens, and household mold and the children’s hearing impairment
model being adjusted for household mold and Massport soundproofing.
Statistical significance was evaluated at the =0.05 level (i.e., p-values <0.05). αResults with p-values between 0.05 and 0.20 were considered to be borderline statistically
significant. Borderline statistically significant results are noted particularly in cases where
estimates show a consistent effect in one direction or another across several analyses or
among similar health outcomes, suggesting a consistent effect.
TREND ANALYSES
As described above, multivariate logistic regression models were used to examine
the likelihood of having a particular health outcome among residents in the low exposure
area compared to those in the medium and high exposure areas. Additionally, trend
analyses were performed to evaluate the possibility of a linear pattern in the likelihood of
having a particular health outcome as the potential for airport-related air pollution
exposure increases across the low, medium, and high exposure areas. Linear trends were
evaluated for each health outcome by modeling the categorical airport-related air pollution
variable as a continuous variable in each final, multivariate logistic regression model based
on the average relative increase in air pollution concentrations that was assigned to
respondents within each exposure area.
61

To account for the exponential distribution of air pollution concentrations across
the study area, exposure values for trend analyses were assigned as follows. First, the
median concentration of each of the five air pollutants was calculated for each exposure
area. Second, the relative increase in concentration was calculated for each pollutant
across the three exposure areas moving from low to medium to high and the average
relative increase was assigned for each exposure category. Thus, the resulting values of 1,
3.09, and 12.56 were assigned in this analysis. A trend was considered significant if the p-
value for this exposure variable, modeled continuously, was less than 0.05 in final,
multivariate logistic regression models.
62

6 RESULTS
6.1 SURVEY RESPONSE RATES
The response rate of a telephone survey is the proportion of eligible households in
the sample that actually complete the survey. Response rates for the LAHS were calculated
using standardized methods established by the American Association of Public Opinion
Research (AAPOR, 2008). A total of 37670 telephone numbers were selected by RDD
methodology for inclusion in the study. Of those, 10091 (26.8%) were identified as eligible
households; 17294 (45.9%) were determined to be ineligible either as a non-residential
number (16745) or an ineligible household (549); and 10285 (27.3%) were classified as
being either residences of unknown eligibility (5443) or numbers that were always busy,
never answered, or only answered by a machine that did not indicate whether or not the
number belonged to a residence (4842).
The challenge in calculating response rates is to estimate how many telephone
numbers of unknown eligibility actually belong to eligible households. There are many
methods of estimating this figure (Smith, 2009), but for the purposes of the LAHS we chose
to apply what is known as the Council of American Survey Research Organizations (CASRO)
or proportional allocation method, which formed the basis of and is equivalent to AAPOR’s
Response Rate 3 (RR3). The proportional allocation method assumes that the proportion
of eligible to ineligible telephone numbers is the same among those that were successfully
classified as it is among those that were unable to be classified. The CASRO or AAPOR RR3
method is known to be a conservative approach that generally produces underestimates of
a study’s response rate, but it is also the most widely used and allows for comparison
across studies. Based on this method, the LAHS survey response rate was calculated to be
35%. To provide what can be considered an upper-bound estimate of the response rate,
we also calculated the AAPOR Response Rate 6 (RR6), which simply assumes that none of
the unresolved telephone numbers belonged to eligible households. Using this method, the
63

LAHS survey response rate would be 60%. The true response rate is believed to fall
between the two estimates.
6.2 POPULATION CHARACTERISTICS
ADULTS
Demographic characteristics are presented in Table 6-1 for the 6072 adults in the
LAHS survey sample, for the study area as a whole based on survey data weighted to be
representative of the overall population, and for MA statewide based on 2010 US Census
data. The majority of survey respondents were white (85%) and non-Hispanic (87%). Ten
percent (10%) of respondents were Black or African-American, and 5% classified their race
as Asian, Pacific Islander, Native Hawaiian, American Indian, or another race. Thirteen
percent (13%) of respondents identified as Hispanic or Latino. Compared to the MA
population statewide, the study area population has a proportionally greater numbers of
Black or African American residents (12% vs. 6%) and fewer White residents (76% vs.
82%).
More women than men responded to the survey (64% vs. 36%). The population is
more evenly distributed between women and men in the study area overall (56% vs. 44%)
and statewide (52% vs. 48%). A little more than half (54%) of the adults surveyed were
between the ages of 40 and 69 years; 31% were aged 18-39 years; and about 15% were
aged 70 years or above. The study area population overall is somewhat younger than that
of the state with 46% vs. 38% of residents being aged 18-39. One third (32%) of adults in
the study area lived in households with incomes less than twice the 2005 federal poverty
guideline. Fourteen percent (14%) had household incomes below federal poverty
guidelines compared to 11% statewide. Almost 90% of respondents had a high-school
diploma or GED; 62% reported educational attainment of at least some college; and 42%
had earned a bachelor’s degree or higher. In the study population overall there was a
somewhat higher degree of educational attainment compared to the state as a whole.
64

Table 6-6. Basic Demographic Characteristics for the 6072 Adult Participants of the Logan Airport Health Study (LAHS) Survey, Study Area Population, and Statewide
Survey Respondents,
Study Area Populationb,
StatewidePopulationc,
Characteristica Percent (%) Percent (%) Percent (%)
RaceWhite 85 76 82Black 10 12 6Other 5 12 12
EthnicityNon-Hispanic 87 90 92Hispanic 13 10 8
SexMale 36 44 48Female 64 56 52
Age18-39 31 46 3840-69 54 42 5070+ 15 12 12
Poverty Index Ratio< 1 15 14 111-1.99 19 18 132-3.5 23 23 n/a3.5+ 41 44 n/aMissing 1 1 -
EducationLess than high-school 10 8 12High-school grad/GED 27 22 28Some college/tech school 20 20 18Bachelor’s degree 23 26 24Graduate school 19 23 18Missing 1 1 -
aMissing values for age, sex, race, ethnicity, and household income were imputed. Poverty Income Ratio (PIR) was calculated using household income and household size; due to missing information on household size, some PIR values are missing. See Chapter 5, Data Analysis, for more information on missing values and imputation.bStudy area population estimates were calculated using survey data weighted to be representative of the study area in terms of race, ethnicity, age, sex, and household
65

income.cStatewide demographics are from the 2010 US Census, which does not calculate PIR prevalence for the same ranges used in this study. PIR statewide prevalence for adults in MA: 2.00-2.99=13%; 3.00-3.99=13%; 4.00+=50%.
CHILDREN
The sample population in the LAHS comprised 2215 children aged 3-17 years living
in 1379 of the 6072 participating households. Information about the children was reported
by adult survey responders. Presented in Table 6-2 are demographic characteristics for
children in the LAHS survey sample, in the study area as a whole based on survey data
weighted to be representative of the overall population, and in MA statewide based on
2010 US Census data.
Slightly more males than females (53% to 47%) were a part of the study’s sample of
children, although in the study area overall and in MA statewide the proportion is 51%
male to 49% female. A little more than half (56%) of the survey children were aged 3-11
years, while the remaining 44% were aged 12-17 years. In the survey area overall and in
MA statewide, the proportion of younger children is slightly higher (61% and 58%,
respectively). Almost half (48%) of survey children lived in households with incomes less
than twice the 2005 federal poverty guideline. Twenty-three percent (23%) had household
incomes below federal poverty guidelines. These figures match those of the study
population, in general, but are higher than the proportion of MA children living in
households with incomes less than two times the poverty, which was 29% in 2005. The
mothers of 81% of survey children had a high-school diploma or GED; 57% reported
educational attainment of at least some college; and 36% had earned at least a bachelor’s
degree. These educational attainment figures were similar for the study area population
overall and for the state of MA.
66

Survey Respondents,
Study Area Populationb,
StatewidePopulationc,
Characteristica Percent (%) Percent (%) Percent (%)Sex
Male 53 51 51Female 47 49 49
Age3-11 56 61 5812-17 44 39 42
Poverty Index Ratio< 1 23 24 141-1.99 25 25 152-3.5 21 18 n/a3.5+ 31 33 n/aMissing 0.1 0.03 -
Maternal EducationLess than high-school 17 15 14High-school grad or GED 24 22 19Some college/tech school 21 21 29Bachelor’s degree 23 25 24Graduate school 13 14 14Missing 3 2 -
aMissing values for age, sex, and household income were imputed. Poverty Income Ratio (PIR) was calculated using household income and household size; due to missing information on household size, some PIR values are missing. See Chapter 5, Data Analysis, for more information on missing values and imputation.bStudy area population estimates were calculated using survey data weighted to be representative of the study area in terms of race, ethnicity, age, sex, and household income.cStatewide demographics are from the 2010 US Census, which does not calculate PIR prevalence for the same ranges used in this study. PIR statewide prevalence for children in MA: 2.00-2.99=14%; 3.00-3.99=13%; 4.00+=44%.
Table 6-7. Basic Demographic Characteristics of the 2215 Child Participants of the Logan Airport Health Study (LAHS) Survey, for the LAHS study Area, and for the State Population
67

6.3 DISEASE BURDEN IN THE TOTAL STUDY AREA
ADULTS
Table 6-3 presents the prevalence of targeted respiratory and cardiovascular health
outcomes within the entire LAHS area using weighted sample data to be representative of
the study area in terms of race, ethnicity, age, sex, and household income. For more
information about the weighting process, refer to Chapter 5 (section 5.2.2).
The percentage of people having ever had a diagnosis of asthma (lifetime asthma)
within the study area was found to be 15.5%. A little over one tenth of the population
(11.0%) reported currently having asthma, and 7.7% had current asthma that required the
use of medication. In addition, of those who had never been diagnosed with asthma, 4.6%
reported symptoms indicative of asthma (probable asthma). Of adult asthmatics, 24.7%
reported having had an asthma-related hospital visit in the year prior to the survey.
Diagnosis of COPD was reported by 6.6% of adults. Statewide prevalence of these health
outcomes is provided in the footnotes in Table 6-3.
Within the LAHS area, the prevalence of lifetime asthma, current asthma, and COPD
was higher in 2005 than the statewide prevalence of these diseases; the differences are not
statistically significant. For CHD and MI, the prevalence in the LAHS area is lower than that
of the state as a whole. Again, these differences are not statistically significant.
68

Table 6-8. Prevalence Estimates of Respiratory and Cardiovascular Diseases Among Adults in the Logan Airport Health Study Area (2005)
Health Outcome Sample SizeaPrevalence,
Percent (%)b, c
95% Confidence
Interval
Lifetime Asthma 6055 15.5 (14.3 - 16.8)
Current Asthma 6032 11.0 (9.9 - 12.1)
Current Asthma With Medication Use 6031 7.7 (6.8 - 8.6)
Probable Asthma 5136 4.6 (3.8 - 5.4)
Asthma Hospitalization 673 24.7 (20.2 - 29.1)
Chronic Obstructive Pulmonary Disease (COPD) 6010 6.6 (5.8 - 7.4)
Coronary Heart Disease (CHD) 6008 3.3 (2.7 - 3.8)
Myocardial Infarction (MI) 6019 3.5 (3.0 - 4.1)aSample sizes vary slightly based on the number of "don't know/refuse" responses for each outcome. Additionally, probable asthma was assessed only among those without lifetime asthma, and asthma hospitalizations were assessed only among those with current asthma.bSurvey data were weighted to population demographics to produce prevalence estimates representative of the study area.cStatewide prevalence based on BRFSS and MMWR (for COPD) are as follows: 2005 Lifetime asthma = 14.2% (95% CI: 13.2-15.2); 2005 Current asthma = 9.6% (95% CI: 8.7-10.5);2011 COPD = 5.4% (95% CI: 5.0-5.9); 2005 CHD = 4.0% (95% CI: 3.5-4.5);2005 MI = 4.2% (95% CI: 3.7-4.7).
69

CHILDREN
Estimates of the prevalence of respiratory outcomes among children in the LAHS
area are presented in Table 6-4. The prevalence of health outcomes was calculated using
weighted sample data to be representative of the study area in terms of race, ethnicity, age,
sex, and household income. For more information about the weighting process, refer to
Chapter 5 (section 5.2.2).
The overall prevalence of lifetime asthma among children in the LAHS study area in
2005 was 21.2% compared to the statewide 2005-2007 average among children (14.4%).
The prevalence of current asthma among children in the LAHS was 14.8% of children
compared with the statewide 2005-2007 average of 10.3%. About 12.6% of children in the
LAHS were reported to have current asthma that required the use of medication. Among
children not reported to have been diagnosed with asthma, 3.6% were reported to have
symptoms consistent with asthma (probable asthma). Of the children reported to have
current asthma, 41.0% had visited the hospital for asthma at least once in the previous 12
months. As presented in Table 6-4, for both lifetime asthma and current asthma, the
prevalence in children in the LAHS area is statistically significantly higher than among
children statewide.
70

Table 6-9. Prevalence Estimates of Respiratory Disease Among Children in the Logan Airport Health Study Area (2005)
Health Outcome Sample SizeaPrevalence,
Percent (%)b, c95% Confidence
Interval
Lifetime Asthma 2201 21.2 (18.9 - 23.5)
Current Asthma 2192 14.8 (12.8 - 16.8)
Current Asthma with Medication Use 2191 12.6 (10.7 - 14.5)
Probable Asthma 1749 3.6 (2.5 - 4.7)
Asthma Hospitalization 328 41.0 (33.6 - 48.3)
Chronic Bronchitis/Chest Infections 2203 6.3 (4.9 - 7.7)aSample sizes vary slightly based on the number of "don't know/refuse" responses for each outcome. Additionally, probable asthma was assessed only among those without lifetime asthma, and asthma hospitalizations were assessed only among those with current asthma.bSurvey data were weighted to population demographics to produce prevalence estimates representative of the study area.cStatewide prevalence of children’s asthma from BRFSS data as reported in MDPH (2009):2005-2007 Lifetime asthma: 14.4% (95% CI: 13.0-15.8); 2005-2007 Current asthma: 10.3% (95% CI: 9.1-11.5).
6.4 CRUDE UNIVARIATE RESULTS: PREVALENCE OF HEALTH OUTCOMES BY AIRPORT-RELATED AIR POLLUTION EXPOSURE AREAS
ADULTS
As discussed earlier, the estimated prevalence of some health outcomes for the total
study area was somewhat higher than expected based upon statewide data (refer to Tables
6-3 and 6-4). However, in order to determine if prevalence was higher due to potential
exposure to air pollution related to Logan airport, disease prevalence was evaluated
separately by modeled airport-related air pollution exposure categories.
71

The prevalence estimates for health outcomes in adults are presented in Table 6-5.
The high exposure area, compared to the low exposure area, had a higher prevalence of
current asthma (12.2% vs. 10.8%), current asthma that required medication (9.9% vs.
7.3%), and probable asthma (7.1% vs. 4.4%). Among adult asthmatics, report of an
asthma-related hospital visit was almost twice as common in the high exposure area
compared to the low (40.3% vs. 22.5%). Of these comparisons, none were statistically
significant at an α=0.05 level. However, prevalence of COPD was statistically significantly
different (p = 0.001) across exposure areas, with 11.0% reported in the high exposure area,
7.8% reported in the medium exposure area, and 5.7% reported in the low exposure area.
Cardiovascular diseases were reported with a similar frequency among adults in the
entire study area and across air pollution exposure categories. CHD was found to be
present in 3.3% of the overall study population, and non-fatal MI was experienced by 3.5%
of the overall study population.
72

Table 6-10. Prevalence Estimates of Respiratory and Cardiovascular Diseases Among Adults by Category of Modeled Airport-related Air Pollution Exposure in the Logan Airport Health Study Area (2005)
Prevalenceb, % (95% Confidence Interval)
Sample
Sizea
Exposure Category
Health Outcome Low Medium High
Lifetime Asthma 6055 15.5 (13.9 - 17.1) 15.5 (13.1 - 17.8) 15.9 (12.2 - 19.6)
Current Asthma 6032 10.8 (9.4 - 12.2) 11.2 (9.2 - 13.3) 12.2 (8.7 - 15.6)
Current Asthma with Medication Use 6031 7.3 (6.2 - 8.4) 8.3 (6.6 - 10.1) 9.9 (6.6 - 13.2)
Probable Asthma 5136 4.4 (3.4 - 5.4) 4.6 (3.2 - 6.0) 7.1 (4.8 - 9.4)
Asthma
Hospitalization673 22.5 (17.0 - 28.0) 26.0 (17.5 - 34.4) 40.3 (24.6 - 56.0)
COPD 6010 5.7 (4.8 - 6.7) 7.8* (6.3 - 9.4) 11.0* (8.1 - 14.6)
Coronary Heart
Disease6008 3.5 (2.8 - 4.2) 2.5 (1.7 - 3.3) 3.4 (1.1 - 5.7)
Myocardial Infarction 6019 3.6 (2.9 - 4.4) 3.4 (2.5 - 4.4) 3.2 (1.8 - 4.6)aSample sizes vary slightly based on the number of "don't know/refuse" responses for each outcome. Additionally, probable asthma was assessed only among those without lifetime asthma, and asthma hospitalizations were assessed only among those with current asthma.bSurvey data were weighted to population demographics to produce prevalence estimates representative of each exposure area.*Indicates statistical significance (p-value <0.05) for comparison with the low exposure category.
CHILDREN
Similarly, the prevalence of respiratory outcomes among children was also
examined for those living in each of the three modeled airport-related air pollution
73

exposure areas (Table 6-6). The prevalence of lifetime asthma, current asthma, current
asthma requiring medication, and asthma hospitalizations among children were similar for
the total study area and across all three exposure areas. No clear patterns emerged;
however, probable or undiagnosed asthma was more prevalent in the high exposure area
than in the medium or low exposure areas (7.3% vs. 3.4% and 3.3%, respectively). The
differences were not statistically significant. Similarly, the prevalence of chronic bronchitis
increased as the potential for exposure increased, but the differences were not statistically
significant (8.4%, 7.1%, 5.9%, in the high, medium and low exposure areas, respectively).
Table 6-11. Prevalence Estimates of Respiratory Disease Among Children by Category of Modeled Airport-related Air Pollution Exposure in the Logan Airport Health Study Area (2005)
Prevalenceb, % (95% Confidence Interval)Sample
Sizea
Exposure CategoryHealth Outcome Low Medium High
Lifetime Asthma 2201 22.1 (19.2 - 25.0) 18.5 (14.5 - 22.6) 19.1 (13.6 - 24.7)
Current Asthma 2192 15.2 (12.7 - 17.7) 13.7 (10.1 - 17.3) 14.4 (9.1 - 19.6)
Current Asthma with Medication Use
2191 12.8 (10.4 - 15.1) 11.9 (8.4 - 15.3) 12.7 (7.7 - 17.7)
Probable Asthma 1749 3.3 (2.0 - 4.6) 3.4 (1.1 - 5.8) 7.3 (3.1 - 11.5)
Asthma Hospitalization
328 41.6 (32.5 - 50.6) 38.6 (25.0 - 52.3) 41.5 (23.2 - 59.9)
Chronic Bronchitis/ Chest Infections
2203 5.9 (4.2 - 7.6) 7.1 (4.4 - 9.8) 8.4 (5.1 - 11.7)
aSample sizes vary slightly based on the number of "don't know/refuse" responses for each outcome. Additionally, probable asthma was assessed only among those without lifetime asthma, and asthma hospitalizations were assessed only among those with current asthma.bSurvey data were weighted to population demographics to produce prevalence estimates representative of each exposure area.
74

6.5 ADJUSTED MULTIVARIATE REGRESSION MODELS: ASSOCIATIONS BETWEEN ADVERSE HEALTH EFFECTS AND AIR POLLUTION EXPOSURE AREAS
The prevalence estimates presented in Tables 6-3 through 6-6 are not adjusted for
any demographic or other risk factor information that could partially explain differences
across exposure areas. In order to better isolate the relationship between targeted health
outcomes and estimated exposure to airport-related air pollution, logistic regression
models were developed that assess the relationships while adjusting for demographic
variables and other potentially confounding risk factors. For more information regarding
the development of regression models and the selection of covariates, refer to Chapter 5
(Section 5.4).
ADULTS
Presented in Table 6-7 are adjusted odds ratios for the associations between
respiratory and cardiovascular outcomes and residence in low, medium, or high estimated
airport-related air pollution exposure areas.
While some odds ratios were elevated in the high compared to the low exposure
areas, these associations were not statistically significant. However, results were observed
for the likelihood of having COPD in the high versus low exposure areas approached
statistical significance (OR=1.5, 95% CI: 0.9-2.5). There was no association observed
between air pollution exposure areas and other measures of asthma including lifetime
asthma, current asthma not specified with respect to medication usage, and
probable/undiagnosed asthma.
75

Table 6-12. Estimated Exposure to Airport-related Air Pollution and Adjusted Odds of Respiratory and Cardiovascular Disease Among Adults Living in the Logan Airport Health Study Area (2005)a
Health OutcomeSample
SizeOdds Ratio
Lower 95% CI
Upper 95% CI
p-value
Lifetime Asthma 5829Low 1.0 1.0 1.0Medium 1.0 0.8 1.2 0.77High 1.0 0.7 1.5 0.82
Current Asthma 5806Low 1.0 1.0 1.0Medium 1.0 0.8 1.3 0.93High 1.2 0.8 1.8 0.43
Current Asthma with Medication Use
5805
Low 1.0 1.0 1.0Medium 1.1 0.8 1.5 0.46High 1.4 0.8 2.3 0.20
Probable Asthma 4934Low 1.0 1.0 1.0Medium 0.8 0.5 1.2 0.31High 1.1 0.6 1.9 0.77
Asthma Hospitalizationb 638
Low 1.0 1.0 1.0Medium 1.2 0.6 2.3 0.63High 1.3 0.5 3.7 0.56
aAll models were adjusted for age, sex, race, ethnicity, household income (PIR), education, smoking status, and background air pollution exposure. Respiratory outcome models were also adjusted for household indoor smoking. Cardiovascular outcome models (MI and CHD) were also adjusted for binge drinking, diabetes, hypertension, high cholesterol, and family history of heart disease. Exposure to background air pollution was adjusted using estimated residential background PM2.5 concentrations and residential proximity to a major road (<200 meters).bAnalysis conducted among those with current asthma. Also adjusted for BMI, alcohol intake, GERD, and use of chemicals such as pesticides in the home.cAlso adjusted for use of chemicals such as pesticides in the home.
Table 6-7 continued on page 75
76

Table 6-7 continued
Health OutcomeSample
SizeOdds Ratioa
Lower 95% CI
Upper 95% CI
p-value
COPDc 5689Low 1.0 1.0 1.0Medium 1.2 0.9 1.7 0.22High 1.5 0.9 2.5 0.08
Coronary Heart Disease
5603
Low 1.0 1.0 1.0Medium 0.7 0.4 1.2 0.22High 1.1 0.4 3.1 0.86
Myocardial Infarction 5608Low 1.0 1.0 1.0Medium 1.0 0.7 1.6 0.89High 0.8 0.4 1.7 0.62
aAll models were adjusted for age, sex, race, ethnicity, household income (PIR), education, smoking status, and background air pollution exposure. Respiratory outcome models were also adjusted for household indoor smoking. Cardiovascular outcome models (MI and CHD) were also adjusted for binge drinking, diabetes, hypertension, high cholesterol, and family history of heart disease. Exposure to background air pollution was adjusted using estimated residential background PM2.5 concentrations and residential proximity to a major road (<200 meters).bAnalysis conducted among those with current asthma. Also adjusted for BMI, alcohol intake, GERD, and use of chemicals such as pesticides in the home.cAlso adjusted for use of chemicals such as pesticides in the home.
Although higher prevalences of current and probable asthma were observed in the
high exposure area in crude, univariate, analyses (Table 6.5), when potential confounding
factors were controlled for in this analysis, no differences were observed across the high,
medium, and low exposure areas for the likelihood of current or probable asthma. Tests of
trend were not significant for any of the targeted respiratory outcomes.
77

The likelihood of non-fatal myocardial infarction and coronary heart disease were
not found to be different across air pollution exposure areas. Tests of trend were not
significant for any of the targeted cardiovascular outcomes.
Taking length of residence into account, respiratory and cardiovascular disease
associations were re-evaluated in individuals having lived in their current exposure areas
for at least 1, 3, 5, or 10 years. The results for each length of residence analysis are
presented in Table 6-8. Overall, restricting the analyses to individuals who had lived in
their current exposure areas for 3 or more years and for 5 or more years produced
stronger associations between potential airport-related air pollution exposure and most of
the targeted respiratory outcomes. These stronger associations reach the level of
statistical significance for COPD (3+ years OR=1.8, 95% CI: 1.1-3.0) and are of borderline
significance for current asthma with medication use (5+ years OR=1.7, 95% CI: 1.0-3.0) in
the high exposure area compared to the low exposure area. These stronger associations
did not persist when restricting to individuals with 10+ years residence in their current
exposure areas, possibly due to the loss of sample size or possibly because length of
residence isn’t a strong factor for these outcomes beyond 5 years or so.
For MI and CHD, there is very little change in effect when length of residency in an
exposure area is considered except for the 10+ years analysis. For those longer term
residents, the estimated likelihood of MI is somewhat higher for those in the medium and
high exposure areas compared to those in the low, but the association is not statistically
significant. Conversely, the estimated likelihood of CHD is lower in the medium and high
exposure areas compared to those in the low, but again the results are not statistically
significant
78

Table 6-13. Estimated Exposure to Airport-related Air Pollution and Odds of Respiratory and Cardiovascular Disease Among Adults Living in the Logan Airport Health Study Area Who Have Resided in their Respective Exposure Area for at least 1, 3, 5, or 10 yearsa
79

80
n OR LCI UCI p-value n OR LCI UCI p-value n OR LCI UCI p-value n OR LCI UCI p-valueLifetime Asthma 5511 4711 4061 3076
Lower 1.0 1.0 1.0 1.0 1.0 1.0 1.0 1.0 1.0 1.0 1.0 1.0Medium 1.0 0.8 1.2 0.80 1.0 0.8 1.4 0.78 1.0 0.7 1.3 0.90 0.9 0.6 1.3 0.69Higher 1.1 0.8 1.6 0.60 1.2 0.8 1.7 0.48 1.1 0.7 1.7 0.61 1.0 0.6 1.6 0.97
Current Asthma 5491 4692 4043 3066Lower 1.0 1.0 1.0 1.0 1.0 1.0 1.0 1.0 1.0 1.0 1.0 1.0Medium 1.0 0.7 1.3 0.97 1.1 0.8 1.5 0.41 1.1 0.8 1.5 0.54 1.0 0.7 1.5 0.96Higher 1.2 0.8 1.9 0.32 1.3 0.8 2.0 0.29 1.3 0.8 2.1 0.29 1.1 0.6 1.9 0.71
Current Asthma with Meds 5490 4692 4043 3066Lower 1.0 1.0 1.0 1.0 1.0 1.0 1.0 1.0 1.0 1.0 1.0 1.0Medium 1.1 0.8 1.5 0.62 1.2 0.8 1.6 0.40 1.2 0.8 1.7 0.33 1.0 0.6 1.6 0.96Higher 1.5 0.9 2.5 0.12 1.6 1.0 2.7 0.07 1.7 1.0 3.0 0.05 1.5 0.8 2.7 0.23
Probable Asthma 4673 4007 3459 2646Lower 1.0 1.0 1.0 1.0 1.0 1.0 1.0 1.0 1.0 1.0 1.0 1.0Medium 0.8 0.5 1.3 0.46 0.9 0.5 1.5 0.62 1.1 0.6 2.0 0.81 1.1 0.6 2.3 0.75Higher 1.1 0.6 1.9 0.81 1.1 0.6 1.9 0.88 1.1 0.6 2.1 0.80 1.3 0.6 2.7 0.53
Asthma Hospitalizationb 598 508 436 312Lower 1.0 1.0 1.0 1.0 1.0 1.0 1.0 1.0 1.0 1.0 1.0 1.0Medium 1.2 0.6 2.4 0.60 1.2 0.6 2.7 0.59 1.5 0.7 3.4 0.34 1.6 0.6 4.4 0.40Higher 1.6 0.6 4.5 0.34 1.5 0.5 4.0 0.46 1.6 0.5 4.5 0.42 1.5 0.4 5.2 0.57
COPDc 5394 4619 3990 3031Lower 1.0 1.0 1.0 1.0 1.0 1.0 1.0 1.0 1.0 1.0 1.0 1.0Medium 1.3 0.9 1.8 0.11 1.6 1.1 2.3 0.01 1.6 1.1 2.4 0.01 1.4 0.9 2.2 0.13Higher 1.5 0.9 2.5 0.09 1.8 1.1 3.0 0.02 1.6 0.9 2.8 0.09 1.4 0.8 2.4 0.22
Coronary Heart Disease 5301 4520 3897 2950Lower 1.0 1.0 1.0 1.0 1.0 1.0 1.0 1.0 1.0 1.0 1.0 1.0Medium 0.8 0.5 1.3 0.39 0.8 0.5 1.3 0.37 0.8 0.4 1.3 0.34 0.6 0.3 1.1 0.09Higher 1.3 0.4 3.7 0.67 1.3 0.4 3.7 0.69 1.3 0.4 4.0 0.68 0.7 0.3 1.6 0.39
Myocardial Infarction 5305 4525 3902 2953Lower 1.0 1.0 1.0 1.0 1.0 1.0 1.0 1.0 1.0 1.0 1.0 1.0Medium 1.1 0.7 1.7 0.83 1.0 0.6 1.6 0.94 1.1 0.6 1.7 0.83 1.2 0.7 2.0 0.53Higher 0.9 0.5 1.8 0.79 0.8 0.4 1.7 0.59 0.9 0.4 1.8 0.70 1.2 0.6 2.4 0.65
bAnalysis conducted among those reporting current asthma. Also adjusted for BMI, alcohol intake, GERD, and use of chemicals such as pesticides in the home.cAlso adjusted for the use of chemicals such as pesticides in the home.
Residence 1+ yrs Residence 3+ yrs Residence 5+ yrs Residence 10+ yrs
aAll models were adjusted for age, sex, race, ethnicity, household income (PIR), education, smoking status, and background air pollution exposure. Respiratory outcome models were also adjusted for household indoor smoking. Cardiovascular outcome models (MI and CHD) were also adjusted for binge drinking, diabetes, hypertension, high cholesterol, and family history of heart disease. Exposure to background air pollution was adjusted using estimated residential background PM 2.5 concentrations and residential proximity to a major road (<200 meters).
Health Outcome

CHILDREN
Table 6-9 presents results of multivariate logistic regression models for associations
between estimated airport-related air pollution exposure and respiratory outcomes in
children. There were no differences across respiratory health outcomes in children in the
unadjusted univariate analysis. No associations were observed across air pollution
exposure areas for either lifetime asthma or current asthma that requires use of
medication; nor were asthmatic children in different air pollution exposure areas more or
less likely to visit the hospital for asthma-related illness.
The strongest statistically significant association between air pollution exposure
area and respiratory outcomes in children was observed for the likelihood of probable (or
undiagnosed) asthma, which was 3.6 times higher for children in the high exposure area
compared to those in the low exposure area (OR=3.6, 95% CI: 1.1-11). There was also a
statistically significant trend of higher likelihood of probable asthma in children with
increasing potential exposure to airport-related air pollution (p=0.03).
81

Table 6-14. Estimated Exposure to Airport-related Air Pollution and Adjusted Odds of Respiratory Disease Among Children in the Logan Airport Health Study Area (2005)a
Health OutcomeSample
SizeOdds Ratio
Lower 95% CI
Upper 95% CI
p-value
Lifetime Asthma 2081Low 1.0 1.0 1.0Medium 0.9 0.6 1.3 0.51High 1.0 0.6 1.6 0.94
Current Asthmab 2072Low 1.0 1.0 1.0Medium 1.0 0.7 1.6 0.90High 1.2 0.7 2.3 0.52
Current Asthma with Medication Use 2071
Low 1.0 1.0 1.0Medium 0.9 0.6 1.5 0.75High 1.0 0.5 2.0 0.90
Probable Asthmab 1644Low 1.0 1.0 1.0Medium 1.3 0.5 3.0 0.58High 3.6 1.1 11 0.03
Asthma Hospitalization 319Low 1.0 1.0 1.0Medium 0.6 0.3 1.5 0.33High 1.0 0.3 3.3 0.96
Chronic Bronchitis /Chest Infections 2082
Low 1.0 1.0 1.0Medium 1.2 0.6 2.2 0.61High 1.7 0.7 4.0 0.25
aAll models were adjusted for age, sex, household income (PIR), maternal education, household indoor smoking, household NO2 sources, household allergens, household mold, and background air pollution exposure. Exposure to background air pollution was adjusted using estimated residential background PM2.5 concentrations and residential proximity to a major road (<200 meters).bTest of trend for this association was statistically significant (p<0.05).
82

6.6 ADJUSTED MULTIVARIATE REGRESSION MODELS: ASSOCIATIONS BETWEEN AUDITORY HEALTH EFFECTS AND NOISE EXPOSURE AREAS
Table 6-10 presents results of multivariate logistic regression models for
associations between categories of airport-related noise exposure and auditory health
outcomes in adults and children. Children’s analyses were adjusted for the presence or
absence of home soundproofing obtained from Massport as part of their noise abatement
program. Massport soundproofing was evaluated in adult models, as well, but was not
found to have any effect on the association between noise exposure category and hearing
impairment and so was not included in final models. No statistically significant
associations were observed for either adults or children and confidence intervals were
wide. The direction of effect indicated by the ORs (lower than 1 or higher than 1) varied
for the three outcomes evaluated in adults.
83

Table 6-15. Estimated Exposure to Airport-related Noise and Adjusted Odds of Auditory Impairment Among Adults and Children Living in the Logan Airport Health Study Area (2005)
Health OutcomeSample
SizeOdds Ratio
Lower 95% CI
Upper 95% CI
p-value
Adultsa
Hearing Impairment 5714Low, ≤ 59 dB 1.0 1.0 1.0Medium, 60-64 dB 0.6 0.4 1.0 0.07High, ≥ 65 dB 0.9 0.3 2.5 0.80
Hearing Impairment and Uses Hearing Aidb 3693
Low, ≤ 59 dB 1.0 1.0 1.0Medium, 60-64 dB 0.6 0.2 1.7 0.32High, ≥ 65 dB 1.9 0.2 15 0.54
Tinnitus 5775Low, ≤ 59 dB 1.0 1.0 1.0Medium, 60-64 dB 0.8 0.5 1.5 0.53High, ≥ 65 dB 0.5 0.1 2.1 0.35
Childrenc
Hearing Impairment 2105
Low, ≤ 59 dB 1.0 1.0 1.0Medium, 60-64 dB 0.7 0.3 2.0 0.53High, ≥ 65 dB 1.7 0.4 7.5 0.50
aAll adult models were adjusted for age, sex, race, ethnicity, household income (PIR), education, smoking status, and occupational noise exposure.bHearing impairment combined with hearing aid use was assessed only among adults aged 40 years or greater due to very low prevalence in younger adults.cChildren’s hearing impairment model adjusted for age, sex, household income (PIR), maternal education, household indoor smoking, household mold, and Massport soundproofing.
84
7 DISCUSSION
As directed by the Massachusetts legislature, the MDPH/BEH conducted an
assessment of health impacts of Logan Airport on residents of seventeen communities
located within a 5 mile radius of the airport. With input from key stakeholders, including
residents and local health departments, and from experts in the fields of epidemiology, risk
assessment, survey design and administration, and air pollution modeling, the MDPH/BEH
designed and conducted a cross-sectional disease and symptom prevalence study. The
purpose of the study was to investigate associations between potential exposure to airport
emissions and adverse respiratory, cardiovascular, and auditory health outcomes among
residents of seventeen communities surrounding Logan Airport.
The study area was geographically stratified into three exposure areas based on the
best available data for predicting ambient concentrations of air pollution and noise
associated with operations at the airport. In addition, a sample of residents from across the
study area, statistically representative of the total study area, was interviewed to collect
information on the prevalence of the targeted health outcomes and other relevant
demographic and risk factor information. The prevalence estimates of respiratory,
cardiovascular, and auditory outcomes in the LAHS communities were initially compared to
those of the state of MA to evaluate the general burden of disease in the study area. Finally,
statistical analyses were conducted to address the primary goal of the LAHS, which was to
determine whether residents living in areas with greater potential for airport-related
exposures were more likely to experience the targeted health outcomes compared to
residents living in areas with lesser potential for airport-related exposures. The final
analyses also took into consideration the effects of confounding factors, such as smoking,
which could mask or mimic the Logan-related exposure under study.
Overall, the population of the LAHS area appeared to have a greater burden of current
and lifetime asthma in both adults and children than the state as a whole. In contrast, the
prevalence of cardiovascular disease was lower than observed statewide. Patterns in the
85

prevalence of these outcomes emerged as analyses looked more closely at where individuals
lived in the study area and after accounting for other risk factors for the outcomes
investigated.
Even though current and lifetime asthma appeared to be high in the LAHS total adult
population, when considering the potential for exposure to airport-related air pollution and
other risk factors for asthma, these outcomes did not appear associated with Logan Airport.
Final analyses in adults did indicate that COPD was statistically significantly higher for
residents who lived 3 or more years in the high exposure area.
The more in-depth statistical analyses did not alter the initial conclusion that
cardiovascular disease was not higher in the LAHS population. The reported occurrence of
both heart attacks and coronary heart disease were not found to be associated with potential
exposure to pollutants from the airport.
The strongest results for children were somewhat different from those observed for
adults. Children who lived in the high exposure area had a greater likelihood of undiagnosed
asthma (probable asthma) than children who lived in the low exposure area.
The following discussion presents how the related scientific literature and the
methods employed in the LAHS support its findings. Limitations in the methods and their
possible impact on the results are also discussed.
RESPIRATORY OUTCOMES
The burden of asthma in both adults and children in the LAHS area was found to be
higher than that of the statewide population of adults and children. For children, the 2005
prevalence of asthma (current and lifetime) was statistically significantly higher in the LAHS
area than in the state as a whole. This result is not particularly surprising considering that
the LAHS area is made up of the largest metropolitan region of MA, including the city of
Boston, and it is well-recognized that urban areas tend to have higher rates of respiratory
disease including asthma (Sunyer et al., 1997; Galea et al., 2005; Cohen et al., 2006),
86

particularly among children (Corburn et al., 2006; Clougherty et al., 2007; Gern et al., 2009).
Many factors have been suggested to explain the increased asthma risk in urban areas
including low socioeconomic status (Gern et al., 2009), stress and violence (Williams et al.,
2009), exposure to rodent and cockroach allergens, indoor exposures to mold and
environmental tobacco smoke, and air pollution (Corburn et al., 2006).
The role of air pollution in the higher prevalence of lifetime and current asthma
among adults and children living in the LAHS area is less clear based upon the scientific
literature. Although still under investigation, research on the association between air
pollution exposure and asthma prevalence and/or development has thus far been less
consistent than that of air pollution and exacerbation of asthma and respiratory symptoms.
In children, a large cross-sectional study of asthma (>500,000 children in 105 cities/51
countries) called the International Study of Asthma and Allergies in Childhood (ISAAC),
found no association between change in prevalence in asthma and change in PM2.5 levels
(Anderson et al., 2010). On the other hand, when evaluating traffic-related exposures, most
studies have observed an association with asthma prevalence (Braback et al., 2009; Jerrett et
al., 2008; Lindgren et al., 2010; McConnell, 2006; McConnell et al., 2010; Salam et al., 2008);
however, not all traffic-related exposure studies find an effect on asthma prevalence
(Pujades-Rodriguez et al., 2009). Long term exposure to ozone (O3), in particular, has been
associated with both new-onset asthma in children and increased respiratory symptoms in
current asthmatics (US EPA, 2013). Notably, from 1997-2008, the eastern part of MA
including the LAHS area was designated as being in moderate non-attainment for the US EPA
8-hour ambient standard for ground level ozone (US EPA, 2013).
When specifically investigating the role of the airport on respiratory disease in the
LAHS area, lifetime and current asthma prevalence were not found to be associated with
predicted airport-related exposures for adults or children. However, among children not
diagnosed with asthma, the odds of experiencing asthma-related symptoms (probable
asthma) were 3.6 times higher for those in the high compared to the low airport-related air
pollution exposure area (95% CI: 1.2-11). This finding was statistically significant even after
87

adjusting for numerous other factors including demographic variables, background air
pollution, and household exposures to tobacco smoke, NO2, allergens, and mold.
The increased prevalence of probable asthma has also been observed in other studies
evaluating the associations between exposure to air pollution and respiratory symptoms in
children (US EPA, 2009). Multiple studies of children conducted worldwide have also
observed significant associations between exposure to air pollution, notably particulate
matter, and respiratory symptoms (increase in cough, wheeze and bronchitis) and
impairment of lung function in children (Kim et al., 2012; Penard-Morand et al., 2010;
Schwartz, 2004).
In this study, elevated odds of reporting physician-diagnosed COPD were observed
among adults living in the high versus low airport-related air pollution exposure areas for 3
or more years (OR=1.8, 95% CI: 1.1-3.0). Although smoking is a primary risk factor for
COPD, the association between COPD and the airport exposure category in this study was
observed after adjusting for individual smoking status. Recent studies have suggested that a
large percentage of COPD diagnoses occurring in populations of never smokers (Salvi et al.,
2009). For example, Salvi et al. (2009) cites as evidence the findings from an analysis of
NHANES III data suggesting that 25% of COPD cases in the US are in never-smokers.
Literature related to air pollution and COPD also report significant associations
between outdoor air pollution and COPD exacerbation including increased COPD hospital
admissions and mortality (Samet et al., 2000). A review by Pope et al. (2006a) cites
epidemiologic evidence that long-term PM exposures are associated with lung function
deficits and increased symptoms of obstructive airway disease (e.g., chronic cough,
bronchitis), supporting the biological plausibility of the role of air pollution in exacerbating
COPD. In addition, a small number of studies have evaluated the role of air pollution in the
prevalence of COPD. In a review of studies assessing the association between air pollution
and COPD, Schikowski et al (2013) concluded that results from several studies are
suggestive, but inconclusive, that air pollution is related to the development of COPD.
88

Both short- and long-term exposures to ambient air pollution, notably PM2.5 and NO2,
are associated with exacerbation of respiratory diseases (US EPA, 2009; US EPA 2008). In
the LAHS, there was evidence, though only of borderline statistical significance, that adults
living for 5 or more years in the high air pollutant exposure area had higher odds of current
asthma requiring the use of medication (OR=1.7, 95% CI: 1.0-3.0). These findings were
adjusted for a number of potential confounding factors including, but not limited to, age, sex,
race, household income (PIR), education, smoking status, and background air pollution.
CARDIOVASCULAR OUTCOMES
Prevalence of cardiovascular disease (CVD) in the LAHS area was found to be slightly
lower than that of the state of MA as a whole, although the confidence intervals for the LAHS
area and MA estimates overlap, suggesting that the differences may not be statistically
significant. Although few studies have specifically examined urban versus rural prevalence
of myocardial infarction or coronary heart disease in the US, the LAHS results appear to be
consistent with those that have. For example, using data from the 2008 BRFSS, O’Connor
and Wellenius (2012) found that the crude prevalence of coronary heart disease was 40%
higher among respondents living in rural versus urban areas of the US. After adjusting for
poverty, obesity, tobacco use, and other risk factors, the prevalence of coronary heart
disease was still found to be higher in rural areas, but only by approximately 10% (O’Connor
and Wellenius, 2012). Separately, in a study of social determinants of CVD risk factors
among men in Georgia, it was found that rural men were almost twice as likely to have two
or more CVD risk factors than were urban men (Quarells et al., 2012).
When looking at cardiovascular morbidity (CHD and non-fatal heart attack) in the
LAHS area by airport-related air pollution exposure category, no differences were observed.
After adjusting for demographic and other risk factors, including diabetes, hypertension,
high cholesterol, and family history of heart disease, the likelihood of CHD and non-fatal MI
was still not different across airport-related exposure categories. Although exposure to air
pollution, particularly PM, has been associated with MI and CHD, more studies have reported
associations with mortality rather than morbidity (Pope et al., 2006a). Given the fact that
89

this study measured self-reported health outcomes, only persons who survived to report
their MI or CHD were included in this study.
To address this limitation, MDPH/BEH analyzed mortality data from the MA Registry
of Vital Records for differences in the crude 5-year average annual MI mortality rate (2001-
2005) between the state of MA as a whole and each of the three airport-related air pollution
exposure areas. Population data were obtained from the US Census and ArcGIS was used to
assign census tracts and estimate total population for each of the LAHS exposure areas. No
statistically significant differences were observed in the average annual MI mortality rates
for each of the LAHS exposure areas and the state as a whole. Per 100,000 adults age 35
years and older, the annual average MI mortality rate was 99 for MA (95% CI: 95-102), 88
for the low exposure area (95% CI: 80-96), 100 for the medium exposure area (95% CI: 84-
116), and 92 for the high exposure area (95% CI: 63-121).
Despite the lack of an association between potential airport-related air pollution
exposure and CVD morbidity (crude and adjusted) or mortality (crude) in this study, it is
well established that both long and short term exposure to ambient air pollution, including
PM and NO2, increases risk of CVD (Atkinson et al., 2013; Peters et al., 2004; Miller at al.,
2007; Schwartz et al., 1995; Wellenius et al., 2006). Therefore, the lack of an association in
this study suggests that airport-related exposures were not high enough to cause detectable
impacts on CHD or MI morbidity in the LAHS area. This does not rule out the possibility that
small effects are present and undetectable with the current study’s sample size and/or
measures of outcome. For example, some studies have found associations between
particulate matter exposure and sub-clinical measures of the development and progression
of cardiovascular disease such as accelerated atherosclerosis, altered cardiac autonomic
function, heart rate variability, and alterations in vascular tone (Brook et al., 2004; Peters et
al., 2002). Also notable is the fact that effect estimates in other studies are relatively small
for associations between air pollution and CVD, particularly in comparison to other CVD risk
factors (Pope et al., 2006a).
90

AUDITORY OUTCOMES
In the LAHS, three auditory endpoints were evaluated in adults (hearing impairment,
hearing impairment with hearing aid use, and tinnitus). One auditory outcome (hearing
impairment), was evaluated in children. This study did not find a relationship between any
of the auditory outcomes evaluated and estimated airport-related noise exposure. Effect
estimates had very wide confidence intervals and the direction of effect was inconsistent
across the three outcomes evaluated in adults.
A recent study has reported NIHL in workers at airports (Pepper et al., 2003) and a
few studies have reported reduced hearing ability in people living near an airport (Chen et
al., 1997) but the data are limited. One reason for not observing an association between
airport-related noise and auditory endpoints in this study may be that residents are not
exposed to sufficient noise levels to induce auditory impairment. The WHO
recommendation for prevention of noise-induced hearing loss (NIHL) is that lifetime average
daily exposure to environmental noise be less than 70 dB (Leq (24) <70 dB). This
recommendation is estimated to prevent impairment in 95% of people exposed at or below
the recommended level over an entire lifetime. Noise contours modeled for the LAHS
suggested that very few residents were exposed to airport-related noise above the 70 dB
WHO recommendation. Due to this fact, and to account for uncertainties in the noise
modeling estimates, the high noise exposure category was defined by the 65 dB noise
contour line. In addition, the WHO guideline value may underestimate auditory effects in
sensitive subpopulations including children. Finally, the Massport noise modeling contours
as defined only predict noise levels associated with aircraft operations in the vicinity of the
airport and not cumulative noise levels that residents are typically exposed to in their
neighborhoods. In a cumulative sense, exposure to levels of airport-related noise below the
WHO guideline could theoretically contribute to auditory impairment. Nevertheless, no
91

measure of hearing impairment was found to be elevated or more likely to occur among
residents living in the high noise exposure area.
Another reason for not observing auditory health effects among residents living in the
high noise exposure area may be due in part to the implementation of Massport’s noise
abatement program, which provides soundproofing of homes and apartments within the 65
dB noise contour. Analysis of survey results indicated that 44% of residents in the high
noise exposure area had received Massport soundproofing and 24% of residents in the
medium exposure area had received the soundproofing (Appendix C).
Although adverse auditory outcomes associated with airport-related noise exposure
were not observed, other health and quality of life endpoints may be influenced by exposure
to airport-related noise. Some of these effects include annoyance, interference with speech
and communication, sleep disturbance, stress, and cardiovascular impacts. This study did
not evaluate these endpoints. Regarding cardiovascular effects, only recently have studies
begun to understand the potential impact of noise exposure on CVD health. For example, the
Schiphol airport study, a multi-airport retrospective study of older people (65 years and
older) in US (Correia et al., 2013, a study of residents living near Heathrow airport (Hansell
et al., 2013) and a study in Switzerland (Huss et al., 2010) have reported emerging evidence
of increased incidence of noise-related cardiovascular effects. A review of the literature of
these studies for the US FAA/NASA/Transport Canada sponsored Center of Excellence
concluded that a pattern of increased incidence of cardiovascular effects, hypertension, and
ischemic heart disease associated with noise appear to have emerged (Swift, 2010).
STUDY DESIGN CONSIDERATIONS
The Logan Airport Health Study (LAHS) was a cross-sectional study. Cross-sectional
studies provide an overview of the rates and patterns of diseases and/or conditions in a
population and provide insight into how they may relate to other characteristics of that area.
Cross-sectional studies can be thought of as providing a snapshot of the population at a
specific point in time. The survey instrument (questionnaire) for this study was designed to
collect information about the prevalence in 2005 of targeted health outcomes within the
92
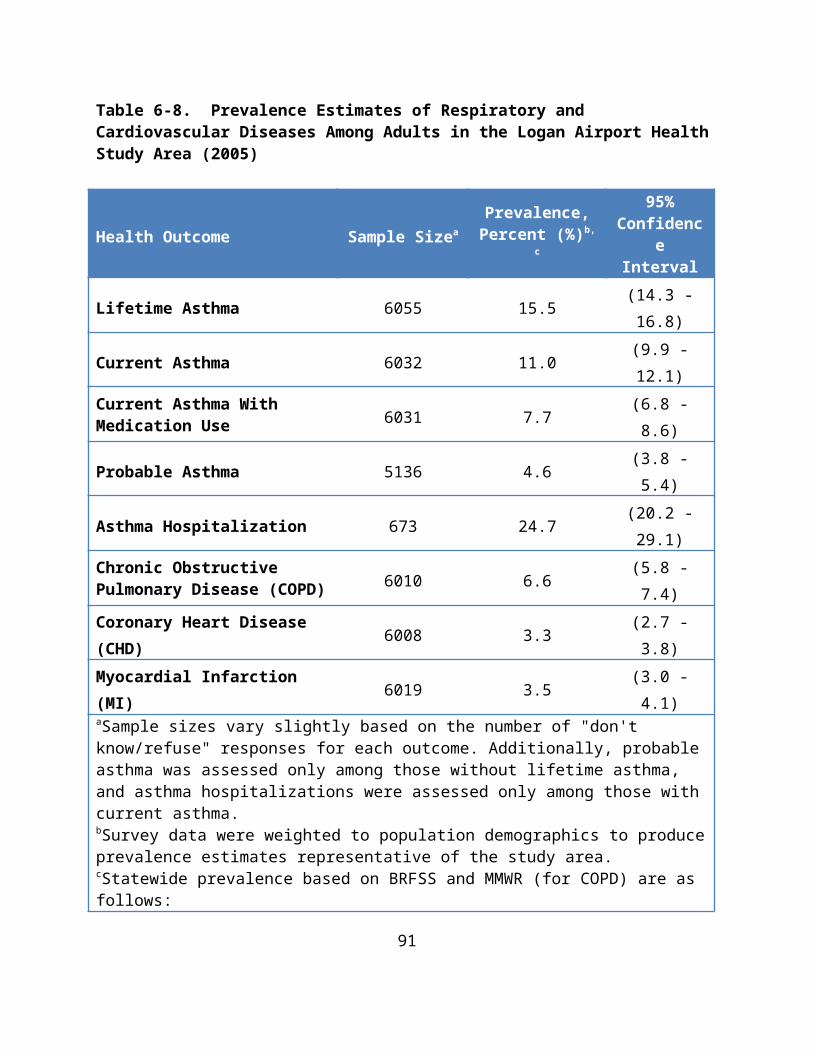
LAHS area as a whole and, separately, within subdivisions of the study area believed to
experience different potentials for exposure to airport-related air pollution and noise in
2005. It may not be possible to distinguish whether an individual’s exposure (i.e., location
of current residence) preceded or followed the occurrence of a health outcome. For this
reason, this study’s findings cannot determine cause and effect relationships, but they can
allow us to demonstrate relative differences in disease burden and to develop inferences and
hypotheses based on observed associations.
The survey instrument also sought to collect information on important potential
confounders such as demographic factors, health behaviors, household and occupational
exposures, and other risk factors for the targeted health outcomes. Although it was not
feasible to collect information on every individual in the study area, techniques of RDD
sampling and post-sampling statistical methodologies (e.g., weighting of study data to
population demographics) work to provide estimates of disease burden and disease-
exposure associations that are meant to be generalizable to the entire study population, both
those who actually participated in the survey and those who did not. Another key aspect of
the survey design was that the study area was divided into estimated exposure areas for the
purpose of oversampling sections of the study area nearest the airport. This was done in
order to achieve sample sizes in those areas sufficient for detecting significant effects should
they be present.
The survey instrument was also pilot tested both in 2002 with a population near an
airport in ME and, later (in 2005), with a small sample of individuals from the LAHS area.
These efforts helped to improve introductory language to encourage participation and to
refine questions for clarity, increasing respondent consistency in answers. One survey
limitation, however, is that health outcome data acquired through a telephone survey are
self-reported and, therefore, may be subject to some error. For all outcomes in this study,
persons were asked to self-report diseases and conditions; medical records review or
physical examinations were not conducted. A technique used to encourage consistency of
reporting for health outcomes in the LAHS was that survey questions regarding specific
health outcomes began, “Have you ever been told by a doctor that you have…?” Another
93

limitation of telephone surveys is that they generally exclude residents that only use cell
phones, although prevalence of cell-phone only households was still relatively low in 2005 at
approximately 7% (Blumberg and Luke, 2007). The LAHS survey also only included only
residents whose primary language was English or Spanish.
There is always the possibility of residual confounding or, in other words, factors
other than the airport that are associated with the targeted health outcomes and that, when
unaccounted for, could either mask effects of the airport or falsely appear as effects of the
airport. However, this study benefited from the availability of data on a multitude of
potential risk factors including smoking status, alcohol intake, occupational exposures to
noise and respiratory irritants, and NO2 sources in the home, to name a few. Multivariate
logistic regression analyses were conducted to simultaneously adjust for these demographic,
lifestyle, and other characteristics known to be risk factors for adverse respiratory,
cardiovascular, or auditory outcomes.
One important example for this study was data collected on smoking status. Although
the low exposure area was found to have a slightly lower prevalence of current smoking
compared to the medium and high exposure areas (17% in the low compared to 21% in both
the high and medium areas, Appendix C), this factor was controlled for by including smoking
status as a covariate in multivariate regression models when looking at respiratory and
cardiovascular outcomes. Other potential confounding factors, such as exposure to
occupational dust and/or fumes, the presence of allergens in the home, and the presence of
mold in the home, were assessed in multivariate regression models but were not found to
have any meaningful impact on respiratory or cardiovascular results.
SURVEY PARTICIPATION
As previously discussed, statistical methodologies (e.g., weighting of the survey
sample based on population demographics of the area) are employed to minimize possible
response bias and help ensure that the results obtained are generalizable not only to all
study participants but to the total study population from which the participants were
selected. Response bias is important to minimize because its presence may reduce the
94

study’s ability to detect associations even if they are present. Survey response rates are one
factor that could affect the presence of response bias.
Although survey response rates are not solely predictive of the presence or absence
of non-response bias in a study (Groves and Peytcheva 2008; Wagner 2012), extremely low
response rates may indicate the need for a deeper assessment of potential bias. Response
rates for telephone surveys have declined steadily over the past few decades, particularly
since the mid-90s when call-blocking and screening technologies skyrocketed (Curtin et al.
2005). Research examining the impact of such declines on selection bias and survey results
has found, overwhelmingly, that lower response rates do not necessarily lead to biased
results and most investigations have concluded that findings are not significantly different
between initial responders and those recruited with more effort (Curtin et al. 2000; Davern
et al. 2010; Keeter et al. 2000).
The Council of American Survey Research Organizations (CASRO) method for
estimating response rates (equivalent to the AAPOR RR3) is considered the most
appropriate for surveys of the type used in the LAHS. It is comparable to other RDD surveys
conducted around the same time period, including for the response rate of the
Massachusetts portion of the Behavioral Risk Factor Surveillance Survey (BRFSS)(CDC
2006). The CASRO or AAPOR RR3 method estimated a response rate for the LAHS of 35%.
Although useful for comparison between studies, research strongly suggests that the
RR3 method produces an underestimate of the true response rate (Brick et al. 2002). The
extent of underestimation varies depending on how much lower the proportion of eligible to
ineligible telephone numbers actually was among unresolved numbers compared to those
that were resolved. In contrast, the AAPOR RR5 response rate achieved for the LAHS (60%)
can be thought of as the upper bound of the true rate.
Another useful indicator of the potential for selection bias is to examine the similarity
or dissimilarity of response rates across different exposure areas. A higher response rate
among communities closer to the airport, for example, could suggest that respondents in
that area were more motivated to participate (although the survey instrument did not
95

identify the airport as a subject of the study). If respondents with personal experiences of
adverse health outcomes are also more motivated to participate, then a higher response rate
in areas closer to the airport could suggest a selection bias.
For the LAHS, response rates were calculated for each of the three stages of RDD
telephone sampling, which were designed to oversample portions of the study area closer to
the airport. For Stage 1, which included telephone numbers across the entire study area, the
RR3 and RR5 response rates were 34% and 60%, respectively. For Stage 2, which included
telephone numbers from the medium and high exposure areas (as defined for survey
oversampling), the RR3 and RR5 response rates were 33% and 59%, respectively. For Stage
3, which included telephone numbers from only the high exposure oversampling area
(within 1 mile of the airport or along a major aircraft flight path), the RR3 and RR5 response
rates were 37% and 62%, respectively. Overall, response rates for the three stages of
sampling were very similar with only a slightly higher rate for Stage 3, suggesting that
residence near the airport was only weakly, if at all, related to the likelihood of participation
in the LAHS.
EXPOSURE ASSESSMENT OF AIRPORT-RELATED AIR POLLUTION
A major strength of this study was the exposure assessment of airport-related
emissions used to classify residential households into categories of low, medium, and high
areas of potential exposure to air pollution from airport-related operations. This study is
believed to be the only study that has assessed the relative contribution of airport-related
emissions using advanced air dispersion modeling to evaluate associations with health
outcomes in the surrounding community. The modeling analysis included all known sources
of emissions and the temporal allocation of emissions from the takeoff and landing of aircraft
by using a schedule of over 350,000 aircraft operations (94% of total 2005 operations)
quantified and provided by Massport. Emissions along flight paths up to an altitude of 3000
feet for takeoffs and landings were also included in the modeling analysis.
The air dispersion modeling allowed us to investigate concentrations of five
pollutants (CO, NOx, PM2.5, SOx, VOCs) across the study area for three different averaging
96

times, 1-hour, 24-hour, and annual. Given the extremely high correlation of estimated
concentrations of the five pollutants across the study area, a combined exposure variable
was developed that encompassed all pollutants. Furthermore, although annual average
pollutant concentrations were selected for developing cut-points for the three exposure
areas, the spatial distribution of pollutants was extremely similar using concentrations for
all three averaging times. In other words, the high exposure area (as defined by the 80th
percentile of annual average pollutant concentrations) also included the highest peak
concentrations (1-hour and daily).
Evaluating three categories of exposure allowed for the clearest assessment of
relative effects between those in potentially high airport-related exposure areas and those in
a potentially low airport-related exposure area. Nevertheless, an analysis using final
multivariate adjusted regression models was also conducted to evaluate air pollution
exposure on a continuous scale using PM2.5 as the model compound in order to be sure that
exposure misclassification from categorization did not limit power to detect associations.
Results from continuous exposure analyses were similar to the categorical exposure
analyses presented in this report (see Appendix D).
There is substantial evidence in the literature that particles are associated with
respiratory and cardiovascular health effects, but there is evidence that other constituents
within the complex mixture may also be relevant to human health outcomes (Hu et al., 2008;
Zhou et al., 2009). The aggregate exposure metric allowed for qualitative consideration of
the complex nature of the combustion of diesel, jet, and gasoline fuels that produce ultrafine,
fine, and course particles, as well as gas or vapor-phase compounds. For this reason,
associations observed in this study cannot necessarily be attributed to exposure to any one
pollutant nor to any specific concentration. Rather, associations observed reflect differences
in the likelihood of certain outcomes among those living in regions of the study area
estimated to experience higher airport-related exposures relative to those living in a region
of the study area estimated to experience lower airport-related exposures.
97

The findings of the air dispersion modeling analysis with respect to levels of
predicted pollutant concentrations, as well as the spatial and temporal variability of those
concentrations across the study area, are consistent with other studies that have modeled
airport operations (Ratliff et al., 2009; Adamkiewicz et al., 2010). In particular, a spatial
gradient was observed such that predicted air pollutant concentrations were highest near
the airport and dropped off rapidly with increasing distance from the airport. The
distribution of predicted air pollutant concentrations was also consistent with monitoring
studies that have detected distinct upwind and downwind emission gradients at airports for
certain pollutants [e.g., NOx (Adamkiewicz et al., 2010), black carbon (Morin, 2007), and
ultrafine particles (Westerdahl et al., 2008)] and a rapid reduction in pollutant
concentrations with distance from the airport.
The complex mixture of air pollutants emitted from large urban airports, such as
Logan Airport, are those characterized by combustion of various types of fuel (e.g., jet fuel,
diesel fuel, and gasoline). As such, airport emissions are similar to pollutants typically found
in urban air including criteria air pollutants and numerous air toxics (Ratliff et al., 2009;
Zhou et al., 2009). As discussed previously, many of these pollutants, including PM2.5, PM10,
SO2, and NO2, have been associated with respiratory and cardiovascular endpoints similar to
those measured in this study.
These health outcomes are consistent with those observed in studies of the impacts of
air pollution at levels found in ambient air. However, comparison of the emissions inventory
modeling of the airport done in this study to the total emissions inventory for the LAHS area
indicates that the airport contributes only a small fraction to the total air pollutants emitted,
which is consistent with emissions inventory studies of most other large urban airports in
the US that have been estimated to contribute only 1-2% of total emissions within a given
airshed (Ratliff et al., 2009). With the exception of probable asthma in children, the
associations observed in this study were of either borderline statistical significance or not
statistically significant. Furthermore, no associations were observed between CVD outcomes
and estimated airport-related air pollution exposure. One possible reason for this is that the
98

incremental contribution of air pollution concentrations from airport-related activities was
relatively small compared to overall background concentrations.
To further assess our observations regarding the contribution of airport-related air
pollution, the average airport-related PM2.5 concentration predicted from modeling the 2005
emissions inventory across the study area (using annual average concentrations) was
compared to PM2.5 background concentrations from the nearest monitoring station, and the
airport contribution was found to be less than 1 percent. For the highest LAHS airport-
related modeled concentrations (those greater than 75% of the maximum), the percent
contribution to background concentrations for PM2.5 was 4.3%. The only study to model the
air pollution emissions inventory for the entire US with and without aircraft emissions found
that the percent increase due to aircraft emissions was about an order of magnitude less
than the LAHS results (0.06% in non-attainment areas and 0.08% in all counties) (Ratliff et
al., 2009). Although there are known uncertainties in the emissions inventory (e.g., mobile
source PM emissions) and in the modeled concentrations, these uncertainties are not likely
to significantly change the overall contribution of emissions to background concentrations.
Although some associations with respiratory outcomes were observed in this study, it may
be that the additional burden of airport-related air pollution to that already present in the
ambient air from other sources is not strong enough for many of those associations to reach
statistical significance given the sample size and study design. Similarly, as noted previously,
it may be that airport-related air pollution exposures were not high enough to cause
observable CVD associations in this study.
Along with the fact that estimated airport-related annual average air pollutant
concentrations were relatively low in the study area, another challenge was the issue of
potential confounding by background air pollution. Background air pollution exposure is not
thought to be uniform across the study area, particularly from residential proximity to major
roadways (Gryparis et al., 2007; Levy et al., 2003). For example, the percentage of people
living within 200 meters of a major roadway was about two times higher in the medium
(22%) and high (24%) exposure areas compared to the low exposure area (13%). Recent
literature identifies associations between proximity to traffic sources and induction of
99

asthma incidence in children, and evidence is suggestive of inducing asthma in adults
(Braback et al., 2009; Lindgren et al., 2010; McConnell, 2006; McConnell et al., 2010; Salam et
al., 2008). Recent studies have also reported an association between traffic-related
exposures and an increased prevalence of COPD (Andersen et al., 2011; Lindgren et al,
2009). For this reason, multivariate analyses in this study were adjusted for residential
proximity to major roads.
To address potential confounding from other major pollutant sources in the study
area, such as those arising from industrial combustion emissions, multivariate regression
analyses also included a measure of monitored background PM2.5 concentrations. Therefore,
this study accounted for both overall background concentrations represented by centrally-
located monitoring stations in the study area and the higher gradient near major roadways
that is not captured by the central monitors. For background air pollution adjustment using
air monitoring station data, PM2.5 concentrations were used because PM has been most
strongly associated with respiratory and cardiovascular health effects in epidemiologic
research (compared to other pollutants such as CO). In addition, a study in Boston of the
relationship between ambient measures of urban air pollution found that PM2.5 data from
centrally-located monitors was strongly associated with personal exposure to PM2.5,
supporting the use of PM2.5 data from central monitors for assessing exposure to PM2.5 in
epidemiological studies (Koutrakis et al., 2005). While NOx is also an important pollutant
with respect to respiratory effects, a recent analysis by US EPA found that centrally-located
monitors are not optimally located to characterize NOx exposures because the monitors were
located primarily to model ozone formation.
Despite adjustment for both of these variables, fully accounting for variation in
personal exposure to background air pollution was not possible in this study and may be a
source of residual confounding, which could either mask effects of the airport or show false
positive associations. For example, the various levels of exposure related to time activity
patterns, such as increased exposure from exercising outdoors could not be considered.
100

A further method employed to isolate the effects of exposure to airport-related air
pollution included consideration of the movement of residents into or out of the study area
over time. An important limitation in the exposure assessment is the potential
misclassification of respondents due to different lengths of residence in the study area. For
example, some study respondents may have developed asthma or experienced a myocardial
infarction prior to moving to their current residence. This type of migration effect could lead
to mis-measurement of disease incidence since arrival in the study area, making it more
difficult to assess true associations that may be present.
This limitation was partially addressed by performing sub-analyses in which
associations were examined only among residents who had lived in their current exposure
area (high, medium, low) for greater than 1, 3, 5, and 10 years. Those analyses indicated that
consideration of migration may help clarify associations of exposure and disease in this
population. For example, when the analyses were restricted to individuals who had lived in
their current airport-related exposure area for at least 3 or more years, associations were
strengthened for most of the targeted respiratory outcomes, including a statistically
significantly higher likelihood of having COPD among adults in the high compared to the low
airport-related air pollution exposure area. The association between airport-related air
pollution exposure category and current asthma with medication use also strengthened with
increasing length of residence from an odds ratio of 1.4 (high versus low; p=0.20) in the total
study population to 1.7 (high versus low; p=0.05) among those with 5+ years residence
(Table 6-8). These findings suggest that the respiratory impact of exposure to airport-
related air pollution increases as the duration of exposure increases. For both COPD and
current asthma with medication use, the association with airport-related exposure category
lessened in the 10+ years of residence analysis, possibly due to loss of sample size or
possibly because length of residence is not as strong a factor for these outcomes beyond 5
years or so.
For cardiovascular outcomes, attempting to refine the exposure measure by
consideration of residential length did not help to elucidate any associations with potential
airport-related exposure. For both MI and CHD, measures of effect (ORs) remained fairly
101

null when restricting analyses to residents with longer lengths of residence. Since CVD
outcomes involve biologic mechanisms that develop over time and involve a long lag time,
one hypothesis was that assessing historical and/or longer exposures may lead to
observable associations. This was not the case and, in fact, review of the scientific literature
reveals that the most robust results of the association between air pollution and CVD risk are
demonstrated in studies using a case-crossover design, which examine short-term, acute
exposures, particularly to PM (Peters et al., 2001;Wellenius et al., 2006).
102

8 CONCLUSIONS AND RECOMMENDATIONS
The major conclusions of the Logan Airport Health Study are as follows:
Air dispersion modeling of airport related emissions using a state-of-the-art model indicates that the highest predicted pollutant concentrations associated with airport-related operations are near the perimeter of Logan Airport and fall off rapidly with increased distance. This is a characteristic of the impact of sources that are primarily located near the ground surface.
Consistent with findings of other airport studies, modeled concentrations of air pollutants are low relative to measured background air pollution concentrations.
Evaluation of associations between airport-related pollutant concentrations and targeted health outcomes among the study area population detected some elevations in respiratory health outcomes in the high exposure area.
Specifically:
Among children, study results identified some respiratory effects indicative of undiagnosed asthma (i.e., probable asthma); children in the high exposure area were estimated to have three to four times the likelihood of this respiratory outcome compared with children in the low exposure area.
Among adult residents, individuals diagnosed with chronic obstructive pulmonary disease (COPD) were statistically significantly more likely to have lived in the high exposure area for three or more years.
There were no statistically significant differences in cardiovascular outcomes in the study population across the high, medium, and low exposure areas.
There were no statistically significant differences with respect to hearing loss in either adults or children for those living in the high exposure area compared to the lowest exposure area.
Recommendations:
The results of this study should be reviewed by Massport and others to determine mitigating steps that can be taken across the study area.
103

Massport has undertaken initiatives to reduce air pollution impacts within their control (e.g., providing infrastructure for compressed natural gas (CNG) fuels and electricity charging stations, Alternative Fuel Vehicle Program). Similar initiatives could be considered in consultation with local communities that would serve to further reduce the burden of indoor and outdoor sources of air pollution on residents in closest proximity to the airport.
Massport has also been working with the East Boston Neighborhood Health Center (EBNHC) to address workforce issues among Massport employees. Massport could expand these efforts with the EBNHC as well as other community health centers to better address respiratory health notably among children in closest proximity to the airport.
While air dispersion modeling indicates that the contribution from Logan Airport operations across the study area is relatively small, air pollution levels are higher in urban areas. Predicted pollutant concentrations were higher near the perimeter of the airport; thus, any methods that can be implemented to continue to reduce airport-related air pollution should be explored.
MDPH/BEH should work with communities within the high exposure area (in whole or in part) on initiatives that would serve to further reduce exacerbation of pre-existing respiratory diseases (e.g., asthma and COPD) among residents.
Specifically:
• MDPH/BEH will continue to support MassDEP’s efforts to reduce motor vehicle emissions including implementation of the Low Emissions Vehicle program and diesel engine retrofit initiatives;
• Upon request MDPH/BEH’s Indoor Air Quality (IAQ) Program staff will work with local municipalities to conduct IAQ assessments in schools and public buildings;
• Upon request MDPH will work with local officials to address concerns that may be associated with local development initiatives;
• MDPH/BEH will collaborate with the MDPH Bureau of Community Health and Prevention’s Tobacco Cessation and Prevention Program on their efforts to work with local boards of health and tobacco-free community partnerships. These efforts enforce youth access and secondhand smoking laws and provide educational/outreach resources to support smoke-free workplace and housing programs.
104

9 REFERENCES
ACOEM. American College of Occupational and Environmental Medicine. Noise-induced hearing loss. October 27, 2002.
ACRP. Airport Cooperative Research Program. Guidance for quantifying the contribution of airport emissions to local air quality. Transportation Research Board ACRP Report 71. 2012.
Adamkiewicz G, Hsu HH, Vallarino J, Melly SJ, Spengler JD, Levy JI. Nitrogen dioxide concentrations in neighborhoods adjacent to a commercial airport: A land use regression modeling study. Environ Health 2010; 9:73.
AAPOR. American Association for Public Opinion Research, Standard Definitions: Final Dispositions of Case Codes and Outcome Rates for Surveys. 4th edition. Ann Arbor: AAPOR, 2008.
Anderson HR, Ruggles R, Pandey KD, Kapetanakis V, Brunekreef B, Lai CKW, Strachan DP, Weiland S. Ambient particulate pollution and the world-wide prevalence of asthma, rhinoconjunctivitis, and eczema in children: Phase One of the International Study of Asthma and Allergies in Childhood. Occup Environ Med 2010; 67:293-300.
Andersen Z, Hvidberg M, Jensen SS, Ketzel M, Loft S, Sorensen M, Tjonneland A, Overvad K, Raaschou-Nielen O. Chronic obstructive pulmonary disease and long-term exposure to traffic-related air pollution. Am J Respir Crit Care Med 2011; 183:455-61.
Anzueto A, Sethi S, Martinez FJ. Exacerbations of chronic obstructive pulmonary disease. Proc Am Thorac Soc 2007; 4:554-64.
Atkinson RW, Anderson HR, Strachan DP, Bland JM, Bremner SA, Ponce de Leon A. Short-term associations between outdoor air pollution and visits to accident and emergency departments in London for respiratory complaints. Eur Respir J 1999; 13(2):257-65.
Atkinson RW, Carey IM, Kent AJ, van Staa TP, Anderson HR, Cook DG. Long-term exposure to outdoor air pollution and incidence of cardiovascular diseases. Epidemiology 2013; 24(1):44-53.
105

Barnett AG, Williams GM, Schwartz J, Best TL, Neller AH, Petroeschevsky AL, Simpson RW. The effects of air pollution on hospitalizations for cardiovascular disease in elderly people in Australian and New Zealand cities. Environ Health Perspect 2006; 114(7):1018-23.
Barnett AG, Williams GM, Schwartz J, Neller AH, Best TL, Petroeschevsky AL, Simpson RW. Air pollution and child respiratory health: A case-crossover study in Australia and New Zealand. Am J Respir Crit Care Med 2005; 171(11):1272-8.
Blumberg SJ, Luke JV. Wireless substitution: Early release of estimates based on data from the National Health Interview Survey, July – December 2006. National Center for Health Statistics. 2007.
Bråbäck L, Forsberg B. Does traffic exhaust contribute to the development of asthma and allergic sensitization in children: Findings from recent cohort studies. Environ Health 2009; 16:8-17.
BRFSS, 2003. Behavioral Risk Factor Surveillance System. Massachusetts Department of Public Health, Health Survey Program. A Profile of Health Among Massachusetts Adults, 2003.
Brick JM, Montaquila J, Scheuren F. Estimating residency rates for undetermined telephone numbers. Public Opinion Quarterly 2002; 66(1):18-39.
Brook RD, Franklin B, Cascio W, Hong Y, Howard G, Lipsett M, Luepker R, Mittleman M. Air pollution and cardiovascular disease: A statement for healthcare professionals from the expert panel on population and prevention science of the American Heart Association. Circulation 2004; 109:2655-71.
Brunekreef B, Janssen NA, de Hartog J, Harssema H, Knape M, van Vliet P. Air pollution from truck traffic and lung function in children living near motorways. Epidemiology 1997; 8(3):298-303.
CDC, 2006. Centers for Disease Control and Prevention. Behavioral Risk Factor Surveillance System. Operational and User’s Guide. Version 3.0. December 12, 2006. Accessed from http://www.cdc.gov/brfss/training/index.htm
106

Chauhan AJ, Inskip HM, Linaker CH, Smith S, Schreiber J, Johnston SL, Holgate ST. Personal exposure to nitrogen dioxide (NO2) and the severity of virus-induced asthma in children. Lancet 2003; 361(9373):1939-44.
Chen TJ, Chen SS. Effects of aircraft noise on hearing and auditory pathway function of school-age children. Int Arch Occup Environ Health 1993; 65(2):107-11.
Chen TJ, Chen SS, Hseih PY, Chiang HC. Auditory effects of aircraft noise on people living near an airport. Arch Environ Health 1997; 52(1):45-50.
Chuang KJ, Chan CC, Su TC, Lee CT, Tang CS. The effect of urban air pollution on inflammation, oxidative stress, coagulation, and autonomic dysfunction in young adults. Am J Respir Crit Care Med 2007; 176:370-6.
Clougherty JE, Levy JI, Kubzansky LD, Ryan PB, Suglia SF, Canner MJ, Wright RJ. Synergistic effects of traffic-related air pollution and exposure to violence on urban asthma etiology. Environ Health Perspect 2007; 115(8):1140-6.
Cohen AJ, Anderson HR, Ostro B, Pandey KD, Krzyzanowski M, Künzli N, Gutschmidt K, Pope CA 3rd, Romieu I, Samet JM, Smith KR. Urban air pollution (Chapter 17). In WHO Comparative Quantification of Health Risks. Global and Regional Burden of Disease Attribution to Selected Major Risk Factors. http://www.who.int/publications/cra/chapters/volume2/part2/en/index.html
Corburn J, Osleeb J, Porter M. Urban asthma and the neighbourhood environment in New York City. Health Place 2006; 12(2):167-79.
Correia AW, Peters JL, Levy JI, Melly S, Dominici F. Residential exposure to aircraft noise and hospital admissions for cardiovascular diseases: multi-airport retrospective study. BMJ. 2013 Oct 8;347:f5561.
Curtin R, Presser S, Singer E. The effects of response rate changes on the index of consumer sentiment. Public Opinion Quarterly 2000; 64(4):413-28.
Curtin R, Presser S, Singer E. Changes in telephone survey nonresponse over the past quarter century. Public Opinion Quarterly 2005; 69(1):87-98.
107

Davern M, McAlpine D, Beebe TJ, Ziegenfuss J, Rockwood T, Call KT. Are lower response rates hazardous to your health survey? An analysis of three state telephone health surveys. Health Services Research 2010; 45(5p1):1324-44.
Delfino RJ, Sioutas C, Malik S. Potential role of ultrafine particles in associations between airborne particle mass and cardiovascular health. Environ Health Perspect 2005; 113(8):934-46.
Dockery DW, Pope CA 3rd, Xu X, Spengler JD, Ware JH, Fay ME, Ferris BG Jr, Speizer FE. An association between air pollution and mortality in six U.S. cities. N Engl J Med 1993; 329(24):1753–59.
Dominici F, Peng RD, Bell ML, Pham L, McDermott A, Zeger SL, Samet JM. Fine particulate air pollution and hospital admission for cardiovascular and respiratory diseases. JAMA 2006; 295(10):1127-34.
EDR, 2006. Boston-Logan International Airport 2006 Environmental Data Report (EDR). Submitted to Executive Office of Energy and Environmental Affairs, MEPA Office by Massachusetts Port Authority Economic Planning and Development. Prepared by Vanasse Hangen Brustlin, Inc. September 2007.
El-Shazly A. Toxic solvents in car paints increase the risk of hearing loss associated with occupational exposure to moderate noise intensity. B-ENT 2006; 2(1):1-5.
Franssen EAM, van Wiechen CMAG, Nagelkerke NJD, Lebret E. Aircraft noise around a large international airport and its impact on general health and medication use. Occup Environ Med 2004; 61:405-13.
Galea S, Freudenberg N, Vlahov D. Cities and population health. Social Science & Medicine 2005; 60(5):1017-33.
Gent JF, Triche EW, Holford TR, Belanger K, Bracken MB, Beckett WS, Leaderer BP. Association of low-level ozone and fine particles with respiratory symptoms in children with asthma. JAMA 2003; 290(14):1859-67.
108

Gern JE, Visness CM, Gergen PJ, Wood RA, Bloomberg GR, O'Connor GT, Kattan M, Sampson HA, Witter FR, Sandel MT, Shreffler WG, Wright RJ, Arbes SJ Jr, Busse WW. The Urban Environment and Childhood Asthma (URECA) birth cohort study: design, methods, and study population. BMC Pulm Med 2009; 9:17.
Groves RM, Peytcheva E. The impact of nonresponse rates on nonresponse bias. Public Opinion Quarterly 2008; 72(2):167-89.
Gryparis A, Coull BA, Schwartz J, Suh HH. Semiparametric latent variable regression models for spatiotemporal modelling of mobile source particles in the greater Boston area. Journal of the Royal Statistical Society: Series C (Applied Statistics) 2007; 56(2):183-209.
Hoffmann B, Moebus S, Kröger K, Stang A, Möhlenkamp S, Dragano N, Schmermund A, Memmesheimer M, Erbel R, Jöckel KH. Residential exposure to urban air pollution, ankle-brachial index, and peripheral arterial disease. Epidemiology 2009; 20(2):280-8.
Hansell AL, Blangiardo M, Fortunato L, Floud S, de Hoogh K, Fecht D, Ghosh RE, Laszlo HE, Pearson C, Beale L, Beevers S, Gulliver J, Best N, Richardson S, Elliott P. Aircraft noise and cardiovascular disease near Heathrow airport in London: small area study.BMJ. 2013 Oct 8;347:f5432.
Heinrich J. Nonallergic respiratory morbidity improved along with a decline of traditional air pollution levels: A review. Eur Respir J 2003; 21(Suppl 40):64-9.
Henry JA, Dennis KC, Schechter MA. General review of tinnitus: Prevalence, mechanisms, effects, and management. Journal of Speech, Language, and Hearing Research 2005; 48:1204-35.
Holguin F, Folch E, Redd SC, Mannino DM. Comorbidity and mortality in COPD-related hospitalizations in the United States, 1979-2001. Chest Oct 2005; 128(4):2005-11.
Hu S, Fruin S, Kozawa K, Mara S, Winer AM, Paulson SE. Aircraft emission impacts in a neighborhood adjacent to a general aviation airport in Southern California. Environ Sci Technol 2009; 43(21):8039-45.
Huss A, Spoerri A, Egger M, Röösli M; Swiss National Cohort Study Group. Aircraft noise, air pollution, and mortality from myocardial infarction. Epidemiology 2010; 21(6):829-36.
109

Ito K, Thurston GD, Silverman RA. Characterization of PM2.5, gaseous pollutants, and meteorological interactions in the context of time-series health effects models. J Expo Sci Environ Epidemiol 2007; 17 Suppl 2:S45-60.
Jerrett M, Shankardass K, Berhane K, Gauderman WJ, Künzli N, Avol E, Gilliland F, Lurmann F, Molitor JN, Molitor JT, Thomas DC, Peters J, McConnell R. Traffic-related air pollution and asthma onset in children: a prospective cohort study with individual exposure measurement. Environ Health Perspect. 2008;116(10):1433-8.
Kappos AD, Bruckmann P, Eikmann T, Englert N, Heinrich U, Höppe P, Koch E, Krause GHM, Kreyling WG, Rauchfuss K, Rombout P, Schulz-Klemp V, Thiel WR, Wichmann HE. Health effects of particles in ambient air. Int J Hyg Environ Health 2004; 207:399-407.
Katsouyanni K. Ambient air pollution and health. British Medical Bulletin 2003; 68:143-56.
Keeter S, Miller C, Kohut A, Groves RM, Presser S. Consequences of reducing nonresponse in a national telephone survey. Public Opinion Quarterly 2000; 64:125–48.
Kim BJ, Hong SJ. Ambient air pollution and allergic diseases in children. Korean J Pediatr 2012; 55(6):185-92.
Ko FWS, Tam W, Wong TW, Chan DPS, Tung AH, Lai CKW, Hui DSC. Temporal relationship between air pollutants and hospital admissions for chronic obstructive pulmonary disease in Hong Kong. Thorax 2007; 62:780-5.
Konings A, Van Laer L, Van Camp G. Genetic studies on noise-induced hearing loss: A review. Ear Hear 2009; 30(2):151-9.
Koutrakis P, Suh HH, Sarnet JA, Brown, KW, Coull BA, Schwartz J. Characterization of particulate and gas exposures of sensitive subpopulations living in Baltimore and Boston. Res Rep Health Eff Inst 2005; Dec(131):1-65; discussion 67-75.
Krewski D, Jerrett M, Burnett RT, Ma R, Hughes E, Shi Y, Turner MC, Pope CA 3rd, Thurston G, Calle EE, Thun MJ, Beckerman B, DeLuca P, Finkelstein N, Ito K, Moore DK, Newbold KB, Ramsay T, Ross Z, Shin H, Tempalski B. Extended follow-up and spatial analysis of the American Cancer Society study linking particulate air pollution and mortality. Res Rep Health Effects Institute 2009; 140:5-114.
110

Lagorio S, Forastiere F, Pistelli R, Iavarone I, Michelozzi P, Fano V, Marconi A, Ziemacki G, Ostro BD. Air pollution and lung function among susceptible adult subjects: A panel study. Environmental Health: A Global Access Science Source 2006; 5:11.
Lee YL, Hwang BF, Lin YC, Guo YL; Taiwan Childhood Allergy Survey Group. Time trend of asthma prevalence among school children in Taiwan: ISSAC Phase I and III Surveys. Pediatr Allergy Immunol 2007; 18(3):188-95.
Leikauf GD. Hazardous air pollutants and asthma. Environ Health Perspect 2002; 110(4):505-26.
Le Tertre A, Medina S, Samoli E, Forsberg B, Michelozzi P, Boumghar A, Vonk JM, Bellini A, Atkinson R, Ayres JG, Sunyer J, Schwartz J, Katsouyanni K. Short-term effects of particulate air pollution on cardiovascular diseases in eight European cities. J Epidemiol Community Health 2002; 56(10):773-9.
Levy JI, Bennett DH, Melly SJ, Spengler JD. Influence of traffic patterns on particulate matter and polycyclic aromatic hydrocarbon concentrations in Roxbury, Massachusetts. J Expo Anal Environ Epidemiol 2003; 13:364-71.
Lin S, Munsie JP, Herdt-Losavio M, Hwang SA, Civerolo K, McGarry K, Gentile T. Residential proximity to large airports and potential health impacts in New York State. Int Arch Occup Environ Health 2008; 81(7):797-804.
Lindgren A, Björk J, Stroh E, Jakobsson K. Adult asthma and traffic exposure at residential address, workplace address, and self-reported daily time outdoor in traffic: A two-stage case-control study. BMC Public Health 2010; 10:716.
Lindgren A, Stroh E, Montnémery P, Nihlén U, Jakobsson K, Axmon A. Traffic-related air pollution associated with prevalence of asthma and COPD/chronic bronchitis. A cross-sectional study in Southern Sweden. Int J Health Geogr 2009; 8:2.
Lloyd-Jones DM, Larson MG, Beiser A, Levy D. Lifetime risk of developing coronary heart disease. Lancet 1999; 353(9147): 89-92.
MacNee W, Donaldson K. Exacerbations of COPD: Environmental mechanisms. Chest 2000; 117(5 Suppl 2):390S-7S.
111

MacNee W, Donaldson K. Mechanism of lung injury caused by PM10 and ultrafine particles with special reference to COPD. Eur Respir J Suppl 2003; 40:47s-51s.
Mannino DM. COPD: Epidemiology, prevalence, morbidity and mortality, and disease heterogeneity. Chest 2002; 121(5 Suppl):121S-126S.
McConnell R, Berhane K, Gilliland F, London SJ, Vora H, Avol E, Gauderman WJ, Margolis HG, Lurmann F, Thomas DC, Peters JM. Air pollution and bronchitic symptoms in Southern California children with asthma. Environ Health Perspect 1999; 107(9):757-60.
McConnell R, Berhane K, Yao L, Jerrett M, Lurmann F, Gilliland F, Künzli N, Gauderman J, Avol E, Thomas D, Peters J. Traffic, susceptibility, and childhood asthma. Environ Health Perspect 2006; 114(5):766-72.
McConnell R, Islam T, Shankardass K, Jerrett M, Lurmann F, Gilliland F, Gauderman J, Avol E, Künzli N, Yao L, Peters J, Berhane K. Childhood incident asthma and traffic-related air pollution at home and school. Environ Health Perspect 2010; 118(7):1021-6.
MDPH, 2009. Burden of Asthma in Massachusetts. MDPH, Asthma Prevention and Control Program. April 2009.
Metzger KB, Tolbert PE, Klein M, Peel JL, Flanders WD, Todd K, Mulholland JA, Ryan PB, Frumkin H. Ambient air pollution and cardiovascular emergency department visits. Epidemiology 2004; 15(1):46-56.
Miller KA, Siscovick DS, Sheppard L, Shepherd K, Sullivan JH, Anderson GL, Kaufman JD. Long-term exposure to air pollution and incidence of cardiovascular events in women. N Engl J Med 2007; 356(5):447-58.
Millstein J, Gilliland F, Berhane K, Gauderman WJ, McConnell R, Avol E, Rappaport EB, Peters JM. Effects of ambient air pollutants on asthma medication use and wheezing among fourth-grade school children from 12 Southern California communities enrolled in The Children's Health Study. Arch Environ Health 2004; 59(10):505-14.
Miyakita T, Yoza T, Matsui T, Ito A, Hiramatsu K, Osada Y, Yamamoto T. An epidemiological study regarding the hearing acuity of residents in the area with high level of aircraft noise: Results of hearing tests conducted in the vicinity of Kadena Air Base. Nippon Eiseigaku Zacchi 2001; 56(3): 577-83.
112

Morin B. TF Green Airport Air Monitoring Study. Presentation at EPA Air Toxics Data Analysis Workshop October 3, 2007. http://www.epa.gov/ttnamti1/files/ambient/airtox/2007-workshop/ 01_100307_ morin.pdf-
Mortimer KM, Neas LM, Dockery DW, Redline S, Tager IB. The effect of air pollution on inner-city children with asthma. Eur Respir J 2002; 19(4):699–705.
NAS, 2005. National Academy of Sciences. Institute of Medicine of the National Academies. Noise and Military Service: Implications for Hearing Loss and Tinnitus. Medical Follow-Up Agency. Committee on Noise-Induced Hearing Loss and Tinnitus Associated with Military Service from World War II to the Present. 2005.
National Asthma Education and Prevention Program. Expert Panel Report 3 (EPR-3): Guidelines for the Diagnosis and Management of Asthma-Summary Report 2007. J Allergy Clin Immunol. 2007 Nov;120(5 Suppl):S94-138. Erratum in: J Allergy Clin Immunol. 2008; 121(6):1330.
NHLBI, 1995. National Heart, Lung, and Blood Institute. National Asthma Education and Prevention Program. Expert Panel Report 3: Guidelines for the Diagnosis and Management of Asthma. Full Report. 2007.
NIDCD, 2005. National Institute on Deafness and Other Communication Disorders, National Institute of Health. http://www.nidcd.nih.gov/health/inside/index.asp
NYS DOH 2006 as cited in U.S. EPA. Integrated Science Assessment for Particulate Matter (Final Report). U.S. Environmental Protection Agency, Washington, DC, EPA/600/R-08/139F, 2009.
O'Connor A, Wellenius G. Rural-urban disparities in the prevalence of diabetes and coronary heart disease. Public Health 2012; 126(10):813-20.
Peel JL, Metzger KB, Klein M, Flanders WD, Mulholland JA, Tolbert PE. Ambient air pollution and cardiovascular emergency department visits in potentially sensitive groups. Am J Epidemiol 2007; 165(6):625-33.
113

Peel JL, Tolbert PE, Klein M, Metzger KB, Flanders WD, Todd K, Mulholland JA, Ryan PB, Frumkin H. Ambient air pollution and respiratory emergency department visits. Epidemiology 2005; 16(2):164-74.
Pénard-Morand C, Raherison C, Charpin D, Kopferschmitt C, Lavaud F, Caillaud D, Annesi-Maesano I. Long-term exposure to close-proximity air pollution and asthma and allergies in urban children. Eur Respir J 2010; 36(1):33-40.
Penn A, Murphy G, Baker S, Henk W, Penn L. Combustion-derived ultrafine particles transport organic toxicants to target respiratory cells. Environ Health Perspect 2005; 113(8):956-63.
Pepper CB, Nascarella MA, Kendall RJ. A review of the effects of aircraft noise on wildlife and humans, current control mechanisms, and the need for further study. Environ Manage 2003; 32(4):418-32.
Perry BP, Gantz BJ (2000) Medical And Surgical Evaluation And Management Of Tinnitus. In: Tyler RS (ed) Tinnitus handbook. Singular, San Diego pp 221-241
Peters A, Dockery DW, Heinrich J, Wichmann HE. Short-term effects of particulate air pollution on respiratory morbidity in asthmatic children. Eur Respir J 1997; 10(4):872-9.
Peters A, Dockery DW, Muller JE, Mittleman MA. Increased particulate air pollution and the triggering of myocardial infarction. Circulation 2001; 103(23):2810-5.
Peters A, Pope CA 3rd. Cardiopulmonary mortality and air pollution. Lancet 2002; 360(9341):1184-5.
Peters A, von Klot S, Heier M, Trentinaglia I, Hörmann A, Wichmann HE, Löwel H. Exposure to traffic and the onset of myocardial infarction. N Engl J Med 2004; 351:1721-30.
Pope CA 3rd. Particulate pollution and health: A review of the Utah Valley experience. J Expo Anal Environ Epidemiol 1996; 6(1):23-34.
Pope CA 3rd, Burnett RT, Thun MJ, Calle EE, Krewski D, Ito K, Thurston GD. Lung cancer, cardiopulmonary mortality, and long-term exposure to fine particulate air pollution. JAMA 2002; 287:1132–41.
114

Pope CA 3rd, Dockery DW. Health effects of fine particulate air pollution: Lines that connect. J Air Waste Manag Assoc 2006a; 56(6):709-42.
Pope CA 3rd, Muhlestein JB, May HT, Renlund DG, Anderson JL, Horne BD. Ischemic heart disease events triggered by short-term exposure to fine particulate air pollution. Circulation 2006b; 114(23):2443-8.
Pope CA 3rd, Thun MJ, Namboodiri MM, Dockery DW, Evans JS, Speizer FE, Heath CW Jr. Particulate air pollution as a predictor of mortality in a prospective study of U.S. adults. Am J Respir Crit Care Med 1995; 151(3 Pt 1):669-74.
Pouryaghoub G, Mehrdad R, Mohammadi S. Interaction of smoking and occupational noise exposure on hearing loss: A cross-sectional study. BMC Public Health 2007; 7:137.
Pujades-Rodríguez M, McKeever T, Lewis S, Whyatt D, Britton J, Venn A. Effect of traffic pollution on respiratory and allergic disease in adults: Cross-sectional and longitudinal analyses. BMC Pulm Med 2009; 9:42.
Quarells RC, Liu J, Davis SK. Social determinants of cardiovascular disease risk factor presence among rural and urban black and white men. J Mens Health 2012; 9(2):120-6.
Quinn FB, Vrabec JT, Rosen EJ. Noise induced hearing loss. Grand Rounds Presentation, UTMB, Department of Otolaryngology. 10 January 2001.
Ratliff G, Sequeira C, Waitz I, Ohsfeldt M, Thrasher T, Graham M, Thompson T. Aircraft impacts on local and regional air quality in the United States. Partnership for AiR Transportation Noise and Emissions Reduction Project. (2009) 15.
Rosenlund M, Picciotto S, Forastiere F, Stafoggia M, Perucci CA. Traffic-related air pollution in relation to incidence and prognosis of coronary heart disease. Epidemiology 2008; 19(1):121-8.
Salam MT, Islam T, Gilliland FD. Recent evidence for adverse effects of residential proximity to traffic sources on asthma. Curr Opin Pulm Med 2008; 14(1):3-8.
Salvi SS, Barnes PJ. Chronic obstructive pulmonary disease in non-smokers. Lancet 2009; 374(9691):733-43.
115

Salvi SS, Manap R, Beasley R. Understanding the true burden of COPD: The epidemiological challenges. Prim Care Respir J 2012; 21(3):249-51.
Samet JM, Zeger SL, Dominici F, Curriero F, Coursac I, Dockery DW, Schwartz J, Zanobetti A. The National Morbidity, Mortality, and Air Pollution Study. Part II: Morbidity and mortality from air pollution in the United States. Res Rep Health Eff Inst 2000; 94(Pt 2):5-70; discussion 71-9.
Schikowski T, Mills IC, Anderson HR, Cohen A, Hansell A, Kauffmann F, Krämer U, Marcon A, Perez L, Sunyer J, Probst-Hensch N, Künzli N.Ambient Air Pollution – A Cause for COPD. Eur Respir J. 2014 Jan;43(1):250-63.
Schwartz J. Air pollution and children's health. Pediatrics 2004; 113(4 Suppl):1037-43.
Schwartz J, Morris R. Air pollution and hospital admissions for cardiovascular disease in Detroit, Michigan. Am J Epidemiol 1995; 142(1):23-35.
Schwela D. Air pollution and health in urban areas. Rev Environ Health 2000; 15(1-2):13-42.
Sioutas C, Delfino RJ, Singh M. Exposure assessment for atmospheric ultrafine particles (UFPs) and implications in epidemiologic research. Environ Health Perspect 2005; 113(8): 947-55.
Slaughter JC, Kim E, Sheppard L, Sullivan JH, Larson TV, Claiborn C. Association between particulate matter and emergency room visits, hospital admissions and mortality in Spokane, Washington. J Expo Anal Environ Epidemiol 2005; 15(2):153-9.
Sliwinska-Kowalska M, Pawelczyk M. Contribution of genetic factors to noise-induced hearing loss: A human studies review. Mutat Res 2013; 752(1):61-5.
Smith TW. "A Revised Review of Methods to Estimate the Status of Cases with Unknown Eligibility," unpublished NORC report prepared for the AAPOR Standard Definitions Committee. 2009. Available at http://www.aapor.org/AM/Template.cfm?Section=Do_Response_Rates_Matter_1&Template=/CM/ContentDisplay.cfm&ContentID=4682.
116

Sullivan J, Sheppard L, Schreuder A, Ishikawa N, Siscovick D, Kaufman J. Relation between short-term fine-particulate matter exposure and onset of myocardial infarction. Epidemiology 2005; 16(1):41-8.
Sunyer J. Urban air pollution and chronic obstructive pulmonary disease: A review. Eur Resp J 2001; 17:1024-33.
Sunyer J, Spix C, Quénel P, Ponce-de-León A, Pönka A, Barumandzadeh T, Touloumi G, Bacharova L, Wojtyniak B, Vonk J, Bisanti L, Schwartz J, Katsouyanni K. Urban air pollution and emergency admissions for asthma in four European cities: The APHEA Project. Thorax 1997; 52:760-5.
Swift H. A review of the literature related to potential health effects of aircraft noise. Partnership for AIR Transportation Noise and Emissions Reduction. An FAA/NASA/Transport Canada-sponsored Center for Excellence PARTNER Project 19 Final Report. 2010. Report No. Partner-COE-2010-003.
Tolbert PE, Klein M, Metzger KB, Peel J, Flanders WD, Todd K, Mulholland JA, Ryan PB, Frumkin H. Interim results of The Study of Particulates and Health in Atlanta (SOPHIA). J Expo Anal Environ Epidemiol 2000; 10(5):446-60.
Ulirsch GV, Ball LM, Kaye W, Shy CM, Lee CV, Crawford-Brown D, Symons M, Holloway T. Effect of particulate matter air pollution on hospital admissions and medical visits for lung and heart disease in two Southeast Idaho cities. J Expo Sci Environ Epidemiol 2007; 17(5):478-87.
U.S. EPA. United States Environmental Protection Agency. U.S. EPA Office of Noise Abatement and Control. Information on Levels of Environmental Noise Requisite to Protect Public Health and Welfare with an Adequate Margin of Safety. March 1974. Accessed from: http://nonoise.org/library/levels74/levels74.htm
U.S. EPA. United States Environmental Protection Agency, 1999. Evaluation of Air Pollutant Emissions from Subsonic Commercial Jet Aircraft. EPA420-R-99-013. Office of Air and Radiation.
U.S. EPA. United States Environmental Protection Agency, 2004. Developing Spatially Interpolated Surfaces and Estimating Uncertainty. EPA-454/R-04-004. Office of Air and Radiation. http://www.epa.gov/airtrends/specialstudies/dsisurfaces.pdf.
117

U.S. EPA. United States Environmental Protection Agency, 2005a. AirData: Access to Air Pollution Data http://www.epa.gov/air/data/.
U.S. EPA. United States Environmental Protection Agency. Integrated Science Assessment for Oxides of Nitrogen – Health Criteria (Final Report). U.S. Environmental Protection Agency, Washington, DC, EPA/600/R-08/071, 2008.
U.S. EPA. United States Environmental Protection Agency. Integrated Science Assessment (ISA) for Sulfur Oxides – Health Criteria (Final Report). U.S. Environmental Protection Agency, Washington, DC, EPA/600/R-08/047F, 2008a.
U.S. EPA. United States Environmental Protection Agency. Integrated Science Assessment for Particulate Matter (Final Report). U.S. Environmental Protection Agency, Washington, DC, EPA/600/R-08/139F, 2009.
U.S. EPA. United States Environmental Protection Agency. Integrated Science Assessment of Ozone and Related Photochemical Oxidants (Final Report). U.S. Environmental Protection Agency, Washington, DC, EPA/600/R-10/076F, 2013.
U.S. EPA. United States Environmental Protection Agency. State Designations For The 1997 8-Hour Ozone Standard (as of September 18, 2009). http://www.epa.gov/airquality/ozonepollution/designations/1997standards/regions/region1desig.htm
US FAA. United States Federal Aviation Administration. Emissions and Dispersion Modeling System (EDMS) User’s Manual. Prepared for Federal Aviation Administration Office of Environment and Energy Washington, DC Prepared by CSSI, Inc., Washington, DC November 2010 FAA-AEE-07-01 (Rev. 8 – 11/15/10)http://www.faa.gov/about/office_org/headquarters_offices/apl/research/models/edms_model/media/EDMS%205.1.3%20User%20Manual.pdf
van Strien RT, Gent JF, Belanger K, Triche E, Bracken MB, Leaderer BP. Exposure to NO2 and nitrous acid and respiratory symptoms in the first year of life. Epidemiology 2004; 15(4): 471-8.
118

von Klot S, Peters A, Aalto P, Bellander T, Berglind N, D'Ippoliti D, Elosua R, Hörmann A, Kulmala M, Lanki T, Löwel H, Pekkanen J, Picciotto S, Sunyer J, Forastiere F; Health Effects of Particles on Susceptible Subpopulations (HEAPSS) Study Group. Ambient air pollution is associated with increased risk of hospital cardiac readmissions of myocardial infarction survivors in five European cities. Circulation 2005; 112(20):3073-9.
Wagner, J. A comparison of alternative indicators for the risk of nonresponse bias. Public Opinion Quarterly 2012; 76(3):555-75.
Wayson RL, Fleming GG, Kim B, Draper J. Derivation of a first order approximation of particulate matter from aircraft. In 96th Annual Meeting of the Air & Waste Management Association. (2006)
Wellenius GA, Schwartz J, Mittleman MA. Particulate air pollution and hospital admissions for congestive heart failure in seven United States cities. Am J Cardiol 2006; 97(3):404-8.
Westerdahl D, Fruin SA, Fine PL, Sioutas C. The Los Angeles International Airport as a source of ultrafine particles and other pollutants to nearby communities. Atmospheric Environment 2008; 42(13):3143-55.
WHO. 1999. World Health Organization Guidelines for Community Noise. http://www.who.int/docstore/peh/noise/noiseindex.html
WHO, World Health Organization 2004. World Health Organization Occupational Noise: Assessing The Burden Of Disease From Work-Related Hearing Impairment At National And Local Levels. Concha-Barrientos, Marisol, Campbell-Lendrum, Diarmid, Steenland, Kyle, editors. Geneva.
Williams DR, Sternthal M, Wright RJ. Social determinants: Taking the social context of asthma seriously. Pediatrics 2009; 123 Suppl 3:S174-84.Wilson PW, Culleton BF. Epidemiology of cardiovascular disease in the United States. Am J Kidney Dis 1998; 32(5 Suppl 3):S56-S65.
Wilson PW, Culleton BF. Overview of the risk factors for cardiovascular disease–II. 2005. In: Up To Date (CD-ROM). Up To Date, Waltham, MA.
119

Yeatts K, Shy C, Sotir M, Music S, Herget C. Health consequences for children with undiagnosed asthma-like symptoms. Arch Pediatr Adolesc Med 2003; 157:540-4.Zhou Y, Levy JI. Between-airport heterogeneity in air toxics emissions associated with individual cancer risk thresholds and population risks. Environ Health 2009; 8:22.
120

10 APPENDICES FOR LOGAN AIRPORT HEALTH STUDY
Appendix A: Emissions and Dispersion Modeling
Appendix B: Background Pollutant Concentrations
Appendix C: Health-Related Behaviors, Occupational Exposures, And Household Characteristics Of Adult Residents Of The Logan Airport Health Study (LAHS) Area By Airport-Related Air Or Noise Exposure Area
Appendix D: Continuous Exposure Analyses
121