loggerhead turtle (caretta caretta) movement off the · pdf fileloggerhead turtle (caretta...
TRANSCRIPT
Loggerhead turtle (Caretta caretta) movement off the coastof Taiwan: characterization of a hotspot in the East China Seaand investigation of mesoscale eddies
Donald R. Kobayashi 1*, I-Jiunn Cheng 2, Denise M. Parker 3, Jeffrey J. Polovina 1, Naoki Kamezaki 4,and George H. Balazs 1
1Pacific Islands Fisheries Science Center, NOAA, Honolulu, Hawaii, USA2Institute of Marine Biology, National Taiwan Ocean University, Keelung, Taiwan, ROC3Joint Institute for Marine and Atmospheric Research, University of Hawaii, Honolulu, Hawaii, USA4Sea Turtle Association of Japan, Nagao-motomachi, Hirakata City, Osaka, Japan
*Corresponding Author: tel: +1 808 983 5394; fax: +1 808 983 2902; e-mail: [email protected].
Kobayashi, D. R., Cheng, I-J., Parker, D. M., Polovina, J. J., Kamezaki, N., and Balazs, G. H. 2011. Loggerhead turtle (Caretta caretta) movement offthe coast of Taiwan: characterization of a hotspot in the East China Sea and investigation of mesoscale eddies. – ICES Journal of MarineScience, 68: 707–718.
Received 15 April 2010; accepted 7 October 2010; advance access publication 7 January 2011.
Satellite tags were attached to 34 non-reproductive loggerhead turtles (Caretta caretta) caught as bycatch in the Taiwanese coastalpoundnet fishery from 2002 to 2008. Transmission durations ranged from 6 to 503 d (median 172 d), with 5860 d tracked in total.Horizontal track data were processed using the Bayesian state-space modelling to extract the most likely daily positions, takinginto account ARGOS data quality and other forms of statistical error. A region of high occupancy in the East China Sea, covering433 549 km2 of coastal and pelagic area next to Taiwan, China, Japan, and South Korea, was characterized from the tracking data.Various attributes of this hotspot are described using satellite tracks and remotely sensed data. The tracks were merged with oceano-graphic data, emphasizing a new global dataset characterizing mesoscale eddies from satellite altimetry data. A proximity-probabilityapproach coupled with odds ratio testing was used to infer orientation to eddy features. Comparisons against random points, simu-lated particle tracks, and drifter buoys were used to demonstrate turtle differential responses to eddies inside and outside the hotspot,depending on eddy features (i.e. cyclonic vs. anticyclonic, edges vs. centres). Turtles inside the hotspot utilize fewer strong cycloniceddy edges than those outside.
Keywords: Caretta caretta, East China Sea, habitat, loggerhead turtle, mesoscale eddies, movement, pelagic behaviour, satellite tags.
IntroductionThe open ocean contains a large portion of global habitat, but itremains difficult to survey and sample effectively. Remotelysensed satellite data products offer the unique opportunity toobserve large expanses of ocean efficiently over short periods.Remotely sensed data have been used for many applications,including studies related to the management of pelagic marinespecies. These applications have assisted in improving the effi-ciency of catching harvested species (Zainuddin et al., 2006),as well as improving the efficiency of protection for species ofconcern taken incidentally (Howell et al., 2008). There ismuch potential for remotely sensed data products to assist inthe management and recovery of marine species that are pro-tected, endangered, or threatened, because such indirectapproaches are non-extractive and non-invasive and canaddress processes at the requisite spatio-temporal domains oflong-lived, wide-ranging species (Druon, 2009). Increasedknowledge of their pelagic habitat requirements can be used tominimize harmful anthropogenic interactions that could jeopar-dize populations.
Loggerhead turtles (Caretta caretta) are one such species ofconcern whose management could benefit from remotely senseddata. Satellite tags have yielded many insights into their pelagic be-haviour and habitat use worldwide. In the Mediterranean Sea, log-gerheads in certain areas exhibit a combination of passive drift andsite fidelity (Cardona et al., 2005; Revelles et al., 2007), which maybe a function of age and/or size (Eckert et al., 2008). In the NorthPacific, satellite tags have revealed that many pelagic juvenile log-gerheads, after hatching in Japan, have a protracted residence inthe Kuroshio Extension Bifurcation Region (KEBR) and eastwardadjacent areas of the central North Pacific (Polovina et al., 2000,2006; Kobayashi et al., 2008), where they forage and interactwith pelagic fisheries (Polovina et al., 2004; Kobayashi andPolovina, 2005; Parker et al., 2005). A prominent number ofpelagic juveniles is similarly quasi-resident in the productivewaters off Baja California, where they feed extensively on pelagicred crabs (Pleuroncodes planipes) and interact with coastal fisheries(Nichols et al., 1999; Koch et al., 2006; Peckham et al., 2007).Both the KEBR and the Baja region are thought to be physicaland biological hotspots, where marine predators accumulate
# United States Government, Department of Commerce, National Oceanic and Atmospheric Administration, National Marine FisheriesService 2011. Published by Oxford Journals. All rights reserved.For Permissions, please email: [email protected]
ICES Journal of Marine Science (2011), 68(4), 707–718. doi:10.1093/icesjms/fsq185
(Palacios et al., 2006). Eastward and westward transpacific move-ments of loggerhead turtles have been documented using conven-tional and satellite tags (Uchida and Teruya, 1988; Nichols et al.,2000), but the prevalence of this type of directed migrationremains unknown. Despite these widespread movements andcomplex patterns of spatial occupancy, the North Pacific populationof loggerhead turtles appears to be a single stock originating fromnesting sites in Japan (Bowen et al., 1995; Kamezaki et al., 2003).Loggerhead turtles in the North Pacific are often found in areasnot directly in the pathway between these nesting sites and theabove-mentioned foraging sites. The reasons for this remain unclear.
In the western Pacific, loggerhead turtles are commonly caughtas bycatch in poundnets off the coast of Taiwan (Cheng and Chen,1997), far southwest of nesting sites in Japan. The Taiwanesepoundnet fishery utilizes .100 individual nets moored inshallow water (,20 m deep) along the coastline (Gilman et al.,2010). This type of fishery can exert a significant impact on logger-head turtle stocks via incidental catch, yet mortality remains lowin the Taiwanese fishery (Cheng and Chen, 1997). This appearsto result from frequent tending (2–3 times per day) of the gearby fishers, and the shallow depth, coupled with air-accessiblecatch chambers that allow turtles to breathe (Ishihara, 2007).Taiwan is not known to have any loggerhead nesting sites, and
genetic analysis indicates that these individuals are likely fromthe Japanese nesting stock (P. Dutton, Southwest FisheriesScience Center, pers. comm.). That stock is currently thought tobe in a healthy condition (Kamezaki et al., in press), and it is animportant component of the worldwide loggerhead population.Any additional sources of mortality require careful examinationand mitigation. The purpose of this study was to analyse the move-ment patterns of satellite-tagged loggerhead turtles taken asbycatch in the Taiwanese coastal poundnet fishery. Remotelysensed satellite data were used to infer patterns of habitat usewith respect to regional oceanographic features.
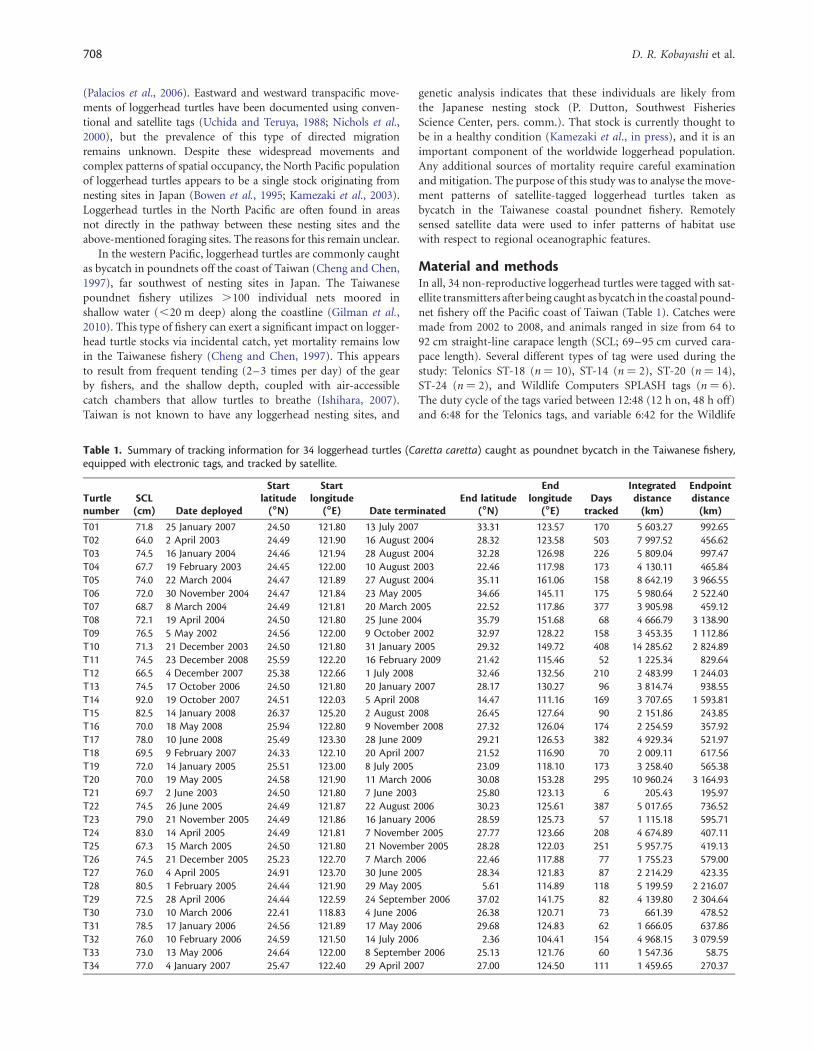
Material and methodsIn all, 34 non-reproductive loggerhead turtles were tagged with sat-ellite transmitters after being caught as bycatch in the coastal pound-net fishery off the Pacific coast of Taiwan (Table 1). Catches weremade from 2002 to 2008, and animals ranged in size from 64 to92 cm straight-line carapace length (SCL; 69–95 cm curved cara-pace length). Several different types of tag were used during thestudy: Telonics ST-18 (n ¼ 10), ST-14 (n ¼ 2), ST-20 (n ¼ 14),ST-24 (n ¼ 2), and Wildlife Computers SPLASH tags (n ¼ 6).The duty cycle of the tags varied between 12:48 (12 h on, 48 h off)and 6:48 for the Telonics tags, and variable 6:42 for the Wildlife
Table 1. Summary of tracking information for 34 loggerhead turtles (Caretta caretta) caught as poundnet bycatch in the Taiwanese fishery,equipped with electronic tags, and tracked by satellite.
Turtlenumber
SCL(cm) Date deployed
Startlatitude
(88888N)
Startlongitude
(88888E) Date terminatedEnd latitude
(88888N)
Endlongitude
(88888E)Days
tracked
Integrateddistance
(km)
Endpointdistance
(km)
T01 71.8 25 January 2007 24.50 121.80 13 July 2007 33.31 123.57 170 5 603.27 992.65T02 64.0 2 April 2003 24.49 121.90 16 August 2004 28.32 123.58 503 7 997.52 456.62T03 74.5 16 January 2004 24.46 121.94 28 August 2004 32.28 126.98 226 5 809.04 997.47T04 67.7 19 February 2003 24.45 122.00 10 August 2003 22.46 117.98 173 4 130.11 465.84T05 74.0 22 March 2004 24.47 121.89 27 August 2004 35.11 161.06 158 8 642.19 3 966.55T06 72.0 30 November 2004 24.47 121.84 23 May 2005 34.66 145.11 175 5 980.64 2 522.40T07 68.7 8 March 2004 24.49 121.81 20 March 2005 22.52 117.86 377 3 905.98 459.12T08 72.1 19 April 2004 24.50 121.80 25 June 2004 35.79 151.68 68 4 666.79 3 138.90T09 76.5 5 May 2002 24.56 122.00 9 October 2002 32.97 128.22 158 3 453.35 1 112.86T10 71.3 21 December 2003 24.50 121.80 31 January 2005 29.32 149.72 408 14 285.62 2 824.89T11 74.5 23 December 2008 25.59 122.20 16 February 2009 21.42 115.46 52 1 225.34 829.64T12 66.5 4 December 2007 25.38 122.66 1 July 2008 32.46 132.56 210 2 483.99 1 244.03T13 74.5 17 October 2006 24.50 121.80 20 January 2007 28.17 130.27 96 3 814.74 938.55T14 92.0 19 October 2007 24.51 122.03 5 April 2008 14.47 111.16 169 3 707.65 1 593.81T15 82.5 14 January 2008 26.37 125.20 2 August 2008 26.45 127.64 90 2 151.86 243.85T16 70.0 18 May 2008 25.94 122.80 9 November 2008 27.32 126.04 174 2 254.59 357.92T17 78.0 10 June 2008 25.49 123.30 28 June 2009 29.21 126.53 382 4 929.34 521.97T18 69.5 9 February 2007 24.33 122.10 20 April 2007 21.52 116.90 70 2 009.11 617.56T19 72.0 14 January 2005 25.51 123.00 8 July 2005 23.09 118.10 173 3 258.40 565.38T20 70.0 19 May 2005 24.58 121.90 11 March 2006 30.08 153.28 295 10 960.24 3 164.93T21 69.7 2 June 2003 24.50 121.80 7 June 2003 25.80 123.13 6 205.43 195.97T22 74.5 26 June 2005 24.49 121.87 22 August 2006 30.23 125.61 387 5 017.65 736.52T23 79.0 21 November 2005 24.49 121.86 16 January 2006 28.59 125.73 57 1 115.18 595.71T24 83.0 14 April 2005 24.49 121.81 7 November 2005 27.77 123.66 208 4 674.89 407.11T25 67.3 15 March 2005 24.50 121.80 21 November 2005 28.28 122.03 251 5 957.75 419.13T26 74.5 21 December 2005 25.23 122.70 7 March 2006 22.46 117.88 77 1 755.23 579.00T27 76.0 4 April 2005 24.91 123.70 30 June 2005 28.34 121.83 87 2 214.29 423.35T28 80.5 1 February 2005 24.44 121.90 29 May 2005 5.61 114.89 118 5 199.59 2 216.07T29 72.5 28 April 2006 24.44 122.59 24 September 2006 37.02 141.75 82 4 139.80 2 304.64T30 73.0 10 March 2006 22.41 118.83 4 June 2006 26.38 120.71 73 661.39 478.52T31 78.5 17 January 2006 24.56 121.89 17 May 2006 29.68 124.83 62 1 666.05 637.86T32 76.0 10 February 2006 24.59 121.50 14 July 2006 2.36 104.41 154 4 968.15 3 079.59T33 73.0 13 May 2006 24.64 122.00 8 September 2006 25.13 121.76 60 1 547.36 58.75T34 77.0 4 January 2007 25.47 122.40 29 April 2007 27.00 124.50 111 1 459.65 270.37
708 D. R. Kobayashi et al.
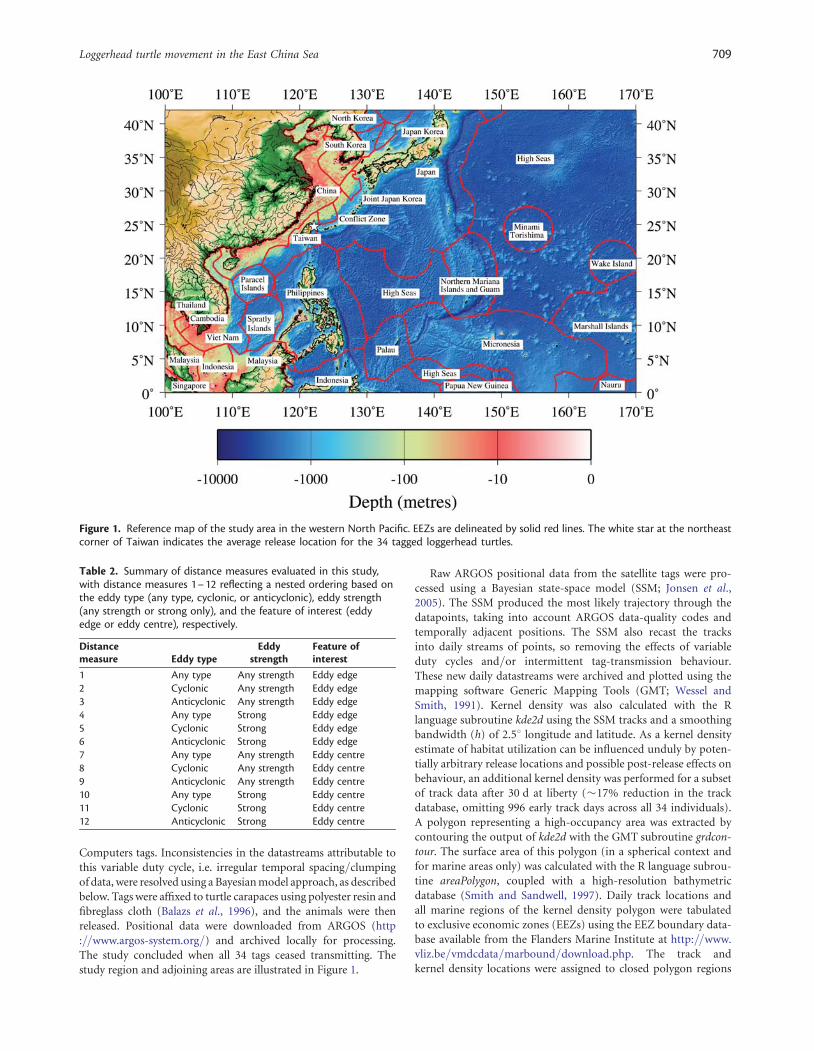
Computers tags. Inconsistencies in the datastreams attributable tothis variable duty cycle, i.e. irregular temporal spacing/clumpingof data, were resolved using a Bayesian model approach, as describedbelow. Tags were affixed to turtle carapaces using polyester resin andfibreglass cloth (Balazs et al., 1996), and the animals were thenreleased. Positional data were downloaded from ARGOS (http://www.argos-system.org/) and archived locally for processing.The study concluded when all 34 tags ceased transmitting. Thestudy region and adjoining areas are illustrated in Figure 1.
Raw ARGOS positional data from the satellite tags were pro-cessed using a Bayesian state-space model (SSM; Jonsen et al.,2005). The SSM produced the most likely trajectory through thedatapoints, taking into account ARGOS data-quality codes andtemporally adjacent positions. The SSM also recast the tracksinto daily streams of points, so removing the effects of variableduty cycles and/or intermittent tag-transmission behaviour.These new daily datastreams were archived and plotted using themapping software Generic Mapping Tools (GMT; Wessel andSmith, 1991). Kernel density was also calculated with the Rlanguage subroutine kde2d using the SSM tracks and a smoothingbandwidth (h) of 2.58 longitude and latitude. As a kernel densityestimate of habitat utilization can be influenced unduly by poten-tially arbitrary release locations and possible post-release effects onbehaviour, an additional kernel density was performed for a subsetof track data after 30 d at liberty (�17% reduction in the trackdatabase, omitting 996 early track days across all 34 individuals).A polygon representing a high-occupancy area was extracted bycontouring the output of kde2d with the GMT subroutine grdcon-tour. The surface area of this polygon (in a spherical context andfor marine areas only) was calculated with the R language subrou-tine areaPolygon, coupled with a high-resolution bathymetricdatabase (Smith and Sandwell, 1997). Daily track locations andall marine regions of the kernel density polygon were tabulatedto exclusive economic zones (EEZs) using the EEZ boundary data-base available from the Flanders Marine Institute at http://www.vliz.be/vmdcdata/marbound/download.php. The track andkernel density locations were assigned to closed polygon regions
Figure 1. Reference map of the study area in the western North Pacific. EEZs are delineated by solid red lines. The white star at the northeastcorner of Taiwan indicates the average release location for the 34 tagged loggerhead turtles.
Table 2. Summary of distance measures evaluated in this study,with distance measures 1–12 reflecting a nested ordering based onthe eddy type (any type, cyclonic, or anticyclonic), eddy strength(any strength or strong only), and the feature of interest (eddyedge or eddy centre), respectively.
Distancemeasure Eddy type
Eddystrength
Feature ofinterest
1 Any type Any strength Eddy edge2 Cyclonic Any strength Eddy edge3 Anticyclonic Any strength Eddy edge4 Any type Strong Eddy edge5 Cyclonic Strong Eddy edge6 Anticyclonic Strong Eddy edge7 Any type Any strength Eddy centre8 Cyclonic Any strength Eddy centre9 Anticyclonic Any strength Eddy centre10 Any type Strong Eddy centre11 Cyclonic Strong Eddy centre12 Anticyclonic Strong Eddy centre
Loggerhead turtle movement in the East China Sea 709
using a ray-casting algorithm written as a QuickBASIC v4.5subroutine.
Tracks were first merged to a suite of available oceanographic,bathymetric, and magnetic data products. These included NOAAPathfinder sea surface temperature (SST), AVISO altimetry pro-ducts (sea surface height, SSH; geostrophic u-component; geos-trophic v-component), SeaWiFS ocean colour, Smith andSandwell (1997) bathymetry, and earth magnetic-field data fromthe IGRF-10 model (total force, declination, inclination). Datawere examined daily and integrated over the entire track durationby averaging across the daily exposures per individual. These
oceanographic data were extracted from weekly (SST, AVISO) ormonthly (SeaWiFS, earth magnetic field) grids by interpolationof corresponding trackline values using the GMT subroutine ofgrdtrack (Wessel and Smith, 1991). Most grids were 0.18 resol-ution, except for the Smith and Sandwell (1997) bathymetry,which was 0.0338 resolution. Trackline aggregated values wereexamined for evidence of multimodality in an attempt to dis-tinguish significant groupings of turtle behaviour. Some variablesof interest (e.g. SST, SeaWiFS) were tabulated over the trackline tocompare average conditions inside and outside a region of highoccupancy.
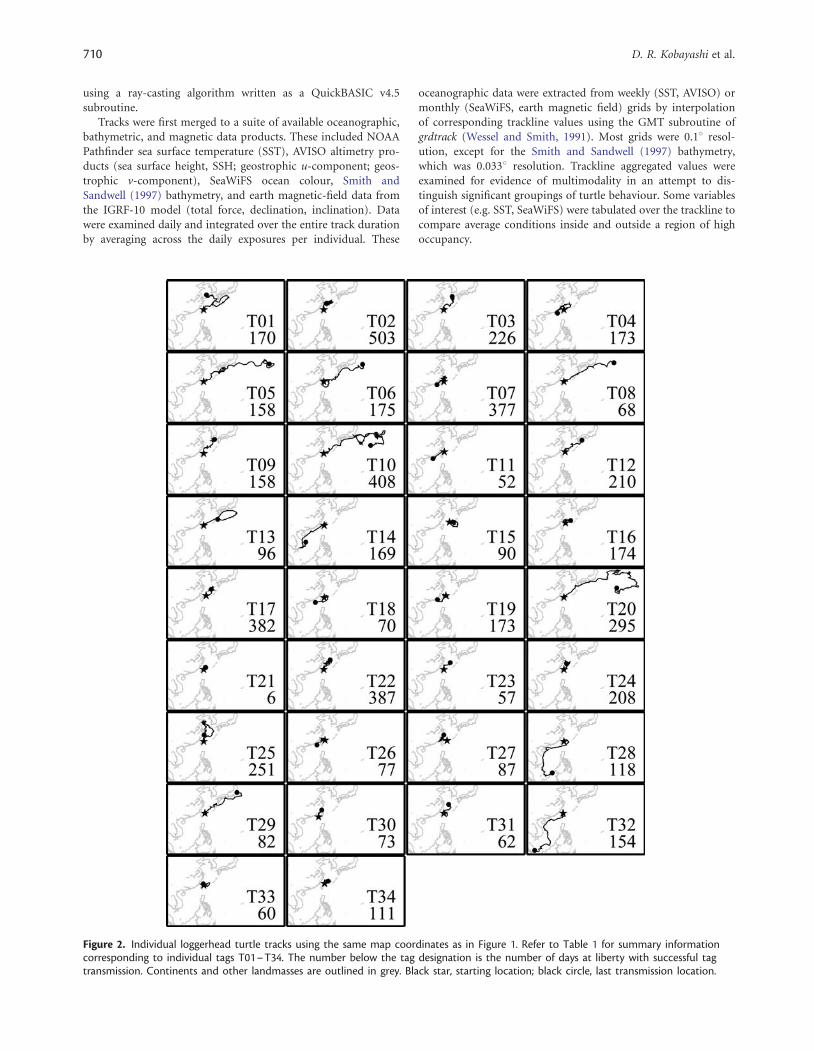
Figure 2. Individual loggerhead turtle tracks using the same map coordinates as in Figure 1. Refer to Table 1 for summary informationcorresponding to individual tags T01–T34. The number below the tag designation is the number of days at liberty with successful tagtransmission. Continents and other landmasses are outlined in grey. Black star, starting location; black circle, last transmission location.
710 D. R. Kobayashi et al.
The SSM tracks were also merged to a new oceanographic dataproduct that quantifies individual eddies from a time-series ofremotely sensed altimetry fields (Chelton et al., 2007, in press).These energetic mesoscale features have scales of tens to hundredsof kilometres and tens to hundreds of days, and account for mostof the variability in the ocean; they are one of the primary dynamicfeatures in the ocean, along with large oceanic currents and gyres(Klein and Lapeyre, 2009). The dataset was created with a pro-cedure that automatically processes SSH data from satellite alti-meters and tracks eddy trajectories over time and space, usingthe SSH fields in the AVISO Reference Series, which are con-structed from pairs of simultaneously operating altimeters, onein a 10-d repeat orbit (TOPEX/Poseidon followed by Jason-1then by Jason-2) and the other in a 35-d repeat (ERS-1, followedby ERS-2, then by ENVISAT; Ducet et al., 2000). Eddies wereidentified with this procedure from closed SSH contours, asdescribed in detail by Chelton et al. (in press) in their eddy docu-mentation. During the period 1992–2008, 176 614 eddy tracks(89 704 cyclonic, 86 910 anticyclonic) with lifetimes of 4 weeksor longer were identified in the global database. Over thedomain of the current study (2002–2008, 100–1808E 0–458N),there were 61 273 eddy tracks (31 292 cyclonic, 29 981anticyclonic).
In addition to their identification in time and space, eddies canbe characterized by attributes such as effective radius, amplitude,edge SSH, and geostrophic rotational speed. The median effectiveradius of the eddies in the study domain was 95 km (14–378 km).Eddy shapes were approximated as circles using the effectiveradius, and the daily SSM turtle positions were compared withpoints along the circumference. Radii at 58 intervals of arc orig-inating in the central locations of the eddies were used for circleconstruction, and these radii-endpoint locations were used forcomparison with the SSM data. The central locations of alleddies were also compared with the SSM data. Eddies were classi-fied as either cyclonic or anticyclonic by the nature of their SSHanomaly (negative SSH anomaly ¼ cyclonic; positive SSHanomaly ¼ anticyclonic) and further classified by eddy strength,as indicated by the ratio of vertical amplitude and the effectiveeddy radius, which is highly correlated with the maximumrotational geostrophic speed within the eddy. Amplitude valuesin the dataset were defined as the absolute difference between
the SSH contour along the edge of the eddy and the mostextreme value within the eddy interior. For the purposes of thisstudy, ratios .0.065 were classified as strong eddies. This valuerepresents the median eddy strength over the entire domain ofeddies in this analysis (range 0.0054–1.2913; n ¼ 61 273). Usingthis merging of datasets, 12 distance-measure metrics were calcu-lated, as summarized in Table 2, reflecting a nested ordering basedon eddy type (cyclonic or anticyclonic), strength (any strength orstrong), and the feature of interest (eddy edge or centre),respectively.
Some discussion of data resolution is appropriate here, becausewe are attempting to resolve differences of the order of tens of kilo-metres to determine whether turtles prefer edges or centres ofeddies. Most satellite-altimetry data products have an approxi-mately weekly sampling cycle and tracklines �100–300 kmapart. Trackline data are then processed with sophisticated algor-ithms to resolve mesoscale processes with wavelength scales of�200 km, which corresponds to an eddy radius of �40 km(Chelton et al., in press). The SSM daily positions include theBayesian credible intervals in both latitudinal and longitudinaldirections. The average 95% interval was 0.648 (�71 km)around latitude and 0.738 (�70 km) around longitude. If anactual turtle position was in maximal error, it would still likelybe closer to the edge or centre of the eddy as originally measured.Therefore, loggerhead turtle positions were known with reasonablecertainty with respect to mesoscale eddy dimensions and featurelocations.
Distance measurements were calculated for all daily positionsalong the SSM tracks. All daily positions within 18 latitude/longi-tude were tabulated as being in proximity to the eddy feature ofinterest. These tabulations were converted to proximity probabil-ities, and comparisons were made using odds ratio tests. Twosubsets of the SSM track data were examined separately for thosedaily positions found within a high-occupancy region and thosefound outside it.
Proximity probabilities to eddy features were calculated forthree sources of spatial data in addition to the SSM daily turtlepositions. First, a set of random-walk tracks was examined.These were essentially a sequence of random points in space con-strained to span the study domain. A sample of 100 tracks wasexamined. Second, a set of simulated passive-particle tracks was
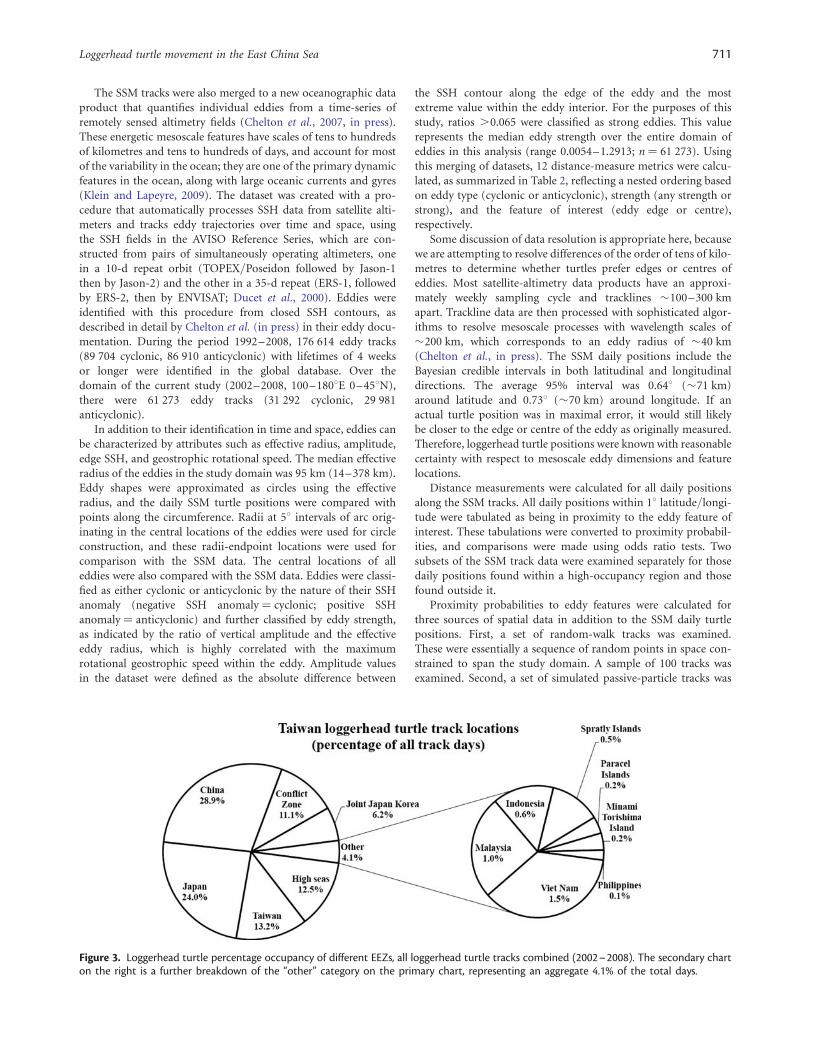
Figure 3. Loggerhead turtle percentage occupancy of different EEZs, all loggerhead turtle tracks combined (2002–2008). The secondary charton the right is a further breakdown of the “other” category on the primary chart, representing an aggregate 4.1% of the total days.
Loggerhead turtle movement in the East China Sea 711
generated and analysed. These particles were driven by NOAAOSCAR (Ocean Surface Current Analyses-Real Time) currentfields, estimated using data from satellite altimeters and scatterom-eters. The movement of particles was simulated using a Lagrangianadvection-diffusion model (Polovina et al., 1999). Currents werematched spatially and temporally to that of the domain of thisanalysis, with releases from the same average release location ofthe bycatch turtles. Time at liberty was set at 1 year, with 50 repli-cates released at the beginning of each of the study years 2002–2008. Third, data from drifting buoys deployed 15 m deep(referred to as surface drifters) that were encountered in thespatial and temporal domain of this analysis (n ¼ 1291 buoyswith 32 963 individual locations) were examined. Surface driftersare routinely deployed by research vessels and vessels of
opportunity as part of a programme studying global circulationpatterns (Lumpkin and Pazos, 2006). The surface drifter datasetused in this analysis is administered by the Global DrifterProgram at NOAA (http://www.aoml.noaa.gov/phod/dac/index.php).
As these three additional sources of spatial data were non-sentient, the a priori hypothesis was that none of the three testswould detect patterns resulting from active orientation and swim-ming behaviour. However, if there were passive accumulation ordispersal processes within the eddy features (e.g. convergence ordivergence), such processes may manifest themselves as significanttest results in the examinations of proximity probabilities.Comparison of the SSM test results and these additional appli-cations might also yield insights into the underlying mechanism
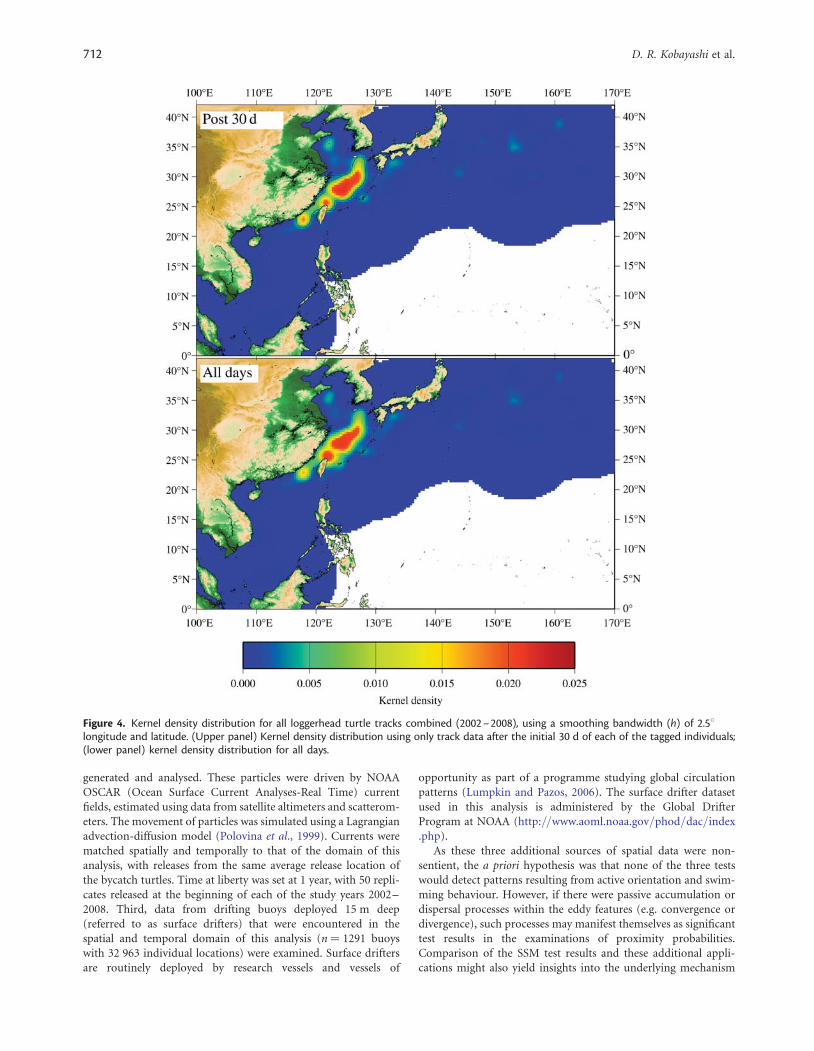
Figure 4. Kernel density distribution for all loggerhead turtle tracks combined (2002–2008), using a smoothing bandwidth (h) of 2.58longitude and latitude. (Upper panel) Kernel density distribution using only track data after the initial 30 d of each of the tagged individuals;(lower panel) kernel density distribution for all days.
712 D. R. Kobayashi et al.
of eddy utilization patterns by loggerhead turtles and the role ofpassive vs. active orientation. A matrix of odds ratio testswas applied, using the reduced-degrees-of-freedom approach(Kobayashi et al., 2008) to alleviate concerns of pseudoreplication(Hurlbert, 1984). Pseudoreplication is a potential issue, because ofthe lack of independence among the many days of track data.
The array of proximity probabilities for the two subsets of turtletracks, the random points, the simulated particles, and the surfacedrifters were used to characterize patterns of track behaviour usingnon-metric multidimensional scaling (NMDS) ordination. Thisattempted to distinguish significant groupings of turtles basedon their utilization of the high-occupancy area and the othertypes of spatial track. The NMDS was done with the softwarepackage PC-ORD (McCune and Grace, 2002).
ResultsThe 34 tags transmitted for an average of 172 d (range 6–503 d),providing 5860 individual days tracked before transmissionsceased. The Bayesian SSM was successfully applied to the 34tracks and the data are plotted in Figure 2. Some turtles movednortheast into the KEBR; others moved southwest. However, thedominant pattern was a quasi-resident behaviour in a regionbetween Taiwan, China, Japan, and South Korea. Loggerheadturtles spent portions of their track time in 12 EEZs (Figure 3).The primary EEZ was China (28.9%), with Japan, Taiwan, andthe Conflict Zone being the only other EEZs with at least 10% occu-pancy. High seas locations represented 12.5% of the total track time.
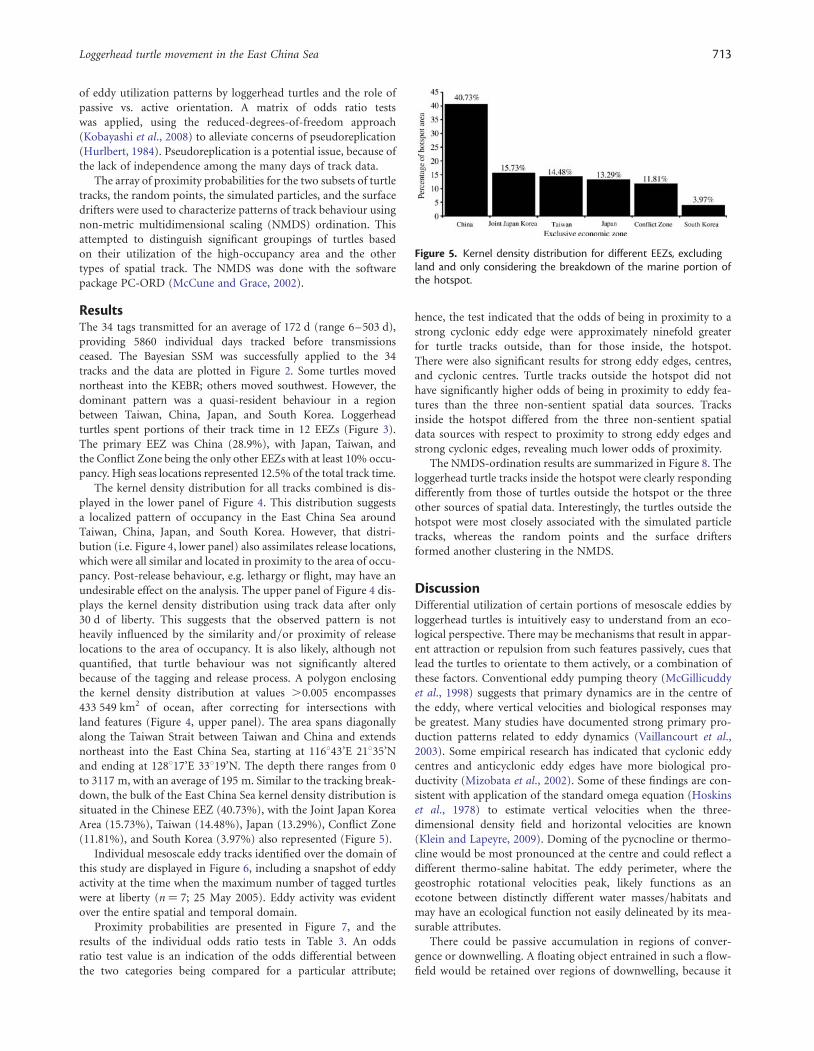
The kernel density distribution for all tracks combined is dis-played in the lower panel of Figure 4. This distribution suggestsa localized pattern of occupancy in the East China Sea aroundTaiwan, China, Japan, and South Korea. However, that distri-bution (i.e. Figure 4, lower panel) also assimilates release locations,which were all similar and located in proximity to the area of occu-pancy. Post-release behaviour, e.g. lethargy or flight, may have anundesirable effect on the analysis. The upper panel of Figure 4 dis-plays the kernel density distribution using track data after only30 d of liberty. This suggests that the observed pattern is notheavily influenced by the similarity and/or proximity of releaselocations to the area of occupancy. It is also likely, although notquantified, that turtle behaviour was not significantly alteredbecause of the tagging and release process. A polygon enclosingthe kernel density distribution at values .0.005 encompasses433 549 km2 of ocean, after correcting for intersections withland features (Figure 4, upper panel). The area spans diagonallyalong the Taiwan Strait between Taiwan and China and extendsnortheast into the East China Sea, starting at 116843’E 21835’Nand ending at 128817’E 33819’N. The depth there ranges from 0to 3117 m, with an average of 195 m. Similar to the tracking break-down, the bulk of the East China Sea kernel density distribution issituated in the Chinese EEZ (40.73%), with the Joint Japan KoreaArea (15.73%), Taiwan (14.48%), Japan (13.29%), Conflict Zone(11.81%), and South Korea (3.97%) also represented (Figure 5).
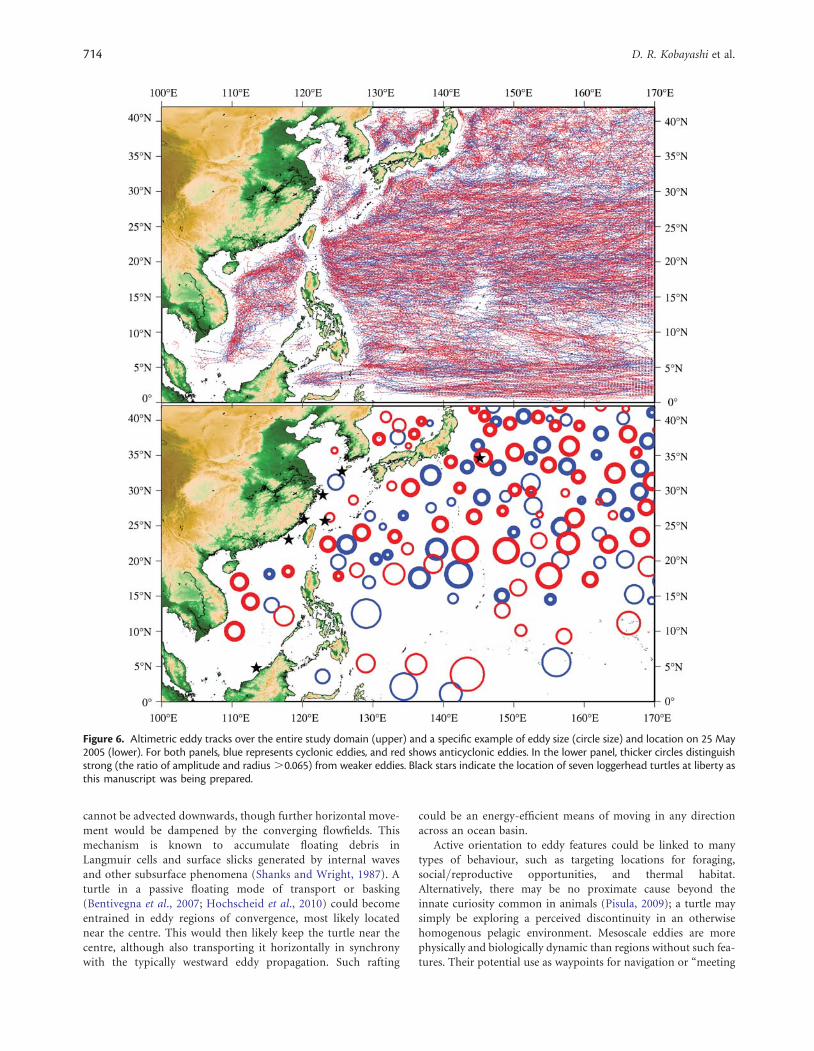
Individual mesoscale eddy tracks identified over the domain ofthis study are displayed in Figure 6, including a snapshot of eddyactivity at the time when the maximum number of tagged turtleswere at liberty (n ¼ 7; 25 May 2005). Eddy activity was evidentover the entire spatial and temporal domain.
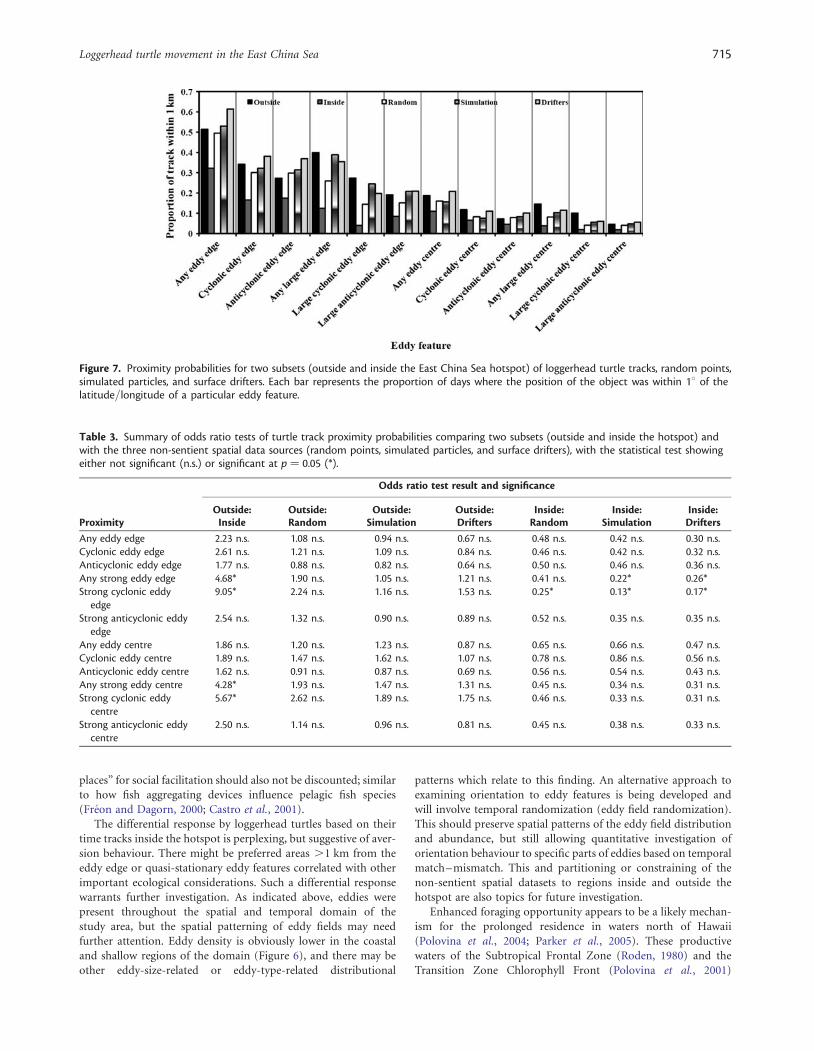
Proximity probabilities are presented in Figure 7, and theresults of the individual odds ratio tests in Table 3. An oddsratio test value is an indication of the odds differential betweenthe two categories being compared for a particular attribute;
hence, the test indicated that the odds of being in proximity to astrong cyclonic eddy edge were approximately ninefold greaterfor turtle tracks outside, than for those inside, the hotspot.There were also significant results for strong eddy edges, centres,and cyclonic centres. Turtle tracks outside the hotspot did nothave significantly higher odds of being in proximity to eddy fea-tures than the three non-sentient spatial data sources. Tracksinside the hotspot differed from the three non-sentient spatialdata sources with respect to proximity to strong eddy edges andstrong cyclonic edges, revealing much lower odds of proximity.
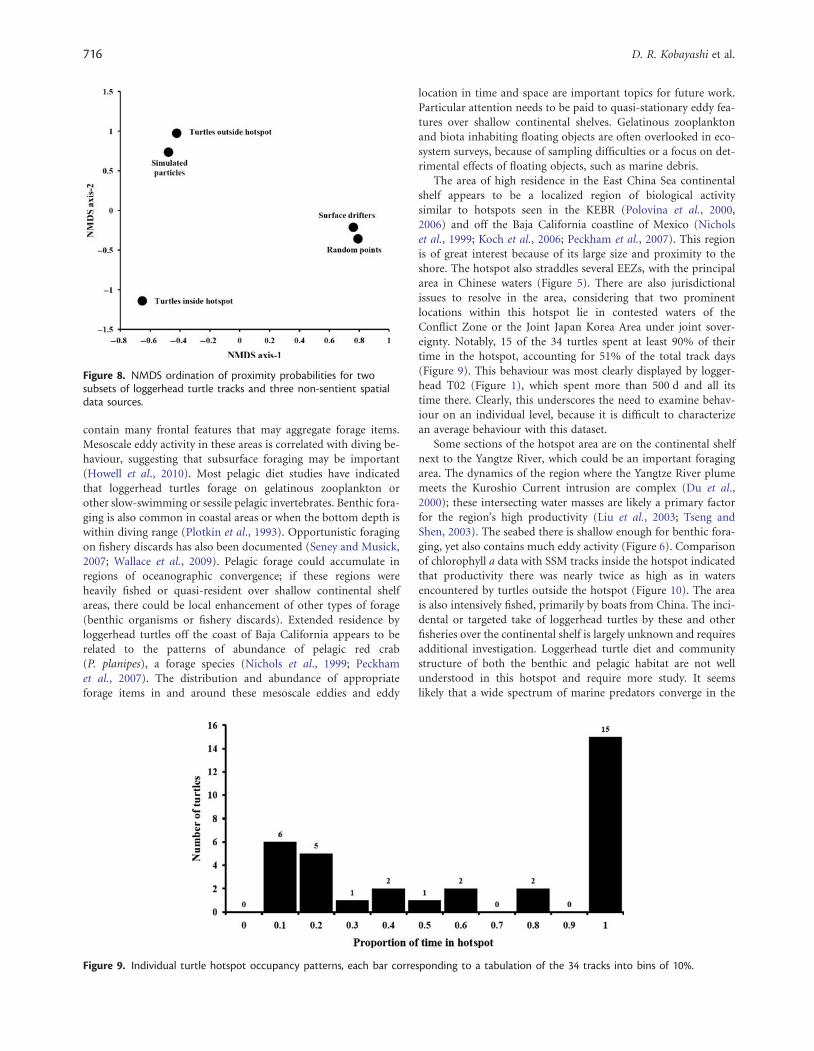
The NMDS-ordination results are summarized in Figure 8. Theloggerhead turtle tracks inside the hotspot were clearly respondingdifferently from those of turtles outside the hotspot or the threeother sources of spatial data. Interestingly, the turtles outside thehotspot were most closely associated with the simulated particletracks, whereas the random points and the surface driftersformed another clustering in the NMDS.
DiscussionDifferential utilization of certain portions of mesoscale eddies byloggerhead turtles is intuitively easy to understand from an eco-logical perspective. There may be mechanisms that result in appar-ent attraction or repulsion from such features passively, cues thatlead the turtles to orientate to them actively, or a combination ofthese factors. Conventional eddy pumping theory (McGillicuddyet al., 1998) suggests that primary dynamics are in the centre ofthe eddy, where vertical velocities and biological responses maybe greatest. Many studies have documented strong primary pro-duction patterns related to eddy dynamics (Vaillancourt et al.,2003). Some empirical research has indicated that cyclonic eddycentres and anticyclonic eddy edges have more biological pro-ductivity (Mizobata et al., 2002). Some of these findings are con-sistent with application of the standard omega equation (Hoskinset al., 1978) to estimate vertical velocities when the three-dimensional density field and horizontal velocities are known(Klein and Lapeyre, 2009). Doming of the pycnocline or thermo-cline would be most pronounced at the centre and could reflect adifferent thermo-saline habitat. The eddy perimeter, where thegeostrophic rotational velocities peak, likely functions as anecotone between distinctly different water masses/habitats andmay have an ecological function not easily delineated by its mea-surable attributes.
There could be passive accumulation in regions of conver-gence or downwelling. A floating object entrained in such a flow-field would be retained over regions of downwelling, because it
Figure 5. Kernel density distribution for different EEZs, excludingland and only considering the breakdown of the marine portion ofthe hotspot.
Loggerhead turtle movement in the East China Sea 713
cannot be advected downwards, though further horizontal move-ment would be dampened by the converging flowfields. Thismechanism is known to accumulate floating debris inLangmuir cells and surface slicks generated by internal wavesand other subsurface phenomena (Shanks and Wright, 1987). Aturtle in a passive floating mode of transport or basking(Bentivegna et al., 2007; Hochscheid et al., 2010) could becomeentrained in eddy regions of convergence, most likely locatednear the centre. This would then likely keep the turtle near thecentre, although also transporting it horizontally in synchronywith the typically westward eddy propagation. Such rafting
could be an energy-efficient means of moving in any directionacross an ocean basin.
Active orientation to eddy features could be linked to manytypes of behaviour, such as targeting locations for foraging,social/reproductive opportunities, and thermal habitat.Alternatively, there may be no proximate cause beyond theinnate curiosity common in animals (Pisula, 2009); a turtle maysimply be exploring a perceived discontinuity in an otherwisehomogenous pelagic environment. Mesoscale eddies are morephysically and biologically dynamic than regions without such fea-tures. Their potential use as waypoints for navigation or “meeting
Figure 6. Altimetric eddy tracks over the entire study domain (upper) and a specific example of eddy size (circle size) and location on 25 May2005 (lower). For both panels, blue represents cyclonic eddies, and red shows anticyclonic eddies. In the lower panel, thicker circles distinguishstrong (the ratio of amplitude and radius .0.065) from weaker eddies. Black stars indicate the location of seven loggerhead turtles at liberty asthis manuscript was being prepared.
714 D. R. Kobayashi et al.
places” for social facilitation should also not be discounted; similarto how fish aggregating devices influence pelagic fish species(Freon and Dagorn, 2000; Castro et al., 2001).
The differential response by loggerhead turtles based on theirtime tracks inside the hotspot is perplexing, but suggestive of aver-sion behaviour. There might be preferred areas .1 km from theeddy edge or quasi-stationary eddy features correlated with otherimportant ecological considerations. Such a differential responsewarrants further investigation. As indicated above, eddies werepresent throughout the spatial and temporal domain of thestudy area, but the spatial patterning of eddy fields may needfurther attention. Eddy density is obviously lower in the coastaland shallow regions of the domain (Figure 6), and there may beother eddy-size-related or eddy-type-related distributional
patterns which relate to this finding. An alternative approach toexamining orientation to eddy features is being developed andwill involve temporal randomization (eddy field randomization).This should preserve spatial patterns of the eddy field distributionand abundance, but still allowing quantitative investigation oforientation behaviour to specific parts of eddies based on temporalmatch–mismatch. This and partitioning or constraining of thenon-sentient spatial datasets to regions inside and outside thehotspot are also topics for future investigation.
Enhanced foraging opportunity appears to be a likely mechan-ism for the prolonged residence in waters north of Hawaii(Polovina et al., 2004; Parker et al., 2005). These productivewaters of the Subtropical Frontal Zone (Roden, 1980) and theTransition Zone Chlorophyll Front (Polovina et al., 2001)
Figure 7. Proximity probabilities for two subsets (outside and inside the East China Sea hotspot) of loggerhead turtle tracks, random points,simulated particles, and surface drifters. Each bar represents the proportion of days where the position of the object was within 18 of thelatitude/longitude of a particular eddy feature.
Table 3. Summary of odds ratio tests of turtle track proximity probabilities comparing two subsets (outside and inside the hotspot) andwith the three non-sentient spatial data sources (random points, simulated particles, and surface drifters), with the statistical test showingeither not significant (n.s.) or significant at p ¼ 0.05 (*).
Proximity
Odds ratio test result and significance
Outside:Inside
Outside:Random
Outside:Simulation
Outside:Drifters
Inside:Random
Inside:Simulation
Inside:Drifters
Any eddy edge 2.23 n.s. 1.08 n.s. 0.94 n.s. 0.67 n.s. 0.48 n.s. 0.42 n.s. 0.30 n.s.Cyclonic eddy edge 2.61 n.s. 1.21 n.s. 1.09 n.s. 0.84 n.s. 0.46 n.s. 0.42 n.s. 0.32 n.s.Anticyclonic eddy edge 1.77 n.s. 0.88 n.s. 0.82 n.s. 0.64 n.s. 0.50 n.s. 0.46 n.s. 0.36 n.s.Any strong eddy edge 4.68* 1.90 n.s. 1.05 n.s. 1.21 n.s. 0.41 n.s. 0.22* 0.26*Strong cyclonic eddy
edge9.05* 2.24 n.s. 1.16 n.s. 1.53 n.s. 0.25* 0.13* 0.17*
Strong anticyclonic eddyedge
2.54 n.s. 1.32 n.s. 0.90 n.s. 0.89 n.s. 0.52 n.s. 0.35 n.s. 0.35 n.s.
Any eddy centre 1.86 n.s. 1.20 n.s. 1.23 n.s. 0.87 n.s. 0.65 n.s. 0.66 n.s. 0.47 n.s.Cyclonic eddy centre 1.89 n.s. 1.47 n.s. 1.62 n.s. 1.07 n.s. 0.78 n.s. 0.86 n.s. 0.56 n.s.Anticyclonic eddy centre 1.62 n.s. 0.91 n.s. 0.87 n.s. 0.69 n.s. 0.56 n.s. 0.54 n.s. 0.43 n.s.Any strong eddy centre 4.28* 1.93 n.s. 1.47 n.s. 1.31 n.s. 0.45 n.s. 0.34 n.s. 0.31 n.s.Strong cyclonic eddy
centre5.67* 2.62 n.s. 1.89 n.s. 1.75 n.s. 0.46 n.s. 0.33 n.s. 0.31 n.s.
Strong anticyclonic eddycentre
2.50 n.s. 1.14 n.s. 0.96 n.s. 0.81 n.s. 0.45 n.s. 0.38 n.s. 0.33 n.s.
Loggerhead turtle movement in the East China Sea 715
contain many frontal features that may aggregate forage items.Mesoscale eddy activity in these areas is correlated with diving be-haviour, suggesting that subsurface foraging may be important(Howell et al., 2010). Most pelagic diet studies have indicatedthat loggerhead turtles forage on gelatinous zooplankton orother slow-swimming or sessile pelagic invertebrates. Benthic fora-ging is also common in coastal areas or when the bottom depth iswithin diving range (Plotkin et al., 1993). Opportunistic foragingon fishery discards has also been documented (Seney and Musick,2007; Wallace et al., 2009). Pelagic forage could accumulate inregions of oceanographic convergence; if these regions wereheavily fished or quasi-resident over shallow continental shelfareas, there could be local enhancement of other types of forage(benthic organisms or fishery discards). Extended residence byloggerhead turtles off the coast of Baja California appears to berelated to the patterns of abundance of pelagic red crab(P. planipes), a forage species (Nichols et al., 1999; Peckhamet al., 2007). The distribution and abundance of appropriateforage items in and around these mesoscale eddies and eddy
location in time and space are important topics for future work.Particular attention needs to be paid to quasi-stationary eddy fea-tures over shallow continental shelves. Gelatinous zooplanktonand biota inhabiting floating objects are often overlooked in eco-system surveys, because of sampling difficulties or a focus on det-rimental effects of floating objects, such as marine debris.
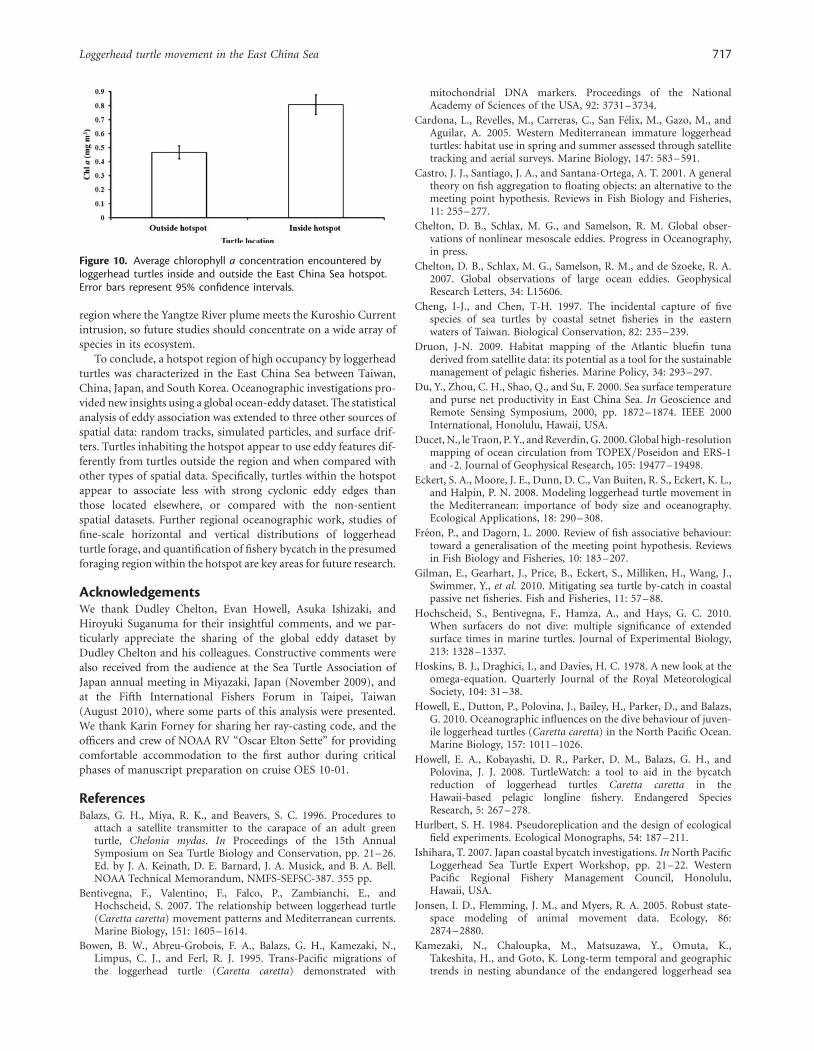
The area of high residence in the East China Sea continentalshelf appears to be a localized region of biological activitysimilar to hotspots seen in the KEBR (Polovina et al., 2000,2006) and off the Baja California coastline of Mexico (Nicholset al., 1999; Koch et al., 2006; Peckham et al., 2007). This regionis of great interest because of its large size and proximity to theshore. The hotspot also straddles several EEZs, with the principalarea in Chinese waters (Figure 5). There are also jurisdictionalissues to resolve in the area, considering that two prominentlocations within this hotspot lie in contested waters of theConflict Zone or the Joint Japan Korea Area under joint sover-eignty. Notably, 15 of the 34 turtles spent at least 90% of theirtime in the hotspot, accounting for 51% of the total track days(Figure 9). This behaviour was most clearly displayed by logger-head T02 (Figure 1), which spent more than 500 d and all itstime there. Clearly, this underscores the need to examine behav-iour on an individual level, because it is difficult to characterizean average behaviour with this dataset.
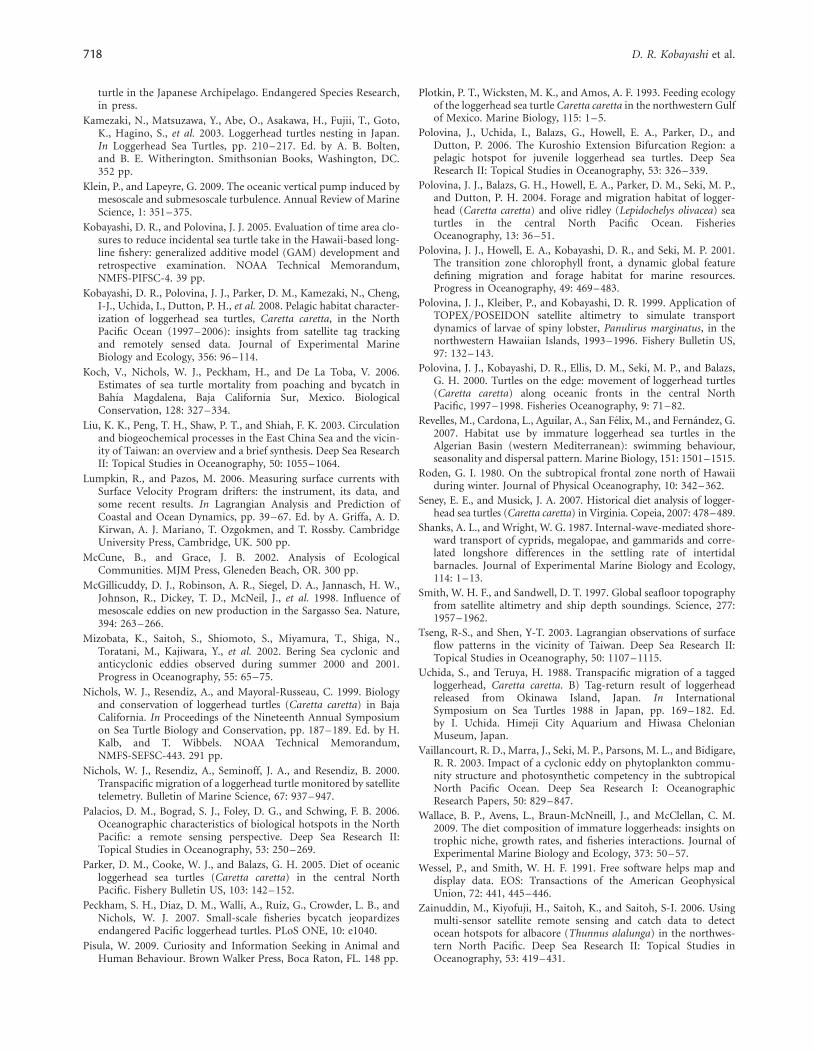
Some sections of the hotspot area are on the continental shelfnext to the Yangtze River, which could be an important foragingarea. The dynamics of the region where the Yangtze River plumemeets the Kuroshio Current intrusion are complex (Du et al.,2000); these intersecting water masses are likely a primary factorfor the region’s high productivity (Liu et al., 2003; Tseng andShen, 2003). The seabed there is shallow enough for benthic fora-ging, yet also contains much eddy activity (Figure 6). Comparisonof chlorophyll a data with SSM tracks inside the hotspot indicatedthat productivity there was nearly twice as high as in watersencountered by turtles outside the hotspot (Figure 10). The areais also intensively fished, primarily by boats from China. The inci-dental or targeted take of loggerhead turtles by these and otherfisheries over the continental shelf is largely unknown and requiresadditional investigation. Loggerhead turtle diet and communitystructure of both the benthic and pelagic habitat are not wellunderstood in this hotspot and require more study. It seemslikely that a wide spectrum of marine predators converge in the
Figure 8. NMDS ordination of proximity probabilities for twosubsets of loggerhead turtle tracks and three non-sentient spatialdata sources.
Figure 9. Individual turtle hotspot occupancy patterns, each bar corresponding to a tabulation of the 34 tracks into bins of 10%.
716 D. R. Kobayashi et al.
region where the Yangtze River plume meets the Kuroshio Currentintrusion, so future studies should concentrate on a wide array ofspecies in its ecosystem.
To conclude, a hotspot region of high occupancy by loggerheadturtles was characterized in the East China Sea between Taiwan,China, Japan, and South Korea. Oceanographic investigations pro-vided new insights using a global ocean-eddy dataset. The statisticalanalysis of eddy association was extended to three other sources ofspatial data: random tracks, simulated particles, and surface drif-ters. Turtles inhabiting the hotspot appear to use eddy features dif-ferently from turtles outside the region and when compared withother types of spatial data. Specifically, turtles within the hotspotappear to associate less with strong cyclonic eddy edges thanthose located elsewhere, or compared with the non-sentientspatial datasets. Further regional oceanographic work, studies offine-scale horizontal and vertical distributions of loggerheadturtle forage, and quantification of fishery bycatch in the presumedforaging region within the hotspot are key areas for future research.
AcknowledgementsWe thank Dudley Chelton, Evan Howell, Asuka Ishizaki, andHiroyuki Suganuma for their insightful comments, and we par-ticularly appreciate the sharing of the global eddy dataset byDudley Chelton and his colleagues. Constructive comments werealso received from the audience at the Sea Turtle Association ofJapan annual meeting in Miyazaki, Japan (November 2009), andat the Fifth International Fishers Forum in Taipei, Taiwan(August 2010), where some parts of this analysis were presented.We thank Karin Forney for sharing her ray-casting code, and theofficers and crew of NOAA RV “Oscar Elton Sette” for providingcomfortable accommodation to the first author during criticalphases of manuscript preparation on cruise OES 10-01.
ReferencesBalazs, G. H., Miya, R. K., and Beavers, S. C. 1996. Procedures to
attach a satellite transmitter to the carapace of an adult greenturtle, Chelonia mydas. In Proceedings of the 15th AnnualSymposium on Sea Turtle Biology and Conservation, pp. 21–26.Ed. by J. A. Keinath, D. E. Barnard, J. A. Musick, and B. A. Bell.NOAA Technical Memorandum, NMFS-SEFSC-387. 355 pp.
Bentivegna, F., Valentino, F., Falco, P., Zambianchi, E., andHochscheid, S. 2007. The relationship between loggerhead turtle(Caretta caretta) movement patterns and Mediterranean currents.Marine Biology, 151: 1605–1614.
Bowen, B. W., Abreu-Grobois, F. A., Balazs, G. H., Kamezaki, N.,Limpus, C. J., and Ferl, R. J. 1995. Trans-Pacific migrations ofthe loggerhead turtle (Caretta caretta) demonstrated with
mitochondrial DNA markers. Proceedings of the NationalAcademy of Sciences of the USA, 92: 3731–3734.
Cardona, L., Revelles, M., Carreras, C., San Felix, M., Gazo, M., andAguilar, A. 2005. Western Mediterranean immature loggerheadturtles: habitat use in spring and summer assessed through satellitetracking and aerial surveys. Marine Biology, 147: 583–591.
Castro, J. J., Santiago, J. A., and Santana-Ortega, A. T. 2001. A generaltheory on fish aggregation to floating objects: an alternative to themeeting point hypothesis. Reviews in Fish Biology and Fisheries,11: 255–277.
Chelton, D. B., Schlax, M. G., and Samelson, R. M. Global obser-vations of nonlinear mesoscale eddies. Progress in Oceanography,in press.
Chelton, D. B., Schlax, M. G., Samelson, R. M., and de Szoeke, R. A.2007. Global observations of large ocean eddies. GeophysicalResearch Letters, 34: L15606.
Cheng, I-J., and Chen, T-H. 1997. The incidental capture of fivespecies of sea turtles by coastal setnet fisheries in the easternwaters of Taiwan. Biological Conservation, 82: 235–239.
Druon, J-N. 2009. Habitat mapping of the Atlantic bluefin tunaderived from satellite data: its potential as a tool for the sustainablemanagement of pelagic fisheries. Marine Policy, 34: 293–297.
Du, Y., Zhou, C. H., Shao, Q., and Su, F. 2000. Sea surface temperatureand purse net productivity in East China Sea. In Geoscience andRemote Sensing Symposium, 2000, pp. 1872–1874. IEEE 2000International, Honolulu, Hawaii, USA.
Ducet, N., le Traon, P. Y., and Reverdin, G. 2000. Global high-resolutionmapping of ocean circulation from TOPEX/Poseidon and ERS-1and -2. Journal of Geophysical Research, 105: 19477–19498.
Eckert, S. A., Moore, J. E., Dunn, D. C., Van Buiten, R. S., Eckert, K. L.,and Halpin, P. N. 2008. Modeling loggerhead turtle movement inthe Mediterranean: importance of body size and oceanography.Ecological Applications, 18: 290–308.
Freon, P., and Dagorn, L. 2000. Review of fish associative behaviour:toward a generalisation of the meeting point hypothesis. Reviewsin Fish Biology and Fisheries, 10: 183–207.
Gilman, E., Gearhart, J., Price, B., Eckert, S., Milliken, H., Wang, J.,Swimmer, Y., et al. 2010. Mitigating sea turtle by-catch in coastalpassive net fisheries. Fish and Fisheries, 11: 57–88.
Hochscheid, S., Bentivegna, F., Hamza, A., and Hays, G. C. 2010.When surfacers do not dive: multiple significance of extendedsurface times in marine turtles. Journal of Experimental Biology,213: 1328–1337.
Hoskins, B. J., Draghici, I., and Davies, H. C. 1978. A new look at theomega-equation. Quarterly Journal of the Royal MeteorologicalSociety, 104: 31–38.
Howell, E., Dutton, P., Polovina, J., Bailey, H., Parker, D., and Balazs,G. 2010. Oceanographic influences on the dive behaviour of juven-ile loggerhead turtles (Caretta caretta) in the North Pacific Ocean.Marine Biology, 157: 1011–1026.
Howell, E. A., Kobayashi, D. R., Parker, D. M., Balazs, G. H., andPolovina, J. J. 2008. TurtleWatch: a tool to aid in the bycatchreduction of loggerhead turtles Caretta caretta in theHawaii-based pelagic longline fishery. Endangered SpeciesResearch, 5: 267–278.
Hurlbert, S. H. 1984. Pseudoreplication and the design of ecologicalfield experiments. Ecological Monographs, 54: 187–211.
Ishihara, T. 2007. Japan coastal bycatch investigations. In North PacificLoggerhead Sea Turtle Expert Workshop, pp. 21–22. WesternPacific Regional Fishery Management Council, Honolulu,Hawaii, USA.
Jonsen, I. D., Flemming, J. M., and Myers, R. A. 2005. Robust state-space modeling of animal movement data. Ecology, 86:2874–2880.
Kamezaki, N., Chaloupka, M., Matsuzawa, Y., Omuta, K.,Takeshita, H., and Goto, K. Long-term temporal and geographictrends in nesting abundance of the endangered loggerhead sea
Figure 10. Average chlorophyll a concentration encountered byloggerhead turtles inside and outside the East China Sea hotspot.Error bars represent 95% confidence intervals.
Loggerhead turtle movement in the East China Sea 717
turtle in the Japanese Archipelago. Endangered Species Research,in press.
Kamezaki, N., Matsuzawa, Y., Abe, O., Asakawa, H., Fujii, T., Goto,K., Hagino, S., et al. 2003. Loggerhead turtles nesting in Japan.In Loggerhead Sea Turtles, pp. 210–217. Ed. by A. B. Bolten,and B. E. Witherington. Smithsonian Books, Washington, DC.352 pp.
Klein, P., and Lapeyre, G. 2009. The oceanic vertical pump induced bymesoscale and submesoscale turbulence. Annual Review of MarineScience, 1: 351–375.
Kobayashi, D. R., and Polovina, J. J. 2005. Evaluation of time area clo-sures to reduce incidental sea turtle take in the Hawaii-based long-line fishery: generalized additive model (GAM) development andretrospective examination. NOAA Technical Memorandum,NMFS-PIFSC-4. 39 pp.
Kobayashi, D. R., Polovina, J. J., Parker, D. M., Kamezaki, N., Cheng,I-J., Uchida, I., Dutton, P. H., et al. 2008. Pelagic habitat character-ization of loggerhead sea turtles, Caretta caretta, in the NorthPacific Ocean (1997–2006): insights from satellite tag trackingand remotely sensed data. Journal of Experimental MarineBiology and Ecology, 356: 96–114.
Koch, V., Nichols, W. J., Peckham, H., and De La Toba, V. 2006.Estimates of sea turtle mortality from poaching and bycatch inBahıa Magdalena, Baja California Sur, Mexico. BiologicalConservation, 128: 327–334.
Liu, K. K., Peng, T. H., Shaw, P. T., and Shiah, F. K. 2003. Circulationand biogeochemical processes in the East China Sea and the vicin-ity of Taiwan: an overview and a brief synthesis. Deep Sea ResearchII: Topical Studies in Oceanography, 50: 1055–1064.
Lumpkin, R., and Pazos, M. 2006. Measuring surface currents withSurface Velocity Program drifters: the instrument, its data, andsome recent results. In Lagrangian Analysis and Prediction ofCoastal and Ocean Dynamics, pp. 39–67. Ed. by A. Griffa, A. D.Kirwan, A. J. Mariano, T. Ozgokmen, and T. Rossby. CambridgeUniversity Press, Cambridge, UK. 500 pp.
McCune, B., and Grace, J. B. 2002. Analysis of EcologicalCommunities. MJM Press, Gleneden Beach, OR. 300 pp.
McGillicuddy, D. J., Robinson, A. R., Siegel, D. A., Jannasch, H. W.,Johnson, R., Dickey, T. D., McNeil, J., et al. 1998. Influence ofmesoscale eddies on new production in the Sargasso Sea. Nature,394: 263–266.
Mizobata, K., Saitoh, S., Shiomoto, S., Miyamura, T., Shiga, N.,Toratani, M., Kajiwara, Y., et al. 2002. Bering Sea cyclonic andanticyclonic eddies observed during summer 2000 and 2001.Progress in Oceanography, 55: 65–75.
Nichols, W. J., Resendiz, A., and Mayoral-Russeau, C. 1999. Biologyand conservation of loggerhead turtles (Caretta caretta) in BajaCalifornia. In Proceedings of the Nineteenth Annual Symposiumon Sea Turtle Biology and Conservation, pp. 187–189. Ed. by H.Kalb, and T. Wibbels. NOAA Technical Memorandum,NMFS-SEFSC-443. 291 pp.
Nichols, W. J., Resendiz, A., Seminoff, J. A., and Resendiz, B. 2000.Transpacific migration of a loggerhead turtle monitored by satellitetelemetry. Bulletin of Marine Science, 67: 937–947.
Palacios, D. M., Bograd, S. J., Foley, D. G., and Schwing, F. B. 2006.Oceanographic characteristics of biological hotspots in the NorthPacific: a remote sensing perspective. Deep Sea Research II:Topical Studies in Oceanography, 53: 250–269.
Parker, D. M., Cooke, W. J., and Balazs, G. H. 2005. Diet of oceanicloggerhead sea turtles (Caretta caretta) in the central NorthPacific. Fishery Bulletin US, 103: 142–152.
Peckham, S. H., Diaz, D. M., Walli, A., Ruiz, G., Crowder, L. B., andNichols, W. J. 2007. Small-scale fisheries bycatch jeopardizesendangered Pacific loggerhead turtles. PLoS ONE, 10: e1040.
Pisula, W. 2009. Curiosity and Information Seeking in Animal andHuman Behaviour. Brown Walker Press, Boca Raton, FL. 148 pp.
Plotkin, P. T., Wicksten, M. K., and Amos, A. F. 1993. Feeding ecologyof the loggerhead sea turtle Caretta caretta in the northwestern Gulfof Mexico. Marine Biology, 115: 1–5.
Polovina, J., Uchida, I., Balazs, G., Howell, E. A., Parker, D., andDutton, P. 2006. The Kuroshio Extension Bifurcation Region: apelagic hotspot for juvenile loggerhead sea turtles. Deep SeaResearch II: Topical Studies in Oceanography, 53: 326–339.
Polovina, J. J., Balazs, G. H., Howell, E. A., Parker, D. M., Seki, M. P.,and Dutton, P. H. 2004. Forage and migration habitat of logger-head (Caretta caretta) and olive ridley (Lepidochelys olivacea) seaturtles in the central North Pacific Ocean. FisheriesOceanography, 13: 36–51.
Polovina, J. J., Howell, E. A., Kobayashi, D. R., and Seki, M. P. 2001.The transition zone chlorophyll front, a dynamic global featuredefining migration and forage habitat for marine resources.Progress in Oceanography, 49: 469–483.
Polovina, J. J., Kleiber, P., and Kobayashi, D. R. 1999. Application ofTOPEX/POSEIDON satellite altimetry to simulate transportdynamics of larvae of spiny lobster, Panulirus marginatus, in thenorthwestern Hawaiian Islands, 1993–1996. Fishery Bulletin US,97: 132–143.
Polovina, J. J., Kobayashi, D. R., Ellis, D. M., Seki, M. P., and Balazs,G. H. 2000. Turtles on the edge: movement of loggerhead turtles(Caretta caretta) along oceanic fronts in the central NorthPacific, 1997–1998. Fisheries Oceanography, 9: 71–82.
Revelles, M., Cardona, L., Aguilar, A., San Felix, M., and Fernandez, G.2007. Habitat use by immature loggerhead sea turtles in theAlgerian Basin (western Mediterranean): swimming behaviour,seasonality and dispersal pattern. Marine Biology, 151: 1501–1515.
Roden, G. I. 1980. On the subtropical frontal zone north of Hawaiiduring winter. Journal of Physical Oceanography, 10: 342–362.
Seney, E. E., and Musick, J. A. 2007. Historical diet analysis of logger-head sea turtles (Caretta caretta) in Virginia. Copeia, 2007: 478–489.
Shanks, A. L., and Wright, W. G. 1987. Internal-wave-mediated shore-ward transport of cyprids, megalopae, and gammarids and corre-lated longshore differences in the settling rate of intertidalbarnacles. Journal of Experimental Marine Biology and Ecology,114: 1–13.
Smith, W. H. F., and Sandwell, D. T. 1997. Global seafloor topographyfrom satellite altimetry and ship depth soundings. Science, 277:1957–1962.
Tseng, R-S., and Shen, Y-T. 2003. Lagrangian observations of surfaceflow patterns in the vicinity of Taiwan. Deep Sea Research II:Topical Studies in Oceanography, 50: 1107–1115.
Uchida, S., and Teruya, H. 1988. Transpacific migration of a taggedloggerhead, Caretta caretta. B) Tag-return result of loggerheadreleased from Okinawa Island, Japan. In InternationalSymposium on Sea Turtles 1988 in Japan, pp. 169–182. Ed.by I. Uchida. Himeji City Aquarium and Hiwasa ChelonianMuseum, Japan.
Vaillancourt, R. D., Marra, J., Seki, M. P., Parsons, M. L., and Bidigare,R. R. 2003. Impact of a cyclonic eddy on phytoplankton commu-nity structure and photosynthetic competency in the subtropicalNorth Pacific Ocean. Deep Sea Research I: OceanographicResearch Papers, 50: 829–847.
Wallace, B. P., Avens, L., Braun-McNneill, J., and McClellan, C. M.2009. The diet composition of immature loggerheads: insights ontrophic niche, growth rates, and fisheries interactions. Journal ofExperimental Marine Biology and Ecology, 373: 50–57.
Wessel, P., and Smith, W. H. F. 1991. Free software helps map anddisplay data. EOS: Transactions of the American GeophysicalUnion, 72: 441, 445–446.
Zainuddin, M., Kiyofuji, H., Saitoh, K., and Saitoh, S-I. 2006. Usingmulti-sensor satellite remote sensing and catch data to detectocean hotspots for albacore (Thunnus alalunga) in the northwes-tern North Pacific. Deep Sea Research II: Topical Studies inOceanography, 53: 419–431.
718 D. R. Kobayashi et al.