logistics marketpdf.euro.savills.co.uk/the-netherlands/commercial---dutch-other/... · cross-border...
TRANSCRIPT

Update | Logistics MarketNetherlands
Savills World Researchsavills.nl/research
Q1 2018
update
Logistics Market

The global trend of internationalisation of the real estate market is also reflected in the logistics sector. Cross-border investment into the Dutch logistics property market represented the vast majority of the total investment volume. In order to measure the current performance and determine the future growth potential of the Dutch logistics market, Savills compared the most important fundamentals of the UK, German, French and Dutch logistics market.
The economic upswing continues to thrive in the Netherlands with a GPD growth of 3.1% YoY in 2017. Export and retail turnover grew by 5.5% and 4.2% respectively. The retail turnover growth was the largest in eleven years, mostly driven by the e-commerce growth of 19.5%. (source: CBS)
Due to the growth of the main economic drivers for the logistics market, the logistics stock is expanding. In 2017, the logistics stock comprised 30.6 million sq m, which is 6.5% larger than in 2016. With continuous speculative and built-to-suit developments, the stock will further expand in the near future.
Take-up in the logistics market in 2017 stood at 2,5 million sq m which is 49% higher compared to 2016. This is the highest take-up ever recorded in the Netherlands with a large share of e-commerce related businesses. The largest new occupier transactions were both by
German retailer Lidl, leasing approximately 70,000 sq m in Venlo and approximately 60,000 sq m in Roosendaal.
Rents for logistics real estate have remained - and are expected to remain - stable throughout the Dutch market. The only exceptions are Utrecht and Rotterdam, where rents are expected to slightly rise, due to limited brown- and greenfield locations and low vacancy levels.
In addition part of the existing stock in these hubs is (being) upgraded to meet modern standards. The relatively high amount of new developments in the remaining hubs is relieving some of the pressure on these occupier markets, keeping the rents stable.
1
Update | Logistics Market | Netherlands
The year 2017
Occupier market
Logistics Market Update
2
Savills World Research | Q1 2018
Take-up versus stockThe table above shows a relatively large take-up compared to the total stock in the Netherlands. As the share of take-up in 2016 was 5.9%, this indicates a growth of interest among occupiers which stimulates the maturing process of the market. The share of take-up compared to the total stock in other countries has remained stable, which indicates occupier demand in the Netherlands is growing faster than in the UK and Germany, which are more established markets.
Investment volumesThe significant growth of the logistics investment volume in the Netherlands is stronger compared to the other countries. However, the share of logistics compared to the total investment volume is the smallest in the Netherlands with 7.6%. We expect this is in an upward trend as new developments continue to be brought to the market and investors are willing to pay more to beat the competition.
Rents Within the researched countries, prime rents for logistics real estate have remained stable in the past few years. The UK stands out with a prime rent of € 185 per sq m per year due to the high demand,
predominantly by Amazon, and the limited supply of quality product. We don’t expect the rents in the Netherlands to follow the trend of the exceptionally high UK rent prices, as the Dutch market still offers sufficient opportunity for new developments which keeps the rents fairly stable.
YieldsInvestor interest has been pushing yields downwards across all countries. Prime yields appear reasonably comparable, compressing towards 4.5 – 5%, but if you look more closely at the yield development it shows the yields in the UK have reached this level since 2014 and Germany since 2016, while the French and Dutch market are still maturing. We expect these markets to mature in line with the UK and German market, leaving room for further compression.
When we look at the fundamentals, we can conclude that the Dutch logistics market has matured over the last years. It has become a stable sector for investors, but we expect further room for growth. Based on the fundamentals of the other countries, the UK seems to have the most matured logistics market. The performance of Germany is currently most comparable to the Netherlands even though the market is much larger (approximately 11 times larger). France shows signs of a less mature market compared to the other countries
1 Five year average take-up
2 Average prime yield of top 7 markets (Berlin, Düsseldorf, Frankfurt, Hamburg, Cologne, Munich and Stuttgart in 2017
The Dutch logistics market from an international perspective
In this logistics update Savills briefly turns to 2017 before setting out the trends and developments within the Dutch logistics market followed by a brief comparison to other key European logistics markets.
The strong economic climate of the Netherlands stimulates the occupier market.
GRAPH: TAKE-UP LOGISTICS STOCK NETHERLANDS
GRAPH: LOGISTICS MARKET FUNDAMENTALS OF 2017 INTERNATIONALLY COMPARED
GRAPH: RENT LOGISTICS PROPERTIES NETHERLANDS
2010
SCH
IPH
OL
AMST
ERDA
M
ROTT
ERDA
M
MO
ERDI
JK
UTR
ECH
T
TILB
URG
VEN
LO
EIN
DHO
VEN
ROO
SEN
DAAL
TIEL
/GEL
DERM
ALSE
N2011 2012 2013 2014 2015 2016 20170 €0
500.000€10
€20
€30
€40
€50
€60
€70
€80
€90
€100
2.000.000
1.000.000
2.5000.00
1.5000.00
3.000.000
Take-up reaching all time high of 2.5 million sq m in 2017
Rent range on prime locations is comparable, Schiphol exceptional peak
AVERAGE
“With the German and Dutch logistics markets being comparable, in terms of infrastructure, ports, etc., we foresee prime yields to tighten up to the level of current German yields.” - Douglas van Oers
2,494,444 SQ M 2,297,011 SQ M 5,340,000 SQ M* 3,577,000 SQ MTAKE-UP
8.2% 5.2% 1.9% N.A.TAKE-UP VERSUS STOCK
7.6% 8.2% 14.8% 12%PERCENTAGE LOGISTICS OF TOTAL INVESTMENT VOLUME
€ 95 € 185 € 82 € 45PRIME RENTS
4.85% 4.50% 4.70%** 5.00%PRIME YIELDS
NL UK DE FR
Update | Logistics Market | Netherlands
Property starts with people.call us at +31 (0) 20 301 2000
Douglas van OersLogistics & [email protected]+31 (0) 20 301 2058
Niek Poppelaars Logistics & [email protected]+31 (0) 20 301 2086
Hobie SmitResearch & [email protected]+31 (0) 20 301 2000
Amy BulthuisSavills [email protected]+31 (0) 20 301 2020
Savills plc Savills is a leading global real estate service provider listed on the London Stock Exchange. The company established in 1855, has a rich heritage with unrivalled growth. It is a company that leads rather than follows, and now has over 700 offices and associates throughout the Americas, Europe, Asia Pacific, Africa and the Middle East.
This report is for general informative purposes only. It may not be published, reproduced or quoted in part or in whole, nor may it be used as a basis for any contract, prospectus, agreement or other document without prior consent. Whilst every effort has been made to ensure its accuracy, Savills accepts no liability whatsoever for any direct or consequential loss arising from its use. The content is strictly copyright and reproduction of the whole or part of it in any form is prohibited without written permission from Savills Research.
Want to know more? Meet our team at Savills
savills.nl/research 2
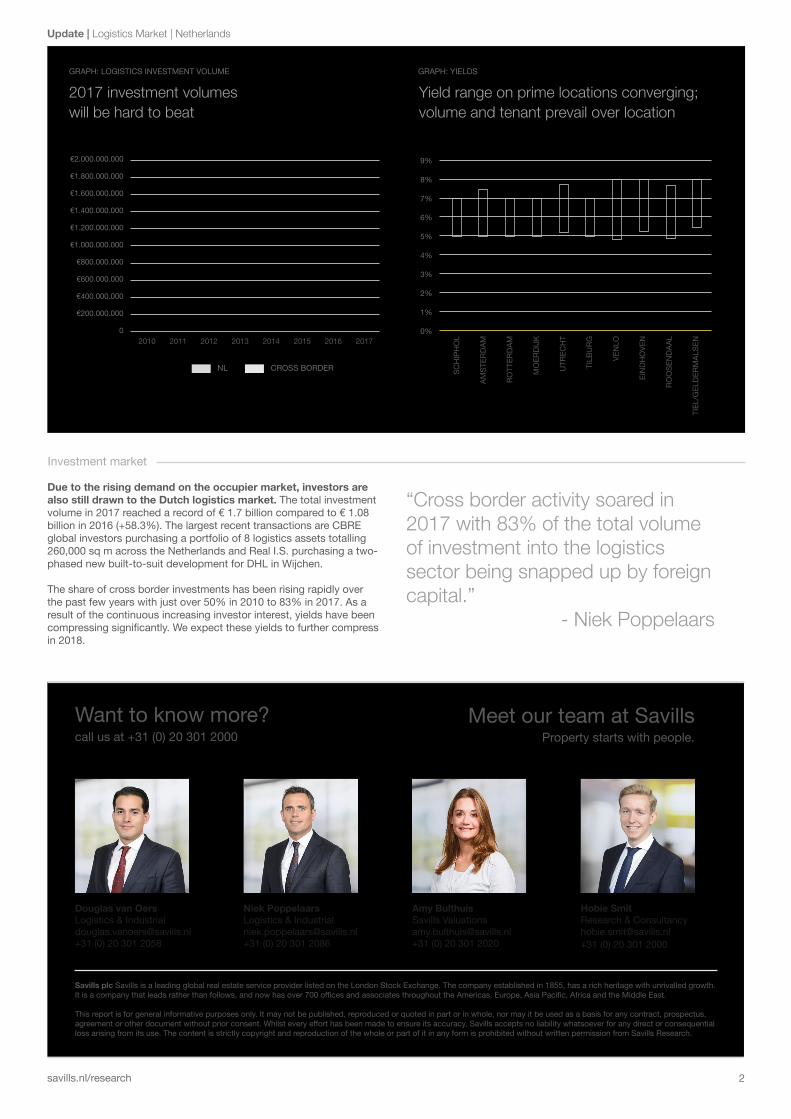
Due to the rising demand on the occupier market, investors are also still drawn to the Dutch logistics market. The total investment volume in 2017 reached a record of € 1.7 billion compared to € 1.08 billion in 2016 (+58.3%). The largest recent transactions are CBRE global investors purchasing a portfolio of 8 logistics assets totalling 260,000 sq m across the Netherlands and Real I.S. purchasing a two-phased new built-to-suit development for DHL in Wijchen.
The share of cross border investments has been rising rapidly over the past few years with just over 50% in 2010 to 83% in 2017. As a result of the continuous increasing investor interest, yields have been compressing significantly. We expect these yields to further compress in 2018.
Investment market
“Cross border activity soared in 2017 with 83% of the total volume of investment into the logistics sector being snapped up by foreign capital.” - Niek Poppelaars
GRAPH: LOGISTICS INVESTMENT VOLUME GRAPH: YIELDS
SCH
IPH
OL
AMST
ERDA
M
ROTT
ERDA
M
MO
ERDI
JK
UTR
ECH
T
TILB
URG
VEN
LO
EIN
DHO
VEN
ROO
SEN
DAAL
TIEL
/GEL
DERM
ALSE
N
0%
1%
2%
3%
4%
5%
6%
7%
8%
9%
2010 2011 2012 2013 2014 2015 2016 20170
€200.000.000
€400.000.000
€600.000.000
€800.000.000
€1.000.000.000
€1.200.000.000
€1.400.000.000
€1.600.000.000
€1.800.000.000
€2.000.000.000
2017 investment volumes will be hard to beat
Yield range on prime locations converging; volume and tenant prevail over location
NL CROSS BORDER