london, november 18 thth 2009 - gruppo ascopiave€¦ · vrt 2009 (thousand of euro) co 2009 20,910...
TRANSCRIPT

Page 1London, London, NovemberNovember 1818thth 20092009
MEDIOBANCA UTILITIES ANDMEDIOBANCA UTILITIES AND
INFRASTRUCTURE CONFERENCE 2009INFRASTRUCTURE CONFERENCE 2009

Page 2
CONTENTS
Business overview
9M 2009 results
Strategic guidelines and objectives
Gas mid and up-stream integration
Dividend policy
MEDIOBANCA UTILITIES AND
MEDIOBANCA UTILITIES AND
INFRASTRUCTURE CONFERENCE 2009
INFRASTRUCTURE CONFERENCE 2009
London,
London,November
November1818thth2009
2009

Page 3
Ascopiave Group structure as of September 30 th 2009
89%
100%
49%
100%
100%
49%
100%
70%
27.6%
17%
51%
100%
100%
100%
51%
100%
Global Energy Group
Ascoenergy Group
100%
100%
New acquisitions / company setups of 9M 2009
ACTIVITIES
Gas distribution, heating management
Gas distribution
Heating management
Gas sales andelectricity sales
Gas sales
Development of gas storage site
Gas shipping
Photovoltaic power plants
Gas distribution, gas sales
MEDIOBANCA UTILITIES AND
MEDIOBANCA UTILITIES AND
INFRASTRUCTURE CONFERENCE 2009
INFRASTRUCTURE CONFERENCE 2009
London,
London,November
November1818thth2009
2009

Page 4
Growth in the gas down-stream market in 2007–2009 (1 )
“TRIVENETO”
NORTHERNITALY
Gas sales companiesacquired in 2009
MEDIOBANCA UTILITIES AND
MEDIOBANCA UTILITIES AND
INFRASTRUCTURE CONFERENCE 2009
INFRASTRUCTURE CONFERENCE 2009
London,
London,November
November1818thth2009
2009
Page 5
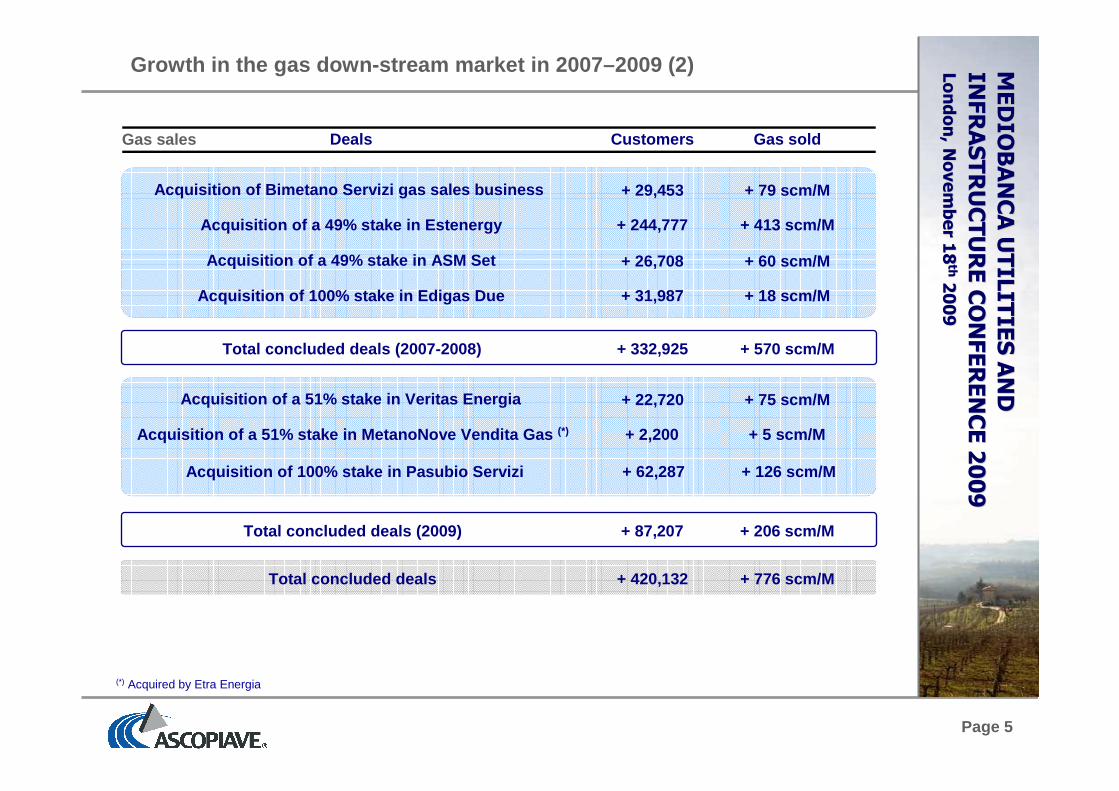
Growth in the gas down-stream market in 2007–2009 (2 )
Deals Customers Gas sold
Total concluded deals (2007-2008) + 332,925 + 570 scm/M
Acquisition of Bimetano Servizi gas sales business + 29,453 + 79 scm/M
Acquisition of a 49% stake in Estenergy + 244,777 + 413 scm/M
Gas sales
Acquisition of a 49% stake in ASM Set + 26,708 + 60 scm/M
Acquisition of 100% stake in Edigas Due + 31,987 + 18 sc m/M
(*) Acquired by Etra Energia
Total concluded deals (2009) + 87,207 + 206 scm/M
Acquisition of a 51% stake in Veritas Energia + 22,720 + 75 scm/M
Acquisition of a 51% stake in MetanoNove Vendita Gas (*) + 2,200 + 5 scm/M
Total concluded deals + 420,132 + 776 scm/M
Acquisition of 100% stake in Pasubio Servizi + 62,287 + 126 scm/M
MEDIOBANCA UTILITIES AND
MEDIOBANCA UTILITIES AND
INFRASTRUCTURE CONFERENCE 2009
INFRASTRUCTURE CONFERENCE 2009
London,
London,November
November1818thth2009
2009

Page 6
749.297
662.090
313.355
22.7202.20015.810
31.987
26.708244.777
29.453
62.287
Ascopiave
Group before
IPO
Bimetano
Servizi
Estenergy ASM Set Edigas Due Organic
growth
Ascopiave
Group
31.12.2008
Metanonove
Vendita Gas
Veritas
Energia
Pasubio
Servizi
Ascopiave
Group
31.12.2008
pro-forma
+111,3% +13,2%
Number of gas sale customers
Growth in the gas down-stream market in 2007–2009 (3 )
∆ = +348,735 ∆ = +87,207
(*) Operating data of the companies consolidated proportionally (49% or 51%) are taken into account at 100%
(*) (*)
(*)
MEDIOBANCA UTILITIES AND
MEDIOBANCA UTILITIES AND
INFRASTRUCTURE CONFERENCE 2009
INFRASTRUCTURE CONFERENCE 2009
London,
London,November
November1818thth2009
2009

Page 7
1.538
1.332
762
126
75
1860
413
79
5
Ascopiave
2006
consolidation
area (before
IPO)
Bimetano
Servizi
Estenergy ASM Set Edigas Due Ascopiave
Group
31.12.2008
Metanonove
Vendita Gas
Veritas
Energia
Pasubio
Servizi
Ascopiave
Group
31.12.2008
pro-forma
+74,8% +15,5%
Growth in the gas down-stream market in 2007–2009 (4 )
(*) Excluding gas sold on wholesaling and trading activities; (**) Operating data of the companies consolidated proportionally (49% or 51%) are taken into account at 100%
Volumes of gas sold (*)
∆ = +570 ∆ = +206
(**) (**)
(**)
MEDIOBANCA UTILITIES AND
MEDIOBANCA UTILITIES AND
INFRASTRUCTURE CONFERENCE 2009
INFRASTRUCTURE CONFERENCE 2009
London,
London,November
November1818thth2009
2009

Page 8
Main financial data 2008
Revenues 59.709EBITDA 3.562Ebitda margin 6,0%Net income 2.008
Operating data 2008
Gas sale customers 62.287Volume of gas sold (Scm/M) 126
Acquisition of Pasubio Servizi
Pasubio Servizi
Pasubio Servizi was the gas-selling company of Pasubio Group, a company wholly owned by 9 municipalities in the North of Vicenza Province.
Main strategic goals for Ascopiave :
4 Further streghtening of market position in “Triveneto”
4 Synergies expected mainly in gas purchasing cost
Pasubio Servizi
MEDIOBANCA UTILITIES AND
MEDIOBANCA UTILITIES AND
INFRASTRUCTURE CONFERENCE 2009
INFRASTRUCTURE CONFERENCE 2009
London,
London,November
November1818thth2009
2009

Page 9
Number Populations (a) Network (km) (b)
Awards from Asco Holding member municipalities 92 649.924 3.795Concessions from other municipalities 91 510.293 3.658
Total 183 1.160.217 7.453
1,1% 3,2%7,8%
31,0%
49,7%
5,4% 1,9%0,0%
10,0%20,0%30,0%40,0%50,0%60,0%
Before 2009 31.12.2009 31.12.2009 31.12.2010 31.12.2010 31.12.2012 Newconcessions
Gas distribution: Ascopiave concessions
(a) Data as of December 31th 2008; Source: ISTAT; (b) Data as of December 31th 2008; (*) The concession is under dispute (the tender procedure has beensuspended by the Administrative Court); (**) The concessions are under dispute (3 tender procedures have been declared null and void; 1 tender procedure hasbeen suspended); (***) 4 concessions are under dispute
50,3% of concessions from shareholder municipalities
88,0% of users on concessions expiring in or beyond 31 december 2010
% of users
Concessions from Asco Holding Shareholders
Concessions from other municipalities
No. ofconcessions 21 (*) 4 (**) 13 (***) 53 92 18
Suspended or null and void tender procedures
Tender proceduresnot yet started
MEDIOBANCA UTILITIES AND
MEDIOBANCA UTILITIES AND
INFRASTRUCTURE CONFERENCE 2009
INFRASTRUCTURE CONFERENCE 2009
London,
London,November
November1818thth2009
2009

Page 10
Gas distribution: legal framework up-dating (1)
Law no. 222/2007 and Law no. 244/2007
Regulation of the “Call of Tenders” to be provided by the Ministry of Economic Development (jointly with other public authorities).
Main issues: 1) Property and value of the assets to be paid to the outgoing concession holder;
2) Cap on fee to be paid to the municipalities awarding the concession;
3) Employment of the work force of the outgoing concession holder.
Minimum territorial district - joining a pool of municipalities with a minimum number of users - to be defined by the Ministry of Economic Development (jointly with other public authorities).
Tasks: 1) Reducing the number of tenders;
2) Reducing the number of operators, permitting them to achieve an optimal size, improving efficiency through economies of scale.
MEDIOBANCA UTILITIES AND
MEDIOBANCA UTILITIES AND
INFRASTRUCTURE CONFERENCE 2009
INFRASTRUCTURE CONFERENCE 2009
London,
London,November
November1818thth2009
2009

Page 11
Gas distribution: legal framework up-dating (2)
Art. no. 23-bis Law no. 133/2008
The Law n. 133/2008, the so-called the 2009 Budget Law, re-introduced some uncer-tainties on the sector. The law is directed to regulate the assignment and management of the local public services with economic relevance, including the gas sector.
The government should issue a specific decree .
Some aspects that could be influenced by the new regulation:
p the minimum territorial area (which could be defined by Ministry of Economic Development – Art. no. 30 Law no. 99/2009 – July 2009)
p the ownership of the network
p the reimbursement value
p the duration of the concession
p other elements concerning the call of tender
MEDIOBANCA UTILITIES AND
MEDIOBANCA UTILITIES AND
INFRASTRUCTURE CONFERENCE 2009
INFRASTRUCTURE CONFERENCE 2009
London,
London,November
November1818thth2009
2009

Page 12
Gas distribution tariff: third regulatory period (1)
Gas distribution tariff: third regulatory period
p New regulatory period: 2009-2012
p New regulation approved by AEEG resolution No. 159/2008
p New evaluating system for the Regulatory Asset Base (Capital Invested):
� parametric system substituted by book value of the network
� adjustment calculation allowed in case of M&A process
p Real pre-tax rate of return on RAB: ~ 7.6%
p Updating of tariff quota covering management operating costs (CO): 1) proportional to number of users and 2) takes into account economies of scale and the spreadness of the distribution network
p X-factor: ~ 3.2%
p Cash Flow Stability: revenues from the distribution business will not depend on the volumes of gas distributed (equalisation system that provides revenues reach VRT, i.e. Total Revenue Constraint )
MEDIOBANCA UTILITIES AND
MEDIOBANCA UTILITIES AND
INFRASTRUCTURE CONFERENCE 2009
INFRASTRUCTURE CONFERENCE 2009
London,
London,November
November1818thth2009
2009

Page 13
Gas distribution tariff: third regulatory period (2)
Gas distribution tariff: third regulatory period
p Because there is a significant spread between the third regulatory period RAB and the previous one, regulation provides a step by step tariff up-dating mechanism.
The step by step up-dating mechanism makes Ascopiave 2009 VRT being lower than un-capped one, that will be reached by degrees by the end of the third regulatory period.
p Ascopiave 2009 VRT has not been yet approved by Gas and Electricity Authority (AEEG). However on September 2009 AEEG informed Ascopiave that:
p estimated preliminary 2009 VRT is equal to € 54M
p estimated preliminary 2009 RAB is equal to € 292M
p estimated preliminary 2009 un-capped RAB is equal to € 335M.
Estimates are based on information provided by Ascopiave about the book value of the tangible assets to AEEG in order to calculate RAB. AEEG is examining such information.
p 2009 VRT will be approved by AEEG within 31 Decembe r 2009.
MEDIOBANCA UTILITIES AND
MEDIOBANCA UTILITIES AND
INFRASTRUCTURE CONFERENCE 2009
INFRASTRUCTURE CONFERENCE 2009
London,
London,November
November1818thth2009
2009

Page 14
VRT 2009 (Thousand of Euro)
CO 2009 20,910AMM 2009 10,936CI 2009 x rd 22,242
Total VRT 2009 (*) 54,087
RAB 2009 291,888
Gas distribution: VRT breakdown
Components of VRD (%)
VRT 2009 (“Vincolo dei Ricavi Ammesso”, i.e. 2009 Tota l Revenue Constraint)
MEDIOBANCA UTILITIES AND
MEDIOBANCA UTILITIES AND
INFRASTRUCTURE CONFERENCE 2009
INFRASTRUCTURE CONFERENCE 2009
London,
London,November
November1818thth2009
2009
(*) Preliminary 2009 VRT, estimated by AEEG
Maximum cost of distribution and metering activities, including management operating costs, depreciation and remuneration of capital invested, that can be compensated through the tariff.
VRD = CO + AMM + CI x rd
where:
CO: represents the tariff quota covering management operating costs;
AMM: represents the quota covering depreciation;
CI: represents the net capital invested in distribution;
rd : represents the real, pre-tax rate of returnon net invested capital (~ 7.60%).
CO 200939%
AMM 200920%
CI 2009 x rd41%

Page 15
Gas sales: operating data
(*) Operating data of the companies consolidated proportionally are taken into account at 100%
Volumes of gas sold by the Group (2008)
(Scm/m)
To end customers(companies consolidated integrally 100%)
859.2
Volumes of gas sold by the Group (2008)
To end customers (*)(companies consolidated proportionally 49%)
472.5
To end customers 1,331.7
On trading activities 823.8
Volumes of gas sold 2,155.5
Volumes of gas sold to end customers (2008)
1.332
824
0
200
400
600
800
1.000
1.200
1.400
1.600
Gas sold to endcustomers
Gas sold on tradingand wholesaling
activities
61.8%
38.2%
957
374
0
200
400
600
800
1.000
1.200
Gas sold to endcustomers < 200.000
scm/y
Gas sold to endcustomers > 200.000
scm/y
71.9%
28.1%
MEDIOBANCA UTILITIES AND
MEDIOBANCA UTILITIES AND
INFRASTRUCTURE CONFERENCE 2009
INFRASTRUCTURE CONFERENCE 2009
London,
London,November
November1818thth2009
2009

Page 16
CONTENTS
Business overview
9M 2009 results
Strategic guidelines and objectives
Gas mid and up-stream integration
Dividend policy
MEDIOBANCA UTILITIES AND
MEDIOBANCA UTILITIES AND
INFRASTRUCTURE CONFERENCE 2009
INFRASTRUCTURE CONFERENCE 2009
London,
London,November
November1818thth2009
2009

Page 17
9M 2009 consolidation area
Company Ownership Shareholding Consolidation method
Ascopiave S.p.A. Parent companyAscotrade S.p.A. Direct 89% Integral (100%)Global Energy S.r.l. (a) Direct 100% Integral (100%)Le Cime Servizi S.r.l. (b) Indirect 100% Integral (100%)Etra Energia S.r.l. Indirect 51% Integral (100%)MetanoNove Vendita Gas S.r.l. (c) Indirect 51% Integral (100%)ASM DG S.r.l. Direct 100% Integral (100%)ASM Set S.r.l. Direct 49% Proportional (49%)Estenergy S.p.A. Direct 48.999% Proportional (48.999%)Sinergie Italiane S.r.l. Direct 20% EquityEdigas Esercizio Distribuzione S.r.l. Direct 100% Integral (100%)Edigas Due S.r.l. Direct 100% Integral (100%)AscoEnergy S.r.l. Direct 70% Integral (100%)Masseria S.r.l. (d) Indirect 70% Integral (100%)Veritas Energia S.r.l. Direct 51% Proportional (51%)Pasubio Servizi S.r.l. Direct 100% Integral (100%)
(a) Global Energy controls the companies Coge Calore (in liquidation) and Etra Energia(b) Le Cime Servizi is controlled with a stake of 100% by Global Energy(c) MetanoNove Vendita Gas is controlled with a stake of 100% by Etra Energia(d) Masseria is controlled with a stake of 100% by AscoEnergy
MEDIOBANCA UTILITIES AND
MEDIOBANCA UTILITIES AND
INFRASTRUCTURE CONFERENCE 2009
INFRASTRUCTURE CONFERENCE 2009
London,
London,November
November1818thth2009
2009

Page 18
Comparison of 9M 2008 and 9M 2009 consolidation areas
9M 2008: 1stQ 2008 2ndQ 2008 3rdQ 2008
9M 2008 Consolidated CompaniesEdigas Esercizio Distribuzione GasEdigas DueVeritas EnergiaMetano Nove Vendita GasPasubio Servizi
9M 2009: 1stQ 2009 2ndQ 2009 3rdQ 2009
9M 2008 Consolidated CompaniesEdigas Esercizio Distribuzione GasEdigas DueVeritas EnergiaMetano Nove Vendita GasPasubio Servizi
Chg of consolidation area: 1stQ 2009 2ndQ 2009 3rdQ 2009
9M 2008 Consolidated CompaniesEdigas Esercizio Distribuzione GasEdigas DueVeritas EnergiaMetano Nove Vendita GasPasubio Servizi
MEDIOBANCA UTILITIES AND
MEDIOBANCA UTILITIES AND
INFRASTRUCTURE CONFERENCE 2009
INFRASTRUCTURE CONFERENCE 2009
London,
London,November
November1818thth2009
2009

Page 19
9M 2009 income statement
(Thousand of Euro) 9M 2009 9M 2008 Chg Chg %
Revenues 557.849 537.450 20.399 +3,8%
(Cost of raw materials and consumables) (460.720) (465.168) 4.448 -1,0%(Cost of services) (39.221) (24.733) (14.489) +58,6%
(Cost of personnel) (13.765) (11.282) (2.483) +22,0%(Other operating costs) (5.849) (7.126) 1.277 -17,9%Other operating income 103 255 (152) -59,6%
EBITDA 38.396 29.396 9.000 +30,6%
(Depreciations and amortizations) (11.955) (10.717) (1.237) +11,5%(Provisions) (2.435) (2.418) (17) +0,7%
EBIT 24.007 16.260 7.747 +47,6%
Financial income / (expenses) (145) (3.961) 3.816 -96,3%
EBT 23.862 12.299 11.563 +94,0%
(Income taxes) (8.781) (4.485) (4.296) +95,8%(Net income of minorities) (603) 93 (696) -746,4%
Net income of the Group 14.478 7.908 6.570 +83,1%
MEDIOBANCA UTILITIES AND
MEDIOBANCA UTILITIES AND
INFRASTRUCTURE CONFERENCE 2009
INFRASTRUCTURE CONFERENCE 2009
London,
London,November
November1818thth2009
2009

Page 20
Balance sheet
(Thousand of Euro) 30/09/2009 31/12/2008 Chg Chg %
Tangible assets 325.243 319.279 5.964 +1,9%Non tangible assets 115.799 92.776 23.023 +24,8%Other fixed assets 15.963 13.860 2.103 +15,2%
Fixed assets 457.004 425.915 31.090 +7,3%
Operating current assets 124.168 281.573 (157.405) -55,9%(Operating current liabilities) (101.669) (259.641) 157.973 -60,8%
(Operating non current liabilities) (42.859) (41.165) (1.695) +4,1%
Net working capital (20.359) (19.233) (1.127) +5,9%
Total capital employed 436.645 406.682 29.963 +7,4%
Group shareholders equity 358.059 359.108 (1.049) -0,3%
Minorities 2.859 2.325 534 +23,0%
Net financial position 75.727 45.249 30.477 +67,4%
Total sources 436.645 406.682 29.963 +7,4%
MEDIOBANCA UTILITIES AND
MEDIOBANCA UTILITIES AND
INFRASTRUCTURE CONFERENCE 2009
INFRASTRUCTURE CONFERENCE 2009
London,
London,November
November1818thth2009
2009

Page 21
Volumes of gas sold to end customers
316,4 330,4
48,1
0
200
400
600
800
9M 2009 9M 2008
New consolidation area
9M 2008 consolidation area
364,5330,4
+10,3%
523,9 575,9
40,4
0
200
400
600
800
9M 2009 9M 2008
New consolidation area
9M 2008 consolidation area
564,3 575,9
-2,0%
∆ = -11,6
Volumes of gas sold to end customers(Million of standard cubic meters)
Gas sold to end customersCompanies consolidated at 100%
∆ = +34,1
Gas sold to end customersCompanies consolidated at 49%-51%
(*) 1stH 2009 of Edigas Due + 9M 2009 of MetanoNove Vendita Gas + 3rdQ 2009 of Pasubio Servizi(**) 9M 2009 of Veritas Energia
(*) (**)
MEDIOBANCA UTILITIES AND
MEDIOBANCA UTILITIES AND
INFRASTRUCTURE CONFERENCE 2009
INFRASTRUCTURE CONFERENCE 2009
London,
London,November
November1818thth2009
2009

Page 22
Volumes of gas sold on trading and wholesaling activi ties
Volumes of gas sold on trading and wholesaling activi ties(Million of standard cubic meters)
603,2
447,8
0
200
400
600
800
1.000
9M 2009 9M 2008
-25,8%
Gas sold on trading and wholesaling activities
∆ = -155,4
MEDIOBANCA UTILITIES AND
MEDIOBANCA UTILITIES AND
INFRASTRUCTURE CONFERENCE 2009
INFRASTRUCTURE CONFERENCE 2009
London,
London,November
November1818thth2009
2009

Page 23
Volumes of gas distributed
529,7 568,4
27,3
0
200
400
600
800
9M 2009 9M 2008
New consolidation area
9M 2008 consolidation area
557,0 568,4
-2,0%
Volumes of gas distributed(Million of standard cubic meters)
∆ = -11,4
(*) 1stH 2009 of Edigas Esercizio Distribuzione Gas(**) Excluding volumes of natural gas distributed by ASM DG and Edigas Esercizio Distribuzione Gas
530,1492,2487,5
516,5
570,7 578,2 571,8
471,1
0
100
200
300
400
500
600
700
9M
2002
9M
2003
9M
2004
9M
2005
9M
2006
9M
2007
9M
2008
9M
2009
532,2 Avg. 02-08
-7,5%
(**)
(*)
Volumes of gas distributed: hystorical trend(Million of standard cubic meters)
MEDIOBANCA UTILITIES AND
MEDIOBANCA UTILITIES AND
INFRASTRUCTURE CONFERENCE 2009
INFRASTRUCTURE CONFERENCE 2009
London,
London,November
November1818thth2009
2009

Page 24
EBITDA bridge
EBITDA bridge(Thousand of Euro)
29.396
38.396
2.868 -5.237
11.370
0
10.000
20.000
30.000
40.000
50.000
60.000
EBITDA 9M
2008
Gross margin on
gas sales
Gas distribution
tariff revenues
Other changes EBITDA 9M
2009
+30,6%
∆ = +9.000
EBITDA bridge :
p EBITDA of new consolidationarea: + €1,5M
p Increase of EBITDA of 9M 2008 consolidation area: + €7,5M
MEDIOBANCA UTILITIES AND
MEDIOBANCA UTILITIES AND
INFRASTRUCTURE CONFERENCE 2009
INFRASTRUCTURE CONFERENCE 2009
London,
London,November
November1818thth2009
2009

Page 25
Gross margin on gas sales bridge
1) Change of consolidation area (1stH 2009 of Edigas Due S.p.A. + 9M 2009 of VeritasEnergia S.r.l. + 3rdQ 2009 of Pasubio Servizi S.r.l.) = + Euro 1,7 mln;
2) Impact of new tariff system for domestic clients (so called “mercato tutelato”) provided by Res. AEEG n. 64/09 (change of QVD tariff component) = + Euro 3,5 mln;
3) Decrease of margin on gas trading and wholesales activities: - Euro 0,4 mln.
4) Decrease of gas volumes sold, decrease of margin on business segment and other changes: - Euro 1,9 mln.
(Thousand of Euro) 9M 2009 9M 2008 Chg Chg %
Revenues from gas sales to end customers 334.192 299.418 34.774 +11,6%Revenues from gas trading and wholesaling 172.018 191.574 (19.557) -10,2%
Revenues from gas sales 506.210 490.992 15.217 +3,1%
(Gas purchase costs) (442.870) (435.266) (7.604) +1,7%(Distribution costs) (45.190) (40.444) (4.746) +11,7%
Gross Margin on Gas Sales 18.150 15.283 2.868 +18,8%
MEDIOBANCA UTILITIES AND
MEDIOBANCA UTILITIES AND
INFRASTRUCTURE CONFERENCE 2009
INFRASTRUCTURE CONFERENCE 2009
London,
London,November
November1818thth2009
2009
Page 26
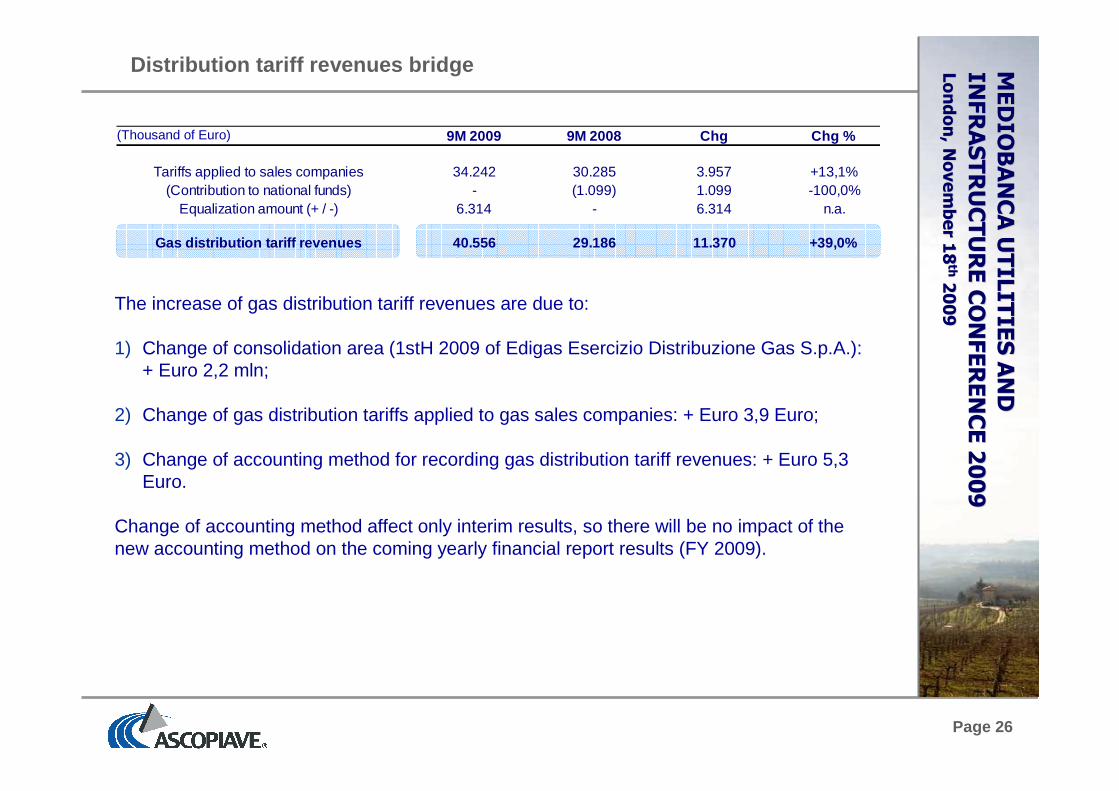
Distribution tariff revenues bridge
The increase of gas distribution tariff revenues are due to:
1) Change of consolidation area (1stH 2009 of Edigas Esercizio Distribuzione Gas S.p.A.): + Euro 2,2 mln;
2) Change of gas distribution tariffs applied to gas sales companies: + Euro 3,9 Euro;
3) Change of accounting method for recording gas distribution tariff revenues: + Euro 5,3 Euro.
Change of accounting method affect only interim results, so there will be no impact of the new accounting method on the coming yearly financial report results (FY 2009).
(Thousand of Euro)MEDIOBANCA UTILITIES AND
MEDIOBANCA UTILITIES AND
INFRASTRUCTURE CONFERENCE 2009
INFRASTRUCTURE CONFERENCE 2009
London,
London,November
November1818thth2009
2009
9M 2009 9M 2008 Chg Chg %
Tariffs applied to sales companies 34.242 30.285 3.957 +13,1%(Contribution to national funds) - (1.099) 1.099 -100,0%
Equalization amount (+ / -) 6.314 - 6.314 n.a.
Gas distribution tariff revenues 40.556 29.186 11.370 + 39,0%
Page 27
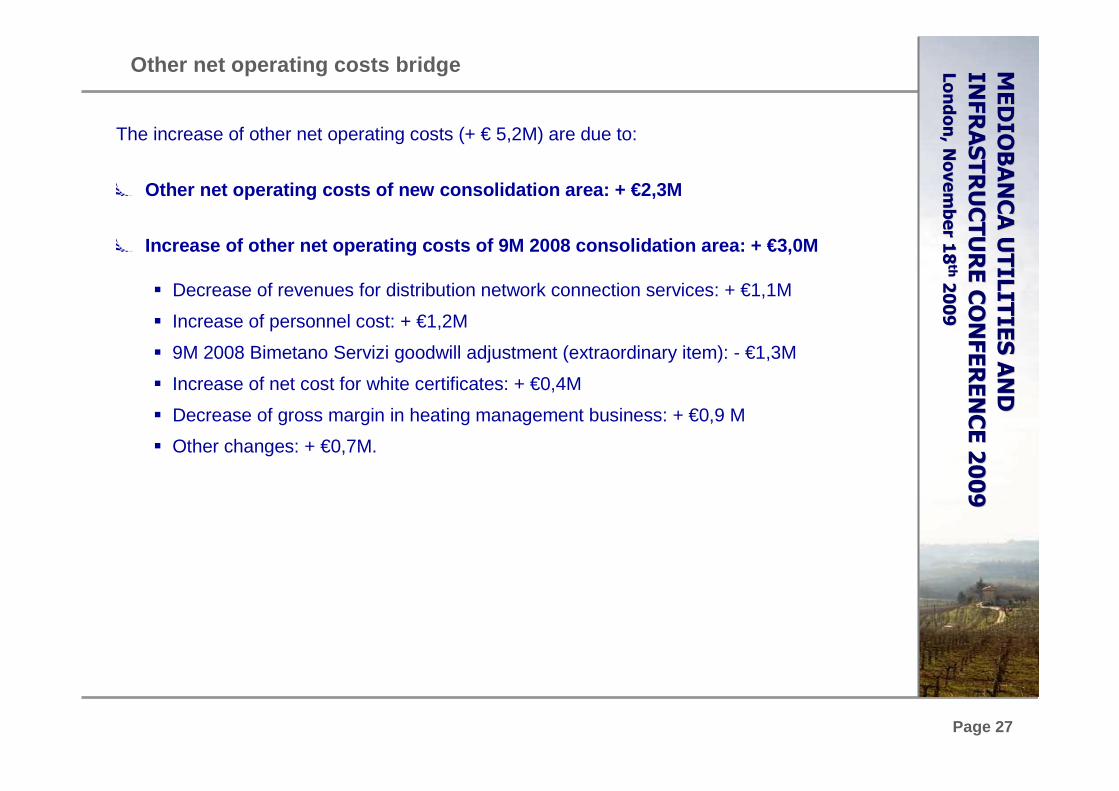
Other net operating costs bridge
The increase of other net operating costs (+ € 5,2M) are due to:
p Other net operating costs of new consolidation area: + €2,3M
p Increase of other net operating costs of 9M 2008 consol idation area: + €3,0M
� Decrease of revenues for distribution network connection services: + €1,1M
� Increase of personnel cost: + €1,2M
� 9M 2008 Bimetano Servizi goodwill adjustment (extraordinary item): - €1,3M
� Increase of net cost for white certificates: + €0,4M
� Decrease of gross margin in heating management business: + €0,9 M
� Other changes: + €0,7M.
MEDIOBANCA UTILITIES AND
MEDIOBANCA UTILITIES AND
INFRASTRUCTURE CONFERENCE 2009
INFRASTRUCTURE CONFERENCE 2009
London,
London,November
November1818thth2009
2009

Page 28
Net Financial Position
-75,7
-45,2
0,1
-24,2
-19,0
-0,7-17,6
28,9
2,0
-90
-80
-70
-60
-50
-40
-30
-20
-10
0
10
20
30
31/12/2008 Cash flow Capex Change in net
working capital
(operating
activities)
Change in net
working capital
(fiscal
activities)
Change in
shareholders'
equity
Acquisitions
(price)
NFP from
acquisitions
30/09/2009
+67,4%(Million of Euro)
∆ = -30,5MEDIOBANCA UTILITIES AND
MEDIOBANCA UTILITIES AND
INFRASTRUCTURE CONFERENCE 2009
INFRASTRUCTURE CONFERENCE 2009
London,
London,November
November1818thth2009
2009

Page 29
Main financial ratios (1)
FINANCIAL RATIOS 2008 2007 2006 AVG 06-08
Capital turnover 2,0 0,9 1,1 1,4
Return on sales 4,2% 7,5% 9,2% 6,9%
Return on investment (ROI) 8,5% 7,1% 10,4% 8,6%
Financial leverage (D/E) 0,13 0,29 -0,24 n.a.
Return on Equity (ROE) 5,1% 5,9% 4,4% 5,1%
Ascopiave Group main financial ratios
Change from 2007 to 2008:
p improvement of Capital Turnover (from 0.9 to 2.0) thanks to re-absorption of net working capital and to the development of trading and wholesaling gas business (with high capital turnover ratio).
p decrease of Return on Sales (from 7.5% to 4.2%) due to development of trading and wholesaling gas business (with low return on sale).
Average return on investment higher than real pre-tax return of investment provided by the gas distribution regulatory system (~ 7.6%).
MEDIOBANCA UTILITIES AND
MEDIOBANCA UTILITIES AND
INFRASTRUCTURE CONFERENCE 2009
INFRASTRUCTURE CONFERENCE 2009
London,
London,November
November1818thth2009
2009

Page 30
FINANCIAL RATIOSLOCAL UTILITIES
(Average data) ASCOPIAVE VAR.
Financial leverage 1,23 0,20 -1,03
D/D+E 54,7% 16,5% -38,2%
E/D+E 45,3% 83,5% 38,2%
Main financial ratios (2)
Financial leverage comparison
(*) Financial leverage is calculated considering Market Capitalization and Net Financial Position on September 30th 2009; (**) Local utilities are: A2A, Hera, Acea, Iride, Acegas-APS, ACSM-AGAM and Enìa.
Ascopiave financial leverage (0.20) is lower than those of the Italian listed competitors (avg: 1.23)
The low indebtedness level is a positive result in the light of a macroeconomic scenario that makes access to credit a real challenge, which therefore strengthens the Group’s economic and financial soundness and enables it to reap the opportunity of carrying out potential extraordinary transactions in 2010.
(*)(**)
MEDIOBANCA UTILITIES AND
MEDIOBANCA UTILITIES AND
INFRASTRUCTURE CONFERENCE 2009
INFRASTRUCTURE CONFERENCE 2009
London,
London,November
November1818thth2009
2009

Page 31
CONTENTS
Business overview
9M 2009 results
Strategic guidelines and objectives
Gas mid and up-stream integration
Dividend policy
MEDIOBANCA UTILITIES AND
MEDIOBANCA UTILITIES AND
INFRASTRUCTURE CONFERENCE 2009
INFRASTRUCTURE CONFERENCE 2009
London,
London,November
November1818thth2009
2009

Page 32
Strategic guidelines and objectives
Long term autonomous and diversified supplying syste m by an up-stream integration in the gas value chain
OBJECTIVES
• Maximizing and stabilizing margins - minimizing commodities risks
• Increasing volume sold: doubling respect to customer base volumes
• Less than 90% supplied by incumbents
• Improvement and exploitation of internal competences and know how
Dimensional growth by a significant increase of the customer base and of the volumes sold consolidating the leadership in the North-East and a national role
• FOCUSED CAPACITY ACQUISITION (LNG, PIPE, STORAGE)
• SONATRACH GSA – GAZPROM GSA (via Sinergie Italiane)
• OTHERS MEDIUM / LONG TERM AGREEMENTS
• GROWTH VIA ACQUISITION (“EXTERNAL GROWTH”)
• “ORGANIC GROWTH”
• TRADING AND WHOLESALING
• RETENTION OF OWN END USERS (via dual fuel and cross selling strategies)
MEDIOBANCA UTILITIES AND
MEDIOBANCA UTILITIES AND
INFRASTRUCTURE CONFERENCE 2009
INFRASTRUCTURE CONFERENCE 2009
London,
London,November
November1818thth2009
2009

Page 33
CONTENTS
Business overview
9M 2009 results
Strategic guidelines and objectives
Gas mid and up-stream integration
Dividend policy
MEDIOBANCA UTILITIES AND
MEDIOBANCA UTILITIES AND
INFRASTRUCTURE CONFERENCE 2009
INFRASTRUCTURE CONFERENCE 2009
London,
London,November
November1818thth2009
2009

Page 34
Ranking Gas sale operatorNo of gas sale customers in
Triveneto%
1 Ascopiave Group 685.000 26,1%2 ENI 500.000 19,1%3 Enel Gas 160.000 6,1%4 Trentino Servizi 130.000 5,0%5 AGSM Verona 125.000 4,8%6 AIM Vicenza 115.000 4,4%7 AMGA Udine 100.000 3,8%8 Thuega 80.000 3,0%9 Edison 80.000 3,0%
10 IRIS Gorizia 60.000 2,3%Altri 588.000 22,4%Totale 2.623.000 100,0%
FROM 284,000 (2003) TO 685,000 (2008 pro-forma) cagr 03-08: +141,2%
Market positioning in Triveneto
No. of gas sale customers in Triveneto
With over 680.000 gas sale customers, Ascopiave ranks 1st in “Triveneto”
Triveneto
ITALY
No. of gas sale customers
(*) Operating data of the companies consolidated proportionally (49% or 51%) are taken into account at 100%
(*)
MEDIOBANCA UTILITIES AND
MEDIOBANCA UTILITIES AND
INFRASTRUCTURE CONFERENCE 2009
INFRASTRUCTURE CONFERENCE 2009
London,
London,November
November1818thth2009
2009

Page 35
Ranking Gas sale operatorsVol. of gas sold in
Italy (Mcm)% Ranking Gas sale operators
Vol. of gas sold in Italy (Mcm)
%
1 Eni 26,862 38.6% 1 Eni 26,862 38.1%2 Enel 12,799 18.4% 2 Enel 12,799 18.2%3 E.On 3,927 5.6% 3 E.On 3,927 5.6%4 Edison 3,428 4.9% 4 Edison 3,428 4.9%5 Energie Investimenti 3,136 4.5% 5 Energie Investimenti 3,136 4.5%6 A2A 2,668 3.8% 6 A2A 2,668 3.8%7 Hera 2,209 3.2% 7 Ascopiave Group 2,376 3.4%8 Ascopiave Group 1,552 2.2% 8 Hera 2,209 3.1%9 Cir (Sorgenia) 1,142 1.6% 9 Cir (Sorgenia) 1,142 1.6%10 Iride 1,107 1.6% 10 Iride 1,107 1.6%11 E.S.TR.A. Energia 567 0.8% 11 E.S.TR.A. Energia 567 0.8%12 Linea Group Holding 399 0.6% 12 Linea Group Holding 399 0.6%13 Erogasmet 386 0.6% 13 Erogasmet 386 0.5%14 Gas Plus 371 0.5% 14 Gas Plus 371 0.5%15 Trentino Servizi 313 0.4% 15 Trentino Servizi 313 0.4%16 Amga - Azienda Multiservizi (Udine) 311 0.4% 16 Amga - Azienda Multiservizi (Udine) 311 0.4%
Others 8,432 12.1% Others 8,432 12.0%Total 69,609 100.0% Total 70,433 100.0%
Market positioning in Italy
The Group has created an industrial pole that, with more than 1.5 billion of cube meters of gas
sold, ranks 8th in Italy
Volumes of gas sold in Italy (a)
(a) In house processing on 2008 AEEG data; (b) Including volumes sold to final market by Ascotrade, Global Energy, Etra Energia, ASM Set, Estenergy, Edigas Due, Veritas Energia, MetanoNove Vendita Gas and Pasubio Servizi; data of the companies consolidated proportionally are taken into account at 100% (c) Also including volumes sold on wholesaling and trading activities.
(c)
FROM 435 cm/mln (2007) TO 824 cm/mln (2008)Volumes of gas sold by trading activities
(b)
Also considering volumes of gas sold on wholesale / trading activities the Group, with about 2.4 billion of
cube meters of gas sold, ranks 7th in Italy
MEDIOBANCA UTILITIES AND
MEDIOBANCA UTILITIES AND
INFRASTRUCTURE CONFERENCE 2009
INFRASTRUCTURE CONFERENCE 2009
London,
London,November
November1818thth2009
2009

Page 36
Import infrastructures and new projects
+6.5 Gmc31 Gmc
TAGRussia
+6.5 Gmc27 Gmc
TRANSMEDAlgeria
BG/Brindisi
8 Gmc
Edison/Rovigo
8 Gmc
Gas NaturalTaranto
8 Gmc
Gas NaturalTrieste
8 Gmc
Cross EnergyGioia Tauro
12 Gmc
Olt Livorno
4 Gmc
GALSI
8/10 Gmc
Edison/BP Rosignano
8 Gmc
Erg, Shell/Priolo
8 Gmc
8-12 Gmc
Endesa Trieste
1,5 Gmc
PIPELINESlovenia
GREENSTREAMLibia
8 Gmc+2 Gmc
P. Empedocle
8 Gmc
18 Gmc
TRANSITGAS Netherlands/
Norway
4 GmcENI Panigaglia
8 GmcIGI
Projected pipelines
Current pipelines Current LNG terminals
Projected LNG Terminals
PROJECT CAPACITY (Gcm) OPERATOR
REP TAG 1 3,2 ENI
REP TAG 2 3,3 ENI
REP TTCP 1 3,2 ENI
REP TTCP 2 3,3 ENI
ROVIGO 8,0 Edison, QP, Exxon
TOTAL 21,0
PROJECT CAPACITY (Gcm) OPERATOR
LNG LIVORNO 4,0 Olt, Iride, E.On
LNG BRINDISI 8,0 Bg
TOTAL 12,0
PROJECT CAPACITY (Gcm) OPERATOR
IGI 8,0 Edison, DEPA
GALSI 8,0 Sonatrach. Edison, etc .
GREENSTREAM REP 2,0 ENI
LNG ROSIGNANO 8,0 Edison BP
LNG GIOIA TAURO 12,0 Cross Energy
LNG PRIOLO 8,0 Shell
LNG TARANTO 8,0 Gas Natural
LNG ZAULE 8,0 Gas Natural
LNG TRIESTE 8,0 Endesa
LNG PORTO EMPEDOCLE 8,0 Nuove Energie
TOTAL 78,0
EXISTING NEW INFRASTRUCTURE
AUHORIZED PLANNED INFRASTRUCTURE
PLANNED NEW INFRASTRUCTURE
2008 2015 2020
National Demand 75,6 94,2 100,8
Domestic Production 9,2 5,8 4,2
Total 84,8 100,0 105,0
VOLUMES OF GAS (Gcm)
MEDIOBANCA UTILITIES AND
MEDIOBANCA UTILITIES AND
INFRASTRUCTURE CONFERENCE 2009
INFRASTRUCTURE CONFERENCE 2009
London,
London,November
November1818thth2009
2009

Page 37
Scenario evolution
Leve
l of m
arke
t co
ncen
trat
ion
-
+
396 operators (*)
20 operators
2009 2013
Horizontal and vertical integration
Dual fuel
Creation of macro-aggregations
+Commercial
companies still existing
732 operators
1997
(*) Source: MSE – July 14th 2009: companies authorized to sell
- Eni; Enel; Edison
- Foreign groups (Gazde France; EON)
- Aggregation of former municipalities
Before unbundling
Extremely fragmented
Consolidation of large groups also foreign
and significant reduction of small
operators
Scenario evolution
MEDIOBANCA UTILITIES AND
MEDIOBANCA UTILITIES AND
INFRASTRUCTURE CONFERENCE 2009
INFRASTRUCTURE CONFERENCE 2009
London,
London,November
November1818thth2009
2009

Page 38
Mid and up-stream integration
Signing an agreement with
Sonatrach for 500 Scm/M of gas
Participation in Sinergie Italiane
Gas supply agreement with
Gazprom
Gas import and shipping
Gas import and shipping
1
Gas wholesaleand trading
Gas wholesaleand trading
2
Acquisition of storage capacityAcquisition of
storage capacity
3
Other upstream projects
Other upstream projects
4
Gas Wholesales
Gas Trading at PSV
Shareholding in Ital Gas Storage,
active in the development of a
gas storage in Cornegliano
Participation in initiative of other
gas pipelines
Considering acquisition of a
qualified stake in re-gasification
terminals
MEDIOBANCA UTILITIES AND
MEDIOBANCA UTILITIES AND
INFRASTRUCTURE CONFERENCE 2009
INFRASTRUCTURE CONFERENCE 2009
London,
London,November
November1818thth2009
2009

Page 39
Long Term supply agreement with Sonatrach
TAG
Source: gie.waxinteractive3.com
GALSIInternational
Section
GALSINational Section
p Purchase of 500 Scm/M of gas import through GALSI pipeline
p Duration of the agreement: 15 years from the date in which GALSI will go into operation
Current agreement with Sonatrach
p Shell, Essent, EGL, Vitol, RWE, EON, BP, Gaselys
Current agreements with:
MEDIOBANCA UTILITIES AND
MEDIOBANCA UTILITIES AND
INFRASTRUCTURE CONFERENCE 2009
INFRASTRUCTURE CONFERENCE 2009
London,
London,November
November1818thth2009
2009

Page 40
Gas import and gas shipping: Sinergie Italiane
Participation in Sinergie Italiane
p Starting from Thermal Year 2008/2009, SINIT manages gas and electricity supply activities of its shareholders:
� over 1.7 million extremely loyal end-customers
� gas volumes sold in excess of 3 Bcm
p Gas supply agreement with Gazprom
p Industrial partnerships and agreements with leading international operators
Leading role in Sinergie Italiane
NORTHERNITALYSinergie Italiane potential market
for Thermal Year 2009-2010: 5 Bcm
Sinergie Italiane is the 4th Italian gas shipping company (the 2nd on residential
market) participated by Ascopiave (27.6%) and by other domestic gas operators
27,6%
27,6%
27,6%
3,1%
6,9%
7,2%
ASCOPIAVEENIABLUGASUTILITA'AEMMEBEA
MEDIOBANCA UTILITIES AND
MEDIOBANCA UTILITIES AND
INFRASTRUCTURE CONFERENCE 2009
INFRASTRUCTURE CONFERENCE 2009
London,
London,November
November1818thth2009
2009

Page 41
Foreign transportation capacity
Total foreign transportationcapacity 2009/2010:
714 MSmc
Own capacity
(Ncm/h)
No.
of lots
ACQ
(Ncm/y)DURATION
2.600 5 113.880.000
2.600 8 182.208.000
2.600 1 22.776.000
2.600 3 68.328.000
44.200 17 387.192.000 Until 2029
Subletting capacity
(Ncm/h)
No.
of lots
ACQ
(Ncm/y)DURATION
15.000 1 131.400.000
15.000 1 131.400.000 Until 2012
59.200 18 518.592.000
CAPACITY
(Kwh/h)
ACQ
(Scm/y)DURATION
117.450 97.481.650 2010
117.227 97.296.564 2012
234.677 194.778.214
CAPACITY
(Mwh/h)
ACQ
(Scm/y)DURATION
110 38.165.000 2009
110 38.165.000
TAG CAPACITY
TRANSITGAS CAPACITY
DUNKERQUE
MEDIOBANCA UTILITIES AND
MEDIOBANCA UTILITIES AND
INFRASTRUCTURE CONFERENCE 2009
INFRASTRUCTURE CONFERENCE 2009
London,
London,November
November1818thth2009
2009

Page 42
Gas storage capacity: supply system flexibilities
Capacity Storage: 1.100.000.000 Smc
National Working Gas : 8.000.000.000 Smc
13,75% - Total domestic storage
p Summer 2010 supply needs: 1Bcm
p 400 Mcm/y Organic Growth
p LNG Supply (Spot and Long Term)
p European stock Exchanges (TTF and EGT)
p Decoupling between Italian and European Gas Market - Gas to Gas Competition
Time, sources and delivery point swap
MEDIOBANCA UTILITIES AND
MEDIOBANCA UTILITIES AND
INFRASTRUCTURE CONFERENCE 2009
INFRASTRUCTURE CONFERENCE 2009
London,
London,November
November1818thth2009
2009

Page 43
Long term supply agreement with Gazprom
Long term supply agreement with Gazprom
p Contract TOP signed by Sinergie Italiane
p Total volumes supplied: 7.5 B/Scm in 10 years :
� 1.0 B/Scm per year in 2009-2011 TY
� 0.5 B/Scm per year in 2012-2018 TY
p Starting from October 2009
� The Long Term Agreement follows two yearly contracts
� Delivery Point in Tarvisio (Italian Border)
� Good flexibilities
� Negotiations for additional volumes still in progress
MEDIOBANCA UTILITIES AND
MEDIOBANCA UTILITIES AND
INFRASTRUCTURE CONFERENCE 2009
INFRASTRUCTURE CONFERENCE 2009
London,
London,November
November1818thth2009
2009
Page 44
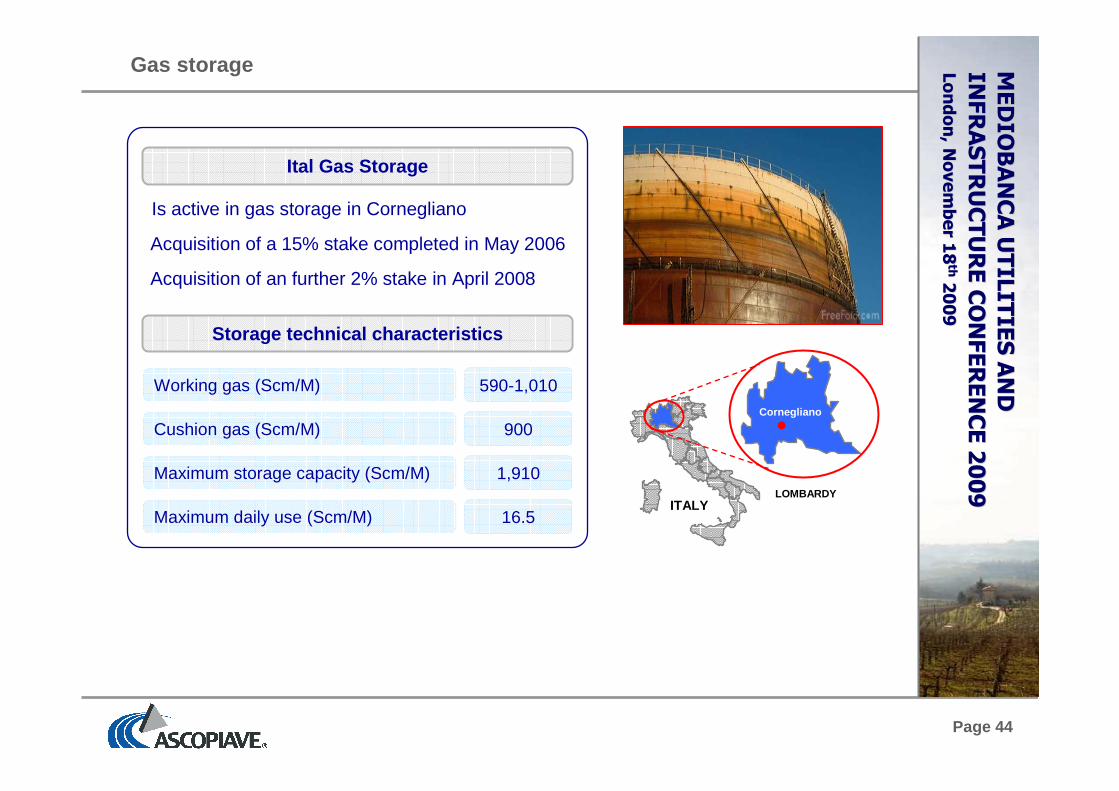
Is active in gas storage in Cornegliano
Gas storage
Working gas (Scm/M) 590-1,010
Cushion gas (Scm/M) 900
Maximum storage capacity (Scm/M) 1,910
Maximum daily use (Scm/M) 16.5
Ital Gas Storage
Acquisition of a 15% stake completed in May 2006
ITALYLOMBARDY
Cornegliano
Acquisition of an further 2% stake in April 2008
Storage technical characteristics
MEDIOBANCA UTILITIES AND
MEDIOBANCA UTILITIES AND
INFRASTRUCTURE CONFERENCE 2009
INFRASTRUCTURE CONFERENCE 2009
London,
London,November
November1818thth2009
2009

Page 45
CONTENTS
Business overview
9M 2009 results
Strategic guidelines and objectives
Gas mid and up-stream integration
Dividend policy
MEDIOBANCA UTILITIES AND
MEDIOBANCA UTILITIES AND
INFRASTRUCTURE CONFERENCE 2009
INFRASTRUCTURE CONFERENCE 2009
London,
London,November
November1818thth2009
2009

Page 46
Dividend policy
Dividend payment sustainable with high return to sh areholders
About 100% pay-out
Sustainability of the dividend policy:
• stable cash flow
• stable business profitability
• well-balanced financial structure
Dividend yield at the top of the listed italian utiliti es companies
DIVIDEND 2006 2007 2008 Average
Dividends paid (Thousand of Euro) 19.833 19.898 19.925 19.885Group Net Income (Thousand of Euro) 16.381 21.764 18.452 18.866
Payout ratio 121% 91% 108% 107%
Dividend per share (Euro) 0,085 0,085 0,085 0,085
Dividend yeald on detachment date 4,2% 5,6% 5,6% 5,1%Dividend yeald on placement price 4,7%
MEDIOBANCA UTILITIES AND
MEDIOBANCA UTILITIES AND
INFRASTRUCTURE CONFERENCE 2009
INFRASTRUCTURE CONFERENCE 2009
London,
London,November
November1818thth2009
2009