long term financial plan - denmark.wa.gov.au
TRANSCRIPT

Long TermFinancial Plan2021/22 - 2030/31

Acknowledgement of
CountryWe acknowledge the Noongar people
who are the traditional custodians
of this land and pay our respects
to Elders, both past and present.
We acknowledge and respect their
continuing culture and the contribution
they make to this region.
2 | Long Term Financial Plan 2021/22 - 2030/31

Contents
4 Shire President’s Message
6 Executive Summary
8 Denmark in Profile
9 Every Dollar Counts
11 Long Term Financial Plan Objective
12 Capital Projects Timeline
13 Basis for Preparation of the Long Term Financial Plan
14 External Influences and Key Risks
15 Economic Assumptions
17 Key Elements of the Financial Statements
21 Key Financial Indicators
26 Key Financial Statements
27 Statement of Comprehensive Income by Nature or Type
28 Rate Setting Statement
29 Statement of Financial Position
30 Statement of Changes in Equity
31 Statement of Operational Funding
32 Statement of Capital Funding
Appendix
33 Reserves Table
3Long Term Financial Plan 2021/22 - 2030/31 |

Electronic copies of the Long Term Financial Plan are available for download at www.denmark.wa.gov.au. Copies of this document are also available in alternative formats upon request.
Shire President’s
MessageCouncil presents the 2021/22 - 2030/31 Long Term Financial Plan to ensure, through these challenging times, that the Shire can continue to support services to the community and advance the capital works program.
The vision and aspirations of the community as set out in Denmark 2027 continue to drive the operations of the Shire, including guiding the building of the Long Term Financial Plan.
It is nearly four years since we held extensive community consultations to build the Strategic Community Plan, Denmark 2027. Council will undertake a review of the plan next year with a focus on understanding emerging issues and concerns, while confirming the community vision and aspirations of the community for the next 10 years.
Through our long term planning, Council is committed to supporting Denmark’s local economy.
We value the key contribution local contractors, businesses and community groups make by partnering with us to deliver critical services and infrastructure developments. With that in mind, Council has established, as one of the guiding principles of the plan, that Council will be responsive to prevailing economic conditions and adjust capital project timeframes in order to support the local economy.
In summary, this Long Term Financial Plan outlines a responsible, balanced and progressive approach to the longer term financial management of our Shire, ensuring future generations inherit a strong and healthy financial footprint.
Cr Ceinwen Gearon Shire President
4 | Long Term Financial Plan 2021/22 - 2030/31
The vision and aspirations of the community as set
out in Denmark 2027 continue to drive the
operations of the Shire.
5Long Term Financial Plan 2021/22 - 2030/31 |

Executive
SummaryThe Long Term Financial Plan (LTFP) is a key strategic document that demonstrates the alignment between the Shire’s organisational capacity and the community’s vision and aspirations as outlined in Denmark 2027.
The Local Government Act 1995 requires all local governments to plan for the future. The 10 year rolling LTFP is a key element of the planning framework that informs directional documents such as the Corporate Business Plan and Annual Budget, to deliver on the priorities set in the Strategic Community Plan Denmark 2027.
As part of the annual review of the adopted 2019 LTFP, management recommended the plan be rebuilt.
The following factors were recognised in this LTFP rebuild:
• The direct impact the Covid-19 pandemic has had on the Shire’s operations, revenues and financial projections
• Managements need to have better control over the informing data to improve the accuracy of the modelling of the LTFP
• Council’s desire to better understand the mechanisms of the LTFP
• The recommendations from a review of the principles and assumptions used in the adopted 2019 LTFP
• The Shire’s evolving understanding of the asset renewal requirements across all asset classes to meet acceptable levels of service and the financial implications of implementing the necessary maintenance, renewal and upgrade programs
6 | Long Term Financial Plan 2021/22 - 2030/31
The LTFP recognises that to maintain the functionality and effectiveness of the Shire’s range of assets, increased funding needs to be allocated to capital renewal. As such, Council has adopted, as one of the guiding principles of the LTFP, that revenue and expenditure are structured with the goal of achieving the future renewal of assets within their planned useful life. This principle will ensure that funding commitments better align to asset depreciation. Strict monitoring and management of operations is essential to maintain this level of expenditure within a tight financial environment.
The 2021/22 - 2030/31 LTFP achieves the following outcomes:
• Rates increase of 4% annually
• Total new borrowings forecast at $5.159M
• Capital works program of $54.2M. A program that includes delivering updated Ocean Beach and Prawn Rock Channel community facilities, redevelopment of Berridge Park public amenities and youth precinct, Civic Centre and Library upgrades, and sharing the upgrading of oval facilities at the Denmark Senior High School
The LTFP sets a positive path for the future, including substantial investment of funding for the renewal of infrastructure. In addition, the Shire would benefit from developing strategies for alternative revenue streams and reviewing existing service levels throughout the life of the plan to improve the Shire’s resilience with consideration for future financial challenges.
This plan provides a sound financial foundation, but is also one that can, and should, be enhanced through effective financial management and timely leadership interventions. This will strengthen the Shire’s financial position in future iterations of the plan to ensure sustainable and reliable ongoing delivery of services to the community.
David Schober Chief Executive Officer
7Long Term Financial Plan 2021/22 - 2030/31 |
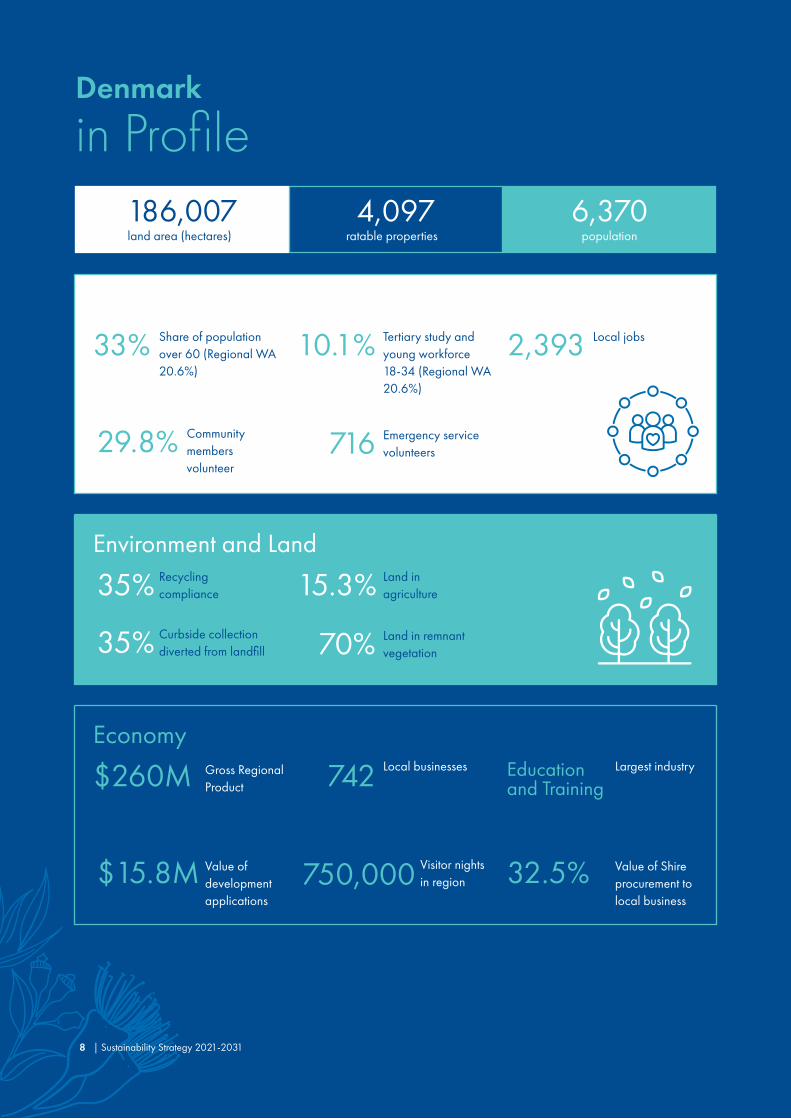
Economy
$260M
$15.8M 32.5%
742
750,000
Education and Training
Gross Regional Product
Value of development applications
Value of Shire procurement to local business
Local businesses
Visitor nights in region
Largest industry
Denmark
in Profile
Environment and Land
186,007
33%
35%
29.8%
35%
10.1%
15.3%
716
70%
2,393
4,097 6,370land area (hectares)
Share of population over 60 (Regional WA 20.6%)
Recycling compliance
Community members volunteer
Curbside collection diverted from landfill
Tertiary study and young workforce 18-34 (Regional WA 20.6%)
Land in agriculture
Emergency service volunteers
Land in remnant vegetation
Local jobs
ratable properties population
8 | Sustainability Strategy 2021-2031

Every Dollar
Counts
$38Rates
$18Fees & Charges
$3Other Revenue
$41Grants & Contributions
The Shire of Denmark raises funds from a range of sources each year to deliver projects and services throughout the Shire. Here’s a breakdown of where every $100 dollars spent in our Shire in the 2020/2021 Financial Year came from.
Where every $100 comes from
9Long Term Financial Plan 2021/22 - 2030/31 |
The objective of the Long Term Financial Plan (LTFP) is to meet the aspirations of the Community Strategic Plan, Denmark 2027, through fiscal responsibility.
10 | Long Term Financial Plan 2021/22 - 2030/31
Long Term
Financial Plan ObjectiveThe objective of the Long Term Financial Plan (LTFP) is to meet the aspirations of the Community Strategic Plan, Denmark 2027, through fiscal responsibility.
It guides our approach to building and maintaining infrastructure and delivering services to the community, while demonstrating our commitment to managing our operations in a fiscally responsible and sustainable manner. The plan achieves this objective by projecting the Shire’s financial position over a 10 year period using a series of realistic financial assumptions.
The LTFP is built using data from the 2021/22 adopted budget to establish the current base financial position of the Shire. From this position, the 10 year plan is built with the general principles that full staffing levels are achieved and service standards are maintained throughout the term of the LTFP. Modelling then builds on this with future information relating to:
• Strategic Community Plan priorities and initiatives
• Corporate Business Plan actions and initiatives
• Asset Management Plan for land and buildings, transport and recreation infrastructure
• Workforce planning
• Capital project plans and proposals
• Plant replacement programs
• Information communication and technology renewal and upgrade program
• Projections for consistency in or changes to the proposed range of services
• Discretionary capital revenue projections
• Anticipated government grants and subsidies
Financial modelling provides the Shire with appropriate information to identify potential challenges and to ensure that there are adequate resources to maintain operations, in addition to funding capital replacement programs and proposed new capital projects. This is particularly important to ensure that the community is not adversely impacted in future years by service delivery constraints or a significant deterioration in the condition of community infrastructure.
The major elements to be considered in the long-term financial planning exercise are:
• Operational service delivery
• Asset renewal, upgrade and replacement
• Discretionary capital projects
In the LTFP context, operational service delivery refers to developing the funding model that ensures that planned services to our community can be consistently and reliably delivered to an agreed standard across the 10 years of the plan.
Asset renewal planning ensures that an appropriate level of funding is provided to maintain infrastructure assets to an agreed standard through timely intervention and maintenance across the life of the plan. When modelling the LTFP, upgrade of assets usually refers to major enhancements to community buildings and facilities.
Discretionary capital projects refers to major new projects that may emerge through master planning exercises such as new buildings, new infrastructure and facility redevelopment. The capital works timeline below outlines the projects that are factored into the LTFP.
11Long Term Financial Plan 2021/22 - 2030/31 |

Capital Projects
Timeline
2022
2023
2024
2025
2026+
Lights Beach Development
Lights Beach Road
Mountain Bike Trail
Waste Facility Upgrade
Library and Civic Centre Upgrade
McLean Park Recreation Centre Upgrade
Aquatic Facility
Peaceful Bay Water System
Administration Building Upgrade
Ocean Beach Recreation Precinct Redevelopment
Nornalup Jetty
High School Oval Facilities Upgrade
Berridge Park Redevelopment
2021
12 | Long Term Financial Plan 2021/22 - 2030/31

Basis for Preparation of the
Long Term Financial PlanThe Long Term Financial Plan (LTFP) is underpinned by the following guiding principles. Guiding principles are a set of values set out by Council to establish the framework for the LTFP.
1. The LTFP is a key informing strategic document that aims to deliver the aspirations of Denmark 2027
2. The LTFP and the Corporate Business Plan are the guiding strategies to build the Annual Budget
3. Financial sustainability and accountability are delivered through an annual balanced budget
4. Reserve funds are maintained to achieve their purpose and intent
5. Revenue and expenditure are structured with the goal of achieving the future renewal of assets within a planned useful life
6. Debt funding may be used for capital works or the purchase of assets, but is not to be used to finance operating activities or recurrent expenditure
7. The LTFP will manage our asset base to meet community needs as identified in the Strategic Community Plan
8. Within the LTFP annual review, Council will be responsive to prevailing economic conditions and adjust capital project timeframes to support the local economy
9. Rating revenue levels are set in order to produce a balanced budget
13
External Influences and
Key RisksOver the past 18 months few organisations have avoided the global impacts of Covid-19 and the corresponding economic responses from State and Federal Governments.
It is one of the key reasons why we are undertaking a significant review of the LTFP so soon after the first plan was adopted in 2019. Whilst rates, fees and charges were frozen in 2020/21 in response to the State Government directive, there was also additional project funding made available from Federal Government as a result of the drought and Covid-19 response respectively.
The past 12 months resulted in significant economic and social impacts as first the community was shut down during the initial stages and then reopened only to experience an unprecedented high demand on the tourism and hospitality sector. Contractors and builders are now experiencing additional pressure on their businesses as more State and Federal funding is released for civil and construction related works.
Risk analysis was undertaken as part of the financial modelling to develop this LTFP. The heavy reliance on project funding from State and Federal funding sources carries a risk that this funding may not eventuate or deliver less than anticipated, requiring a major rework of the capital works program.
There is also a risk that the proceeds from industrial land sales associated with Denmark East Light Industrial Area may not occur in the timeframes modelled in this plan.
Operational funding risks include the risk to movements in interest rates beyond those modelled in the plan. This would create a reduction in interest revenue from investments but conversely could result in more advantageous borrowing conditions. Other operational risks include the reduction or loss of grant funding supporting existing community services, changes in government policy or cost-shifting from State to Local Government. These risks will need to be managed on a case by case basis as they arise.
There are non-financial risks that may affect the delivery of planned major projects or maintenance activities such as limited contractor availability at the time of the scheduled works, the discovery of unknown hazardous materials during a project or delays with securing the required approvals from external agencies.
To responsibly manage its commitments arising from the LTFP the Shire should regularly review the Shire’s financial position and project funding strategies and monitor of the economic environment to allow timely and appropriate interventions.
14 | Long Term Financial Plan 2021/22 - 2030/31

Economic
AssumptionsProjects and Services
The plan is based on a number of financial assumptions relating to the anticipated movements in both revenue and expenditure, the anticipated timeframes for cash flows into and out of the organisation and expectations of any changes to existing grant funding assistance by both Federal and State Governments. Indicative funding or cost estimates included in this plan relate to broad proposals that have been:
• Approved by Council and are in progress, or
• Considered by Council but have yet to be given final approval to proceed, or
• Considered by Council at a strategic or conceptual level, or
• Operational in nature and based on the continued delivery of existing services, or
• Operational in nature and relate to the maintenance of Shire assets in accordance with management or maintenance plans
Any assumptions in relation to the financial modelling parameters, projects or service proposals may subsequently be shown to be imprecise in respect to likely funding requirements, timing or financial estimates or they may not eventuate at all. The LTFP is prepared with the best available information and is subject to ongoing annual review and revision. Adoption of the LTFP by Council does not constitute a commitment to any particular project or service, nor to its timing. Similarly, it does not preclude the possible subsequent inclusion of further initiatives in future years if the financial modelling and strategic direction of Council indicate that it could be supported without adversely impacting on the Shire’s financial sustainability.
Indexing
There were a number of financial parameters used to model this LTFP. Figures used in the financial model are based on current conditions or known factors and the forward projections allow for known or reasonably anticipated circumstances. Included in the financial assumptions are anticipated movements in relevant price indices, wages growth and interest rates as they relate to both investment returns and borrowing costs. Unanticipated changes in any of these parameters or in government policy directions have the potential to impact on the financial modelling. In addition, forecasting the recovery from Covid-19 adds a further level of uncertainty to the projections.
15Long Term Financial Plan 2021/22 - 2030/31 |

Economic
Assumptions (Cont.)Consumer Price Index
The Consumer Price Index (CPI) measures changes in the prices paid by consumers for a basket of goods and services. Whilst that may be a useful indicator of price changes for the average household, it is not a consistent and accurate measure of the cost increases impacting on a Local Government due to the broad range of services provided. As a result, it is only one of a number of index measures used in the forecasting. The CPI (Perth, Q1 2021) came in (year on year) at 1.0% with the longer term expectation that inflation will be within the RBA’s target band (2-3%) in the later quarters of 2021/22.
Local Government Cost Index
The Local Government Cost Index (LGCI), developed by the Western Australian Local Government Association (WALGA), takes into account economic components such as WA Wage Price Index, road and bridge construction, non-residential building, CPI, machinery and equipment, electricity and street lighting, insurance and other utility costs. The LGCI provides a more accurate indicator of cost movements affecting Local Government as it makes better distinction between operating and capital costs and uses price indices that align more closely to the nature of goods and services used. WALGA updates latest forecast (June 2021) indicating a rate of 3.2% for 2021/22 and 2.8% in 2022/23.
Population Growth
The Department of Planning, Lands and Heritage undertakes population forecasting every five years. WA Tomorrow Population Report No.11 contains the latest population forecasts by age and sex, for Western Australia and its regions. They represent the official WA State Government forecasts to 2031. The current estimate is that the Shire is on track to have 7090 residents by 2031, representing an annual increase of 1.3% over the next 10 years. The 2020 Estimated Residential Population data released by ABS showed a slight increase on these numbers as a result of migration to Denmark post pandemic. It is unclear how this trend will play out over coming years, but it may result in revised population growth forecasts in coming years.
16 | Long Term Financial Plan 2021/22 - 2030/31

Key Elements of the
Financial StatementsThe plan achieves a balanced budget for each financial year.
Operating income and expenditures are projected to have steady growth over the next 10 years. Any operating surplus generated at the end of the year will be carried forward and/or placed into reserves to provide funds for expenditure on asset renewal, replacement and provision of new assets to enhance the long-term financial sustainability of the Shire.
Revenue
Rates
The previous version of the LTFP assumed no rates base growth year-on-year. The updated version of the LTFP has factored in a rates base growth of 0.35% in the 2021/22 and 2022/23 financial year and then forecasts an increase of 0.2% for the remainder of the plan. Changes in valuations have not been factored into the calculation of rates.
Due to subdued growth in fees and charges, coupled with demand to increase asset renewal expenditure and maintain existing service levels, a key assumption of a 4% annual rate increase after 2021/22 is contained within the LTFP.
Historical and Planned Rates Annual Increase
Operating Grants
Operating grants are modelled based on the 2021/22 adopted budget estimate, with a 1.5% indexation applied annually. The main annual operating grants received are:
• Grants Commission General $566,460
• Grants Commission Roads $526,885
• Main Roads Direct (untied) $127,200
• Mitigation Activity Fund $497,000
• Bushfire Brigades $165,000
• DFES SES Brigades $20,000
Fees & Charges
An increase of 3% is modelled in the first four years of the plan with year five and beyond modelled with a 2% annual increase. Some listed fees and charges are statutory and are determined by the relevant Government bodies so are outside the Shire’s control. Some of the main revenue earning fees and charges are:
• Waste Management
• Lime Sand Sales
• Peaceful Bay Leases
• Parry Beach Camping Fees
• Department of Transport - Licensing Commission
Waste Services
In 2021, the Shire presented a Waste Services Action Plan to Council that reviewed the Shire’s waste management systems. The Action Plan detailed key steps to progress to a more sustainable waste services model with improved waste management outcomes. The basis of funding the revised waste services model is a $70 general minimum fee levied to all rateable properties commencing in 2021/22. This minimum fee will be reviewed on an annual basis to meet Council and community expectations with regards to the waste services provision.
-2
0
2
4
6
8
10
12
2024
/25
2023
/24
2022
/23
2021
/22
2020
/21
2019
/20
2018
/19
2017
/18
2016
/17
2015
/16
2014
/15
2013
/14
2012
/13
17Long Term Financial Plan 2021/22 - 2030/31 |

Key Elements of the
Financial Statements (Cont.)Peaceful Bay
The Shire of Denmark has control and management of Reserve 24510, with the power to lease for periods not exceeding 21 years. The Shire’s records suggest that 203 leases apply to the subject land, generating approximately $368,000 annual revenue. All of the leases were renewed in July 2010 and expire concurrently in 2031. The LTFP assumes that the income from Peaceful Bay will continue and as such we need to ensure that this revenue stream is maintained. The Shire is investigating staggering the leases or offering new 21 year leases on property transfer similar to Windy Harbour in the Shire of Manjimup.
Ocean Beach Lime Pit
The Ocean Beach Lime Pit provides a valuable resource while also producing an income stream for the Shire. The Shire currently produces 15,000 tonne of high-grade agricultural lime sand annually and generates approximately $180,000 in profit. At some point, the Shire will exhaust the deposit at this site and will investigate alternative income streams.
Interest Earnings
Interest earnings from investments are based on historical information and Western Australian Treasury Corporation forecasts for the next three years which are 2021/22 at 0.5%, 2022/23 at 1.00%, 2023/24 at 1.00%. Year four and beyond assumes an average rate for interest earnings of 2%.
Proceeds from Asset Disposal
The LTFP assumes the sales of five industrial land blocks owned by the Shire in the Denmark East Light Industrial Area. The total revenue yield from the sale of these blocks is predicted at $1,850,000 and are currently scheduled for sale in 2023/24, 2026/27 and 2027/28.
Other Revenue
The majority of other income revenue relates to reimbursements, rebates and sale of miscellaneous items and to some degree is linked to specific expenditure levels. The plan assumes a 2% increase per annum over the life of the plan.
Non-Operating Grants & Subsidies
The Shire of Denmark receives as significant amount of non-operating income annually through the Regional Road Group. The funding is allocated competitively based upon predetermined criteria.
Non-operating grants are project specific and are therefore linked to specific capital project budgets and adjusted consistently. The Shire needs to ensure that applications made are renewal focused and well-aligned to the selection criteria to ensure ongoing funding success under this program. The failure to maintain funding levels under this program will impact the Shire’s ability to pay for our workforce and achieve the desired expenditure levels required under the Asset Management Plan.
As mentioned earlier, reliance on grant funding as a major element of the funding equation carries a risk. Funding streams may not eventuate, be highly competitive or may result in a lesser amount than anticipated.
Expenses
Employee Expenses
Employee expenses are indexed at 2.5% which include salary and wages increases in addition to changes to the Superannuation Guarantee is legislated to be increased from 9.5% to 12% between July 2021 and July 2025. There are no allowances for increases to the staffing structure over the life of the LTFP, other than the possibility of contract staff attached to a particular project for its duration.
Materials and Contracts
Materials and contracts have generally been modelled by applying a 2% indexation, however specific line items have been adjusted to take known or anticipated factors into account. These include increased costs for waste management (landfill, waste processing and recycling costs), reductions to project specific consulting fees and changes to operating initiatives to align with Corporate Business Plan priorities. Adjustments have been made for expenses that recur only in certain years, such as election expenses and triennial Gross Rental Value revaluations.
Utility Expenses
While electricity represents the largest component of utilities expenditure, savings have been achieved by the installation of solar panels on the Shire Administration building and installation of LED lights at the Recreation Centre. Utility expenses are generally modelled by applying the LGCI Index component of 2.5% for the life of the plan.
Insurance Expenses
Insurance expenses are modelled by applying a 2% indexation.
18 | Long Term Financial Plan 2021/22 - 2030/31

Other Expenditure
These expenses are generally modelled using an estimated 1% increase on the base year.
Depreciation
Depreciation assets such as property, plant, equipment, vehicles, infrastructure and land are valued at Fair Value in the Balance Sheet of the Shire. These assets have been depreciated on a straight line method using current depreciation rates.
Debt Management
Loan borrowings use a financing facility available to Local Governments to sustainably meet long-term community needs, particularly in respect to major capital works projects. The Local Government Act (1995) empowers the Shire to borrow within a financial strategy as part of a balanced funding structure and is included in the Shire’s LTFP where appropriate.
The use of long-term borrowings is strongly influenced by the competing needs of building new community assets, upgrading infrastructure and funding projects where insufficient funds are available to meet the capital outlays. This plan requires new borrowings of $5.159M in the 10 year term of the plan for the following:
• Denmark Surf Club 2021/22 $1,769,225
• Rubbish Truck 2021/22 $510,000
• Admin Building 2024/25 $1,000,000
• CivicCentre/Library 2027/28 $1,500,000
• Rubbish Truck 2028/29 $380,000
This plan will see the Shire’s debt peak at $4.58M in 2027/28 and has a loan balance at the end of 10 years of $3.261M.
Long Term Debt Balances
Reserves
Financial reserves are considered an appropriate mechanism to sustainably manage a Local Government’s long-term financial stability. Reserves help to avoid the need for large or irregular rates movements in the years that relevant projects are delivered, spreading or smoothing the financial impacts. The accumulation of funds in reserve accounts over a 10 year period provides the Shire with capacity to meet community demands into the future. The list of reserve accounts currently held by the Shire are:
• Lime Quarry Rehabilitation Reserve
• Parry Inlet Reserve
• Cemetery Reserve
• Employee Leave Entitlements Reserve
• Land and Infrastructure Reserve
• Plant Replacement Reserve
• Waste Services Reserve
• Parks and Gardens Reserve
• Aquatic Facility Development Reserve
• Lionsville Reserve
• Peaceful Bay Reserve
• Recreation Centre Reserve
• Denmark East Development Reserve
• Strategic Reserve
• ICT Reserve
• Legal Contingency Reserve
Long Term Reserves Balances
0
500000
1500000
1000000
2000000
2500000
3500000
3000000
4000000
4500000
21-22 22-23 23-24 24-25 25-26 26-27 27-28 28-29 29-30 30-31
0
6000000
5000000
4000000
3000000
2000000
1000000
21-22 22-23 23-24 24-25 25-26 26-27 27-28 28-29 29-30 30-31
19Long Term Financial Plan 2021/22 - 2030/31 |

Key Elements of the
Financial Statements (Cont.)Asset Renewal
The effective management of assets is crucial to the sustainable delivery of Local Government services. Assets need to serve the needs of the community, in alignment with the Strategic Community Plan. There is a need to plan and prioritise the maintenance, renewal and replacement of existing assets and where appropriate, the acquisition of new assets. This requires a long-term ‘whole of life’ view of asset management.
Given the prioritisation of ‘renew’ over ‘new’ when managing assets, proposals for new discretionary capital projects will require that a whole of life costing is prepared, including a proposed funding model showing indicative contributions from each funding source, whether that be municipal funds, grants, loan borrowings and reserve funds, before the project is considered for endorsement and inclusion in future revisions of the LTFP. This will ensure that a financially sustainable approach is being maintained for the renewal and expansion of the Shire’s assets to meet the ongoing needs of the community.
Capital Expenditure
Capital expenditure is modelled to achieve an immediate improvement to the level of renewal expenditure on the Shires’ infrastructure, property, plant and equipment assets. The Shire’s capital expenditure works program aims to meet infrastructure service requirements of the Shire for the future. Renewal or upgrade of existing infrastructure and the creation of new assets has been included in developing this plan.
This plan provides for an ambitious capital works program of $54.1M (indexed) over the 10 year period, which will require borrowings of $5.159M to achieve this program. To achieve the major projects of $20.55M as part of the Capital Works Program, there is a reliance on State and Federal governments making substantial grants available. Failure to secure these funds would mean some of these major projects may not proceed.
21/22/23 Denmark Surf Club/Precinct
$8,000,000
21/22 Nornalup Jetty / Various Footpaths
$400,000
22/23 Mountain Bike Trail $1,000,000
24/25 Berridge Park Toilets/Skate Park
$2,000,000
24/25 DSHS Facilities $250,000
25/26 Admin Building $1,000,000
25/26 Waste Facility Upgrades
$1,000,000
26/27 McLean Park Rec Centre
$2,000,000
27/28 Civic Centre Library $4,600,000
29/30 Waste Facility Capping Works
$300,000
The Major Projects expected over the life the plan:
20 | Long Term Financial Plan 2021/22 - 2030/31

Key Financial
IndicatorsMeasuring Our Financial Performance
The Local Government (Financial Management ) Regulations 1996 requires all Local Governments in Western Australia to calculate seven key ratios.
These ratios cover financial and asset management performance and form the basis for assessing the financial health of the Shire. There has been recent industry wide concern that some of the ratios may not be appropriate for all tiers of Local Government based on the size and scale of operations. As such, there may be changes in the future as to which ratios are required to be reported under the Local Government Financial Management Regulations. Until such time, the current ratios will continue to be monitored and used to inform local discussion with the community as to the affordability of Local Government services and capital works projects into the future and the implications on the overall financial health of the Shire.
It should be noted that there is no single ratio that delineates the financial sustainability of a Local Government, and it is not necessarily detrimental for any one ratio to move outside of the preferred benchmark. Both the trend of the ratio and the operational activity driving the denominator and numerator values in the ratio calculation, need to be understood to properly inform discussion.
21Long Term Financial Plan 2021/22 - 2030/31 |

Key Financial
Indicators (Cont.)Ratios
Current Ratio
This ratio measures liquidity and our ability to meet our short-term financial obligations from unrestricted current assets. The ratio target is between 100% and 120%. While we are lower than the target benchmark during the 10 year plan, this is not considered a threat to the Shire’s long-term financial position as the current ratio is only a short-term liquidity measure.
Operating Surplus Ratio
This ratio measures the extent to which revenue raised not only covers operational expenses, but also provides for capital funding. The ratio target is between 0% and 15%.
While improving over the 10 years, our result does not meet the benchmark. Indicating that our Shire is reliant on grant funding to undertake capital projects. As the Shire receives grant funding for the renewal of assets, a negative ratio is not viewed as an adverse position for a Tier Three Local Government. While the ratio is below the target, it improves over the term of the plan, indicating an improving operating position.
Actual Target
0%
-30%
-20%
-10%
0%
10%
20%
21-22 22-23 23-24 24-25 25-26 26-27 27-28 28-29 29-30 30-31
Calculation Current Ratio = Current Assets less restricted assets / Current liability less liability associated with restricted assets
Calculation – Net operating surplus / Own source operating revenue
Actual Target
0%
20%
40%
60%
80%
100%
120%
140%
21-22 22-23 23-24 24-25 25-26 26-27 27-28 28-29 29-30 30-31
22 | Long Term Financial Plan 2021/22 - 2030/31

Own Source Coverage Ratio
This ratio measures the extent to which we can cover costs through our own revenue efforts (rates, fees and charges etc). The ratio target is between 40% and 60%.
Debt Service Coverage Ratio
This ratio measures the extent to which we can generate sufficient cash to cover our debt payments. The ratio target is 200% or higher. Modelling indicates that we exceed this benchmark due to our relatively low borrowing level over the 10 years, indicating that we have the capacity to take out further loans should we need to.
Actual Target
0%
10%
20%
30%
40%
50%
60%
70%
80%
90%
21-22 22-23 23-24 24-25 25-26 26-27 27-28 28-29 29-30 30-31
Actual Target
0%
100%
200%
300%
400%
500%
600%
700%
21-22 22-23 23-24 24-25 25-26 26-27 27-28 28-29 29-30 30-31
Calculation – Annual operating result before interest and depreciation / Annual debt service payments (both principal and interest)
Calculation – Annual operating result before interest and depreciation / Annual debt service payments (both principal and interest)
23Long Term Financial Plan 2021/22 - 2030/31 |
Key Financial
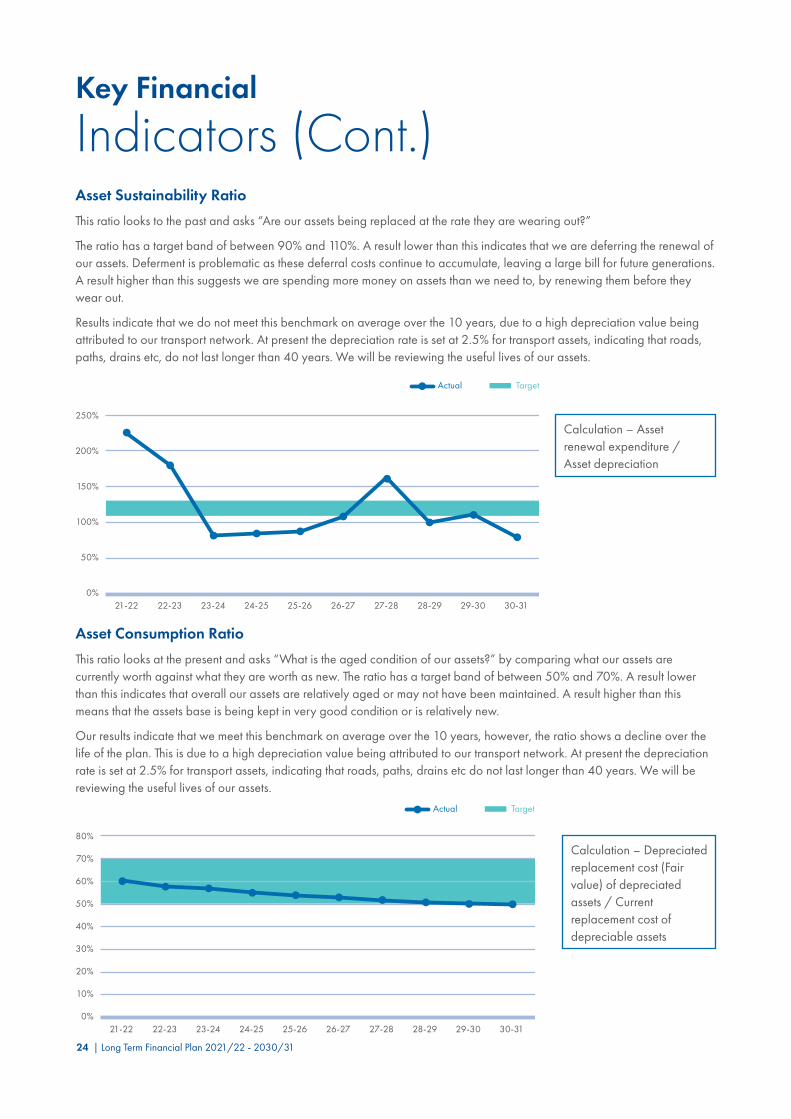
Indicators (Cont.)Asset Sustainability Ratio
This ratio looks to the past and asks “Are our assets being replaced at the rate they are wearing out?”
The ratio has a target band of between 90% and 110%. A result lower than this indicates that we are deferring the renewal of our assets. Deferment is problematic as these deferral costs continue to accumulate, leaving a large bill for future generations. A result higher than this suggests we are spending more money on assets than we need to, by renewing them before they wear out.
Results indicate that we do not meet this benchmark on average over the 10 years, due to a high depreciation value being attributed to our transport network. At present the depreciation rate is set at 2.5% for transport assets, indicating that roads, paths, drains etc, do not last longer than 40 years. We will be reviewing the useful lives of our assets.
Asset Consumption Ratio
This ratio looks at the present and asks “What is the aged condition of our assets?” by comparing what our assets are currently worth against what they are worth as new. The ratio has a target band of between 50% and 70%. A result lower than this indicates that overall our assets are relatively aged or may not have been maintained. A result higher than this means that the assets base is being kept in very good condition or is relatively new.
Our results indicate that we meet this benchmark on average over the 10 years, however, the ratio shows a decline over the life of the plan. This is due to a high depreciation value being attributed to our transport network. At present the depreciation rate is set at 2.5% for transport assets, indicating that roads, paths, drains etc do not last longer than 40 years. We will be reviewing the useful lives of our assets.
Actual Target
0%
50%
100%
150%
200%
250%
21-22 22-23 23-24 24-25 25-26 26-27 27-28 28-29 29-30 30-31
Actual Target
0%
10%
30%
20%
40%
50%
60%
70%
80%
21-22 22-23 23-24 24-25 25-26 26-27 27-28 28-29 29-30 30-31
Calculation – Asset renewal expenditure / Asset depreciation
Calculation – Depreciated replacement cost (Fair value) of depreciated assets / Current replacement cost of depreciable assets
24 | Long Term Financial Plan 2021/22 - 2030/31

Asset Renewal Funding Ratio
This ratio looks to the future and asks “Is there sufficient funding for the renewal and replacement of our assets?”
The ratio has a target band of between 75% and 96%, which means for every dollar that we need to spend, we have at least 75c to 96c available in our LTFP. A result less than this means we do not have enough money (eg: a result of 40% means that for every dollar we need to spend, we only have 40c available). Accordingly, an outcome higher than this means we have surplus funds allocated which could be diverted to address other needs.
This ratio is calculated using Net Present Value (the value of future dollars) and due to the calculation, only five years can be estimated. Our results indicate that we meet this benchmark on average over the five years, having on average 92c available for every dollar we need to spend.
Actual Target
21-220%
20%
40%
22-23 23-24 24-25 25-26
60%
80%
100%
120%
Calculation – NPV of planned renewal expenditure / NPV of asset management plan projections
25Long Term Financial Plan 2021/22 - 2030/31 |

27 Statement of Comprehensive Income by Nature or Type
28 Rate Setting Statement
29 Statement of Financial Position
30 Statement of Changes in Equity
31 Statement of Operational Funding
32 Statement of Capital Funding
Appendix
33 Reserves Table
Key Financial
Statements
26 | Sustainability Strategy 2021-2031

Statement of Comprehensive Income
by Nature or Type1
23
45
67
89
10FY
21/2
2 FY
22/2
3FY
23/2
4FY
24/2
5FY
25/2
6FY
26/2
7FY
27/2
8FY
28/2
9FY
29/3
0FY
30/3
1$
$$
$$
$$
$$
$Re
venu
eRa
tes
7,05
3,66
2
7,
335,
308
7,62
8,21
0
7,
922,
818
8,23
9,40
0
8,
568,
639
8,91
1,04
1
9,
267,
131
9,63
7,45
9
10
,022
,592
Op
erat
ing
gran
ts, s
ubsid
ies a
nd co
ntrib
utio
ns3,
289,
288
2,22
2,29
2
2,
259,
477
2,29
7,29
6
2,
335,
762
2,37
4,88
6
2,
414,
678
2,45
5,15
0
2,
496,
315
2,53
8,18
5
Fe
es a
nd ch
arge
s3,
458,
312
3,56
2,06
1
3,
668,
923
3,77
8,99
1
3,
892,
361
3,97
0,20
8
4,
049,
612
4,13
0,60
4
4,
213,
216
4,29
7,48
1
In
tere
st e
arni
ngs
72,9
08
72
,209
71,7
81
71
,617
72,1
49
72
,692
73,2
46
73
,711
74,1
85
74
,669
Othe
r rev
enue
188,
487
19
2,25
7
196,
102
20
0,02
4
204,
024
20
8,10
5
212,
267
21
6,51
2
220,
843
22
5,25
9
14,0
62,6
57
13,3
84,1
26
13,8
24,4
92
14,2
70,7
46
14,7
43,6
97
15,1
94,5
30
15,6
60,8
43
16,1
43,1
09
16,6
42,0
18
17,1
58,1
86
Expe
nses
Empl
oyee
cost
s(6
,939
,943
)(6
,738
,075
)(6
,906
,526
)(7
,079
,190
)(7
,256
,169
)(7
,437
,573
)(7
,623
,513
)(7
,814
,101
)(8
,009
,453
)(8
,209
,689
)M
ater
ials
and
cont
ract
s(5
,502
,014
)(3
,849
,363
)(3
,891
,490
)(3
,963
,379
)(4
,031
,150
)(4
,149
,376
)(4
,156
,139
)(4
,243
,299
)(4
,381
,547
)(4
,464
,079
)Ut
ility
char
ges
(220
,985
)(2
26,5
10)
(232
,172
)(2
37,9
77)
(243
,926
)(2
50,0
24)
(256
,275
)(2
62,6
82)
(269
,249
)(2
75,9
80)
Depr
ecia
tion
on n
on-c
urre
nt a
sset
s(3
,820
,875
)(4
,019
,635
)(4
,164
,799
)(4
,248
,109
)(4
,338
,424
)(4
,438
,267
)(4
,555
,196
)(3
,562
,337
)(3
,688
,529
)(3
,773
,081
)In
tere
st e
xpen
ses
(123
,877
)(1
26,1
28)
(112
,932
)(1
10,7
18)
(107
,392
)(9
3,99
5)(1
03,9
56)
(116
,740
)(1
05,5
61)
(91,
911)
Insu
ranc
e ex
pens
es(4
27,6
79)
(433
,440
)(4
42,1
09)
(450
,951
)(4
59,9
70)
(469
,169
)(4
78,5
53)
(488
,124
)(4
97,8
86)
(507
,844
)Ot
her e
xpen
ditu
re(4
45,3
00)
(449
,753
)(4
54,2
51)
(458
,793
)(4
63,3
81)
(468
,015
)(4
72,6
95)
(477
,422
)(4
82,1
96)
(487
,018
)(1
7,48
0,67
3)(1
5,84
2,90
4)(1
6,20
4,27
9)(1
6,54
9,11
6)(1
6,90
0,41
1)(1
7,30
6,42
0)(1
7,64
6,32
6)(1
6,96
4,70
4)(1
7,43
4,42
0)(1
7,80
9,60
2)Ne
t Res
ults
from
Ope
ratio
ns(3
,418
,016
)(2
,458
,778
)(2
,379
,787
)(2
,278
,370
)(2
,156
,714
)(2
,111
,890
)(1
,985
,483
)(8
21,5
94)
(792
,402
)(6
51,4
16)
Non-
oper
atin
g gr
ants
, sub
sidie
s and
cont
ribut
ions
4,41
1,10
3
5,
800,
822
3,31
5,24
2
1,
236,
528
1,15
1,53
1
2,
959,
182
3,91
6,91
0
1,
174,
715
1,49
0,59
1
1,
198,
553
Prof
it on
disp
osal
of a
sset
s54
,000
065
0,00
00
060
0,00
060
0,00
00
00
Loss
on
disp
osal
of a
sset
s(3
4,00
0)0
00
00
00
00
NET
RESU
LT1,
013,
087
3,34
2,04
4
1,
585,
455
(1,0
41,8
41)
(1,0
05,1
83)
1,44
7,29
2
2,
531,
427
353,
121
698,
189
547,
137
Othe
r com
preh
ensiv
e in
com
e0
00
00
00
00
0
TOTA
L COM
PREH
ENSI
VE IN
COM
E1,
013,
087
3,34
2,04
4
1,
585,
455
(1,0
41,8
41)
(1,0
05,1
83)
1,44
7,29
2
2,
531,
427
353,
121
698,
189
547,
137
SHIR
E OF
DEN
MAR
K - L
ONG
TERM
FINA
NCIA
L PLA
NFO
RECA
ST S
TATE
MEN
T OF
COM
PREH
ENSI
VE IN
COM
E - B
Y NA
TURE
OR
TYPE
FOR
THE
PERI
OD 2
021/
22 -
2030
/31
27Long Term Financial Plan 2021/22 - 2030/31 |

Rate Setting
Statement1
23
45
67
89
10FY
21/2
2 FY
22/2
3FY
23/2
4FY
24/2
5FY
25/2
6FY
26/2
7FY
27/2
8FY
28/2
9FY
29/3
0FY
30/3
1$
$$
$$
$$
$$
$Ne
t cur
rent
ass
ets c
/fw
d - s
urpl
us/(
defic
it)1,
553,
964
0
00
00
00
00
OPER
ATIN
G AC
TIVI
TIES
Reve
nue
from
ope
ratin
g ac
tiviti
es
Oper
atin
g gr
ants
, sub
sidie
s and
cont
ribut
ions
3,28
9,28
8
2,22
2,29
2
2,25
9,47
7
2,29
7,29
6
2,33
5,76
2
2,37
4,88
6
2,41
4,67
8
2,45
5,15
0
2,49
6,31
5
2,53
8,18
5
Fees
and
char
ges
3,45
8,31
2
3,56
2,06
1
3,66
8,92
3
3,77
8,99
1
3,89
2,36
1
3,97
0,20
8
4,04
9,61
2
4,13
0,60
4
4,21
3,21
6
4,29
7,48
1
Inte
rest
ear
ning
s72
,908
72
,209
71
,781
71
,617
72
,149
72
,692
73
,246
73
,711
74
,185
74
,669
Ot
her r
even
ue18
8,48
7
19
2,25
7
19
6,10
2
20
0,02
4
20
4,02
4
20
8,10
5
21
2,26
7
21
6,51
2
22
0,84
3
22
5,25
9
Pr
ofit
on a
sset
disp
osal
s54
,000
0
650,
000
00
600,
000
600,
000
00
07,
062,
995
6,
048,
818
6,
846,
282
6,
347,
928
6,
504,
297
7,
225,
891
7,
349,
803
6,
875,
978
7,
004,
559
7,
135,
594
Expe
nditu
re fr
om o
pera
ting
activ
ities
Empl
oyee
cost
s(6
,939
,943
)(6
,738
,075
)(6
,906
,526
)(7
,079
,190
)(7
,256
,169
)(7
,437
,573
)(7
,623
,513
)(7
,814
,101
)(8
,009
,453
)(8
,209
,689
)M
ater
ials
and
cont
ract
s(5
,502
,014
)(3
,849
,363
)(3
,891
,490
)(3
,963
,379
)(4
,031
,150
)(4
,149
,376
)(4
,156
,139
)(4
,243
,299
)(4
,381
,547
)(4
,464
,079
)Ut
ility
char
ges
(220
,985
)(2
26,5
10)
(232
,172
)(2
37,9
77)
(243
,926
)(2
50,0
24)
(256
,275
)(2
62,6
82)
(269
,249
)(2
75,9
80)
Depr
ecia
tion
on n
on-c
urre
nt a
sset
s(3
,820
,875
)(4
,019
,635
)(4
,164
,799
)(4
,248
,109
)(4
,338
,424
)(4
,438
,267
)(4
,555
,196
)(3
,562
,337
)(3
,688
,529
)(3
,773
,081
)In
tere
st e
xpen
ses
(123
,877
)(1
26,1
28)
(112
,932
)(1
10,7
18)
(107
,392
)(9
3,99
5)(1
03,9
56)
(116
,740
)(1
05,5
61)
(91,
911)
Insu
ranc
e ex
pens
es(4
27,6
79)
(433
,440
)(4
42,1
09)
(450
,951
)(4
59,9
70)
(469
,169
)(4
78,5
53)
(488
,124
)(4
97,8
86)
(507
,844
)Ot
her e
xpen
ditu
re(4
45,3
00)
(449
,753
)(4
54,2
51)
(458
,793
)(4
63,3
81)
(468
,015
)(4
72,6
95)
(477
,422
)(4
82,1
96)
(487
,018
)Lo
ss o
n di
spos
al o
f ass
ets
(34,
000)
00
00
00
00
0(1
7,51
4,67
3)(1
5,84
2,90
4)(1
6,20
4,27
9)(1
6,54
9,11
6)(1
6,90
0,41
1)(1
7,30
6,42
0)(1
7,64
6,32
6)(1
6,96
4,70
4)(1
7,43
4,42
0)(1
7,80
9,60
2)Op
erat
ing
activ
ities
exc
lude
d fro
m b
udge
tPr
ofit
on d
ispos
al o
f ass
ets
(54,
000)
0(6
50,0
00)
00
(600
,000
)(6
00,0
00)
00
0Lo
ss o
n di
spos
al o
f ass
ets
34,0
00
00
00
00
00
0M
ovem
ent i
n lia
bilit
ies a
ssoc
iate
d w
ith re
stric
ted
cash
115,
871
00
00
00
00
0De
prec
iatio
n an
d am
ortis
atio
n on
ass
ets
3,82
0,87
5
4,01
9,63
5
4,16
4,79
9
4,24
8,10
9
4,33
8,42
4
4,43
8,26
7
4,55
5,19
6
3,56
2,33
7
3,68
8,52
9
3,77
3,08
1
Amou
nt a
ttrib
utab
le to
ope
ratin
g ac
tiviti
es(6
,534
,932
)(5
,774
,450
)(5
,843
,198
)(5
,953
,079
)(6
,057
,691
)(6
,242
,262
)(6
,341
,327
)(6
,526
,389
)(6
,741
,332
)(6
,900
,927
)
INVE
STIN
G AC
TIVI
TIES
Non-
oper
atin
g gr
ants
, sub
sidie
s and
cont
ribut
ions
4,41
1,10
3
5,80
0,82
2
3,31
5,24
2
1,23
6,52
8
1,15
1,53
1
2,95
9,18
2
3,91
6,91
0
1,17
4,71
5
1,49
0,59
1
1,19
8,55
3
Proc
eeds
from
disp
osal
of a
sset
s14
7,00
0
11
7,50
0
73
0,00
0
10
5,00
0
17
2,00
0
80
3,50
0
66
6,00
0
16
3,00
0
94
,500
72
,000
Pr
ocee
ds fr
om se
lf su
ppor
ting
loan
s22
,872
23
,729
22
,474
21
,061
21
,756
22
,473
23
,214
23
,979
24
,769
25
,586
Pu
rcha
se o
f pro
pert
y, p
lant
and
equ
ipm
ent
(5,3
52,6
50)
(3,9
66,1
00)
(1,4
15,9
50)
(1,8
20,2
70)
(1,1
07,5
12)
(3,6
69,6
88)
(5,6
26,6
43)
(1,7
66,9
10)
(1,5
14,9
24)
(959
,600
)Pu
rcha
se a
nd co
nstr
uctio
n of
infra
stru
ctur
e(3
,620
,551
)(3
,698
,864
)(3
,878
,954
)(1
,908
,757
)(2
,799
,002
)(1
,917
,142
)(2
,389
,891
)(1
,962
,981
)(2
,668
,899
)(2
,135
,608
)Am
ount
attr
ibut
able
to in
vest
ing
activ
ities
(4,3
92,2
26)
(1,7
22,9
13)
(1,2
27,1
88)
(2,3
66,4
37)
(2,5
61,2
27)
(1,8
01,6
74)
(3,4
10,4
11)
(2,3
68,1
97)
(2,5
73,9
62)
(1,7
99,0
69)
FINA
NCIN
G AC
TIVI
TIES
Repa
ymen
t of d
eben
ture
s(2
72,5
05)
(316
,301
)(3
24,6
23)
(370
,075
)(4
10,4
74)
(366
,544
)(4
18,1
86)
(458
,090
)(4
31,4
15)
(396
,171
)Re
paym
ent o
f lon
g te
rm le
ases
(102
,490
)(8
3,88
9)(1
9,97
2)(1
0,29
5)0
00
00
0Pr
ocee
ds fr
om n
ew d
eben
ture
s2,
279,
225
0
01,
000,
000
0
01,
500,
000
38
0,00
0
0
0Tr
ansf
ers t
o re
serv
es (r
estr
icted
ass
ets)
(731
,612
)(7
58,4
77)
(757
,008
)(7
57,4
35)
(769
,701
)(8
75,0
33)
(799
,626
)(8
30,7
35)
(826
,802
)(9
94,0
26)
Tran
sfer
s fro
m re
serv
es (r
estr
icted
ass
ets)
1,14
6,91
4
1,32
0,72
3
543,
779
534,
503
1,55
9,69
2
716,
875
558,
509
536,
280
936,
052
67,6
00
Amou
nt a
ttrib
utab
le to
fina
ncin
g ac
tiviti
es2,
319,
532
162,
056
(557
,824
)39
6,69
837
9,51
7(5
24,7
02)
840,
697
(372
,545
)(3
22,1
65)
(1,3
22,5
96)
Surp
lus(
defic
ienc
y) b
efor
e ge
nera
l rat
es(7
,053
,662
)(7
,335
,308
)(7
,628
,210
)(7
,922
,819
)(8
,239
,401
)(8
,568
,639
)(8
,911
,041
)(9
,267
,131
)(9
,637
,459
)(1
0,02
2,59
2)TO
TAL A
MOU
NT R
AISE
D FR
OM R
ATES
7,05
3,66
2
7,33
5,30
8
7,62
8,21
0
7,92
2,81
8
8,23
9,40
0
8,56
8,63
9
8,91
1,04
1
9,26
7,13
1
9,63
7,45
9
10,0
22,5
92
Net c
urre
nt a
sset
s c/f
wd
- sur
plus
/(de
ficit)
00
00
00
00
00
SHIR
E OF
DEN
MAR
K - L
ONG
TERM
FIN
ANCI
AL P
LAN
FORE
CAST
RAT
E SE
TTIN
G ST
ATEM
ENT
FOR
THE
PERI
OD 2
021/
22 -
2030
/31
28 | Long Term Financial Plan 2021/22 - 2030/31
Statement of
Financial Position1
23
45
67
89
10FY
21/2
2 FY
22/2
3FY
23/2
4FY
24/2
5FY
25/2
6FY
26/2
7FY
27/2
8FY
28/2
9FY
29/3
0FY
30/3
1$
$$
$$
$$
$$
$CU
RREN
T AS
SETS
Cash
and
cash
equ
ival
ents
805,
164
70
1,58
4
701,
584
70
1,58
4
701,
583
70
1,58
3
701,
583
70
1,58
4
701,
584
70
1,58
3
Rest
ricte
d ca
sh -
Rese
rves
4,23
8,35
4
3,
676,
108
3,88
9,33
7
4,
112,
269
3,32
2,27
8
3,
480,
436
3,72
1,55
3
4,
016,
008
3,90
6,75
8
4,
833,
184
Rest
ricte
d ca
sh -
Bond
s & D
epos
its H
eld
937,
720
93
7,72
0
937,
720
93
7,72
0
937,
720
93
7,72
0
937,
720
93
7,72
0
937,
720
93
7,72
0
Trad
e an
d ot
her r
ecei
vabl
es1,
738,
345
1,71
4,61
6
1,
692,
142
1,67
1,08
1
1,
649,
326
1,63
0,83
8
1,
607,
624
1,58
3,64
5
1,
558,
876
1,53
3,29
0
In
vent
orie
s13
6,87
7
136,
877
13
6,87
7
136,
877
13
6,87
7
136,
877
13
6,87
7
136,
877
13
6,87
7
136,
877
TO
TAL C
URRE
NT A
SSET
S7,
856,
459
7,16
6,90
5
7,
357,
660
7,55
9,53
1
6,
747,
784
6,88
7,45
4
7,
105,
357
7,37
5,83
4
7,
241,
814
8,14
2,65
4
NON-
CURR
ENT
ASSE
TSOt
her r
ecei
vabl
es55
4,90
0
554,
900
57
4,87
2
585,
167
58
5,16
7
585,
167
58
5,16
7
585,
167
58
5,16
7
585,
167
Ri
ght o
f Use
Ass
ets
114,
158
30
,267
10
,295
0
0
0
0
0
0
0
Inve
stm
ents
53,5
16
53,5
16
53,5
16
53,5
16
53,5
16
53,5
16
53,5
16
53,5
16
53,5
16
53,5
16
Prop
erty
, pla
nt a
nd e
quip
men
t33
,223
,808
35
,300
,180
34
,771
,536
34
,582
,339
33
,542
,449
34
,964
,699
38
,383
,231
38
,860
,260
39
,046
,889
38
,644
,689
In
frast
ruct
ure
64,3
78,1
49
65,8
29,6
06
67,4
08,3
55
66,9
73,4
69
67,4
09,4
49
66,9
32,2
62
66,9
09,0
68
66,4
36,5
94
66,6
50,7
59
66,3
03,0
86
TOTA
L NON
-CUR
RENT
ASS
ETS
98,3
24,5
30
101,
768,
469
10
2,81
8,57
4
102,
194,
492
10
1,59
0,58
2
102,
535,
644
10
5,93
0,98
3
105,
935,
537
10
6,33
6,33
1
105,
586,
458
TOTA
L ASS
ETS
106,
180,
990
10
8,93
5,37
4
110,
176,
234
10
9,75
4,02
3
108,
338,
366
10
9,42
3,09
9
113,
036,
340
11
3,31
1,37
1
113,
578,
145
11
3,72
9,11
2
CURR
ENT
LIABI
LITIE
STr
ade
and
othe
r pay
able
s(3
,494
,795
)(3
,307
,328
)(3
,307
,328
)(3
,307
,328
)(3
,307
,328
)(3
,307
,328
)(3
,307
,328
)(3
,307
,328
)(3
,307
,328
)(3
,307
,328
)Cu
rren
t por
tion
of lo
ng te
rm b
orro
win
gs(2
72,5
05)
(316
,301
)(3
24,6
23)
(370
,075
)(4
10,4
74)
(366
,544
)(4
18,1
86)
(458
,090
)(4
31,4
15)
(396
,171
)Cu
rren
t por
tion
of le
ases
(83,
889)
(19,
972)
(10,
295)
00
00
00
0Pr
ovisi
ons
(1,2
28,5
32)
(1,2
28,5
32)
(1,2
28,5
32)
(1,2
28,5
32)
(1,2
28,5
32)
(1,2
28,5
32)
(1,2
28,5
32)
(1,2
28,5
32)
(1,2
28,5
32)
(1,2
28,5
32)
TOTA
L CUR
RENT
LIAB
ILITI
ES(5
,079
,721
)(4
,872
,133
)(4
,870
,778
)(4
,905
,935
)(4
,946
,334
)(4
,902
,404
)(4
,954
,046
)(4
,993
,950
)(4
,967
,275
)(4
,932
,031
)
NON-
CURR
ENT
LIABI
LITIE
SPa
yabl
es(4
30,2
38)
(430
,238
)(4
30,2
38)
(430
,238
)(4
30,2
38)
(430
,238
)(4
30,2
38)
(430
,238
)(4
30,2
38)
(430
,238
)Lo
ng te
rm b
orro
win
gs(3
,600
,483
)(3
,240
,385
)(2
,907
,440
)(3
,491
,913
)(3
,041
,040
)(2
,718
,426
)(3
,748
,598
)(3
,630
,604
)(3
,225
,865
)(2
,864
,938
)No
n cu
rren
t por
tion
of le
ases
(30,
269)
(10,
295)
(0)
(0)
(0)
(0)
(0)
(0)
(0)
(0)
Prov
ision
s(1
27,7
71)
(127
,771
)(1
27,7
71)
(127
,771
)(1
27,7
71)
(127
,771
)(1
27,7
71)
(127
,771
)(1
27,7
71)
(127
,771
)TO
TAL N
ON-C
URRE
NT LI
ABILI
TIES
(4,1
88,7
61)
(3,8
08,6
90)
(3,4
65,4
50)
(4,0
49,9
23)
(3,5
99,0
50)
(3,2
76,4
36)
(4,3
06,6
08)
(4,1
88,6
14)
(3,7
83,8
75)
(3,4
22,9
48)
TOTA
L LIA
BILIT
IES
(9,2
68,4
82)
(8,6
80,8
23)
(8,3
36,2
28)
(8,9
55,8
58)
(8,5
45,3
84)
(8,1
78,8
40)
(9,2
60,6
54)
(9,1
82,5
64)
(8,7
51,1
49)
(8,3
54,9
79)
NET
ASSE
TS96
,912
,508
10
0,25
4,55
2
101,
840,
007
10
0,79
8,16
5
99,7
92,9
83
101,
244,
259
10
3,77
5,68
7
104,
128,
807
10
4,82
6,99
7
105,
374,
134
EQUI
TYRe
tain
ed su
rplu
s27
,412
,670
31
,316
,960
32
,689
,186
31
,424
,413
31
,209
,221
32
,502
,339
34
,792
,650
34
,851
,316
35
,658
,755
35
,279
,466
Re
serv
es -
cash
bac
ked
4,23
8,35
5
3,
676,
108
3,88
9,33
7
4,
112,
269
3,32
2,27
8
3,
480,
436
3,72
1,55
3
4,
016,
008
3,90
6,75
8
4,
833,
184
Reva
luat
ion
surp
lus
65,2
61,4
84
65,2
61,4
84
65,2
61,4
84
65,2
61,4
84
65,2
61,4
84
65,2
61,4
84
65,2
61,4
84
65,2
61,4
84
65,2
61,4
84
65,2
61,4
84
TOTA
L EQU
ITY
96,9
12,5
08
100,
254,
552
10
1,84
0,00
7
100,
798,
165
99
,792
,983
10
1,24
4,25
9
103,
775,
687
10
4,12
8,80
7
104,
826,
997
10
5,37
4,13
4
SHIR
E OF
DEN
MAR
K - L
ONG
TERM
FIN
ANCI
AL P
LAN
FORE
CAST
STAT
EMEN
T OF
FINA
NCIA
L POS
ITIO
NFO
R TH
E PE
RIOD
202
1/22
- 20
30/3
1
29Long Term Financial Plan 2021/22 - 2030/31 |

Statement of
Changes in Equity1
23
45
67
89
10FY
21/2
2 FY
22/2
3FY
23/2
4FY
24/2
5FY
25/2
6FY
26/2
7FY
27/2
8FY
28/2
9FY
29/3
0FY
30/3
1$
$$
$$
$$
$$
$
RETA
INED
SUR
PLUS
Open
ing
Bala
nce
25,9
84,2
81
27,4
12,6
70
31
,316
,960
32,6
89,1
86
31
,424
,413
31
,209
,221
32,5
02,3
39
34
,792
,650
34,8
51,3
16
35
,658
,755
Net R
esul
t1,
013,
087
3,34
2,04
4
1,58
5,45
5(1
,041
,841
)(1
,005
,183
)1,
451,
277
2,53
1,42
735
3,12
169
8,18
954
7,13
7Am
ount
tran
sfer
red
(to)/
from
Res
erve
s41
5,30
2
562,
246
(213
,229
)(2
22,9
32)
789,
991
(158
,158
)(2
41,1
17)
(294
,455
)10
9,25
0(9
26,4
26)
Clos
ing
Bala
nce
27,4
12,6
70
31
,316
,960
32
,689
,186
31
,424
,413
31
,209
,221
32,5
02,3
39
34,7
92,6
50
34,8
51,3
16
35,6
58,7
55
35,2
79,4
66
RESE
RVES
- CA
SH/I
NVES
TMEN
T BA
CKED
Open
ing
Bala
nce
4,65
3,65
6
4,
238,
354
3,
676,
108
3,
889,
337
4,
112,
269
3,32
2,27
8
3,48
0,43
6
3,72
1,55
3
4,01
6,00
8
3,90
6,75
8
Amou
nt tr
ansf
erre
d (to
)/fro
m R
etai
ned
Surp
lus
(415
,302
)(5
62,2
46)
213,
229
222,
932
(789
,991
)15
8,15
824
1,11
729
4,45
5(1
09,2
50)
926,
426
Clos
ing
Bala
nce
4,23
8,35
5
3,67
6,10
8
3,
889,
337
4,11
2,26
9
3,
322,
278
3,
480,
436
3,72
1,55
3
4,
016,
008
3,90
6,75
8
4,
833,
184
REVA
LUAT
ION
SURP
LUS
Open
ing
Bala
nce
65,2
61,4
84
65,2
61,4
84
65
,261
,484
65,2
61,4
84
65
,261
,484
65
,261
,484
65,2
61,4
84
65
,261
,484
65,2
61,4
84
65
,261
,484
Tota
l Oth
er C
ompr
ehen
sive
Inco
me
-
-
-
-
-
-
-
-
-
-
Clos
ing
Bala
nce
65,2
61,4
84
65
,261
,484
65
,261
,484
65
,261
,484
65
,261
,484
65,2
61,4
84
65,2
61,4
84
65,2
61,4
84
65,2
61,4
84
65,2
61,4
84
TOTA
L EQU
ITY
96,9
12,5
08
10
0,25
4,55
2
10
1,84
0,00
7
10
0,79
8,16
6
99
,792
,983
101,
244,
259
103,
775,
687
104,
128,
808
104,
826,
997
105,
374,
133
SHIR
E OF
DEN
MAR
K - L
ONG
TERM
FINA
NCIA
L PLA
NFO
RECA
ST S
TATE
MEN
T OF
CHA
NGES
IN E
QUIT
YFO
R TH
E PE
RIOD
202
1/22
- 20
30/3
1
30 | Long Term Financial Plan 2021/22 - 2030/31

Statement of
Operational Funding1
23
45
67
89
10FY
21/2
2 FY
22/2
3FY
23/2
4FY
24/2
5FY
25/2
6FY
26/2
7FY
27/2
8FY
28/2
9FY
29/3
0FY
30/3
1TO
TAL
$$
$$
$$
$$
$$
$Fu
ndin
g fro
m O
pera
tiona
l Act
iviti
esRe
venu
eRa
tes
7,05
3,66
3
7,33
5,30
8
7,62
8,21
0
7,92
2,81
8
8,23
9,40
0
8,56
8,63
9
8,91
1,04
1
9,26
7,13
1
9,63
7,45
9
10,0
22,5
92
84
,586
,261
Oper
atin
g gr
ants
, sub
sidie
s and
cont
ribut
ions
3,28
9,28
8
2,22
2,29
2
2,25
9,47
7
2,29
7,29
6
2,33
5,76
2
2,37
4,88
6
2,41
4,67
8
2,45
5,15
0
2,49
6,31
5
2,53
8,18
5
24,6
83,3
29
Pr
ofit
on a
sset
disp
osal
54,0
00
-
650,
000
-
-
600,
000
600,
000
-
-
-
1,90
4,00
0
Fees
and
char
ges
3,45
8,31
2
3,56
2,06
1
3,66
8,92
3
3,77
8,99
1
3,89
2,36
1
3,97
0,20
8
4,04
9,61
2
4,13
0,60
4
4,21
3,21
6
4,29
7,48
1
39,0
21,7
69
In
tere
st e
arni
ngs
72,9
08
72,2
09
71,7
81
71,6
17
72,1
49
72,6
92
73,2
46
73,7
11
74,1
85
74,6
69
729,
167
Othe
r rev
enue
188,
487
192,
257
196,
102
200,
024
204,
024
208,
105
212,
267
216,
512
220,
843
225,
259
2,06
3,88
0
14,1
16,6
58
13
,384
,126
14,4
74,4
92
14
,270
,746
14,7
43,6
97
15
,794
,530
16,2
60,8
43
16
,143
,109
16,6
42,0
18
17
,158
,186
152,
988,
406
Ex
pens
esEm
ploy
ee co
sts
(6,9
39,9
43)
(6,7
38,0
75)
(6,9
06,5
26)
(7,0
79,1
90)
(7,2
56,1
69)
(7,4
37,5
73)
(7,6
23,5
13)
(7,8
14,1
01)
(8,0
09,4
53)
(8,2
09,6
89)
(74,
014,
232)
Mat
eria
ls an
d co
ntra
cts
(5,5
02,0
14)
(3,8
49,3
63)
(3,8
91,4
90)
(3,9
63,3
79)
(4,0
31,1
50)
(4,1
49,3
76)
(4,1
56,1
39)
(4,2
43,2
99)
(4,3
81,5
47)
(4,4
64,0
79)
(42,
631,
836)
Utili
ty ch
arge
s(2
20,9
85)
(226
,510
)(2
32,1
72)
(237
,977
)(2
43,9
26)
(250
,024
)(2
56,2
75)
(262
,682
)(2
69,2
49)
(275
,980
)(2
,475
,779
)De
prec
iatio
n on
non
-cur
rent
ass
et(3
,820
,875
)(4
,019
,635
)(4
,164
,799
)(4
,248
,109
)(4
,338
,424
)(4
,438
,267
)(4
,555
,196
)(3
,562
,337
)(3
,688
,529
)(3
,773
,081
)(4
0,60
9,25
2)Lo
ss o
n as
set d
ispos
al(3
4,00
0)0
00
00
00
00
(34,
000)
Inte
rest
exp
ense
(123
,877
)(1
26,1
28)
(112
,932
)(1
10,7
18)
(107
,392
)(9
3,99
5)(1
03,9
56)
(116
,740
)(1
05,5
61)
(91,
911)
(1,0
93,2
10)
Insu
ranc
e ex
pens
e(4
27,6
79)
(433
,440
)(4
42,1
09)
(450
,951
)(4
59,9
70)
(469
,169
)(4
78,5
53)
(488
,124
)(4
97,8
86)
(507
,844
)(4
,655
,723
)Ot
her e
xpen
ditu
re(4
45,3
00)
(449
,753
)(4
54,2
51)
(458
,793
)(4
63,3
81)
(468
,015
)(4
72,6
95)
(477
,422
)(4
82,1
96)
(487
,018
)(4
,658
,823
)(1
7,51
4,67
3)(1
5,84
2,90
4)(1
6,20
4,27
9)(1
6,54
9,11
6)(1
6,90
0,41
1)(1
7,30
6,42
0)(1
7,64
6,32
6)(1
6,96
4,70
4)(1
7,43
4,42
0)(1
7,80
9,60
2)(1
70,1
72,8
56)
(3,3
98,0
15)
(2,4
58,7
78)
(1,7
29,7
87)
(2,2
78,3
70)
(2,1
56,7
14)
(1,5
11,8
90)
(1,3
85,4
83)
(821
,594
)(7
92,4
02)
(651
,416
)(1
7,18
4,44
9)Fu
ndin
g Po
sitio
n Ad
just
men
tsDe
prec
iatio
n on
non
-cur
rent
ass
ets
3,82
0,87
5
4,01
9,63
5
4,16
4,79
9
4,24
8,10
9
4,33
8,42
4
4,43
8,26
7
4,55
5,19
6
3,56
2,33
7
3,68
8,52
9
3,77
3,08
1
40,6
09,2
52
Ne
t pro
fit a
nd lo
sses
on
disp
osal
(20,
000)
0(6
50,0
00)
00
(600
,000
)(6
00,0
00)
00
0(1
,870
,000
)M
ovem
ent i
n pr
ovisi
ons
115,
871
00
00
00
00
011
5,87
1
Ne
t Fun
ding
from
Ope
ratio
nal A
ctiv
ities
3,91
6,74
6
4,
019,
635
3,51
4,79
9
4,
248,
109
4,33
8,42
4
3,
838,
267
3,95
5,19
6
3,
562,
337
3,68
8,52
9
3,
773,
081
38,8
55,1
23
51
8,73
0
1,56
0,85
8
1,
785,
012
1,96
9,73
9
2,
181,
710
2,32
6,37
7
2,
569,
713
2,74
0,74
2
2,
896,
127
3,12
1,66
5
Fu
ndin
g fro
m C
apita
l Act
iviti
esIn
flow
sPr
ocee
ds o
n di
spos
al14
7,00
0
11
7,50
0
73
0,00
0
10
5,00
0
17
2,00
0
80
3,50
0
66
6,00
0
16
3,00
0
94
,500
72
,000
3,
070,
500
No
n-op
erat
ing
gran
ts, s
ubsid
ies a
nd co
ntrib
utio
ns4,
411,
103
5,
800,
822
3,
315,
242
1,
236,
528
1,
151,
531
2,
959,
182
3,
916,
910
1,
174,
715
1,
490,
591
1,
198,
553
26
,655
,179
Outfl
ows
Proc
eeds
from
self
supp
ortin
g lo
ans
22,8
72
23,7
29
22,4
74
21,0
61
21,7
56
22,4
73
23,2
14
23,9
79
24,7
69
25,5
86
231,
912
Purc
hase
of p
rope
rty,
pla
nt a
nd e
quip
men
t(5
,352
,650
)(3
,966
,100
)(1
,415
,950
)(1
,820
,270
)(1
,107
,512
)(3
,669
,688
)(5
,626
,643
)(1
,766
,910
)(1
,514
,924
)(9
59,6
00)
(27,
200,
247)
Purc
hase
of i
nfra
stru
ctur
e(3
,620
,551
)(3
,698
,864
)(3
,878
,954
)(1
,908
,757
)(2
,799
,002
)(1
,917
,142
)(2
,389
,891
)(1
,962
,981
)(2
,668
,899
)(2
,135
,608
)(2
6,98
0,64
8)Ne
t Fun
ding
from
Cap
ital A
ctiv
ities
(4,3
92,2
26)
(1,7
22,9
13)
(1,2
27,1
88)
(2,3
66,4
37)
(2,5
61,2
27)
(1,8
01,6
74)
(3,4
10,4
11)
(2,3
68,1
97)
(2,5
73,9
62)
(1,7
99,0
69)
(24,
223,
305)
Fund
ing
from
Fina
ncin
g Ac
itivi
tes
Inflo
ws
Tran
sfer
from
rese
rves
1,14
6,91
4
1,32
0,72
3
543,
779
534,
503
1,55
9,69
2
716,
875
558,
509
536,
280
936,
052
67,6
00
7,92
0,92
7
Ne
w B
orro
win
gs2,
279,
225
-
-
1,
000,
000
-
-
1,
500,
000
38
0,00
0
-
-
5,
159,
225
Outfl
ows
Tran
sfer
s to
rese
rves
(731
,612
)(7
58,4
77)
(757
,008
)(7
57,4
35)
(769
,701
)(8
75,0
33)
(799
,626
)(8
30,7
35)
(826
,802
)(9
94,0
26)
(8,1
00,4
54)
Repa
ymen
t of p
ast b
orro
win
gs(2
72,5
05)
(316
,301
)(3
24,6
23)
(370
,075
)(4
10,4
74)
(366
,544
)(4
18,1
86)
(458
,090
)(4
31,4
15)
(396
,171
)(3
,764
,383
)Re
paym
ent o
f lon
g te
rm le
ases
(102
,490
)(8
3,88
9)(1
9,97
2)(1
0,29
5)0
00
00
0(2
16,6
46)
Net F
undi
ng fr
om Fi
nanc
ing
Activ
ities
2,31
9,53
216
2,05
6(5
57,8
24)
396,
698
379,
517
(524
,702
)84
0,69
7(3
72,5
45)
(322
,165
)(1
,322
,596
)99
8,66
8
Estim
ated
Sur
plus
/Def
icit J
uly
1 B/
Fwd
1,55
3,96
4
0
0
0
0
0
0
0
0
0
Fu
ndin
g Av
aila
ble
/ (to
be
sour
ced)
0
0
0
0
0
0
0
0
0
0
SHIR
E OF
DEN
MAR
K - L
ONG
TERM
FINA
NCIA
L PLA
NFO
RECA
ST S
TATE
MEN
T OF
OPE
RATI
ONAL
FUND
ING
FOR
THE
PERI
OD 2
021/
22 -
2030
/31
31Long Term Financial Plan 2021/22 - 2030/31 |

Statement of
Capital Funding1
23
45
67
89
10FY
21/2
2 FY
22/2
3FY
23/2
4FY
24/2
5FY
25/2
6FY
26/2
7FY
27/2
8FY
28/2
9FY
29/3
0FY
30/3
1TO
TAL
$$
$$
$$
$$
$$
$Ca
pita
l Exp
endi
ture
Road
s2,
715,
687
1,33
2,55
3
1,85
3,18
3
1,27
8,30
6
1,40
1,87
7
1,41
4,43
1
1,87
7,12
6
1,43
9,96
0
1,55
1,78
5
1,56
3,72
8
16,4
28,6
35
Foot
path
s10
0,00
0
1,15
9,18
1
150,
000
15
0,00
0
168,
294
17
2,30
3
175,
749
17
9,26
4
182,
123
18
5,37
3
2,62
2,28
7
Dr
aina
ge-
53,0
60
54
,122
55,2
04
56
,308
57,4
34
58
,583
59,7
55
60
,708
61,7
91
51
6,96
5
Ot
her I
nfra
stru
ctur
e80
4,86
4
1,15
4,07
0
1,82
1,64
9
425,
247
1,
172,
523
27
2,97
4
278,
433
28
4,00
2
874,
283
32
4,71
6
7,41
2,76
1
Bu
ildin
gs4,
240,
000
3,05
0,00
0
1,00
3,95
0
1,05
0,00
0
300,
000
2,
719,
313
5,
145,
343
51
7,63
0
900,
000
60
0,00
0
19,5
26,2
36
Furn
iture
and
Equ
ipm
ent
40,0
00
35
0,00
0
100,
000
50
,000
50,0
00
50
,000
50,0
00
50
,000
100,
000
10
0,00
0
940,
000
Plan
t and
Equ
ipm
ent
1,07
2,65
0
56
6,10
0
312,
000
72
0,27
0
757,
512
90
0,37
5
431,
300
1,
199,
280
51
4,92
4
259,
600
6,
734,
011
Tota
l - C
apita
l Exp
endi
ture
8,97
3,20
1
7,
664,
964
5,
294,
904
3,
729,
027
3,
906,
514
5,
586,
830
8,
016,
534
3,
729,
891
4,
183,
823
3,
095,
208
54
,180
,895
Fund
ed b
y:
Capi
tal G
rant
s and
Con
trib
utio
nsRo
ads
1,68
8,45
1
1,
050,
822
1,
515,
242
1,
136,
528
1,
151,
531
1,
159,
182
1,
616,
910
1,
174,
715
1,
190,
591
1,
198,
553
12
,882
,527
Fo
otpa
ths
100,
000
75
0,00
0
-
-
-
-
-
-
-
-
850,
000
Drai
nage
-
-
-
-
-
-
-
-
-
-
-
Othe
r Inf
rast
ruct
ure
401,
877
1,
000,
000
1,
300,
000
10
0,00
0
-
-
-
-
-
-
2,80
1,87
7
Bu
ildin
gs2,
220,
775
3,00
0,00
0
500,
000
-
-
1,
800,
000
2,
300,
000
-
300,
000
-
10,1
20,7
75
Furn
iture
and
Equ
ipm
ent
-
-
-
-
-
-
-
-
-
-
-
Plan
t and
Equ
ipm
ent
-
-
-
-
-
-
-
-
-
-
-
Tota
l - C
apita
l Gra
nts a
nd C
ontr
ibut
ions
4,41
1,10
3
5,
800,
822
3,
315,
242
1,
236,
528
1,
151,
531
2,
959,
182
3,
916,
910
1,
174,
715
1,
490,
591
1,
198,
553
26
,655
,179
-
Ow
n So
urce
Fund
ing
-
Land
-
-
-
-
-
-
-
-
-
-
-
Road
s47
7,23
6
181,
731
33
7,94
1
141,
777
25
0,34
6
255,
248
26
0,21
6
265,
245
36
1,19
4
365,
175
2,
896,
109
Foot
path
s-
57,9
04
11
6,22
1
143,
310
74
,114
172,
303
62
,540
179,
264
96
,495
185,
373
1,
087,
524
Drai
nage
-
53
,060
54,1
22
55
,204
56,3
08
57
,434
58,5
83
59
,755
60,7
08
61
,791
516,
965
Othe
r Inf
rast
ruct
ure
309,
845
21
,224
301,
649
32
5,24
7
172,
523
27
2,97
4
278,
433
28
4,00
2
324,
283
32
4,71
6
2,61
4,89
6
Bu
ildin
gs20
0,00
0
-
26
6,05
0-
50
,000
300,
000
17
9,31
3
545,
343
51
7,63
0
600,
000
60
0,00
0
2,72
6,23
6
Fu
rnitu
re a
nd E
quip
men
t-
50,0
00
10
0,00
0
50,0
00
50
,000
50,0
00
50
,000
50,0
00
10
0,00
0
100,
000
60
0,00
0
Pl
ant a
nd E
quip
men
t15
0,00
0
150,
000
15
0,00
0
150,
000
15
0,00
0
150,
000
15
0,00
0
150,
000
15
0,00
0
150,
000
1,
500,
000
Tota
l - O
wn
Sour
ce Fu
ndin
g1,
137,
081
513,
919
79
3,88
3
915,
538
1,
053,
291
1,
137,
272
1,
405,
115
1,
505,
896
1,
692,
680
1,
787,
055
11
,941
,730
-
Bo
rrow
ings
-
Build
ings
1,76
9,22
5
-
-
1,
000,
000
-
-
1,
500,
000
-
-
-
4,26
9,22
5
Pl
ant a
nd E
quip
men
t51
0,00
0
-
-
-
-
-
-
380,
000
-
-
89
0,00
0
To
tal -
Bor
row
ings
2,27
9,22
5
-
-
1,
000,
000
-
-
1,
500,
000
38
0,00
0
-
-
5,15
9,22
5
-
Re
serv
es-
Ro
ads
550,
000
10
0,00
0
-
-
-
-
-
-
-
-
650,
000
Foot
path
s-
351,
277
33
,779
6,69
0
94,1
80
-
113,
209
-
85,6
28
-
684,
763
Drai
nage
-
-
-
-
-
-
-
-
-
-
-
Othe
r Inf
rast
ruct
ure
93,1
42
13
2,84
6
220,
000
-
1,00
0,00
0
-
-
-
55
0,00
0
-
1,
995,
988
Build
ings
50,0
00
50
,000
120,
000
-
-
14
0,00
0
200,
000
-
-
-
560,
000
Furn
iture
and
Equ
ipm
ent
40,0
00
30
0,00
0
-
-
-
-
-
-
-
-
340,
000
Plan
t and
Equ
ipm
ent
265,
650
29
8,60
0
82,0
00
46
5,27
0
435,
512
54
6,87
5
215,
300
50
6,28
0
270,
424
37
,600
3,12
3,51
1
To
tal -
Res
erve
s99
8,79
2
1,23
2,72
3
455,
779
47
1,96
0
1,52
9,69
2
686,
875
52
8,50
9
506,
280
90
6,05
2
37,6
00
7,
354,
262
-
Othe
r (Di
spos
als a
nd C
/Fw
d)-
La
nd-
-
-
-
-
-
-
-
-
-
-
Bu
ildin
gs-
-
65
0,00
0
-
-
600,
000
60
0,00
0
-
-
-
1,
850,
000
Plan
t and
Equ
ipm
ent
147,
000
11
7,50
0
80,0
00
10
5,00
0
172,
000
20
3,50
0
66,0
00
16
3,00
0
94,5
00
72
,000
1,22
0,50
0
To
tal -
Oth
er (D
ispos
als a
nd C
/Fw
d)14
7,00
0
117,
500
73
0,00
0
105,
000
17
2,00
0
803,
500
66
6,00
0
163,
000
94
,500
72,0
00
3,
070,
500
-
Tota
l Cap
ital F
undi
ng8,
973,
201
7,66
4,96
4
5,29
4,90
4
3,72
9,02
7
3,90
6,51
4
5,58
6,83
0
8,01
6,53
4
3,72
9,89
1
4,18
3,82
3
3,09
5,20
8
54,1
80,8
95
SHIR
E OF
DEN
MAR
K - L
ONG
TERM
FINA
NCIA
L PLA
NFO
RECA
ST ST
ATEM
ENT
OF C
APIT
AL FU
NDIN
GFO
R TH
E PE
RIOD
202
1/22
- 20
30/3
1
32 | Long Term Financial Plan 2021/22 - 2030/31

Appendix
i. Reserves Table1
23
45
67
89
10FY
21/2
2 FY
22/2
3FY
23/2
4FY
24/2
5FY
25/2
6FY
26/2
7FY
27/2
8FY
28/2
9FY
29/3
0FY
30/3
1$
$$
$$
$$
$$
$Em
ploy
ee E
ntitl
emen
ts R
eser
veOp
enin
g Ba
lanc
e44
8,41
044
9,30
745
0,20
645
1,10
645
2,00
845
4,26
845
8,81
146
5,69
347
4,07
648
3,54
8In
tere
st89
789
990
090
22,
260
4,54
36,
882
8,38
29,
472
14,4
92Tr
ansf
er to
0
00
00
00
00
0Tr
ansf
er fr
om0
00
00
00
00
0Cl
osin
g Ba
lanc
e44
9,30
745
0,20
645
1,10
645
2,00
845
4,26
845
8,81
146
5,69
347
4,07
648
3,54
849
8,04
0
Plan
t Res
erve
Open
ing
Bala
nce
586,
098
646,
620
674,
313
918,
661
780,
229
673,
618
458,
479
575,
056
404,
127
466,
778
Inte
rest
1,17
21,
293
1,34
91,
837
3,90
16,
736
6,87
710
,351
8,07
413
,989
Tran
sfer
to
325,
000
325,
000
325,
000
325,
000
325,
000
325,
000
325,
000
325,
000
325,
000
325,
000
Tran
sfer
from
(265
,650
)(2
98,6
00)
(82,
000)
(465
,270
)(4
35,5
12)
(546
,875
)(2
15,3
00)
(506
,280
)(2
70,4
24)
(37,
600)
Clos
ing
Bala
nce
646,
620
674,
313
918,
661
780,
229
673,
618
458,
479
575,
056
404,
127
466,
778
768,
167
Parr
y In
let R
eser
veOp
enin
g Ba
lanc
e19
8,44
819
4,84
520
5,23
521
5,64
522
6,07
723
7,20
724
9,57
926
3,32
327
8,06
329
3,61
8In
tere
st39
739
041
043
11,
130
2,37
23,
744
4,74
05,
556
8,80
0Tr
ansf
er to
10
,000
10,0
0010
,000
10,0
0010
,000
10,0
0010
,000
10,0
0010
,000
10,0
00Tr
ansf
er fr
om(1
4,00
0)0
00
00
00
00
Clos
ing
Bala
nce
194,
845
205,
235
215,
645
226,
077
237,
207
249,
579
263,
323
278,
063
293,
618
312,
418
Cem
eter
y Re
serv
eOp
enin
g Ba
lanc
e2,
118
00
00
00
00
0In
tere
st4
00
00
00
00
0Tr
ansf
er to
0
00
00
00
00
0Tr
ansf
er fr
om(2
,122
)0
00
00
00
00
Clos
ing
Bala
nce
00
00
00
00
00
Lime
Quar
ry R
ehab
ilita
tion
Rese
rve
Open
ing
Bala
nce
414,
700
385,
529
356,
300
327,
013
297,
667
269,
155
241,
847
215,
475
189,
353
163,
137
Inte
rest
829
771
713
654
1,48
82,
692
3,62
83,
879
3,78
34,
889
Tran
sfer
to
00
00
00
00
00
Tran
sfer
from
(30,
000)
(30,
000)
(30,
000)
(30,
000)
(30,
000)
(30,
000)
(30,
000)
(30,
000)
(30,
000)
(30,
000)
Clos
ing
Bala
nce
385,
529
356,
300
327,
013
297,
667
269,
155
241,
847
215,
475
189,
353
163,
137
138,
026
Infra
stru
ctur
e Re
serv
eOp
enin
g Ba
lanc
e70
9,77
879
4,40
431
1,87
088
,715
232,
202
289,
183
535,
606
380,
431
554,
123
629,
566
Inte
rest
1,42
01,
589
624
177
1,16
12,
892
8,03
46,
848
11,0
7118
,868
Tran
sfer
to
133,
206
150,
000
150,
000
150,
000
150,
000
243,
531
150,
000
166,
844
150,
000
282,
097
Tran
sfer
from
(50,
000)
(634
,123
)(3
73,7
79)
(6,6
90)
(94,
180)
0(3
13,2
09)
0(8
5,62
8)0
Clos
ing
Bala
nce
794,
404
311,
870
88,7
1523
2,20
228
9,18
353
5,60
638
0,43
155
4,12
362
9,56
693
0,53
1
Was
te S
ervi
ces R
eser
veOp
enin
g Ba
lanc
e62
1,62
870
5,05
457
6,46
474
7,61
791
9,11
293
,707
264,
644
438,
614
616,
509
498,
827
Inte
rest
1,42
61,
410
1,15
31,
495
4,59
693
73,
970
7,89
512
,318
14,9
50Tr
ansf
er to
17
0,00
017
0,00
017
0,00
017
0,00
017
0,00
017
0,00
017
0,00
017
0,00
017
0,00
017
0,00
0Tr
ansf
er fr
om(8
8,00
0)(3
00,0
00)
00
(1,0
00,0
00)
00
0(3
00,0
00)
0Cl
osin
g Ba
lanc
e70
5,05
457
6,46
474
7,61
791
9,11
293
,707
264,
644
438,
614
616,
509
498,
827
683,
777
SHIR
E OF
DEN
MAR
K - L
ONG
TERM
FINA
NCIA
L PLA
NFO
RECA
ST R
ESER
VES
MOV
EMEN
TFO
R TH
E PE
RIOD
202
1/22
- 20
30/3
1
33Long Term Financial Plan 2021/22 - 2030/31 |

Appendix
i. Reserves Table (cont.)1
23
45
67
89
10FY
21/2
2 FY
22/2
3FY
23/2
4FY
24/2
5FY
25/2
6FY
26/2
7FY
27/2
8FY
28/2
9FY
29/3
0FY
30/3
1$
$$
$$
$$
$$
$
SHIR
E OF
DEN
MAR
K - L
ONG
TERM
FINA
NCIA
L PLA
NFO
RECA
ST R
ESER
VES
MOV
EMEN
TFO
R TH
E PE
RIOD
202
1/22
- 20
30/3
1
Park
s and
Gar
dens
Res
erve
Open
ing
Bala
nce
78,9
850
00
00
00
00
Inte
rest
158
00
00
00
00
0Tr
ansf
er to
0
00
00
00
00
0Tr
ansf
er fr
om(7
9,14
2)0
00
00
00
00
Clos
ing
Bala
nce
00
00
00
00
00
Acqu
atic
Facil
ity D
evel
opm
ent R
eser
veOp
enin
g Ba
lanc
e96
,863
87,0
5797
,231
107,
425
117,
640
128,
229
139,
511
151,
603
164,
332
177,
616
Inte
rest
194
174
194
215
588
1,28
22,
093
2,72
93,
283
5,32
3Tr
ansf
er to
0
10,0
0010
,000
10,0
0010
,000
10,0
0010
,000
10,0
0010
,000
10,0
00Tr
ansf
er fr
om(1
0,00
0)0
00
00
00
00
Clos
ing
Bala
nce
87,0
5797
,231
107,
425
117,
640
128,
229
139,
511
151,
603
164,
332
177,
616
192,
939
Lions
ville
Res
erve
Open
ing
Bala
nce
205,
590
148,
001
90,2
9732
,478
00
00
00
Inte
rest
411
296
181
650
00
00
0Tr
ansf
er to
0
00
00
00
00
0Tr
ansf
er fr
om(5
8,00
0)(5
8,00
0)(5
8,00
0)(3
2,54
3)0
00
00
0Cl
osin
g Ba
lanc
e14
8,00
190
,297
32,4
780
00
00
00
Peac
eful
Bay
Res
erve
Open
ing
Bala
nce
209,
541
244,
960
280,
450
316,
011
351,
643
388,
401
427,
285
468,
694
512,
131
307,
363
Inte
rest
419
490
561
632
1,75
83,
884
6,40
98,
436
10,2
329,
212
Tran
sfer
to
35,0
0035
,000
35,0
0035
,000
35,0
0035
,000
35,0
0035
,000
35,0
0035
,000
Tran
sfer
from
00
00
00
00
(250
,000
)0
Clos
ing
Bala
nce
244,
960
280,
450
316,
011
351,
643
388,
401
427,
285
468,
694
512,
131
307,
363
351,
575
Rive
rmou
th C
arav
an P
ark
Rese
rve
Open
ing
Bala
nce
101,
213
106,
416
111,
629
116,
852
122,
086
127,
696
133,
973
140,
983
148,
520
156,
488
Inte
rest
202
213
223
234
610
1,27
72,
010
2,53
82,
967
4,69
0Tr
ansf
er to
5,
000
5,00
05,
000
5,00
05,
000
5,00
05,
000
5,00
05,
000
5,00
0Tr
ansf
er fr
om0
00
00
00
00
0Cl
osin
g Ba
lanc
e10
6,41
511
1,62
911
6,85
212
2,08
612
7,69
613
3,97
314
0,98
314
8,52
015
6,48
816
6,17
8
Peac
eful
Bay
Car
avan
Par
k Re
serv
eOp
enin
g Ba
lanc
e63
,244
68,3
7073
,506
78,6
5383
,811
89,2
3095
,122
101,
549
108,
377
115,
542
Inte
rest
126
137
147
157
419
892
1,42
71,
828
2,16
53,
463
Tran
sfer
to
5,00
05,
000
5,00
05,
000
5,00
05,
000
5,00
05,
000
5,00
05,
000
Tran
sfer
from
00
00
00
00
00
Clos
ing
Bala
nce
68,3
7073
,506
78,6
5383
,811
89,2
3095
,122
101,
549
108,
377
115,
542
124,
005
34 | Long Term Financial Plan 2021/22 - 2030/31

Appendix
i. Reserves Table (cont.)1
23
45
67
89
10FY
21/2
2 FY
22/2
3FY
23/2
4FY
24/2
5FY
25/2
6FY
26/2
7FY
27/2
8FY
28/2
9FY
29/3
0FY
30/3
1$
$$
$$
$$
$$
$
SHIR
E OF
DEN
MAR
K - L
ONG
TERM
FINA
NCIA
L PLA
NFO
RECA
ST R
ESER
VES
MOV
EMEN
TFO
R TH
E PE
RIOD
202
1/22
- 20
30/3
1
Recr
eatio
n Ce
ntre
Res
erve
Open
ing
Bala
nce
95,6
8410
5,87
511
6,08
712
6,31
913
6,57
214
7,25
518
,727
29,0
0839
,530
50,3
20In
tere
st19
121
223
225
368
31,
473
281
522
790
1,50
8Tr
ansf
er to
10
,000
10,0
0010
,000
10,0
0010
,000
10,0
0010
,000
10,0
0010
,000
10,0
00Tr
ansf
er fr
om0
00
00
(140
,000
)0
00
0Cl
osin
g Ba
lanc
e10
5,87
511
6,08
712
6,31
913
6,57
214
7,25
518
,727
29,0
0839
,530
50,3
2061
,828
Denm
ark
East
Dev
elop
men
t Res
erve
Open
ing
Bala
nce
721,
357
171,
717
172,
060
172,
060
172,
060
172,
060
172,
060
172,
060
172,
060
172,
060
Inte
rest
360
343
00
00
00
00
Tran
sfer
to
00
00
00
00
00
Tran
sfer
from
(550
,000
)0
00
00
00
00
Clos
ing
Bala
nce
171,
717
172,
060
172,
060
172,
060
172,
060
172,
060
172,
060
172,
060
172,
060
172,
060
Stra
tegi
c Res
erve
Open
ing
Bala
nce
100,
000
105,
200
110,
410
115,
631
120,
862
126,
467
132,
731
139,
722
147,
237
155,
179
Inte
rest
200
210
221
231
604
1,26
51,
991
2,51
52,
942
4,65
1Tr
ansf
er to
5,
000
5,00
05,
000
5,00
05,
000
5,00
05,
000
5,00
05,
000
5,00
0Tr
ansf
er fr
om0
00
00
00
00
0Cl
osin
g Ba
lanc
e10
5,20
011
0,41
011
5,63
112
0,86
212
6,46
713
2,73
113
9,72
214
7,23
715
5,17
916
4,83
0
ICT
Rese
rve
Open
ing
Bala
nce
015
,000
30,0
3045
,090
60,1
8075
,481
91,2
3610
7,60
412
4,54
114
2,03
0In
tere
st0
3060
9030
175
51,
369
1,93
72,
488
4,25
7Tr
ansf
er to
15
,000
15,0
0015
,000
15,0
0015
,000
15,0
0015
,000
15,0
0015
,000
15,0
00Tr
ansf
er fr
om0
00
00
00
00
0Cl
osin
g Ba
lanc
e15
,000
30,0
3045
,090
60,1
8075
,481
91,2
3610
7,60
412
4,54
114
2,03
016
1,28
6
Lega
l Con
tinge
ncy
Rese
rve
Open
ing
Bala
nce
010
,000
20,0
2030
,060
40,1
2050
,321
60,8
2471
,736
83,0
2894
,686
Inte
rest
020
4060
201
503
912
1,29
11,
659
2,83
8Tr
ansf
er to
10
,000
10,0
0010
,000
10,0
0010
,000
10,0
0010
,000
10,0
0010
,000
10,0
00Tr
ansf
er fr
om0
00
00
00
00
0Cl
osin
g Ba
lanc
e10
,000
20,0
2030
,060
40,1
2050
,321
60,8
2471
,736
83,0
2894
,686
107,
524
TOTA
L RES
ERVE
BAL
ANCE
4,23
8,35
43,
676,
108
3,88
9,33
74,
112,
269
3,32
2,27
83,
480,
436
3,72
1,55
34,
016,
008
3,90
6,75
84,
833,
184
SUM
MAR
YOp
enin
g Ba
lanc
e4,
653,
656
4,23
8,35
43,
676,
108
3,88
9,33
74,
112,
269
3,32
2,27
83,
480,
436
3,72
1,55
34,
016,
008
3,90
6,75
8In
tere
st8,
406
8,47
77,
008
7,43
519
,701
31,5
0249
,626
63,8
9176
,802
111,
929
Tran
sfer
to
723,
206
750,
000
750,
000
750,
000
750,
000
843,
531
750,
000
766,
844
750,
000
882,
097
Tran
sfer
from
(1,1
46,9
14)
(1,3
20,7
23)
(543
,779
)(5
34,5
03)
(1,5
59,6
92)
(716
,875
)(5
58,5
09)
(536
,280
)(9
36,0
52)
(67,
600)
Clos
ing
Bala
nce
4,23
8,35
43,
676,
108
3,88
9,33
74,
112,
269
3,32
2,27
83,
480,
436
3,72
1,55
34,
016,
008
3,90
6,75
84,
833,
184
35Long Term Financial Plan 2021/22 - 2030/31 |

P: (08) 9848 0300
953 South Coast Highway Denmark WA 6333
www.denmark.wa.gov.au
www.yourdenmark.wa.gov.au