long term financial plan - city of greater geraldton · city of greater geraldton long term...
TRANSCRIPT
City of Greater Geraldton Long Term Financial Plan 2017-2027 Page 1 of 21
2017 - 2027
Long Term Financial Plan
City of Greater Geraldton Long Term Financial Plan 2017-2027 Page 2 of 21
Contents Introduction ............................................................................................................................................ 3
2. Our Integrated Planning Framework .......................................................................................... 4
3. Key Statistics ............................................................................................................................... 5
4. Who We Are ................................................................................................................................ 5
Mullewa ............................................................................................................................................. 5
5. Our Services ................................................................................................................................ 6
6. Service Delivery ........................................................................................................................... 6
7. Asset Management ..................................................................................................................... 7
8. Financial Strategies and Principles .............................................................................................. 8
8.1 Rate increases ........................................................................................................................... 8
8.2 Budget surpluses ..................................................................................................................... 10
8.3 Cost recovery of services ........................................................................................................ 10
8.4 Prudent use of debt finance.................................................................................................... 11
8.5 Cash reserves .......................................................................................................................... 11
8.6 Land Development .................................................................................................................. 12
9. Workforce Planning Strategies ................................................................................................. 12
Modelling and Sensitivity Analysis ........................................................................................................ 12
Key Assumptions Underpinning the Long Term Financial Plan ............................................................ 13
Measuring Sustainability ....................................................................................................................... 16
Current Ratio ..................................................................................................................................... 16
Operating Surplus Ratio .................................................................................................................... 17
Rates Coverage Ratio ........................................................................................................................ 17
Debt Service Cover Ratio .................................................................................................................. 18
Asset Sustainability Ratio .................................................................................................................. 18
Asset Consumption Ratio .................................................................................................................. 19
Asset Renewal Funding Ratio ............................................................................................................ 19
Risk Assessment .................................................................................................................................... 20
Financial Projections ............................................................................................................................. 20
Conclusion - Implementation and Review of the LTFP ......................................................................... 21
City of Greater Geraldton Long Term Financial Plan 2017-2027 Page 3 of 21
Introduction The City of Greater Geraldton Long Term Financial Plan (LTFP) 2017-2027 is a high level
informing strategy that outlines the City’s approach to delivering infrastructure and services to
the community in a financially sustainable and affordable manner. It also demonstrates the
City’s commitment to managing its operations in a way that avoids unsustainable rate
increases for ratepayers. The Plan is aligned to other core planning documents by which the
City is accountable to the community including the Strategic Community Plan and the
Corporate Business Plan. Information contained in other strategic plans including the Asset
Management Plan and Workforce Plan have been used to informed the LTFP which forms the
basis for preparation of the Annual Budgets.
The LTFP is a dynamic tool which analyses financial trends over a ten-year period on a range
of assumptions and provides the City with information to assess resourcing requirements to
achieve its strategic objectives and to allow the City to ensure its future financial sustainability.
The LTFP covers the period 2017/18 to 2026/27. The City undertakes a broad review of its
Strategic Community Plan every two years and a full review is planned every four years (2016-
17). This LTFP will be reviewed every year and in conjunction with Corporate Business Plan
reviews. As Annual Budgets are developed from the LTFP, there may be some annual
variations between both, which will be explained in the Annual Budget process.
City of Greater Geraldton Long Term Financial Plan 2017-2027 Page 4 of 21
2. Our Integrated Planning Framework
In 2011, the Department of Local Government introduced the Integrated Planning and
Reporting Framework to encourage a movement towards best Practice strategic planning and
reporting standards across the Western Australian local government industry.
A significant component of the Framework is the development of a long-term financial plan to
inform the resourcing requirements and financial capacity of a local government to achieve its
stated objectives and priorities.
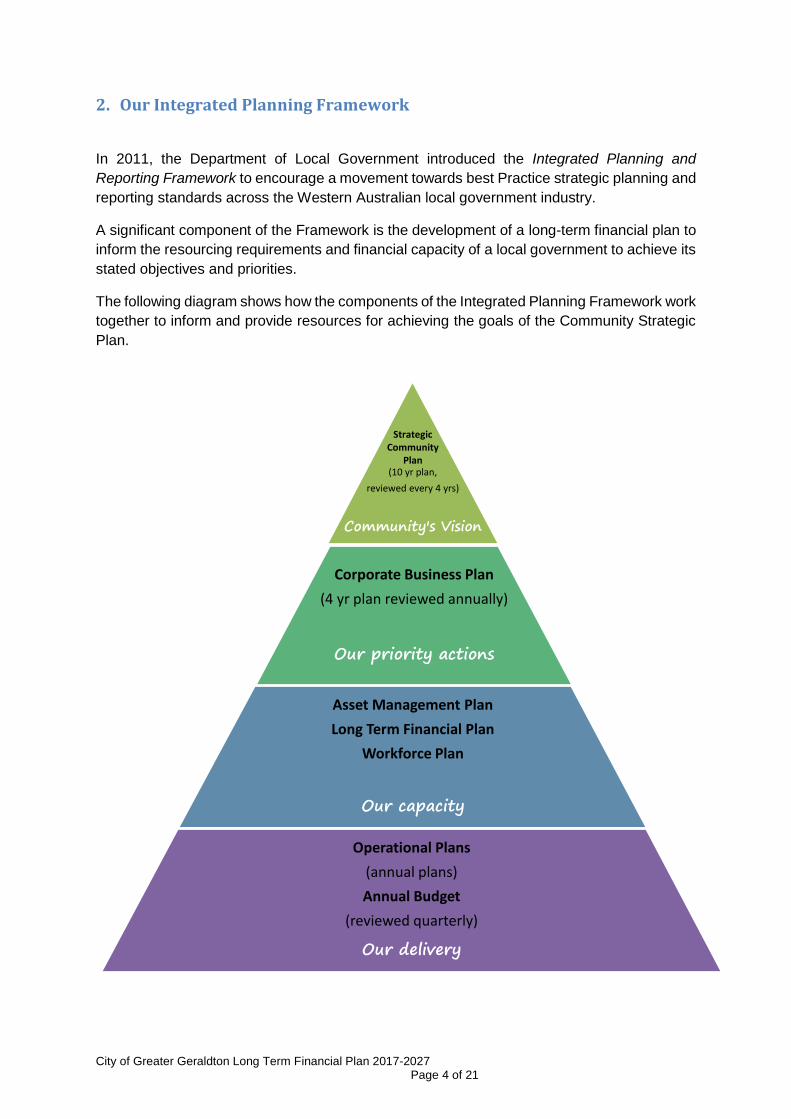
The following diagram shows how the components of the Integrated Planning Framework work
together to inform and provide resources for achieving the goals of the Community Strategic
Plan.
Strategic Community
Plan(10 yr plan,
reviewed every 4 yrs)
Community's Vision
Corporate Business Plan
(4 yr plan reviewed annually)
Our priority actions
Asset Management Plan
Long Term Financial Plan
Workforce Plan
Our capacity
Operational Plans
(annual plans)
Annual Budget
(reviewed quarterly)
Our delivery
City of Greater Geraldton Long Term Financial Plan 2017-2027 Page 5 of 21
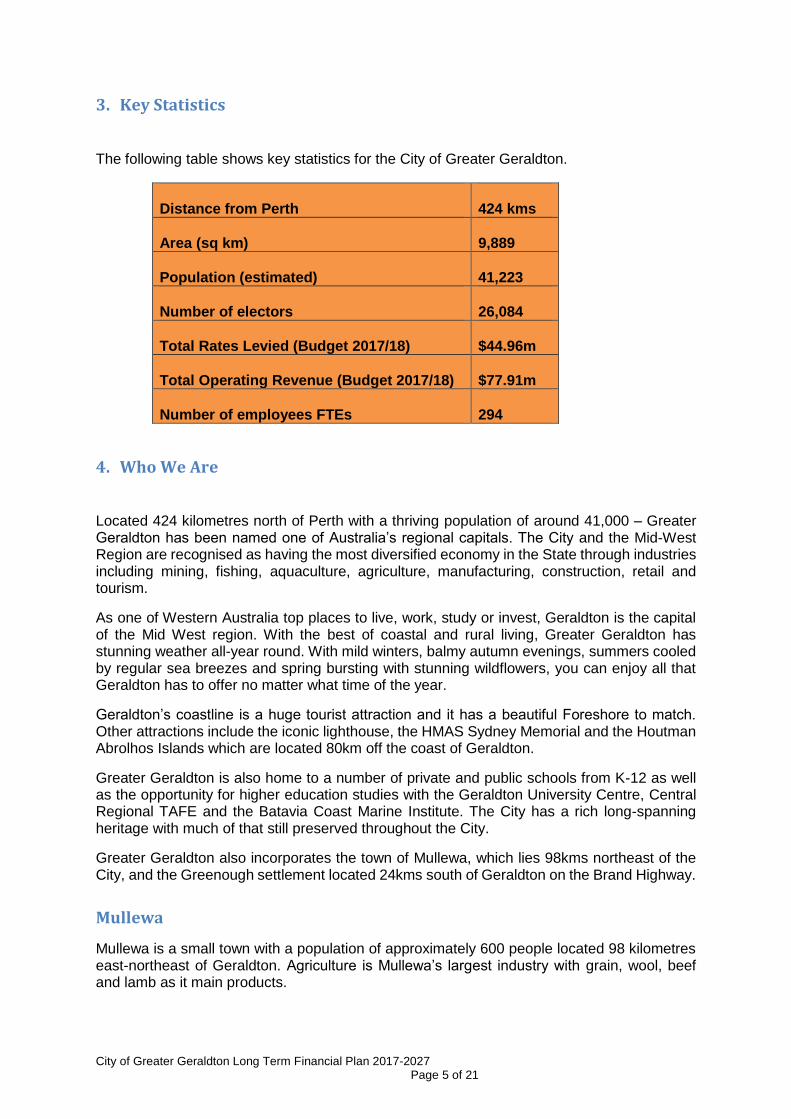
3. Key Statistics
The following table shows key statistics for the City of Greater Geraldton.
Distance from Perth
424 kms
Area (sq km)
9,889
Population (estimated)
41,223
Number of electors
26,084
Total Rates Levied (Budget 2017/18)
$44.96m
Total Operating Revenue (Budget 2017/18)
$77.91m
Number of employees FTEs
294
4. Who We Are
Located 424 kilometres north of Perth with a thriving population of around 41,000 – Greater Geraldton has been named one of Australia’s regional capitals. The City and the Mid-West Region are recognised as having the most diversified economy in the State through industries including mining, fishing, aquaculture, agriculture, manufacturing, construction, retail and tourism.
As one of Western Australia top places to live, work, study or invest, Geraldton is the capital of the Mid West region. With the best of coastal and rural living, Greater Geraldton has stunning weather all-year round. With mild winters, balmy autumn evenings, summers cooled by regular sea breezes and spring bursting with stunning wildflowers, you can enjoy all that Geraldton has to offer no matter what time of the year.
Geraldton’s coastline is a huge tourist attraction and it has a beautiful Foreshore to match. Other attractions include the iconic lighthouse, the HMAS Sydney Memorial and the Houtman Abrolhos Islands which are located 80km off the coast of Geraldton.
Greater Geraldton is also home to a number of private and public schools from K-12 as well as the opportunity for higher education studies with the Geraldton University Centre, Central Regional TAFE and the Batavia Coast Marine Institute. The City has a rich long-spanning heritage with much of that still preserved throughout the City.
Greater Geraldton also incorporates the town of Mullewa, which lies 98kms northeast of the City, and the Greenough settlement located 24kms south of Geraldton on the Brand Highway.
Mullewa
Mullewa is a small town with a population of approximately 600 people located 98 kilometres east-northeast of Geraldton. Agriculture is Mullewa’s largest industry with grain, wool, beef and lamb as it main products.
City of Greater Geraldton Long Term Financial Plan 2017-2027 Page 6 of 21
Mullewa is well known for an abundance of wildflowers in spring and is one of the few places in the world that the wreath flower grows. Mullewa boasts a number of religious buildings designed by the famous Western Australian architect-priest Monsignor John Hawes, including the Church of Our Lady of Mount Carmel and the Holy Apostles St Peter and St Paul and the Priest House (now known as the Monsignor Hawes Priest House Museum).
The Mullewa District comes alive in late winter and spring each year, when dramatic displays of wildflowers brighten the bushland and road verges. Amongst the many varieties of wildflowers are the famous wreath flower as well as the pink, white and yellow everlastings, and the pom-pom everlastings. You can view wildflowers within the town site along the Mullewa Bush Trail and the Wildflower Walk.
The City’s vision is to have a prosperous, diverse, vibrant and sustainable community.
Community feedback has made it clear that our environment and coastal lifestyle are regarded
as our most valuable assets and is a major reason that people live here. The City’s integrated
planning and associated aspirations, aims to continue the experience of the lifestyle we all
enjoy, and at the same time, encourage the local economy and industry to make the most of
opportunities that are on offer and will benefit our community.
5. Our Services
The City provides an extensive range of services to the community including:
Building and Planning approvals
Environmental health services
Community development and youth services
Libraries, festivals, concerts, art gallery and other cultural events
Leisure and recreation services and facilities
Rangers and community safety
Waste collection and landfill facilities
Land development
Parking facilities
Airport services
Tourism services
Infrastructure including roads, footpaths and street lighting
Parks and natural areas and management of the environment
Economic development
6. Service Delivery The City of Greater Geraldton’s financial position means that many community needs and aspirations are unlikely to be delivered within the short term, without significant increases in rates or reduction in expenses. In coming up with solutions to these challenges, the City has long recognised that the best
solutions are those that are made collaboratively between Council, the Community and its
staff, utilising the principles of engagement and deliberative democracy. Under the banner of
#changesCGGcommunity, the City has over the last 4 years engaged and worked with the
Community via Community Panels to develop a priority listing of the services the City provides,
City of Greater Geraldton Long Term Financial Plan 2017-2027 Page 7 of 21
made recommendations to Council on increasing, decreasing or maintaining the current level
of service and providing a framework for evaluating new services. This has provided staff with
a more focused approach on the delivery of services and some level of certainty for the
community about what services they can expect Council to deliver in the coming years
#ChangesCGGcommunity was a community engagement activity developed to empower local
residents in making decisions that affect the City’s budget. The City recognised there was a
need for change concerning future financial sustainability, community aspirations and growing
community expectations and a history of implementing deliberative democracy principles to
inform decision-making. It successfully:
Incorporated the principles of participatory budgeting into the recommendations on the
range and level of services the City provides;
Developed an assessment framework for current and not yet identified services;
Improved civic participation in decision making;
Improved alignment of City services with the needs of the community;
Increased the community’s knowledge of responsible budget management; and
Increased community acceptance of Council decisions.
Review of services will be a continual process that is undertaken along with the impact of
growth across the municipality in relation to the annual review and update of the LTFP.
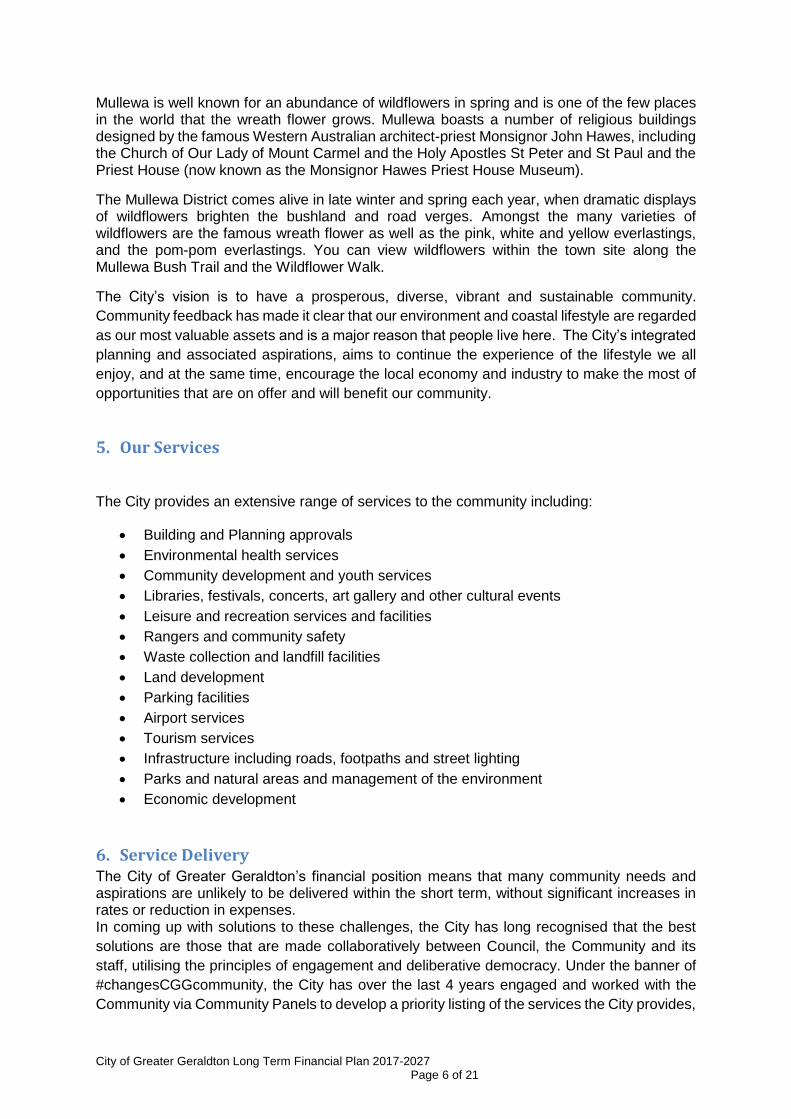
7. Asset Management
The City has developed a strategic approach to asset management and developed asset
management plans based on the total life cycle of assets. Asset Management Plans are
currently being reviewed and updated to assist Council in better predicting infrastructure
consumption and asset renewal needs and identify at a more mature level the cost required
to renew or preserve the asset (renewal gap). This renewal gap is being addressed in the
LTFP and will be the focus of future annual budgets.
0
10
20
30
40
50
60
70
Mill
ion
s
Asset Renewal Gap
Expenditure Required 2016/17 LTFP 2017/18 LTFP
City of Greater Geraldton Long Term Financial Plan 2017-2027 Page 8 of 21
Funding for the renewal of assets is to be increased annually on the basis to be able to fund
the City annual renewal expense at a level that equates to a range of 90% to 100% of the
City’s annual depreciation expense. The continued allocation of funding towards the renewal
of assets and funding for maintenance and upgrades will result in a positive investment for the
community into the future. Asset acquisitions and capital works projects are funded from
general revenue, sales of existing land/property assets, government grants or external
borrowings.
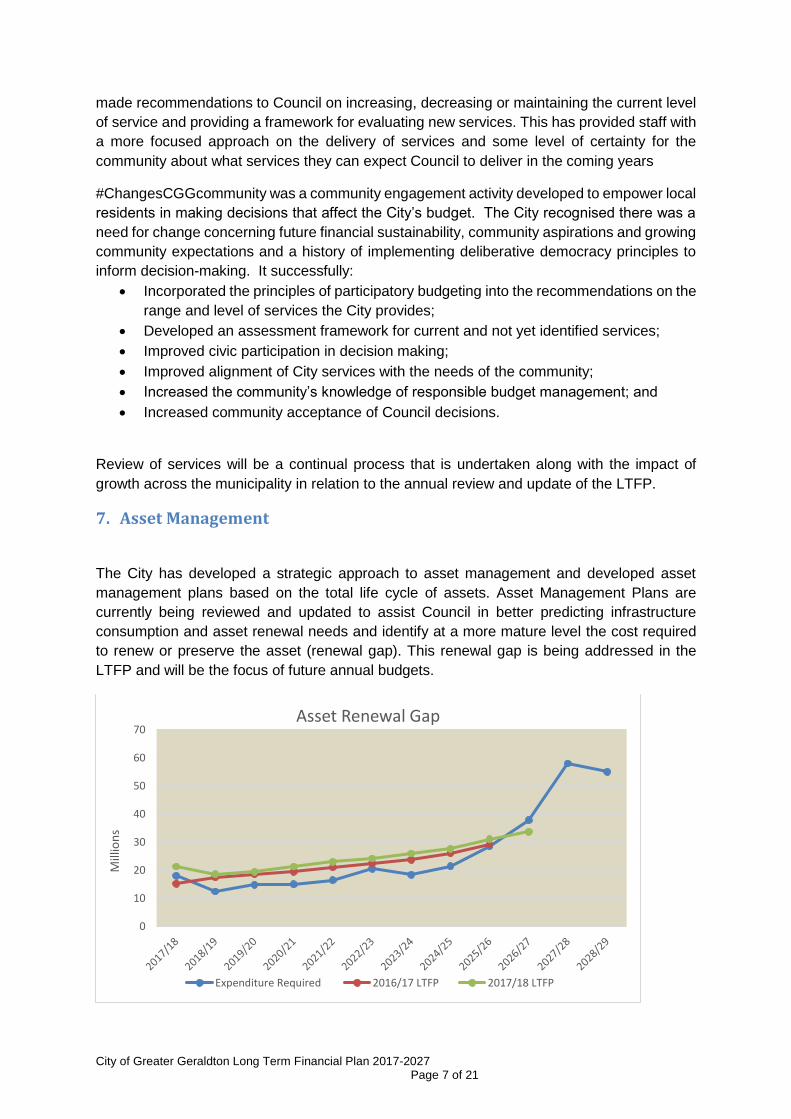
The proposed new LTFP will see the level of renewal expenditure (excluding flood repairs
works) increase by 8.6% over the next five years when compared to the previous LTFP for the
same period.
8. Financial Strategies and Principles
8.1 Rate increases
As a result of population growth, it is predicted that future budgets will be impacted by an
increasing demand for services and new infrastructure. Levying rate increases at or below CPI
is unsustainable in the long term and in the report to Council (CCS259 – Rates 2017-18 Notice
of Intention) Council has given endorsement subject to the completion 2017-18 Budget
process and development of a new LTFP of an aggregate rates revenue increase of 3.5%
(plus growth) years 1 to 10. This represents a significant reduction from the initial (2013-14)
LTFP forecast rates levied in 2017-18 of $47.96m compared to the currently proposed levied
amount of $44.96m as highlighted in the following graph:
0
5
10
15
20
25
2017/18 2018/19 2019/20 2020/21 2021/22
Mill
ion
s
Renewal Expenditure
2016/17 LTFP 2017/18 LTFP
City of Greater Geraldton Long Term Financial Plan 2017-2027 Page 9 of 21
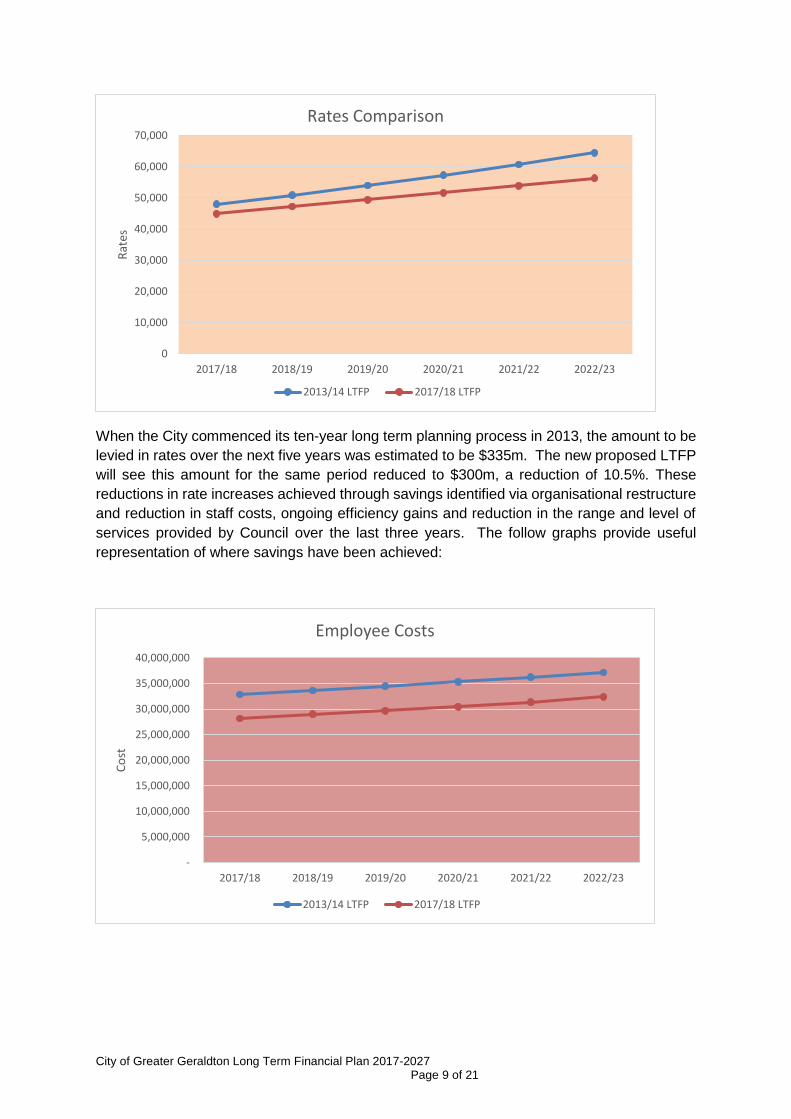
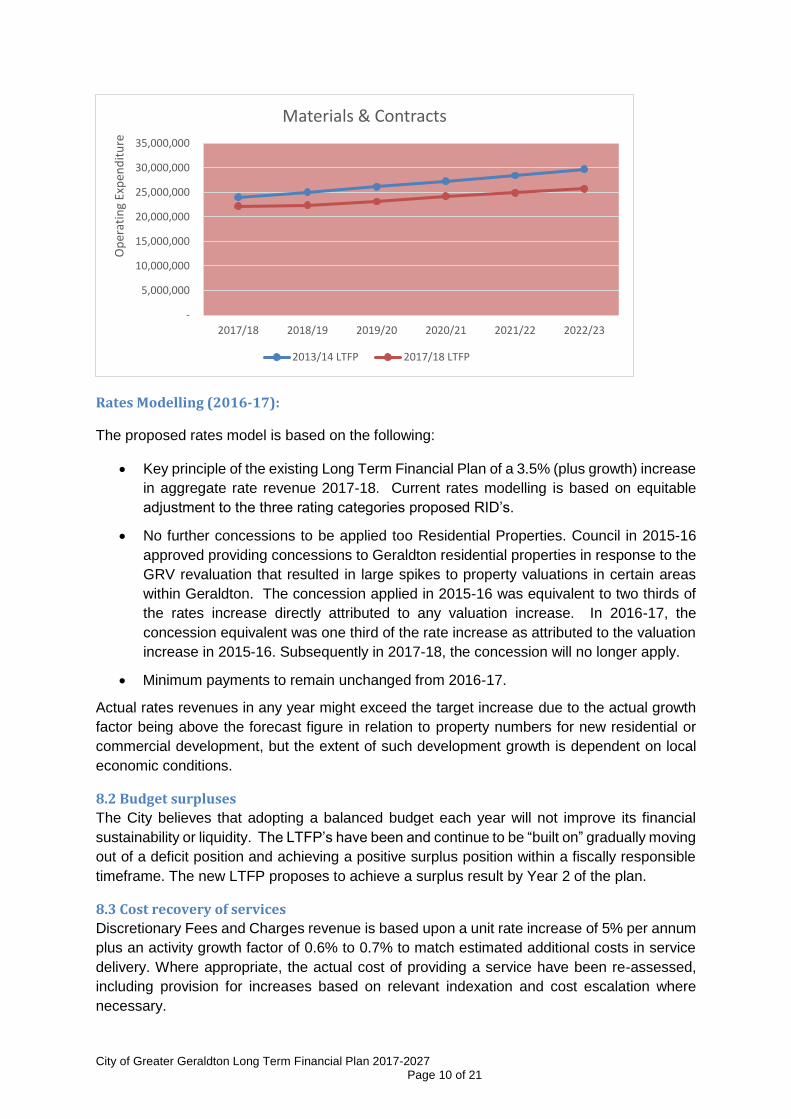
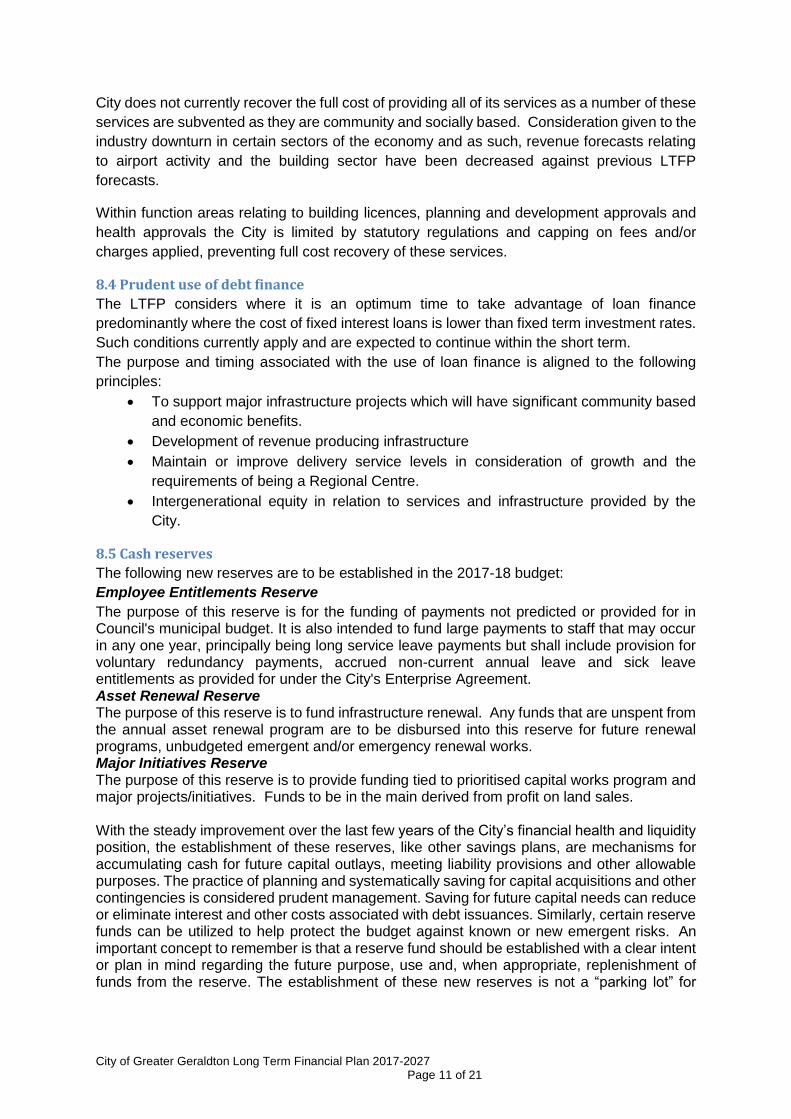
When the City commenced its ten-year long term planning process in 2013, the amount to be
levied in rates over the next five years was estimated to be $335m. The new proposed LTFP
will see this amount for the same period reduced to $300m, a reduction of 10.5%. These
reductions in rate increases achieved through savings identified via organisational restructure
and reduction in staff costs, ongoing efficiency gains and reduction in the range and level of
services provided by Council over the last three years. The follow graphs provide useful
representation of where savings have been achieved:
0
10,000
20,000
30,000
40,000
50,000
60,000
70,000
2017/18 2018/19 2019/20 2020/21 2021/22 2022/23
Rat
esRates Comparison
2013/14 LTFP 2017/18 LTFP
-
5,000,000
10,000,000
15,000,000
20,000,000
25,000,000
30,000,000
35,000,000
40,000,000
2017/18 2018/19 2019/20 2020/21 2021/22 2022/23
Co
st
Employee Costs
2013/14 LTFP 2017/18 LTFP
City of Greater Geraldton Long Term Financial Plan 2017-2027 Page 10 of 21
Rates Modelling (2016-17):
The proposed rates model is based on the following:
Key principle of the existing Long Term Financial Plan of a 3.5% (plus growth) increase
in aggregate rate revenue 2017-18. Current rates modelling is based on equitable
adjustment to the three rating categories proposed RID’s.
No further concessions to be applied too Residential Properties. Council in 2015-16
approved providing concessions to Geraldton residential properties in response to the
GRV revaluation that resulted in large spikes to property valuations in certain areas
within Geraldton. The concession applied in 2015-16 was equivalent to two thirds of
the rates increase directly attributed to any valuation increase. In 2016-17, the
concession equivalent was one third of the rate increase as attributed to the valuation
increase in 2015-16. Subsequently in 2017-18, the concession will no longer apply.
Minimum payments to remain unchanged from 2016-17.
Actual rates revenues in any year might exceed the target increase due to the actual growth
factor being above the forecast figure in relation to property numbers for new residential or
commercial development, but the extent of such development growth is dependent on local
economic conditions.
8.2 Budget surpluses
The City believes that adopting a balanced budget each year will not improve its financial
sustainability or liquidity. The LTFP’s have been and continue to be “built on” gradually moving
out of a deficit position and achieving a positive surplus position within a fiscally responsible
timeframe. The new LTFP proposes to achieve a surplus result by Year 2 of the plan.
8.3 Cost recovery of services
Discretionary Fees and Charges revenue is based upon a unit rate increase of 5% per annum
plus an activity growth factor of 0.6% to 0.7% to match estimated additional costs in service
delivery. Where appropriate, the actual cost of providing a service have been re-assessed,
including provision for increases based on relevant indexation and cost escalation where
necessary.
-
5,000,000
10,000,000
15,000,000
20,000,000
25,000,000
30,000,000
35,000,000
2017/18 2018/19 2019/20 2020/21 2021/22 2022/23
Op
erat
ing
Exp
end
itu
reMaterials & Contracts
2013/14 LTFP 2017/18 LTFP
City of Greater Geraldton Long Term Financial Plan 2017-2027 Page 11 of 21
City does not currently recover the full cost of providing all of its services as a number of these
services are subvented as they are community and socially based. Consideration given to the
industry downturn in certain sectors of the economy and as such, revenue forecasts relating
to airport activity and the building sector have been decreased against previous LTFP
forecasts.
Within function areas relating to building licences, planning and development approvals and
health approvals the City is limited by statutory regulations and capping on fees and/or
charges applied, preventing full cost recovery of these services.
8.4 Prudent use of debt finance
The LTFP considers where it is an optimum time to take advantage of loan finance
predominantly where the cost of fixed interest loans is lower than fixed term investment rates.
Such conditions currently apply and are expected to continue within the short term.
The purpose and timing associated with the use of loan finance is aligned to the following
principles:
To support major infrastructure projects which will have significant community based
and economic benefits.
Development of revenue producing infrastructure
Maintain or improve delivery service levels in consideration of growth and the
requirements of being a Regional Centre.
Intergenerational equity in relation to services and infrastructure provided by the
City.
8.5 Cash reserves
The following new reserves are to be established in the 2017-18 budget:
Employee Entitlements Reserve
The purpose of this reserve is for the funding of payments not predicted or provided for in Council's municipal budget. It is also intended to fund large payments to staff that may occur in any one year, principally being long service leave payments but shall include provision for voluntary redundancy payments, accrued non-current annual leave and sick leave entitlements as provided for under the City's Enterprise Agreement. Asset Renewal Reserve The purpose of this reserve is to fund infrastructure renewal. Any funds that are unspent from the annual asset renewal program are to be disbursed into this reserve for future renewal programs, unbudgeted emergent and/or emergency renewal works. Major Initiatives Reserve The purpose of this reserve is to provide funding tied to prioritised capital works program and major projects/initiatives. Funds to be in the main derived from profit on land sales. With the steady improvement over the last few years of the City’s financial health and liquidity position, the establishment of these reserves, like other savings plans, are mechanisms for accumulating cash for future capital outlays, meeting liability provisions and other allowable purposes. The practice of planning and systematically saving for capital acquisitions and other contingencies is considered prudent management. Saving for future capital needs can reduce or eliminate interest and other costs associated with debt issuances. Similarly, certain reserve funds can be utilized to help protect the budget against known or new emergent risks. An important concept to remember is that a reserve fund should be established with a clear intent or plan in mind regarding the future purpose, use and, when appropriate, replenishment of funds from the reserve. The establishment of these new reserves is not a “parking lot” for

City of Greater Geraldton Long Term Financial Plan 2017-2027 Page 12 of 21
excess cash but established with a clear purpose and plan in respect to the application of unspent funds and/or unbudgeted revenue.
8.6 Land Development
Currently, the City has a property disposal portfolio estimated to be around $16m. The new
proposed LTFP will remain consistent with the approach adopted in the previous LTFP and
not set revenue estimates within the life of the plan for land & property sales. The rationale
behind this approach is due to the high level of uncertainty and risk associated with not
realising these sales against forecast revenue that would significantly affect achieving
benchmark indicators. This City will continue in its effort to realise these sales over the life of
the plan with timing dependent on market conditions and any revenue generated will be
applied to either increasing the level of capital renewal or replacement expenditure, fund new
and high prioritised emergent capital projects and major initiatives.
9. Workforce Planning Strategies
The revised Workforce Plan proposes that net staff levels will remain relatively unchanged in
line with current service provision levels. There is no provision in either the Workforce Plan
or the LTFP to increase staff numbers above this level in the initial 3 years of the LTFP. Staff
levels are reviewed on an annual basis, and assessed on a number of factors including the
level of service required by the community and the ability to fund new positions. The
Workforce Plan proposes a range of initiatives to attract, develop and retain employees. It
also proposes building the City’s leadership capability and putting in place a robust framework
so that the City has the necessary skills to deliver the required level of service now and into
the future.
Modelling and Sensitivity Analysis
All modelling and analysis undertaken was primarily concentrated around achieving the
following:
The period within the plan where Council achieves an operating surplus from ordinary
activities.
Operating surplus once achieved is maintained
Achievement of financial and sustainability ratios.
The adopted model results in:
Achieving a positive accounting result from Ordinary Operating Activities (an effective operating surplus in accounting terms) within a fiscally responsible timeframe. The new proposed LTFP forecasts the City achieving and maintaining a surplus position from 2018-19.
Improving the City’s liquidity position. The City will now achieve and maintain the associated financial ratio (current ratio) benchmark by the end of the 2017-18 financial year.
Renewing assets when required to maintain capacity of performance and associated levels of services. The proposed new LTFP will see the level of renewal expenditure increase when compared to the previous LTFP.
City of Greater Geraldton Long Term Financial Plan 2017-2027 Page 13 of 21
Maintaining debt service levels within benchmark levels and having the capacity to borrow when required.
Key Assumptions Underpinning the Long Term Financial Plan The previous long term financial planning scenario that was developed and adopted by
Council in 2016-17, will remain relatively unchanged in the 2017-18 LTFP except for
achievement of a positive accounting result from Ordinary Operating Activities, level of
renewal expenditure and the provision of cash reserves.
The following overarching assumptions and strategies will now underpin the development of
a new LTFP:
Years 1 to 10 the increase per annum in aggregate rate revenue would be 3.5% (plus
growth).
The growth in the annual rate base will continue per annum to be at least 1% or
estimated in accordance with current growth.
Increases in revenue from rates, fees and charges should be smoothed to avoid
revenue-raising shocks to the community.
Achieving a positive accounting result from Ordinary Operating Activities.
Improving the City’s liquidity position.
Renewing assets when required to maintain capacity of performance and associated
levels of services.
Maintaining debt service levels within benchmark levels and having the capacity to
borrow when required.
Reserves to be either established or retained where there is a legal or statutory
requirement to do so and are mechanisms for accumulating cash for future capital
outlays and meeting liability provisions.
Interest rates for investment funds will be around 2.5% to 4% over the life of the plan
with the dollar return adjusted according to the annual cash available for short-term
investment.
Interest rates for new borrowing will be between 4% and 6.5% over the life of the plan
and within this range consideration given to the loan term.
2017-18 Income and Expenditure Assumptions
The aggregate increase in dollar terms for rates revenues levied incorporates an equitable increase in the differential rating categories ‘rate in the dollar’ of 3.5%.
The aggregate increase in fees and charges based upon the draft Schedule of Fees and Charges for 2017-18 and the expected consumption of these services by the community. Year 1 also allows for a current downturn in certain sectors of the economy and related impact on activity levels.
The total budget for this revenue category based on confirmed grants for 2017-18, and that financial assistance grants indexation restored and re-applied to the 2017-18 allocations after a three- year freeze on indexing.
Interest earnings calculated upon the likely cash balances during each financial year against current investment rates.
Employee costs increase allows for 2.5% rise associated with the Council’s Enterprise Bargaining Agreement and 0.3% increase in incremental
City of Greater Geraldton Long Term Financial Plan 2017-2027 Page 14 of 21
employment levels based on the organisations full and approved organisational structure.
Materials & Contracts increased by 2.4% compared to 2016-17 budget. This movement is primarily due to the following:
$150,000 addition due to the removal of local government concessional rates for motor vehicle registrations.
$150,000 new allocation to support growth plan initiatives.
Utility charges for water and electricity calculated costs based upon the expected consumption and potential increases in the State Budget. Adjustments have been made to electricity charges based on the following:
New bundled electricity supply agreements which is expected to generate savings.
Flow on impacts of cost savings initiatives at the Aquarena and Art Galley that took effect in 2016-17.
Energy review of existing tariffs and subsequent changes to these tariffs based on energy usage.
Annual fair value assessments on assets undertaken in 2016-17 that will take effect from 1st July 2017.
Insurance costs based on current 2016-17 actuals and changes to insurance policies relating to excess amounts and reduction in CGG fleet size.
Interest rates for new borrowings in 2017-18 based on conservative estimates of around 4-5% with consideration given to the loan term.
Years 2 to 10 Income and Expenditure Assumptions Years 2 to 10 in the LTFP include the following assumptions giving regards to changes in
yearly budgets:
The aggregate increase in rates across all categories from year 2 to 10 is 3.5%, inclusive of any GRV and UV revaluations plus a 1.0% growth in the rate base.
Operating grants and contributions based on existing recurrent funding allowing for indexation of 3.2% in years 2 to 10.
Non-operating grants and contributions indexed to a level of known or likely capital contributions from other levels of government.
Fees and Charges revenue based upon a unit rate increase of 5% per annum adjusted for expected activity growth or decline.
Interest Earnings are calculated upon the likely cash balances during each financial-year and allowing for marginal increases in the base cash rate.
Employee costs indexed annually by both the known and expected Enterprise Agreement percentage increase of between 2.5% and 3% for the life of the plan. During the life of the plan, any movements outside the Enterprise Agreement range reflect changes to superannuation compulsory contribution rates, incremental pay level increases and changes to staff establishment.
Materials and Contract costs indexed between 2.0% and 3.5% and adjusted to reflect the cyclical expenditure on specific operational items (i.e. land revaluations & fair value asset valuations).
Interest Expenses reflect the expected borrowing rate and debt profile. Substantial decreases in interest expenses are indicative of the retirement of debt whilst increases are associated with new debt.
Utility charges based on 5% increase per annum against expected consumption levels.
Insurance costs indexed at a conservative rate of 5% per annum.
City of Greater Geraldton Long Term Financial Plan 2017-2027 Page 15 of 21
10 YR Capital Plan
Funding for the renewal of assets increased annually on the basis to fund the City annual renewal expense in Year 9 of the LTFP at a level that equates to a range of 90% to 100% of the City’s annual depreciation expense. The continued allocation of funding towards the renewal of assets and funding for maintenance and upgrades will result in a positive investment for the community into the future. Asset acquisitions and capital works projects funded from general revenue, sales of existing land assets, government grants or external borrowings.
Incorporates the City’s Project Management Framework delivery strategy in relation to initiation and planning phases. This enables the City to establish a bank of projects that have progressed to the detailed design phase and are “shelf ready” to go when opportunity presents in relation to available funding both internally and externally.
In Years 2 to 10, the nature and type of capital expenditure are only indicative figures; however, the Capital Plan underpins the level of expenditure in relation to resource capabilities.
In Years 2 to 10, the amount of funding sourced from Non-Operating (Capital) grants and contributions based on confirmed funding agreements and/or known sources of recurrent funding. The LTFP assumes that the current level of funding will continue to be available for the life of the plan in relation to road related grants such as Roads to Recovery and Main Roads.
During the life of the LTFP, the City’s debt level is such that it provides the ability and capacity to manage unexpected peaks in capital expenditure that
may result from emergent works or other capital funding opportunities.
City of Greater Geraldton Long Term Financial Plan 2017-2027 Page 16 of 21
Measuring Sustainability
Several statutory key performance indicators (KPIs) are prescribed in the Local Government (Financial Management) Regulations 1995 to
measure the financial sustainability of local governments. The LTFP is assessed against these KPIs and will be compared with KPIs measured
from the Annual Budgets and Annual Financial Statements to provide clear targets for the City to report its progress to the community each year.
The KPIs, target rates and results measured from the LTFP are tabled below:
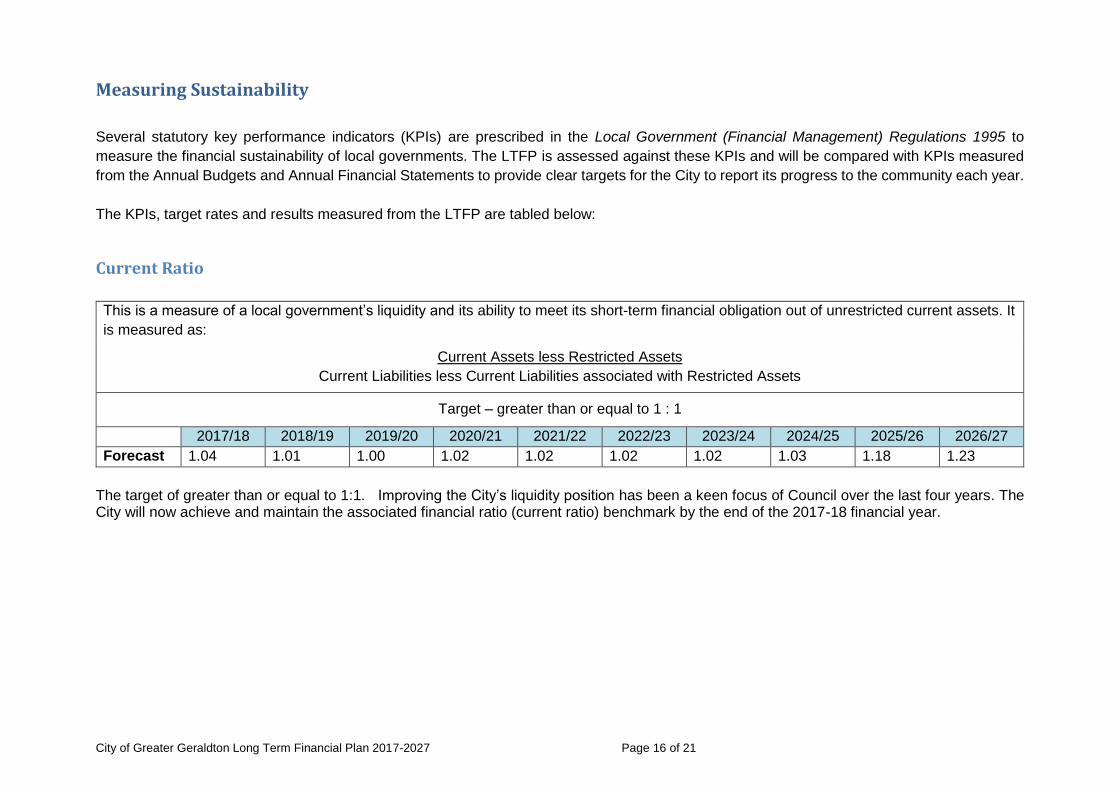
Current Ratio
This is a measure of a local government’s liquidity and its ability to meet its short-term financial obligation out of unrestricted current assets. It
is measured as:
Current Assets less Restricted Assets
Current Liabilities less Current Liabilities associated with Restricted Assets
Target – greater than or equal to 1 : 1
2017/18 2018/19 2019/20 2020/21 2021/22 2022/23 2023/24 2024/25 2025/26 2026/27
Forecast 1.04 1.01 1.00 1.02 1.02 1.02 1.02 1.03 1.18 1.23
The target of greater than or equal to 1:1. Improving the City’s liquidity position has been a keen focus of Council over the last four years. The City will now achieve and maintain the associated financial ratio (current ratio) benchmark by the end of the 2017-18 financial year.
City of Greater Geraldton Long Term Financial Plan 2017-2027 Page 17 of 21
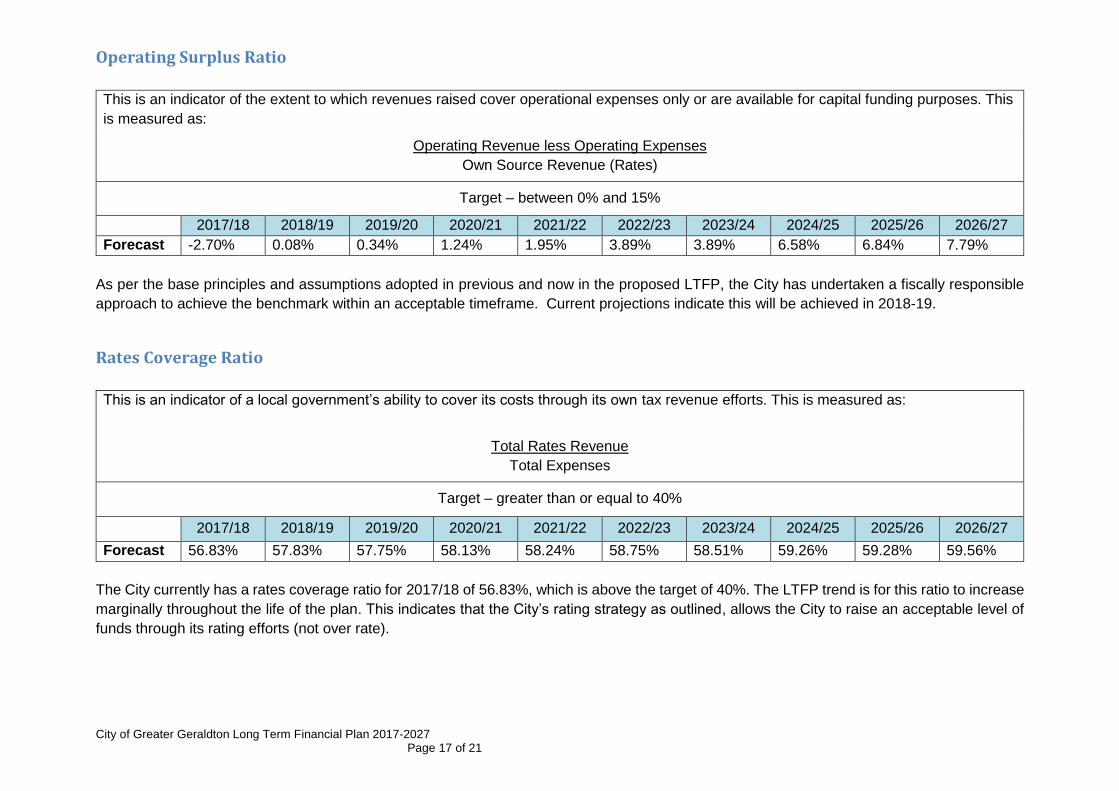
Operating Surplus Ratio
This is an indicator of the extent to which revenues raised cover operational expenses only or are available for capital funding purposes. This
is measured as:
Operating Revenue less Operating Expenses
Own Source Revenue (Rates)
Target – between 0% and 15%
2017/18 2018/19 2019/20 2020/21 2021/22 2022/23 2023/24 2024/25 2025/26 2026/27
Forecast -2.70% 0.08% 0.34% 1.24% 1.95% 3.89% 3.89% 6.58% 6.84% 7.79%
As per the base principles and assumptions adopted in previous and now in the proposed LTFP, the City has undertaken a fiscally responsible
approach to achieve the benchmark within an acceptable timeframe. Current projections indicate this will be achieved in 2018-19.
Rates Coverage Ratio
This is an indicator of a local government’s ability to cover its costs through its own tax revenue efforts. This is measured as:
Total Rates Revenue
Total Expenses
Target – greater than or equal to 40%
2017/18 2018/19 2019/20 2020/21 2021/22 2022/23 2023/24 2024/25 2025/26 2026/27
Forecast 56.83% 57.83% 57.75% 58.13% 58.24% 58.75% 58.51% 59.26% 59.28% 59.56%
The City currently has a rates coverage ratio for 2017/18 of 56.83%, which is above the target of 40%. The LTFP trend is for this ratio to increase
marginally throughout the life of the plan. This indicates that the City’s rating strategy as outlined, allows the City to raise an acceptable level of
funds through its rating efforts (not over rate).
City of Greater Geraldton Long Term Financial Plan 2017-2027 Page 18 of 21
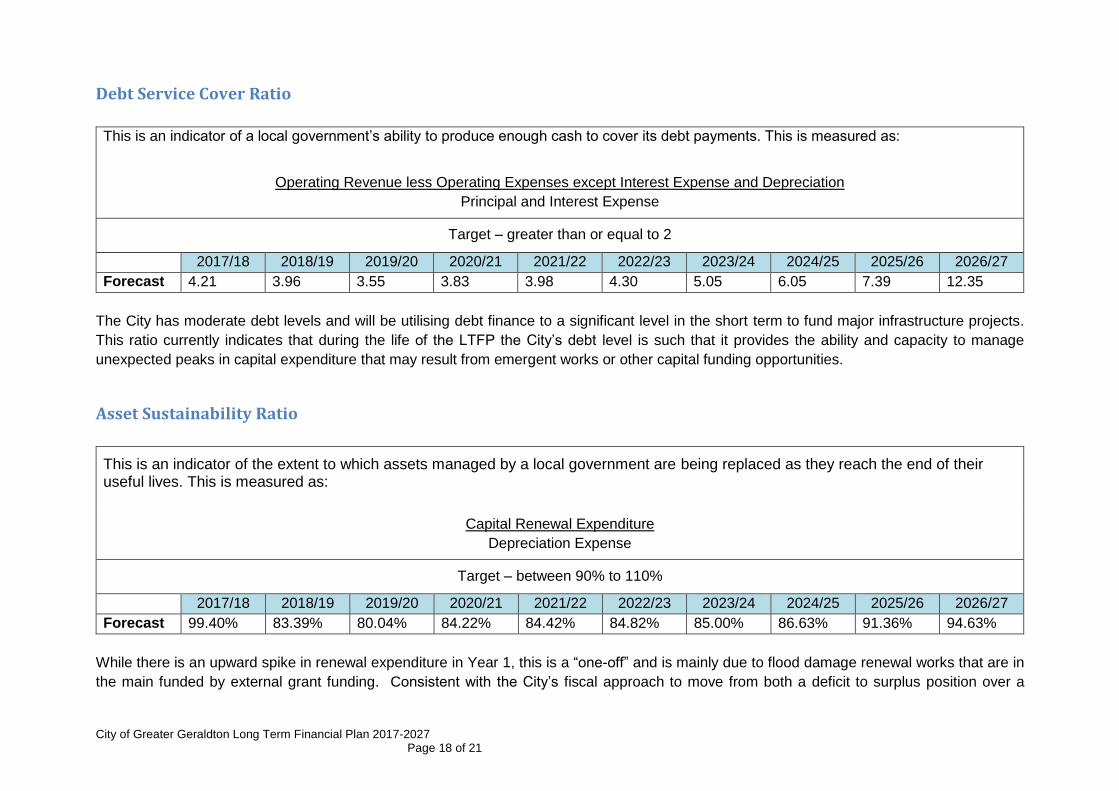
Debt Service Cover Ratio
This is an indicator of a local government’s ability to produce enough cash to cover its debt payments. This is measured as:
Operating Revenue less Operating Expenses except Interest Expense and Depreciation
Principal and Interest Expense
Target – greater than or equal to 2
2017/18 2018/19 2019/20 2020/21 2021/22 2022/23 2023/24 2024/25 2025/26 2026/27
Forecast 4.21 3.96 3.55 3.83 3.98 4.30 5.05 6.05 7.39 12.35
The City has moderate debt levels and will be utilising debt finance to a significant level in the short term to fund major infrastructure projects.
This ratio currently indicates that during the life of the LTFP the City’s debt level is such that it provides the ability and capacity to manage
unexpected peaks in capital expenditure that may result from emergent works or other capital funding opportunities.
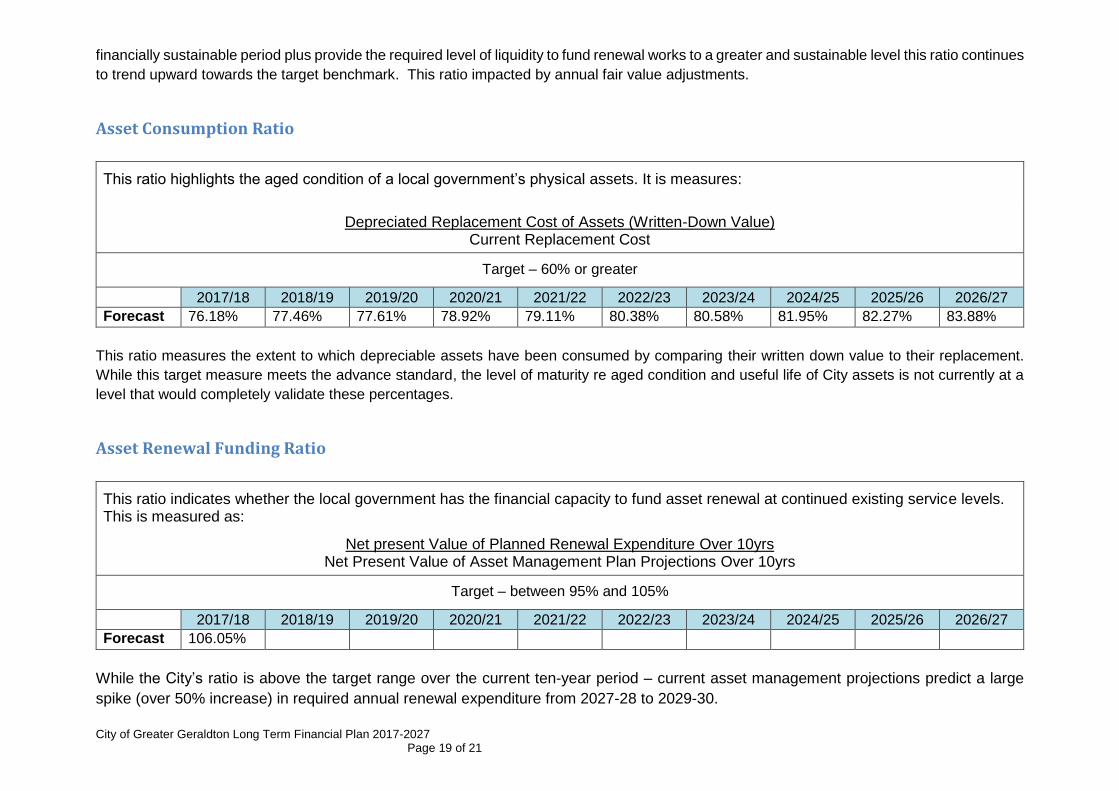
Asset Sustainability Ratio
This is an indicator of the extent to which assets managed by a local government are being replaced as they reach the end of their useful lives. This is measured as:
Capital Renewal Expenditure
Depreciation Expense
Target – between 90% to 110%
2017/18 2018/19 2019/20 2020/21 2021/22 2022/23 2023/24 2024/25 2025/26 2026/27
Forecast 99.40% 83.39% 80.04% 84.22% 84.42% 84.82% 85.00% 86.63% 91.36% 94.63%
While there is an upward spike in renewal expenditure in Year 1, this is a “one-off” and is mainly due to flood damage renewal works that are in
the main funded by external grant funding. Consistent with the City’s fiscal approach to move from both a deficit to surplus position over a
City of Greater Geraldton Long Term Financial Plan 2017-2027 Page 19 of 21
financially sustainable period plus provide the required level of liquidity to fund renewal works to a greater and sustainable level this ratio continues
to trend upward towards the target benchmark. This ratio impacted by annual fair value adjustments.
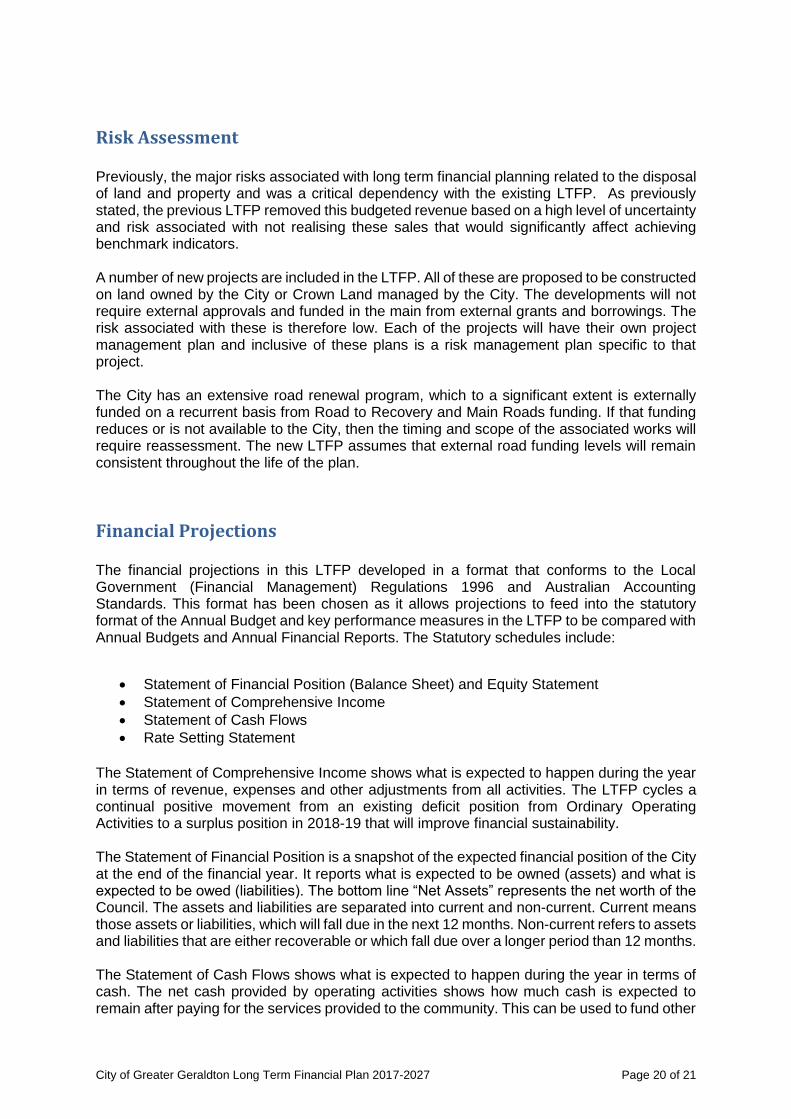
Asset Consumption Ratio
This ratio highlights the aged condition of a local government’s physical assets. It is measures:
Depreciated Replacement Cost of Assets (Written-Down Value) Current Replacement Cost
Target – 60% or greater
2017/18 2018/19 2019/20 2020/21 2021/22 2022/23 2023/24 2024/25 2025/26 2026/27
Forecast 76.18% 77.46% 77.61% 78.92% 79.11% 80.38% 80.58% 81.95% 82.27% 83.88%
This ratio measures the extent to which depreciable assets have been consumed by comparing their written down value to their replacement.
While this target measure meets the advance standard, the level of maturity re aged condition and useful life of City assets is not currently at a
level that would completely validate these percentages.
Asset Renewal Funding Ratio
This ratio indicates whether the local government has the financial capacity to fund asset renewal at continued existing service levels. This is measured as:
Net present Value of Planned Renewal Expenditure Over 10yrs Net Present Value of Asset Management Plan Projections Over 10yrs
Target – between 95% and 105%
2017/18 2018/19 2019/20 2020/21 2021/22 2022/23 2023/24 2024/25 2025/26 2026/27
Forecast 106.05%
While the City’s ratio is above the target range over the current ten-year period – current asset management projections predict a large
spike (over 50% increase) in required annual renewal expenditure from 2027-28 to 2029-30.
City of Greater Geraldton Long Term Financial Plan 2017-2027 Page 20 of 21
Risk Assessment Previously, the major risks associated with long term financial planning related to the disposal of land and property and was a critical dependency with the existing LTFP. As previously stated, the previous LTFP removed this budgeted revenue based on a high level of uncertainty and risk associated with not realising these sales that would significantly affect achieving benchmark indicators. A number of new projects are included in the LTFP. All of these are proposed to be constructed on land owned by the City or Crown Land managed by the City. The developments will not require external approvals and funded in the main from external grants and borrowings. The risk associated with these is therefore low. Each of the projects will have their own project management plan and inclusive of these plans is a risk management plan specific to that project. The City has an extensive road renewal program, which to a significant extent is externally funded on a recurrent basis from Road to Recovery and Main Roads funding. If that funding reduces or is not available to the City, then the timing and scope of the associated works will require reassessment. The new LTFP assumes that external road funding levels will remain consistent throughout the life of the plan.
Financial Projections The financial projections in this LTFP developed in a format that conforms to the Local Government (Financial Management) Regulations 1996 and Australian Accounting Standards. This format has been chosen as it allows projections to feed into the statutory format of the Annual Budget and key performance measures in the LTFP to be compared with Annual Budgets and Annual Financial Reports. The Statutory schedules include:
Statement of Financial Position (Balance Sheet) and Equity Statement
Statement of Comprehensive Income
Statement of Cash Flows
Rate Setting Statement
The Statement of Comprehensive Income shows what is expected to happen during the year in terms of revenue, expenses and other adjustments from all activities. The LTFP cycles a continual positive movement from an existing deficit position from Ordinary Operating Activities to a surplus position in 2018-19 that will improve financial sustainability. The Statement of Financial Position is a snapshot of the expected financial position of the City at the end of the financial year. It reports what is expected to be owned (assets) and what is expected to be owed (liabilities). The bottom line “Net Assets” represents the net worth of the Council. The assets and liabilities are separated into current and non-current. Current means those assets or liabilities, which will fall due in the next 12 months. Non-current refers to assets and liabilities that are either recoverable or which fall due over a longer period than 12 months. The Statement of Cash Flows shows what is expected to happen during the year in terms of cash. The net cash provided by operating activities shows how much cash is expected to remain after paying for the services provided to the community. This can be used to fund other
City of Greater Geraldton Long Term Financial Plan 2017-2027 Page 21 of 21
activities such as capital works and infrastructure. The information in this statement assists in the assessment of the ability to generate cash flows and meet financial commitments as they fall due, including debt repayments. Reflective of the current ratio, the City maintains the ability to meet all operating and capital commitments during the term of the LTFP. In the LTFP, rates assessed and determined are within the accepted range of 90 to 110% and reflect cyclical movements in cash flow from year to year.
The statements supported by schedules of:
loan borrowings and repayments
capital works
cash reserves
depreciation calculations
assumptions used in the LTFP
schedule of KPIs
Conclusion - Implementation and Review of the LTFP Council will consider the content of the LTFP when preparing the Annual Budget for 2017-18 and subsequent years with the expectation that adopted budgets will closely align with the proposals, underlying principles and assumptions of the LTFP. Review of the LTFP will occur each year as budgets are prepared to account for performance information and changing circumstances.
The City is confident that the LTFP will allow the City to set priorities within its resourcing
capabilities to sustainably deliver the assets and services required by the community in a
fiscally responsible manner.