long term financial plan
DESCRIPTION
ÂTRANSCRIPT

1 Long Term Financial Plan
Long Termfinancial plan2015/2025

2 Long Term Financial Plan
about this plan.
What is THE LONG TERM FINANCIAL PLAN?The Long Term Financial Plan is a 10 year plan that outlines Council’s financial capacity to meet those objectives of the Community Strategic Plan that fall under the auspices of Council.
The Long Term Financial Plan is formulated by using a number of estimates and assumptions to project the future revenue and expenditure required of Council to deliver those services and projects expected by the community. In doing so it addresses the resources that impact on Council’s ability to fund its services and capital works whilst remaining financially sustainable
The Long Term Financial Plan is one element of the resourcing strategy that ensures the community’s ideas and aspirations for the future are realistically achievable. The other elements of the resourcing strategy include the Asset Management Plan and the Workforce Plan. The Asset Management Plan aims to predict infrastructure consumption and renewal needs, as well as consider infrastructure requirements to meet future community needs. The Workforce Plan is designed to ensure that Council has the necessary staff to deliver current services and operational needs for the community now and in the future.
These interrelated plans give consideration to the capacity of Council to deliver on its responsibilities within the Community Strategic Plan (‘Ruby & Oliver’). Each element informs the Delivery Plan which outlines the strategies in place to meet these responsibilities.
Council has reviewed the previous Long Term Financial Plan and significant changes have been made to both operational and capital items in the formulation of this 2014/24 Long Term Financial Plan. Council reviews any significant changes to the Long Term Financial Plan via the Monthly Finance Report to Council. The Monthly Finance Report assesses Council’s performance against budget each month. Any ongoing changes to budget that result from this process are included in the Long Term Financial Plan and reported to Council. A comprehensive review of the Long Term Financial Plan is conducted annually during the Operational Plan process.
what is this documentall about?

3 Long Term Financial Plan
contents.
contents.Our Plan 2
EXECUTIVE SUMMARY 4
proposed special rate variation 5
fit for the future 7
FINANCIAL STRATEGIES 10Financial Strategy 1 10Financial Strategy 2 11Financial Strategy 3 11Financial Strategy 4 11Financial Strategy 5 12Financial Strategy 6 12
PLANNING ASSUMPTIONS 13
FINANCIAL FORECAST ASSUMPTIONS 15
SENSITIVITY ANALYSIS 18Bse Case Scenario 20Scenario 1a. 23Scenario 1b. 23Scenario 2a. 24Scenario 2b. 24Scenario 3a. 25Scenario 3b. 26Scenario 4a. 27Scenario 4b. 28
appendices 29Appendix 1Budgeted Income Statement 30
Appendix 2Balance Sheet Forecasts 31
Appendix 3Cashflow Statement Forecasts 33
Appendix 4Financial Sustainability Indicators 36
Appendix 5Budgeted External Restrictions 37
Appendix 6Budgeted Internal Restrictions 38
Appendix 7New External Loan Projects & Debt Servicing 42
Appendix 8Capital Works Program 54
Appendix 9Wagga Wagga Regional Airport Ten Year Financial Plan 74
Appendix 11Livestock Marketing Centre Ten Year Financial Plan 74
Appendix 12Sewerage Services Ten Year Financial Plan 76
Appendix 13Solid Waste Services Ten Year Financial Plan 78
Appendix 14Stormwater Levy Ten Year Financial Plan 80
Appendix 15Budgeted Income Statement by Function 82
contact us 85

4 Long Term Financial Plan
executive summary.
our EXECUTIVESUMMARY.The Long Term Financial Plan (LTFP) is one element of the resourcing strategy which details how the strategic aspirations of the City which are outlined in the Community Strategic Plan (‘Ruby & Oliver’) can be achieved in terms of time, money, assets and people.
The Resourcing Strategy focuses on long term strategies in three key areas:
• Financial Planning - addresses the financial resources that impact on Council’s ability to fund its services and capital works whilst remaining financially sustainable
• Workforce Planning - ensures that Council has the necessary staff to deliver current services and operational needs for the community now and in the future.
• Asset Management Planning - aims to predict infrastructure consumption and renewal needs, as well as consider infrastructure requirements to meet future community needs.
Council’s LTFP is a ten-year financial planning document with an emphasis on long-term financial sustainability. Financial sustainability is one of the key issues facing local government due to several contributing factors including growing demands for community services and facilities, constrained revenue growth and ageing infrastructure.
The LTFP is formulated by using a number of estimates and assumptions to project the future revenue and expenditure required of Council to deliver those services and projects expected by the community.
Council has reviewed the previous LTFP and significant changes have been made to both operational and capital items in the formulation of this 2015/25 LTFP. The draft budget for both 2015/16 and 2016/17 years are balanced, and this position has been achieved with significant changes to both operational and capital budgets including savings over the ten year period for $21.9M for salaries, $5.6M in utility costs and $2.6M in operational budgets. These savings have helped Council overcome unfavourable adjustments to Council’s revenue sources including a three year freeze on indexation of the Federal Government’s Financial Assistance Grant ($9.4M) and a reduction of investment income of $1.4M over the ten year period.
Council also reviews any significant changes to the LTFP via the Monthly Finance Report to Council. The Monthly Finance Report assesses Council’s performance against budget each month, and any ongoing changes to budget that result from this process are included in the LTFP and reported to Council.
Special Rate VariationThe Delivery Program and Long Term Financial Plan highlight
Council’s intentions to fund its one-third share of the Main City and North Wagga Levee Upgrade Project with a Special Rate Variation (SRV) commencing from the 2016/17 financial year which will require a contribution from all ratepayers within the Local Government Area.
Council also has a scenario in the Long Term Financial Plan which provides funding for Council’s one-third share by loan borrowings in the event that the application for a SRV to the Independent Pricing and Regulatory Tribunal (IPART) is not approved. If Council’s SRV application is not approved, Council will need to make additional budget reductions from the 2017/18 year to accommodate the additional debt servicing costs associated with the borrowings.
Long Term Financial Plan ObjectivesThe objectives of Council’s LTFP are:
• to provide a forecast financial position over ten years to ensure that Council remains financially sustainable
• to support the implementation of the Council’s Community Strategic Plan (‘Ruby & Oliver’)
• to identify and highlight future challenges, problems and financial trends in order that they be proactively addressed
• to ensure compliance with legislative requirements of integrated planning and reporting contained in the Local Government Act and the guidelines produced by the NSW Office of Local Government
• trend towards becoming ‘Fit for the Future’.
Financial Sustainability In 2013, New South Wales Treasury Corporation (TCorp) conducted a financial assessment of the 152 Councils in New South Wales. During this assessment, TCorp defined financial sustainability as:
A local government will be financially sustainable over the long term when it is able to generate sufficient funds to provide the levels of service and infrastructure agreed with its community.
From its assessment, TCorp developed key recommendations for consideration:
1. At least breakeven operating positions are essential2. Pricing paths are needed for the medium term3. Rate increases must meet underlying costs4. Asset management planning must be prioritised5. Councillor and management capacity must be developed6. Improved use of restricted funds7. Increased use of debtT-Corp concluded that Council’s financial sustainability was Moderate, with a Negative outlook.
A Moderate rating indicates that a Council has an adequate capacity to meet its financial obligations in the short to medium term (being the next five years), and to manage the risks to its business. Councils rated as Moderate will generally not have sufficient funds to address their Infrastructure Backlogs over time.
The Negative Outlook rating is based on the perception of the likely future movement in the Financial Sustainability Rating (FSR) of each Council over the next three years. A Negative Outlook indicates that a Council’s FSR is more likely to deteriorate, and is a sign of a general weakening in performance and sustainability.
In developing this year’s LTFP, Council has considered T-Corp’s recommendations and have investigated programs and strategies in order to assist in improving Council’s financial sustainability position.

5 Long Term Financial Plan
proposed special ratevariation.Wagga Wagga City Council (WWCC) has been planning for an upgrade to the levee system since 2007, and recently completed detailed designs for the Main City and North Wagga Levee Upgrade Project. Following extensive community consultation Council resolved to upgrade the Main City Levee to a 1 in 100 year level of protection. The full impact of upgrading the North Wagga Levee will be considered in a review of the Floodplain Risk Management Study.
The upgrade of the Main City Levee will ensure the protection of residences and businesses in Central Wagga up to a 1 in 100 year flood event. This will reduce the likelihood that the area will need to be evacuated during a flood event, which can also have an immediate social and economic impact. In some flood events the upgrade will mean that flood levels in some flood events in parts of the floodplain upstream and outside of the Main City Levee will increase slightly.
The estimated cost of upgrading both of the levees to a 1 in 100 year level of protection is $24.4M.
Council has made an application for funding under the NSW Floodplain Management Program for construction of the levee upgrade. Given the nature of funding through the program, it is likely that the upgrade will be constructed in stages over a number of years.
If Council’s application is successful, it is anticipated that construction will commence in the second half of 2016.
Providing it can secure Federal and State funding, Council is committed to funding one-third of the cost of the overall project and proposes to fund this $8.13M share with a Special Rate Variation (SRV). Council intends to make an application to the the Independent Pricing and Regulatory Tribunal (IPART) for a SRV of 3.95% above the rate peg each year maintained for five years, commencing in 2016/17.
Assuming the rate peg is set at 3% each year, the full increase will be a one off annual increase of 6.95% maintained for five years.
At the end of the five year period rates payable in (2021/22) will revert back down to the equivalent level to that if an SRV had not occurred.
Rates for each property are calculated as a percentage of the land value so the rate increase in dollar terms will vary.
The average annual increase for each rate category is outlined below:
These figures are calculated using a total rate increase of 6.95% (3.95% special rate variation plus an estimated 3% rate peg).
Rate category Average land value*
Total average annual increase in 2016/17 (SRV plus rate peg)**
Average annual increase in 2016/17 for SRV only**
Total average annual increase by 2020/21 (SRV plus rate peg)**
Average annual increase in 2020/21 for SRV only**
Residential Wagga
$121,000 $69.15 $39.30 $77.83 $44.24
Residential Village
$63,000 $24.33 $13.83 $27.39 $15.56
Residential Other
$219,000 $97.91 $55.65 $110.20 $62.63
Business Wagga
$445,000 $438.43 $249.18 $493.45 $280.45
Business Village $74,000 $36.01 $20.47 $40.53 $23.04
Farmland $637,000 $168.54 $95.79 $189.70 $107.81
*Based on 2015/16 rates**Indicative increase only and subject to change as per rate pegs set by IPART each year

6 Long Term Financial Plan
Ratepayers can be assured that money raised by the proposed SRV can only be spent on the Levee Upgrade Project.
In the event that an upgrade of the North Wagga levee to a 1 in 100 hundred year level of protection does not proceed to this extent, the SRV amount would be adjusted downwards to include only the increase required to upgrade the Main City Levee.
If Council is not successful with its application for a special rate variation, it will need to fund its one-third share of the Levee Project by borrowing $8.12M over five years. This would be paid back with interest over approximately 14 years. The total cost of the repayments is anticipated to be $11.41M.
The table shown right outlines what the repayments are expected to be each year over the 14 year repayment period (timing of funds drawn down is reflective of the five (5) year construction period). The debt servicing costs would need to be budgeted for in each of the financial year’s listed below, which will mean a reduction in the services that Council provides to the community. Services that could be impacted include Council’s road and footpath maintenance program, facilities such as the Oasis Aquatic Centre, cultural programs such as community festivals and further staff cuts.
YEAR REPAYMENT AMOUNT*17/18 $228,109
18/19 $456,219
19/20 $684,328
20/21 $912,437
21/22 $1,140,547
22/23 $1,140,547
23/24 $1,140,547
24/25 $1,140,548
25/26 $1,140,548
26/27 $1,140,548
27/28 $912,439
28/29 $684,329
29/30 $456,219
30/31 $228,110
TOTAL $ 11,405,475
*Indicative increase only and subject to changes in interest rates
Given the significant pressure that borrowing money to fund the Levee Upgrade Project will have on Council’s ability to provide services, Council believes that the fairest and most cost effective result for the community is to fund the project with a SRV.
The various scenarios for funding the Levee Upgrade Project are outlined in detail in the sensitivity analysis section of this document.
This LTFP includes separate funding scenarios which include and exclude the North Wagga option.

7 Long Term Financial Plan
Following T-Corp’s recommendations, the NSW Government have commenced a “Fit for the Future” program to achieve the shared vision of strengthening local communities. A reform package of up to $1 billion will provide support and incentives to help councils become “Fit For the Future”. The package is the Government’s response to the findings of the comprehensive three-year independent review of local government.
The Fit for the Future process will help councils demonstrate to their community that they are financially sound, operating efficiently and in a strong position to guide growth and deliver quality services into the future.
Each council is being asked to:
• Review its situation, starting with whether the council has scale and capacity to meet the challenges ahead
• Prepare a Fit for the Future submission by 30 June 2015
• Make the transition to a new structure by September 2016 or implement an improvement plan
A Fit for the Future council is one that is:
• Sustainable
• Efficient
• Effectively manages infrastructure and delivers services for communities
• Has the scale and capacity to engage effectively across community, industry and government.
These features will ensure that a council has the strategic capacity to govern effectively and partner with industry and State government to deliver key priorities.
The below criteria results are based on a 3 year average of Wagga Wagga City Council’s 2011/12, 2012/13 and 2013/14 actual financial results for General Fund only. A description of each of the seven ratios and commentary is shown right.
Fit for the futureimplications forcouncil.
fit for the future implications.
Benchmark Result Meets FFTF Benchmark
Sust
aina
bilit
y
Operating Performance Ratio (greater or equal to break-even average over 3 years)
-0.053 NO
Own Source Revenue Ratio (gretaer than 60% average over 3 years)
62.63% YES
Building and Infrastructure Asset Renewal Ratio (greater then 100% average over 3 years)
123.84% YESEf
fect
ive
Infr
astr
uctu
re a
nd
Serv
ice M
anag
ent
Infrastructure Backlog Ratio (less than 2%) 9.65% NO
Asset Maintenance Ratio 115% YES
Debt Service Ratio (greater than 0 and less than or equal to 20% average over 3 years)
2.04% YES
Effic
ienc
y A decrease in Real Operating Expenditure per capita over time Increasing NO
OVERALL RESULTCouncil does not meet all seven of the Fit for the Future Criteria
Operating Performance RatioOLG Benchmark = greater or equal to break-even (3yr average)
IPART Benchmark = between deficit of -3% to surplus of 10% (3yr average)
The Operating Performance Ratio is calculated as below:
This ratio is considered the core measure of financial sustainability by TCorp. It is an indication of a Councils continued capacity to meet on-going expenditure requirements. Operating Expenses for 2013/14 includes depreciation expense of approximately $22M.To meet this benchmark Council would need to increase revenue or decrease expenses, to improve its net operating result, by approximately $3M per year.
Operating Revenue (excluding capital grants) less operating expenses
Operating Revenue (excluding capital grants)

8 Long Term Financial Plan
It is key that there is a plan for Wagga Wagga City Council to improve this ratio in future years.
Note: Council is currently undergoing an asset revaluation and a possible change in depreciation methodology which will have an impact on the FFF ratios.
Own Source Revenue RatioOLG & IPART Benchmark = greater than 60% (3yr average)
The Own Source Revenue Ratio is calculated as below:
This ratio relates to Council’s reliance on external funding sources such as grants and contributions. Councils with higher own source revenue from user fees and charges and rates income would have greater ability to control operating performance and sustainability. This measure is highly sensitive to trends in capital grants and contributions. Councils result would be higher if there were no grant funding received such as flood work funding.
Building and Asset Renewal RatioOLG & IPART Benchmark = Greater than 100% (3yr average)
The Building and Asset Renewal Ratio is calculated as below:
The ratio compares the amount spent on infrastructure asset renewals and the assets deterioration. Performance of less than 100% indicates that the existing assets are deteriorating faster than they are being renewed. This ratio is dependent upon the depreciation methodology used (e.g. an adjustment to the useful life of assets can change the depreciation expense which would then change the result). It is also dependent on the classification of asset renewals and new assets (e.g. The result would improve if the assets are classed as renewals rather than new assets as new assets are excluded from the calculation).
Infrastructure Backlog RatioOLG & IPART Benchmark = Less than 2%
The Infrastructure Backlog Ratio is calculated as below:
This ratio indicates the backlog against the total value of Council’s assets. Concerns with this benchmark are that the measure may not be consistently reported across Councils due to the subjectivity of asset condition ratings.
Asset Renewals (Building & Infrastructure)
Depreciation (Building & Infrastructure)
Actual Asset Maintenance
Required Asset Maintenance
Estimated capital cost to bring assets to a satisfactory condition
(Written Down Value) Infrastructure, buildings, other structures
High backlog ratios indicate increased pressures in maintaining service delivery and financing future infrastructure demands.
In order to determine which assets are in a satisfactory condition, the following asset ratings are used:
1: Excellent No work required (normal maintenance)2: Good Only minor maintenance work required3: Average Maintenance work required4: Poor Renewal required5: Very poor Urgent renewal / upgrading requiredCurrently, Council has a satisfactory condition rating for assets at a 3. If it was decided that the satisfactory condition was a 4 or a 5, the backlog ratio would reduce significantly.
There is potential for the written down value of infrastructure assets to also change this ratio as a result of the revaluation process.
Asset Maintenance RatioOLG & IPART Benchmark = Greater than 100% (3yr average)
The Asset Maintenance Ratio is calculated as below:
This ratio reflects the actual asset maintenance expenditure relative to the asset maintenance required to keep the asset at its current condition. A ratio of less than 100% indicates that this may increase the worsening infrastructure backlog recorded for the last ratio. Note: The data to support the calculation of Required Asset Maintenance is sourced from the 2010 Asset Management Plans which is currently under review.
Debt Service RatioOLG & IPART Benchmark = Greater than 0 and less than 20% (3yr average)
The Debt Service Ratio is calculated as below:
This ratio represents Council’s ability to fund loan repayments and spread the cost of assets over future generations of ratepayers. The result is low due to the majority of Councils borrowings being related to the Sewer fund. This ratio will increase in future years with the utilisation of borrowings for the RIFL project and MPS projects.
Loan repayments
Operating revenue (less capital grants)
Operating Revenue (excluding all grants)
Operating Revenue (including capital & operating grants)
fit for the future implications.

9 Long Term Financial Plan
Operating Expenditure
Population
Operating Expenditure per capitaOLG & IPART Benchmark = A decrease in operating expenditure per capita over time
The Operating Expenditure per capita is calculated as below:
It is difficult to measure productivity changes over time. Assuming that service levels remain constant, decline in expenditure per capita indicates efficiency improvements. This ratio is based on a 5 year trend given that efficiency improvements require some time for the results to be fully achieved. Council has not met this ratio over the past few years as a result of increased expenditure due to flood works.
While preparing the 2015/25 LTFP, Wagga Wagga City Council has been committed to improving our financial position and sustainability. With the introduction of the Fit for the Future program, maintaining or improving our current working funds result, achieving a balanced or preferably a surplus budget each year have been key contributors in the decision making process.
Fit For the Future - Council Improvement ProposalAs a part of Council’s Fit For the Future submission, Council is required to propose strategies and outcomes that will improve Council’s financial sustainability.
Strategies that Council may look at implementing to improve our position include but are not limited to:
• Service Reviews across the organisation
• Special Rate Variations
• User Fee Increases
• Sharing of Services
• Asset Recycling
fit for the future implications.

10 Long Term Financial Plan
Council is committed to operating in a financially sustainable framework, to ensure that its community and other stakeholders can rely upon the ongoing provision of a full and diverse range of high quality community services, facilities and infrastructure.
Council plans to maintain its financial position and performance, to ensure resilience and a capacity to adapt and respond to arising community needs in a measured and equitable manner.
Key principles employed in the financial planning process:
Financial Strategy 1Financial SustainabilityOver the past few years, Council has faced significant challenges in maintaining a stable position in previous LTFPs. The 2014/24 LTFP highlighted that Council had commenced the critical decision making in adjusting its operations and ensuring a more financially sustainable path by forecasting surplus budgets up to 2019/20 with the remaining four years of the plan forecasting deficit budgets. The announcement in May 2014 of the freeze on the indexation of the Financial Assistance Grant added further pressure on trying to remain financially sustainable into the future. Council has made significant budget savings which demonstrate its commitment to remaining financially sustainable.
Balanced BudgetsWith each annual budget process Council aims to achieve, at a minimum, a balanced budget which allows Council to maintain a positive working funds balance. This position gives Council the flexibility to maintain liquidity and fund unforeseen expenditures or discretionary funding deficits.
The Base Case budget detailed in the Long Term Financial Plan indicates Council will maintain a balance budget over the next two financial years, with the remaining years (Surplus)/Deficits presented below:
15/16 16/17 17/18 18/19 19/20(Surplus) / Deficit 0 0 (384,812) (571,924) (95,319)
20/21 21/22 22/23 23/24 24/25(Surplus) / Deficit 11,794 (6,068) 278,796 (53,148) (472,287)
Arriving at mainly Surplus positions over the ten years was a complex and challenging task with each area of the organisation having to contribute significant budget reductions and operational efficiencies to achieve this goal. These savings will have a substantial impact on the delivery of projects and services, which will require Council to be highly innovative and efficient in delivering the Operational Plan and Delivery Plan items.
Although Council has managed to arrive at balanced budgets for the next two financial years, it maintains a heavy reliance on Capital Grants and Contributions. Figure 1 details Councils Deficits before accounting for Capital Grants and Contributions:
our financialStrategY
Figure 1: Council’s increasing deficits before Capital Grants and Contributions.
our financial strategy.
0
2
4
6
8
10
12
14
2015/16 2016/17 2017/18 2018/19 2019/20 2020/21 2021/22 2022/23 2023/24 2024/25
MILL
IONS

11 Long Term Financial Plan
Maintain Current Working FundsWorking funds represent a measure of liquidity/net financial position. Council’s working capital allows for day to day liquidity and ensures Council is able to survive any budget shocks during the year – i.e. expenditure overruns and income shortfalls. Council as a prudent financial manager has set a minimum level of $3.5M at which its working capital should be maintained. This level of working capital ensures Council retains an appropriate level of liquidity on an ongoing basis and is able to control/determine the value of its annual budget surplus or deficit. Forecasts of Council’s available working funds as per the base case budget are shown below:
As you can see from Figure 2, Council still has some work to do for the 2017/18 and future year’s budgets to ensure Council’s working funds position remains at a minimum, the $3.5M target.
Financial Strategy 2Prudent financial investmentCouncil will continue to carefully manage its cash reserves and investments, to ensure that appropriate financial reserves are available to meet the City’s liabilities and commitments, and manage cash flow demands to ensure responsible financial management control. While externally restricted reserves will be maintained in accordance with legislative requirements, a number of internally restricted reserves are used to ensure that funds are set aside to directly support Council’s Community Strategic Plan initiatives and projects.
Council will closely monitor its investment performance and publish a number of key financial indicators within its monthly and quarterly budget reviews to demonstrate its financial health and sustainability.
Financial Strategy 3Effective utilisation of funding sources to fund capital worksCouncil’s Long Term Capital Works Program identifies the various funding sources proposed for each capital project. Where available, Council will utilise grant funding, internal reserves where applicable, and borrowings where valid.
Financial Strategy 4Maintain tight control over expenditure and staff numbers, while still maintaining best value services, facilities and infrastructureCouncil has committed to undertake a detailed Operational and Efficiency Review of its service delivery. Specifically, Council is seeking to identify if the services it delivers are relevant and necessary to their community as well as appropriate in the current environment. This includes determining if the services meet the needs and expectations of the community articulated in the Community Strategic Plan (CSP).
The Service Review process aims to achieve the following objectives:
• Assist in informing Councillors, the community and Council staff on what, how and why Council delivers the current list of services. It endeavours to answer questions surrounding the need to provide the service, service delivery alternatives such as contracting resources, outsourcing some activities, joint delivery with other Councils, what can be provided at what cost and can any efficiencies be found.
Figure 2: Council’s estimated unrestricted working funds.
our financial strategy.
2024/25 2023/24 2022/23 2021/22 2020/21 2019/20 2018/19 2017/18 2016/17 2015/16Budget Budget Budget Budget Budget Budget Budget Budget Budget Budget
0
500
1,000
1,500
2,000
2,500
3,000
3,500
4,000
THOU
SAND
S

12 Long Term Financial Plan
• Finding savings that are real, sustainable, and are able to be entrenched into future budgets. This strategic approach to budget management is to identify lasting solutions for the provision of services in contrast to common short term budget management strategies which include delaying the implementation of projects or unfunded activities, or by making budget cuts that may not align with the CSP.
• Continue moving the organisational culture to one of a “can do attitude & approach”. By creating an expectation of better service delivery, Council is empowering its staff with the tools and processes to make better decisions.
• Embedding the realisation of continuous improvement. In providing an environment where continuous improvement to service delivery is expected, staff are encouraged and supported to identify opportunities to make Council services the best value for its community.
• Identifying a clear set of recommendations on proposed changes following each service reviewed. These recommendations will include as a minimum consideration of options for costs and efficient service delivery which may include process, resourcing and delivery changes.
Council is still in the early stages of the Service Review process. Of the 65 broadly defined Key Service Areas, two reviews have been completed with recommendations being considered by Management.
A number of other initiatives have been implemented to assist in identifying budget efficiencies, which include:
• Targeted savings for employee costs
• Review of fees and charges to ensure closer alignment with costs
• Energy savings and carbon reduction initiatives
• EBusiness and online service initiatives
• Improved information management systems and technology
• Review of capital project processes, procedures and outcomes
• Utilisation of allowable reserves for internal loans in preference to external borrowings where possible
Financial Strategy 5Maintain/move towards above benchmark results against key performance indicatorsAs indicated in Wagga Wagga City Council’s Fit for the Future Criteria Results which are based on a three year average, Council does not meet four out of the seven benchmarks. The scenarios which we have developed indicate special rate variations which will improve the Operating Performance Ratio. Council recommends in Scenarios 3 and 4 that the additional revenue received under a special rate variation will be utilised to decrease the infrastructure backlog, which will improve the Building and Infrastructure Asset Renewal Ratio; the Infrastructure Backlog Ratio; and the Asset Maintenance Ratio
Financial Strategy 6Narrow the Infrastructure Funding GapCouncil’s Asset Management Plan identifies a shortfall in current expenditure on the maintenance and renewal of infrastructure assets. This represents a risk to Council that a significant number of assets may fail due to inadequate maintenance. If this issue is not addressed it will have an adverse impact on Council’s financial position in the medium and longer term. Council is attempting to address this issue by:
• Increasing recurrent levels of maintenance and renewal budgets by identifying budget savings and efficiency gains from all parts of the organisation
• Maintaining a reserve for Infrastructure Replacement and allocating additional funds towards this reserve as a priority when budget improvements are realised, and allocating the proceeds from the sale of non-core assets
• Increasing the use of low cost borrowings to fund infrastructure renewals through the Local Government Infrastructure Renewal Scheme (LIRS)
• Reassessing asset condition and what constitutes “satisfactory” condition
our financial strategy.

13 Long Term Financial Plan
planning assumptions.
our planningassumptions.Population and DemographicsThe level of population increase and population demographics have a significant impact on demand for services, and are key drivers for Council’s planning for new infrastructure and the type of infrastructure incorporated in the LTFP. The data provided by the ABS reveals that Wagga Wagga has a population which is younger relative to the NSW state average. The proportion of the population aged 24 or less for Wagga Wagga is 37% compared with 31.6% for NSW. The proportion of the population aged over 60 is 19.1% compared with 21.1% for NSW.
This profile is reflected in Council’s ten year capital works program which places a heavy influence on facilities such as skate parks, sporting and recreation improvements and cultural events and activities
Economic Conditions and Growth Economic conditions and growth have a significant external impact to Wagga’s financial position and the LTFP. Some key factors include the following:
• The state of financial markets (including official interest rates)
• Inflation rates
• Labour force and unemployment rate
• Population growth rate
Interest rate fluctuations will have a direct impact on the returns earned on Councils investment portfolio.
Inflation rate fluctuations impact both income and expenditure and what products can be purchased for in real terms. When the general price level rises, each unit of currency buys fewer goods and services. Consequently, inflation reflects a reduction in the purchasing power per unit of money
The city’s labour force was comprised of just over 37,000 persons as at September 2014 and maintained an unemployment rate of 4.9% as at the same time period per the Department of Employment Sept 2014 Qtr results The unemployment rate of 4.9% compares favourably to the NSW average of 5.9%.
Over the next 20 years, Wagga Wagga is expected to grow steadily at an average annual rate of 1% to reach almost 80,000 residents by the year 2036.
Major ProjectsThe uncertainties around Council’s planned major projects have the potential to have a significant impact on the LTFP both in regards to timing and costings.
Riverina Intermodal Freight and LogisticsThe Riverina Intermodal Freight and Logistics (RIFL) hub project involves the construction of new major rail and road infrastructure and a freight terminal on 95 hectares of land north of Wagga Wagga at the Bomen Business Park. The project also includes the development of an agricultural bulk goods facility (grain terminal) and will be a key economic driver of growth in the Riverina.
Key project deliverables for the 2015/2016 financial year will include the finalisation of commercial models, customer agreements, constructions plans and project funding by late 2015. Stage 1 construction is proposed to commence in early 2016 which will include the construction of enabling roads, grain terminal and an intermodal terminal.
The uncertainties associated with the RIFL project continue to reduce as the project matures through the project phases.
Multi Purpose Stadium The scope of the project is to deliver two Multi Purpose Stadiums (both sport and conference facilities), the first site located at The Exhibition Centre, consisting of a large sports building next to the existing Netball Clubhouse. The facility will provide three full sized indoor multi purpose courts, offices, amenities and function area.
The second site is an expansion to the Bolton Park Stadium’s existing gymnasium building, with the construction of a large single level Police Citizen Youth Club (PCYC) housing judo, boxing, passive recreation and childcare areas. In addition to an entrance foyer and administrative/amenities areas the scope of the project includes modifications of the existing amenities.
Both these projects will have an approximate 50 week construction period (weather permitting) with a whole of project budget value of $12.6 million.
Levee Bank Upgrades - Upgrades of Main City Levee and North Wagga Levees (Not included in the base case data)Council recently completed detailed designs for the Main City and North Wagga Levee Upgrade Project and has resolved to proceed with the upgrade of the Main City Levee to a 1 in 100 year level of protection.
The full impact of upgrading the North Wagga Levee will be considered in a review of the Floodplain Risk Management Study.
Council remains committed to funding one-third of the cost of the upgrades and is awaiting the outcome of a funding application to the NSW Office of Environment and Heritage (NSW OEH) for the remaining cost.

14 Long Term Financial Plan
At this stage the design process the cost estimate is within plus or minus 20 – 30%.
This LTFP includes modelling for the following items:
1. Upgrade the Main City Levee to a 1 in 100 year level of protection – Estimated cost $17.6M
2. Upgrade the North Wagga Levee to a 1 in 100 year level of protection – Estimated cost $6.8M
As previously mentioned, no decision has been made on the extent of the upgrade to the North Wagga Levee.
The modelling assumes a construction period of five (5) years but this is conditional of the timing and conditions of funding from NSW OEH.
The capital costs have been indexed at a rate of 5% which is based on advice from NSW Public Works.
The total capital cost indexed over the five (5) year period is as follows:
ProjectIndexed Estimated Cost
Council’s one-third share
Upgrade of Main City Levee $17.6M $5.9M
Upgrade of North Wagga Levees $6.8M $2.2M
TOTAL $24.4M $8.1M
Funding options for Council’s one-third share:
1. Special Rate Variation (SRV). An additional rates levy applied to all rateable property owners within the Local Government Area over a five year period. This is Council’s preferred option however this option requires approval from the Independent Pricing and Regulatory Tribunal
2. Borrowings. This option will be applied in the event that the SRV is not approved by IPART
This provides an assurance by Council to fund its one-third share regardless of the result of the application to IPART.
This LTFP includes separate funding scenarios which include and exclude the North Wagga option.
planning assumptions.

15 Long Term Financial Plan
financial forecast assumptions.
FINANCIAL FORECAST ASSUMPTIONS – BASE CASE SCENARIO
financial forecast assumptions.
OPERATING revenueFigure 3 represents Council’s budgeted operating revenue for the 2015/16 financial year.
RatesThe Independent Pricing and Regulatory Tribunal (IPART) determine the rate peg based on a Local Government Cost Index, a productivity factor, as well as any other pertinent legislative and industry factors. This is to ensure that a balance is made between Council meeting the increasing costs of delivering services and that productivity gains are shared with ratepayers.
The base case scenario includes an ordinary rate increase for 2015/16 of 2.4% as announced by IPART, with a 1% growth in rateable properties for residential only. The assumed increase for 2016/17 onwards in line with rate pegging is 3% with an additional 1% growth factor (for residential only) in additional rateable properties for the LTFP.
The risk that Council may incur in relation to the amount of rates revenue forecast in the LTFP is that the rate peg announced annually by IPART may be below the assumed percentages Council has used.
Annual Charges – Domestic & Commercial WasteAnnual charges for Waste are modelled at recovering a reasonable estimated cost of providing the service which includes a component for future site rehabilitation. The rate used in the base case and all scenarios is an annual increase of 3%.
Sewer ChargesSewer charges are also modelled at recovering a reasonable estimated cost of providing the service which includes a component for future site rehabilitation. The rate used in the base case and all scenarios is:
For the first 3 years - 4.5% increase plus a 1% residential growth factor.
For the remaining 7 years - 2.5% increase plus a 1% residential growth factor.
Stormwater ServicesThe maximum amount for annual stormwater services is prescribed by legislation. This is currently $25 per residential & business property per annum, which is the amount used in the base case and all scenarios of the LTFP.
Grants & Contributions provided for Capital Purposes
Grants & Contributions provided for Operating Purposes
Other revenues
Interest & Investment Revenue
User charges & fees
Rates & Annual Charges
49%
3%
14%
19%
12%
3%
Figure 3: Source of Council’s operating revenue for 2015/16 financial year, displayed as percentage.
16 Long Term Financial Plan
financial forecast assumptions.
User Fees & ChargesThe base case scenario of the LTFP includes a projected increase in user fees and charges generally at 3%. A number of fees are prescribed by legislation and some fees are set at a level to recover the actual cost of providing the service. All fees have been reviewed in line with Council’s pricing policy.
Investment RevenueGiven the present volatility in global financial markets, and the relatively low cash rate it is difficult for Council to ascertain with certainty what actual returns are likely to be over the 10 years of the plan. It is not likely that Council can continue to rely on additional investment income over the life of the LTFP given the current balance of the portfolio, and the reserves that are identified to be expended. The reduction in investment income and overall portfolio balance places further funding pressures on Council in the future.
Council’s investment revenue is linked to the expected balance of the portfolio over the life of the LTFP. For the base case scenario, the projected interest rates to inform the LTFP are:
Years 1-3 – 3.75% - 3.94% Years 4-7 – 3.58% - 3.86% Years 8-10 – 3.70% - 3.98%
Grants & ContributionsIt is assumed in the base case scenario that the current level of grant funding from the State and Federal Governments will continue. Grants are a significant source of funding for local government and as such any fluctuation in current levels is likely to have a substantial effect on the delivery of services and projects identified in the LTFP.
The 3 year freeze on indexation for the Financial Assistance Grant has had a significant impact on our 2015/16 LTFP – $634K adjustment to 2015/16’s starting point. The base case and all scenarios assume that the indexation of the Financial Assistance Grant will recommence from 1 July 2017. The LTFP provides sensitivity analysis on a continuation of the freeze and indexation rates between 0 and 2.5%.
Developer ContributionsDeveloper contributions have been projected in line with each contribution plan over the life of the LTFP. Each of these plans is subject to review annually and the each iteration of the LTFP is updated accordingly.
Other RevenueOther revenue includes fines, income from sale of goods as well as diesel fuel rebates and income from insurance claims and rebates. Revenue from these sources is difficult to ascertain with any certainty as they are generally influenced by factors outside of Council’s control. As a result for the purposes of the LTFP other revenue has been projected at 3% which corresponds to historical trends.
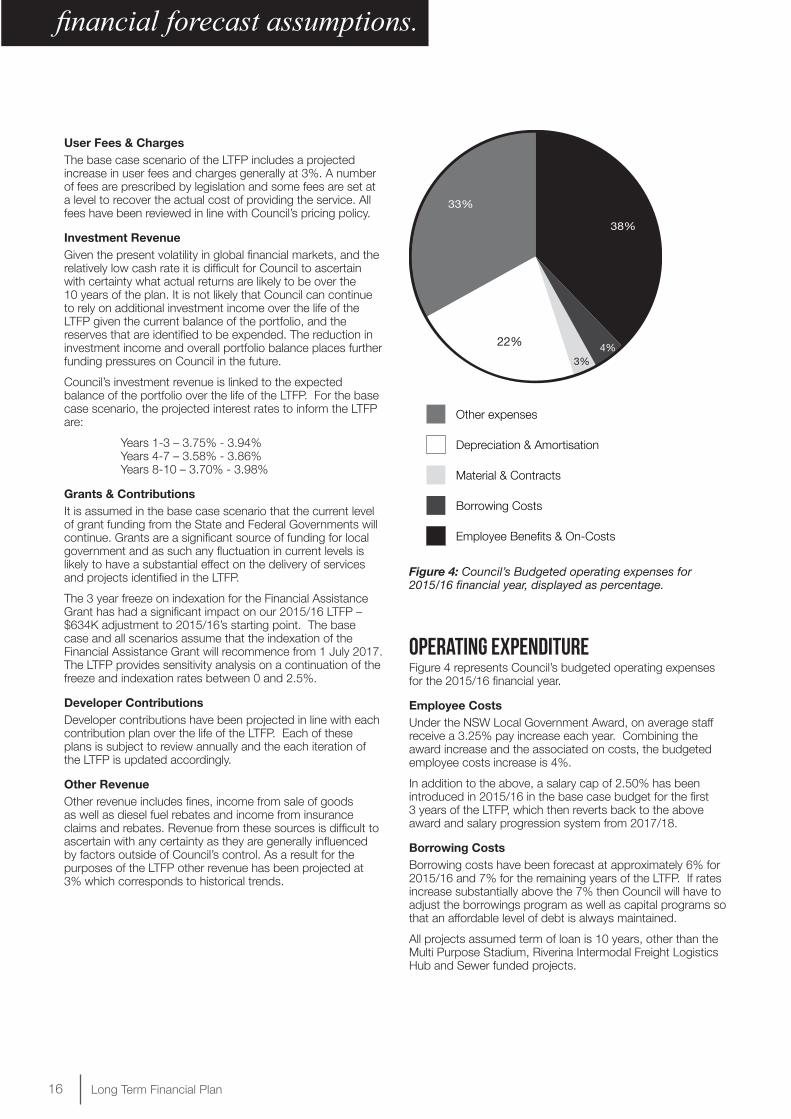
Other expenses
Depreciation & Amortisation
Material & Contracts
Borrowing Costs
Employee Benefits & On-Costs
38%
22%
33%
4%3%
OPERATING EXPENDITUREFigure 4 represents Council’s budgeted operating expenses for the 2015/16 financial year.
Employee CostsUnder the NSW Local Government Award, on average staff receive a 3.25% pay increase each year. Combining the award increase and the associated on costs, the budgeted employee costs increase is 4%.
In addition to the above, a salary cap of 2.50% has been introduced in 2015/16 in the base case budget for the first 3 years of the LTFP, which then reverts back to the above award and salary progression system from 2017/18.
Borrowing CostsBorrowing costs have been forecast at approximately 6% for 2015/16 and 7% for the remaining years of the LTFP. If rates increase substantially above the 7% then Council will have to adjust the borrowings program as well as capital programs so that an affordable level of debt is always maintained.
All projects assumed term of loan is 10 years, other than the Multi Purpose Stadium, Riverina Intermodal Freight Logistics Hub and Sewer funded projects.
Figure 4: Council’s Budgeted operating expenses for 2015/16 financial year, displayed as percentage.

17 Long Term Financial Plan
financial forecast assumptions.
Figure 5: Council’s Operating Revenue and Expenditure.
MILL
IONS
0
40
20
60
80
100
120
140
160
Expenses from continuing operations
Grants & contributions provided for capital purposes
Grants & contributions provided for operating purposes
Other revenues
Interest & investment revenue
User charges & fees
Rates & annual charges
2024/25 2023/24 2022/23 2021/22 2020/21 2019/20 2018/19 2017/18 2016/17 2015/16
Materials & ContractsThe cost of materials and contracts is to be maintained within existing budgets.
UtilitiesAn increase has been projected in the LTFP for electricity, gas and water costs of 9% per annum. Council is actively pursuing efficient alternative sources of energy in order to reduce the effect of these costs where possible and these projected savings have been included in the LTFP.
InsuranceIt has been assumed that insurance premiums will increase at 5% per annum, with liability insurance assumed at 7%.
DepreciationDepreciation is forecast to increase by 5.65% each year of the LTFP. This is reflective of the new capital additions and purchases over the term of the LTFP. Depreciation levels are subject to ongoing review with each LTFP.
Council is currently undergoing an asset revaluation and a possible change in depreciation methodology which may have an impact on the depreciation expense forecasts.
Other Operating ExpensesThe cost of other operating expenses is to be maintained within existing budgets.
Figure 5 demonstrates the relationship between operating revenue and operating expenditure.
18 Long Term Financial Plan
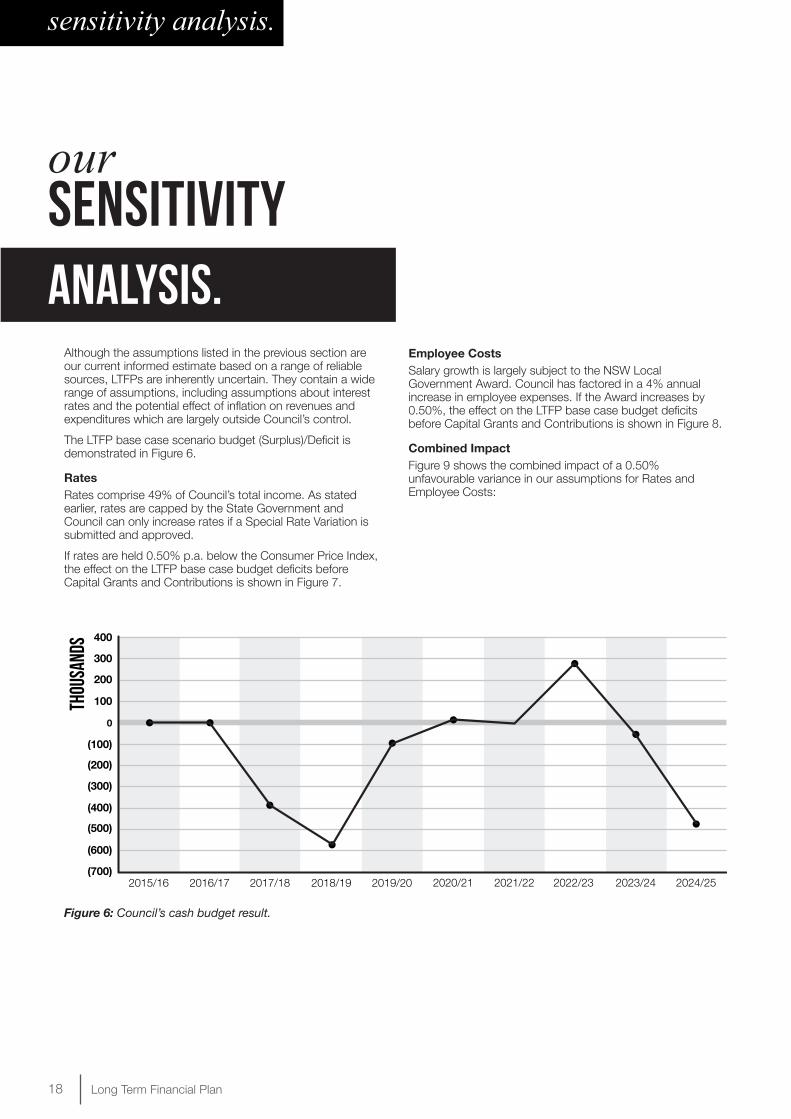
Although the assumptions listed in the previous section are our current informed estimate based on a range of reliable sources, LTFPs are inherently uncertain. They contain a wide range of assumptions, including assumptions about interest rates and the potential effect of inflation on revenues and expenditures which are largely outside Council’s control.
The LTFP base case scenario budget (Surplus)/Deficit is demonstrated in Figure 6.
RatesRates comprise 49% of Council’s total income. As stated earlier, rates are capped by the State Government and Council can only increase rates if a Special Rate Variation is submitted and approved.
If rates are held 0.50% p.a. below the Consumer Price Index, the effect on the LTFP base case budget deficits before Capital Grants and Contributions is shown in Figure 7.
sensitivity analysis.
our sensitivityanalysis.
Figure 6: Council’s cash budget result.
Employee CostsSalary growth is largely subject to the NSW Local Government Award. Council has factored in a 4% annual increase in employee expenses. If the Award increases by 0.50%, the effect on the LTFP base case budget deficits before Capital Grants and Contributions is shown in Figure 8.
Combined ImpactFigure 9 shows the combined impact of a 0.50% unfavourable variance in our assumptions for Rates and Employee Costs:
(100)
0
100
200
300
400
(200)
(300)
(400)
(500)
(600)
(700)
THOU
SAND
S
2015/16 2016/17 2017/18 2018/19 2019/20 2020/21 2021/22 2022/23 2023/24 2024/25

19 Long Term Financial Plan
sensitivity analysis.
Figure 7: The impact of rate pegging on Council’s cash budget result
Figure 8: The impact of employee award increases on Council’s cash budget result
Figure 9: Combined impact of unfavourable variances on Council’s cash budget result.
0
(2)
(4)
(6)
(8)
(10)
(12)
(14)
(16)
(18)2015/16
Employee Costs @ 4% Employee Costs @ 4.5%
2016/17 2017/18 2018/19 2019/20 2020/21 2021/22 2022/23 2023/24 2024/25
MILL
IONS
0
(2)
(4)
(6)
(8)
(10)
(12)
(14)
(16)2015/16 2016/17 2017/18 2018/19 2019/20 2020/21 2021/22 2022/23 2023/24 2024/25
Forecast Rates @ Rate Peg Forecast Rates @ 0.5% pa under Rate Peg
MILL
IONS
Existing budget Forecast rates and employee costs varying by 0.5%
0
(2)
(4)
(6)
(8)
(10)
(12)
(14)
(16)
(18)
(20)2015/16 2016/17 2017/18 2018/19 2019/20 2020/21 2021/22 2022/23 2023/24 2024/25
MILL
IONS

20 Long Term Financial Plan
base case scenario
The commentary and analysis provided in the document to this point describe the base model of the Long Term Financial Plan. It is this model inclusive of the previously detailed assumptions that will be recommended to Council for adoption.
scenariobase case

21 Long Term Financial Plan
LONG
TERM
FINA
NCIA
L PLA
N - B
ASE C
ASE S
CENA
RIO
BUDG
ET
2015
/16
BUDG
ET
2016
/17
BUDG
ET
2017
/18
BUDG
ET
2018
/19
BUDG
ET
2019
/20
BUDG
ET
2020
/21
BUDG
ET
2021
/22
BUDG
ET
2022
/23
BUDG
ET
2023
/24
BUDG
ET
2024
/25
Rev
enue
Fro
m C
ont
inui
ng O
per
atio
ns
Rat
es &
Ann
ual C
harg
es(5
6,80
1,51
8)(5
8,85
7,22
7)(6
0,98
9,73
9)(6
3,08
9,46
1)(6
5,26
3,00
5)(6
7,51
3,02
2)(6
9,84
2,25
4)(7
2,25
3,54
8)(7
4,74
9,65
5)(7
7,33
3,82
1)
Use
r C
harg
es &
Fee
s(2
2,02
9,24
9)(2
3,49
9,88
7)(2
5,25
6,14
7)(2
6,17
6,95
0)(2
7,16
1,25
9)(2
8,17
2,01
4)(2
9,08
2,16
8)(3
0,00
4,65
1)(3
0,95
8,99
3)(3
1,94
6,92
8)
Inte
rest
& In
vest
men
t Rev
enue
(3,3
57,7
02)
(3,9
98,8
65)
(4,5
10,2
56)
(4,3
71,9
15)
(4,6
68,4
48)
(4,7
94,4
34)
(5,0
01,8
46)
(4,9
32,1
12)
(5,1
22,8
08)
(5,4
30,7
30)
Oth
er R
even
ues
(2,9
44,7
55)
(3,0
35,3
00)
(3,1
30,2
21)
(3,1
94,5
09)
(3,2
60,7
20)
(3,3
28,9
16)
(3,3
98,4
01)
(3,4
69,7
11)
(3,5
42,9
00)
(3,6
17,9
70)
Gra
nts
& C
ontr
ibut
ions
pro
vide
d fo
r O
pera
ting
Pur
pose
s(1
4,15
7,66
7)(1
4,13
2,58
3)(1
4,59
2,51
5)(1
5,01
3,63
2)(1
5,34
6,03
6)(1
5,74
0,07
2)(1
6,19
6,09
6)(1
6,56
2,47
6)(1
6,99
3,59
3)(1
7,43
7,83
5)
Gra
nts
& C
ontr
ibut
ions
pro
vide
d fo
r C
apita
l Pur
pose
s(1
5,95
6,38
3)(1
0,35
3,33
9)(6
,792
,765
)(7
,040
,702
)(6
,908
,198
)(6
,945
,299
)(7
,016
,053
)(7
,089
,510
)(7
,168
,721
)(7
,230
,737
)
Rev
enue
Fro
m C
ont
inui
ng
Op
erat
ions
(115
,247
,273
)(1
13,8
77,2
01)
(115
,271
,644
)(1
18,8
87,1
69)
(122
,607
,666
)(1
26,4
93,7
56)
(130
,536
,817
)(1
34,3
12,0
08)
(138
,536
,670
)(1
42,9
98,0
22)
Exp
ense
s Fr
om
Co
ntin
uing
Op
erat
ions
Em
ploy
ee B
enefi
ts &
On-
Cos
ts41
,102
,148
42,3
43,7
9143
,789
,029
45,7
70,8
0647
,538
,197
49,6
67,5
4351
,914
,944
53,9
82,3
3756
,132
,416
58,3
68,4
90
Bor
row
ing
Cos
ts4,
373,
955
5,26
1,71
65,
730,
899
5,69
1,50
65,
657,
703
5,57
0,78
75,
425,
134
5,35
1,36
34,
941,
357
4,52
3,24
5
Mat
eria
ls &
Con
trac
ts2,
925,
694
2,55
6,43
22,
851,
139
2,71
2,90
52,
747,
062
2,61
8,95
72,
705,
160
2,56
4,45
52,
622,
626
2,48
0,39
6
Dep
reci
atio
n &
Am
ortis
atio
n23
,810
,744
25,1
56,0
5226
,577
,368
28,0
78,9
9029
,665
,453
31,3
41,5
5133
,112
,348
34,9
83,1
9636
,959
,747
39,0
47,9
72
Oth
er E
xpen
ses
35,7
98,0
7736
,299
,520
36,7
48,0
9137
,841
,802
38,4
85,4
6040
,178
,665
40,4
31,3
8341
,491
,782
42,7
41,3
3044
,328
,644
Exp
ense
s Fr
om
Co
ntin
uing
O
per
atio
ns10
8,01
0,62
011
1,61
7,51
011
5,69
6,52
712
0,09
6,00
912
4,09
3,87
512
9,37
7,50
313
3,58
8,97
013
8,37
3,13
314
3,39
7,47
614
8,74
8,74
8
Net
Op
erat
ing
(Pro
fit)
/Lo
ss(7
,236
,653
)(2
,259
,691
)42
4,88
31,
208,
840
1,48
6,21
02,
883,
747
3,05
2,15
34,
061,
125
4,86
0,80
65,
750,
725
base case scenario

22 Long Term Financial Plan
LONG
TERM
FINA
NCIA
L PLA
N - B
ASE C
ASE S
CENA
RIO
BUDG
ET
2015
/16
BUDG
ET
2016
/17
BUDG
ET
2017
/18
BUDG
ET
2018
/19
BUDG
ET
2019
/20
BUDG
ET
2020
/21
BUDG
ET
2021
/22
BUDG
ET
2022
/23
BUDG
ET
2023
/24
BUDG
ET
2024
/25
Cap
ital
and
Res
erve
Mo
vem
ents
Cap
ital E
xpen
ditu
re -
Ren
ewal
s15
,471
,291
17,6
89,0
5919
,692
,794
19,2
74,2
3119
,366
,088
18,1
52,8
0918
,172
,962
19,2
02,6
5919
,204
,511
19,4
52,7
38
Cap
ital E
xpen
ditu
re -
New
P
roje
cts
36,0
75,0
7021
,238
,113
7,92
8,25
88,
088,
354
8,28
6,32
56,
140,
379
5,28
8,06
81,
177,
803
538,
000
4,88
8,00
0
Loan
Rep
aym
ents
2,61
4,35
13,
592,
909
4,03
2,76
14,
311,
867
4,63
1,71
14,
971,
708
5,49
8,60
56,
252,
783
6,20
8,63
66,
016,
381
New
Loa
n B
orro
win
gs(1
8,60
4,09
9)(1
0,38
2,16
4)(3
,387
,891
)(3
,156
,220
)(3
,279
,761
)(2
,751
,806
)(4
,215
,133
)0
00
Pro
ceed
s fro
m S
ale
of in
tang
ible
&
tang
ible
Ass
ets
(3,6
70,9
50)
(3,7
57,7
90)
(3,2
97,0
00)
(1,4
70,0
00)
(1,0
50,0
00)
(1,0
50,0
00)
(1,0
50,0
00)
(1,0
50,0
00)
(1,0
50,0
00)
(1,0
50,0
00)
Net
Mov
emen
ts to
/(fro
m)
Res
erve
s(8
38,2
65)
(964
,385
)79
8,75
3(7
50,0
05)
129,
561
3,00
6,50
96,
359,
626
5,61
7,62
27,
144,
646
3,51
7,84
1
Tota
l Cap
ital
and
Res
erve
M
ove
men
ts31
,047
,398
27,4
15,7
4225
,767
,674
26,2
98,2
2628
,083
,924
28,4
69,5
9830
,054
,128
31,2
00,8
6732
,045
,793
32,8
24,9
60
Net
Res
ult
afte
r D
epre
ciat
ion
23,8
10,7
4525
,156
,051
26,1
92,5
5727
,507
,066
29,5
70,1
3431
,353
,345
33,1
06,2
8135
,261
,992
36,9
06,5
9838
,575
,686
Ad
d b
ack
Dep
reci
atio
n E
xpen
se (n
on-
cash
)23
,810
,744
25,1
56,0
5226
,577
,368
28,0
78,9
9029
,665
,453
31,3
41,5
5133
,112
,348
34,9
83,1
9636
,959
,747
39,0
47,9
72
Cas
h B
udg
et (S
urp
lus)
/Defi
cit
0(0
)(3
84,8
12)
(571
,924
)(9
5,31
9)11
,794
(6,0
68)
278,
796
(53,
148)
(472
,287
)
base case scenario

23 Long Term Financial Plan
scenario 1.
SCENARIO 1a).Upgrade Main City Levee – funded by Special Rate VariationMain City Levee Project budget - $17.6MAs mentioned earlier in this plan, the upgrade of both the Main City Levee and the North Wagga Levee are not included in the base case budget.
Scenario 1a) uses the base case budget data plus a special rate variation to cover Council’s expenditure to upgrade the Main City Levee. Council’s preference for this project is for a
scenario 1A.
Additional rates income - apply for srv for 2016/17 to upgrade main city levee16/17 17/18 18/19 19/20 20/21 21/22 22/23 23/24 24/25 total-1,050,881 -1,139,058 -1,173,230 -1,208,426 -1,244,679 0 0 0 0 -5,871,274
funding commitment to be secured from both the Federal and State Governments prior to the commencement of the works. If government grants are secured, Council proposes to fund its share of the funding for the project via an SRV to upgrade the levee.
Rates for 2016/17 under this scenario are proposed to be:
2016/17 Rate Peg 3.00%
2016/17 SRV % increase 2.86%
2016/17 Total Rates increase 5.86%
Future year’s rates are proposed to be set at the rate peg of 3%.
SCENARIO 1B).Upgrade Main City Levee – funded by Loan BorrowingsMain City Levee Project budget - $17.6MScenario 1b) uses the same data as Scenario 1a) however in the event a Special Rate Variation is not submitted and/or approved by IPART, Council would drawdown on loan
scenario 1b.borrowings. The below table illustrates the loan advances over the five years, and the applicable loan repayments over the LTFP.
The assumption used for the potential loan borrowings is 7% over a 14 year loan period (timing of funds drawn down is reflective of the five (5) year construction period).
additional income - funded by loan borrowings16/17 17/18 18/19 19/20 20/21 21/22 22/23 23/24 24/25
Main City Levee only -1,050,881 -1,139,058 -1,173,230 -1,208,426 -1,244,679 0 0 0 0
Borrowing Repayments 0 166,052 332,104 498,156 664,209 830,261 830,261 830,261 830,261

24 Long Term Financial Plan
scenario 2A.
scenario 2b.
scenario 2.
SCENARIO 2a). Upgrade Main City Levee + North Wagga Levee – funded by Special Rate VariationMain City Levee - North Wagga Levee Project budget - $24.4MScenario 2a) uses the base case budget data plus a special rate variation to cover Council’s expenditure to upgrade the Main City Levee and the North Wagga Levee. Council’s preference for these projects is for a funding commitment to be secured from both the Federal and State Governments
16/17 17/18 18/19 19/20 20/21 21/22 22/23 23/24 24/25Main City + North Wagga Levee
-1,554,700 -1,632,435 -1,714,057 -1,799,760 -1,417,605 0 0 0 0
Borrowing Repayments
0 228,109 456,219 684,328 912,437 1,140,547 1,140,547 1,140,547 1,140,548
Additional rates income - apply for srv for 2016/17 to upgrade main city levee16/17 17/18 18/19 19/20 20/21 21/22 22/23 23/24 24/25 total-1,554,700 -1,632,435 -1,714,057 -1,799,760 -1,417,605 0 0 0 0 -8,118,556
prior to the commencement of the works. If government grants are secured, Council proposes to fund its share of the funding for the project via an SRV to upgrade the levees.
Rates for 2016/17 under this scenario are proposed to be:
2016/17 Rate Peg 3.00%
2016/17 SRV % increase 3.95%
2016/17 Total Rates increase 6.95%
Future year’s rates are proposed to be set at the rate peg of 3%
SCENARIO 2b). Upgrade Main City Levee + North Wagga Levee – funded by Loan BorrowingsMain City Levee - North Wagga Levee Project budget - $24.4MScenario 2b) uses the same data as Scenario 2a) however
in the event a Special Rate Variation is not submitted and/or approved by IPART, Council would drawdown on loan borrowings. The below table illustrates the loan advances over the five years, and the applicable loan repayments over the LTFP.
The assumption used for the potential loan borrowings is 7% over a 14 year loan period (timing of funds drawn down is reflective of the five (5) year construction period).

25 Long Term Financial Plan
scenario 3A.
scenario 3.
SCENARIO 3a). Upgrade Main City Levee – funded by Special Rate Variation; Plus a further Special Rate Variation commencing 2021/22 to fund Road Renewals
Main City Levee Project budget - $17.6MScenario 3a) uses the base case budget data plus a special rate variation to cover Council’s expenditure to upgrade the Main City Levee. Council’s preference for this project is for a funding commitment to be secured from both the Federal and State Governments prior to the commencement of the works. If government grants are secured, Council proposes to fund its share of the funding for the project via an SRV to upgrade the levee.
16/17 17/18 18/19 19/20 20/21 21/22 22/23 23/24 24/25 TOTALMain City + North Wagga Levee
-1,050,881 -1,139,058 -1,173,230 -1,208,426 -1,244,679 0 0 0 0 -5,871,274
6% used to fund Road Renewals
0 0 0 0 0 -2,666,537 -4,206,160 -5,879,550 -7,695,973 20,448,220
Scenario 3a) also proposes a further 6% Special Rate Variation commencing in the 2021/22 year. The additional funds received under the 2nd Special Rate Variation will be used to fund further Road Renewals to assist in narrowing the infrastructure gap.
Rates under this scenario are proposed to be:
2016/17
2016/17 Rate Peg 3.00%
2016/17 SRV % increase 2.86%
2016/17 Total Rates increase 5.86%
2017/18 – 2020/212017/18 - 2020/21 Rate Peg 3.00%
2021/22 – 2024/252021/22 – 2024/25 Rate Peg 3.00%
2021/22 – 2024/25 SRV % increase 3.00%
2021/22 – 2024/25 Annual Rates increase 6.00%

26 Long Term Financial Plan
scenario 3b.
scenario 3.
SCENARIO 3B). Upgrade Main City Levee – funded by Loan Borrowings; Plus a further Special Rate Variation commencing 2021/22 to fund Road Renewals
Main City Levee Project budget - $17.6MScenario 3b) uses the same data as Scenario 3a) however in the event a Special Rate Variation is not submitted and/or approved by IPART, Council would drawdown on loan borrowings. The below table illustrates the loan advances over the five years for the Main City Levee, and the applicable loan repayments over the LTFP.
The assumption used for the potential loan borrowings is 7% over a 14 year loan period (timing of funds drawn down is
reflective of the five (5) year construction period).
Scenario 3b) also proposes a further 6% Special Rate Variation commencing in the 2021/22 year. The additional funds received under the 2nd Special Rate Variation will be used to fund further Road Renewals to assist in narrowing the infrastructure gap.
Rates under this scenario are proposed to be:
2016/17 – 2020/212016/17 – 2020/21 Rate Peg 3.00%
2021/22 – 2024/252021/22 – 2024/25 Rate Peg 3.00%
2021/22 – 2024/25 SRV % increase 3.00%
2021/22 – 2024/25 Annual Rates increase 6.00%
16/17 17/18 18/19 19/20 20/21 21/22 22/23 23/24 24/25Main City Levee only
-1,050,881 -1,139,058 -1,173,230 -1,208,426 -1,244,679 0 0 0 0
6% used to fund Road Renewals
0 0 0 0 0 -2,666,537 -4,206,160 -5,879,550 -7,695,973
Borrowing Repayments
0 166,052 332,104 498,156 664,209 830,261 830,261 830,261 830,261
27 Long Term Financial Plan
scenario 4A.
scenario 4.
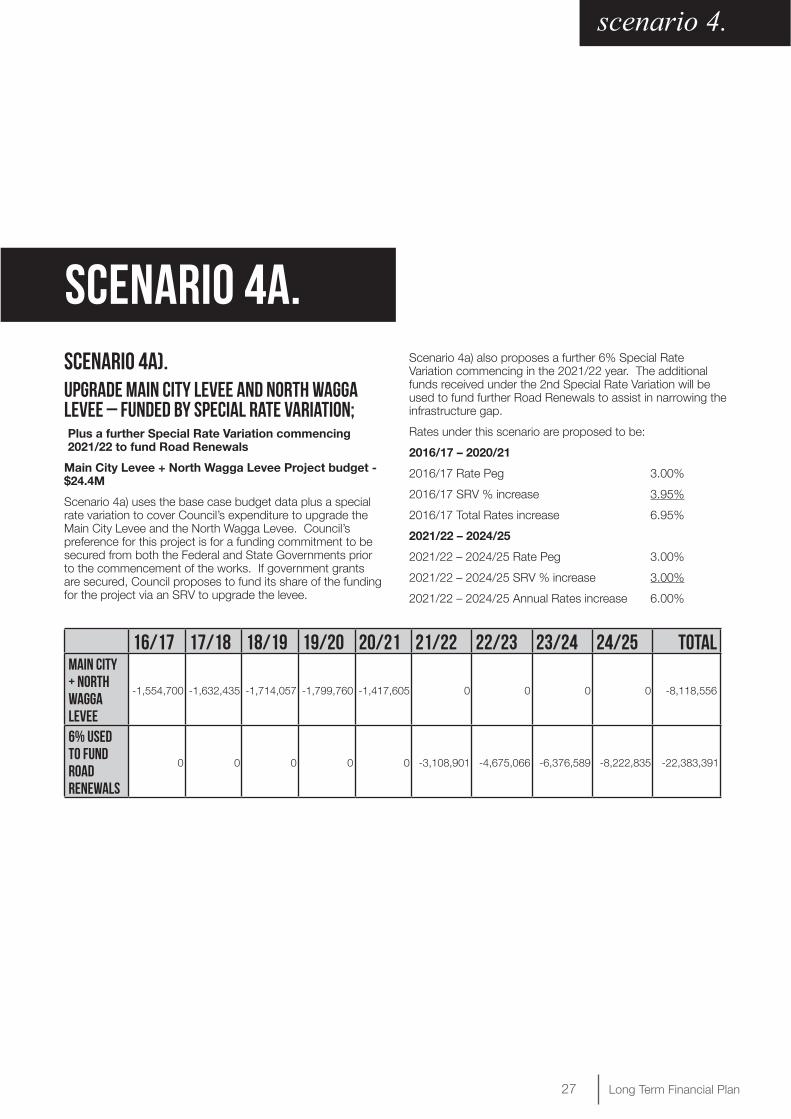
SCENARIO 4A). Upgrade Main City Levee and North Wagga Levee – funded by Special Rate Variation; Plus a further Special Rate Variation commencing 2021/22 to fund Road Renewals
Main City Levee + North Wagga Levee Project budget - $24.4M
Scenario 4a) uses the base case budget data plus a special rate variation to cover Council’s expenditure to upgrade the Main City Levee and the North Wagga Levee. Council’s preference for this project is for a funding commitment to be secured from both the Federal and State Governments prior to the commencement of the works. If government grants are secured, Council proposes to fund its share of the funding for the project via an SRV to upgrade the levee.
Scenario 4a) also proposes a further 6% Special Rate Variation commencing in the 2021/22 year. The additional funds received under the 2nd Special Rate Variation will be used to fund further Road Renewals to assist in narrowing the infrastructure gap.
Rates under this scenario are proposed to be:
2016/17 – 2020/21
2016/17 Rate Peg 3.00%
2016/17 SRV % increase 3.95%
2016/17 Total Rates increase 6.95%
2021/22 – 2024/25
2021/22 – 2024/25 Rate Peg 3.00%
2021/22 – 2024/25 SRV % increase 3.00%
2021/22 – 2024/25 Annual Rates increase 6.00%
16/17 17/18 18/19 19/20 20/21 21/22 22/23 23/24 24/25 TOTALMain City + North Wagga Levee
-1,554,700 -1,632,435 -1,714,057 -1,799,760 -1,417,605 0 0 0 0 -8,118,556
6% used to fund Road Renewals
0 0 0 0 0 -3,108,901 -4,675,066 -6,376,589 -8,222,835 -22,383,391

28 Long Term Financial Plan
SCENARIO 4b). Upgrade Main City Levee and North Wagga Levee – funded by Loan Borrowings; Plus a further Special Rate Variation commencing 2021/22 to fund Road Renewals
Main City Levee + North Wagga Levee Project budget - $24.4M
Scenario 4b) uses the same data as Scenario 4a) however in the event a Special Rate Variation is not submitted and/or approved by IPART, Council would drawdown on loan borrowings. The below table illustrates the loan advances over the five years for the Main City and North Wagga Levee, and the applicable loan repayments over the LTFP.
The assumption used for the potential loan borrowings is 7% over a 14 year loan period (timing of funds drawn down is
reflective of the five (5) year construction period).
Scenario 4b) also proposes a further 6% Special Rate Variation commencing in the 2021/22 year. The additional funds received under the 2nd Special Rate Variation will be used to fund further Road Renewals to assist in narrowing the infrastructure gap.
Rates under this scenario are proposed to be:
2016/17 – 2020/212016/17 – 2020/21 Rate Peg 3.00%
2021/22 – 2024/252021/22 – 2024/25 Rate Peg 3.00%
2021/22 – 2024/25 SRV % increase 3.00%
2021/22 – 2024/25 Annual Rates increase 6.00%
scenario 4b.
scenario 4.
16/17 17/18 18/19 19/20 20/21 21/22 22/23 23/24 24/25Main City + North Wagga Levee
-1,554,700 -1,632,435 -1,714,057 -1,799,760 -1,417,605 0 0 0 0
6% used to fund Road Renewals
0 0 0 0 0 -3,108,901 -4,675,066 -6,376,589 -8,222,835
Borrowing Repayments
0 228,109 456,219 684,328 912,437 1,140,547 1,140,547 1,140,547 1,140,548
29 Long Term Financial Plan
APPENDICESThe following summary documents are provided as appendixes to the Long Term Financial Plan document. They provide a summary of the financial projections of Council over the next ten years. It is important that these documents are considered as a total package and not in isolation to gain a clear picture of Council’s financial position over the next ten years.
Appendix 1 Budgeted Income Statement
Appendix 2 Balance Sheet Forecasts
Appendix 3 Cash Flow Statement Forecasts
Appendix 4 Financial Sustainability Indicators
Appendix 5 Budgeted External Restrictions
Appendix 6 Budgeted Internal Restrictions
Appendix 7 New External Loan Projects and Debt Servicing
Appendix 8 Capital Works Program
Appendix 9 Wagga Wagga Regional Airport Ten Year Financial Plan
Appendix 10 Livestock Marketing Centre Ten Year Financial Plan
Appendix 11 Sewerage Services Ten Year Financial Plan
Appendix 12 Solid Waste Services Ten Year Financial Plan
Appendix 13 Stormwater Levy Ten Year Financial Plan
Appendix 14 Budgeted Income Statement by Function
Appendix 15 Summary table of Financial Modelling Scenarios
appendices.
long term financial planAPPENDICES.

30 Long Term Financial Plan
LONG
TERM
FINA
NCIA
L PLA
N - B
UDGE
TED
INCO
ME S
TATE
MEN
TBU
DGET
20
15/1
6BU
DGET
20
16/1
7BU
DGET
20
17/1
8BU
DGET
20
18/1
9BU
DGET
20
19/2
0BU
DGET
20
20/2
1BU
DGET
20
21/2
2BU
DGET
20
22/2
3BU
DGET
20
23/2
4BU
DGET
20
24/2
5R
even
ue F
rom
Co
ntin
uing
Op
erat
ions
Rat
es &
Ann
ual C
harg
es(5
6,80
1,51
8)(5
8,85
7,22
7)(6
0,98
9,73
9)(6
3,08
9,46
1)(6
5,26
3,00
5)(6
7,51
3,02
2)(6
9,84
2,25
4)(7
2,25
3,54
8)(7
4,74
9,65
5)(7
7,33
3,82
1)
Use
r C
harg
es &
Fee
s(2
2,02
9,24
9)(2
3,49
9,88
7)(2
5,25
6,14
7)(2
6,17
6,95
0)(2
7,16
1,25
9)(2
8,17
2,01
4)(2
9,08
2,16
8)(3
0,00
4,65
1)(3
0,95
8,99
3)(3
1,94
6,92
8)
Inte
rest
& In
vest
men
t Rev
enue
(3,3
57,7
02)
(3,9
98,8
65)
(4,5
10,2
56)
(4,3
71,9
15)
(4,6
68,4
48)
(4,7
94,4
34)
(5,0
01,8
46)
(4,9
32,1
12)
(5,1
22,8
08)
(5,4
30,7
30)
Oth
er R
even
ues
(2,9
44,7
55)
(3,0
35,3
00)
(3,1
30,2
21)
(3,1
94,5
09)
(3,2
60,7
20)
(3,3
28,9
16)
(3,3
98,4
01)
(3,4
69,7
11)
(3,5
42,9
00)
(3,6
17,9
70)
Gra
nts
& C
ontr
ibut
ions
pro
vide
d fo
r O
pera
ting
Pur
pose
s(1
4,15
7,66
7)(1
4,13
2,58
3)(1
4,59
2,51
5)(1
5,01
3,63
2)(1
5,34
6,03
6)(1
5,74
0,07
2)(1
6,19
6,09
6)(1
6,56
2,47
6)(1
6,99
3,59
3)(1
7,43
7,83
5)
Gra
nts
& C
ontr
ibut
ions
pro
vide
d fo
r C
apita
l Pur
pose
s(1
5,95
6,38
3)(1
0,35
3,33
9)(6
,792
,765
)(7
,040
,702
)(6
,908
,198
)(6
,945
,299
)(7
,016
,053
)(7
,089
,510
)(7
,168
,721
)(7
,230
,737
)
Rev
enue
Fro
m C
ont
inui
ng
Op
erat
ions
(115
,247
,273
)(1
13,8
77,2
01)
(115
,271
,644
)(1
18,8
87,1
69)
(122
,607
,666
)(1
26,4
93,7
56)
(130
,536
,817
)(1
34,3
12,0
08)
(138
,536
,670
)(1
42,9
98,0
22)
Exp
ense
s Fr
om
Co
ntin
uing
Op
erat
ions
Em
ploy
ee B
enefi
ts &
On-
Cos
ts41
,102
,148
42,3
43,7
9143
,789
,029
45,7
70,8
0647
,538
,197
49,6
67,5
4351
,914
,944
53,9
82,3
3756
,132
,416
58,3
68,4
90
Bor
row
ing
Cos
ts4,
373,
955
5,26
1,71
65,
730,
899
5,69
1,50
65,
657,
703
5,57
0,78
75,
425,
134
5,35
1,36
34,
941,
357
4,52
3,24
5
Mat
eria
ls &
Con
trac
ts2,
925,
694
2,55
6,43
22,
851,
139
2,71
2,90
52,
747,
062
2,61
8,95
72,
705,
160
2,56
4,45
52,
622,
626
2,48
0,39
6
Dep
reci
atio
n &
Am
ortis
atio
n23
,810
,744
25,1
56,0
5226
,577
,368
28,0
78,9
9029
,665
,453
31,3
41,5
5133
,112
,348
34,9
83,1
9636
,959
,747
39,0
47,9
72
Oth
er E
xpen
ses
35,7
98,0
7736
,299
,520
36,7
48,0
9137
,841
,802
38,4
85,4
6040
,178
,665
40,4
31,3
8341
,491
,782
42,7
41,3
3044
,328
,644
Exp
ense
s Fr
om
Co
ntin
uing
O
per
atio
ns10
8,01
0,62
011
1,61
7,51
011
5,69
6,52
712
0,09
6,00
912
4,09
3,87
512
9,37
7,50
313
3,58
8,97
013
8,37
3,13
314
3,39
7,47
614
8,74
8,74
8
Net
Op
erat
ing
Res
ult
(Sur
plu
s)/D
efici
t(7
,236
,653
)(2
,259
,691
)42
4,88
31,
208,
840
1,48
6,21
02,
883,
747
3,05
2,15
34,
061,
125
4,86
0,80
65,
750,
725
Net
Op
erat
ing
Res
ult
bef
ore
G
rant
s an
d C
ont
rib
utio
ns
pro
vid
ed f
or
Cap
ital
Pur
po
ses
8,71
9,73
08,
093,
648
7,21
7,64
88,
249,
542
8,39
4,40
89,
829,
046
10,0
68,2
0611
,150
,635
12,0
29,5
2612
,981
,463
appendix 1.

31 Long Term Financial Plan
appendix 2.
LONG
TERM
FINA
NCIA
L PLA
N - B
UDGE
TED
BALA
NCE S
HEET
BUDG
ET
2015
/16
BUDG
ET
2016
/17
BUDG
ET
2017
/18
BUDG
ET
2018
/19
BUDG
ET
2019
/20
BUDG
ET
2020
/21
BUDG
ET
2021
/22
BUDG
ET
2022
/23
BUDG
ET
2023
/24
BUDG
ET
2024
/25
AS
SE
TS
Cur
rent
Ass
ets
Cas
h &
Cas
h E
quiv
alen
ts20
,040
,121
18,3
06,6
0818
,387
,678
18,0
11,4
9017
,945
,727
20,4
46,1
5226
,408
,904
31,1
82,4
5138
,041
,136
42,1
03,3
67
Inve
stm
ents
37,0
37,0
2046
,009
,392
47,8
70,0
1551
,865
,702
51,5
37,3
6549
,783
,726
48,4
71,8
9146
,066
,909
43,0
82,3
7939
,626
,706
Rec
eiva
bles
12,8
58,4
8512
,722
,457
12,9
97,5
5713
,343
,628
13,7
72,3
1814
,233
,268
14,6
36,3
3015
,084
,899
15,5
39,7
8416
,056
,551
Inve
ntor
ies
267,
054
233,
348
260,
249
247,
631
250,
749
239,
056
246,
924
234,
081
239,
391
226,
408
Oth
er46
8,26
946
9,86
747
8,85
549
0,40
949
8,60
651
7,53
252
1,63
053
2,75
254
8,56
556
6,04
0
Non
-cur
rent
as
sets
cl
assi
fied
as
"hel
d fo
r sa
le"
00
00
00
00
00
Tota
l Cur
rent
A
sset
s70
,670
,949
77,7
41,6
7379
,994
,354
83,9
58,8
6084
,004
,765
85,2
19,7
3490
,285
,680
93,1
01,0
9297
,451
,255
98,5
79,0
72
No
n-C
urre
nt A
sset
s
Inve
stm
ents
32,4
90,6
1240
,361
,598
41,9
93,8
2345
,499
,027
45,2
10,9
9543
,672
,621
42,5
21,8
1740
,412
,054
37,7
93,8
8534
,762
,407
Rec
eiva
bles
2,43
1,00
02,
431,
000
2,43
1,00
02,
431,
000
2,43
1,00
02,
431,
000
2,43
1,00
02,
431,
000
2,43
1,00
02,
431,
000
Inve
ntor
ies
00
00
00
00
00
Infra
stru
ctur
e,
Pro
pert
y, P
lant
&
Equ
ipm
ent
1,33
9,59
6,00
41,
349,
609,
334
1,34
7,35
6,01
81,
345,
169,
613
1,34
2,10
6,57
31,
334,
008,
210
1,32
3,30
6,89
11,
307,
654,
157
1,28
9,38
6,92
11,
273,
629,
687
Inve
stm
ents
A
ccou
nted
fo
r us
ing
the
equi
ty m
etho
d
1,74
4,00
01,
744,
000
1,74
4,00
01,
744,
000
1,74
4,00
01,
744,
000
1,74
4,00
01,
744,
000
1,74
4,00
01,
744,
000
Inve
stm
ent
Pro
pert
y3,
955,
000
3,95
5,00
03,
955,
000
3,95
5,00
03,
955,
000
3,95
5,00
03,
955,
000
3,95
5,00
03,
955,
000
3,95
5,00
0
Tota
l No
n-C
urre
nt
Ass
ets
1,38
0,21
6,61
61,
398,
100,
932
1,39
7,47
9,84
11,
398,
798,
640
1,39
5,44
7,56
81,
385,
810,
831
1,37
3,95
8,70
81,
356,
196,
211
1,33
5,31
0,80
61,
316,
522,
094

32 Long Term Financial Plan
appendix 2.
LONG
TERM
FINA
NCIA
L PLA
N - B
UDGE
TED
BALA
NCE S
HEET
BUDG
ET
2015
/16
BUDG
ET
2016
/17
BUDG
ET
2017
/18
BUDG
ET
2018
/19
BUDG
ET
2019
/20
BUDG
ET
2020
/21
BUDG
ET
2021
/22
BUDG
ET
2022
/23
BUDG
ET
2023
/24
BUDG
ET
2024
/25
TO
TAL
AS
SE
TS
1,45
0,88
7,56
51,
475,
842,
605
1,47
7,47
4,19
51,
482,
757,
500
1,47
9,45
2,33
31,
471,
030,
565
1,46
4,24
4,38
81,
449,
297,
303
1,43
2,76
2,06
21,
415,
101,
167
LIA
BIL
ITIE
S
Cur
rent
Lia
bili
ties
Ban
k O
verd
raft
00
00
00
00
00
Pay
able
s13
,692
,688
12,7
56,2
3411
,964
,728
12,1
11,6
2812
,260
,990
12,2
34,8
8312
,246
,970
12,1
28,5
3912
,265
,438
12,8
58,8
00
Bor
row
ings
3,59
2,90
94,
032,
761
4,31
1,86
74,
631,
711
4,97
1,70
85,
498,
605
6,25
2,78
36,
208,
636
6,01
6,38
16,
016,
381
Pro
visi
ons
15,0
93,2
7215
,093
,272
15,0
93,2
7215
,093
,272
15,0
93,2
7215
,093
,272
15,0
93,2
7215
,093
,272
15,0
93,2
7215
,093
,272
Tota
l Cur
rent
Li
abili
ties
32,3
78,8
7031
,882
,267
31,3
69,8
6731
,836
,611
32,3
25,9
7032
,826
,761
33,5
93,0
2533
,430
,447
33,3
75,0
9133
,968
,453
No
n-C
urre
nt L
iab
iliti
es
Pay
able
s0
00
00
00
00
0
Bor
row
ings
77,7
07,6
2184
,057
,025
83,1
33,0
4981
,657
,558
79,9
65,6
1177
,218
,812
75,1
81,1
6368
,972
,526
62,9
56,1
4556
,939
,765
Pro
visi
ons
1,96
3,15
11,
963,
151
1,96
3,15
11,
963,
151
1,96
3,15
11,
963,
151
1,96
3,15
11,
963,
151
1,96
3,15
11,
963,
151
Tota
l No
n-C
urre
nt
Liab
iliti
es
79,6
70,7
7386
,020
,176
85,0
96,2
0083
,620
,709
81,9
28,7
6379
,181
,964
77,1
44,3
1470
,935
,678
64,9
19,2
9758
,902
,916
TO
TAL
LIA
BIL
ITIE
S11
2,04
9,64
211
7,90
2,44
311
6,46
6,06
711
5,45
7,32
011
4,25
4,73
311
2,00
8,72
411
0,73
7,33
910
4,36
6,12
598
,294
,388
92,8
71,3
69
NE
T A
SS
ET
S1,
338,
837,
922
1,35
7,94
0,16
31,
361,
008,
127
1,36
7,30
0,17
91,
365,
197,
600
1,35
9,02
1,84
11,
353,
507,
049
1,34
4,93
1,17
81,
334,
467,
674
1,32
2,22
9,79
7
EQ
UIT
Y
Ret
aine
d E
arni
ngs
851,
711,
922
870,
814,
163
873,
882,
127
880,
174,
179
878,
071,
600
871,
895,
841
866,
381,
049
857,
805,
178
847,
341,
674
835,
103,
797
Rev
alua
tion
Res
erve
s48
7,12
6,00
048
7,12
6,00
048
7,12
6,00
048
7,12
6,00
048
7,12
6,00
048
7,12
6,00
048
7,12
6,00
048
7,12
6,00
048
7,12
6,00
048
7,12
6,00
0
TO
TAL
EQ
UIT
Y1,
338,
837,
922
1,35
7,94
0,16
31,
361,
008,
127
1,36
7,30
0,17
91,
365,
197,
600
1,35
9,02
1,84
11,
353,
507,
049
1,34
4,93
1,17
81,
334,
467,
674
1,32
2,22
9,79
7

33 Long Term Financial Plan
LONG
TERM
FINA
NCIA
L PLA
N - B
UDGE
TED
CASH
FLOW
STAT
EMEN
T
BUDG
ET
2015
/16
BUDG
ET
2016
/17
BUDG
ET
2017
/18
BUDG
ET
2018
/19
BUDG
ET
2019
/20
BUDG
ET
2020
/21
BUDG
ET
2021
/22
BUDG
ET
2022
/23
BUDG
ET
2023
/24
BUDG
ET
2024
/25
Cas
h Fl
ows
from
Ope
ratin
g A
ctiv
ities
Rec
eipt
s:
Rat
es &
Ann
ual
Cha
rges
56,6
89,5
1358
,730
,732
60,8
58,5
1862
,960
,257
65,1
29,2
5967
,374
,570
69,6
98,9
2872
,105
,172
74,5
96,0
6177
,174
,809
Use
r C
harg
es &
Fe
es21
,695
,426
24,0
19,1
5925
,185
,380
26,1
16,7
9927
,094
,578
28,1
04,3
5629
,032
,017
29,9
55,3
5430
,907
,756
31,8
93,5
92
Inte
rest
&
Inve
stm
ent
Rev
enue
R
ecei
ved
2,82
6,08
03,
821,
493
4,29
8,99
64,
311,
320
4,56
1,05
34,
788,
343
4,99
6,65
54,
870,
405
5,10
2,80
75,
397,
138
Gra
nts
&
Con
trib
utio
ns29
,821
,990
21,5
10,7
5421
,349
,749
22,0
08,9
9722
,240
,688
22,6
56,1
5623
,176
,453
23,6
22,1
8224
,127
,733
24,6
34,2
67
Oth
er2,
269,
244
2,93
8,37
62,
943,
035
3,05
0,22
33,
116,
844
3,17
7,99
73,
246,
886
3,31
5,60
03,
383,
601
3,45
4,29
7
Pay
men
ts:
Em
ploy
ee
Ben
efits
& O
n-C
osts
(41,
205,
715)
(42,
343,
791)
(43,
789,
029)
(45,
770,
806)
(47,
538,
197)
(49,
667,
543)
(51,
914,
944)
(53,
982,
337)
(56,
132,
416)
(58,
368,
490)
Mat
eria
ls &
C
ontr
acts
(33,
780,
747)
(33,
048,
050)
(33,
467,
535)
(34,
016,
476)
(34,
319,
638)
(35,
122,
926)
(35,
557,
761)
(36,
327,
498)
(36,
563,
861)
(36,
411,
311)
Bor
row
ing
Cos
ts(6
,763
,079
)(5
,515
,327
)(5
,642
,072
)(5
,601
,142
)(5
,565
,841
)(5
,477
,476
)(5
,330
,438
)(5
,255
,359
)(4
,844
,138
)(4
,456
,290
)
Oth
er(4
,871
,544
)(4
,899
,879
)(4
,900
,587
)(5
,233
,491
)(5
,575
,871
)(6
,252
,619
)(6
,201
,663
)(6
,286
,287
)(7
,238
,694
)(8
,746
,232
)
Net
Cas
h pr
ovid
ed/(u
sed
in) O
pera
ting
Act
iviti
es
26,6
81,1
6825
,213
,466
26,8
36,4
5627
,825
,682
29,1
42,8
7529
,580
,858
31,1
46,1
3332
,017
,233
33,3
38,8
4834
,571
,779
Cas
h Fl
ows
from
Inve
stin
g A
ctiv
ities
appendix 3.

34 Long Term Financial Plan
LONG
TERM
FINA
NCIA
L PLA
N - B
UDGE
TED
CASH
FLOW
STAT
EMEN
T
BUDG
ET
2015
/16
BUDG
ET
2016
/17
BUDG
ET
2017
/18
BUDG
ET
2018
/19
BUDG
ET
2019
/20
BUDG
ET
2020
/21
BUDG
ET
2021
/22
BUDG
ET
2022
/23
BUDG
ET
2023
/24
BUDG
ET
2024
/25
Rec
eipt
s:
Sal
e of
In
vest
men
t S
ecur
ities
31,3
37,4
6440
,118
,777
32,0
95,0
2238
,514
,026
46,2
16,8
3136
,375
,228
44,1
27,5
3134
,963
,820
42,3
69,4
3133
,895
,545
Sal
e of
In
frast
ruct
ure,
P
rope
rty,
Pla
nt
& E
quip
men
t
4,39
3,95
03,
196,
290
3,29
7,00
01,
470,
000
1,05
0,00
01,
050,
000
1,05
0,00
01,
050,
000
1,05
0,00
01,
050,
000
Pay
men
ts:
Pur
chas
e of
In
vest
men
t S
ecur
ities
(22,
959,
572)
(41,
327,
230)
(30,
440,
862)
(38,
370,
193)
(46,
089,
382)
(36,
871,
506)
(44,
245,
807)
(35,
396,
646)
(42,
475,
975)
(33,
180,
357)
Pur
chas
e of
In
frast
ruct
ure,
P
rope
rty,
Pla
nt
& E
quip
men
t
(48,
210,
523)
(27,
295,
918)
(27,
513,
801)
(27,
341,
279)
(27,
676,
303)
(24,
016,
289)
(23,
392,
436)
(20,
126,
532)
(19,
689,
925)
(24,
719,
767)
Con
trib
utio
ns
Pai
d to
Joi
nt
Vent
ures
&
Ass
ocia
tes
(1,1
52,4
17)
(1,1
86,9
86)
(1,2
22,5
95)
(1,2
59,2
73)
(1,2
97,0
52)
(1,3
35,9
64)
(1,3
76,0
43)
(1,4
17,3
23)
(1,4
59,8
43)
(1,5
03,6
38)
Net
Cas
h pr
ovid
ed/(u
sed
in) I
nves
ting
Act
iviti
es
(36,
591,
098)
(26,
495,
067)
(23,
785,
237)
(26,
986,
720)
(27,
795,
907)
(24,
798,
530)
(23,
836,
754)
(20,
926,
682)
(20,
206,
312)
(24,
458,
218)
Cas
h Fl
ows
from
Fin
anci
ng
Act
iviti
es
Rec
eipt
s:
Pro
ceed
s fro
m
Bor
row
ings
&
Adv
ance
s
15,7
54,4
083,
370,
796
1,11
9,36
43,
155,
004
3,27
8,76
62,
751,
039
4,21
4,60
00
00
Pay
men
ts:
appendix 3.

35 Long Term Financial Plan
appendix 3.
LONG
TERM
FINA
NCIA
L PLA
N - B
UDGE
TED
CASH
FLOW
STAT
EMEN
T
BUDG
ET
2015
/16
BUDG
ET
2016
/17
BUDG
ET
2017
/18
BUDG
ET
2018
/19
BUDG
ET
2019
/20
BUDG
ET
2020
/21
BUDG
ET
2021
/22
BUDG
ET
2022
/23
BUDG
ET
2023
/24
BUDG
ET
2024
/25
Rep
aym
ent o
f B
orro
win
gs &
A
dvan
ces
(3,0
82,5
11)
(3,8
22,7
09)
(4,0
89,5
13)
(4,3
70,1
56)
(4,6
91,4
98)
(5,0
32,9
43)
(5,5
61,2
26)
(6,3
17,0
04)
(6,2
73,8
50)
(6,0
51,3
31)
Net
Cas
h pr
ovid
ed/(u
sed
in) i
n Fi
nanc
ing
Act
iviti
es
12,6
71,8
98(4
51,9
13)
(2,9
70,1
49)
(1,2
15,1
51)
(1,4
12,7
31)
(2,2
81,9
03)
(1,3
46,6
26)
(6,3
17,0
04)
(6,2
73,8
50)
(6,0
51,3
31)
Net
Incr
ease
/(D
ecre
ase)
in
Cas
h &
Cas
h E
quiv
alen
ts
2,76
1,96
8(1
,733
,513
)81
,070
(376
,189
)(6
5,76
3)2,
500,
425
5,96
2,75
34,
773,
547
6,85
8,68
54,
062,
230
plus
: Cas
h,
Cas
h E
quiv
alen
ts &
In
vest
men
ts -
be
ginn
ing
of
year
17,2
78,1
5420
,040
,121
18,3
06,6
0818
,387
,678
18,0
11,4
9017
,945
,727
20,4
46,1
5226
,408
,904
31,1
82,4
5138
,041
,136
Cas
h &
Cas
h E
quiv
alen
ts -
en
d of
the
year
20,0
40,1
2118
,306
,608
18,3
87,6
7818
,011
,490
17,9
45,7
2720
,446
,152
26,4
08,9
0431
,182
,451
38,0
41,1
3642
,103
,367
Cas
h &
Cas
h E
qui
vale
nts
- en
d o
f th
e ye
ar
20,0
40,1
2118
,306
,608
18,3
87,6
7818
,011
,490
17,9
45,7
2720
,446
,152
26,4
08,9
0431
,182
,451
38,0
41,1
3642
,103
,367
Inve
stm
ents
-
end
of
the
year
69,5
27,6
3286
,370
,990
89,8
63,8
3897
,364
,729
96,7
48,3
6093
,456
,347
90,9
93,7
0886
,478
,963
80,8
76,2
6474
,389
,113
Cas
h, C
ash
Eq
uiva
lent
s &
In
vest
men
ts
- en
d o
f th
e ye
ar
89,5
67,7
5310
4,67
7,59
810
8,25
1,51
611
5,37
6,21
911
4,69
4,08
711
3,90
2,49
911
7,40
2,61
211
7,66
1,41
411
8,91
7,40
011
6,49
2,48
0

36 Long Term Financial Plan
appendix 4.
LONG
TERM
FINA
NCIA
L PLA
N - B
ASE C
ASE S
CENA
RIO
- SUS
TAIN
ABILI
TY IN
DICA
TORS
BUDG
ET
2015
/16
BUDG
ET
2016
/17
BUDG
ET
2017
/18
BUDG
ET
2018
/19
BUDG
ET
2019
/20
BUDG
ET
2020
/21
BUDG
ET
2021
/22
BUDG
ET
2022
/23
BUDG
ET
2023
/24
BUDG
ET
2024
/25
2.44
:1U
nres
tric
ted
Cur
rent
Rat
io3.
854.
134.
244.
234.
084.
114.
374.
685.
095.
07
Cur
rent
Ass
ets
less
all
Ext
erna
l R
estr
ictio
ns ('
000)
82,0
5886
,628
87,1
2588
,677
87,3
5589
,869
98,5
7510
4,93
311
3,60
911
5,76
6
Cur
rent
Lia
bilit
ies
less
Spe
cific
Pur
pose
Li
abilit
ies
('000
)21
,321
20,9
5420
,561
20,9
6921
,396
21,8
4922
,538
22,4
0222
,340
22,8
23
7.13
%D
ebt S
ervi
ce R
atio
7.17
%9.
13%
10.0
2%10
.08%
10.0
1%9.
92%
10.0
6%10
.39%
9.66
%8.
83%
Deb
t Ser
vice
Cos
t6,
104
8,15
99,
404
9,76
410
,050
10,3
0310
,792
11,4
9311
,049
10,4
52
Rev
enue
from
Con
tinui
ng O
pera
tions
ex
clud
ing
Cap
ital I
tem
s &
Spe
cific
Pur
pose
G
rant
s/C
ontr
ibut
ions
85,1
3389
,391
93,8
8696
,833
100,
353
103,
808
107,
325
110,
660
114,
374
118,
329
62.1
1%R
ates
& A
nnua
l Cha
rges
Cov
erag
e R
atio
(O
wn
Sou
rce
Ope
ratin
g R
atio
)49
.29%
51.6
8%52
.91%
53.0
7%53
.23%
53.3
7%53
.50%
53.8
0%53
.96%
54.0
8%
Rat
es &
Ann
ual C
harg
es56
,802
58,8
5760
,990
63,0
8965
,263
67,5
1369
,842
72,2
5474
,750
77,3
34
Rev
enue
from
Con
tinui
ng O
pera
tions
115,
247
113,
877
115,
272
118,
887
122,
608
126,
494
130,
537
134,
312
138,
537
142,
998
6.43
%R
ates
, Ann
ual C
harg
es, I
nter
est &
Ext
ra
Cha
rges
Out
stan
ding
Per
cent
age
6.35
%6.
56%
6.78
%7.
00%
7.22
%7.
45%
7.69
%7.
93%
8.18
%8.
44%
Rat
es, A
nnua
l & E
xtra
Cha
rges
O
utst
andi
ng3,
864
4,00
44,
149
4,29
24,
441
4,59
44,
753
4,91
75,
087
5,26
4
Rat
es, A
nnua
l & E
xtra
Cha
rges
Col
lect
ible
60,8
6061
,001
61,1
5661
,317
61,4
7761
,642
61,8
1461
,991
62,1
7562
,366
3,
572
Est
imat
ed U
nres
tric
ted
Wor
king
Fun
ds
- $
'000
3,57
23,
572
3,18
72,
615
2,52
02,
531
2,52
52,
804
2,75
12,
279

37 Long Term Financial Plan
appendix 5.
LONG
TERM
FINA
NCIA
L PLA
N - B
ASE C
ASE S
CENA
RIO
- BUD
GETE
D EX
TERN
AL R
ESTR
ICTI
ONS B
ALAN
CE
RESE
RVE
NAM
EES
TIM
ATED
CL
OSIN
G BA
LANC
E 20
14/1
5
CLOS
ING
BALA
NCE
2015
/16
CLOS
ING
BALA
NCE
2016
/17
CLOS
ING
BALA
NCE
2017
/18
CLOS
ING
BALA
NCE
2018
/19
CLOS
ING
BALA
NCE
2019
/20
CLOS
ING
BALA
NCE
2020
/21
CLOS
ING
BALA
NCE
2021
/22
CLOS
ING
BALA
NCE
2022
/23
CLOS
ING
BALA
NCE
2023
/24
CLOS
ING
BALA
NCE
2024
/25
Sew
er R
eser
ve(7
,353
,506
)(7
,103
,495
)(7
,116
,118
)(7
,041
,534
)(6
,586
,981
)(6
,696
,706
)(7
,098
,037
)(7
,248
,227
)(6
,137
,786
)(5
,978
,528
)(6
,400
,056
)
Sol
id W
aste
R
eser
ve(2
,524
,639
)(3
,094
,732
)(2
,541
,180
)(4
,202
,958
)(5
,590
,514
)(2
,759
,399
)(4
,572
,428
)(6
,744
,287
)(9
,046
,438
)(1
1,33
8,03
2)(9
,428
,325
)
Sto
rmw
ater
Le
vy R
eser
ve(9
65,6
04)
(965
,604
)(9
65,6
04)
(965
,604
)(9
65,6
04)
(965
,604
)(9
65,6
04)
(965
,604
)(9
65,6
04)
(965
,604
)(9
65,6
04)
S94
Dev
elop
er
Con
trib
utio
ns(5
,760
,109
)(6
,423
,655
)(6
,130
,164
)(2
,315
,471
)1,
324,
798
452,
290
1,15
6,09
8(4
85,0
71)
(2,9
36,6
75)
(5,3
87,0
02)
(7,8
44,9
75)
S94
A
Dev
elop
er
Con
trib
utio
ns
(544
,072
)(7
97,9
77)
(548
,218
)(7
62,5
26)
(975
,713
)(9
87,7
31)
(926
,926
)(1
,136
,451
)(1
,344
,647
)(1
,551
,457
)(1
,756
,821
)
S94
(Old
Pla
n 19
93-2
004)
D
evel
oper
C
ontr
ibut
ions
(121
,838
)(1
21,8
38)
00
00
00
00
0
S64
Dev
elop
er
Con
trib
utio
ns
(Sto
rmw
ater
)
(929
,260
)(7
57,5
49)
(162
,043
)(6
62,0
43)
(1,1
62,0
43)
(1,6
62,0
43)
(1,6
62,0
43)
(1,6
62,0
43)
(1,6
62,0
43)
(1,6
62,0
43)
(1,6
62,0
43)
TOTA
L(1
8,19
9,02
9)(1
9,26
4,85
1)(1
7,46
3,32
7)(1
5,95
0,13
6)(1
3,95
6,05
8)(1
2,61
9,19
4)(1
4,06
8,94
0)(1
8,24
1,68
5)(2
2,09
3,19
5)(2
6,88
2,66
7)(2
8,05
7,82
5)
* U
nexp
ende
d G
rant
s ar
e al
so c
lass
ified
as
exte
rnal
ly re
stric
ted
fund
s -
how
ever
thes
e ar
e no
t sho
wn
in th
is ta
ble

38 Long Term Financial Plan
appendix 6.
LONG
TERM
FINA
NCIA
L PLA
N - B
ASE C
ASE S
CENA
RIO
- BUD
GETE
D IN
TERN
AL R
ESTR
ICTI
ONS B
ALAN
CERE
SERV
E NA
ME
ESTI
MAT
ED
CLOS
ING
BALA
NCE
2014
/15
CLOS
ING
BALA
NCE
2015
/16
CLOS
ING
BALA
NCE
2016
/17
CLOS
ING
BALA
NCE
2017
/18
CLOS
ING
BALA
NCE
2018
/19
CLOS
ING
BALA
NCE
2019
/20
CLOS
ING
BALA
NCE
2020
/21
CLOS
ING
BALA
NCE
2021
/22
CLOS
ING
BALA
NCE
2022
/23
CLOS
ING
BALA
NCE
2023
/24
CLOS
ING
BALA
NCE
2024
/25
Airp
ort R
eser
ve(1
77,0
26)
(94,
934)
(39,
193)
(8,7
30)
(2,7
71)
(19,
868)
(58,
874)
(117
,486
)(1
94,0
18)
(286
,193
)(5
08,5
62)
Live
stoc
k M
arke
ting
Cen
tre
Res
erve
(4,8
99,9
65)
(4,0
59,0
46)
(4,2
06,3
35)
(3,6
32,5
67)
(4,2
31,3
02)
(4,8
79,7
90)
(5,5
28,6
89)
(6,2
77,8
01)
(7,0
77,5
28)
(7,9
28,0
41)
(8,8
29,2
08)
Em
ploy
ee L
eave
E
ntitl
emen
ts
Gen
Fun
d R
eser
ve
(3,1
41,1
08)
(3,1
41,1
08)
(3,1
41,1
08)
(3,1
41,1
08)
(3,1
41,1
08)
(3,1
41,1
08)
(3,1
41,1
08)
(3,1
41,1
08)
(3,1
41,1
08)
(3,1
41,1
08)
(3,1
41,1
08)
Info
rmat
ion
Ser
vice
s /
E-B
usin
ess
Res
erve
(114
,440
)(8
9,44
0)(8
9,44
0)(8
9,44
0)(8
9,44
0)(8
9,44
0)(8
9,44
0)(8
9,44
0)(8
9,44
0)(8
9,44
0)(8
9,44
0)
Fam
ily D
ay C
are
Res
erve
(169
,877
)(1
65,5
51)
(171
,635
)(1
86,9
74)
(210
,363
)(2
40,5
49)
(276
,223
)(3
16,0
23)
(340
,023
)(3
47,3
58)
(337
,099
)
Sen
ior
Citi
zens
C
entr
e R
eser
ve(1
4,66
1)(1
6,66
1)(1
8,66
1)(2
0,66
1)(2
2,66
1)(2
4,66
1)(2
6,66
1)(2
8,66
1)(3
0,66
1)(3
2,66
1)(3
4,66
1)
Art
Gal
lery
R
eser
ve(5
1,99
0)(5
5,49
0)(5
8,99
0)(6
2,49
0)(6
5,99
0)(6
9,49
0)(7
2,99
0)(7
6,49
0)(7
9,99
0)(8
3,49
0)(8
6,99
0)
Mus
eum
A
cqui
sitio
ns
Res
erve
(39,
378)
(39,
378)
(39,
378)
(39,
378)
(39,
378)
(39,
378)
(39,
378)
(39,
378)
(39,
378)
(39,
378)
(39,
378)
Gra
vel P
it R
esto
ratio
n R
eser
ve
(726
,109
)(7
26,1
09)
(726
,109
)(7
26,1
09)
(726
,109
)(7
26,1
09)
(726
,109
)(7
26,1
09)
(726
,109
)(7
26,1
09)
(726
,109
)
Indu
stria
l Lan
d D
evel
opm
ent
Res
erve
(367
,873
)(3
67,8
73)
(367
,873
)(3
67,8
73)
(367
,873
)(3
67,8
73)
(367
,873
)(3
67,8
73)
(367
,873
)(3
67,8
73)
(367
,873
)
Pla
nt
Rep
lace
men
t R
eser
ve
(2,7
17,4
64)
(2,2
86,6
80)
(2,4
02,3
30)
(2,3
66,3
92)
(2,4
16,2
48)
(2,5
54,3
19)
(2,7
83,0
90)
(3,1
05,1
16)
(3,5
23,0
23)
(4,0
39,5
07)
(4,6
57,3
37)
Cou
ncil
Ele
ctio
n R
eser
ve(3
04,1
23)
(371
,981
)(1
29,8
39)
(197
,697
)(2
65,5
55)
(333
,413
)(9
1,27
1)(1
59,1
29)
(226
,987
)(2
94,8
45)
(52,
703)

39 Long Term Financial Plan
appendix 6.
LONG
TERM
FINA
NCIA
L PLA
N - B
ASE C
ASE S
CENA
RIO
- BUD
GETE
D IN
TERN
AL R
ESTR
ICTI
ONS B
ALAN
CERE
SERV
E NA
ME
ESTI
MAT
ED
CLOS
ING
BALA
NCE
2014
/15
CLOS
ING
BALA
NCE
2015
/16
CLOS
ING
BALA
NCE
2016
/17
CLOS
ING
BALA
NCE
2017
/18
CLOS
ING
BALA
NCE
2018
/19
CLOS
ING
BALA
NCE
2019
/20
CLOS
ING
BALA
NCE
2020
/21
CLOS
ING
BALA
NCE
2021
/22
CLOS
ING
BALA
NCE
2022
/23
CLOS
ING
BALA
NCE
2023
/24
CLOS
ING
BALA
NCE
2024
/25
Est
ella
C
omm
unity
C
entr
e R
eser
ve
(225
,199
)(2
25,1
99)
(46,
680)
(46,
680)
(46,
680)
(46,
680)
(46,
680)
(46,
680)
(46,
680)
(46,
680)
(46,
680)
Civ
ic T
heat
re
Tech
nica
l In
frast
ruct
ure
Res
erve
(20,
264)
(70,
264)
(120
,264
)(1
70,2
64)
(220
,264
)(2
70,2
64)
(320
,264
)(3
70,2
64)
(420
,264
)(4
70,2
64)
(520
,264
)
Inte
rnal
Loa
ns
Res
erve
(2,4
90,5
17)
(2,1
85,9
62)
(3,9
89,5
24)
(6,5
33,9
49)
(6,8
11,0
62)
(7,0
87,9
55)
(7,3
64,6
19)
(7,5
33,1
74)
(7,6
80,7
51)
(7,8
28,1
05)
(7,9
75,4
59)
Infra
stru
ctur
e R
epla
cem
ent
Res
erve
(44,
815)
(19,
159)
(36,
929)
(83,
550)
(91,
626)
(121
,638
)(1
46,3
54)
(171
,949
)(1
74,5
60)
(175
,286
)(1
95,6
21)
Lake
Alb
ert
Impr
ovem
ents
R
eser
ve
(212
,300
)(2
12,3
00)
(212
,300
)(2
62,3
00)
(312
,300
)(3
62,3
00)
(412
,300
)(4
62,3
00)
(512
,300
)(5
62,3
00)
(612
,300
)
LEP
Pre
para
tion
Res
erve
(2,5
45)
(2,5
45)
(2,5
45)
(2,5
45)
(2,5
45)
(2,5
45)
(2,5
45)
(2,5
45)
(2,5
45)
(2,5
45)
(2,5
45)
Oas
is P
lant
R
eser
ve(8
82,9
37)
(992
,937
)(1
,102
,937
)(1
,212
,937
)(1
,322
,937
)(1
,432
,937
)(1
,542
,937
)(1
,652
,937
)(1
,762
,937
)(1
,872
,937
)(1
,982
,937
)
Silv
erlit
e R
eser
ve(6
4,82
3)(6
4,82
3)(6
4,82
3)(6
4,82
3)(6
4,82
3)(6
4,82
3)(6
4,82
3)(6
4,82
3)(6
4,82
3)(6
4,82
3)(6
4,82
3)
Sto
rm D
amag
e R
eser
ve(3
,016
)0
00
00
00
00
0
Ker
b &
Gut
ter
Res
erve
(122
,538
)0
00
00
00
00
0
Sto
rmw
ater
D
rain
age
Res
erve
(248
,890
)(1
91,2
90)
(63,
177)
(63,
177)
(63,
177)
(63,
177)
(63,
177)
(63,
177)
(63,
177)
(63,
177)
(63,
177)
Gur
woo
d S
tree
t Pro
pert
y R
eser
ve
(50,
454)
(50,
454)
(50,
454)
(50,
454)
(50,
454)
(50,
454)
(50,
454)
(50,
454)
(50,
454)
(50,
454)
(50,
454)

40 Long Term Financial Plan
appendix 6.
LONG
TERM
FINA
NCIA
L PLA
N - B
ASE C
ASE S
CENA
RIO
- BUD
GETE
D IN
TERN
AL R
ESTR
ICTI
ONS B
ALAN
CERE
SERV
E NA
ME
ESTI
MAT
ED
CLOS
ING
BALA
NCE
2014
/15
CLOS
ING
BALA
NCE
2015
/16
CLOS
ING
BALA
NCE
2016
/17
CLOS
ING
BALA
NCE
2017
/18
CLOS
ING
BALA
NCE
2018
/19
CLOS
ING
BALA
NCE
2019
/20
CLOS
ING
BALA
NCE
2020
/21
CLOS
ING
BALA
NCE
2021
/22
CLOS
ING
BALA
NCE
2022
/23
CLOS
ING
BALA
NCE
2023
/24
CLOS
ING
BALA
NCE
2024
/25
Rob
erts
on O
val
Red
evel
opm
ent
Res
erve
(86,
697)
(86,
697)
(86,
697)
(86,
697)
(86,
697)
(86,
697)
(86,
697)
(86,
697)
(86,
697)
(86,
697)
(86,
697)
Pub
lic A
rt
Res
erve
(173
,538
)(5
2,95
5)5,
623
(7,3
75)
(7,7
55)
(43,
897)
(99,
094)
(93,
559)
(96,
681)
(99,
804)
(102
,926
)
Gle
nfiel
d C
omm
unity
C
entr
e R
eser
ve
(13,
704)
(15,
704)
(17,
704)
(19,
704)
(21,
704)
(23,
704)
(25,
704)
(27,
704)
(29,
704)
(31,
704)
(33,
704)
Sis
ter
Citi
es
Res
erve
(20,
762)
(30,
762)
(40,
762)
(50,
762)
(60,
762)
(70,
762)
(80,
762)
(90,
762)
(100
,762
)(1
10,7
62)
(120
,762
)
Civ
il P
roje
cts
Res
erve
(1,6
20,5
65)
(1,6
20,5
65)
(1,5
67,7
65)
(1,5
67,7
65)
(1,5
67,7
65)
(1,5
67,7
65)
(1,5
67,7
65)
(1,5
67,7
65)
(1,5
67,7
65)
(1,5
67,7
65)
(1,5
67,7
65)
Ped
estr
ian
Riv
er C
ross
ing
Res
erve
(198
,031
)(1
98,0
31)
(198
,031
)(1
98,0
31)
(198
,031
)(1
98,0
31)
(198
,031
)(1
98,0
31)
(198
,031
)(1
98,0
31)
(198
,031
)
Une
xpen
ded
Ext
erna
l Loa
ns
Res
erve
(137
,522
)(1
37,5
22)
(137
,522
)(1
37,5
22)
(137
,522
)(1
37,5
22)
(137
,522
)(1
37,5
22)
(137
,522
)(1
37,5
22)
(137
,522
)
Par
ks &
R
ecre
atio
n P
roje
cts
Res
erve
(51,
620)
(51,
620)
(51,
620)
(51,
620)
(51,
620)
(51,
620)
(51,
620)
(51,
620)
(51,
620)
(51,
620)
(51,
620)
Gen
eric
Pro
ject
s R
eser
ve(5
1,30
3)(3
3,06
6)(7
,318
)(7
,318
)(7
,318
)(7
,318
)(7
,318
)(7
,318
)(7
,318
)(7
,318
)(7
,318
)
Brid
ge
Rep
lace
men
t R
eser
ve
(226
,667
)(2
26,6
67)
(326
,667
)(1
23,6
67)
79,3
33(2
0,66
7)(1
20,6
67)
(220
,667
)(3
20,6
67)
(420
,667
)(5
20,6
67)
CB
D C
arpa
rkin
g Fa
cilit
ies
Res
erve
(939
,765
)(1
,112
,997
)(1
,317
,609
)(1
,520
,406
)(1
,721
,315
)(1
,920
,260
)(2
,117
,163
)(2
,311
,942
)(2
,504
,512
)(2
,694
,785
)(2
,882
,669
)

41 Long Term Financial Plan
appendix 6.
LONG
TERM
FINA
NCIA
L PLA
N - B
ASE C
ASE S
CENA
RIO
- BUD
GETE
D IN
TERN
AL R
ESTR
ICTI
ONS B
ALAN
CERE
SERV
E NA
ME
ESTI
MAT
ED
CLOS
ING
BALA
NCE
2014
/15
CLOS
ING
BALA
NCE
2015
/16
CLOS
ING
BALA
NCE
2016
/17
CLOS
ING
BALA
NCE
2017
/18
CLOS
ING
BALA
NCE
2018
/19
CLOS
ING
BALA
NCE
2019
/20
CLOS
ING
BALA
NCE
2020
/21
CLOS
ING
BALA
NCE
2021
/22
CLOS
ING
BALA
NCE
2022
/23
CLOS
ING
BALA
NCE
2023
/24
CLOS
ING
BALA
NCE
2024
/25
Eco
nom
ic
Dev
elop
men
t In
cent
ives
R
eser
ve
(19,
500)
(19,
500)
(19,
500)
(19,
500)
(19,
500)
(19,
500)
(19,
500)
(19,
500)
(19,
500)
(19,
500)
(19,
500)
Str
eet L
ight
ing
Rep
lace
men
t R
eser
ve
(40,
314)
(70,
314)
(100
,314
)(1
30,3
14)
(160
,314
)(1
90,3
14)
(220
,314
)(2
50,3
14)
(280
,314
)(3
10,3
14)
(340
,314
)
Civ
ic T
heat
re
Ope
ratin
g R
eser
ve
(100
,000
)(2
00,0
00)
(300
,000
)(4
00,0
00)
(500
,000
)(2
97,0
00)
(397
,000
)(4
97,0
00)
(597
,000
)(6
97,0
00)
(797
,000
)
Oas
is B
uild
ing
Ren
ewal
R
eser
ve
(72,
000)
(1,0
00)
(51,
000)
(101
,000
)(7
4,00
0)(9
3,70
0)(1
43,7
00)
(193
,700
)(1
32,6
00)
(182
,600
)(2
32,6
00)
Sub
divi
sion
Tr
ee P
lant
ing
Res
erve
(134
,191
)(1
54,1
91)
(114
,191
)(1
34,1
91)
(154
,191
)(1
74,1
91)
(134
,191
)(1
54,1
91)
(174
,191
)(1
94,1
91)
(214
,191
)
Cem
eter
y C
apita
l Res
erve
(70,
324)
(191
,001
)(2
89,0
02)
(298
,827
)(4
20,4
43)
(553
,787
)(6
98,7
52)
(883
,520
)(6
20,3
19)
(637
,698
)(6
15,5
07)
Cem
eter
y P
erpe
tual
R
eser
ve
(66,
769)
(123
,860
)(2
13,5
21)
(338
,667
)(4
68,0
46)
(601
,777
)(7
39,9
79)
(882
,778
)(1
,040
,693
)(1
,252
,052
)(1
,518
,671
)
Lloy
d E
2 E
nviro
nmen
tal
Wor
ks R
eser
ve
(110
,033
)(1
10,0
33)
(110
,033
)(1
10,0
33)
(110
,033
)(1
10,0
33)
(110
,033
)(1
10,0
33)
(110
,033
)(1
10,0
33)
(110
,033
)
CC
TV R
eser
ve(5
4,00
0)(6
4,00
0)(7
4,00
0)(8
4,00
0)(9
4,00
0)(7
6,00
0)(5
8,00
0)(4
0,00
0)(2
2,00
0)(4
,000
)14
,000
Gra
ssro
ots
Cric
ket R
eser
ve(1
5,00
0)(3
0,00
0)(4
5,00
0)(4
5,00
0)(4
5,00
0)(4
5,00
0)(4
5,00
0)(4
5,00
0)(4
5,00
0)(4
5,00
0)(4
5,00
0)
Sus
tain
able
E
nerg
y R
eser
ve0
(90,
000)
(180
,000
)(2
70,0
00)
(270
,000
)(2
70,0
00)
(270
,000
)(2
70,0
00)
(270
,000
)(2
70,0
00)
(270
,000
)
Ash
mon
t C
omm
unity
Fa
cilit
y R
eser
ve
(1,5
00)
(3,0
00)
(4,5
00)
(6,0
00)
(7,5
00)
(9,0
00)
(10,
500)
(12,
000)
(13,
500)
(15,
000)
(16,
500)
TO
TAL
(21,
296,
118)
(20,
052,
668)
(22,
327,
659)
(25,
038,
499)
(26,
668,
849)
(28,
557,
314)
(30,
555,
172)
(33,
014,
539)
(35,
041,
057)
(37,
656,
637)
(40,
259,
726)

42 Long Term Financial Plan
NEW EXTERNAL LOAN PROJECTS AND DEBT SERVICING - LONG TERM FINANCIAL PLANBORROWING YEAR
CAPITAL PROJECT Amount Borrowed
budget 2014/15
budget 2015/16
budget 2016/17
budget 2017/18
budget 2018/19
budget 2019/20
budget 2020/21
budget 2021/22
budget 2022/23
budget 2023/24
budget 2024/25
TOTALS
General Fund Capital Projects
2011/12 Wiradjuri Boat Ramp - 6.44% - 15 years 421,603
Interest 24,388 23,154 21,710 20,350 18,616 16,986 15,203 13,298 11,268 9,163 6,781 180,917
Principal 19,684 20,919 22,363 23,723 25,457 27,087 28,870 30,774 32,805 34,910 37,292 303,884
44,073 44,073 44,073 44,073 44,073 44,073 44,073 44,073 44,073 44,073 44,073 484,801
2011/12 Replace Substation Jubilee Park - 6.44% - 15 years
334,000
Interest 19,321 18,343 17,199 16,122 14,748 13,457 12,044 10,535 8,927 7,259 5,372 143,325
Principal 15,594 16,572 17,716 18,794 20,167 21,459 22,871 24,380 25,988 27,656 29,543 240,741
34,915 34,915 34,915 34,915 34,915 34,915 34,915 34,915 34,915 34,915 34,915 384,066
2011/12 Replace Bridge Over Model Railway at Botanic Gardens - 6.44% - 15 years
51,306
Interest 3,067 2,912 2,730 2,559 2,341 2,136 1,912 1,673 1,417 1,152 853 22,754
Principal 2,476 2,631 2,813 2,984 3,202 3,407 3,631 3,871 4,126 4,391 4,690 38,219
5,543 5,543 5,543 5,543 5,543 5,543 5,543 5,543 5,543 5,543 5,543 60,973
2011/12 Upgrade Docker Street Pedestrian Rail Crossing - 6.44% - 15 years
400,000
Interest 23,470 22,282 20,892 19,584 17,915 16,346 14,630 12,798 10,844 8,818 6,525 174,104
Principal 18,943 20,131 21,521 22,829 24,498 26,067 27,783 29,615 31,569 33,595 35,888 292,440
42,413 42,413 42,413 42,413 42,413 42,413 42,413 42,413 42,413 42,413 42,413 466,544
2011/12 Upgrade Tarcutta Main Street - 6.44% - 15 Years
300,000
Interest 17,354 16,475 15,448 14,480 13,247 12,087 10,818 9,463 8,018 6,520 4,825 128,735
Principal 14,007 14,885 15,913 16,880 18,114 19,274 20,543 21,898 23,343 24,841 26,536 216,234
31,361 31,361 31,361 31,361 31,361 31,361 31,361 31,361 31,361 31,361 31,361 344,970
2011/12 Upgrade Civic Theatre Sound Systems to Meet Industry Standards - 6.44% - 15 years
172,000
Interest 9,950 9,446 8,857 8,302 7,595 6,930 6,202 5,425 4,597 3,738 2,766 73,808
Principal 8,031 8,534 9,123 9,678 10,386 11,051 11,778 12,555 13,383 14,242 15,214 123,974
17,980 17,980 17,980 17,980 17,980 17,980 17,980 17,980 17,980 17,980 17,980 197,783
2011/12 Australian Carbon Trust Project - 5% - 4 years 211,909
Interest 5,888 4,150 2,230 - - - - - - - - 12,267
Principal 35,341 37,121 39,023 20,112 - - - - - - - 131,597
41,229 41,271 41,253 20,112 - - - - - - - 143,865
2011/12 Robertson Oval - 6.44% - 15 years 3,343,032
Interest 193,384 183,593 172,144 161,362 147,612 134,688 120,550 105,448 89,349 72,657 53,767 1,434,554
Principal 156,084 165,875 177,324 188,106 201,856 214,780 228,918 244,021 260,119 276,811 295,701 2,409,595
2012/13 Robertson Oval - 5.42% - 10 years 200,000
Interest 9,692 8,841 7,939 6,902 5,875 4,818 3,661 2,451 1,192 - - 51,371
Principal 15,827 16,678 17,580 18,617 19,644 20,701 21,859 23,068 30,707 - - 184,680
374,987 374,987 374,987 374,987 374,987 374,987 374,987 374,987 381,367 349,468 349,468 4,080,201
appendix 7.

43 Long Term Financial Plan
NEW EXTERNAL LOAN PROJECTS AND DEBT SERVICING - LONG TERM FINANCIAL PLANBORROWING YEAR
CAPITAL PROJECT Amount Borrowed
budget 2014/15
budget 2015/16
budget 2016/17
budget 2017/18
budget 2018/19
budget 2019/20
budget 2020/21
budget 2021/22
budget 2022/23
budget 2023/24
budget 2024/25
TOTALS
General Fund Capital Projects
2011/12 Wiradjuri Boat Ramp - 6.44% - 15 years 421,603
Interest 24,388 23,154 21,710 20,350 18,616 16,986 15,203 13,298 11,268 9,163 6,781 180,917
Principal 19,684 20,919 22,363 23,723 25,457 27,087 28,870 30,774 32,805 34,910 37,292 303,884
44,073 44,073 44,073 44,073 44,073 44,073 44,073 44,073 44,073 44,073 44,073 484,801
2011/12 Replace Substation Jubilee Park - 6.44% - 15 years
334,000
Interest 19,321 18,343 17,199 16,122 14,748 13,457 12,044 10,535 8,927 7,259 5,372 143,325
Principal 15,594 16,572 17,716 18,794 20,167 21,459 22,871 24,380 25,988 27,656 29,543 240,741
34,915 34,915 34,915 34,915 34,915 34,915 34,915 34,915 34,915 34,915 34,915 384,066
2011/12 Replace Bridge Over Model Railway at Botanic Gardens - 6.44% - 15 years
51,306
Interest 3,067 2,912 2,730 2,559 2,341 2,136 1,912 1,673 1,417 1,152 853 22,754
Principal 2,476 2,631 2,813 2,984 3,202 3,407 3,631 3,871 4,126 4,391 4,690 38,219
5,543 5,543 5,543 5,543 5,543 5,543 5,543 5,543 5,543 5,543 5,543 60,973
2011/12 Upgrade Docker Street Pedestrian Rail Crossing - 6.44% - 15 years
400,000
Interest 23,470 22,282 20,892 19,584 17,915 16,346 14,630 12,798 10,844 8,818 6,525 174,104
Principal 18,943 20,131 21,521 22,829 24,498 26,067 27,783 29,615 31,569 33,595 35,888 292,440
42,413 42,413 42,413 42,413 42,413 42,413 42,413 42,413 42,413 42,413 42,413 466,544
2011/12 Upgrade Tarcutta Main Street - 6.44% - 15 Years
300,000
Interest 17,354 16,475 15,448 14,480 13,247 12,087 10,818 9,463 8,018 6,520 4,825 128,735
Principal 14,007 14,885 15,913 16,880 18,114 19,274 20,543 21,898 23,343 24,841 26,536 216,234
31,361 31,361 31,361 31,361 31,361 31,361 31,361 31,361 31,361 31,361 31,361 344,970
2011/12 Upgrade Civic Theatre Sound Systems to Meet Industry Standards - 6.44% - 15 years
172,000
Interest 9,950 9,446 8,857 8,302 7,595 6,930 6,202 5,425 4,597 3,738 2,766 73,808
Principal 8,031 8,534 9,123 9,678 10,386 11,051 11,778 12,555 13,383 14,242 15,214 123,974
17,980 17,980 17,980 17,980 17,980 17,980 17,980 17,980 17,980 17,980 17,980 197,783
2011/12 Australian Carbon Trust Project - 5% - 4 years 211,909
Interest 5,888 4,150 2,230 - - - - - - - - 12,267
Principal 35,341 37,121 39,023 20,112 - - - - - - - 131,597
41,229 41,271 41,253 20,112 - - - - - - - 143,865
2011/12 Robertson Oval - 6.44% - 15 years 3,343,032
Interest 193,384 183,593 172,144 161,362 147,612 134,688 120,550 105,448 89,349 72,657 53,767 1,434,554
Principal 156,084 165,875 177,324 188,106 201,856 214,780 228,918 244,021 260,119 276,811 295,701 2,409,595
2012/13 Robertson Oval - 5.42% - 10 years 200,000
Interest 9,692 8,841 7,939 6,902 5,875 4,818 3,661 2,451 1,192 - - 51,371
Principal 15,827 16,678 17,580 18,617 19,644 20,701 21,859 23,068 30,707 - - 184,680
374,987 374,987 374,987 374,987 374,987 374,987 374,987 374,987 381,367 349,468 349,468 4,080,201
appendix 7.

44 Long Term Financial Plan
appendix 7.
NEW EXTERNAL LOAN PROJECTS AND DEBT SERVICING - LONG TERM FINANCIAL PLANBORROWING YEAR
CAPITAL PROJECT Amount Borrowed
budget 2014/15
budget 2015/16
budget 2016/17
budget 2017/18
budget 2018/19
budget 2019/20
budget 2020/21
budget 2021/22
budget 2022/23
budget 2023/24
budget 2024/25
TOTALS
2011/12 Equestrian Audit Recommendations - 6.44% - 15 years
250,000
Interest 14,462 13,730 12,873 12,067 11,039 10,072 9,015 7,886 6,682 5,433 4,021 107,279
Principal 11,672 12,405 13,261 14,067 15,095 16,062 17,119 18,248 19,452 20,701 22,113 180,195
2013/14 Equestrian Audit Recommendations - 4.84% 5 years + 7% - 5 years
250,000
Interest 11,853 10,867 9,835 8,639 7,466 9,503 7,851 6,083 4,191 2,166 - 78,454
Principal 20,726 21,713 22,745 23,940 25,114 23,608 25,260 27,029 28,921 28,779 - 247,834
58,714 58,714 58,714 58,714 58,714 59,245 59,245 59,245 59,245 57,079 26,134 613,762
2011/12 Develop Botanic Gardens & Zoo - 6.44% - 15 years
97,581
Interest 5,785 5,492 5,149 4,827 4,416 4,029 3,606 3,154 2,673 2,173 1,608 42,912
Principal 4,669 4,962 5,304 5,627 6,038 6,425 6,848 7,299 7,781 8,280 8,845 72,078
2012/13 Develop Botanic Gardens & Zoo - 5.42% - 10 years
200,000
Interest 9,692 8,841 7,939 6,902 5,875 4,818 3,661 2,451 1,192 - - 51,371
Principal 15,827 16,678 17,580 18,617 19,644 20,701 21,859 23,068 30,707 - - 184,680
35,973 35,973 35,973 35,973 35,973 35,973 35,973 35,973 42,352 10,454 10,454 351,042
2012/13 Construct New Amenities Building - Jubilee Park - 5.42% - 10 years
300,000
Interest 14,538 13,261 11,909 10,353 8,813 7,228 5,491 3,677 1,788 - - 77,057
Principal 23,741 25,017 26,370 27,926 29,466 31,051 32,788 34,601 46,061 - - 277,020
38,279 38,279 38,279 38,279 38,279 38,279 38,279 38,279 47,848 - - 354,077
2012/13 Higgins Avenue Rehabilitation (LIRS) - 5.42% - 10 years
275,000
Interest 13,327 12,156 10,917 9,490 8,078 6,625 5,033 3,371 1,639 - - 70,636
Principal 21,762 22,933 24,172 25,599 27,011 28,463 30,056 31,718 42,222 - - 253,935
35,089 35,089 35,089 35,089 35,089 35,089 35,089 35,089 43,861 - - 324,571
2012/13 Reinstate Road Failures (LIRS) - 5.42% - 10 years
589,000
Interest 28,543 26,036 23,381 20,326 17,302 14,190 10,780 7,220 3,510 - - 151,289
Principal 46,611 49,117 51,773 54,828 57,852 60,963 64,373 67,934 90,433 - - 543,883
75,154 75,154 75,154 75,154 75,154 75,154 75,154 75,154 93,942 - - 695,172
2012/13 Soccer Development City Wide Strategy (LIRS) - 5.42% - 10 years
180,000
Interest 8,723 7,957 7,145 6,212 5,288 4,337 3,294 2,206 1,073 - - 46,234
Principal 14,244 15,010 15,822 16,755 17,680 18,631 19,673 20,761 27,636 - - 166,212
2013/14 Soccer Development City Wide Strategy (LIRS) - 5.39% - 10 years
473,500
Interest 24,882 22,668 20,596 18,345 15,973 13,576 10,809 8,033 5,117 2,021 - 142,019
Principal 36,670 38,884 40,956 43,207 45,579 47,976 50,743 53,519 56,435 59,531 - 473,500
2014/15 Soccer Development City Wide Strategy (LIRS) - 6% - 10 years
360,155
Interest - 21,609 19,970 18,232 16,390 14,437 12,368 10,174 7,848 5,383 2,770 129,180
Principal - 27,324 28,964 30,702 32,544 34,496 36,566 38,760 41,086 43,551 43,394 357,385
84,519 133,453 133,453 133,453 133,453 133,453 133,453 133,453 139,194 110,485 46,164 1,314,531
2012/13 Implement Tarcutta Street Gasworks Remediation - 5.42% - 10 years (transferred from RIFL)
760,000
Interest 36,830 33,595 30,169 26,227 22,325 18,310 13,910 9,316 4,528 - - 195,211
Principal 60,143 63,377 66,803 70,745 74,647 78,662 83,063 87,657 116,687 - - 701,785

45 Long Term Financial Plan
NEW EXTERNAL LOAN PROJECTS AND DEBT SERVICING - LONG TERM FINANCIAL PLANBORROWING YEAR
CAPITAL PROJECT Amount Borrowed
budget 2014/15
budget 2015/16
budget 2016/17
budget 2017/18
budget 2018/19
budget 2019/20
budget 2020/21
budget 2021/22
budget 2022/23
budget 2023/24
budget 2024/25
TOTALS
2011/12 Equestrian Audit Recommendations - 6.44% - 15 years
250,000
Interest 14,462 13,730 12,873 12,067 11,039 10,072 9,015 7,886 6,682 5,433 4,021 107,279
Principal 11,672 12,405 13,261 14,067 15,095 16,062 17,119 18,248 19,452 20,701 22,113 180,195
2013/14 Equestrian Audit Recommendations - 4.84% 5 years + 7% - 5 years
250,000
Interest 11,853 10,867 9,835 8,639 7,466 9,503 7,851 6,083 4,191 2,166 - 78,454
Principal 20,726 21,713 22,745 23,940 25,114 23,608 25,260 27,029 28,921 28,779 - 247,834
58,714 58,714 58,714 58,714 58,714 59,245 59,245 59,245 59,245 57,079 26,134 613,762
2011/12 Develop Botanic Gardens & Zoo - 6.44% - 15 years
97,581
Interest 5,785 5,492 5,149 4,827 4,416 4,029 3,606 3,154 2,673 2,173 1,608 42,912
Principal 4,669 4,962 5,304 5,627 6,038 6,425 6,848 7,299 7,781 8,280 8,845 72,078
2012/13 Develop Botanic Gardens & Zoo - 5.42% - 10 years
200,000
Interest 9,692 8,841 7,939 6,902 5,875 4,818 3,661 2,451 1,192 - - 51,371
Principal 15,827 16,678 17,580 18,617 19,644 20,701 21,859 23,068 30,707 - - 184,680
35,973 35,973 35,973 35,973 35,973 35,973 35,973 35,973 42,352 10,454 10,454 351,042
2012/13 Construct New Amenities Building - Jubilee Park - 5.42% - 10 years
300,000
Interest 14,538 13,261 11,909 10,353 8,813 7,228 5,491 3,677 1,788 - - 77,057
Principal 23,741 25,017 26,370 27,926 29,466 31,051 32,788 34,601 46,061 - - 277,020
38,279 38,279 38,279 38,279 38,279 38,279 38,279 38,279 47,848 - - 354,077
2012/13 Higgins Avenue Rehabilitation (LIRS) - 5.42% - 10 years
275,000
Interest 13,327 12,156 10,917 9,490 8,078 6,625 5,033 3,371 1,639 - - 70,636
Principal 21,762 22,933 24,172 25,599 27,011 28,463 30,056 31,718 42,222 - - 253,935
35,089 35,089 35,089 35,089 35,089 35,089 35,089 35,089 43,861 - - 324,571
2012/13 Reinstate Road Failures (LIRS) - 5.42% - 10 years
589,000
Interest 28,543 26,036 23,381 20,326 17,302 14,190 10,780 7,220 3,510 - - 151,289
Principal 46,611 49,117 51,773 54,828 57,852 60,963 64,373 67,934 90,433 - - 543,883
75,154 75,154 75,154 75,154 75,154 75,154 75,154 75,154 93,942 - - 695,172
2012/13 Soccer Development City Wide Strategy (LIRS) - 5.42% - 10 years
180,000
Interest 8,723 7,957 7,145 6,212 5,288 4,337 3,294 2,206 1,073 - - 46,234
Principal 14,244 15,010 15,822 16,755 17,680 18,631 19,673 20,761 27,636 - - 166,212
2013/14 Soccer Development City Wide Strategy (LIRS) - 5.39% - 10 years
473,500
Interest 24,882 22,668 20,596 18,345 15,973 13,576 10,809 8,033 5,117 2,021 - 142,019
Principal 36,670 38,884 40,956 43,207 45,579 47,976 50,743 53,519 56,435 59,531 - 473,500
2014/15 Soccer Development City Wide Strategy (LIRS) - 6% - 10 years
360,155
Interest - 21,609 19,970 18,232 16,390 14,437 12,368 10,174 7,848 5,383 2,770 129,180
Principal - 27,324 28,964 30,702 32,544 34,496 36,566 38,760 41,086 43,551 43,394 357,385
84,519 133,453 133,453 133,453 133,453 133,453 133,453 133,453 139,194 110,485 46,164 1,314,531
2012/13 Implement Tarcutta Street Gasworks Remediation - 5.42% - 10 years (transferred from RIFL)
760,000
Interest 36,830 33,595 30,169 26,227 22,325 18,310 13,910 9,316 4,528 - - 195,211
Principal 60,143 63,377 66,803 70,745 74,647 78,662 83,063 87,657 116,687 - - 701,785
appendix 7.

46 Long Term Financial Plan
NEW EXTERNAL LOAN PROJECTS AND DEBT SERVICING - LONG TERM FINANCIAL PLANBORROWING YEAR
CAPITAL PROJECT Amount Borrowed
budget 2014/15
budget 2015/16
budget 2016/17
budget 2017/18
budget 2018/19
budget 2019/20
budget 2020/21
budget 2021/22
budget 2022/23
budget 2023/24
budget 2024/25
TOTALS
2013/14 Implement Tarcutta Street Gasworks Remediation - 4.84% 5 years + 7% 5 years
1,864,610
Interest 88,407 81,051 73,354 64,437 55,682 70,880 58,555 45,367 31,255 16,156 - 585,145
Principal 154,587 161,943 169,640 178,557 187,312 176,078 188,403 201,591 215,703 214,646 - 1,848,459
2014/15 Implement Tarcutta Street Gasworks Remediation - 6% - 10 years
1,489,226
Interest - 89,354 82,574 75,389 67,772 59,698 51,139 42,067 32,451 22,258 11,453 534,155
Principal - 112,985 119,764 126,949 134,566 142,640 151,199 160,271 169,887 180,080 179,432 1,477,773
339,966 542,305 542,305 542,305 542,305 546,269 546,269 546,269 570,512 433,140 190,885 5,342,527
2012/13 New Amenities Building - Duke Kent Oval - 5.42% - 10 years
22,000
Interest 1,066 972 873 759 646 530 403 270 131 - - 5,651
Principal 1,741 1,835 1,934 2,048 2,161 2,277 2,404 2,537 3,378 - - 20,315
2013/14 New Amenities Building - Duke Kent Oval - 4.84% 5 years + 7% 5 years
31,680
Interest 1,502 1,377 1,246 1,095 946 1,204 995 771 531 274 - 9,940
Principal 2,626 2,751 2,882 3,033 3,182 2,991 3,200 3,424 3,664 3,646 - 31,400
2014/15 New Amenities Building - Duke Kent Oval - 6% - 10 years
416,320
Interest - 24,979 23,084 21,075 18,946 16,689 14,296 11,760 9,072 6,222 3,202 149,325
Principal - 31,585 33,480 35,489 37,619 39,876 42,268 44,804 47,493 50,342 50,161 413,118
6,935 63,499 63,499 63,499 63,499 63,567 63,567 63,567 64,268 60,485 53,363 629,749
2012/13 Multi Purpose Stadium Facilities - 5.42% - 10 years
61,000
Interest 2,956 2,696 2,421 2,105 1,792 1,470 1,116 748 363 - - 15,668
Principal 4,827 5,087 5,362 5,678 5,991 6,314 6,667 7,036 9,366 - - 56,327
2012/13 Multi Purpose Stadium Facilities - 5.42% - 10 years
100,000
Interest 4,846 4,420 3,970 3,451 2,938 2,409 1,830 1,226 596 - - 25,686
Principal 7,914 8,339 8,790 9,309 9,822 10,350 10,929 11,534 15,354 - - 92,340
2014/15 Multi Purpose Stadium Facilities - 6% - 15 years
376,411
Interest - 22,585 21,614 20,586 19,496 18,340 17,115 15,817 14,440 12,981 11,435 174,408
Principal - 16,172 17,142 18,170 19,261 20,416 21,641 22,940 24,316 25,775 27,322 213,155
2015/16 Multi Purpose Stadium Facilities - 6% - 15 years
7,163,550
Interest - - 429,813 411,347 391,773 371,025 349,032 325,719 301,007 274,813 247,047 3,101,575
Principal - - 307,766 326,232 345,806 366,554 388,547 411,860 436,572 462,766 490,532 3,536,635
20,543 59,299 796,878 796,878 796,878 796,878 796,878 796,878 802,014 776,335 776,335 7,215,795
2013/14 Oasis Energy Co-Generation Project - 4 years 200,912
Interest 6,788 3,241 234 - - - - - - - - 10,263
Principal 69,528 73,075 18,782 - - - - - - - - 161,385
76,316 76,316 19,016 - - - - - - - - 171,648
2013/14 Equestrian Audit Recommendations - 4.84% - 5 years + 7% - 5 years
100,000
Interest 4,741 4,347 3,934 3,456 2,986 3,801 3,140 2,433 1,676 866 - 31,382
Principal 8,291 8,685 9,098 9,576 10,046 9,443 10,104 10,811 11,568 11,512 - 99,134
13,032 13,032 13,032 13,032 13,032 13,244 13,244 13,244 13,244 12,378 - 130,515
2013/14 RRL Headquarters - $12K per year for 10 years 120,000
Principal 12,000 12,000 12,000 12,000 12,000 12,000 12,000 12,000 12,000 12,000 - 120,000
12,000 12,000 12,000 12,000 12,000 12,000 12,000 12,000 12,000 12,000 - 120,000
appendix 7.

47 Long Term Financial Plan
NEW EXTERNAL LOAN PROJECTS AND DEBT SERVICING - LONG TERM FINANCIAL PLANBORROWING YEAR
CAPITAL PROJECT Amount Borrowed
budget 2014/15
budget 2015/16
budget 2016/17
budget 2017/18
budget 2018/19
budget 2019/20
budget 2020/21
budget 2021/22
budget 2022/23
budget 2023/24
budget 2024/25
TOTALS
2013/14 Implement Tarcutta Street Gasworks Remediation - 4.84% 5 years + 7% 5 years
1,864,610
Interest 88,407 81,051 73,354 64,437 55,682 70,880 58,555 45,367 31,255 16,156 - 585,145
Principal 154,587 161,943 169,640 178,557 187,312 176,078 188,403 201,591 215,703 214,646 - 1,848,459
2014/15 Implement Tarcutta Street Gasworks Remediation - 6% - 10 years
1,489,226
Interest - 89,354 82,574 75,389 67,772 59,698 51,139 42,067 32,451 22,258 11,453 534,155
Principal - 112,985 119,764 126,949 134,566 142,640 151,199 160,271 169,887 180,080 179,432 1,477,773
339,966 542,305 542,305 542,305 542,305 546,269 546,269 546,269 570,512 433,140 190,885 5,342,527
2012/13 New Amenities Building - Duke Kent Oval - 5.42% - 10 years
22,000
Interest 1,066 972 873 759 646 530 403 270 131 - - 5,651
Principal 1,741 1,835 1,934 2,048 2,161 2,277 2,404 2,537 3,378 - - 20,315
2013/14 New Amenities Building - Duke Kent Oval - 4.84% 5 years + 7% 5 years
31,680
Interest 1,502 1,377 1,246 1,095 946 1,204 995 771 531 274 - 9,940
Principal 2,626 2,751 2,882 3,033 3,182 2,991 3,200 3,424 3,664 3,646 - 31,400
2014/15 New Amenities Building - Duke Kent Oval - 6% - 10 years
416,320
Interest - 24,979 23,084 21,075 18,946 16,689 14,296 11,760 9,072 6,222 3,202 149,325
Principal - 31,585 33,480 35,489 37,619 39,876 42,268 44,804 47,493 50,342 50,161 413,118
6,935 63,499 63,499 63,499 63,499 63,567 63,567 63,567 64,268 60,485 53,363 629,749
2012/13 Multi Purpose Stadium Facilities - 5.42% - 10 years
61,000
Interest 2,956 2,696 2,421 2,105 1,792 1,470 1,116 748 363 - - 15,668
Principal 4,827 5,087 5,362 5,678 5,991 6,314 6,667 7,036 9,366 - - 56,327
2012/13 Multi Purpose Stadium Facilities - 5.42% - 10 years
100,000
Interest 4,846 4,420 3,970 3,451 2,938 2,409 1,830 1,226 596 - - 25,686
Principal 7,914 8,339 8,790 9,309 9,822 10,350 10,929 11,534 15,354 - - 92,340
2014/15 Multi Purpose Stadium Facilities - 6% - 15 years
376,411
Interest - 22,585 21,614 20,586 19,496 18,340 17,115 15,817 14,440 12,981 11,435 174,408
Principal - 16,172 17,142 18,170 19,261 20,416 21,641 22,940 24,316 25,775 27,322 213,155
2015/16 Multi Purpose Stadium Facilities - 6% - 15 years
7,163,550
Interest - - 429,813 411,347 391,773 371,025 349,032 325,719 301,007 274,813 247,047 3,101,575
Principal - - 307,766 326,232 345,806 366,554 388,547 411,860 436,572 462,766 490,532 3,536,635
20,543 59,299 796,878 796,878 796,878 796,878 796,878 796,878 802,014 776,335 776,335 7,215,795
2013/14 Oasis Energy Co-Generation Project - 4 years 200,912
Interest 6,788 3,241 234 - - - - - - - - 10,263
Principal 69,528 73,075 18,782 - - - - - - - - 161,385
76,316 76,316 19,016 - - - - - - - - 171,648
2013/14 Equestrian Audit Recommendations - 4.84% - 5 years + 7% - 5 years
100,000
Interest 4,741 4,347 3,934 3,456 2,986 3,801 3,140 2,433 1,676 866 - 31,382
Principal 8,291 8,685 9,098 9,576 10,046 9,443 10,104 10,811 11,568 11,512 - 99,134
13,032 13,032 13,032 13,032 13,032 13,244 13,244 13,244 13,244 12,378 - 130,515
2013/14 RRL Headquarters - $12K per year for 10 years 120,000
Principal 12,000 12,000 12,000 12,000 12,000 12,000 12,000 12,000 12,000 12,000 - 120,000
12,000 12,000 12,000 12,000 12,000 12,000 12,000 12,000 12,000 12,000 - 120,000
appendix 7.

48 Long Term Financial Plan
appendix 7.
NEW EXTERNAL LOAN PROJECTS AND DEBT SERVICING - LONG TERM FINANCIAL PLANBORROWING YEAR
CAPITAL PROJECT Amount Borrowed
budget 2014/15
budget 2015/16
budget 2016/17
budget 2017/18
budget 2018/19
budget 2019/20
budget 2020/21
budget 2021/22
budget 2022/23
budget 2023/24
budget 2024/25
TOTALS
2013/14 Implement Animal Shelter Expansion (LIRS) - 5.39% - 10 years
117,870
Interest 6,194 5,643 5,127 4,567 3,976 3,380 2,691 2,000 1,274 503 - 35,353
Principal 9,128 9,680 10,195 10,756 11,346 11,943 12,632 13,323 14,049 14,819 - 117,870
2014/15 Implement Animal Shelter Expansion (LIRS) - 6% - 10 years
542,130
Interest - 32,528 30,060 27,444 24,671 21,732 18,616 15,314 11,813 8,103 4,169 194,451
Principal - 41,130 43,598 46,214 48,987 51,926 55,042 58,344 61,845 65,555 65,319 537,961
15,322 88,980 88,980 88,980 88,980 88,980 88,980 88,980 88,980 88,980 69,489 885,635
2013/14 City Levee Project - 4.84% - 5 years + 7% - 5 years
199,750
Interest 9,471 8,683 7,858 6,903 5,965 7,593 6,273 4,860 3,348 1,731 - 62,685
Principal 16,560 17,349 18,173 19,128 20,066 18,863 20,183 21,596 23,108 22,994 - 198,020
2014/15 City Levee Project - 6% - 10 years 293,750
Interest - 17,625 16,288 14,870 13,368 11,775 10,087 8,298 6,401 4,390 2,259 105,362
Principal - 22,286 23,623 25,041 26,543 28,136 29,824 31,613 33,510 35,521 35,393 291,491
26,031 65,942 65,942 65,942 65,942 66,367 66,367 66,367 66,367 64,636 37,652 657,558
2013/14 Rehabilitation Lakeside Drive (LIRS) - 5.39% - 10 years
523,630
Interest 27,516 25,068 22,776 20,287 17,665 15,014 11,953 8,883 5,658 2,235 - 157,055
Principal 40,552 43,001 45,292 47,781 50,404 53,055 56,116 59,185 62,410 65,834 - 523,630
2014/15 Rehabilitation Lakeside Drive (LIRS) - 6% - 10 years
112,370
Interest - 6,742 6,231 5,688 5,114 4,505 3,859 3,174 2,449 1,679 864 40,305
Principal - 8,525 9,037 9,579 10,154 10,763 11,409 12,093 12,819 13,588 13,539 111,506
68,068 83,336 83,336 83,336 83,336 83,336 83,336 83,336 83,336 83,336 14,403 832,495
2014/15 Implement Bomen Roads Project - 6% - 15 years
836,000
Interest - 50,160 48,005 45,721 43,299 40,733 38,012 35,128 32,071 28,831 28,831 390,791
Principal - 35,917 38,072 40,356 42,778 45,344 48,065 50,949 54,006 57,246 57,246 469,978
- 86,077 86,077 86,077 86,077 86,077 86,077 86,077 86,077 86,077 86,077 860,769
2014/15 Bomen - Eunony Deviation - 6% - 10 years 785,625
Interest - 47,138 43,561 39,770 35,752 31,493 26,978 22,192 17,119 11,742 6,042 281,788
Principal - 59,604 63,180 66,971 70,989 75,248 79,763 84,549 89,622 94,999 94,657 779,583
- 106,741 106,741 106,741 106,741 106,741 106,741 106,741 106,741 106,741 100,699 1,061,371
2014/15 Riverina Intermodal Freight & Logistics Terminal - 6% - 15 years
4,695,000
Interest - 281,700 269,597 256,769 243,170 228,756 213,476 197,280 180,113 161,915 142,625 2,175,401
Principal - 201,710 213,813 226,642 240,240 254,654 269,934 286,130 303,298 321,495 340,785 2,658,700
2015/16 Riverina Intermodal Freight & Logistics Terminal - 6% - 15 years
9,390,000
Interest - - 563,400 539,195 513,537 486,340 457,511 426,953 394,561 360,225 323,830 4,065,552
Principal - - 403,420 427,626 453,283 480,480 509,309 539,867 572,259 606,595 642,991 4,635,831
2016/17 Riverina Intermodal Freight & Logistics Terminal - 7% - 15 years
4,695,000
Interest - - - 328,650 315,572 301,578 286,604 270,582 253,439 235,096 215,468 2,206,988
Principal - - - 186,836 199,914 213,908 228,882 244,904 262,047 280,390 300,017 1,916,898
- 483,410 1,450,231 1,965,716 1,965,716 1,965,716 1,965,716 1,965,716 1,965,716 1,965,716 1,965,716 17,659,371

49 Long Term Financial Plan
NEW EXTERNAL LOAN PROJECTS AND DEBT SERVICING - LONG TERM FINANCIAL PLANBORROWING YEAR
CAPITAL PROJECT Amount Borrowed
budget 2014/15
budget 2015/16
budget 2016/17
budget 2017/18
budget 2018/19
budget 2019/20
budget 2020/21
budget 2021/22
budget 2022/23
budget 2023/24
budget 2024/25
TOTALS
2013/14 Implement Animal Shelter Expansion (LIRS) - 5.39% - 10 years
117,870
Interest 6,194 5,643 5,127 4,567 3,976 3,380 2,691 2,000 1,274 503 - 35,353
Principal 9,128 9,680 10,195 10,756 11,346 11,943 12,632 13,323 14,049 14,819 - 117,870
2014/15 Implement Animal Shelter Expansion (LIRS) - 6% - 10 years
542,130
Interest - 32,528 30,060 27,444 24,671 21,732 18,616 15,314 11,813 8,103 4,169 194,451
Principal - 41,130 43,598 46,214 48,987 51,926 55,042 58,344 61,845 65,555 65,319 537,961
15,322 88,980 88,980 88,980 88,980 88,980 88,980 88,980 88,980 88,980 69,489 885,635
2013/14 City Levee Project - 4.84% - 5 years + 7% - 5 years
199,750
Interest 9,471 8,683 7,858 6,903 5,965 7,593 6,273 4,860 3,348 1,731 - 62,685
Principal 16,560 17,349 18,173 19,128 20,066 18,863 20,183 21,596 23,108 22,994 - 198,020
2014/15 City Levee Project - 6% - 10 years 293,750
Interest - 17,625 16,288 14,870 13,368 11,775 10,087 8,298 6,401 4,390 2,259 105,362
Principal - 22,286 23,623 25,041 26,543 28,136 29,824 31,613 33,510 35,521 35,393 291,491
26,031 65,942 65,942 65,942 65,942 66,367 66,367 66,367 66,367 64,636 37,652 657,558
2013/14 Rehabilitation Lakeside Drive (LIRS) - 5.39% - 10 years
523,630
Interest 27,516 25,068 22,776 20,287 17,665 15,014 11,953 8,883 5,658 2,235 - 157,055
Principal 40,552 43,001 45,292 47,781 50,404 53,055 56,116 59,185 62,410 65,834 - 523,630
2014/15 Rehabilitation Lakeside Drive (LIRS) - 6% - 10 years
112,370
Interest - 6,742 6,231 5,688 5,114 4,505 3,859 3,174 2,449 1,679 864 40,305
Principal - 8,525 9,037 9,579 10,154 10,763 11,409 12,093 12,819 13,588 13,539 111,506
68,068 83,336 83,336 83,336 83,336 83,336 83,336 83,336 83,336 83,336 14,403 832,495
2014/15 Implement Bomen Roads Project - 6% - 15 years
836,000
Interest - 50,160 48,005 45,721 43,299 40,733 38,012 35,128 32,071 28,831 28,831 390,791
Principal - 35,917 38,072 40,356 42,778 45,344 48,065 50,949 54,006 57,246 57,246 469,978
- 86,077 86,077 86,077 86,077 86,077 86,077 86,077 86,077 86,077 86,077 860,769
2014/15 Bomen - Eunony Deviation - 6% - 10 years 785,625
Interest - 47,138 43,561 39,770 35,752 31,493 26,978 22,192 17,119 11,742 6,042 281,788
Principal - 59,604 63,180 66,971 70,989 75,248 79,763 84,549 89,622 94,999 94,657 779,583
- 106,741 106,741 106,741 106,741 106,741 106,741 106,741 106,741 106,741 100,699 1,061,371
2014/15 Riverina Intermodal Freight & Logistics Terminal - 6% - 15 years
4,695,000
Interest - 281,700 269,597 256,769 243,170 228,756 213,476 197,280 180,113 161,915 142,625 2,175,401
Principal - 201,710 213,813 226,642 240,240 254,654 269,934 286,130 303,298 321,495 340,785 2,658,700
2015/16 Riverina Intermodal Freight & Logistics Terminal - 6% - 15 years
9,390,000
Interest - - 563,400 539,195 513,537 486,340 457,511 426,953 394,561 360,225 323,830 4,065,552
Principal - - 403,420 427,626 453,283 480,480 509,309 539,867 572,259 606,595 642,991 4,635,831
2016/17 Riverina Intermodal Freight & Logistics Terminal - 7% - 15 years
4,695,000
Interest - - - 328,650 315,572 301,578 286,604 270,582 253,439 235,096 215,468 2,206,988
Principal - - - 186,836 199,914 213,908 228,882 244,904 262,047 280,390 300,017 1,916,898
- 483,410 1,450,231 1,965,716 1,965,716 1,965,716 1,965,716 1,965,716 1,965,716 1,965,716 1,965,716 17,659,371
appendix 7.

50 Long Term Financial Plan
appendix 7.
NEW EXTERNAL LOAN PROJECTS AND DEBT SERVICING - LONG TERM FINANCIAL PLANBORROWING YEAR
CAPITAL PROJECT Amount Borrowed
budget 2014/15
budget 2015/16
budget 2016/17
budget 2017/18
budget 2018/19
budget 2019/20
budget 2020/21
budget 2021/22
budget 2022/23
budget 2023/24
budget 2024/25
TOTALS
2015/16 Lawn Cemetery Master Plan Stg 2A Works - 6% - 10 years
292,165
Interest - - 17,530 16,200 14,790 13,296 11,712 10,033 8,253 6,366 4,367 102,547
Principal - - 22,166 23,496 24,906 26,400 27,984 29,663 31,443 33,329 35,329 254,716
2021/22 Lawn Cemetery Master Plan Stg 2A Works - 7% - 10 years
637,035
Interest - - - - - - - - 44,592 41,365 37,912 123,869
Principal - - - - - - - - 46,107 49,334 52,788 148,229
- - 39,696 39,696 39,696 39,696 39,696 39,696 130,395 130,395 130,395 629,361
2016/17 Construct Estella Community Centre - 7% - 10 years
100,000
Interest - - - 7,000 6,493 5,951 5,371 4,751 4,087 3,376 2,616 39,645
Principal - - - 7,238 7,745 8,287 8,867 9,487 10,151 10,862 11,622 74,259
- - - 14,238 14,238 14,238 14,238 14,238 14,238 14,238 14,238 113,904
2018/19 Jubilee Park Synthetic Hockey Fields Replace - 7% - 10 years
600,000
Interest - - - - - 42,000 38,960 35,708 32,227 28,503 24,519 201,917
Principal - - - - - 43,427 46,466 49,719 53,199 56,923 60,908 310,642
- - - - - 85,427 85,427 85,427 85,427 85,427 85,427 512,559
TOTAL GENERAL DEBT SERVICING 44,935,119
Interest 628,636 1,175,715 2,102,586 2,308,046 2,157,262 2,074,765 1,900,562 1,715,994 1,564,778 1,356,115 1,155,925 18,140,385
Principal 869,806 1,474,426 2,234,333 2,518,439 2,649,112 2,822,235 2,996,438 3,181,007 3,508,634 3,267,541 2,977,259 28,499,230
1,498,442 2,650,141 4,336,919 4,826,486 4,806,374 4,897,000 4,897,000 4,897,000 5,073,412 4,623,657 4,133,184 46,639,615
Airport Masterplan Projects
2009/10 Airport Pavement Upgrade - 7% - 25 years 3,133,340
Interest 286,314 246,196 227,933 208,124 186,641 163,342 138,072 110,665 80,942 48,704 13,741 1,710,675
Principal 251,283 215,997 234,261 254,069 275,552 298,852 324,122 351,528 381,251 413,489 332,904 3,333,307
537,597 462,193 462,193 462,193 462,193 462,193 462,193 462,193 462,193 462,193 346,645 5,043,982
2011/12 Develop Precinct 2A - 6.44% - 15 years 6,015,614
Interest 347,985 330,367 309,765 290,363 265,621 242,364 216,923 189,747 160,779 130,742 96,751 2,581,407
Principal 280,865 298,483 319,085 338,487 363,229 386,486 411,927 439,102 468,071 498,108 532,099 4,335,942
628,850 628,850 628,850 628,850 628,850 628,850 628,850 628,850 628,850 628,850 628,850 6,917,349
TOTAL AIRPORT DEBT SERVICING 9,148,954
Interest 634,299 576,563 537,697 498,488 452,262 405,705 354,995 300,412 241,721 179,446 110,492 4,292,082
Principal 532,147 514,480 553,346 592,556 638,781 685,338 736,048 790,630 849,322 911,597 865,003 7,669,249
1,166,446 1,091,043 1,091,043 1,091,043 1,091,043 1,091,043 1,091,043 1,091,043 1,091,043 1,091,043 975,495 11,961,330
Stormwater Levy Projects
2011/12 Remediate Wollundry Lagoon - 6.44% - 15 years
1,005,000
Interest 58,136 55,193 51,751 48,510 44,376 40,491 36,240 31,700 26,861 21,842 16,164 431,263
Principal 46,923 49,866 53,308 56,549 60,683 64,568 68,819 73,359 78,198 83,217 88,895 724,385
TOTAL STORMWATER LEVY DEBT SERVICING
105,059 105,059 105,059 105,059 105,059 105,059 105,059 105,059 105,059 105,059 105,059 1,155,648

51 Long Term Financial Plan
NEW EXTERNAL LOAN PROJECTS AND DEBT SERVICING - LONG TERM FINANCIAL PLANBORROWING YEAR
CAPITAL PROJECT Amount Borrowed
budget 2014/15
budget 2015/16
budget 2016/17
budget 2017/18
budget 2018/19
budget 2019/20
budget 2020/21
budget 2021/22
budget 2022/23
budget 2023/24
budget 2024/25
TOTALS
2015/16 Lawn Cemetery Master Plan Stg 2A Works - 6% - 10 years
292,165
Interest - - 17,530 16,200 14,790 13,296 11,712 10,033 8,253 6,366 4,367 102,547
Principal - - 22,166 23,496 24,906 26,400 27,984 29,663 31,443 33,329 35,329 254,716
2021/22 Lawn Cemetery Master Plan Stg 2A Works - 7% - 10 years
637,035
Interest - - - - - - - - 44,592 41,365 37,912 123,869
Principal - - - - - - - - 46,107 49,334 52,788 148,229
- - 39,696 39,696 39,696 39,696 39,696 39,696 130,395 130,395 130,395 629,361
2016/17 Construct Estella Community Centre - 7% - 10 years
100,000
Interest - - - 7,000 6,493 5,951 5,371 4,751 4,087 3,376 2,616 39,645
Principal - - - 7,238 7,745 8,287 8,867 9,487 10,151 10,862 11,622 74,259
- - - 14,238 14,238 14,238 14,238 14,238 14,238 14,238 14,238 113,904
2018/19 Jubilee Park Synthetic Hockey Fields Replace - 7% - 10 years
600,000
Interest - - - - - 42,000 38,960 35,708 32,227 28,503 24,519 201,917
Principal - - - - - 43,427 46,466 49,719 53,199 56,923 60,908 310,642
- - - - - 85,427 85,427 85,427 85,427 85,427 85,427 512,559
TOTAL GENERAL DEBT SERVICING 44,935,119
Interest 628,636 1,175,715 2,102,586 2,308,046 2,157,262 2,074,765 1,900,562 1,715,994 1,564,778 1,356,115 1,155,925 18,140,385
Principal 869,806 1,474,426 2,234,333 2,518,439 2,649,112 2,822,235 2,996,438 3,181,007 3,508,634 3,267,541 2,977,259 28,499,230
1,498,442 2,650,141 4,336,919 4,826,486 4,806,374 4,897,000 4,897,000 4,897,000 5,073,412 4,623,657 4,133,184 46,639,615
Airport Masterplan Projects
2009/10 Airport Pavement Upgrade - 7% - 25 years 3,133,340
Interest 286,314 246,196 227,933 208,124 186,641 163,342 138,072 110,665 80,942 48,704 13,741 1,710,675
Principal 251,283 215,997 234,261 254,069 275,552 298,852 324,122 351,528 381,251 413,489 332,904 3,333,307
537,597 462,193 462,193 462,193 462,193 462,193 462,193 462,193 462,193 462,193 346,645 5,043,982
2011/12 Develop Precinct 2A - 6.44% - 15 years 6,015,614
Interest 347,985 330,367 309,765 290,363 265,621 242,364 216,923 189,747 160,779 130,742 96,751 2,581,407
Principal 280,865 298,483 319,085 338,487 363,229 386,486 411,927 439,102 468,071 498,108 532,099 4,335,942
628,850 628,850 628,850 628,850 628,850 628,850 628,850 628,850 628,850 628,850 628,850 6,917,349
TOTAL AIRPORT DEBT SERVICING 9,148,954
Interest 634,299 576,563 537,697 498,488 452,262 405,705 354,995 300,412 241,721 179,446 110,492 4,292,082
Principal 532,147 514,480 553,346 592,556 638,781 685,338 736,048 790,630 849,322 911,597 865,003 7,669,249
1,166,446 1,091,043 1,091,043 1,091,043 1,091,043 1,091,043 1,091,043 1,091,043 1,091,043 1,091,043 975,495 11,961,330
Stormwater Levy Projects
2011/12 Remediate Wollundry Lagoon - 6.44% - 15 years
1,005,000
Interest 58,136 55,193 51,751 48,510 44,376 40,491 36,240 31,700 26,861 21,842 16,164 431,263
Principal 46,923 49,866 53,308 56,549 60,683 64,568 68,819 73,359 78,198 83,217 88,895 724,385
TOTAL STORMWATER LEVY DEBT SERVICING
105,059 105,059 105,059 105,059 105,059 105,059 105,059 105,059 105,059 105,059 105,059 1,155,648
appendix 7.

52 Long Term Financial Plan
NEW EXTERNAL LOAN PROJECTS AND DEBT SERVICING - LONG TERM FINANCIAL PLANBORROWING YEAR
CAPITAL PROJECT Amount Borrowed
budget 2014/15
budget 2015/16
budget 2016/17
budget 2017/18
budget 2018/19
budget 2019/20
budget 2020/21
budget 2021/22
budget 2022/23
budget 2023/24
budget 2024/25
TOTALS
SEWER FUND DEBT SERVICING
2015/16 Sewer Capital - 6% - 10 years 1,758,384
Interest - - 105,503 97,499 89,014 80,021 70,487 60,382 49,671 38,316 26,281 617,173
Principal - - 133,405 141,409 149,894 158,887 168,421 178,526 189,238 200,592 212,627 1,532,999
2016/17 Sewer Capital - 7% - 30 years 5,587,164
Interest - - - 391,101 386,961 382,531 377,791 372,719 367,291 361,484 355,271 2,995,149
Principal - - - 59,148 63,288 67,719 72,459 77,531 82,958 88,765 94,979 606,847
2017/18 Sewer Capital - 7% - 30 years 3,387,891
Interest - - - - 237,152 234,642 231,955 229,081 226,005 222,715 219,193 1,600,744
Principal - - - - 35,866 38,376 41,063 43,937 47,012 50,303 53,825 310,381
2018/19 Sewer Capital - 7% - 30 years 2,556,220
Interest - - - - - 178,935 177,041 175,014 172,845 170,525 168,042 1,042,403
Principal - - - - - 27,061 28,955 30,982 33,151 35,472 37,955 193,576
2019/20 Sewer Capital - 7% - 30 years 3,279,761
Interest - - - - - - 229,583 227,153 224,552 221,770 218,792 1,121,850
Principal - - - - - - 34,721 37,151 39,752 42,535 45,512 199,671
2020/21 Sewer Capital - 7% - 10 years 2,751,806
Interest - - - - - - - 192,626 178,685 163,767 147,805 682,883
Principal - - - - - - - 199,169 213,111 228,028 243,990 884,298
2021/22 Sewer Capital - 7% - 10 years 3,578,098
Interest - - - - - - - - 250,467 232,339 212,942 695,747
Principal - - - - - - - - 258,974 277,102 296,499 832,575
- - 238,908 689,157 962,175 1,168,172 1,432,476 1,824,272 2,333,712 2,333,712 2,333,712 13,316,297
2007/08 Sewer 2010 - 7.1% - 30 years 36,000,000
Interest 2,448,343 2,408,385 2,365,447 2,319,305 2,269,721 2,216,438 2,159,180 2,097,651 2,031,531 1,960,479 1,884,127 24,160,607
Principal 535,621 575,579 618,517 664,659 714,243 767,526 824,784 886,313 952,433 1,023,485 1,099,837 8,662,997
2,983,964 2,983,964 2,983,964 2,983,964 2,983,964 2,983,964 2,983,964 2,983,964 2,983,964 2,983,964 2,983,964 32,823,604
TOTAL SEWER DEBT SERVICING 58,899,324
Interest 2,448,343 2,408,385 2,470,950 2,807,905 2,982,849 3,092,567 3,246,038 3,354,626 3,501,048 3,371,395 3,232,452 32,916,557
Principal 535,621 575,579 751,922 865,216 963,291 1,059,569 1,170,402 1,453,609 1,816,629 1,946,282 2,085,224 13,223,344
2,983,964 2,983,964 3,222,872 3,673,121 3,946,139 4,152,136 4,416,440 4,808,236 5,317,676 5,317,676 5,317,676 46,139,901
CONSOLIDATED DEBT SERVICING 113,988,397
Interest 3,769,415 4,215,856 5,162,984 5,662,949 5,636,748 5,613,528 5,537,835 5,402,732 5,334,407 4,928,799 4,515,033 55,780,286
Principal 1,984,496 2,614,351 3,592,909 4,032,761 4,311,867 4,631,711 4,971,708 5,498,605 6,252,783 6,208,636 6,016,381 50,116,208
5,753,911 6,830,208 8,755,893 9,695,709 9,948,615 10,245,239 10,509,543 10,901,338 11,587,190 11,137,435 10,531,414 105,896,495
appendix 7.

53 Long Term Financial Plan
NEW EXTERNAL LOAN PROJECTS AND DEBT SERVICING - LONG TERM FINANCIAL PLANBORROWING YEAR
CAPITAL PROJECT Amount Borrowed
budget 2014/15
budget 2015/16
budget 2016/17
budget 2017/18
budget 2018/19
budget 2019/20
budget 2020/21
budget 2021/22
budget 2022/23
budget 2023/24
budget 2024/25
TOTALS
SEWER FUND DEBT SERVICING
2015/16 Sewer Capital - 6% - 10 years 1,758,384
Interest - - 105,503 97,499 89,014 80,021 70,487 60,382 49,671 38,316 26,281 617,173
Principal - - 133,405 141,409 149,894 158,887 168,421 178,526 189,238 200,592 212,627 1,532,999
2016/17 Sewer Capital - 7% - 30 years 5,587,164
Interest - - - 391,101 386,961 382,531 377,791 372,719 367,291 361,484 355,271 2,995,149
Principal - - - 59,148 63,288 67,719 72,459 77,531 82,958 88,765 94,979 606,847
2017/18 Sewer Capital - 7% - 30 years 3,387,891
Interest - - - - 237,152 234,642 231,955 229,081 226,005 222,715 219,193 1,600,744
Principal - - - - 35,866 38,376 41,063 43,937 47,012 50,303 53,825 310,381
2018/19 Sewer Capital - 7% - 30 years 2,556,220
Interest - - - - - 178,935 177,041 175,014 172,845 170,525 168,042 1,042,403
Principal - - - - - 27,061 28,955 30,982 33,151 35,472 37,955 193,576
2019/20 Sewer Capital - 7% - 30 years 3,279,761
Interest - - - - - - 229,583 227,153 224,552 221,770 218,792 1,121,850
Principal - - - - - - 34,721 37,151 39,752 42,535 45,512 199,671
2020/21 Sewer Capital - 7% - 10 years 2,751,806
Interest - - - - - - - 192,626 178,685 163,767 147,805 682,883
Principal - - - - - - - 199,169 213,111 228,028 243,990 884,298
2021/22 Sewer Capital - 7% - 10 years 3,578,098
Interest - - - - - - - - 250,467 232,339 212,942 695,747
Principal - - - - - - - - 258,974 277,102 296,499 832,575
- - 238,908 689,157 962,175 1,168,172 1,432,476 1,824,272 2,333,712 2,333,712 2,333,712 13,316,297
2007/08 Sewer 2010 - 7.1% - 30 years 36,000,000
Interest 2,448,343 2,408,385 2,365,447 2,319,305 2,269,721 2,216,438 2,159,180 2,097,651 2,031,531 1,960,479 1,884,127 24,160,607
Principal 535,621 575,579 618,517 664,659 714,243 767,526 824,784 886,313 952,433 1,023,485 1,099,837 8,662,997
2,983,964 2,983,964 2,983,964 2,983,964 2,983,964 2,983,964 2,983,964 2,983,964 2,983,964 2,983,964 2,983,964 32,823,604
TOTAL SEWER DEBT SERVICING 58,899,324
Interest 2,448,343 2,408,385 2,470,950 2,807,905 2,982,849 3,092,567 3,246,038 3,354,626 3,501,048 3,371,395 3,232,452 32,916,557
Principal 535,621 575,579 751,922 865,216 963,291 1,059,569 1,170,402 1,453,609 1,816,629 1,946,282 2,085,224 13,223,344
2,983,964 2,983,964 3,222,872 3,673,121 3,946,139 4,152,136 4,416,440 4,808,236 5,317,676 5,317,676 5,317,676 46,139,901
CONSOLIDATED DEBT SERVICING 113,988,397
Interest 3,769,415 4,215,856 5,162,984 5,662,949 5,636,748 5,613,528 5,537,835 5,402,732 5,334,407 4,928,799 4,515,033 55,780,286
Principal 1,984,496 2,614,351 3,592,909 4,032,761 4,311,867 4,631,711 4,971,708 5,498,605 6,252,783 6,208,636 6,016,381 50,116,208
5,753,911 6,830,208 8,755,893 9,695,709 9,948,615 10,245,239 10,509,543 10,901,338 11,587,190 11,137,435 10,531,414 105,896,495
appendix 7.

54 Long Term Financial Plan
appendix 8.
LONG TERM FINANCIAL PLAN CAPITAL PROGRAM - 2015/16 - 2024/25Ref Project Description Funding Source Responsibility 2015/16 2016/17 2017/18 2018/19 2019/20 2020/21 2021/22 2022/23 2023/24 2024/25Environmental & Community Services
1 Lawn Cemetery Master Plan Stage 2A Works
Borrowings (Cemetery Capital Reserve - Future Years Loan Repayments)
Manager Parks Strategic Operations 292,165 637,035
2 Crematorium Office Extension Cemetery Capital Reserve Manager Parks Strategic Operations 318,150
3 Crematorium - Furnace Hot Face Reline Cemetery Capital Reserve Manager Parks Strategic Operations 100,000
4 Renew Street Trees in line with condition and life expectancy
GPR Manager Parks Strategic Operations 65,000 67,500 102,000 104,500 107,000 109,500 112,000 114,500 117,000 119,500
5 Subdivision Tree Planting Contributions Manager Parks Strategic Operations 30,000 90,000 30,000 30,000 30,000 90,000 30,000 30,000 30,000 30,000
6 Estella West and Gobbagombalin Playground
S94* Manager Environment and Recreation Services 150,000
7 Explorer Park at Amundsen Street - Embellishment and landscape works
S94* Manager Environment and Recreation Services 365,186
8 Lineal Park (Promenade - Amundsen) - Corridor Recreation Improvements
S94* Manager Environment and Recreation Services 913,100
9 Estella Sportsground Land Acquisition & Development (Acquisition 17/18 - OS22, Development 18/19 - OS4)
S94* Manager Environment and Recreation Services 1,500,000 1,300,000
10 Land Adjacent Estella Sportsground Acquisition (OS28)
S94* Manager Environment and Recreation Services 1,500,000
11 Oasis Pool Joint Replacement Oasis Building Renewal Reserve Manager Environment and Recreation Services 111,100
12 Oasis - Diving Board Replacements Oasis Building Renewal Reserve Manager Environment and Recreation Services 30,300
13 Upgrade Jubilee Park Clubhouse Ground Level Changeroom
S94* Manager Environment and Recreation Services 100,000
14 Jubilee Park - Replace existing synthetic surfaces at the Jubilee Park Hockey Complex
Hockey Association Contribution $200,000 + Infrastructure Reserve $200,000 + Borrowings $600,000
Manager Environment and Recreation Services 1,000,000
15 Estella - Neighbourhood Open Space Works
S94* Manager Environment and Recreation Services 31,816
16 Construct Estella Community Centre S94* $600,000 + GPR $199,643 + S94 (Old Plan) $121,838 + Reserve $178,519 + Borrowings $100,000 (GPR - Future Years Loan Repayments)
Manager Environment and Recreation Services 1,200,000
17 Boorooma New Playground - Open Space Works
S94* Manager Environment and Recreation Services 51,481
18 Construction of Bourkelands Neighbourhood Park
S94A* Manager Environment and Recreation Services 126,373
19 Construction of Forest Hill Neighbourhood Park
S94A* Manager Environment and Recreation Services 128,702
20 Construction of Lake Albert Neighbourhood Park
S94A* Manager Environment and Recreation Services 0

55 Long Term Financial Plan
LONG TERM FINANCIAL PLAN CAPITAL PROGRAM - 2015/16 - 2024/25Ref Project Description Funding Source Responsibility 2015/16 2016/17 2017/18 2018/19 2019/20 2020/21 2021/22 2022/23 2023/24 2024/25Environmental & Community Services
1 Lawn Cemetery Master Plan Stage 2A Works
Borrowings (Cemetery Capital Reserve - Future Years Loan Repayments)
Manager Parks Strategic Operations 292,165 637,035
2 Crematorium Office Extension Cemetery Capital Reserve Manager Parks Strategic Operations 318,150
3 Crematorium - Furnace Hot Face Reline Cemetery Capital Reserve Manager Parks Strategic Operations 100,000
4 Renew Street Trees in line with condition and life expectancy
GPR Manager Parks Strategic Operations 65,000 67,500 102,000 104,500 107,000 109,500 112,000 114,500 117,000 119,500
5 Subdivision Tree Planting Contributions Manager Parks Strategic Operations 30,000 90,000 30,000 30,000 30,000 90,000 30,000 30,000 30,000 30,000
6 Estella West and Gobbagombalin Playground
S94* Manager Environment and Recreation Services 150,000
7 Explorer Park at Amundsen Street - Embellishment and landscape works
S94* Manager Environment and Recreation Services 365,186
8 Lineal Park (Promenade - Amundsen) - Corridor Recreation Improvements
S94* Manager Environment and Recreation Services 913,100
9 Estella Sportsground Land Acquisition & Development (Acquisition 17/18 - OS22, Development 18/19 - OS4)
S94* Manager Environment and Recreation Services 1,500,000 1,300,000
10 Land Adjacent Estella Sportsground Acquisition (OS28)
S94* Manager Environment and Recreation Services 1,500,000
11 Oasis Pool Joint Replacement Oasis Building Renewal Reserve Manager Environment and Recreation Services 111,100
12 Oasis - Diving Board Replacements Oasis Building Renewal Reserve Manager Environment and Recreation Services 30,300
13 Upgrade Jubilee Park Clubhouse Ground Level Changeroom
S94* Manager Environment and Recreation Services 100,000
14 Jubilee Park - Replace existing synthetic surfaces at the Jubilee Park Hockey Complex
Hockey Association Contribution $200,000 + Infrastructure Reserve $200,000 + Borrowings $600,000
Manager Environment and Recreation Services 1,000,000
15 Estella - Neighbourhood Open Space Works
S94* Manager Environment and Recreation Services 31,816
16 Construct Estella Community Centre S94* $600,000 + GPR $199,643 + S94 (Old Plan) $121,838 + Reserve $178,519 + Borrowings $100,000 (GPR - Future Years Loan Repayments)
Manager Environment and Recreation Services 1,200,000
17 Boorooma New Playground - Open Space Works
S94* Manager Environment and Recreation Services 51,481
18 Construction of Bourkelands Neighbourhood Park
S94A* Manager Environment and Recreation Services 126,373
19 Construction of Forest Hill Neighbourhood Park
S94A* Manager Environment and Recreation Services 128,702
20 Construction of Lake Albert Neighbourhood Park
S94A* Manager Environment and Recreation Services 0
appendix 8.

56 Long Term Financial Plan
appendix 8.
LONG TERM FINANCIAL PLAN CAPITAL PROGRAM - 2015/16 - 2024/25Ref Project Description Funding Source Responsibility 2015/16 2016/17 2017/18 2018/19 2019/20 2020/21 2021/22 2022/23 2023/24 2024/2521 Construction of Mt Austin Neighbourhood
ParkS94A* Manager Environment and Recreation Services 171,603
22 Replace Softfall - Botanic Gardens Adventure Playground
GPR Manager Environment and Recreation Services 84,840
23 Indoor Multi Purpose Stadium Borrowings $7,163,550 + PCYC Contribution $1,830,000 (Sale of Land + Contribution) + Netball Contribution $250,000 + Royal Lifesaving NSW Contribution $205,000 + Sale of Land $400,000
Manager Environment and Recreation Services 9,848,550
24 Implement Recreational Assets Capital Works Plan
GPR Manager Environment and Recreation Services 20,000 20,000 20,000 20,000 20,000 20,000 20,000 20,000 20,000 20,000
25 Implement Sportsgrounds Lighting Program - Jubilee Park Hockey
GPR Manager Environment and Recreation Services 180,000
26 Implement Sportsgrounds Lighting Program - Anderson Oval
GPR Manager Environment and Recreation Services 180,000
27 Implement Sportsgrounds Lighting Program - Forest Hill
GPR Manager Environment and Recreation Services 180,000
28 Implement Sportsgrounds Lighting Program - Frenchs Field
GPR Manager Environment and Recreation Services 180,000
29 Implement Sportsgrounds Lighting Program - Harris Park
GPR Manager Environment and Recreation Services 180,000
30 Implement Sportsgrounds Lighting Program - McPherson Oval
GPR Manager Environment and Recreation Services 180,000
31 Implement Sportsgrounds Lighting Program - Estella
GPR Manager Environment and Recreation Services 180,000
32 Implement Sportsgrounds Lighting Program - Ashmont Oval
GPR Manager Environment and Recreation Services 180,000
33 Implement Sportsgrounds Lighting Program - TBA
GPR Manager Environment and Recreation Services 180,000
34 Renew Parks Facilities GPR Manager Environment and Recreation Services 108,648 112,167 115,732 119,344 123,005 126,715 130,476 134,390 138,422 142,575
35 Renew Playground Equipment GPR Manager Environment and Recreation Services 168,826 173,891 179,108 184,481 190,016 195,716 201,587 207,635 213,864 220,280
36 Renew Recreational Facilities S94A $9,653 + GPR balance Manager Environment and Recreation Services 130,206 133,792 137,455 141,200 145,025 148,936 152,935 156,911 160,990 165,176
37 Upgrade of Backstage Equipment - Civic Theatre
GPR Manager Cultural and Community Services 10,000 10,000 10,000 10,000 10,000 10,000 10,000 10,000 10,000 10,000
38 Acquire pieces for the Australian Print Collection
GPR Manager Cultural and Community Services 8,000 8,000 8,000 8,000 8,000 8,000 8,000 8,000 8,000 8,000
39 Acquire pieces for the National Art Glass Collection
GPR Manager Cultural and Community Services 20,000 20,000 20,000 20,000 20,000 20,000 20,000 20,000 20,000 20,000
40 Welcoming - Roundabouts Public Art Reserve Manager Cultural and Community Services 25,000 25,000
41 Connecting - NightLights/BrightLights Public Art Reserve Manager Cultural and Community Services 50,000 50,000

57 Long Term Financial Plan
LONG TERM FINANCIAL PLAN CAPITAL PROGRAM - 2015/16 - 2024/25Ref Project Description Funding Source Responsibility 2015/16 2016/17 2017/18 2018/19 2019/20 2020/21 2021/22 2022/23 2023/24 2024/2521 Construction of Mt Austin Neighbourhood
ParkS94A* Manager Environment and Recreation Services 171,603
22 Replace Softfall - Botanic Gardens Adventure Playground
GPR Manager Environment and Recreation Services 84,840
23 Indoor Multi Purpose Stadium Borrowings $7,163,550 + PCYC Contribution $1,830,000 (Sale of Land + Contribution) + Netball Contribution $250,000 + Royal Lifesaving NSW Contribution $205,000 + Sale of Land $400,000
Manager Environment and Recreation Services 9,848,550
24 Implement Recreational Assets Capital Works Plan
GPR Manager Environment and Recreation Services 20,000 20,000 20,000 20,000 20,000 20,000 20,000 20,000 20,000 20,000
25 Implement Sportsgrounds Lighting Program - Jubilee Park Hockey
GPR Manager Environment and Recreation Services 180,000
26 Implement Sportsgrounds Lighting Program - Anderson Oval
GPR Manager Environment and Recreation Services 180,000
27 Implement Sportsgrounds Lighting Program - Forest Hill
GPR Manager Environment and Recreation Services 180,000
28 Implement Sportsgrounds Lighting Program - Frenchs Field
GPR Manager Environment and Recreation Services 180,000
29 Implement Sportsgrounds Lighting Program - Harris Park
GPR Manager Environment and Recreation Services 180,000
30 Implement Sportsgrounds Lighting Program - McPherson Oval
GPR Manager Environment and Recreation Services 180,000
31 Implement Sportsgrounds Lighting Program - Estella
GPR Manager Environment and Recreation Services 180,000
32 Implement Sportsgrounds Lighting Program - Ashmont Oval
GPR Manager Environment and Recreation Services 180,000
33 Implement Sportsgrounds Lighting Program - TBA
GPR Manager Environment and Recreation Services 180,000
34 Renew Parks Facilities GPR Manager Environment and Recreation Services 108,648 112,167 115,732 119,344 123,005 126,715 130,476 134,390 138,422 142,575
35 Renew Playground Equipment GPR Manager Environment and Recreation Services 168,826 173,891 179,108 184,481 190,016 195,716 201,587 207,635 213,864 220,280
36 Renew Recreational Facilities S94A $9,653 + GPR balance Manager Environment and Recreation Services 130,206 133,792 137,455 141,200 145,025 148,936 152,935 156,911 160,990 165,176
37 Upgrade of Backstage Equipment - Civic Theatre
GPR Manager Cultural and Community Services 10,000 10,000 10,000 10,000 10,000 10,000 10,000 10,000 10,000 10,000
38 Acquire pieces for the Australian Print Collection
GPR Manager Cultural and Community Services 8,000 8,000 8,000 8,000 8,000 8,000 8,000 8,000 8,000 8,000
39 Acquire pieces for the National Art Glass Collection
GPR Manager Cultural and Community Services 20,000 20,000 20,000 20,000 20,000 20,000 20,000 20,000 20,000 20,000
40 Welcoming - Roundabouts Public Art Reserve Manager Cultural and Community Services 25,000 25,000
41 Connecting - NightLights/BrightLights Public Art Reserve Manager Cultural and Community Services 50,000 50,000
appendix 8.

58 Long Term Financial Plan
appendix 8.
LONG TERM FINANCIAL PLAN CAPITAL PROGRAM - 2015/16 - 2024/25Ref Project Description Funding Source Responsibility 2015/16 2016/17 2017/18 2018/19 2019/20 2020/21 2021/22 2022/23 2023/24 2024/2542 Connecting - Exhibition Centre & Bolton
PkPublic Art Reserve Manager Cultural and Community Services 80,000
43 Placeshaping - VillageWorks Public Art Reserve Manager Cultural and Community Services 25,000 25,000
44 Placeshaping - NeighbourWorks Public Art Reserve Manager Cultural and Community Services 25,000 25,000
45 Placeshaping - ArtWorks Public Art Reserve Manager Cultural and Community Services 14,000 14,000
46 Public Art Projects - TBA Public Art Reserve Manager Cultural and Community Services 100,000 100,000 100,000 100,000 100,000 100,000 100,000 100,000
Total Capital Works - Environmental & Community Services 12,325,055 2,506,136 4,218,951 3,217,525 1,113,346 1,008,867 1,602,033 1,410,686 998,276 1,015,530
Infrastructure Services
47 Amundsen Bridge - Boorooma East to Boorooma
S94* Manager Engineering 0 281,512
48 Bakers Lane and Inglewood Road - Intersection improvements
S94* Manager Engineering 0 17,675
49 Bakers Lane and Sturt Highway - Intersection improvements
S94* Manager Engineering 0 44,188
50 Bakers Lane Widening S94* Manager Engineering 0 330,082
51 Boorooma Street Slip Lane into Boorooma West
S94* Manager Engineering 297,000
52 Bourke Street and Bourkelands Drive Intersection Upgrade
S94* Manager Engineering 107,252
53 Farrer Road Improvements S94* Manager Engineering 126,354 1,137,182 0
54 Glenfield Road Corridor – Widening/duplication of rail bridge and associated drainage. (Note - includes additional work for Glenfield Road - Urana Street Intersection upgrade)
S94* Manager Engineering 100,000 0 3,117,550
55 Glenfield Road/Pearson St - Red Hill Rd to Dobney Ave Widening to 4 lanes (Full length-3 km)
S94* Manager Engineering 1,394,272
56 Harris Road/Pine Gully Road - Dual Lane Roundabout
S94* Manager Engineering 0 1,211,564
57 Kooringal Road Widening to 4 lanes (Full length - 4km)
S94* Manager Engineering 1,179,768
58 Old Narrandera Road - Second Carriageway for 600m
S94A* $100,000 + S94* $737,428
Manager Engineering 837,428
59 Old Narrandera Road/Olympic Highway Roundabout
S94A* $100,000 + S94* $577,886
Manager Engineering 677,886
60 Pine Gully Road - Bike Track S94* Manager Engineering 126,510
61 Pine Gully Road - Second Carriageway for 1.2km
S94A* $100,000 + S94* $1,840,965
Manager Engineering 1,940,965

59 Long Term Financial Plan
LONG TERM FINANCIAL PLAN CAPITAL PROGRAM - 2015/16 - 2024/25Ref Project Description Funding Source Responsibility 2015/16 2016/17 2017/18 2018/19 2019/20 2020/21 2021/22 2022/23 2023/24 2024/2542 Connecting - Exhibition Centre & Bolton
PkPublic Art Reserve Manager Cultural and Community Services 80,000
43 Placeshaping - VillageWorks Public Art Reserve Manager Cultural and Community Services 25,000 25,000
44 Placeshaping - NeighbourWorks Public Art Reserve Manager Cultural and Community Services 25,000 25,000
45 Placeshaping - ArtWorks Public Art Reserve Manager Cultural and Community Services 14,000 14,000
46 Public Art Projects - TBA Public Art Reserve Manager Cultural and Community Services 100,000 100,000 100,000 100,000 100,000 100,000 100,000 100,000
Total Capital Works - Environmental & Community Services 12,325,055 2,506,136 4,218,951 3,217,525 1,113,346 1,008,867 1,602,033 1,410,686 998,276 1,015,530
Infrastructure Services
47 Amundsen Bridge - Boorooma East to Boorooma
S94* Manager Engineering 0 281,512
48 Bakers Lane and Inglewood Road - Intersection improvements
S94* Manager Engineering 0 17,675
49 Bakers Lane and Sturt Highway - Intersection improvements
S94* Manager Engineering 0 44,188
50 Bakers Lane Widening S94* Manager Engineering 0 330,082
51 Boorooma Street Slip Lane into Boorooma West
S94* Manager Engineering 297,000
52 Bourke Street and Bourkelands Drive Intersection Upgrade
S94* Manager Engineering 107,252
53 Farrer Road Improvements S94* Manager Engineering 126,354 1,137,182 0
54 Glenfield Road Corridor – Widening/duplication of rail bridge and associated drainage. (Note - includes additional work for Glenfield Road - Urana Street Intersection upgrade)
S94* Manager Engineering 100,000 0 3,117,550
55 Glenfield Road/Pearson St - Red Hill Rd to Dobney Ave Widening to 4 lanes (Full length-3 km)
S94* Manager Engineering 1,394,272
56 Harris Road/Pine Gully Road - Dual Lane Roundabout
S94* Manager Engineering 0 1,211,564
57 Kooringal Road Widening to 4 lanes (Full length - 4km)
S94* Manager Engineering 1,179,768
58 Old Narrandera Road - Second Carriageway for 600m
S94A* $100,000 + S94* $737,428
Manager Engineering 837,428
59 Old Narrandera Road/Olympic Highway Roundabout
S94A* $100,000 + S94* $577,886
Manager Engineering 677,886
60 Pine Gully Road - Bike Track S94* Manager Engineering 126,510
61 Pine Gully Road - Second Carriageway for 1.2km
S94A* $100,000 + S94* $1,840,965
Manager Engineering 1,940,965
appendix 8.

60 Long Term Financial Plan
LONG TERM FINANCIAL PLAN CAPITAL PROGRAM - 2015/16 - 2024/25Ref Project Description Funding Source Responsibility 2015/16 2016/17 2017/18 2018/19 2019/20 2020/21 2021/22 2022/23 2023/24 2024/2562 Pine Gully Road/Old Narrandera Road -
Intersection UpgradeS94* Manager Engineering 1,077,439
63 Red Hill Rd – Widen to 4 lanes Plumpton Rd to Glenfield Plus widening at Dalman & Yentoo 2.7km
S94* Manager Engineering 144,790 820,475
64 Red Hill Road and Hudson Drive – Intersection improvements
S94* Manager Engineering 0 16,088 91,164
65 Implement unfunded Traffic Committee resolutions as adopted by Council
GPR Manager Engineering 50,000 50,000 50,000 50,000 50,000 50,000 50,000 50,000 50,000 50,000
66 Upgrade Existing Bus Shelters GPR Manager Engineering 20,000 20,000 20,000 20,000 20,000
67 Implement Street Lighting Improvements Program - Roads and Traffic Facilities (as per schedule)
GPR $50,000 + S94A* $19,714 Manager Engineering 69,714 69,714 69,714 69,714 69,714 69,714 69,714 69,714 69,714 69,714
68 Replace Emu Plains Bridge Bridge Replacement Reserve Manager Engineering 303,000
69 Replace Graveyard Creek Bridge Bridge Replacement Reserve Manager Engineering 303,000
70 Replace Tim Hedditch Bridge GPR Manager Engineering 303,000
71 Capital renewal - reseal program GPR + Regional Roads Block Grant $287,256 (incrementing 3% each yr)
Manager Engineering 1,467,736 1,526,360 1,589,229 1,656,715 1,729,233 1,807,233 1,891,210 1,981,709 2,076,539 2,176,212
72 Conduct Heavy Patching Program GPR Manager Engineering 733,868 763,180 794,614 828,357 864,616 903,616 945,605 990,854 1,038,268 1,088,105
73 Conduct Urban Asphalt Program GPR Manager Engineering 701,797 761,813 827,526 899,496 978,340 1,056,585 1,088,283 1,120,931 1,154,558 1,189,195
74 Supplementary Regional Roads Block Grant - project TBA
Block Grant -Supp Manager Engineering 199,000 199,000 199,000 199,000 199,000 199,000 199,000 199,000 199,000 199,000
75 Pavement Rehabilitation Program R2R Grant $770,116 (incrementing 3% each yr) + Regional Roads Block Grant $574,511 (incrementing 3% each yr) + GPR Balance
Manager Engineering 2,935,471 3,052,720 3,178,457 3,313,430 3,458,465 3,614,466 3,782,421 3,963,417 4,153,074 4,344,116
76 Replace Kerb and Gutter GPR + Kerb & Gutter Reserve $123K (2015/16 only)
Manager Engineering 405,962 466,855 536,885 617,417 710,029 816,533 837,699 858,999 880,365 902,374
77 Gravel Resheets GPR Manager Engineering 1,395,127 1,486,243 1,584,856 1,691,663 1,807,436 1,923,060 2,015,469 2,113,821 2,219,010 2,331,645
78 Maintain Roads - Village and Rural Area S94A* Manager Engineering 14,479 14,479 14,479 14,479 14,479 14,479 14,479 14,479 14,479 14,479
79 Renew and Replace Culverts GPR Manager Engineering 500,000 500,000 500,000 500,000 500,000 500,000 500,000 500,000 500,000 500,000
80 Improve Footpaths S94A $16,088 + GPR $83,912 Manager Engineering 100,000 100,000 100,000 100,000 100,000 100,000 100,000 100,000 100,000 100,000
81 Replace Plant and Equipment Plant Replacement Reserve $2,420,950 + Sale of Plant $1,037,550 (amounts adjusted slightly each future fin yr)
Manager Procurement Services 3,826,500 3,164,300 3,500,000 3,500,000 3,500,000 3,500,000 3,500,000 3,500,000 3,500,000 3,500,000
appendix 8.
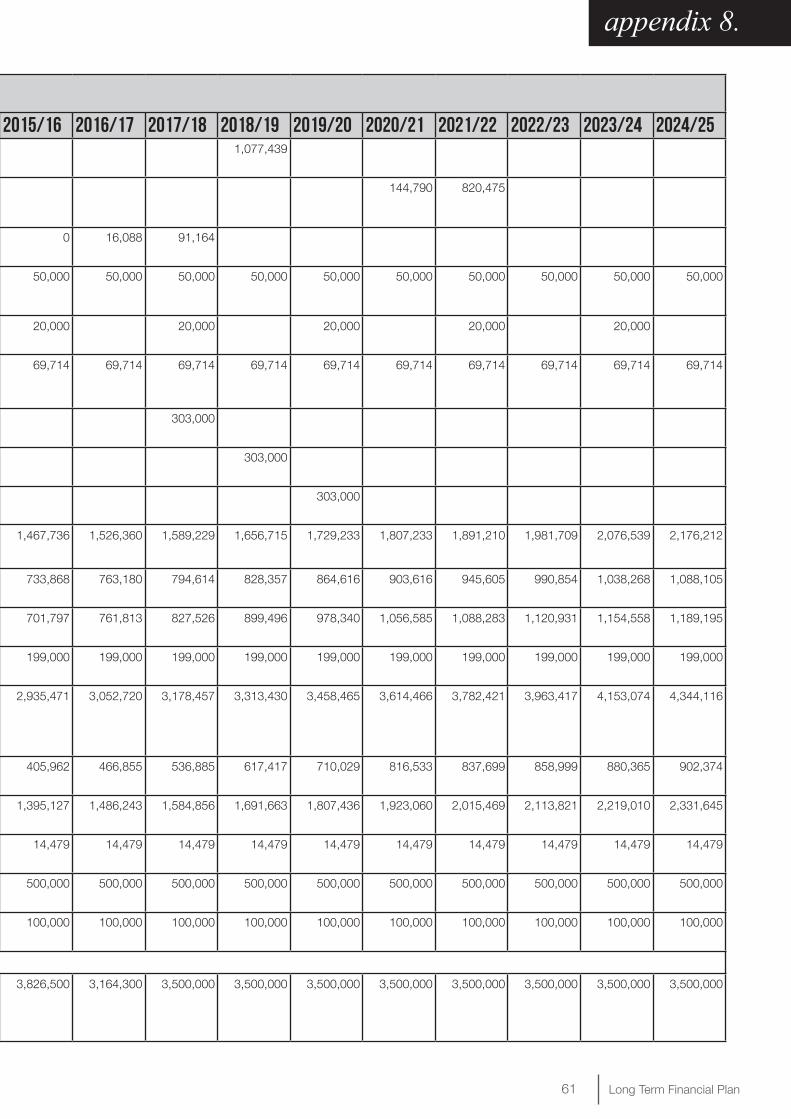
61 Long Term Financial Plan
LONG TERM FINANCIAL PLAN CAPITAL PROGRAM - 2015/16 - 2024/25Ref Project Description Funding Source Responsibility 2015/16 2016/17 2017/18 2018/19 2019/20 2020/21 2021/22 2022/23 2023/24 2024/2562 Pine Gully Road/Old Narrandera Road -
Intersection UpgradeS94* Manager Engineering 1,077,439
63 Red Hill Rd – Widen to 4 lanes Plumpton Rd to Glenfield Plus widening at Dalman & Yentoo 2.7km
S94* Manager Engineering 144,790 820,475
64 Red Hill Road and Hudson Drive – Intersection improvements
S94* Manager Engineering 0 16,088 91,164
65 Implement unfunded Traffic Committee resolutions as adopted by Council
GPR Manager Engineering 50,000 50,000 50,000 50,000 50,000 50,000 50,000 50,000 50,000 50,000
66 Upgrade Existing Bus Shelters GPR Manager Engineering 20,000 20,000 20,000 20,000 20,000
67 Implement Street Lighting Improvements Program - Roads and Traffic Facilities (as per schedule)
GPR $50,000 + S94A* $19,714 Manager Engineering 69,714 69,714 69,714 69,714 69,714 69,714 69,714 69,714 69,714 69,714
68 Replace Emu Plains Bridge Bridge Replacement Reserve Manager Engineering 303,000
69 Replace Graveyard Creek Bridge Bridge Replacement Reserve Manager Engineering 303,000
70 Replace Tim Hedditch Bridge GPR Manager Engineering 303,000
71 Capital renewal - reseal program GPR + Regional Roads Block Grant $287,256 (incrementing 3% each yr)
Manager Engineering 1,467,736 1,526,360 1,589,229 1,656,715 1,729,233 1,807,233 1,891,210 1,981,709 2,076,539 2,176,212
72 Conduct Heavy Patching Program GPR Manager Engineering 733,868 763,180 794,614 828,357 864,616 903,616 945,605 990,854 1,038,268 1,088,105
73 Conduct Urban Asphalt Program GPR Manager Engineering 701,797 761,813 827,526 899,496 978,340 1,056,585 1,088,283 1,120,931 1,154,558 1,189,195
74 Supplementary Regional Roads Block Grant - project TBA
Block Grant -Supp Manager Engineering 199,000 199,000 199,000 199,000 199,000 199,000 199,000 199,000 199,000 199,000
75 Pavement Rehabilitation Program R2R Grant $770,116 (incrementing 3% each yr) + Regional Roads Block Grant $574,511 (incrementing 3% each yr) + GPR Balance
Manager Engineering 2,935,471 3,052,720 3,178,457 3,313,430 3,458,465 3,614,466 3,782,421 3,963,417 4,153,074 4,344,116
76 Replace Kerb and Gutter GPR + Kerb & Gutter Reserve $123K (2015/16 only)
Manager Engineering 405,962 466,855 536,885 617,417 710,029 816,533 837,699 858,999 880,365 902,374
77 Gravel Resheets GPR Manager Engineering 1,395,127 1,486,243 1,584,856 1,691,663 1,807,436 1,923,060 2,015,469 2,113,821 2,219,010 2,331,645
78 Maintain Roads - Village and Rural Area S94A* Manager Engineering 14,479 14,479 14,479 14,479 14,479 14,479 14,479 14,479 14,479 14,479
79 Renew and Replace Culverts GPR Manager Engineering 500,000 500,000 500,000 500,000 500,000 500,000 500,000 500,000 500,000 500,000
80 Improve Footpaths S94A $16,088 + GPR $83,912 Manager Engineering 100,000 100,000 100,000 100,000 100,000 100,000 100,000 100,000 100,000 100,000
81 Replace Plant and Equipment Plant Replacement Reserve $2,420,950 + Sale of Plant $1,037,550 (amounts adjusted slightly each future fin yr)
Manager Procurement Services 3,826,500 3,164,300 3,500,000 3,500,000 3,500,000 3,500,000 3,500,000 3,500,000 3,500,000 3,500,000
appendix 8.

62 Long Term Financial Plan
appendix 8.
LONG TERM FINANCIAL PLAN CAPITAL PROGRAM - 2015/16 - 2024/25Ref Project Description Funding Source Responsibility 2015/16 2016/17 2017/18 2018/19 2019/20 2020/21 2021/22 2022/23 2023/24 2024/25
82 Sewer Reticulation Scheme - Oura Borrowings (Sewer Reserve - Future Years Loan Repayments)
Manager Waste and Stormwater Services 3,848,948
83 Install Sewage Pumping Station Storage - Gracelands - SPS20
Sewer Reserve Manager Waste and Stormwater Services 144,817
84 Renew Sewage Treatment Works - Tarcutta
Sewer Reserve Manager Waste and Stormwater Services 100,000 12,947
85 Renew Sewage Treatment Works - Uranquinty
Sewer Reserve Manager Waste and Stormwater Services 20,533 35,786
86 Sewer - Pump Station - SPS15 Hammond Avenue - New Assets
2017/18 - Borrowings (Sewer Reserve - Future Years Loan Repayments), 2018/19 - Sewer Reserve
Manager Waste and Stormwater Services 401,016 2,719
87 Sewer - Operation Overload Borrowings (Sewer Reserve - Future Years Loan Repayments)
Manager Waste and Stormwater Services 358,235 102,353
88 Sewer - Pump Station - SPS03 Simmons Street - New Assets
Sewer Reserve Manager Waste and Stormwater Services 108,684
89 Sewer - Pump Station - SPS10 Wiradjuri - New Assets
Sewer Reserve Manager Waste and Stormwater Services 20,390
90 Sewer - Pump Station - SPS34 Tarcutta - New Assets
Sewer Reserve Manager Waste and Stormwater Services 6,796 47,578
91 Sewer - Pump Station - SPS52 Henry Street - New Assets
Sewer Reserve Manager Waste and Stormwater Services 2,718
92 Sewer - Pump Station - SPS53 William Street - New Assets
Sewer Reserve Manager Waste and Stormwater Services 6,796 36,703
93 Sewer - Pump Station - SPS54 Marah Street - New Assets
Sewer Reserve Manager Waste and Stormwater Services 6,796 29,906
94 Sewer - SPS04 Bolton Park - New Assets Sewer Reserve Manager Waste and Stormwater Services 27,188 299,063
95 Sewer - Pump Station - SPS01 Sheppard Street - Renewals
Borrowings (Sewer Reserve - Future Years Loan Repayments)
Manager Waste and Stormwater Services 484,138
96 Sewer - Pump Station - SPS02 Forsyth Street - Renewals
Sewer Reserve Manager Waste and Stormwater Services 0 600,000
97 Sewer - Pump Station - SPS03 Simmons Street - Renewals
Sewer Reserve Manager Waste and Stormwater Services 342,109
98 Sewer - Pump Station - SPS04 Bolton Park - Renewals
Sewer Reserve Manager Waste and Stormwater Services 212,311
99 Sewer - Pump Station - SPS06 Shaw Street - Renewals
Sewer Reserve Manager Waste and Stormwater Services 229,384
100 Sewer - Pump Station - SPS09 Cartwrights Hill - Renewals
Sewer Reserve Manager Waste and Stormwater Services 107,352
101 Sewer - Pump Station - SPS10 Wiradjuri - Renewals
Sewer Reserve Manager Waste and Stormwater Services 18,410
102 Sewer - Pump Station - SPS12 CSU - Renewals
Sewer Reserve Manager Waste and Stormwater Services 231,824

63 Long Term Financial Plan
LONG TERM FINANCIAL PLAN CAPITAL PROGRAM - 2015/16 - 2024/25Ref Project Description Funding Source Responsibility 2015/16 2016/17 2017/18 2018/19 2019/20 2020/21 2021/22 2022/23 2023/24 2024/25
82 Sewer Reticulation Scheme - Oura Borrowings (Sewer Reserve - Future Years Loan Repayments)
Manager Waste and Stormwater Services 3,848,948
83 Install Sewage Pumping Station Storage - Gracelands - SPS20
Sewer Reserve Manager Waste and Stormwater Services 144,817
84 Renew Sewage Treatment Works - Tarcutta
Sewer Reserve Manager Waste and Stormwater Services 100,000 12,947
85 Renew Sewage Treatment Works - Uranquinty
Sewer Reserve Manager Waste and Stormwater Services 20,533 35,786
86 Sewer - Pump Station - SPS15 Hammond Avenue - New Assets
2017/18 - Borrowings (Sewer Reserve - Future Years Loan Repayments), 2018/19 - Sewer Reserve
Manager Waste and Stormwater Services 401,016 2,719
87 Sewer - Operation Overload Borrowings (Sewer Reserve - Future Years Loan Repayments)
Manager Waste and Stormwater Services 358,235 102,353
88 Sewer - Pump Station - SPS03 Simmons Street - New Assets
Sewer Reserve Manager Waste and Stormwater Services 108,684
89 Sewer - Pump Station - SPS10 Wiradjuri - New Assets
Sewer Reserve Manager Waste and Stormwater Services 20,390
90 Sewer - Pump Station - SPS34 Tarcutta - New Assets
Sewer Reserve Manager Waste and Stormwater Services 6,796 47,578
91 Sewer - Pump Station - SPS52 Henry Street - New Assets
Sewer Reserve Manager Waste and Stormwater Services 2,718
92 Sewer - Pump Station - SPS53 William Street - New Assets
Sewer Reserve Manager Waste and Stormwater Services 6,796 36,703
93 Sewer - Pump Station - SPS54 Marah Street - New Assets
Sewer Reserve Manager Waste and Stormwater Services 6,796 29,906
94 Sewer - SPS04 Bolton Park - New Assets Sewer Reserve Manager Waste and Stormwater Services 27,188 299,063
95 Sewer - Pump Station - SPS01 Sheppard Street - Renewals
Borrowings (Sewer Reserve - Future Years Loan Repayments)
Manager Waste and Stormwater Services 484,138
96 Sewer - Pump Station - SPS02 Forsyth Street - Renewals
Sewer Reserve Manager Waste and Stormwater Services 0 600,000
97 Sewer - Pump Station - SPS03 Simmons Street - Renewals
Sewer Reserve Manager Waste and Stormwater Services 342,109
98 Sewer - Pump Station - SPS04 Bolton Park - Renewals
Sewer Reserve Manager Waste and Stormwater Services 212,311
99 Sewer - Pump Station - SPS06 Shaw Street - Renewals
Sewer Reserve Manager Waste and Stormwater Services 229,384
100 Sewer - Pump Station - SPS09 Cartwrights Hill - Renewals
Sewer Reserve Manager Waste and Stormwater Services 107,352
101 Sewer - Pump Station - SPS10 Wiradjuri - Renewals
Sewer Reserve Manager Waste and Stormwater Services 18,410
102 Sewer - Pump Station - SPS12 CSU - Renewals
Sewer Reserve Manager Waste and Stormwater Services 231,824
appendix 8.

64 Long Term Financial Plan
LONG TERM FINANCIAL PLAN CAPITAL PROGRAM - 2015/16 - 2024/25Ref Project Description Funding Source Responsibility 2015/16 2016/17 2017/18 2018/19 2019/20 2020/21 2021/22 2022/23 2023/24 2024/25103 Sewer - Pump Station - SPS15 Hammond
Avenue - RenewalsBorrowings (Sewer Reserve - Future Years Loan Repayments)
Manager Waste and Stormwater Services 1,054,907
104 Sewer - Pump Station - SPS17 Cleardale - Renewals
Borrowings (Sewer Reserve - Future Years Loan Repayments)
Manager Waste and Stormwater Services 209,118 99,725
105 Sewer - Pump Station - SPS18 Industrial - Renewals
Sewer Reserve Manager Waste and Stormwater Services 209,118
106 Sewer - Pump Station - SPS20 Gracelands - Renewals
Borrowings (Sewer Reserve - Future Years Loan Repayments)
Manager Waste and Stormwater Services 195,607
107 Sewer - Pump Station - SPS21 Smith Street Forest Hill - Renewals
Sewer Reserve Manager Waste and Stormwater Services 136,698
108 Sewer - Pump Station - SPS26 Kyeamba - Renewals
Borrowings (Sewer Reserve - Future Years Loan Repayments)
Manager Waste and Stormwater Services 187,192
109 Sewer - Pump Station - SPS27 Tarcoola - Renewals
Sewer Reserve Manager Waste and Stormwater Services 164,469
110 Sewer - Pump Station - SPS28 Equex - Renewals
Sewer Reserve Manager Waste and Stormwater Services 119,866
111 Sewer - Pump Station - SPS56 Moorong Street - Renewals
Sewer Reserve Manager Waste and Stormwater Services 130,386
112 Sewer - Pump Stations - General Upgrades
Sewer Reserve Manager Waste and Stormwater Services 100,000
113 Sewer - Pump Station - SPS06 Shaw Street - New Assets
Sewer Reserve Manager Waste and Stormwater Services 61,171
114 Sewer - Pump Station - SPS12 CSU - New Assets
Sewer Reserve Manager Waste and Stormwater Services 0 52,010
115 Sewer - Pump Station - SPS13 Olympic Highway - New Assets
Borrowings (Sewer Reserve - Future Years Loan Repayments)
Manager Waste and Stormwater Services 840,413
116 Sewer - Pump Station - SPS16 Kooringal - New Assets
Sewer Reserve Manager Waste and Stormwater Services 61,172
117 Sewer - Pump Station - SPS19 Estella - New Assets
Borrowings (Sewer Reserve - Future Years Loan Repayments)
Manager Waste and Stormwater Services 228,939
118 Sewer - Pump Station - SPS21 Smith Street - New Assets
Sewer Reserve Manager Waste and Stormwater Services 34,081 5,117
119 Sewer - Pump Station - SPS22 Elizabeth Street - New Assets
Borrowings (Sewer Reserve - Future Years Loan Repayments)
Manager Waste and Stormwater Services 1,032,585
120 Sewer - Pump Station - SPS23 Ashmont - New Assets
Borrowings (Sewer Reserve - Future Years Loan Repayments)
Manager Waste and Stormwater Services 1,337,543 822,870
121 Sewer - Pump Station - SPS24 Lakehaven West - New Assets
Sewer Reserve Manager Waste and Stormwater Services 61,421
122 Sewer - Pump Station - SPS29 Gobba - New Assets
Borrowings (Sewer Reserve - Future Years Loan Repayments)
Manager Waste and Stormwater Services 286,242
123 Sewer - Pump Station - SPS31 Uranquinty - New Assets
Sewer Reserve Manager Waste and Stormwater Services 56,743
124 Sewer - Pump Station - SPS39 Copland Street - New Assets
Sewer Reserve Manager Waste and Stormwater Services 414,910
appendix 8.

65 Long Term Financial Plan
LONG TERM FINANCIAL PLAN CAPITAL PROGRAM - 2015/16 - 2024/25Ref Project Description Funding Source Responsibility 2015/16 2016/17 2017/18 2018/19 2019/20 2020/21 2021/22 2022/23 2023/24 2024/25103 Sewer - Pump Station - SPS15 Hammond
Avenue - RenewalsBorrowings (Sewer Reserve - Future Years Loan Repayments)
Manager Waste and Stormwater Services 1,054,907
104 Sewer - Pump Station - SPS17 Cleardale - Renewals
Borrowings (Sewer Reserve - Future Years Loan Repayments)
Manager Waste and Stormwater Services 209,118 99,725
105 Sewer - Pump Station - SPS18 Industrial - Renewals
Sewer Reserve Manager Waste and Stormwater Services 209,118
106 Sewer - Pump Station - SPS20 Gracelands - Renewals
Borrowings (Sewer Reserve - Future Years Loan Repayments)
Manager Waste and Stormwater Services 195,607
107 Sewer - Pump Station - SPS21 Smith Street Forest Hill - Renewals
Sewer Reserve Manager Waste and Stormwater Services 136,698
108 Sewer - Pump Station - SPS26 Kyeamba - Renewals
Borrowings (Sewer Reserve - Future Years Loan Repayments)
Manager Waste and Stormwater Services 187,192
109 Sewer - Pump Station - SPS27 Tarcoola - Renewals
Sewer Reserve Manager Waste and Stormwater Services 164,469
110 Sewer - Pump Station - SPS28 Equex - Renewals
Sewer Reserve Manager Waste and Stormwater Services 119,866
111 Sewer - Pump Station - SPS56 Moorong Street - Renewals
Sewer Reserve Manager Waste and Stormwater Services 130,386
112 Sewer - Pump Stations - General Upgrades
Sewer Reserve Manager Waste and Stormwater Services 100,000
113 Sewer - Pump Station - SPS06 Shaw Street - New Assets
Sewer Reserve Manager Waste and Stormwater Services 61,171
114 Sewer - Pump Station - SPS12 CSU - New Assets
Sewer Reserve Manager Waste and Stormwater Services 0 52,010
115 Sewer - Pump Station - SPS13 Olympic Highway - New Assets
Borrowings (Sewer Reserve - Future Years Loan Repayments)
Manager Waste and Stormwater Services 840,413
116 Sewer - Pump Station - SPS16 Kooringal - New Assets
Sewer Reserve Manager Waste and Stormwater Services 61,172
117 Sewer - Pump Station - SPS19 Estella - New Assets
Borrowings (Sewer Reserve - Future Years Loan Repayments)
Manager Waste and Stormwater Services 228,939
118 Sewer - Pump Station - SPS21 Smith Street - New Assets
Sewer Reserve Manager Waste and Stormwater Services 34,081 5,117
119 Sewer - Pump Station - SPS22 Elizabeth Street - New Assets
Borrowings (Sewer Reserve - Future Years Loan Repayments)
Manager Waste and Stormwater Services 1,032,585
120 Sewer - Pump Station - SPS23 Ashmont - New Assets
Borrowings (Sewer Reserve - Future Years Loan Repayments)
Manager Waste and Stormwater Services 1,337,543 822,870
121 Sewer - Pump Station - SPS24 Lakehaven West - New Assets
Sewer Reserve Manager Waste and Stormwater Services 61,421
122 Sewer - Pump Station - SPS29 Gobba - New Assets
Borrowings (Sewer Reserve - Future Years Loan Repayments)
Manager Waste and Stormwater Services 286,242
123 Sewer - Pump Station - SPS31 Uranquinty - New Assets
Sewer Reserve Manager Waste and Stormwater Services 56,743
124 Sewer - Pump Station - SPS39 Copland Street - New Assets
Sewer Reserve Manager Waste and Stormwater Services 414,910
appendix 8.

66 Long Term Financial Plan
LONG TERM FINANCIAL PLAN CAPITAL PROGRAM - 2015/16 - 2024/25Ref Project Description Funding Source Responsibility 2015/16 2016/17 2017/18 2018/19 2019/20 2020/21 2021/22 2022/23 2023/24 2024/25125 Sewer - Pump Station - SPS41 Glenfield
East - New Assets2019/20 - Sewer Reserve, 2020/21 + 2021/22 - Borrowings (Sewer Reserve - Future Years Loan Repayments)
Manager Waste and Stormwater Services 0 102,352 1,810,893 1,076,386
126 Sewer - Pump Station - SPS49 Springvale - New Assets
2020/21 - Sewer Reserve, 2021/22 - Borrowings (Sewer Reserve - Future Years Loan Repayments)
Manager Waste and Stormwater Services 15,352 581,105
127 Sewer Treatment Works - Forest Hill Plant - New Assets
Borrowings (Sewer Reserve - Future Years Loan Repayments)
Manager Waste and Stormwater Services 1,218,677
128 Sewer Treatment Works - Narrung Street General Improvements - New Assets
Sewer Reserve Manager Waste and Stormwater Services 200,000
129 Sewer - Gravity Network Extension - New Assets
Borrowings (Sewer Reserve - Future Years Loan Repayments)
Manager Waste and Stormwater Services 897,803 265,494
130 Sewer - Pump Station - SPS31 Uranquinty - Renewals
Borrowings (Sewer Reserve - Future Years Loan Repayments)
Manager Waste and Stormwater Services 520,000
131 Sewer - Pump Station - SPS34 Tarcutta - Renewals
2019/20 - Borrowings (Sewer Reserve - Future Years Loan Repayments), 2023/24 - Sewer Reserve
Manager Waste and Stormwater Services 600,000 266,117
132 Sewer - Pump Station - SPS57 Mangoplah 2 - Renewals
Sewer Reserve Manager Waste and Stormwater Services 30,173
133 Sewer Treatment Works - Collingullie Villages - Renewals
Sewer Reserve Manager Waste and Stormwater Services 40,781
134 Sewer Treatment Works - Mangoplah Villages - Renewals
Sewer Reserve Manager Waste and Stormwater Services 6,051
135 Sewer Pump Stations - Forsyth St New Sewer Pump Station
Borrowings (Sewer Reserve - Future Years Loan Repayments)
Manager Waste and Stormwater Services 1,758,384
136 Sewer Pump Stations - Structural Report Sewer Reserve Manager Waste and Stormwater Services 100,000
137 Sewer - Pump Station - SPS 08 Boorooma - Increase Pump Capacity
Sewer Reserve Manager Waste and Stormwater Services 76,689
138 Sewer - Pump Station - SPS 08 Boorooma - Emergency/Wet Weather Detention STG
Sewer Reserve Manager Waste and Stormwater Services 254,414
139 Sewer - Pump Station - SPS01 + SPS02 Sewer Rising Main Network Diversion
Borrowings (Sewer Reserve - Future Years Loan Repayments)
Manager Waste and Stormwater Services 801,984
140 Sewer - Ashmont SPS, Rising Main & Gravity Main Upgrade
Borrowings (Sewer Reserve - Future Years Loan Repayments)
Manager Waste and Stormwater Services 654,671
141 Implement Road and Drainage Works - Hammond Avenue - Industrial Areas
S94A* Manager Waste and Stormwater Services 128,703 171,604
142 Extend Drainage Trickle Flow - west of Elizabeth Avenue Forest Hill
Stormwater DSP * $144,000 + Stormwater Drainage Reserve $98,513
Manager Waste and Stormwater Services 242,513
143 Implement Stormwater Drainage - Fernleigh Rd Trickle Flow from culvert north west of Rules Club to detention basins - Wagga West DSP Area
Stormwater DSP * $357,306 + Stormwater Drainage Reserve $28,800
Manager Waste and Stormwater Services 386,106
appendix 8.

67 Long Term Financial Plan
LONG TERM FINANCIAL PLAN CAPITAL PROGRAM - 2015/16 - 2024/25Ref Project Description Funding Source Responsibility 2015/16 2016/17 2017/18 2018/19 2019/20 2020/21 2021/22 2022/23 2023/24 2024/25125 Sewer - Pump Station - SPS41 Glenfield
East - New Assets2019/20 - Sewer Reserve, 2020/21 + 2021/22 - Borrowings (Sewer Reserve - Future Years Loan Repayments)
Manager Waste and Stormwater Services 0 102,352 1,810,893 1,076,386
126 Sewer - Pump Station - SPS49 Springvale - New Assets
2020/21 - Sewer Reserve, 2021/22 - Borrowings (Sewer Reserve - Future Years Loan Repayments)
Manager Waste and Stormwater Services 15,352 581,105
127 Sewer Treatment Works - Forest Hill Plant - New Assets
Borrowings (Sewer Reserve - Future Years Loan Repayments)
Manager Waste and Stormwater Services 1,218,677
128 Sewer Treatment Works - Narrung Street General Improvements - New Assets
Sewer Reserve Manager Waste and Stormwater Services 200,000
129 Sewer - Gravity Network Extension - New Assets
Borrowings (Sewer Reserve - Future Years Loan Repayments)
Manager Waste and Stormwater Services 897,803 265,494
130 Sewer - Pump Station - SPS31 Uranquinty - Renewals
Borrowings (Sewer Reserve - Future Years Loan Repayments)
Manager Waste and Stormwater Services 520,000
131 Sewer - Pump Station - SPS34 Tarcutta - Renewals
2019/20 - Borrowings (Sewer Reserve - Future Years Loan Repayments), 2023/24 - Sewer Reserve
Manager Waste and Stormwater Services 600,000 266,117
132 Sewer - Pump Station - SPS57 Mangoplah 2 - Renewals
Sewer Reserve Manager Waste and Stormwater Services 30,173
133 Sewer Treatment Works - Collingullie Villages - Renewals
Sewer Reserve Manager Waste and Stormwater Services 40,781
134 Sewer Treatment Works - Mangoplah Villages - Renewals
Sewer Reserve Manager Waste and Stormwater Services 6,051
135 Sewer Pump Stations - Forsyth St New Sewer Pump Station
Borrowings (Sewer Reserve - Future Years Loan Repayments)
Manager Waste and Stormwater Services 1,758,384
136 Sewer Pump Stations - Structural Report Sewer Reserve Manager Waste and Stormwater Services 100,000
137 Sewer - Pump Station - SPS 08 Boorooma - Increase Pump Capacity
Sewer Reserve Manager Waste and Stormwater Services 76,689
138 Sewer - Pump Station - SPS 08 Boorooma - Emergency/Wet Weather Detention STG
Sewer Reserve Manager Waste and Stormwater Services 254,414
139 Sewer - Pump Station - SPS01 + SPS02 Sewer Rising Main Network Diversion
Borrowings (Sewer Reserve - Future Years Loan Repayments)
Manager Waste and Stormwater Services 801,984
140 Sewer - Ashmont SPS, Rising Main & Gravity Main Upgrade
Borrowings (Sewer Reserve - Future Years Loan Repayments)
Manager Waste and Stormwater Services 654,671
141 Implement Road and Drainage Works - Hammond Avenue - Industrial Areas
S94A* Manager Waste and Stormwater Services 128,703 171,604
142 Extend Drainage Trickle Flow - west of Elizabeth Avenue Forest Hill
Stormwater DSP * $144,000 + Stormwater Drainage Reserve $98,513
Manager Waste and Stormwater Services 242,513
143 Implement Stormwater Drainage - Fernleigh Rd Trickle Flow from culvert north west of Rules Club to detention basins - Wagga West DSP Area
Stormwater DSP * $357,306 + Stormwater Drainage Reserve $28,800
Manager Waste and Stormwater Services 386,106
appendix 8.

68 Long Term Financial Plan
LONG TERM FINANCIAL PLAN CAPITAL PROGRAM - 2015/16 - 2024/25Ref Project Description Funding Source Responsibility 2015/16 2016/17 2017/18 2018/19 2019/20 2020/21 2021/22 2022/23 2023/24 2024/25144 Implement Stormwater Drainage - Tarcoola
Rd - Wagga East DSP AreaStormwater DSP * $314,405 + Stormwater Drainage Reserve $28,800
Manager Waste and Stormwater Services 343,205
145 Implement Stormwater Drainage Improvements - Jubilee Oval to Red Hill Rd - Wagga West DSP Area
Stormwater DSP * $265,580 + Civil Projects Reserve $24,000
Manager Waste and Stormwater Services 289,580
146 Undertake Stormwater Drainage Upgrade - Contour Ridge (Lloyd) approx 5 km - Wagga West DSP Area
Stormwater DSP * $119,102 + Stormwater Drainage Reserve $9,600
Manager Waste and Stormwater Services 128,702
147 Undertake Stormwater Drainage Upgrade - Day, Higgins, Tarcutta St - Wagga West DSP Area
Stormwater DSP * $248,129 + Stormwater Drainage Reserve $20,000
Manager Waste and Stormwater Services 268,129
148 Improve Stormwater drainage - Kincaid St end to Flowerdale pumping station - Wagga West DSP Area
Stormwater DSP * $318,695 + Civil Projects $28,800
Manager Waste and Stormwater Services 347,495
149 GWMC - Construction of a new Waste Cell (Design + Construction)
Solid Waste Reserve Manager Waste and Stormwater Services 150,000 4,242,000 150,000 4,500,000
150 GWMC - Cell Capping Solid Waste Reserve Manager Waste and Stormwater Services 250,000
151 GWMC - Road Rehabilitation Solid Waste Reserve Manager Waste and Stormwater Services 500,000
152 GWMC - Alternate Waste Treatment Facility (Business Case 15/16 + Construction 16/17)
Solid Waste Reserve Manager Waste and Stormwater Services 250,000 2,000,000
153 Eliminate Sewer Joint Connections Sewer Reserve Manager Waste and Stormwater Services 140,809 140,809 140,809 140,809 140,809 140,809 140,809 140,809 140,809 140,809
154 Implement renewal program for Gravity Sewer
Sewer Reserve Manager Waste and Stormwater Services 130,000 130,000 130,000 130,000 130,000 130,000 130,000 130,000 130,000 130,000
155 Implement Sewer Mains Rehabilitation Program
Sewer Reserve Manager Waste and Stormwater Services 1,200,000 1,200,000 1,200,000 1,200,000 1,200,000 1,200,000 1,200,000 1,200,000 1,200,000 1,200,000
156 Install Sewer Network Extensions 2015/16 - Sewer Reserve, 2021/22 Borrowings (Sewer Reserve - Future Years Loan Repayments)
Manager Waste and Stormwater Services 30,000 1,224,096
157 Replacement and Renewal of Sewer Plant Sewer Reserve Manager Waste and Stormwater Services 50,000 50,000 50,000 50,000 50,000 50,000 50,000 50,000 50,000 50,000
158 Flood Pumps - Progressively Upgrade Pumps
GPR Manager Waste and Stormwater Services 40,400 40,400 40,400 40,400 40,400 40,400 40,400 40,400 40,400 40,400
159 Stormwater Pollution Traps Stormwater Levy Manager Waste and Stormwater Services 50,000 50,000 50,000 50,000 50,000 50,000 50,000 50,000 50,000 50,000
160 Upgrade of Stormwater pit lids to lightweight lids
GPR Manager Waste and Stormwater Services 40,400 40,400 40,400
161 Stormwater DSP Project Allocation - TBA Stormwater DSP Manager Waste and Stormwater Services 500,000 500,000 500,000 500,000 500,000
Total Capital Works - Infrastructure Services 17,837,121 25,678,384 21,974,431 23,330,392 26,021,139 23,012,946 21,630,981 18,734,920 18,502,333 23,076,050
appendix 8.
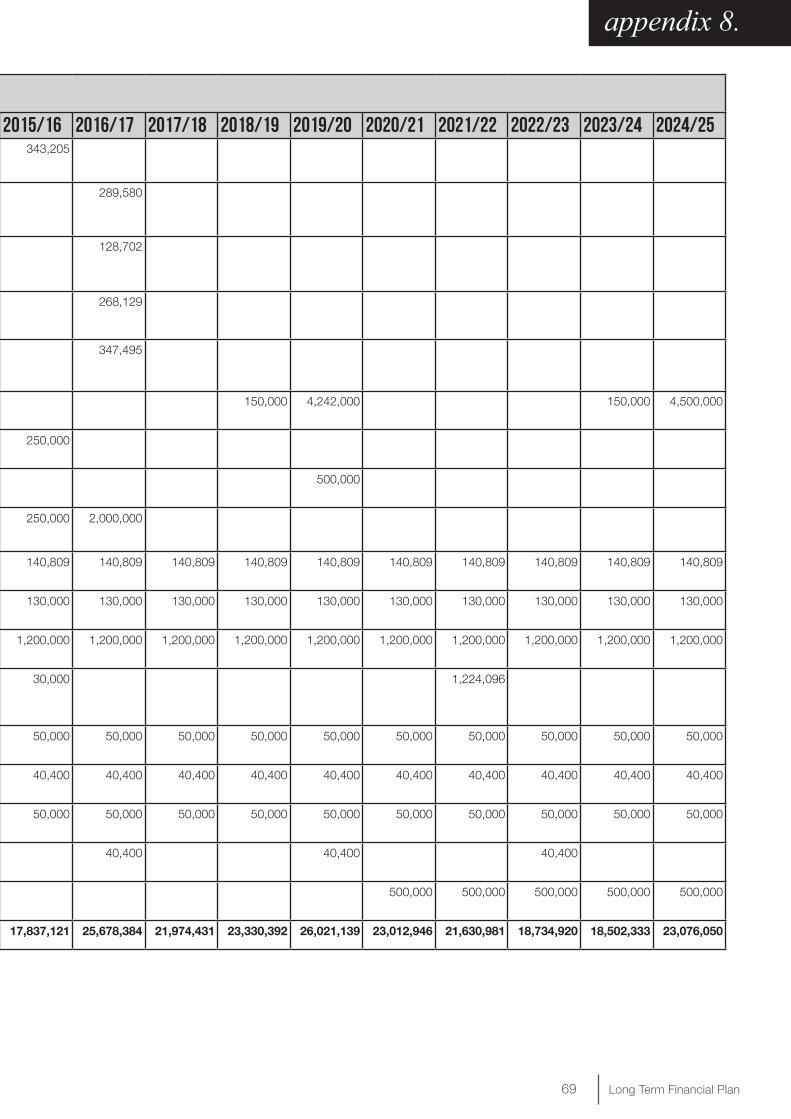
69 Long Term Financial Plan
LONG TERM FINANCIAL PLAN CAPITAL PROGRAM - 2015/16 - 2024/25Ref Project Description Funding Source Responsibility 2015/16 2016/17 2017/18 2018/19 2019/20 2020/21 2021/22 2022/23 2023/24 2024/25144 Implement Stormwater Drainage - Tarcoola
Rd - Wagga East DSP AreaStormwater DSP * $314,405 + Stormwater Drainage Reserve $28,800
Manager Waste and Stormwater Services 343,205
145 Implement Stormwater Drainage Improvements - Jubilee Oval to Red Hill Rd - Wagga West DSP Area
Stormwater DSP * $265,580 + Civil Projects Reserve $24,000
Manager Waste and Stormwater Services 289,580
146 Undertake Stormwater Drainage Upgrade - Contour Ridge (Lloyd) approx 5 km - Wagga West DSP Area
Stormwater DSP * $119,102 + Stormwater Drainage Reserve $9,600
Manager Waste and Stormwater Services 128,702
147 Undertake Stormwater Drainage Upgrade - Day, Higgins, Tarcutta St - Wagga West DSP Area
Stormwater DSP * $248,129 + Stormwater Drainage Reserve $20,000
Manager Waste and Stormwater Services 268,129
148 Improve Stormwater drainage - Kincaid St end to Flowerdale pumping station - Wagga West DSP Area
Stormwater DSP * $318,695 + Civil Projects $28,800
Manager Waste and Stormwater Services 347,495
149 GWMC - Construction of a new Waste Cell (Design + Construction)
Solid Waste Reserve Manager Waste and Stormwater Services 150,000 4,242,000 150,000 4,500,000
150 GWMC - Cell Capping Solid Waste Reserve Manager Waste and Stormwater Services 250,000
151 GWMC - Road Rehabilitation Solid Waste Reserve Manager Waste and Stormwater Services 500,000
152 GWMC - Alternate Waste Treatment Facility (Business Case 15/16 + Construction 16/17)
Solid Waste Reserve Manager Waste and Stormwater Services 250,000 2,000,000
153 Eliminate Sewer Joint Connections Sewer Reserve Manager Waste and Stormwater Services 140,809 140,809 140,809 140,809 140,809 140,809 140,809 140,809 140,809 140,809
154 Implement renewal program for Gravity Sewer
Sewer Reserve Manager Waste and Stormwater Services 130,000 130,000 130,000 130,000 130,000 130,000 130,000 130,000 130,000 130,000
155 Implement Sewer Mains Rehabilitation Program
Sewer Reserve Manager Waste and Stormwater Services 1,200,000 1,200,000 1,200,000 1,200,000 1,200,000 1,200,000 1,200,000 1,200,000 1,200,000 1,200,000
156 Install Sewer Network Extensions 2015/16 - Sewer Reserve, 2021/22 Borrowings (Sewer Reserve - Future Years Loan Repayments)
Manager Waste and Stormwater Services 30,000 1,224,096
157 Replacement and Renewal of Sewer Plant Sewer Reserve Manager Waste and Stormwater Services 50,000 50,000 50,000 50,000 50,000 50,000 50,000 50,000 50,000 50,000
158 Flood Pumps - Progressively Upgrade Pumps
GPR Manager Waste and Stormwater Services 40,400 40,400 40,400 40,400 40,400 40,400 40,400 40,400 40,400 40,400
159 Stormwater Pollution Traps Stormwater Levy Manager Waste and Stormwater Services 50,000 50,000 50,000 50,000 50,000 50,000 50,000 50,000 50,000 50,000
160 Upgrade of Stormwater pit lids to lightweight lids
GPR Manager Waste and Stormwater Services 40,400 40,400 40,400
161 Stormwater DSP Project Allocation - TBA Stormwater DSP Manager Waste and Stormwater Services 500,000 500,000 500,000 500,000 500,000
Total Capital Works - Infrastructure Services 17,837,121 25,678,384 21,974,431 23,330,392 26,021,139 23,012,946 21,630,981 18,734,920 18,502,333 23,076,050
appendix 8.

70 Long Term Financial Plan
LONG TERM FINANCIAL PLAN CAPITAL PROGRAM - 2015/16 - 2024/25Ref Project Description Funding Source Responsibility 2015/16 2016/17 2017/18 2018/19 2019/20 2020/21 2021/22 2022/23 2023/24 2024/25Commercial & Economic Development
162 Riverina Intermodal Freight & Logistics Hub
2015/16 - Borrowings $9.39M (GPR + S94A $200K - Future Years Loan Repayments) + Grant funds $7.25M + Sale of Land $1.12M + Internal Loans Reserve $2.19M (Repaid in 2016/17 + 2017/18 when land sales are realised) + S94A $52K, 2016/17 - Borrowings $4.69M (GPR - Future Years Loan Repayments) + Grant funds $3.63M + Sale of Land $1.12M + Internal Loans Reserve $535K (Repaid in 2017/18 when land sales are realised)+ S94A $27K
Manager CED Strategic 20,010,000 10,005,000
163 Upgrade Airconditioning - Civic Centre S94* Recoupment Manager Council Businesses 606,000
164 Civic Centre Air-Conditioning Upgrade GPR Manager Council Businesses 84,184
165 Buildings - Civic Theatre - Air-Conditioning Upgrade
Civic Theatre Operating Reserve Manager Council Businesses 303,000
166 Civic Centre Southern Lift Control Upgrade GPR Manager Council Businesses 102,000
167 LMC - Capital - RFID network renewal LMC Reserve Manager Council Businesses 50,000
168 LMC - Computer network upgrades LMC Reserve Manager Council Businesses 50,000
169 LMC - Road overlays LMC Reserve Manager Council Businesses 165,000
170 LMC - Re-use Water System (Solids Separation & Aeration)
LMC Reserve Manager Council Businesses 300,000
171 LMC - Additional Cattle Unloading Ramp LMC Reserve Manager Council Businesses 75,000
172 LMC - Additional Draft & Selling Pens in Cattle Yards
LMC Reserve Manager Council Businesses 350,000
173 LMC - New Ablutions Block in Sheepyards LMC Reserve Manager Council Businesses 150,000
174 LMC - Relocate Trucking Yards LMC Reserve Manager Council Businesses 200,000
175 LMC - Additional Sheepyards LMC Reserve Manager Council Businesses 350,000
176 LMC - Asphalt Overlay all Roads & Parking Areas
LMC Reserve Manager Council Businesses 1,123,080
177 Renew Community Amenities - Henwood Park
GPR Manager Council Businesses 190,962
178 Renew Community Amenities - Collingulllie Oval
GPR Manager Council Businesses 196,690
appendix 8.

71 Long Term Financial Plan
LONG TERM FINANCIAL PLAN CAPITAL PROGRAM - 2015/16 - 2024/25Ref Project Description Funding Source Responsibility 2015/16 2016/17 2017/18 2018/19 2019/20 2020/21 2021/22 2022/23 2023/24 2024/25Commercial & Economic Development
162 Riverina Intermodal Freight & Logistics Hub
2015/16 - Borrowings $9.39M (GPR + S94A $200K - Future Years Loan Repayments) + Grant funds $7.25M + Sale of Land $1.12M + Internal Loans Reserve $2.19M (Repaid in 2016/17 + 2017/18 when land sales are realised) + S94A $52K, 2016/17 - Borrowings $4.69M (GPR - Future Years Loan Repayments) + Grant funds $3.63M + Sale of Land $1.12M + Internal Loans Reserve $535K (Repaid in 2017/18 when land sales are realised)+ S94A $27K
Manager CED Strategic 20,010,000 10,005,000
163 Upgrade Airconditioning - Civic Centre S94* Recoupment Manager Council Businesses 606,000
164 Civic Centre Air-Conditioning Upgrade GPR Manager Council Businesses 84,184
165 Buildings - Civic Theatre - Air-Conditioning Upgrade
Civic Theatre Operating Reserve Manager Council Businesses 303,000
166 Civic Centre Southern Lift Control Upgrade GPR Manager Council Businesses 102,000
167 LMC - Capital - RFID network renewal LMC Reserve Manager Council Businesses 50,000
168 LMC - Computer network upgrades LMC Reserve Manager Council Businesses 50,000
169 LMC - Road overlays LMC Reserve Manager Council Businesses 165,000
170 LMC - Re-use Water System (Solids Separation & Aeration)
LMC Reserve Manager Council Businesses 300,000
171 LMC - Additional Cattle Unloading Ramp LMC Reserve Manager Council Businesses 75,000
172 LMC - Additional Draft & Selling Pens in Cattle Yards
LMC Reserve Manager Council Businesses 350,000
173 LMC - New Ablutions Block in Sheepyards LMC Reserve Manager Council Businesses 150,000
174 LMC - Relocate Trucking Yards LMC Reserve Manager Council Businesses 200,000
175 LMC - Additional Sheepyards LMC Reserve Manager Council Businesses 350,000
176 LMC - Asphalt Overlay all Roads & Parking Areas
LMC Reserve Manager Council Businesses 1,123,080
177 Renew Community Amenities - Henwood Park
GPR Manager Council Businesses 190,962
178 Renew Community Amenities - Collingulllie Oval
GPR Manager Council Businesses 196,690
appendix 8.

72 Long Term Financial Plan
appendix 8.
LONG TERM FINANCIAL PLAN CAPITAL PROGRAM - 2015/16 - 2024/25Ref Project Description Funding Source Responsibility 2015/16 2016/17 2017/18 2018/19 2019/20 2020/21 2021/22 2022/23 2023/24 2024/25179 Renew Community Amenities - Bolton
ParkGPR Manager Council Businesses 202,590
180 Renew Community Amenities - Anderson Oval
GPR Manager Council Businesses 208,668
181 Renew Community Amenities - Frenchs Fields
GPR Manager Council Businesses 214,928
182 Renew Community Amenities - Kessler Park
GPR Manager Council Businesses 221,375
183 Renew Community Amenities - Ashmont Oval
GPR Manager Council Businesses 228,016
184 Renew Community Amenities - Forest Hill Oval
GPR Manager Council Businesses 234,856
185 Renew Community Amenities - Uranquinty Sports Ground
GPR Manager Council Businesses 241,901
186 Renew Community Amenities - TBA GPR Manager Council Businesses 249,158
Total Capital Works - Commercial & Economic Development 21,384,184 10,742,652 1,427,670 814,668 517,928 271,375 228,016 234,856 241,901 249,158
TOTAL LTFP CAPITAL PROGRAM 51,546,360 38,927,172 27,621,052 27,362,585 27,652,413 24,293,188 23,461,030 20,380,462 19,742,510 24,340,738

73 Long Term Financial Plan
LONG TERM FINANCIAL PLAN CAPITAL PROGRAM - 2015/16 - 2024/25Ref Project Description Funding Source Responsibility 2015/16 2016/17 2017/18 2018/19 2019/20 2020/21 2021/22 2022/23 2023/24 2024/25179 Renew Community Amenities - Bolton
ParkGPR Manager Council Businesses 202,590
180 Renew Community Amenities - Anderson Oval
GPR Manager Council Businesses 208,668
181 Renew Community Amenities - Frenchs Fields
GPR Manager Council Businesses 214,928
182 Renew Community Amenities - Kessler Park
GPR Manager Council Businesses 221,375
183 Renew Community Amenities - Ashmont Oval
GPR Manager Council Businesses 228,016
184 Renew Community Amenities - Forest Hill Oval
GPR Manager Council Businesses 234,856
185 Renew Community Amenities - Uranquinty Sports Ground
GPR Manager Council Businesses 241,901
186 Renew Community Amenities - TBA GPR Manager Council Businesses 249,158
Total Capital Works - Commercial & Economic Development 21,384,184 10,742,652 1,427,670 814,668 517,928 271,375 228,016 234,856 241,901 249,158
TOTAL LTFP CAPITAL PROGRAM 51,546,360 38,927,172 27,621,052 27,362,585 27,652,413 24,293,188 23,461,030 20,380,462 19,742,510 24,340,738
appendix 8.

74 Long Term Financial Plan
appendix 9.
AIRP
ORT -
LONG
TERM
FINA
NCIA
L PLA
NBU
DGET
20
15/1
6BU
DGET
20
16/1
7BU
DGET
20
17/1
8BU
DGET
20
18/1
9BU
DGET
20
19/2
0BU
DGET
20
20/2
1BU
DGET
20
21/2
2BU
DGET
20
22/2
3BU
DGET
20
23/2
4BU
DGET
20
24/2
5E
stim
ated
Res
erve
Bal
ance
at
sta
rt o
f the
yea
r17
7,02
694
,934
39,1
938,
730
2,77
119
,868
58,8
7411
7,48
619
4,01
828
6,19
3
Rev
enue
Fro
m C
ont
inui
ng O
per
atio
ns
Rat
es &
Ann
ual C
harg
es0
00
00
00
00
0
Use
r C
harg
es &
Fee
s(3
,360
,399
)(3
,461
,211
)(3
,565
,047
)(3
,671
,998
)(3
,782
,158
)(3
,895
,623
)(4
,012
,492
)(4
,132
,867
)(4
,256
,853
)(4
,384
,558
)
Inte
rest
& In
vest
men
t R
even
ue(6
,183
)(6
,368
)(6
,559
)(6
,756
)(6
,959
)(7
,167
)(7
,382
)(7
,604
)(7
,832
)(8
,067
)
Oth
er R
even
ues
(176
,694
)(1
81,9
94)
(187
,454
)(1
93,0
78)
(198
,870
)(2
04,8
36)
(210
,981
)(2
17,3
11)
(223
,830
)(2
30,5
45)
Gra
nts
& C
ontr
ibut
ions
pr
ovid
ed fo
r O
pera
ting
Pur
pose
s
00
00
00
00
00
Gra
nts
& C
ontr
ibut
ions
pr
ovid
ed fo
r C
apita
l P
urpo
ses
00
00
00
00
00
Tota
l Rev
enue
Fro
m
Co
ntin
uing
Op
erat
ions
(3,5
43,2
75)
(3,6
49,5
73)
(3,7
59,0
60)
(3,8
71,8
32)
(3,9
87,9
87)
(4,1
07,6
27)
(4,2
30,8
56)
(4,3
57,7
81)
(4,4
88,5
15)
(4,6
23,1
70)
Exp
ense
s Fr
om
Co
ntin
uing
Op
erat
ions
Em
ploy
ee B
enefi
ts &
On-
Cos
ts47
8,72
549
7,58
551
7,19
853
7,59
555
8,80
658
0,86
560
3,80
462
7,66
065
2,46
967
8,26
9
Bor
row
ing
Cos
ts57
6,56
353
7,69
749
8,48
845
2,26
240
5,70
535
4,99
530
0,41
224
1,72
117
9,44
611
0,49
2
Mat
eria
ls &
Con
trac
ts24
3,43
124
6,52
224
9,70
525
2,98
325
6,36
025
9,83
926
3,42
226
7,11
327
0,91
627
4,83
2
Dep
reci
atio
n &
Am
ortis
atio
n23
2,58
424
5,72
525
9,60
827
4,27
628
9,77
330
6,14
532
3,44
234
1,71
636
1,02
338
1,42
1
Oth
er E
xpen
ses
1,81
2,16
81,
870,
164
1,93
1,57
71,
996,
170
2,06
4,68
12,
136,
874
2,21
3,97
52,
295,
433
2,38
1,91
12,
472,
206
Tota
l Exp
ense
s Fr
om
C
ont
inui
ng O
per
atio
ns3,
343,
471
3,39
7,69
23,
456,
576
3,51
3,28
63,
575,
325
3,63
8,71
73,
705,
055
3,77
3,64
43,
845,
766
3,91
7,22
0
Net
Ope
ratin
g (P
rofit
)/Los
s(1
99,8
04)
(251
,881
)(3
02,4
85)
(358
,546
)(4
12,6
62)
(468
,910
)(5
25,8
00)
(584
,137
)(6
42,7
49)
(705
,950
)

75 Long Term Financial Plan
appendix 9.
AIRP
ORT -
LONG
TERM
FINA
NCIA
L PLA
NBU
DGET
20
15/1
6BU
DGET
20
16/1
7BU
DGET
20
17/1
8BU
DGET
20
18/1
9BU
DGET
20
19/2
0BU
DGET
20
20/2
1BU
DGET
20
21/2
2BU
DGET
20
22/2
3BU
DGET
20
23/2
4BU
DGET
20
24/2
5C
apit
al a
nd R
eser
ve M
ove
men
ts
Cap
ital E
xpen
ditu
re -
R
enew
als
00
00
00
00
00
Cap
ital E
xpen
ditu
re -
New
P
roje
cts
00
00
00
00
00
Loan
Rep
aym
ents
514,
480
553,
346
592,
556
638,
781
685,
338
736,
048
790,
630
849,
322
911,
597
865,
003
New
Loa
n B
orro
win
gs0
00
00
00
00
0
Pro
ceed
s fro
m S
ale
of
inta
ngib
le &
tang
ible
Ass
ets
00
00
00
00
00
Net
Mov
emen
ts to
/(fro
m)
Res
erve
s(8
2,09
2)(5
5,74
0)(3
0,46
3)(5
,959
)17
,096
39,0
0758
,612
76,5
3292
,175
222,
369
Tota
l Cap
ital
and
R
eser
ve M
ove
men
ts43
2,38
849
7,60
656
2,09
363
2,82
270
2,43
577
5,05
584
9,24
292
5,85
41,
003,
772
1,08
7,37
2
Net
Res
ult
232,
584
245,
725
259,
608
274,
276
289,
773
306,
145
323,
442
341,
716
361,
023
381,
421
Add
bac
k D
epre
ciat
ion
Exp
ense
(non
-cas
h)23
2,58
424
5,72
525
9,60
827
4,27
628
9,77
330
6,14
532
3,44
234
1,71
636
1,02
338
1,42
1
Cas
h B
udg
et (S
urp
lus)
/D
efici
t(0
)(0
)(0
)(0
)(0
)0
(0)
(0)
(0)
(0)

76 Long Term Financial Plan
appendix 10.
LIVES
TOCK
MAR
KETI
NG C
ENTR
E - LO
NG TE
RM FI
NANC
IAL P
LAN
BUDG
ET
2015
/16
BUDG
ET
2016
/17
BUDG
ET
2017
/18
BUDG
ET
2018
/19
BUDG
ET
2019
/20
BUDG
ET
2020
/21
BUDG
ET
2021
/22
BUDG
ET
2022
/23
BUDG
ET
2023
/24
BUDG
ET
2024
/25
Est
imat
ed R
eser
ve
Bal
ance
at s
tart
of t
he y
ear
4,89
9,96
54,
059,
046
4,20
6,33
53,
632,
567
4,23
1,30
24,
879,
790
5,52
8,68
96,
277,
801
7,07
7,52
87,
928,
041
Rev
enue
Fro
m
Co
ntin
uing
Op
erat
ions
Rat
es &
Ann
ual C
harg
es0
00
00
00
00
0
Use
r C
harg
es &
Fee
s(3
,637
,512
)(3
,760
,855
)(3
,888
,398
)(4
,020
,286
)(4
,156
,665
)(4
,297
,691
)(4
,443
,522
)(4
,594
,322
)(4
,750
,261
)(4
,911
,514
)
Inte
rest
& In
vest
men
t R
even
ue0
00
00
00
00
0
Oth
er R
even
ues
(30,
478)
(31,
392)
(32,
334)
(33,
304)
(34,
303)
(35,
332)
(36,
392)
(37,
484)
(38,
608)
(39,
766)
Gra
nts
& C
ontr
ibut
ions
pr
ovid
ed fo
r O
pera
ting
Pur
pose
s
00
00
00
00
00
Gra
nts
& C
ontr
ibut
ions
pr
ovid
ed fo
r C
apita
l P
urpo
ses
00
00
00
00
00
Rev
enue
Fro
m
Co
ntin
uing
Op
erat
ions
(3,6
67,9
89)
(3,7
92,2
47)
(3,9
20,7
32)
(4,0
53,5
89)
(4,1
90,9
68)
(4,3
33,0
23)
(4,4
79,9
14)
(4,6
31,8
05)
(4,7
88,8
69)
(4,9
51,2
80)
Exp
ense
s Fr
om
C
ont
inui
ng O
per
atio
ns
Em
ploy
ee B
enefi
ts &
On-
Cos
ts98
9,23
71,
028,
068
1,06
7,47
31,
109,
472
1,15
3,15
21,
198,
579
1,24
5,82
41,
294,
958
1,34
6,05
71,
399,
200
Bor
row
ing
Cos
ts0
00
00
00
00
0
Mat
eria
ls &
Con
trac
ts29
3,56
829
6,07
129
6,15
829
8,73
930
1,39
730
4,13
430
6,95
430
9,85
831
2,85
031
5,93
1
Dep
reci
atio
n &
A
mor
tisat
ion
241,
629
255,
281
269,
704
284,
942
301,
042
318,
050
336,
020
355,
005
375,
063
396,
254
Oth
er E
xpen
ses
1,93
6,10
31,
970,
818
2,00
7,78
92,
046,
644
2,08
7,93
02,
131,
411
2,17
8,02
42,
227,
263
2,27
9,44
82,
334,
981

77 Long Term Financial Plan
appendix 10.
LIVES
TOCK
MAR
KETI
NG C
ENTR
E - LO
NG TE
RM FI
NANC
IAL P
LAN
BUDG
ET
2015
/16
BUDG
ET
2016
/17
BUDG
ET
2017
/18
BUDG
ET
2018
/19
BUDG
ET
2019
/20
BUDG
ET
2020
/21
BUDG
ET
2021
/22
BUDG
ET
2022
/23
BUDG
ET
2023
/24
BUDG
ET
2024
/25
Exp
ense
s Fr
om
C
ont
inui
ng O
per
atio
ns3,
460,
537
3,55
0,23
83,
641,
124
3,73
9,79
73,
843,
521
3,95
2,17
54,
066,
822
4,18
7,08
44,
313,
418
4,44
6,36
7
Net
Op
erat
ing
(Pro
fit)
/Lo
ss(2
07,4
53)
(242
,009
)(2
79,6
08)
(313
,792
)(3
47,4
47)
(380
,848
)(4
13,0
91)
(444
,722
)(4
75,4
50)
(504
,913
)
Cap
ital
and
Res
erve
M
ove
men
ts
Cap
ital E
xpen
ditu
re -
R
enew
als
215,
000
01,
123,
080
00
50,0
000
00
0
Cap
ital E
xpen
ditu
re -
New
P
roje
cts
1,07
5,00
035
0,00
00
00
00
00
0
Loan
Rep
aym
ents
00
00
00
00
00
New
Loa
n B
orro
win
gs0
00
00
00
00
0
Pro
ceed
s fro
m S
ale
of
inta
ngib
le &
tang
ible
A
sset
s
00
00
00
00
00
Net
Mov
emen
ts to
/(fro
m)
Res
erve
s(8
40,9
19)
147,
289
(573
,768
)59
8,73
464
8,48
964
8,89
974
9,11
279
9,72
785
0,51
390
1,16
8
Tota
l Cap
ital
and
R
eser
ve M
ove
men
ts44
9,08
149
7,28
954
9,31
259
8,73
464
8,48
969
8,89
974
9,11
279
9,72
785
0,51
390
1,16
8
Net
Res
ult
241,
629
255,
281
269,
704
284,
942
301,
042
318,
050
336,
020
355,
005
375,
063
396,
254
Add
bac
k D
epre
ciat
ion
Exp
ense
(non
-cas
h)24
1,62
925
5,28
126
9,70
428
4,94
230
1,04
231
8,05
033
6,02
035
5,00
537
5,06
339
6,25
4
Cas
h B
udg
et (S
urp
lus)
/D
efici
t0
(0)
(0)
(0)
(0)
(0)
(0)
(0)
(0)
(0)

78 Long Term Financial Plan
appendix 11.
SEW
ER FU
ND -
LONG
TERM
FINA
NCIA
L PLA
NBU
DGET
20
15/1
6BU
DGET
20
16/1
7BU
DGET
20
17/1
8BU
DGET
20
18/1
9BU
DGET
20
19/2
0BU
DGET
20
20/2
1BU
DGET
20
21/2
2BU
DGET
20
22/2
3BU
DGET
20
23/2
4BU
DGET
20
24/2
5
Est
imat
ed R
eser
ve
Bal
ance
at s
tart
of t
he y
ear
7,35
3,50
67,
103,
495
7,11
6,11
87,
041,
534
6,58
6,98
16,
696,
706
7,09
8,03
77,
248,
227
6,13
7,78
65,
978,
528
Rev
enue
Fro
m C
ont
inui
ng O
per
atio
ns
Rat
es &
Ann
ual C
harg
es(1
0,87
3,65
0)(1
1,35
1,93
9)(1
1,85
1,47
0)(1
2,26
0,64
4)(1
2,68
3,99
7)(1
3,12
2,02
1)(1
3,57
5,22
6)(1
4,04
4,14
0)(1
4,52
9,30
8)(1
5,03
1,29
6)
Use
r C
harg
es &
Fee
s(4
,459
,338
)(4
,568
,557
)(4
,680
,517
)(4
,795
,286
)(4
,912
,936
)(5
,033
,539
)(5
,157
,168
)(5
,283
,901
)(5
,413
,815
)(5
,546
,990
)
Inte
rest
& In
vest
men
t R
even
ue(3
51,3
52)
(424
,614
)(4
82,4
64)
(464
,562
)(4
97,1
17)
(509
,761
)(5
31,7
80)
(521
,489
)(5
41,3
70)
(592
,000
)
Oth
er R
even
ues
00
00
00
00
00
Gra
nts
& C
ontr
ibut
ions
pr
ovid
ed fo
r O
pera
ting
Pur
pose
s
(160
,664
)(1
67,8
93)
(175
,449
)(1
81,5
89)
(187
,945
)(1
94,5
23)
(201
,331
)(2
08,3
78)
(215
,671
)(2
23,2
20)
Gra
nts
& C
ontr
ibut
ions
pr
ovid
ed fo
r C
apita
l P
urpo
ses
(1,0
12,0
00)
(1,2
75,0
00)
(1,2
89,0
00)
(1,3
05,0
00)
(1,3
19,0
00)
(1,3
01,0
00)
(1,3
15,0
00)
(1,3
30,0
00)
(1,3
49,0
00)
(1,3
49,0
00)
Rev
enue
Fro
m
Co
ntin
uing
Op
erat
ions
(16,
857,
004)
(17,
788,
003)
(18,
478,
899)
(19,
007,
082)
(19,
600,
995)
(20,
160,
843)
(20,
780,
505)
(21,
387,
908)
(22,
049,
164)
(22,
742,
505)
Exp
ense
s Fr
om
Co
ntin
uing
Op
erat
ions
Em
ploy
ee B
enefi
ts &
On-
Cos
ts2,
153,
618
2,23
9,04
12,
326,
071
2,41
8,46
42,
514,
553
2,61
4,48
52,
718,
414
2,82
6,49
92,
938,
908
3,05
5,81
3
Bor
row
ing
Cos
ts2,
408,
385
2,47
0,95
02,
807,
905
2,98
2,84
93,
092,
567
3,24
6,03
83,
354,
626
3,50
1,04
83,
371,
395
3,23
2,45
2
Mat
eria
ls &
Con
trac
ts1,
168,
047
1,09
8,25
71,
225,
675
1,15
7,70
81,
290,
752
1,22
4,83
51,
359,
980
1,29
6,22
71,
433,
611
1,37
2,16
9
Dep
reci
atio
n &
A
mor
tisat
ion
6,66
7,40
17,
044,
110
7,44
2,10
27,
862,
581
8,30
6,81
68,
776,
151
9,27
2,00
49,
795,
872
10,3
49,3
3910
,934
,077
Oth
er E
xpen
ses
8,58
8,36
78,
848,
556
9,09
4,23
59,
343,
813
9,61
1,38
69,
824,
827
10,1
15,5
5710
,416
,751
10,7
31,3
0111
,054
,510

79 Long Term Financial Plan
appendix 11.
SEW
ER FU
ND -
LONG
TERM
FINA
NCIA
L PLA
NBU
DGET
20
15/1
6BU
DGET
20
16/1
7BU
DGET
20
17/1
8BU
DGET
20
18/1
9BU
DGET
20
19/2
0BU
DGET
20
20/2
1BU
DGET
20
21/2
2BU
DGET
20
22/2
3BU
DGET
20
23/2
4BU
DGET
20
24/2
5E
xpen
ses
Fro
m
Co
ntin
uing
Op
erat
ions
20,9
85,8
1821
,700
,913
22,8
95,9
8823
,765
,414
24,8
16,0
7425
,686
,336
26,8
20,5
8127
,836
,398
28,8
24,5
5429
,649
,021
Net
Ope
ratin
g (P
rofit
)/Los
s4,
128,
814
3,91
2,91
04,
417,
089
4,75
8,33
25,
215,
080
5,52
5,49
26,
040,
076
6,44
8,49
06,
775,
390
6,90
6,51
6
Cap
ital
and
Res
erve
Mo
vem
ents
Cap
ital E
xpen
ditu
re -
R
enew
als
2,08
3,01
92,
192,
302
4,01
6,66
52,
018,
927
3,33
7,70
22,
175,
480
1,76
3,66
82,
169,
542
1,78
6,92
61,
520,
809
Cap
ital E
xpen
ditu
re -
New
P
roje
cts
1,88
8,38
45,
761,
517
1,60
5,60
63,
132,
804
1,86
4,50
12,
255,
252
3,44
2,55
847
1,65
30
0
Loan
Rep
aym
ents
575,
579
751,
922
865,
216
963,
291
1,05
9,56
91,
170,
402
1,45
3,60
91,
816,
629
1,94
6,28
22,
085,
224
New
Loa
n B
orro
win
gs(1
,758
,384
)(5
,587
,164
)(3
,387
,891
)(2
,556
,220
)(3
,279
,761
)(2
,751
,806
)(3
,578
,098
)0
00
Pro
ceed
s fro
m S
ale
of
inta
ngib
le &
tang
ible
A
sset
s
00
00
00
00
00
Net
Mov
emen
ts to
/(fro
m)
Res
erve
s(2
50,0
11)
12,6
22(7
4,58
4)(4
54,5
54)
109,
725
401,
331
150,
191
(1,1
10,4
41)
(159
,258
)42
1,52
8
Tota
l Cap
ital
and
R
eser
ve M
ove
men
ts2,
538,
587
3,13
1,19
93,
025,
013
3,10
4,24
83,
091,
737
3,25
0,65
93,
231,
928
3,34
7,38
33,
573,
949
4,02
7,56
1
Net
Res
ult
6,66
7,40
17,
044,
110
7,44
2,10
27,
862,
581
8,30
6,81
68,
776,
151
9,27
2,00
49,
795,
872
10,3
49,3
3910
,934
,077
Add
bac
k D
epre
ciat
ion
Exp
ense
(non
-cas
h)6,
667,
401
7,04
4,11
07,
442,
102
7,86
2,58
18,
306,
816
8,77
6,15
19,
272,
004
9,79
5,87
210
,349
,339
10,9
34,0
77
Cas
h B
udg
et (S
urp
lus)
/D
efici
t0
(0)
00
00
(0)
00
0

80 Long Term Financial Plan
appendix 12.
SOLID
WAS
TE -
LONG
TERM
FINA
NCIA
L PLA
NBU
DGET
20
15/1
6BU
DGET
20
16/1
7BU
DGET
20
17/1
8BU
DGET
20
18/1
9BU
DGET
20
19/2
0BU
DGET
20
20/2
1BU
DGET
20
21/2
2BU
DGET
20
22/2
3BU
DGET
20
23/2
4BU
DGET
20
24/2
5
Est
imat
ed R
eser
ve
Bal
ance
at s
tart
of t
he y
ear
2,52
4,63
93,
094,
732
2,54
1,18
04,
202,
958
5,59
0,51
42,
759,
399
4,57
2,42
86,
744,
287
9,04
6,43
811
,338
,032
Rev
enue
Fro
m C
ont
inui
ng O
per
atio
ns
Rat
es &
Ann
ual C
harg
es(7
,228
,521
)(7
,445
,377
)(7
,668
,738
)(7
,898
,801
)(8
,135
,765
)(8
,379
,838
)(8
,631
,233
)(8
,890
,170
)(9
,156
,679
)(9
,431
,184
)
Use
r C
harg
es &
Fee
s(2
,990
,210
)(3
,100
,196
)(3
,214
,292
)(3
,332
,656
)(3
,455
,447
)(3
,582
,835
)(3
,714
,993
)(3
,852
,103
)(3
,994
,172
)(4
,141
,937
)
Inte
rest
& In
vest
men
t R
even
ue(8
4,04
3)(1
01,5
68)
(115
,405
)(1
11,1
23)
(118
,910
)(1
21,9
35)
(127
,202
)(1
24,7
40)
(129
,496
)(1
41,6
06)
Oth
er R
even
ues
(61,
375)
(62,
784)
(64,
229)
(65,
710)
(67,
227)
(68,
783)
(70,
378)
(72,
012)
(73,
687)
(75,
405)
Gra
nts
& C
ontr
ibut
ions
pr
ovid
ed fo
r O
pera
ting
Pur
pose
s
(115
,300
)(1
18,7
59)
(122
,322
)(1
25,9
92)
(129
,772
)(1
33,6
65)
(137
,675
)(1
41,8
05)
(146
,059
)(1
50,4
41)
Gra
nts
& C
ontr
ibut
ions
pr
ovid
ed fo
r C
apita
l P
urpo
ses
00
00
00
00
00
Rev
enue
Fro
m
Co
ntin
uing
Op
erat
ions
(10,
479,
450)
(10,
828,
684)
(11,
184,
987)
(11,
534,
281)
(11,
907,
121)
(12,
287,
055)
(12,
681,
480)
(13,
080,
830)
(13,
500,
094)
(13,
940,
573)
Exp
ense
s Fr
om
Co
ntin
uing
Op
erat
ions
Em
ploy
ee B
enefi
ts &
On-
Cos
ts1,
093,
163
1,13
6,83
11,
182,
246
1,22
9,47
81,
278,
599
1,32
9,68
51,
382,
814
1,43
8,06
91,
495,
533
1,55
5,29
7
Bor
row
ing
Cos
ts0
00
00
00
00
0
Mat
eria
ls &
Con
trac
ts4,
516,
823
4,66
3,10
54,
817,
534
4,97
9,13
05,
147,
097
5,32
1,69
05,
503,
170
5,69
1,81
15,
887,
897
6,09
1,72
2
Dep
reci
atio
n &
A
mor
tisat
ion
339,
831
359,
031
379,
316
400,
748
423,
390
447,
312
472,
585
499,
286
527,
495
557,
299
Oth
er E
xpen
ses
3,79
9,37
23,
582,
300
3,52
3,42
93,
788,
116
3,57
0,54
03,
822,
651
3,62
3,63
63,
648,
799
3,67
5,07
03,
703,
261

81 Long Term Financial Plan
appendix 12.
SOLID
WAS
TE -
LONG
TERM
FINA
NCIA
L PLA
NBU
DGET
20
15/1
6BU
DGET
20
16/1
7BU
DGET
20
17/1
8BU
DGET
20
18/1
9BU
DGET
20
19/2
0BU
DGET
20
20/2
1BU
DGET
20
21/2
2BU
DGET
20
22/2
3BU
DGET
20
23/2
4BU
DGET
20
24/2
5E
xpen
ses
Fro
m
Co
ntin
uing
Op
erat
ions
9,74
9,18
89,
741,
268
9,90
2,52
610
,397
,472
10,4
19,6
2710
,921
,337
10,9
82,2
0511
,277
,965
11,5
85,9
9511
,907
,578
Net
Op
erat
ing
(Pro
fit)
/Lo
ss(7
30,2
62)
(1,0
87,4
17)
(1,2
82,4
61)
(1,1
36,8
09)
(1,4
87,4
95)
(1,3
65,7
18)
(1,6
99,2
75)
(1,8
02,8
65)
(1,9
14,0
98)
(2,0
32,9
94)
Cap
ital
and
Res
erve
Mo
vem
ents
Cap
ital E
xpen
ditu
re -
R
enew
als
00
00
500,
000
00
00
0
Cap
ital E
xpen
ditu
re -
New
P
roje
cts
500,
000
2,00
0,00
00
150,
000
4,24
2,00
00
00
150,
000
4,50
0,00
0
Loan
Rep
aym
ents
00
00
00
00
00
New
Loa
n B
orro
win
gs0
00
00
00
00
0
Pro
ceed
s fro
m S
ale
of
inta
ngib
le &
tang
ible
A
sset
s
00
00
00
00
00
Net
Mov
emen
ts to
/(fro
m)
Res
erve
s57
0,09
3(5
53,5
52)
1,66
1,77
81,
387,
557
(2,8
31,1
15)
1,81
3,02
92,
171,
859
2,30
2,15
12,
291,
594
(1,9
09,7
07)
Tota
l Cap
ital
and
R
eser
ve M
ove
men
ts1,
070,
093
1,44
6,44
81,
661,
778
1,53
7,55
71,
910,
885
1,81
3,02
92,
171,
859
2,30
2,15
12,
441,
594
2,59
0,29
3
Net
Res
ult
339,
831
359,
031
379,
316
400,
748
423,
390
447,
312
472,
585
499,
286
527,
495
557,
299
Add
bac
k D
epre
ciat
ion
Exp
ense
(non
-cas
h)33
9,83
135
9,03
137
9,31
640
0,74
842
3,39
044
7,31
247
2,58
549
9,28
652
7,49
555
7,29
9
Cas
h B
udg
et (S
urp
lus)
/D
efici
t0
00
(0)
(0)
(0)
(0)
(0)
(0)
(0)

82 Long Term Financial Plan
appendix 13.
STOR
MW
ATER
LEVY
- LO
NG TE
RM FI
NANC
IAL P
LAN
BUDG
ET
2015
/16
BUDG
ET
2016
/17
BUDG
ET
2017
/18
BUDG
ET
2018
/19
BUDG
ET
2019
/20
BUDG
ET
2020
/21
BUDG
ET
2021
/22
BUDG
ET
2022
/23
BUDG
ET
2023
/24
BUDG
ET
2024
/25
Est
imat
ed R
eser
ve
Bal
ance
at s
tart
of t
he y
ear
965,
604
965,
604
965,
604
965,
604
965,
604
965,
604
965,
604
965,
604
965,
604
965,
604
Rev
enue
Fro
m C
ont
inui
ng O
per
atio
ns
Rat
es &
Ann
ual C
harg
es(6
49,5
83)
(657
,083
)(6
64,5
83)
(672
,083
)(6
79,5
83)
(687
,083
)(6
94,5
83)
(702
,083
)(7
09,5
83)
(717
,083
)
Use
r C
harg
es &
Fee
s0
00
00
00
00
0
Inte
rest
& In
vest
men
t R
even
ue0
00
00
00
00
0
Oth
er R
even
ues
00
00
00
00
00
Gra
nts
& C
ontr
ibut
ions
pr
ovid
ed fo
r O
pera
ting
Pur
pose
s
00
00
00
00
00
Gra
nts
& C
ontr
ibut
ions
pr
ovid
ed fo
r C
apita
l P
urpo
ses
00
00
00
00
00
Rev
enue
Fro
m
Co
ntin
uing
Op
erat
ions
(649
,583
)(6
57,0
83)
(664
,583
)(6
72,0
83)
(679
,583
)(6
87,0
83)
(694
,583
)(7
02,0
83)
(709
,583
)(7
17,0
83)
Exp
ense
s Fr
om
Co
ntin
uing
Op
erat
ions
Em
ploy
ee B
enefi
ts &
On-
Cos
ts0
00
00
00
00
0
Bor
row
ing
Cos
ts55
,193
51,7
5148
,510
44,3
7640
,491
36,2
4031
,700
26,8
6121
,842
16,1
64
Mat
eria
ls &
Con
trac
ts0
00
00
00
00
0
Dep
reci
atio
n &
A
mor
tisat
ion
00
00
00
00
00
Oth
er E
xpen
ses
494,
524
502,
024
509,
524
517,
024
524,
524
532,
024
539,
524
547,
024
554,
524
562,
024

83 Long Term Financial Plan
appendix 13.
Exp
ense
s Fr
om
C
ont
inui
ng O
per
atio
ns54
9,71
755
3,77
555
8,03
456
1,40
056
5,01
556
8,26
457
1,22
457
3,88
557
6,36
757
8,18
8
Net
Op
erat
ing
(Pro
fit)
/Lo
ss(9
9,86
6)(1
03,3
08)
(106
,549
)(1
10,6
83)
(114
,568
)(1
18,8
19)
(123
,359
)(1
28,1
98)
(133
,217
)(1
38,8
95)
Cap
ital
and
Res
erve
Mo
vem
ents
Cap
ital E
xpen
ditu
re -
R
enew
als
50,0
0050
,000
50,0
0050
,000
50,0
0050
,000
50,0
0050
,000
50,0
0050
,000
Cap
ital E
xpen
ditu
re -
New
P
roje
cts
00
00
00
00
00
Loan
Rep
aym
ents
49,8
6653
,308
56,5
4960
,683
64,5
6868
,819
73,3
5978
,198
83,2
1788
,895
New
Loa
n B
orro
win
gs0
00
00
00
00
0
Pro
ceed
s fro
m S
ale
of
inta
ngib
le &
tang
ible
A
sset
s
00
00
00
00
00
Net
Mov
emen
ts to
/(fro
m)
Res
erve
s0
00
00
00
00
0
Tota
l Cap
ital
and
R
eser
ve M
ove
men
ts99
,866
103,
308
106,
549
110,
683
114,
568
118,
819
123,
359
128,
198
133,
217
138,
895
Net
Res
ult
00
00
00
00
00
Add
bac
k D
epre
ciat
ion
Exp
ense
(non
-cas
h)0
00
00
00
00
0
Cas
h B
udg
et (S
urp
lus)
/D
efici
t0
00
00
00
00
0

84 Long Term Financial Plan
appendix 14.
LONG
TERM
FINA
NCIA
L PLA
N - B
Y FU
NCTI
ONBU
DGET
20
15/1
6BU
DGET
20
16/1
7BU
DGET
20
17/1
8BU
DGET
20
18/1
9BU
DGET
20
19/2
0BU
DGET
20
20/2
1BU
DGET
20
21/2
2BU
DGET
20
22/2
3BU
DGET
20
23/2
4BU
DGET
20
24/2
5
Rev
enue
Fro
m C
ont
inui
ng O
per
atio
ns
Gov
erna
nce
(30,
000)
(30,
000)
(30,
000)
(30,
000)
(30,
000)
(30,
000)
(30,
000)
(30,
000)
(30,
000)
(30,
000)
Adm
inis
trat
ion
(1,1
24,8
33)
(1,1
29,8
19)
(1,1
35,2
54)
(1,1
40,8
53)
(1,1
46,6
19)
(1,1
52,5
59)
(1,1
58,6
77)
(1,1
64,9
78)
(1,1
71,4
68)
(1,1
78,1
53)
Pub
lic O
rder
& S
afet
y(1
,709
,011
)(1
,745
,554
)(1
,783
,250
)(1
,822
,136
)(1
,862
,253
)(1
,903
,638
)(1
,945
,575
)(1
,988
,583
)(2
,032
,690
)(2
,077
,926
)
Hea
lth(2
05,0
08)
(212
,076
)(2
39,4
05)
(227
,007
)(2
34,8
90)
(243
,067
)(2
50,6
83)
(259
,101
)(2
68,4
64)
(278
,202
)
Env
ironm
ent
(11,
283,
735)
(11,
644,
507)
(12,
012,
479)
(12,
373,
579)
(12,
758,
366)
(13,
150,
391)
(13,
557,
059)
(13,
968,
807)
(14,
400,
630)
(14,
853,
834)
Com
mun
ity S
ervi
ces
&
Edu
catio
n(2
,237
,153
)(2
,276
,144
)(2
,315
,163
)(2
,354
,211
)(2
,393
,289
)(2
,432
,399
)(2
,471
,543
)(2
,492
,216
)(2
,513
,540
)(2
,535
,519
)
Hou
sing
& C
omm
unity
A
men
ities
(5,1
74,9
92)
(5,3
35,4
17)
(5,4
61,5
68)
(5,5
30,3
24)
(5,6
36,0
78)
(5,7
39,8
87)
(5,8
50,7
12)
(5,9
56,2
31)
(6,0
75,3
80)
(6,2
08,5
32)
Sew
erag
e S
ervi
ces
(16,
857,
004)
(17,
788,
003)
(18,
478,
899)
(19,
007,
082)
(19,
600,
995)
(20,
160,
843)
(20,
780,
505)
(21,
387,
908)
(22,
049,
164)
(22,
742,
505)
Rec
reat
ion
& C
ultu
re(3
,671
,251
)(3
,447
,463
)(3
,514
,522
)(3
,763
,791
)(3
,635
,409
)(3
,709
,356
)(3
,785
,707
)(3
,862
,541
)(3
,943
,282
)(4
,026
,812
)
Min
ing,
Man
ufac
turin
g &
Con
stru
ctio
n(1
,297
,930
)(1
,362
,094
)(1
,429
,433
)(1
,500
,106
)(1
,574
,276
)(1
,652
,119
)(1
,733
,817
)(1
,819
,561
)(1
,909
,563
)(2
,004
,047
)
Tran
spor
t &
Com
mun
icat
ion
(15,
599,
780)
(10,
074,
893)
(6,6
35,3
98)
(6,8
26,4
56)
(7,0
23,2
37)
(7,2
25,9
13)
(7,4
34,6
61)
(7,6
49,6
64)
(7,8
71,1
13)
(8,0
99,2
00)
Eco
nom
ic A
ffairs
(4,6
73,2
69)
(5,5
49,2
15)
(6,7
07,4
66)
(7,1
06,5
45)
(7,4
10,8
10)
(7,7
70,4
34)
(8,0
58,4
38)
(8,2
54,0
75)
(8,5
07,5
96)
(8,7
69,2
04)
Rev
enue
Fro
m
Co
ntin
uing
O
per
atio
ns
(63,
863,
966)
(60,
595,
184)
(59,
742,
838)
(61,
682,
090)
(63,
306,
222)
(65,
170,
606)
(67,
057,
375)
(68,
833,
665)
(70,
772,
889)
(72,
803,
934)
Gen
eral
Pur
pose
In
com
e(5
1,38
3,30
8)(5
3,28
2,01
7)(5
5,52
8,80
6)(5
7,20
5,07
9)(5
9,30
1,44
3)(6
1,32
3,15
0)(6
3,47
9,44
2)(6
5,47
8,34
3)(6
7,76
3,78
1)(7
0,19
4,08
8)
Tota
l Rev
enue
Fr
om
Co
ntin
uing
O
per
atio
ns
(115
,247
,273
)(1
13,8
77,2
01)
(115
,271
,644
)(1
18,8
87,1
69)
(122
,607
,666
)(1
26,4
93,7
56)
(130
,536
,817
)(1
34,3
12,0
08)
(138
,536
,670
)(1
42,9
98,0
22)

85 Long Term Financial Plan
appendix 14.
LONG
TERM
FINA
NCIA
L PLA
N - B
Y FU
NCTI
ONBU
DGET
20
15/1
6BU
DGET
20
16/1
7BU
DGET
20
17/1
8BU
DGET
20
18/1
9BU
DGET
20
19/2
0BU
DGET
20
20/2
1BU
DGET
20
21/2
2BU
DGET
20
22/2
3BU
DGET
20
23/2
4BU
DGET
20
24/2
5
Exp
ense
s Fr
om
Co
ntin
uing
Op
erat
ions
Gov
erna
nce
1,09
3,76
11,
444,
664
1,17
7,19
91,
221,
432
1,26
7,43
01,
625,
263
1,36
6,41
11,
419,
586
1,48
0,37
11,
853,
514
Adm
inis
trat
ion
11,3
77,1
9711
,566
,636
12,0
25,4
9812
,899
,780
13,6
46,5
0714
,599
,411
15,7
25,1
0816
,542
,795
17,4
99,4
9718
,409
,403
Pub
lic O
rder
& S
afet
y2,
367,
948
2,43
3,73
32,
493,
366
2,54
9,45
02,
618,
007
2,69
3,25
32,
762,
785
2,83
9,28
12,
918,
648
3,00
5,52
1
Hea
lth1,
236,
452
1,25
4,80
51,
273,
709
1,29
6,29
21,
343,
958
1,36
4,99
91,
386,
308
1,40
7,86
71,
430,
108
1,45
7,27
5
Env
ironm
ent
14,3
97,9
2914
,534
,898
14,8
94,0
1615
,567
,292
15,7
77,1
5316
,475
,835
16,7
43,5
9017
,256
,661
17,7
93,1
4318
,354
,464
Com
mun
ity S
ervi
ces
&
Edu
catio
n3,
106,
521
3,17
7,90
13,
221,
499
3,28
2,16
83,
345,
336
3,41
1,11
23,
479,
533
3,55
0,87
93,
625,
180
3,70
2,55
6
Hou
sing
& C
omm
unity
A
men
ities
5,67
7,31
35,
820,
212
6,23
7,24
86,
359,
058
6,65
9,97
16,
980,
468
7,29
3,69
17,
742,
482
8,12
7,82
08,
539,
166
Sew
erag
e S
ervi
ces
20,9
85,8
1821
,700
,913
22,8
95,9
8823
,765
,414
24,8
16,0
7425
,686
,336
26,8
20,5
8127
,836
,398
28,8
24,5
5429
,649
,021
Rec
reat
ion
& C
ultu
re18
,777
,336
19,4
41,6
0720
,159
,317
20,9
16,6
5621
,570
,500
22,2
75,5
4123
,026
,771
23,7
99,4
7924
,624
,677
25,4
96,2
51
Min
ing,
Man
ufac
turin
g &
Con
stru
ctio
n1,
200,
667
1,24
2,37
41,
284,
907
1,33
2,54
71,
382,
157
1,42
0,42
51,
474,
240
1,53
0,29
91,
588,
702
1,64
9,55
2
Tran
spor
t &
Com
mun
icat
ion
21,2
25,5
2021
,593
,237
21,9
03,4
3222
,560
,534
23,2
56,9
7423
,990
,056
24,7
20,2
8125
,548
,344
26,4
20,2
0327
,342
,367
Eco
nom
ic A
ffairs
6,56
4,15
87,
406,
531
8,13
0,34
88,
345,
388
8,40
9,80
98,
854,
804
8,78
9,67
18,
899,
062
9,06
4,57
39,
289,
659
Exp
ense
s Fr
om
C
ont
inui
ng
Op
erat
ions
108,
010,
620
111,
617,
510
115,
696,
527
120,
096,
009
124,
093,
875
129,
377,
503
133,
588,
970
138,
373,
133
143,
397,
476
148,
748,
748
Net
Op
erat
ing
(P
rofi
t)/L
oss
(7,2
36,6
53)
(2,2
59,6
91)
424,
883
1,20
8,84
01,
486,
210
2,88
3,74
73,
052,
153
4,06
1,12
54,
860,
806
5,75
0,72
5
Cap
ital
and
Res
erve
Mo
vem
ents
Gov
erna
nce
00
00
00
00
00

86 Long Term Financial Plan
appendix 14.
LONG
TERM
FINA
NCIA
L PLA
N - B
Y FU
NCTI
ONBU
DGET
20
15/1
6BU
DGET
20
16/1
7BU
DGET
20
17/1
8BU
DGET
20
18/1
9BU
DGET
20
19/2
0BU
DGET
20
20/2
1BU
DGET
20
21/2
2BU
DGET
20
22/2
3BU
DGET
20
23/2
4BU
DGET
20
24/2
5A
dmin
istr
atio
n3,
901,
151
3,24
3,53
03,
583,
879
3,58
9,22
23,
592,
339
3,59
8,33
33,
604,
723
3,61
1,53
03,
616,
951
3,59
7,81
7
Pub
lic O
rder
& S
afet
y50
,810
53,7
9356
,970
60,3
3363
,869
67,6
7371
,667
75,8
9380
,375
65,3
19
Hea
lth33
8,30
535
6,20
737
6,25
239
6,52
539
7,38
042
2,66
444
9,51
950
2,27
739
4,72
617
9,43
2
Env
ironm
ent
636,
987
2,14
2,33
112
6,66
226
0,68
34,
856,
568
118,
819
123,
359
128,
198
283,
217
4,63
8,89
5
Com
mun
ity S
ervi
ces
&
Edu
catio
n0
00
00
00
00
0
Hou
sing
& C
omm
unity
A
men
ities
022
,166
23,4
9624
,906
26,4
0027
,984
29,6
6377
,550
82,6
6488
,117
Sew
erag
e S
ervi
ces
4,54
6,98
28,
705,
741
6,48
7,48
76,
115,
022
6,26
1,77
25,
601,
135
6,65
9,83
54,
457,
824
3,73
3,20
83,
606,
033
Rec
reat
ion
& C
ultu
re1,
306,
178
1,31
1,47
11,
361,
384
1,42
9,27
61,
567,
706
1,61
4,55
81,
695,
816
2,10
6,49
81,
911,
720
1,84
1,43
1
Min
ing,
Man
ufac
turin
g &
Con
stru
ctio
n0
00
00
00
00
0
Tran
spor
t &
Com
mun
icat
ion
39,5
97,0
8125
,679
,537
14,6
33,1
4517
,562
,270
14,5
23,7
0216
,707
,541
15,2
03,2
0414
,481
,865
14,5
82,5
6114
,999
,035
Eco
nom
ic A
ffairs
3,78
3,21
81,
005,
305
5,00
4,53
92,
236,
215
994,
387
1,10
6,18
91,
121,
850
1,19
1,61
01,
265,
727
1,34
1,03
9
New
Loa
n B
orro
win
gs(1
8,60
4,09
9)(1
0,38
2,16
4)(3
,387
,891
)(3
,156
,220
)(3
,279
,761
)(2
,751
,806
)(4
,215
,133
)0
00
Pro
ceed
s fro
m S
ale
of
inta
ngib
le &
tang
ible
A
sset
s
(3,6
70,9
50)
(3,7
57,7
90)
(3,2
97,0
00)
(1,4
70,0
00)
(1,0
50,0
00)
(1,0
50,0
00)
(1,0
50,0
00)
(1,0
50,0
00)
(1,0
50,0
00)
(1,0
50,0
00)
Net
Mov
emen
ts to
/(fr
om) R
eser
ves
(838
,265
)(9
64,3
85)
798,
753
(750
,005
)12
9,56
13,
006,
509
6,35
9,62
65,
617,
622
7,14
4,64
63,
517,
841
Tota
l Cap
ital
and
R
eser
ve M
ove
men
ts31
,047
,398
27,4
15,7
4225
,767
,674
26,2
98,2
2628
,083
,924
28,4
69,5
9830
,054
,128
31,2
00,8
6732
,045
,793
32,8
24,9
60
Net
Res
ult
afte
r D
epre
ciat
ion
23,8
10,7
4525
,156
,051
26,1
92,5
5727
,507
,066
29,5
70,1
3431
,353
,345
33,1
06,2
8135
,261
,992
36,9
06,5
9838
,575
,686

87 Long Term Financial Plan
appendix 14.
LONG
TERM
FINA
NCIA
L PLA
N - B
Y FU
NCTI
ONBU
DGET
20
15/1
6BU
DGET
20
16/1
7BU
DGET
20
17/1
8BU
DGET
20
18/1
9BU
DGET
20
19/2
0BU
DGET
20
20/2
1BU
DGET
20
21/2
2BU
DGET
20
22/2
3BU
DGET
20
23/2
4BU
DGET
20
24/2
5
Add
bac
k D
epre
ciat
ion
Exp
ense
(non
-cas
h)23
,810
,744
25,1
56,0
5226
,577
,368
28,0
78,9
9029
,665
,453
31,3
41,5
5133
,112
,348
34,9
83,1
9636
,959
,747
39,0
47,9
72
Cas
h B
udg
et
(Sur
plu
s)/D
efici
t0
(0)
(384
,812
)(5
71,9
24)
(95,
319)
11,7
94(6
,068
)27
8,79
6(5
3,14
8)(4
72,2
87)

88 Long Term Financial Plan
summary table of financial modelling scenariosBase Case
Scenario 1a
Main City Levee Only
(SRV)
Scenario 1b
Main City Levee Only
(Loan Borrow)
Scenario 2a
Main City + North Wagga Levees
(SRV)
Scenario 2b
Main City + North Wagga Levees
(Loan Borrow)
Scenario 3a
Main City Levee Only (SRV) + additional Asset Renewals from 2021/22 onwards
(SRV)
Scenario 3b
Main City Levee Only (Loan Borrow) + additional Asset Renewals from 2021/22 onwards
(SRV)
Scenario 4a
Main City + North Wagga Levees
Only (SRV) + additional Asset Renewals from 2021/22 onwards
(SRV)
Scenario 4b
Main City + North Wagga Levees
(Loan Borrow) + additional Asset Renewals from 2021/22 onwards
(SRV)
Operating IncomeRates Rate Peg SRV
2016/17 5.73%, maintained for 5 years (Return to base 2021/22)
Rate Peg SRV 2016/17 6.64%, maintained for 5 years (Return to base 2021/22)
Rate Peg SRV 2016/17 5.73%, maintained for 5 years
SRV 2021/22, 6% each year for 4 years
Rate Peg
SRV 2021/22,
6% each year for 4 years
SRV 2016/17 6.64%, maintained for 5 years
SRV 2021/22, 6% each year for 4 years
Rate Peg
SRV 2021/22,
6% each year for 4 years
User Fees & Charges
Standard CPI increase
Interest and Investment Revenue – estimated interest rates
Years 1-3 – 3.75% - 3.94%
Years 4-7 – 3.58% - 3.86%
Years 8-10 – 3.70% - 3.98%
Operating ExpensesInterest rate on borrowings
6-7% annual interest rate, 10-15 year borrowing terms
Employee Expenses
2.5% cap for 2015/16 + 2016/17, 4% annual increase from 2017/18 – includes award and progression increases
Depreciation Current method – advanced straight line
Major Capital ProjectsRIFL Yes
MPS Yes
Main City Levee
No Yes
North Wagga Levee
No No No Yes Yes No No Yes Yes
appendix 15.

89 Long Term Financial Plan

90 Long Term Financial Plan
contact us.
questions? comments?contact us.contact usWagga Wagga City Council PO Box 20 Cnr Baylis & Morrow Sts Wagga Wagga NSW
Ph: 1300 292 442 Fax: (02) 6926 9199 Email: [email protected] @WaggaCouncil on Twitter to get the news, events and emergency information straight from the source.
www.wagga.nsw.gov.au