long term trends in exploration and the likely future of ... · pdf filelong term trends in...
TRANSCRIPT

Exploration TrendsExploration Trends 1
RichardRichard SchoddeSchoddeManager Manager -- Risk Capital AnalysisRisk Capital AnalysisWMC Resources LtdWMC Resources Ltd
AAusIMM usIMM Technical Meeting Technical Meeting Melbourne Branch : 6 May 2003Melbourne Branch : 6 May 2003
Long term trends in exploration Long term trends in exploration and the likely and the likely future of the future of the
Australian Exploration IndustryAustralian Exploration Industry
I have been invited to speak to you about my views on the long term trends in minerals
exploration and the likely future of the Australian exploration industry.
This is a major issue to both government and the local industry, as evidenced by the current
Commonwealth and WA enquiries into the Impediments to Mineral Exploration in
Australia. To date, 100 submissions have been received and a decision will be handed
down later in the year.

Exploration TrendsExploration Trends 2
OverviewOverview
! Industry Review! Trends in Expenditures! Discovery Rates
! Key Issues facing the Industry
! The Future! Industry is facing structural
change
! Industry Review! Trends in Expenditures! Discovery Rates
! Key Issues facing the Industry
! The Future! Industry is facing structural
change
My presentation will cover three main subjects :
Firstly I will review of the current state of play of the industry.
In detail, I will review recent trends in exploration expenditures both in Australia and overseas. And
more importantly, the recent trends in our discovery performance for gold and base metals.
Secondly, from the review I will identify the issues and challenges facing the exploration industry.
In particular, l will discuss the industry paradigm of “if we don’t drill we wont discover”.
And finally I will talk a little about what I see is the the future for the industry. In my view the
industry is facing major structural changes and needs to evolve to survive.

Exploration TrendsExploration Trends 3
Trends in Exploration ExpendituresTrends in Exploration Expenditures
With regard to the first subject – namely the long term trends in exploration expenditures …..

Exploration TrendsExploration Trends 4
Exploration Expenditures : AustraliaExploration Expenditures : Australia
$0
$500
$1000
$1500
1960 1970 1980 1990 2000 2010
Source : ABS
Constant June 2002 A$ Million
52% Drop in A$ terms1997-2002
Base Metals
Gold
Other
Exploration includes Grassroots + Advanced + Mine Site
Looking at exploration expenditures in Australia it is clear that the business is cyclic and that certain
minerals move in and out of fashion over time.
From the graph it is obvious that the industry is in down part of the business cycle – with
expenditures down by 52% (in real terms) over the last 5 years.
Background notes :
Expenditures are for all forms of exploration – grassroots, advanced exploration (ie in-fill drill and feasibility work) and mine site exploration

Exploration TrendsExploration Trends 5
Exploration Expenditures Exploration Expenditures Western World : Gold + Base MetalsWestern World : Gold + Base Metals
$0
$1000
$2000
$3000
$4000
$5000
1970 1980 1990 2000 2010
Sources : Mackenzie & Metals Economic Group
Constant June 2002 US$ Million
??
72% Drop in US$ terms1997-2002
Base Metals
Gold
Exploration includes Grassroots + Advanced + Mine Site
We see similar trends at international level. Western World expenditures on gold and base metals
exploration are down 74% in US Dollar terms over the same period (1997-2002).
The two questions are – when will the industry turn and, secondly, will exploration expenditures
recover to their previous levels in the next business cycle. Over the next few slides I will argue that
there has been a fundamental structural adjustment in the industry and that expenditures are
unlikely to return to their former high levels.
Background notes :
1987 peak due to flow-through financing in Canada and world-wide gold exploration
1997 peak due to high commodity prices and opening up of developing world for exploration
Expenditures cover only gold and base metals (exclude Diamonds, Mineral Sands and Coal)
Expenditures are for all forms of exploration – grassroots, advanced exploration (ie in-fill drill and feasibility work) and mine site exploration

Exploration TrendsExploration Trends 6
What Drives Exploration ?What Drives Exploration ?
Companies explore to :
1. Sustain the business (ie replace reserves as they are mined) and/or
2. Grow the business
Companies explore to :
1. Sustain the business (ie replace reserves as they are mined) and/or
2. Grow the business
The traditional view that exploration is a “necessary” expense is being replaced with a focus on measuring and creating value
(ie we do it because it makes money)
In my view, there has been a fundamental change in how companies view exploration.
There are two main reasons why companies explore. Firstly, to sustain their current business by
replacing the reserves they mine.
Secondly, the explore because they want to grow their business.
In the past, exploration was viewed as a “necessary” expense of doing business. The level of
funding was driven by what you could afford – not whether it was cost effective to do so.
This view is being replaced by a more disciplined focus on measuring the value of exploration and
only direct money to it because it adds value to the company.

Exploration TrendsExploration Trends 7
Perceptions on the Value of Exploration are affected by :Perceptions on the Value of Exploration are affected by :
! Changes in commodity prices
! New discoveries … such as Voisey Bay
! New geological concepts and search techniques! New processing technologies, which make lower grade
ore bodies economic (Au CIP in 1970s, Cu SXEW in the 1980s, PAL
Ni in the 1990s and Albion Zn in 2000s ?) conversely the introduction of Carbon Taxes may make some mines uneconomic
! Changes in business risk (such as the opening up of the Developing World or, conversely, the problems with Native Title in Australia)
Doesn’t change how much is spent, just where it is spent
The perceived value of a exploration project (and hence the desire to fund it) is driven by several
factors.
The most obvious is commodity prices – which accounts for much of the volatility in exploration
expenditures.
Other factors include :
• New discoveries which attracts funding for similar projects elsewhere
• Innovations in geological models and search techniques
• New processing technologies which make certain styles of deposits more economic. In the 1970s
it was CIP for low grade gold deposits, in the 1980s it was SXEW for copper oxide deposits, in the
1990s it was the promise of Pressure Acid Leaching for nickel oxide ores. In the next decade it is
speculated the next process wave could be for zinc deposits amenable to MIMs Albion process.
Technologies which lower the cost of production, lower the minimum cut-off grade on the deposit
– which encourages companies to re-assess the economics of past discoveries.
On the other hand, environmental issues, such as Carbon Taxes, could raise the cost of mining and
so make certain deposit targets less attractive.
And finally, value is affected changes in business risk. The fall of communism opened up a new
a whole new world of opportunities for explorationists. On the other hand, increasing problems
with Native Title and Community issues can lock out certain targets.
With regard to the last point, changes in business risk generally don’t change the total amount of
exploration dollars spent – just where it is spent.

Exploration TrendsExploration Trends 8
-50%
0%
50%
100%
-50% 0% 50% 100%
NickelCopperZinc
-50%
0%
50%
100%
-50% 0% 50% 100%
NickelCopperZinc
-50%
0%
50%
100%
-50% 0% 50% 100%
Gold
-50%
0%
50%
100%
-50% 0% 50% 100%
Gold
Effect of Commodity PricesYear on Year Change in Price vs Change in Exploration Expenditure
Effect of Commodity PricesYear on Year Change in Price vs Change in Exploration Expenditure
Source : WMC note : Changes are net of inflation
Change in Change in Expenditures Expenditures (lagged by one year)(lagged by one year)
Change in Change in Expenditures Expenditures (lagged by one year)(lagged by one year)
Change in PriceChange in Price Change in PriceChange in Price
One of the most obvious factors exploration expenditures are changes in commodity prices.
The following graphs show the impact of a change on prices on the change in exploration (lagged
by one year) for gold and various base metals.
As can be seen – while there is a positive correlation between the two, the fit is very “loose”. There
are case where prices went up yet exploration went down and visa versa !
Obviously, other factors, such as new discoveries and general market sentiment affect the level of
exploration.
A case in point is the current situation for gold. While the recent run up in the price of gold to
US$350/oz suggests good times ahead for the local gold explorers, it should be noted that, with the
recent appreciation in the Australian Dollar, the domestic price for gold is the same as it was this
time last year (~A$580/oz)., There is also an expectation that prices are artificially high because of
the war fears. Consequently, in my view the level of gold exploration in Australia won’t rise as
much as some people hope.
Background notes :
The analysis covers period 1970-2002 for gold and 1985-2002 for the base metals. The commodity prices exploration expenditures have been adjusted for inflation – and so show the real change on a year-on-year basis

Exploration TrendsExploration Trends 9
Endowment and Business Risk Endowment and Business Risk affects affects wherewhere Exploration occursExploration occurs
$0
$1000
$2000
$3000
$4000
$5000
1970 1975 1980 1985 1990 1995 2000 2005 2010
Sources : Mackenzie & Metals Economic Group
Other
Australia
CanadaUSA
Gold + Base Metal Exploration Gold + Base Metal Exploration Constant June 2002 US$ Constant June 2002 US$ MillionMillion
AfricaLatin AmericaSEA / PacificOther
Exploration has become a Global Business
Where the exploration dollars are spent is driven by mineral endowment and business risk issues.
Over the last two decades, much of the growth in exploration activities has been in countries outside
the traditional three – USA, Canada and Australia.

Exploration TrendsExploration Trends 10
Gold Exploration :Gold Exploration :The current recession has slowed The current recession has slowed
the move to new countriesthe move to new countries
0%
20%
40%
60%
80%
100%
1970 1975 1980 1985 1990 1995 2000 2005 2010Sources : MacKenzie & Metals Economic Group
Australia
Other Countries
Canada
South Africa
USA
22%
Rest of Africa
Latin America
Africaexcl SA
Latin America
SEA / PacificOther
22%
Percentage split of Western World Percentage split of Western World Expenditures on Expenditures on GoldGold by Countryby Country
Even in the face of new opportunities elsewhere in the world, Australia has managed to maintain its
share of the world’s gold exploration efforts.
The main losers were Canada and the US – though these have improved in the last couple of years
as the industry contracted back to near-mine-site exploration.

Exploration TrendsExploration Trends 11
Base Metals Exploration Base Metals Exploration
0%
20%
40%
60%
80%
100%
1970 1975 1980 1985 1990 1995 2000 2005 2010Sources : Mackenzie & Metals Economic Group
and WMC estimates
Australia
Canada
USA
63%
14%
37%Developedcountries
Developingcountries
Other Countries
Africa
Latin Americaexcl Chile
SEA / Pacific
Other
Chile
Percentage split of Western World Percentage split of Western World Expenditures on Expenditures on Base MetalsBase Metals by Countryby Country
Base metals exploration shows a similar trend – with Australia holding onto a 14% share of the
western world expenditures on exploration.

Exploration TrendsExploration Trends 12
Trends in Discovery RatesTrends in Discovery Rates
The cost of discovering a major deposit have increased 2-3 fold over the last two decades
At the end of the day, we explore with the expectation of finding a major deposit. The challenge
facing the industry is that our performance has significantly deteriorated in the last two decades.
This has led companies to become less enthused about funding future exploration. It is this very
point that has led to a structural change in the industry’s spending patterns.

Exploration TrendsExploration Trends 13
0
5
10
15
1950 1960 1970 1980 1990 2000$0
$1000
$2000
$3000
0
5
10
15
1950 1960 1970 1980 1990 2000$0
$1000
$2000
$3000
Western World Discovery History GOLD
Western World Discovery History Western World Discovery History GOLD GOLD
Source: WMC March 03
Number of Deposits Number of Deposits Discovered per YearDiscovered per Year
Discoveries
Expenditures Avg discovery cost in 1980s & 90s
US$290m
Avg discovery costin 1950s & 60s
US$90m
Discoveries with in-situ value >US$1 B
Exploration Expenditure Exploration Expenditure (excluding Mine Site)(excluding Mine Site) 2002 US$m2002 US$m
With regard to gold, since the 1970s the western world has been consistently discovering around 4
to 5 major deposits per year. It is not yet clear whether the drop off in discoveries in the last four
years is real or an artifact of the delays associated with delineating a major deposit.
Even though the discovery rate is higher, the total amount spent on gold exploration has increased
ten-fold. This means that the average cost per major discovery has risen three-fold from US$90m in
the 1950s & 60s to around US$290m in the 1980s & 90s.
Background notes :
A Major deposit is defined as a deposit containing a resource in excess of US$1000 million of value on an in-situ basis. This is calculated using a US$300/oz price, which translates into a ~3 moz ore body.
The resource refers to the current known size of the deposit – rather than the size reported at the time of discovery.

Exploration TrendsExploration Trends 14
0
5
10
15
1950 1960 1970 1980 1990 2000$0
$1000
$2000
$3000
0
5
10
15
1950 1960 1970 1980 1990 2000$0
$1000
$2000
$3000
Western World Discovery History BASE METALS
Western World Discovery History Western World Discovery History BASE METALS BASE METALS
Source: WMC March 03
Number of Deposits Number of Deposits Discovered per YearDiscovered per Year
Discoveries with in-situ value >US$1 B
Exploration Expenditure Exploration Expenditure (excluding Mine Site)(excluding Mine Site) 2002 US$m2002 US$m
Discoveries
Expenditures
Avg discovery cost
in 1980s & 90s US$150m
Avg discovery costin 1950s & 60s
US$90m
You see slightly different trends for Base Metals exploration.
While the annual discovery rate was higher in the 1950s to 70s than present, the level of exploration
expenditures has remained static around the US$500m to $800m range.
Consequently, the average cost per major discovery has doubled from US$90m in the 1950s & 60s to
around US$150m in the 1980s & 90s.
The question is – is the prize sufficiently big enough to justify the cost of finding it ?
To put these numbers into context, lets compare it to the value generated by Minotaur’s recent
discovery at Prominent Hill in South Australia. Based on Minotaur’s current share price (A$0.70)
implies that this prize is worth A$64m in total. Lets hope its worth much more than this. Either that,
in order to pay its way, the industry has to find several Prominent Hill sized discoveries a year.
Background notes :
Minotaur has 24.6 m ordinary shares at $0.70 = A$17m market cap. Deduct ~$5m in cash reserves and ignoring any value for its other exploration projects implies that its 19% share of Prominent Hill is worth ~$12m. 100% of project is therefore worth ~A$64m.
The expenditure and discovery figures refer to Base Metals and Gold only. Also the expenditures only include grassroots and advanced exploration (ie have not counted mine site exploration – as this is mainly focused on finding smaller additional deposits around an existing facility).
Exploration TrendsExploration Trends 15
In spite of the Mediocre Discovery Record, the world is not running out
of Mineral Resources ….
In spite of the Mediocre Discovery Record, the world is not running out
of Mineral Resources ….
In spite of the industry’s mediocre record at discovery, the world still has plenty of mineral
resources.

Exploration TrendsExploration Trends 16
Effective Resource Life : Western WorldEffective Resource Life : Western World(Indicated Resources / Current Mining Rate)
0
50
100
150
1975 1980 1985 1990 1995 2000
Copper
Gold(includes Sth Africa)
Nickel(Laterites+Sulphides)
Zinc
Years
131Yrs
Life in 2000
53 Yrs48 Yrs
32 Yrs
Gold inclOfficial Stocks
Source : WMC derived from USGS 2001
48 Yrs
Based on data from the USGS the current level of known indicated resources in the Western
World appears to be sufficient to meet metal demand for the next several decades.
On closer inspection, the situation may not be as rosy :
•The nickel figures include laterites as well as sulphides – with the latter in much shorter supply,
even though 2/3rds of metal production is from this source
•The copper figures show a steady decline over time
•The Gold figures include South Africa. Putting aside the issue of political risk, the concern is
that the South African resources are under deep cover and not all of it is economically mineable at
today’s gold prices
Background notes :
Of more importance is the quality of these resources. If the cost is high, then prices will need to correspondingly rise – increasing the value of exploration to find new mineral discoveries.

Exploration TrendsExploration Trends 17
… and Australia’s Resource Base has significantly grown in recent years
… and Australia’s Resource Base has significantly grown in recent years
22
3
17
6
13
1980
3518(Mt)Zinc
224(Mt)Nickel
1711(Mt)Lead
247(Mt)Copper
16065(Moz)Gold
20011990
Source: Geoscience Australia 2002
Economic Demonstrated Resources
As reported by Geoscience Australia in their Annual Report on Resources, for most metals
Australia’s inventory has significantly grown in recent years.
In particular, the inventory of “Economically Demonstrated” gold resources has increased 12-fold
in the last 20 years.

Exploration TrendsExploration Trends 18
If we have such a mediocre discovery rate, why is our resource base growing ?
If we have such a mediocre discovery rate, why is our resource base growing ?
Given the previous observation that the industry is not good at discovering new deposits, how is it
that our resource base is still growing ?

Exploration TrendsExploration Trends 19
Deposits found in Earlier Years continue to Grow in Size
Deposits found in Earlier Years continue to Grow in Size
0
100
200
300
400
1985 1990 1995 2000
0
100
200
300
400
1985 1990 1995 2000
Cumulative Ounces Found Cumulative Ounces Found in Australia (in Australia (MozMoz))
pre-1985 + unspecified
1985-89
1995-99
2000-02290 Moz discovered in 17 years Average = 17 Moz pa
1990-94
Sources: WMC March 03Geoscience AustraliaOunces Found = Net Change in Resources + Mine Production
Year deposit found
the answer is that much of the increase in resources has come from increases in existing known
deposits.
In a recent detailed study of the Australian gold industry, I found that the majority of the recent
increase came from deposits found several decades ago.
As can be seen, much of the 17 Moz pa increase in gold found came from deposits found prior to
1985.

Exploration TrendsExploration Trends 20
Most of the Ounces were found after the Mine started up
Most of the Ounces were found after the Mine started up
0
10
20
30
40
50
60
1985 1990 1995 2000
Pre-Mine StartupPost-Mine StartupOther
0
10
20
30
40
50
60
1985 1990 1995 2000
Pre-Mine StartupPost-Mine StartupOther
Source: WMC March 03Other = Pre-1985 discoveries and mines, plus unspecified projects
Cumulative Ounces Found Cumulative Ounces Found in Australia (in Australia (MozMoz))
Another important factor is that the majority of the ounces were found after the mine started up.
Consequently, mine-site exploration contributes significantly to our resource base than grassroots
exploration.
This graph also shows that, while we continue to add substantial ounces to the inventory, in the
recent years, very little of this has come from grassroots discoveries. This is not sustainable in the
longer run.
Background notes :
The “Other” category in the graph mainly refers to deposits found prior to 1985.There is also a small component associated with deposits found after 1985 where I didn’t have detailed data on its discovery history (these are typically deposits less than 100 koz in size).

Exploration TrendsExploration Trends 21
Dividing the Discovery Rate by the level of Exploration Expenditures …
Dividing the Discovery Rate by the level of Exploration Expenditures …
0
10
20
30
40
50
60
1985 1990 1995 2000
$0
$200
$400
$600
$800
$1000
$1200Pre-MineStartupPost-MineStartupOther
0
10
20
30
40
50
60
1985 1990 1995 2000
$0
$200
$400
$600
$800
$1000
$1200Pre-MineStartupPost-MineStartupOther
Expenditures (2002 A$m)Expenditures (2002 A$m)
Source: WMC March 03Other = Pre-1985 discoveries and mines, plus unspecified projects
Cumulative Ounces Found Cumulative Ounces Found in Australia (in Australia (MozMoz))
Overlaying the level of exploration exploration on gold gives an indication of the relative efficiency
of the local industry in finding gold.
Approximately three-quarters of the expenditures are on grassroots exploration with the remainder
spend on on mine-site exploration.

Exploration TrendsExploration Trends 22
…. gives the Average Finding Cost for Gold in Australia
…. gives the Average Finding Cost for Gold in Australia
$0
$20
$40
$60
$80
$100
$120
1985 1990 1995 2000
$0
$20
$40
$60
$80
$100
$120
1985 1990 1995 2000Source: WMC March 03
1985-2002 Avg Finding Cost
Grassroots = A$60-70/oz Mine site = A$12-18/oz
Overall = A$32/oz
Finding Cost (2002 A$/oz)Finding Cost (2002 A$/oz)
Over the last 15 years the average finding cost cost in Australia was A$32/oz in today’s dollars.
It should be noted that the majority of the expenditures were on grassroots exploration. And, as
mentioned before, the majority of ounces were found after mine startup, I estimate that the average
finding cost for grassroots exploration for this period was around A$60-70/oz, compared with an
estimated A$12-18/oz for mine-site exploration.

Exploration TrendsExploration Trends 23
Exploration vs AcquisitionExploration vs Acquisition
OBSERVATIONS
! The stock market rewards those companies that are big (and getting bigger)
! Major gold producers have been finding it difficult to grow reserves through grassroots exploration! By its nature, exploration discoveries are uncertain and discrete
! Exploration is expensive! Average finding cost (grassroot+mine site) in the Western world
is ~US$20/oz. Grassroots costs are much higher
! Acquisition Prices have been falling! Average acquisition cost for undeveloped gold deposits in
Western World was US$6/oz in 2002, down from ~US$20/oz in the mid-1990s
Caution : it is misleading to compare the value of exploration vs acquisition on a $/oz basis
- as it all depends on the quality and size of the resource
Remembering that the main reasons why companies explore is to sustain and grow their business.
The same objectives can also be met through acquisition.
Looking back over the last five years one can make the following observations regarding
acquisitions versus exploration:
Firstly, in recent years the stock market has placed a premium on large companies versus smaller
companies. This is a strong incentive to grow.
The problem for the major gold producers is that they have found it difficult to quickly and
consistently grow through grassroots exploration. By its very nature, exploration is a high risk high
reward business with uncertain returns.
Exploration is expensive – especially so for grassroots exploration. Over the last decade, the
average finding cost in the Western World has been around US$20 per ounce.
By comparison, the average cost of an acquisition has been falling. With regard to the sale of
undeveloped resources (which are most comparable to exploration projects) the weighted average
price of depoists sold was only US^/oz last year. This is down from $20/oz a decade ago.
Background note :
It can be misleading to compare the cost of discoveries against sales price of acquisitions – as in both cases the value is critically dependent on the quality and location of the deposit.

Exploration TrendsExploration Trends 24
Selling Price of various Undeveloped Gold Deposits around the World : 1993-2002
Selling Price of various Undeveloped Gold Deposits around the World : 1993-2002
$0
$50
$100
$150
$200
1993 1995 1997 1999 2001 2003
$0
$50
$100
$150
$200
1993 1995 1997 1999 2001 2003
limited data
Weighted Average Price
Sale Price (US$/Ounce)Sale Price (US$/Ounce)Excludes Operating Mines
US$6/oz
Pierina
Bulyanhulu
SertaoMorila
Chariot Creek
Quicay (Peru)
Nalunaq (Greenland)
Sources: WMC and DuetcheBank
This chart shows the range of prices paid for undeveloped gold resources around the world. As you
can see there is a wide variation in the prices paid – ranging from virtually nothing to up to US$200
per ounce. This is driven by the quality of the resource, the potential for finding additional
resources and country risk issues.
In recent years, the weighted average sales price of gold projects has declined from US$25 to
around US$8 per ounce of resource.
Note: The slide excludes the sales of operating gold mines – as there is substantial value associated with the processing facilities – and this will bias the implied value of the underlying resource.

Exploration TrendsExploration Trends 25
Exploration vs AcquisitionExploration vs Acquisition
RESPONSES
! Switch from exploration to acquisition
! Switch from grassroots to mine-site exploration
! Combination of both of the above
RESPONSES
! Switch from exploration to acquisition
! Switch from grassroots to mine-site exploration
! Combination of both of the above
The industry’s responses are predictable.
There has been a major shift away from exploration to acquisition as the main strategy for growth.
To save on costs, there has been a shift away from (high risk / high return) grassroots exploration to
(lower cost but lower return) brownfields exploration

Exploration TrendsExploration Trends 26
Grassroots Exploration is Being Focused closer to Existing MinesGrassroots Exploration is Being
Focused closer to Existing Mines
$0
$100
$200
$300
< 1.75 km 1.75 - 5 km 5 - 10 km 10 - 20 km 20 - 40 km >40 km
$0
$100
$200
$300
< 1.75 km 1.75 - 5 km 5 - 10 km 10 - 20 km 20 - 40 km >40 km
Exploration Expenditure (2002 Exploration Expenditure (2002 A$m)A$m)
Distance from Nearest Existing Mine (km)Distance from Nearest Existing Mine (km)
Western Australia
Source: Geological Survey of WA 2003
1997
2001
Down 56%
Down 10%
The following chart highlights the shift away from grassroots to mine-site exploration. Data from
the GSWA shows that most of the so-called off-production lease exploration in Western Australia is
concentrated very close to the mine. And that, in recent years, there has been a significant decline
in what it calls “pure grassroots” exploration which is finding new mining camps remote from
existing operations.
In detail, between 1997 and 2001 the amount of expenditures on exploration projects within 1.75
km of an existing mine only dropped 10% in real terms, whereas spending on projects more than
40km away dropped by more than half.

Exploration TrendsExploration Trends 27
Key Issues Facing the Exploration Industry
Key Issues Facing the Exploration Industry
Moving onto the key issues facing the exploration industry ….

Exploration TrendsExploration Trends 28
Key Issues Facing the IndustryKey Issues Facing the Industry
! Need to Improve Performance! Need to find ways of lowering the cost of discovery! Need to drill to discover ! … or more correctly we
need to be smarter in where we drill
! Funding ! How to build a sustainable business ?
! Globalisation ! The internationalisation of the industry has a major
effect on where the exploration dollars are spent
There are three main issues facing the international industry today. These are
Firstly, we need to significantly improve our discovery performance. We have to add value not
destroy it ! One obvious way to increase the discovery rate is to drill more holes. But as I will
outline, later in my talk, the real issue is to be smarter in where we drill the holes – rather than the
total number of holes drilled.
This point leads into the second issue. How can we build a sustainable business ? We need to
develop ways of securing a reliable source of funds.
And finally, there are some profound implications for the domestic industry arising from the
growing move towards gloabalisation.

Exploration TrendsExploration Trends 29
How to Improve PerformanceHow to Improve Performance
! Find High Value Deposits! Focus on targeting
! Lower the Cost per Discovery! Be more efficient in exploration ! Be more effective in exploration ! Improve the probability of success
! Increase the Speed of Project Turnover! Better land access – need to resolve Native
Title issues
! Find High Value Deposits! Focus on targeting
! Lower the Cost per Discovery! Be more efficient in exploration ! Be more effective in exploration ! Improve the probability of success
! Increase the Speed of Project Turnover! Better land access – need to resolve Native
Title issues
This gives the biggest pay-off
In detail, there are several ways we can improve our exploration performance.
We need to focus on finding things of value. This impacts on the strategies used for targeting.
We also need to lower the cost of making each discovery. This means looking carefully at ways of
being more efficient and effective at exploring. Most importantly, we need to improve the
probability of success. At a hit rate of only 1 of 20,000 holes delivering a major discovery, a lot of
the industry’s efforts are wasted.
A related matter is the need to increase the rate and number of projects evaluated - so that we can
get to the big discovery sooner ! An obvious impediment in this area is the issue of Native Title –
which impacts on land access.

Exploration TrendsExploration Trends 30
If we don’t Drill we won’t DiscoverIf we don’t Drill we won’t Discover
! Paradigm is that the industry’s lack of success is due to a lack of drilling
…. If we could only drill more holes !!!
! Paradigm is that the industry’s lack of success is due to a lack of drilling
…. If we could only drill more holes !!!
One of the Manta’s chanted by the industry is that “If we don’t drill we won’t discover”.
The implication is that all our problems would be solved if we only could only do more drilling.

Exploration TrendsExploration Trends 31
Drilling Rates are directly linked to Drilling Rates are directly linked to Exploration ExpendituresExploration Expenditures
All Minerals Exploration in AustraliaAll Minerals Exploration in Australia
$0
$500
$1,000
$1,500
1980 1985 1990 1995 2000 2005
0
5
10
15
Source : ABS
Millions ofMetres Drilled
Metres Drilled(on- and off-production leases)
Expenditures June 2002 A$m
Total Exploration Expenditures
Exploration includes Grassroots + Advanced + Mine Site
This graph shows that the amount of total drilling (as defined by the ABS as drilling on both
production and non-production leases) in Australia is closely linked to the overall level of
exploration expenditures. Over the last five years (1997-2002) exploration expenditures went down
by 47% in real terms. Over the same period, the amount of metres drilled dropped by 57%.
But if you take a longer time frame it is interesting to note the amount of drilling per exploration
dollar spent is currently no worse than what it was back in the mid 1980s – which is well before the
invention of lawyers, environmental concerns and Native Title issues !
Background notes :
Warning : Data includes all froms of exploration (grassroots + advanced + mine site. The drilling data is for both production and non-production leases. The ABS data is too ambiguous to separate into grassroots and brownfields drilling - as some of the drilling off production lease could be classified as brownfields and visa-versa.

Exploration TrendsExploration Trends 32
Average Drilling Costs : AustraliaOn & Off-Production Leases
Average Drilling Costs : AustraliaOn & Off-Production Leases
$0
$20
$40
$60
$80
$100
$120
$140
1980 1985 1990 1995 2000 2005
$0
$20
$40
$60
$80
$100
$120
$140
1980 1985 1990 1995 2000 2005
Source : ABS
Diamond Drilling
RC & Rab Drilling
Weighted Average
June 2002 A$ per June 2002 A$ per MetreMetre
est
est
est
est
Over the same period, in real terms the average cost of drilling has declined. On average, it now
costs around A$105 per metre for diamond drilling and around $26 per metre for RC & RAB
drilling. The weighted average cost for the industry is currently around A$43 per metre.
Using these average costs, and knowing how many metres are drilled it is possible to calculate the
total amount of money spent by the exploration industry on drilling ….

Exploration TrendsExploration Trends 33
Estimated Amount of Exploration Estimated Amount of Exploration Expenditures spent on Drilling in AustraliaExpenditures spent on Drilling in Australia
$0
$500
$1,000
$1,500
1980 1985 1990 1995 2000 2005Sources : Derived from ABS
Expenditures June 2002 A$m
Total Exploration Expenditures
Estimated Drilling Expenditures
This graphs shows the estimated total amount of drilling and compares it against the total
exploration expenditures for Australia. As can be seen, drilling is a significant component of total
exploration expenditures.
Background notes :
The total expenditures include exploration for all commodity types (other charts refer only to the gold or base metals components) and include what is effectively brownfiled as well as grassroots exploration activities

Exploration TrendsExploration Trends 34
Estimated Amount of Exploration Estimated Amount of Exploration Expenditures spent on Drilling in AustraliaExpenditures spent on Drilling in Australia
0%
10%
20%
30%
40%
50%
1980 1985 1990 1995 2000 2005Source : Derived from ABS
Percentage Spent on Drilling
Warning : Assumes all drilling is for discovery –in practice much of the RC drilling is forgeochem survey work
Increase might be due to shift back to near-mine site
exploration
Dividing one by the other, will give us the estimated percentage of exploration money spent on
drilling.
This graph indicates that around 32% of the total exploration budget is currently being spent on
drilling. While this is down on recent years it is still significantly higher than what was spent in the
1980s.
Anecdotal evidence suggests that these percentage figures are too high – and that the true number is
somewhere around 20%. Part of the difference could be definitional – in that the reported drilling
figures quotes in the ABS statistics may also include RC drilling for geochemical data – rather than
drilling for discovery. Another factor is that in the current down-cycle exploration has shifted away
form “pure” grassroots to work more closely surrounding existing operations – which I would call
brownfields exploration. This type of exploration tends to be more drilling-intensive. It is
impossible to untangle the full story.

Exploration TrendsExploration Trends 35
“But if you don’t Drill, “But if you don’t Drill, you don’t Discover”you don’t Discover”
0
2
4
6
8
10
1980 1985 1990 1995 2000 2005
0
2
4
6
8
10GoldBase Metal
Sources : ABS and WMC March 03
Millions of Metres Drilled
Metres Drilled Off-Mine Site (ie Grassroots Exploration)
No of Discoveries with In-Situ Value >US$1b
No of Large Discoveries
PERIOD 1985-2000Total Drilling = 86,200 kmLess Resource Delineation = 3,400 kmEquals Exploration Drilling = 82,800 kmMajor Discoveries = 27 Drilling per Major Discovery = 3070km
The key challenge facing the industry is the need to increase the number of discoveries made.
As stated before, a common mantra is ”if you don’t drill, you don’t discover”.
While there is only so far one can stretch the statistics – over the last 15 years (1985-2000) the
Australian industry made 27 major discoveries. If you divide that by the 86 million metres of drilling
done, this equates to one major discovery per 3.4 million metres or 3400 kilometres ! The real
number is slightly lower than this (3070 km) because of follow-up drilling associated with delineating
those discoveries.
To reiterate, over the last 15 years it took an average of 3070 km of drilling to make one major
discovery in Australia ! At say, 150 metres per hole, this equates to ~20,000 holes per large
discovery. Clearly, a lot of this effort is wasted.
Background notes :
Between 1985-2000 a total of 86 million metres (86,000 km) of drilling was done off production leases. 16 major gold deposits and 11 base metal deposits were found during this time. Total ounces found (for all gold deposits, both big and small) was 61 moz prior to mine start up
Secondly, once a discovery is made, follow-up drilling is required to deliniate the deposit. As a rule of thumb, it takes 5000 m of drilling per to drill-out a 100 koz gold deposit. This rises to to 30,000m for a 1 moz resource and 140,000m for a 10moz resource. Say an average of 50 km per moz (this is very pessimistic s it assumes that the average deposit found was only 100 koz).
Between 1985-2000 a total of 61 moz of gold was found in Australia prior to mine-startup. This would require 61 x 50 km = 3050 km of drilling. Say (optimistically) another 30km per major Base Metals discovery …. This will give 11 x 30 = 330 km of delineation drilling.On this basis 3050 + 330 = 3380 km out of a total of 86,000 km drilled was associated with delineation. The rest was exploration drilling (86000 – 3380 = ~83000 km). This is equal to around 3070 km per major discovery net of delineation drilling

Exploration TrendsExploration Trends 36
Challenge for the IndustryChallenge for the Industry
! Simply drilling more holes is not the solution! Major (US$1000m) Discovery ~3000 km (~~20,000 holes)! Moderate (US$200m) Discovery ~300 km (~~2,000 holes) ! Minor (US$30m) Discovery ~30 km (~~200 holes)
! We need to be much smarter in where we drill
! We need to be more hard-nosed on when to stop drilling (ie need to recognise at the earliest possible stage when the prospect isn’t going to be a “winner”)
The objective of the industry is to make more discoveries. The real challenge is that, because of our
poor success rate, simply drilling more holes is not an economic solution.
Based on the previous slide, it currently requires approximately 3000 km of drilling (both exploration
and geochem)to make one major discovery (with a major discovery defined as having an in-situ value
in excess of US$1000m).
As a rule of thumb, for every one major discovery, there are 10 moderate sized discoveries and 100
minor discoveries – where “Major” is defined as having in excess of $1000m of in-situ value,
“Moderate” having >US$200m of value and “Minor” having US$30m of value.
On this basis, Australia’s success rate is that, on average, for every couple of hundred holes we make
a Minor discovery, every couple thousand holes we make a moderate-sized discovery, and only once
every 20,000 holes do we make a major discovery. World-class discoveries are even rarer !
Even if you cut these numbers by half, to account for the issue of geochem drilling, the success rate is
very poor. Obviously, the industry needs to be a lot smarter in where it drills.
Secondly, it needs to be much more hard-nosed on when to stop drilling. All too often, companies
continue to drill out a prospect when there is clear evidence that it isn’t big enough or high enough
grade to be economic.

Exploration TrendsExploration Trends 37
How to Get Better FundingHow to Get Better Funding
Major Companies! Develop a “track record” for success
! Demonstrate that you add-value to the company
Junior Companies! Raise funds from the Market (traditional route)! Form alliances with Majors! Find alternative sources of funds
Major Companies! Develop a “track record” for success
! Demonstrate that you add-value to the company
Junior Companies! Raise funds from the Market (traditional route)! Form alliances with Majors! Find alternative sources of funds
With all of us, whether working for a junior explorer or a major company (or even the government)
is the need to secure long term reliable funding for our exploration projects. In many cases we
need the time and money to fully test our ideas.
The subject of how to get better funding deserves a separate paper in its own right. The following is
only a short discussion of the possibilities. Briefly, in my view the best way to secure funding
within a major company is to win the confidence and trust of the board. You only do this through
developing a “track record” for success and demonstrating that you do add significant value to the
business.
With regard to Junior companies life is more difficult. While there is always the traditional path of
raising funds directly from the stock market, this is not easy or assured. Other strategies involve the
formation of partnerships / alliances with Major companies. Finally, a more recent phenomena is
the move by juniors into the mining as a way of creating a long term cash flow for their exploration
activities.

Exploration TrendsExploration Trends 38
Raising Funds from the MarketRaising Funds from the Market
0
10
20
30
40
1992 1994 1996 1998 2000 2002 2004
0
10
20
30
40
1992 1994 1996 1998 2000 2002 2004
No of New Floats on the ASXNo of New Floats on the ASX
na
Lack of floats due to the Industry recession
and the Dot-Com Bubble
est
There has been a resurgence in the number of Junior companies floated … but this is getting harder, and the funds raised are small
Note : Only A$100m wasraised in 2002
With regard to raising money from the stock market, the last couple of years have been good for the
junior sector. However, even though it was a “good” year only A$100m was raised. This is equal
to only 17% of the total exploration spend for Australia.
Looking to the future, anecdotal evidence suggest that it is getting harder for juniors to raise money.
By my guess around 20 to 30 new companies will be floated this year. Already at least 17 have
registered their interest to do so.
The problem is that there is no guarantee that further funding will be available in the future. A
related problem is that the amount of money raised is usually pretty modest (only A$3-5m) which is
only enough to fund a handful of projects for 2-3 years. To survive, the focus is to deliver good
results quickly !

Exploration TrendsExploration Trends 39
Alternative Sources of FundsAlternative Sources of Funds
! Operate a small mine to generate cash for exploration! Tax effective – can use the tax credits from exploration
! Provides time for long term exploration programs to bear fruit
! Fits well with Major Company’s strategy of selling-off small / old assets
! Risk is that, in order to sustain the cash flow, the company will become overly focused on exploring around the mine – even if the geological potential is not good
Examples : Mincor (Ni), West Musgrave Mining (Ni)Troy Resources (Au), Gympie Gold (Au)Oxiana (Au/Cu)
An interesting trend in recent times is the move towards junior companies developing their own
mines – with a view of using the cash flow to fund their exploration activities. This is very tax-
effective and allows the junior to develop long-term plans for exploration.
This strategy also neatly fits in with the Major Company’s strategy of selling off its older/smaller
operations. The end-result is an interesting an vibrant junior sector with a sustainable future.
Exploration TrendsExploration Trends 40
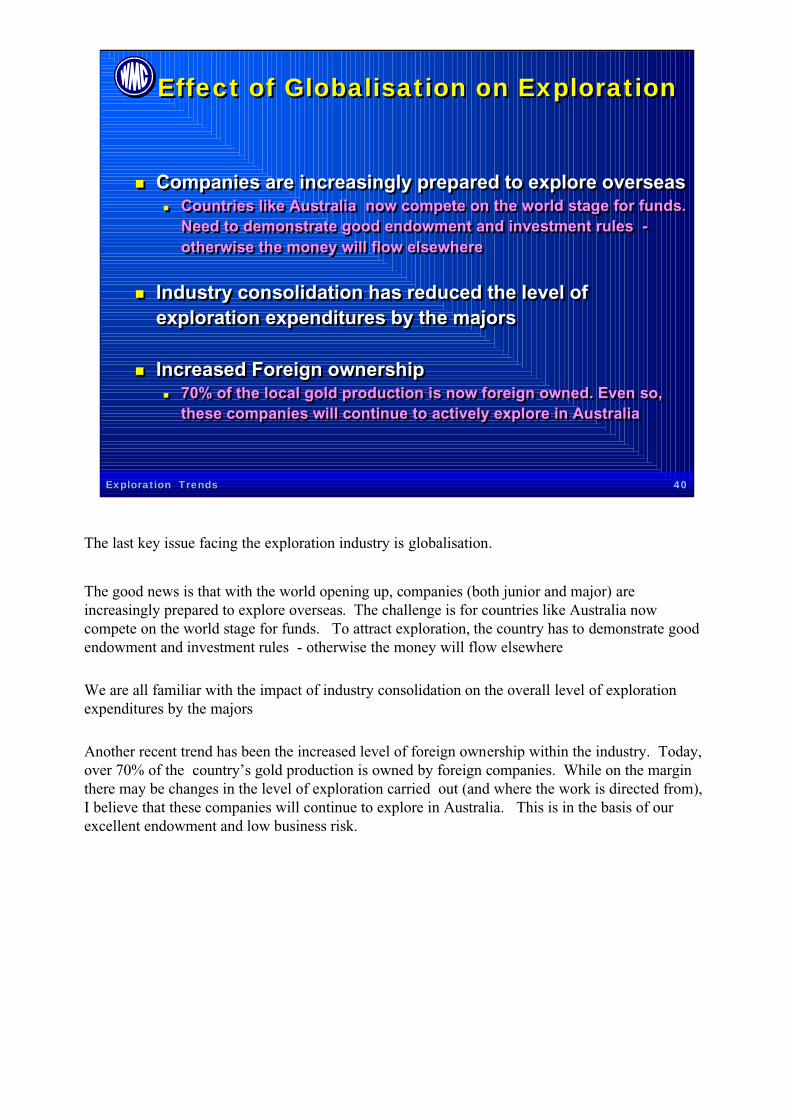
Effect of Globalisation on ExplorationEffect of Globalisation on Exploration
! Companies are increasingly prepared to explore overseas! Countries like Australia now compete on the world stage for funds.
Need to demonstrate good endowment and investment rules -otherwise the money will flow elsewhere
! Industry consolidation has reduced the level of exploration expenditures by the majors
! Increased Foreign ownership ! 70% of the local gold production is now foreign owned. Even so,
these companies will continue to actively explore in Australia
The last key issue facing the exploration industry is globalisation.
The good news is that with the world opening up, companies (both junior and major) are
increasingly prepared to explore overseas. The challenge is for countries like Australia now
compete on the world stage for funds. To attract exploration, the country has to demonstrate good
endowment and investment rules - otherwise the money will flow elsewhere
We are all familiar with the impact of industry consolidation on the overall level of exploration
expenditures by the majors
Another recent trend has been the increased level of foreign ownership within the industry. Today,
over 70% of the country’s gold production is owned by foreign companies. While on the margin
there may be changes in the level of exploration carried out (and where the work is directed from),
I believe that these companies will continue to explore in Australia. This is in the basis of our
excellent endowment and low business risk.

Exploration TrendsExploration Trends 41
Possible Effect of Globalisation on Exploration in Australia
Possible Effect of Globalisation on Exploration in Australia
! Australia has excellent endowment and so will continue to attract exploration dollars
! While the discoveries may be foreign-owned, Australia will benefit from the building of new mines
! The level of exploration funding will be more foot-loose or volatile (driven by international issues and domestic concerns – such as Native Title problems)
! Exploration will be increasingly carried our on a contractor or agency basis – with small “ideas generation” teams directing work to a large pool of contractors . While this is more efficient and flexible, it brings with it more uncertainty in the labour market
With regard to Australia, the possible effects of globalisation are :
•Are minimal on the level of direct expenditures. Australia has excellent endowment and so will
continue to attract exploration dollars
•While the discoveries may be foreign-owned, Australia will still receive the economic benefits
from building new mines.
•However I believe that the level of exploration funding will be more foot-loose or volatile. It will
be increasingly driven by international issues (like the profitability of the overseas parent
company) and domestic concerns – such as problems with Native Title issues.
•Also, exploration will be increasingly carried our on a contractor or agency basis. In other works
the industry is evolving towards small teams of people involved in “ideas generation”, who then
contract out the field and specialised work to a large pool of contractors. The good news is that
this leads to a more more efficient and flexible business. The bad news is that it leads to
increased volatility and uncertainty in employment levels.

Exploration TrendsExploration Trends 42
The FutureThe Future
! Exploration expenditures will continue to be under pressure as companies seek alternative (more profitable) ways of growing their business ! Recent exploration performance has been poor and spending will be lower
and more directed to near-mine-site exploration ……. but …..
! The exploration industry could re-invent itself! Increased focus on ways to improve the probability of success! Move towards small project generation teams feeding work to contractors /
JV partners! More innovative funding of Juniors
! In the medium term, the world is not going to run out of resources. The inventory will grow through mine-site exploration and improvements in mining costs (which lower the cut-off grade and expand the resource)
! In the longer term the brown field opportunities will be exhausted. The availability of resources will be driven by break-throughs in technology (both exploration and mine production) and modified by environmental issues
My vision of the future for exploration is that :
• Exploration expenditures will continue to be under pressure as companies seek alternative (more
profitable) ways of growing their business
Recent exploration performance has been poor and spending will be lower and more directed to
near-mine-site exploration.
However, this may not happen if the exploration industry manages to reinvent itself.
• I believe that the industry will rise to the challenge and develop ways to improve its discovery
record
• I also believe the industry structure is moving towards small project generation teams feeding
work to contractors / JV partners
• Junior companies will find more innovative ways of raising funds. The move to operating small
mines will lead to a vibrant junior sector
• Not withstanding the high cost of discovery, the world is not going to run out of resources. This
is certainly true for the short to medium term through near mine-site exploration, as well as
operational improvements in mining costs which lower the cut-off grade (thereby increasing the
resource base)
• Even so, in the longer term these brown field opportunities will eventually be exhausted. The
availability of resources will be driven by break-throughs in technology (both exploration and
mine production) and modified by environmental issues
Exploration TrendsExploration Trends 43
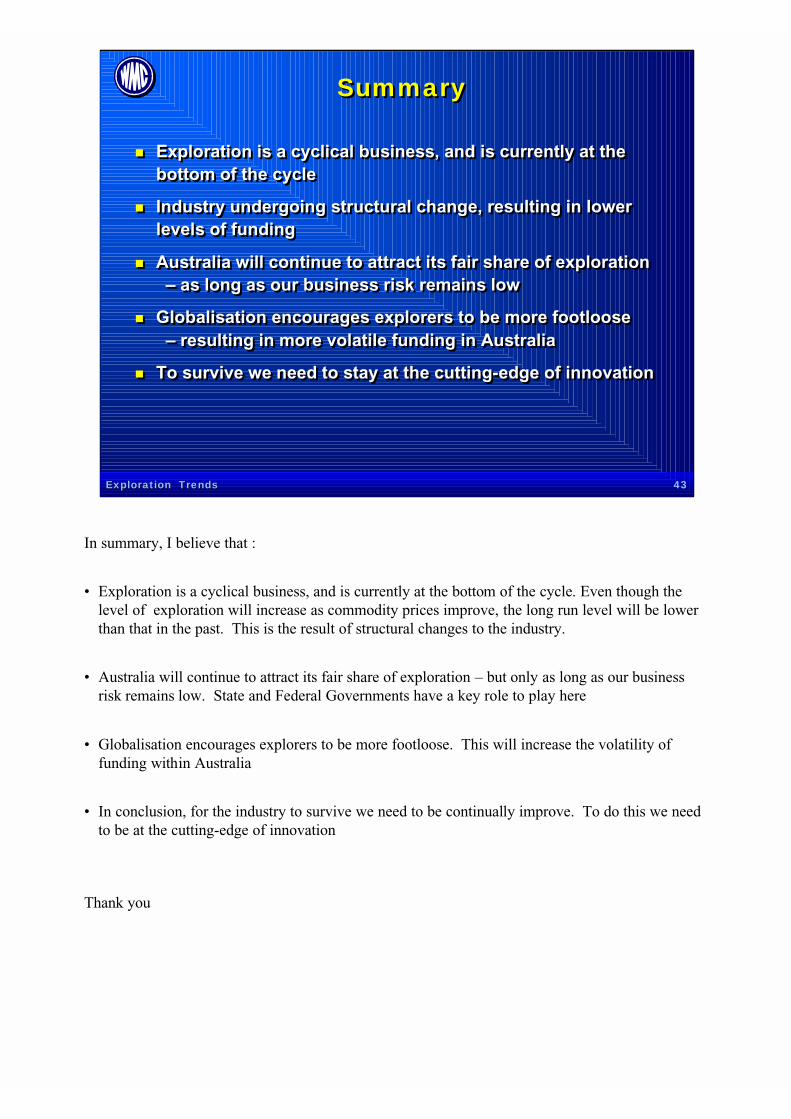
SummarySummary
! Exploration is a cyclical business, and is currently at the bottom of the cycle
! Industry undergoing structural change, resulting in lower levels of funding
! Australia will continue to attract its fair share of exploration– as long as our business risk remains low
! Globalisation encourages explorers to be more footloose – resulting in more volatile funding in Australia
! To survive we need to stay at the cutting-edge of innovation
In summary, I believe that :
• Exploration is a cyclical business, and is currently at the bottom of the cycle. Even though the
level of exploration will increase as commodity prices improve, the long run level will be lower
than that in the past. This is the result of structural changes to the industry.
• Australia will continue to attract its fair share of exploration – but only as long as our business
risk remains low. State and Federal Governments have a key role to play here
• Globalisation encourages explorers to be more footloose. This will increase the volatility of
funding within Australia
• In conclusion, for the industry to survive we need to be continually improve. To do this we need
to be at the cutting-edge of innovation
Thank you