love field airport modernization corporation - dwu 2015 os.pdf · interest on the $109,235,000 love...
TRANSCRIPT

OFFICIAL STATEMENT DATED JULY 23, 2015
NEW ISSUE – Book-Entry-Only Ratings: Moody’s: “A1” S&P: “A” Fitch: “A” See “OTHER INFORMATION – Ratings”
In the opinion of Co-Bond Counsel, interest on the Bonds will be excludable from gross income for federal income tax purposes under statutes, regulations, published rulings and court decisions existing on the date hereof, except as explained under “TAX MATTERS” herein. Interest on the Bonds will be an item of tax preference for purposes of determining the alternative minimum tax imposed on individuals and corporations under section 57(a)(5) of the Code. See “TAX MATTERS” herein for a discussion of Co-Bond Counsel’s opinion and certain collateral federal tax consequences.
$109,235,000LOVE FIELD AIRPORT MODERNIZATION CORPORATION
(A not-for-profit local government corporation acting on behalf of the City of Dallas, Texas)General Airport Revenue Bonds, Series 2015
Dated: Date of Delivery Due: November 1, as shown below
Payment terms. . . Interest on the $109,235,000 Love Field Airport Modernization Corporation General Airport Revenue Bonds, Series 2015 (the “Bonds”) will accrue from their date of delivery and will be payable on November 1, 2015, and on each May 1 and November 1 thereafter until maturity or prior redemption. Interest on the Bonds will be calculated on the basis of a 360-day year consisting of twelve 30-day months. The definitive Bonds will be initially registered and delivered only to Cede & Co., the nominee of The Depository Trust Company, New York, New York (“DTC”), pursuant to the Book-Entry-Only System described herein. Beneficial ownership of the Bonds may be acquired in denominations of $5,000 or integral multiples thereof. No physical delivery of the Bonds will be made to the owners thereof. Principal of and interest on the Bonds will be payable by the Paying Agent/Registrar to Cede & Co., which will make distribution of the amounts so paid to the participating members of DTC for subsequent payment to the beneficial owners of the Bonds. See “THE BONDS – Book-Entry-Only System” herein. The initial Paying Agent/Registrar for the Bonds is Wells Fargo Bank, National Association (see “THE BONDS – Paying Agent/Registrar”).
authority for issuance. . . The Bonds are being issued pursuant to a resolution (the “Bond Resolution”) adopted by the Board of Directors of the Love Field Airport Modernization Corporation (the “Issuer”, “LFAMC”, or the “Corporation”) on June 9, 2015 authorizing the issuance of the Bonds, and an Indenture of Trust, dated as of July 1, 2015 (the “Indenture”), by and between the Issuer and Wells Fargo Bank, National Association, as trustee (the “Trustee”), and are payable, both as to principal and interest, solely from and are secured by a first lien on and pledge of the Pledged Revenues (defined herein). Under the terms of a Project Financing Agreement between the City of Dallas, Texas (the “City”) and the Corporation (the “Project Financing Agreement”), the City has agreed to make available to the Corporation “Net Revenues” from the operation of the “Airport System,” which consists of Dallas Love Field, a general aviation airport owned and operated by the City (“Love Field”), Dallas Executive Airport, a general aviation airport owned and operated by the City, and a downtown heliport owned and operated by the City, in an amount sufficient to pay the principal of and interest on the Bonds. The Corporation has assigned its rights to the Net Revenues to the Trustee under the terms of the Indenture. The obligation of the City to make payments under the Project Financing Agreement is solely from the Net Revenues, and the City is not obligated to make payments under the Project Financing Agreement from monies raised or to be raised from taxation (see “THE BONDS – Security and Source of Payment”). In the Bond Resolution, the Corporation authorized the President of the Board of Directors of the Corporation and the Chief Financial Officer of the City to execute a bond purchase agreement to effect the sale of the Bonds. For a description of the Airport System, see “DESCRIPTION OF THE AIRPORT SYSTEM AND OPERATIONS.”
The Issuer was established by the City under the provisions of Chapter 431, Texas Transportation Code, and the general laws of the State of Texas to aid, assist, and act on behalf of the City in the performance of the City’s governmental functions and to promote the City, including the development of the geographic areas of the City included at or in the vicinity of Love Field.
PurPose. . . Proceeds from the sale of the Bonds will be used to (i) fund design and construction costs of an approximately 5,000 space parking garage and related improvements to increase public parking capacity at Love Field (the “Project”); (ii) fund approximately 27 months of capitalized interest (which is intended to cover the period commencing with the date of issuance of the Bonds through 12 months following substantial completion of construction of the Project); (iii) fund a bond debt service reserve fund; and (iv) pay costs of issuance.
CUSIP Prefix: 54714CMATURITY SCHEDULE & 9 DIGIT CUSIP
See Schedule on Page 2
LegaLity. . . The Bonds are offered for delivery when, as and if issued and received by the Underwriters listed below (the “Underwriters”) and subject to the approving opinions of the Attorney General of the State of Texas, and the opinions of Co-Bond Counsel, McCall, Parkhurst & Horton L.L.P. and Escamilla & Poneck, LLP (see Appendix G – “Form of Co-Bond Counsel’s Opinion”). Certain legal matters will be passed upon for the City by Andrews Kurth LLP, Dallas, Texas and Gonzalez Saggio & Harlan LLP, Atlanta, Georgia, Co-Disclosure Counsel for the City. Certain other legal matters will be passed upon for the City by the City Attorney. Certain legal matters will be passed upon for the Underwriters by their Co-Counsel, Locke Lord LLP, Dallas, Texas and White & Wiggins, LLP, Dallas, Texas.
DeLivery. . . It is expected that the Bonds will be available for delivery through DTC on or about August 18, 2015.
stern Brothers & co. goLDman, sachs & co.citigrouP
frost Bank LooP caPitaL markets PiPer Jaffray & co.ramirez & co., inc. stifeL, nicoLaus & comPany, incorPorateD WeLLs fargo securities

2 2
MATURITY SCHEDULE CUSIP Prefix: 54714C(1)
$109,235,000
General Airport Revenue Bonds, Series 2015
Maturity CUSIP(1) Maturity CUSIP(1)
(November 1) Amount Rate Yield Suffix (November 1) Amount Rate Yield Suffix
2018 3,885,000$ 5.000% 1.430% AA5 2027 6,025,000$ 5.000% 3.430% (2) AK3
2019 4,075,000 5.000% 1.670% AB3 2028 6,325,000 5.000% 3.550% (2) AL1
2020 4,280,000 5.000% 1.910% AC1 2029 6,640,000 5.000% 3.610% (2) AM9
2021 4,495,000 5.000% 2.230% AD9 2030 6,975,000 5.000% 3.680% (2) AN7
2022 4,720,000 5.000% 2.560% AE7 2031 7,320,000 5.000% 3.740% (2) AP2
2023 4,955,000 5.000% 2.770% AF4 2032 7,690,000 5.000% 3.790% (2) AQ0
2024 5,205,000 5.000% 2.970% AG2 2033 8,070,000 5.000% 3.850% (2) AR8
2025 5,465,000 5.000% 3.100% AH0 2034 8,475,000 5.000% 3.850% (2) AS6
2026 5,735,000 5.000% 3.300% (2) AJ6 2035 8,900,000 5.000% 3.860% (2) AT4
(Interest accrues from the Date of Delivery)
(1) CUSIP is a registered trademark of the American Bankers Association. CUSIP data herein is provided by CUSIP Global Services, managed by Standard & Poor’s Financial Services LLC on behalf of the American Bankers Association. This data is not intended to create a database and does not serve in any way as a substitute for the CUSIP Services. The Underwriters, the City, and the Co-Financial Advisors are not responsible for the selection or correctness of the CUSIP numbers set forth herein. (2) Yield shown is yield to the first optional call date, November 1, 2025. REDEMPTION. . . The Issuer reserves the right, at its option, to redeem the Bonds having stated maturities on and after November 1, 2026, in whole, or in part in principal amounts of $5,000 or any integral multiple thereof, on November 1, 2025 or on any date thereafter, at the redemption price of par plus accrued interest to the date fixed for redemption. (See "THE BONDS – Redemption of Bonds").
[THE REMAINDER OF THIS PAGE INTENTIONALLY LEFT BLANK]

3
This Official Statement and the information contained herein are subject to completion and amendment. The Bonds may not be sold nor any offers to buy be accepted prior to the time the Official Statement is delivered in final form. Under no circumstances shall this Official Statement constitute an offer to sell or the solicitation of any offer to buy, nor shall there be any sale of the Bonds in any jurisdiction in which such offer, solicitation, or sale would be unlawful prior to registration or qualification under the securities laws of any such jurisdiction. This Official Statement, which includes the cover page and the Appendices hereto, does not constitute an offer to sell or the solicitation of an offer to buy in any jurisdiction to any person to whom it is unlawful to make such offer, solicitation or sale. No dealer, broker, salesperson or other person has been authorized to give information or to make any representation other than those contained in this Official Statement, and, if given or made, such other information or representations must not be relied upon. The information set forth herein has been obtained from the Issuer and other sources believed to be reliable, but such information is not guaranteed as to accuracy or completeness and is not to be construed as the promise or guarantee of the Issuer’s Co-Financial Advisors. This Official Statement contains, in part, estimates and matters of opinion which are not intended as statements of fact, and no representation is made as to the correctness of such estimates and opinions, or that they will be realized. All information contained in this Official Statement is subject, in all respects, to the complete body of information contained in the original sources thereof and no guaranty, warranty, or other representation is made concerning the accuracy or completeness of the information herein. In particular, no opinion or representation is rendered as to whether any projection will approximate actual results, and all opinions, estimates and assumptions, whether expressly identified as such, should not be considered statements of fact. The Underwriters have provided the following sentence for inclusion in this Official Statement. The Underwriters have reviewed the information in this Official Statement in accordance with, and as part of, their responsibilities to investors under, the federal securities laws as applied to the facts and circumstances of this transaction, but the Underwriters do not guarantee the accuracy or completeness of such information. The information and expressions of opinion contained herein are subject to change without notice, and neither the delivery of this Official Statement nor any sale made hereunder shall, under any circumstances, create any implication that there has been no change in the affairs of the Issuer or other matters described. IN CONNECTION WITH THIS OFFERING, THE UNDERWRITERS MAY OVER-ALLOT OR EFFECT TRANSACTIONS WHICH STABILIZE THE MARKET PRICE OF THE ISSUE AT A LEVEL ABOVE THAT WHICH MIGHT OTHERWISE PREVAIL IN THE OPEN MARKET. SUCH STABILIZING, IF COMMENCED, MAY BE DISCONTINUED AT ANY TIME. THE AGREEMENTS OF THE ISSUER AND OTHERS RELATED TO THE BONDS ARE CONTAINED SOLELY IN THE CONTRACTS DESCRIBED HEREIN. NEITHER THIS OFFICIAL STATEMENT NOR ANY OTHER STATEMENT MADE IN CONNECTION WITH THE OFFER OR SALE OF THE BONDS IS TO BE CONSTRUED AS CONSTITUTING AN AGREEMENT WITH THE PURCHASERS OF THE BONDS. INVESTORS SHOULD READ THE ENTIRE OFFICIAL STATEMENT, INCLUDING ALL APPENDICES ATTACHED HERETO, TO OBTAIN INFORMATION ESSENTIAL TO MAKING AN INFORMED INVESTMENT DECISION. THE BONDS ARE EXEMPT FROM REGISTRATION WITH THE UNITED STATES SECURITIES AND EXCHANGE COMMISSION AND CONSEQUENTLY HAVE NOT BEEN REGISTERED THEREWITH. THE REGISTRATION, QUALIFICATION, OR EXEMPTION OF THE BONDS IN ACCORDANCE WITH APPLICABLE SECURITIES LAW PROVISIONS OF THE JURISDICTIONS IN WHICH THE BONDS HAVE BEEN REGISTERED, QUALIFIED, OR EXEMPTED SHOULD NOT BE REGARDED AS A RECOMMENDATION THEREOF. All information contained in this Official Statement is subject, in all respects, to the complete body of information contained in the original sources thereof and no guaranty, warranty, or other representation is made concerning the accuracy or completeness of the information herein. In particular, no opinion or representation is rendered as to whether any projection will approximate actual results, and all opinions, estimates and assumptions, whether expressly identified as such, should not be considered statements of fact. Neither the Issuer nor the Underwriters make any representation regarding the information contained in this Official Statement regarding The Depository Trust Company or its Book-Entry-Only System, as such information has been furnished by DTC. CUSIP numbers have been assigned to this issue by CUSIP Global Services, and are included solely for the convenience of the owners of the Bonds. Neither the Issuer nor the Underwriters shall be responsible for the selection or correctness of the CUSIP numbers shown on the inside cover page. This Official Statement contains “forward-looking” statements within the meaning of Section 21E of the Securities Exchange Act of 1934, as amended. Such statements may involve known and unknown risks, uncertainties and other factors which may cause the actual results, performance and achievements to be different from future results, performance and achievements expressed or implied by such forward-looking statements. Investors are cautioned that the actual results could differ materially from those set forth in the forward-looking statements (see “CERTAIN INVESTMENT CONSIDERATIONS – Forward Looking Statements”).

4
TABLE OF CONTENTS
OFFICIAL STATEMENT SUMMARY ...................................... 5 LOVE FIELD AIRPORT MODERNIZATION
CORPORATION ................................................................. 7 BOARD MEMBERS .................................................................. 7
CITY OFFICIALS, STAFF AND CONSULTANTS .................. 7 ELECTED OFFICIALS............................................................... 7 SELECTED ADMINISTRATIVE STAFF ...................................... 8 AVIATION MANAGEMENT OFFICIALS .................................... 8 CONSULTANTS AND ADVISORS .............................................. 8
INTRODUCTION .......................................................................... 9 THE ISSUER .................................................................................. 9 THE BONDS ................................................................................. 10
DESCRIPTION OF THE BONDS ............................................... 10 AUTHORITY FOR ISSUANCE .................................................. 10 PURPOSE ............................................................................... 10 SECURITY FOR THE BONDS .................................................. 10 RATE COVENANT ................................................................. 10 PLEDGED REVENUE FUND; FLOW OF FUNDS ....................... 11 DEBT SERVICE FUND ........................................................... 11 RESERVE FUND .................................................................... 11 PROJECT FUND ..................................................................... 11 COSTS OF ISSUANCE FUND................................................... 11 ADDITIONAL PARITY BONDS ............................................... 12 REDEMPTION OF BONDS ...................................................... 12 NOTICE OF REDEMPTION ..................................................... 12 BOOK-ENTRY-ONLY SYSTEM .............................................. 13 PAYING AGENT/REGISTRAR ................................................ 14 TRANSFER, EXCHANGE AND REGISTRATION ....................... 14 LIMITATION ON TRANSFER OF BONDS CALLED FOR
REDEMPTION ............................................................. 15 RECORD DATE FOR INTEREST PAYMENT ............................. 15 SOURCES AND USES OF FUNDS ............................................ 15 DEFEASANCE ........................................................................ 15 OWNERS’ REMEDIES ............................................................ 16 EVENTS OF DEFAULT ........................................................... 16 TRUSTEE REMEDIES ............................................................. 16 AMENDMENTS TO THE INDENTURE ...................................... 17
PROJECT FINANCING AGREEMENT .................................. 17 THE PROJECT ............................................................................ 18 AIRPORT USE AND LEASE AGREEMENT ......................... 18 REPORT OF THE AIRPORT CONSULTANT ....................... 19 DESCRIPTION OF THE AIRPORT SYSTEM AND
OPERATIONS ................................................................... 21 AIRPORT SYSTEM MANAGEMENT ........................................ 21 TABLE 1 – LOVE FIELD TOTAL ENPLANED PASSENGERS .... 22 TABLE 2 – LOVE FIELD LANDED WEIGHT BY AIRLINE ....... 23 TABLE 3 – LOVE FIELD HISTORICAL AIRLINE LANDINGS ... 23 TABLE 4 – LIST OF AIRLINES WITH SCHEDULED SERVICE
AT LOVE FIELD .......................................................... 24 TABLE 5 – LOVE FIELD AIRLINE MARKET SHARES ............. 24 TABLE 6 – COMPARATIVE STATEMENTS OF REVENUE,
EXPENSES AND CHANGES IN AIRPORT REVENUES
FUND NET ASSETS/POSITION .................................... 25 TABLE 7 – AIRPORT SYSTEM OPERATING REVENUE DETAIL
BY FISCAL YEAR ....................................................... 26 PASSENGER FACILITY CHARGES.......................................... 26
CERTAIN INVESTMENT CONSIDERATIONS .................... 27 GENERAL .............................................................................. 27 LOVE FIELD .......................................................................... 27 SOUTHWEST AIRLINES ......................................................... 27 COMPETITION FROM DFW AIRPORT.................................... 27 THE WRIGHT AMENDMENT ................................................. 27 THE LOVE FIELD MODERNIZATION PROGRAM AND ACCESS
TO THE CREDIT MARKETS ......................................... 28 GENERAL FACTORS AFFECTING AIR CARRIER REVENUES . 28
GENERAL FACTORS AFFECTING AIRLINE ACTIVITY ........... 28 UNCERTAINTIES OF THE AIRLINE INDUSTRY ....................... 29 AIRLINE MERGERS ............................................................... 29 EFFECT OF BANKRUPTCY ON AIRLINE LEASE
AGREEMENTS ............................................................ 29 NATIONAL SECURITY AND THREAT OF TERRORISM ............ 29 THE AIRLINES AND THE AIRLINE INDUSTRY ....................... 30 LIMITED OBLIGATIONS ........................................................ 30 ADDITIONAL PARITY BONDS ............................................... 30 REPORT OF THE AIRPORT CONSULTANT .............................. 30 PASSENGER FACILITY CHARGES.......................................... 30 AIRPORT USE AND LEASE AGREEMENTS ............................. 31 LIMITATION AND ENFORCEABILITY OF REMEDIES .............. 32 FORWARD-LOOKING STATEMENTS ..................................... 32
DEBT INFORMATION .............................................................. 33 TABLE 8 – AIRPORT SYSTEM DEBT SERVICE
REQUIREMENTS ......................................................... 33 FUTURE BOND ISSUANCE ...................................................... 33 FINANCIAL INFORMATION .................................................. 34
INVESTMENT POLICY ........................................................... 34 TABLE 9 – CURRENT INVESTMENTS .................................... 35
TAX MATTERS ........................................................................... 36 OPINION ............................................................................... 36 FEDERAL INCOME TAX ACCOUNTING TREATMENT OF
ORIGINAL ISSUE DISCOUNT ...................................... 36 COLLATERAL FEDERAL INCOME TAX CONSEQUENCES ...... 37 STATE AND LOCAL TAXES AND FOREIGN PERSONS ............ 37 FUTURE AND PROPOSED LEGISLATION ................................ 37
OTHER INFORMATION ........................................................... 38 RATINGS ............................................................................... 38 LITIGATION .......................................................................... 38 CLEAN AIR ACT AMENDMENTS OF 1990 ............................. 40 CONTINUING DISCLOSURE OF INFORMATION ...................... 41 ANNUAL REPORTS ............................................................... 41 DISCLOSURE EVENT NOTICES.............................................. 41 LIMITATIONS AND AMENDMENTS........................................ 41 COMPLIANCE WITH PRIOR UNDERTAKINGS ........................ 42 REGISTRATION AND QUALIFICATION OF BONDS FOR SALE 42 LEGAL INVESTMENTS AND ELIGIBILITY TO SECURE PUBLIC
FUNDS IN TEXAS ....................................................... 42 LEGAL OPINIONS .................................................................. 42 CO-FINANCIAL ADVISORS ................................................... 43 UNDERWRITING ................................................................... 43
APPENDICES
GENERAL INFORMATION REGARDING THE CITY ..................... A REPORT OF THE AIRPORT CONSULTANT ................................... B EXCERPTS FROM THE CITY OF DALLAS, TEXAS COMPREHENSIVE ANNUAL FINANCIAL REPORT ....................... C SUMMARY OF CERTAIN PROVISIONS OF THE INDENTURE ........ D PROJECT FINANCING AGREEMENT ............................................ E BOND RESOLUTION ................................................................... F FORM OF CO-BOND COUNSEL'S OPINION ................................ G
The cover page hereof, this page, the appendices included herein as any addenda, supplement or amendment hereto, are part of the Official Statement.

5
OFFICIAL STATEMENT SUMMARY This summary is subject in all respects to the more complete information and definitions contained or incorporated in this Official Statement. The offering of the Bonds to potential investors is made only by means of this entire Official Statement. No person is authorized to detach this summary from this Official Statement or to otherwise use it without the entire Official Statement. THE ISSUER .................................. The Love Field Airport Modernization Corporation, a not-for-profit local government corporation organized
under Chapter 431, Texas Transportation Code, and existing under the laws of the State of Texas (the “Issuer”, “LFAMC” or the "Corporation"), was authorized by the City Council of the City of Dallas (the “City”) for the public purpose of aiding, assisting, and acting on behalf of the City in the performance of its governmental functions to promote the City, including the development of the geographic areas of the City included at or in the vicinity of Love Field, a general aviation airport owned and operated by the City (“Love Field”).
The City is among the three most populous cities in Texas and among the ten most populous cities in the U.S. The City is approximately 378 square miles in area.
THE BONDS .................................. The $109,235,000 Love Field Airport Modernization Corporation General Airport Revenue Bonds, Series
2015 (the “Bonds”) are issued as serial bonds maturing on November 1 in each of the years 2018 through and including 2035. The Bonds shall mature on the dates as shown on the inside cover of this Official Statement (see “THE BONDS – Description of the Bonds”). There are no other obligations currently outstanding secured by the revenues of Love Field.
PAYMENT OF INTEREST .............. Interest on the Bonds accrues from their date of delivery, and is payable commencing November 1, 2015 and
on each May 1 and November 1 thereafter until maturity or prior redemption (see “THE BONDS – Description of the Bonds” and “THE BONDS – Redemption of Bonds – Optional Redemption”.
AUTHORITY FOR ISSUANCE ......... The Bonds are issued pursuant to the general laws of the State, particularly Chapters 22 and 431, Texas
Transportation Code, the resolution passed by the Board of Directors of the Corporation (the “Bond Resolution”) and the Indenture of Trust between the Corporation and Wells Fargo Bank, National Association, as trustee (the “Indenture”). The City Council of the City passed a resolution approving the issuance of the Bonds by the Corporation and the execution of the Project Financing Agreement (herein defined).
SECURITY FOR THE BONDS .......... Under the terms of a Project Financing Agreement between the City and the Corporation (the “Project
Financing Agreement”), the City has agreed to make available to the Corporation “Net Revenues” from the operation of the Airport System (see "DESCRIPTION OF THE AIRPORT SYSTEM AND OPERATIONS"), in an amount sufficient to pay the principal of and interest on the Bonds. The Corporation has assigned its rights to the Net Revenues to the Trustee under the terms of the Indenture. The obligation of the City to make payments under the Project Financing Agreement is solely from the Net Revenues, and the City is not obligated to make payments under the Project Financing Agreement from monies raised or to be raised from taxation. The Bonds constitute special obligations of the Corporation payable, both as to principal and interest, solely from and secured by a first lien on and pledge of the Pledged Revenues (as defined in the Indenture), which include the Net Revenues (see “THE BONDS – Security for the Bonds”). "Net Revenues" do not include Passenger Facility Charges.
REDEMPTION ............................... The Issuer reserves the right, at its option, to redeem the Bonds having stated maturities on and after
November 1, 2026 on November 1, 2025 or any date thereafter at the par value thereof, plus accrued interest to the date fixed for redemption (see “THE BONDS – Redemption of Bonds”).
TAX EXEMPTION ......................... In the opinion of Co-Bond Counsel, the interest on the Bonds will be excludable from gross income for
federal income tax purposes under existing law, subject to the matters described under the caption “TAX MATTERS” herein. Interest on the Bonds will be an item of tax preference for purposes of determining the alternative minimum tax imposed on individuals and corporations under section 57(a)(5) of the Code. See "TAX MATTERS" herein for a discussion of Co-Bond Counsel’s opinion and certain collateral federal tax consequences.
USE OF PROCEEDS ....................... Proceeds from sale of the Bonds, together with other available funds, if necessary, will be used to: (i) fund
design and construction costs of a 5,000 space parking garage and related improvements to increase public parking capacity at Love Field (the "Project"); (ii) fund approximately 27 months of capitalized interest (which is intended to cover the period commencing with the date of issuance of the Bonds through 12 months following substantial completion of construction of the Project); (iii) fund a bond debt service reserve fund; and (iv) pay costs of issuance.

6
RATINGS ..................................... The Bonds are rated “A1”, “A”, and “A”, respectively, by Moody’s Investors Service, Inc. (“Moody’s”) Standard & Poor’s Ratings Services, a Standard & Poor’s Financial Services LLC business (“S&P”), and Fitch Inc. (“Fitch”, and together with Moody’s and S&P, the “Rating Agencies”). An explanation of the significance of such ratings may be obtained from the company furnishing the rating. The ratings reflect only the respective views of such organizations and neither the City nor the Issuer make any representation as to the appropriateness of the ratings (see “OTHER INFORMATION – Ratings”).
PAYMENT RECORD ..................... The Corporation has never defaulted in payment of its bonds. BOOK-ENTRY-ONLY SYSTEM ..... The definitive Bonds will be initially registered and delivered only to Cede & Co., the nominee of DTC
pursuant to the Book-Entry-Only System described herein. Beneficial ownership of the Bonds may be acquired in denominations of $5,000 or integral multiples thereof. No physical delivery of the Bonds will be made to the beneficial owners thereof. Principal of, premium, if any, and interest on the Bonds will be payable by the Paying Agent/Registrar to Cede & Co., which will make distributions of the amounts so paid to the participating members of DTC for subsequent payment to the beneficial owners of the Bonds (see “THE BONDS – Book-Entry-Only System”).
For additional information regarding the Corporation and the City, please contact:
Ms. Jeanne Chipperfield City of Dallas 1500 Marilla Street, 4DN Dallas, Texas 75201 (214) 670-7804
or
Mr. Wayne Placide Mr. Steve Johnson First Southwest Company, LLC 325 N. St. Paul, Suite 800 Dallas, Texas 75201 (214) 953-4000
or
Mr. Noe Hinojosa, Jr. Mr. U.S. Williams Estrada Hinojosa & Company, Inc. 1717 Main Street, 47th Floor Dallas, Texas 75201 (214) 658-1670
For additional information regarding Love Field and the Airport System, please contact:
Mr. Mark Duebner Director of Aviation Dallas Love Field 8008 Herb Kelleher Way, LB 16 Dallas, Texas 75235 (214) 670-6080
[THE REMAINDER OF THIS PAGE INTENTIONALLY LEFT BLANK]

7
LOVE FIELD AIRPORT MODERNIZATION CORPORATION BOARD MEMBERS
Forest Turner, President
Shelia Robinson, Vice President
Corrine Steeger, Secretary-Treasurer
Bob Montgomery (ex officio)
CITY OFFICIALS, STAFF AND CONSULTANTS ELECTED OFFICIALS
City Council Term Expires Occupation
Mike Rawlings June 2019 4 Years Private Equity (Vice-Chairman)
Mayor - Place 15
Scott Griggs June 2017 4 Years Attorney
Councilmember - Place 1
Adam Medrano June 2017 2 Years Civic Leader
Councilmember - Place 2
Casey Thomas, II June 2017 Newly Elected Teacher
Councilmember - Place 3
Carolyn King Arnold June 2017 Newly Elected Civic Leader
Councilmember - Place 4
Rick Callahan June 2017 2 Years Real Estate Broker
Councilmember - Place 5
Monica Alonzo June 2017 4 Years Civic Leader
Mayor Pro Tem - Place 6
Tiffinni A. Young June 2017 Newly Elected Civic Leader
Councilmember - Place 7
Erik Wilson June 2017 Newly Elected Teacher
Deputy Mayor Pro Tem - Place 8
Mark Clayton June 2017 Newly Elected Insurance
Councilmember - Place 9
Adam McGough June 2017 Newly Elected Attorney
Councilmember - Place 10
Lee M. Kleinman June 2017 2 Years Investor
Councilmember - Place 11
Sandy Greyson June 2017 4 Years Community Volunteer
Councilmember - Place 12
Jennifer S. Gates June 2017 2 Years Community Volunteer/Registered Nurse
Councilmember - Place 13
Philip Kingston June 2017 2 Years Commercial Litigator
Councilmember - Place 14
Length of Serviceas of
July 1, 2015

8
SELECTED ADMINISTRATIVE STAFF
Name PositionA.C. Gonzalez City Manager 1 Year, 4 Months 15 YearsRyan S. Evans First Assistant City Manager 1 Year, 4 Months 30 Years, 4 MonthsJill A. Jordan, P.E. Assistant City Manager 16 Years, 6 Months 32 Years, 7 MonthsEric Campbell Assistant City Manager 9 Months 9 MonthsMark McDaniel Assistant City Manager 10 Months 10 MonthsJoey Zapata Assistant City Manager 4 Years, 1 Month 21 Years, 2 MonthsJeanne Chipperfield Chief Financial Officer 5 Years, 5 Months 21 Years, 2 MonthsWarren Ernst City Attorney 1 Year, 4 Months 11 Years, 9 MonthsRosa A. Rios City Secretary 3 Years, 5 Months 8 Years, 11 MonthsCraig Kinton City Auditor 8 Years, 9 Months 8 Years, 9 Months
Length of Time in Tenure with CityThis Position as of of Dallas as of
July 1, 2015 July 1, 2015
AVIATION MANAGEMENT OFFICIALS
Name PositionMark Duebner Director 4 Years, 5 Months 18 Years, 11 MonthsLana Furra Assistant Director 3 Years, 1 Month 21 Years, 6 MonthsLynetta Kidd Assistant Director 10 Months 18 Years, 7 MonthsTerry Mitchell Assistant Director 16 Years 30 Years, 6 Months
Length of Time in Tenure with CityThis Position as of of Dallas as of
July 1, 2015 July 1, 2015
CONSULTANTS AND ADVISORS Auditors ........................................................................................................................................................... Grant Thornton L.L.P. Dallas, Texas Co-Bond Counsel ....................................................................................................................... McCall, Parkhurst & Horton L.L.P. Dallas, Texas Escamilla & Poneck, LLP Dallas, Texas Co-Disclosure Counsel ....................................................................................................................................... Andrews Kurth LLP Dallas, Texas Gonzalez Saggio & Harlan LLP Atlanta, Georgia Co-Financial Advisors ...................................................................................................................... First Southwest Company, LLC Dallas, Texas Estrada Hinojosa & Company, Inc. Dallas, Texas
9
OFFICIAL STATEMENT
Relating to
$109,235,000
LOVE FIELD AIRPORT MODERNIZATION CORPORATION
(A not-for-profit local government corporation acting on behalf of the City of Dallas, Texas) General Airport Revenue Bonds, Series 2015
INTRODUCTION
This Official Statement provides certain information in connection with the issuance by the Love Field Airport Modernization Corporation (the "Corporation", “LFAMC” or the "Issuer") of its General Airport Revenue Bonds, Series 2015 (the "Bonds"). The City of Dallas, Texas, (the “City”) created the Corporation as a local government corporation to act on behalf of the City to facilitate the development of the Love Field Modernization Project and to act on behalf of the City in the performance of its governmental function to promote development of the geographic areas of the City included at or in the vicinity of Dallas Love Field (“Love Field”) and in furtherance of the promotion, development, encouragement, and maintenance of employment, commerce, aviation activity, tourism and economic development in the City. The Bonds are issued pursuant to the general laws of the State of Texas, and a resolution authorizing the issuance of the Bonds (the "Bond Resolution") adopted by the Board of Directors of the Issuer (the "Board"), and an Indenture of Trust, dated as of July 1, 2015 (the "Indenture"), by and between the Issuer and Wells Fargo Bank, National Association, as trustee (the "Trustee"). The Bonds are "General Airport Revenue Bonds", as such term is defined in the Indenture. The City and the Issuer have also negotiated and plan to execute a Project Financing Agreement (defined herein) pursuant to which the Issuer and the City have agreed to cooperate and coordinate their activities with respect to the commencement, financing, design and construction of improvements at Love Field, including the project for which the proceeds of the Bonds will be used as described under “THE BONDS-Purpose” below. For a more detailed description of the Project, see also “THE PROJECT” and “THE PROJECT FINANCING AGREEMENT” herein. It is currently anticipated that the costs of designing and constructing the Project will be funded with the proceeds of the Bonds and one subsequent issue of General Airport Revenue Bonds, anticipated to be issued in 2016. Under the Issuer's article of incorporation, approval by the Board and the City is required prior to the delivery of the Bonds. Board approval was effected through the adoption of the Bond Resolution. City approval was effected through the adoption of a resolution by the City Council of the City on June 10, 2015. The Bonds are the first series of General Airport Revenue Bonds issued pursuant to the Indenture. Other than the Bonds, there are no other obligations outstanding secured by and payable from the general airport revenues of the “Airport System,” which consists of Dallas Love Field (“Love Field”), a general aviation airport owned and operated by the City, Dallas Executive Airport, a general aviation airport owned and operated by the City, and a downtown heliport owned and operated by the City. See “DESCRIPTION OF THE AIRPORT SYSTEM AND OPERATIONS.” There follows in this Official Statement descriptions of the Bonds, the Bond Resolution, the Indenture, certain other information about the Issuer, and certain agreements between the City and the Issuer, including the Project Financing Agreement between the City and the Issuer (the “Project Financing Agreement”). An Airport Consultant’s Report prepared in connection with the issuance of the Bonds is included herein as Appendix B. All capitalized terms used herein which are not defined in the text of this Official Statement shall have the meanings set forth in the Indenture (see “Appendix D – SUMMARY OF CERTAIN PROVISIONS OF THE INDENTURE”) or the Bond Resolution (see “Appendix F”), except as otherwise indicated herein. All descriptions of documents contained herein are only summaries and are qualified in their entirety by reference to each such document. Copies of such documents may be obtained from First Southwest Company, LLC, Dallas, Texas, and Estrada, Hinojosa & Co., Inc., Co-Financial Advisors to the City. References to web site addresses presented herein are for informational purposes only and may be in the form of a hyperlink solely for the reader’s convenience. Unless specified otherwise, such web sites and the information or links contained therein are not incorporated into, and are not part of, this Official Statement.
THE ISSUER The City created the Issuer to act on behalf of the City to facilitate the development of the Love Field Modernization Project and to promote the development of the geographic areas of the City included at or in the vicinity of Love Field, in furtherance of the promotion, development, encouragement, and maintenance of employment, commerce, aviation security, tourism and economic development in the City. The Issuer is authorized by Chapter 431, Texas Transportation Code, and the Bond Resolution to issue the Bonds to finance the Project and to enter into the documents described in this Official Statement in connection with the issuance of the Bonds (see “THE PROJECT”). The Issuer is governed by a three-member Board of Directors, who are appointed to serve in that capacity by the City Council of the City. In addition, an ex-officio member of the Board of Directors, who has no voting power, is appointed by Southwest Airlines Co. (“Southwest”).

10
THE BONDS
DESCRIPTION OF THE BONDS The Bonds are dated the Date of Delivery, and mature on November 1 in each years and in the amounts shown on the inside cover page hereof. Interest will be computed on the basis of a 360-day year of twelve 30-day months, and will be payable on November 1, 2015, and on each May 1 and November 1 thereafter until maturity or prior redemption. AUTHORITY FOR ISSUANCE The Bonds are being issued pursuant to the Bond Resolution and the Indenture, and are payable, both as to principal and interest, solely from and secured by a first lien on and pledge of the Pledged Revenues (defined herein). Under the terms of the Project Financing Agreement, the City has agreed to make available to the Corporation “Net Revenues” from the operation of the Airport System, in an amount sufficient to pay the principal of and interest on the Bonds. The Corporation has assigned its rights to the Net Revenues to the Trustee under the terms of the Indenture (see “PROJECT FINANCING AGREEMENT”). The obligation of the City to make payments under the Project Financing Agreement is solely from the Net Revenues, and the City is not obligated to make payments under the Project Financing Agreement from monies raised or to be raised from taxation (see “THE BONDS – Security for the Bonds”). PURPOSE Proceeds from sale of the Bonds, together with other available funds, if necessary, will be used to: (i) fund the design and construction costs of an approximately 5,000 space parking garage and related improvements to increase public parking capacity at Love Field; (ii) fund approximately 27 months of capitalized interest (which is intended to cover the period commencing with the date of issuance of the Bonds through 12 months following substantial completion of construction of the Project); (iii) fund a bond debt service reserve fund; and (iv) to pay costs of issuance, including Underwriters’ discount, provided, however, that no more than two percent of the proceeds of the Bonds shall be used for the payment of the costs of issuance. For a more detailed description of the sources and use of proceeds of the Bonds, see “THE BONDS – Sources and Uses of Funds” herein. For more detailed description of the Project, see “THE PROJECT” herein. SECURITY FOR THE BONDS The Bonds are limited obligations of the Issuer payable solely from (i) the Net Revenues (defined below) deposited into the revenue fund established with the Trustee (the “Pledged Revenue Fund”), (ii) other moneys deposited or required to be deposited to the various funds held under the Indenture and (iii) the earnings and investments thereon (collectively “the Pledged Revenues”).
Pursuant to the Indenture, in order to further secure the Bonds and any future General Airport Revenue Bonds, the Issuer entered into the Indenture with the Trustee for the purpose of assigning and pledging to the Trustee the Net Revenues payable to the Issuer by the City in accordance with the terms of the Project Financing Agreement and for the purpose of establishing the Pledged Revenue Fund, the Project Fund, and the Debt Service Fund and thereby providing the Pledged Revenues to be held by the Trustee to secure the payment and principal of and interest on all General Airport Revenue Bonds from time to time issued by the Issuer. “Net Revenues” is defined in the Project Financing Agreement as the revenues of the Airport System deposited to the credit of the Aviation Revenue Fund, a fund established and maintained by the City in accordance with the terms of the Airport Use and Lease Agreement, that are available after the funding of the Operations and Maintenance Account and the Operations and Maintenance Reserve Account and deposited to the credit of the General Airport Revenue Bond Debt Service Fund, each account as established and maintained as provided in the Airport Use and Lease Agreement. “Net Revenues” do not include Passenger Facility Charges. See "DESCRIPTION OF THE AIRPORT SYSTEM AND OPERATIONS" herein. The Bonds are not obligations of the City, the State of Texas, or any entity other than the Issuer. The Issuer is not obligated to pay principal of and interest on the Bonds from any moneys of the Issuer other than the Pledged Revenues. The Issuer has no taxing powers. See “AIRPORT USE AND LEASE AGREEMENT” herein for a description of the Airport Use and Lease Agreement, each fund created therein, as well as the order of priority of Airport System revenues for such funds, the summary of which is extracted from the Airport Consultant Report. See also “PROJECT FINANCING AGREEMENT” herein for a description of the Project Financing Agreement, including the rates the Issuer is required to fix, maintain, and collect so long as the Bonds of the Issuer secured by Net Revenues are outstanding and unpaid. See also "THE REPORT OF THE AIRPORT CONSULTANT" for information about the financial feasibility report prepared by Unison Consulting, Inc. (the “Airport Consultant”). A table summarizing Net Revenues, debt service requirements associated with the Bonds, a subsequent bond issue anticipated in 2016 (the "Series 2016 Bonds") and a future issue of General Airport Revenue Bonds is included under such heading herein. RATE COVENANT For so long as any Bonds of the Issuer secured by Net Revenues are outstanding and unpaid, in the Project Financing Agreement the City covenants and agrees (a) to operate and maintain the Airport System in accordance with the provisions of the Airport Use and Lease Agreement, (b) to fix, establish, maintain and collect such rates, charges and fees for the use and availability of the Airport System at all times as are necessary to produce revenues sufficient, (1) to pay all current operation and maintenance expenses and operation and maintenance

11
reserve requirements of the Airport System, (2) to produce Net Revenues for each Fiscal Year at least equal to 1.25 times the Average Annual Debt Service on all outstanding Bonds and Additional Parity Bonds scheduled to occur during each respective Fiscal Year, and (3) to pay all other obligations of the Airport System, and (c) to collect Net Revenues sufficient to meet its payment obligations under the Project Financing Agreement. PLEDGED REVENUE FUND; FLOW OF FUNDS Immediately upon receipt thereof, the Issuer shall deposit into the Pledged Revenue Fund all Pledged Revenues. Money in the Pledged Revenue Fund shall be held in trust by the Trustee and applied on each Transfer Date in the following manner and order of priority:
(A) First, to the Debt Service Fund amounts necessary to make the amounts on deposit therein equal to the interest and Principal Installments, and premium, if any, due on the General Airport Revenue Bonds in the then current Fiscal Year;
(B) Second, to the Reserve Fund amounts required to attain or maintain the Reserve Requirement;
(C) Third, to the payment of the fees and expenses of the Trustee and Paying Agent/Registrar due and owing, for the next twelve (12) month period;
(D) Fourth to any fund or account created for the benefit of any Subordinate Lien Obligations issued or incurred by the Issuer; provided that immediately prior to any such transfers the deposits required by clauses(A) through (C) above have been made or provided for; and
(E) Fifth, as directed by the Corporation, to the Project Fund to pay for any services, improvements or other costs of the Project as are agreed to by the City and the Corporation by an agreement duly authorized by the governing bodies of both the City and the Corporation; provided that immediately prior to any such transfers the deposits required or payments made by (A) through (D) above have been made or provided for.
DEBT SERVICE FUND Money in the Debt Service Fund shall be held in trust by the Trustee. The Issuer shall deposit or cause to be deposited into the Debt Service Fund, moneys designated by the Issuer as capitalized interest on the General Airport Revenue Bonds, transfers from the Pledged Revenue Fund as provided above, and, to the extent necessary, other Pledged Revenues in such amounts and at such times to provide that amounts necessary to pay all General Airport Revenue Bonds when due, including specifically to pay interest and Principal Installments due on the General Airport Revenue Bonds in the then current Fiscal Year. The Trustee shall transfer on each Interest Payment Date and each Principal Installment Payment Date to the Paying Agent/Registrar such amounts in the Debt Service Fund to pay Principal Installments and interest on the General Airport Revenue Bonds as the same becomes due. RESERVE FUND Pursuant to the Indenture, the Issuer is required to maintain an amount equal to the Maximum Annual Debt Service; provided, that in any event the Reserve Requirement shall be the lesser of (A) 1.25 times the Average Annual Debt Service, (B) Maximum Annual Debt Service or (C) ten percent (10%) of the stated principal amount of the Bonds or 10% of the issue price of the Bonds if the Bonds are issued with more than a de minimis amount of original issue discount (the "Reserve Requirement") in the Reserve Fund created under the Indenture as additional security for the Bonds and any Additional Parity Bonds. The Reserve Requirement shall be recomputed annually and after the issuance of any series of Additional Parity Bonds. See "Appendix D — SUMMARY OF CERTAIN PROVISIONS OF THE INDENTURE ". Upon the issuance of the Bonds, the Reserve Requirement will be $9,346,750.00. The Issuer will fund such amount with proceeds of the Bonds. PROJECT FUND The Project Fund and any accounts or subaccounts thereof shall initially be funded as provided in the Bond Resolution. The money and securities in the Project Fund shall be held in trust by the Trustee and applied as provided herein, and until such application, the money and securities in such fund shall be subject to a lien and charge in favor of the Owners of the Bonds. The Trustee is hereby authorized and directed to make disbursements from the Project Fund and to issue its checks therefor or otherwise pay upon receipt of a requisition in accordance with the next succeeding paragraph. The Trustee shall keep and maintain adequate records pertaining to the Project Fund and all disbursements therefrom. The Trustee shall use money in the Project Fund solely to pay or reimburse the Corporation for Project Costs and the repayment of any advances, loans, notes or other obligations used to finance Project Costs. Before any payment shall be made from the Project Fund, there shall be filed with the Trustee a completed requisition, signed by an Authorized Representative of the Corporation and the City. Upon receipt of such requisition, the Trustee shall make payment from the Project Fund in accordance with such requisition. COSTS OF ISSUANCE FUND The Trustee shall deposit to the credit of the Costs of Issuance Fund the amount set forth in the closing instructions executed by or on behalf of the Corporation in connection with the delivery of a Series of General Airport Revenue Bonds. The Trustee shall apply the monies in the Costs

12
of Issuance Fund to the payment of Costs of Issuance, in accordance with the certificate to be delivered as provided in the Bond Resolution in respect to the application of proceeds of General Airport Revenue Bonds. The Trustee will transfer any balance remaining in the Costs of Issuance Fund on the one hundred and eightieth (180th) day following the issuance of the Series of General Airport Revenue Bonds to the Pledged Revenue Fund. ADDITIONAL PARITY BONDS The Corporation reserves the right to issue, for any lawful purpose (including the refunding of any previously issued or incurred General Airport Revenue Bonds), one or more series of Additional Parity Bonds payable from and secured by a first lien on the Pledged Revenues, on a parity with the Bonds (see "Appendix D — SUMMARY OF CERTAIN PROVISIONS OF THE INDENTURE"); provided, however, that no Additional Parity Bonds may be issued unless:
(a) The Additional Parity Bonds mature on, and interest is payable on, the Principal Installment Payment Dates and Interest Payment Dates, respectively;
(b) There shall be on deposit in the Reserve Fund, after the issuance of the Additional Parity Bonds, an amount equal to the Reserve Requirement on any Outstanding Parity Bonds plus the Additional Parity Bonds;
(c) The Corporation is not in material default with the terms of the Indenture, any Bond Resolution, the Project Financing Agreement or any other agreement to which it is a party and has so certified; and
(d) The City delivers to the Corporation and the Trustee either (i) a written report from an Airport Consultant setting forth projections which indicate that the estimated Net Revenues of Love Field for each of three consecutive Fiscal Years beginning in the earlier of (A) the first Fiscal Year following the estimated date of completion and initial use of all revenue producing facilities to be financed with Additional Parity Bonds, based upon a written estimated completion date by the consulting engineer for the facility or facilities, or (B) the first Fiscal Year in which the Corporation will have scheduled payments of interest on or principal of the Additional Parity Bonds to be issued for the payment of which provision has not been made as indicated in the report of the Airport Consultant from proceeds of the Additional Parity Bonds, investment income on the proceeds of such Additional Parity Bonds or from other appropriated sources (other than Net Revenues) are at least equal to 1.25 times the Average Annual Debt Service on all Outstanding Parity Bonds scheduled to occur during each respective Fiscal Year after taking into consideration the additional Debt Service requirements for the Additional Parity Bonds to be issued, or (ii) a certificate executed by the Aviation Director and countersigned by the Chief Financial Officer of the City showing that, for either the City's most recent complete Fiscal Year or for any consecutive twelve (12) out of the most recent eighteen (18) months, the Net Revenues of the Airport System were equal to at least 1.10 times the Maximum Annual Debt Service requirements of all Parity Bonds scheduled to occur in the then current or any future Fiscal Year after taking into consideration the issuance of the Additional Parity Bonds proposed to be issued.
The foregoing notwithstanding, the conditions set forth in paragraph (d) above shall not apply to (A) the first $250,000,000 in aggregate principal amount of General Airport Revenue Bonds issued by the Corporation to fund the costs of the design and construction of the Project, funding the Reserve Fund and other funds and accounts established by the Indenture, and related Costs of Issuance, and (B) the issuance of any Series of Additional Parity Bonds for refunding purposes that will have the result of reducing the maximum debt service requirements on the General Airport Revenue Bonds so refunded. The Bonds are the first series of General Airport Revenue Bonds issued under the Indenture. Upon the delivery of the Bonds, the Corporation may issue up to $140,765,000 in General Airport Revenue Bonds for the purposes described above without satisfying the condition set forth in paragraph (d) above.
REDEMPTION OF BONDS Optional Redemption. The Issuer reserves the right, at its option, to redeem the Bonds having stated maturities on and after November 1, 2026, in whole, or in part in principal amounts of $5,000 or any integral multiple thereof, on November 1, 2025 or on any date thereafter, at the redemption price of par plus accrued interest to the date fixed for redemption. If less than all of the Bonds are to be redeemed and if less than all of a maturity is to be redeemed, the Paying Agent/Registrar will determine by lot the Bonds, or portions thereof, within such maturity to be redeemed; provided, however, that during any period in which ownership of the Bonds is determined only by a book entry at a securities depository (see “THE BONDS – Book-Entry-Only System”, below), if fewer than all of the Bonds of the same maturity are to be redeemed, the particular Bonds will be selected in accordance with arrangements between the Issuer and the securities depository. NOTICE OF REDEMPTION Not less than 30 days prior to a redemption date for the Bonds called for redemption, the Issuer will cause (i) a written notice of such redemption to be given by the Paying Agent/Registrar to the registered owner of each Bond or a portion thereof being called for redemption by depositing such notice in the United States mail, first class, postage prepaid, addressed to each such registered owner at the address of such registered owner shown on the Registration Books of the Paying Agent/Registrar and (ii) a notice of such redemption to be published one time in a financial journal or publication of general circulation in the United States of America or the State of Texas carrying as a regular feature notices of municipal bonds called for redemption; provided, however, that the failure to send, mail or receive such notice described in (i) above, or any defect therein or in the sending or mailing thereof, will not affect the validity or effectiveness of the proceedings for the redemption of any Bond, and the publication of notice as described in (ii) above shall be the only notice actually required in connection with or as a prerequisite to the redemption of any Bonds. ANY NOTICE WILL BE CONCLUSIVELY PRESUMED TO HAVE BEEN DULY GIVEN, WHETHER OR NOT THE REGISTERED OWNER RECEIVES SUCH NOTICE. NOTICE HAVING BEEN SO GIVEN, THE BONDS CALLED FOR REDEMPTION WILL BECOME DUE AND PAYABLE ON THE SPECIFIED REDEMPTION DATE, AND

13
NOTWITHSTANDING THAT ANY BOND OR PORTION THEREOF HAS NOT BEEN SURRENDERED FOR PAYMENT, INTEREST ON SUCH BOND OR PORTION THEREOF WILL CEASE TO ACCRUE, EXCEPT AS PROVIDED IN THE NEXT PARAGRAH. With respect to any optional redemption of the Bonds, unless the Paying Agent/Registrar has received funds sufficient to pay the principal and premium, if any, and interest on the Bonds to be redeemed before giving of a notice of redemption, the notice of redemption may state the Issuer may condition redemption on the receipt by Paying Agent/Registrar of such funds on or before the date fixed for the redemption, or on the satisfaction of any other prerequisites set forth in the notice of redemption. If a conditional notice of redemption is given and such prerequisites to redemption and sufficient funds are not received, the notice shall be of no force and effect, the Issuer shall not redeem the Bonds and the Paying Agent/Registrar shall give notice, in the manner in which the notice of redemption was given, that the Bonds have not been redeemed. BOOK-ENTRY-ONLY SYSTEM This section describes how ownership of the Bonds are to be transferred and how the principal of, premium, if any, and interest on the Bonds are to be paid to and credited by The Depository Trust Company, New York, New York (“DTC”), while the Bonds are registered in its nominee name. The information in this section concerning DTC and the Book-Entry-Only System has been provided by DTC for use in disclosure documents such as this Official Statement. The Issuer believes the source of such information to be reliable, but takes no responsibility for the accuracy or completeness thereof. The Issuer cannot and does not give any assurance that (1) DTC will distribute payments of debt service on the Bonds, or redemption or other notices, to DTC Participants, (2) DTC Participants or others will distribute debt service payments paid to DTC or its nominee (as the registered owner of the Bonds), or redemption or other notices, to the Beneficial Owners, or that they will do so on a timely basis, or (3) DTC will serve and act in the manner described in this Official Statement. The current rules applicable to DTC are on file with the United States Securities and Exchange Commission (the “SEC”), and the current procedures of DTC to be followed in dealing with DTC Participants are on file with DTC. DTC will act as securities depository for the Bonds. The Bonds will be issued as fully-registered securities registered in the name of Cede & Co. (DTC’s partnership nominee) or such other name as may be requested by an authorized representative of DTC. One fully-registered certificate for each maturity and series of the Bonds will be issued, in the aggregate principal amount of such issue, and will be deposited with DTC. DTC, the world’s largest depository, is a limited-purpose trust company organized under the New York Banking Law, a “banking organization” within the meaning of the New York Banking Law, a member of the Federal Reserve System, a “clearing corporation” within the meaning of the New York Uniform Commercial Code, and a “clearing agency” registered pursuant to the provisions of Section 17A of the Securities Exchange Act of 1934. DTC holds and provides asset servicing for over 3.5 million issues of U.S. and non-U.S. equity issues, corporate and municipal debt issues, and money market instruments (from over 100 countries) that DTC’s participants (“Direct Participants”) deposit with DTC. DTC also facilitates the post-trade settlement among Direct Participants of sales and other securities transactions in deposited securities, through electronic computerized book-entry transfers and pledges between Direct Participants’ accounts. This eliminates the need for physical movement of securities certificates. Direct Participants include both U.S. and non-U.S. securities brokers and dealers, banks, trust companies, clearing corporations, and certain other organizations. DTC is a wholly-owned subsidiary of The Depository Trust & Clearing Corporation (“DTCC”). DTCC is the holding company for DTC, National Securities Clearing Corporation and Fixed Income Clearing Corporation, all of which are registered clearing agencies. DTCC is owned by the users of its regulated subsidiaries. Access to the DTC system is also available to others such as both U.S. and non-U.S. securities brokers and dealers, banks, trust companies, and clearing companies that clear through or maintain a custodial relationship with a Direct Participant, either directly or indirectly (“Indirect Participants”). Direct Participants and Indirect Participants are collectively referred to as “Participants”. DTC has a Standard & Poor’s rating of “AA+”. The DTC Rules applicable to its Participants are on file with the SEC. More information about DTC can be found at www.dtcc.com. Purchase of the Bonds under the DTC system must be made by or through Direct Participants, which will receive a credit for the Bonds on DTC’s records. The ownership interest of each actual purchaser of each Bonds (“Beneficial Owner”) is in turn to be recorded on the Participants’ records. Beneficial Owners will not receive written confirmation from DTC of their purchase. Beneficial Owners are, however, expected to receive written confirmations providing details of the transaction, as well as periodic statements of their holdings, from the Participant through which the Beneficial Owner entered into the transaction. Transfers of ownership interests in the Bonds are to be accomplished by entries made on the books of Participants acting on behalf of Beneficial Owners. Beneficial Owners will not receive certificates representing their ownership interests in Bonds, except in the event that use of the book-entry system for the Bonds of such series discontinued. To facilitate subsequent transfers, all Bonds deposited by Direct Participants with DTC are registered in the name of DTC’s partnership nominee, Cede & Co., or such other name as may be requested by an authorized representative of DTC. The deposit of Bonds with DTC and their registration in the name of Cede & Co. or such other DTC nominee do not effect any change in beneficial ownership. DTC has no knowledge of the actual Beneficial Owners of the Bonds; DTC’s records reflect only the identity of the Direct Participants to whose accounts such Bonds are credited, which may or may not be the Beneficial Owners. The Participants will remain responsible for keeping account of their holdings on behalf of their customers. Conveyance of notices and other communications by DTC to Direct Participants, by Direct Participants to Indirect Participants, and by Direct Participants and Indirect Participants to Beneficial Owners will be governed by arrangements among them, subject to any statutory or regulatory requirements as may be in effect from time to time. Beneficial Owners of Bonds may wish to take certain steps to augment the

14
transmission to them of notices of significant events with respect to the Bonds, such as redemptions, tenders, defaults, and proposed amendments to the Bond documents. For example, Beneficial Owners of Bonds may wish to ascertain that the nominee holding the Bonds for their benefit has agreed to obtain and transmit notices to Beneficial Owners. In the alternative, Beneficial Owners may wish to provide their names and addresses to the Paying Agent/Registrar and request that copies of the notices be provided directly to them. Neither DTC nor Cede & Co. (nor any other DTC nominee) will consent or vote with respect to Bonds unless authorized by a Direct Participant in accordance with DTC’s Procedures. Under its usual procedures, DTC mails an Omnibus Proxy to the Issuer as soon as possible after the record date. The Omnibus Proxy assigns Cede & Co.’s consenting or voting rights to those Direct Participants to whose accounts Bonds are credited on the record date (identified in a listing attached to the Omnibus Proxy). Principal and interest payments on the Bonds will be made to Cede & Co., or such other nominee as may be requested by an authorized representative of DTC. DTC’s practice is to credit Direct Participants’ accounts upon DTC’s receipt of funds and corresponding detail information from the Issuer or the Paying Agent/Registrar, on the payable date in accordance with their respective holdings shown on DTC’s records. Payments by Participants to Beneficial Owners will be governed by standing instructions and customary practices, as is the case with securities held for the accounts of customers in bearer form or registered in “street name,” and will be the responsibility of such Participant and not of DTC nor its nominee, the Paying Agent/Registrar of each series, or the Issuer, subject to any statutory or regulatory requirements as may be in effect from time to time. Payment of redemption proceeds, principal and interest payments to Cede & Co. (or such other nominee as may be requested by an authorized representative of DTC) is the responsibility of the Issuer or the Paying Agent/Registrar, disbursement of such payments to Direct Participants will be the responsibility of DTC, and disbursement of such payments to the Beneficial Owners will be the responsibility of Participants. DTC may discontinue providing its services as depository with respect to the Bonds at any time by giving reasonable notice to the Issuer or the Paying Agent/Registrar. Under such circumstances, in the event that a successor depository is not obtained, Bonds are required to be printed and delivered. Use of Certain Terms in Other Sections of this Official Statement. In reading this Official Statement, it should be understood that while the Bonds are in the Book-Entry-Only System, references in other sections of this Official Statement to registered owners or bondholders should be read to include the person for which the Participant acquires an interest in the Bonds, but (i) all rights of ownership must be exercised through DTC and the Book-Entry-Only System, and (ii) except as described above, notices that are to be given to registered owners under the Bond Resolution will be given only to DTC. Information concerning DTC and the Book-Entry-Only System has been obtained from DTC and is not guaranteed as to accuracy or completeness by, and is not to be construed as a representation by, the Issuer or the Underwriters. Effect of Termination of Book-Entry-Only System. In the event that the Book-Entry-Only System is discontinued by DTC or the use of the Book-Entry-Only System is discontinued by the Issuer, printed Bonds will be issued to the holders and the Bonds will be subject to transfer, exchange and registration provisions as set forth in the Bond Resolution and summarized under “THE BONDS – Transfer, Exchange and Registration” below. PAYING AGENT/REGISTRAR The initial Paying Agent/Registrar is Wells Fargo Bank, National Association. In the Bond Resolution, the Issuer retains the right to replace the Paying Agent/Registrar. The Issuer covenants to maintain and provide a Paying Agent/Registrar at all times until the Bonds are duly paid, and any successor Paying Agent/Registrar shall be a commercial bank or trust company or other entity duly qualified and legally authorized to serve as and perform the duties and services of Paying Agent/Registrar for the Bonds. Upon any change in the Paying Agent/Registrar for the Bonds, the Issuer agrees to promptly cause a written notice thereof to be sent to each registered owner of the Bonds by United States mail, first class, postage prepaid, which notice shall also give the address of the new Paying Agent/Registrar. In the event the Book-Entry-Only System should be discontinued, principal of the Bonds will be payable to the registered owner at maturity or prior redemption upon presentation at the Designated Trust Office. Interest on the Bonds will be payable by check, dated as of the interest payment date, and mailed by the Paying Agent/Registrar to registered owners as shown on the records of the Paying Agent/Registrar on the Record Date (see "THE BONDS – Record Date for Interest Payment" herein), or by such other method, acceptable to the Paying Agent/Registrar, requested by, and at the risk and expense of, the registered owner. If the date for the payment of the principal of or interest on the Bonds shall be a Saturday, Sunday, legal holiday, or day on which banking institutions in the city where the Paying Agent/Registrar is located are authorized by law or executive order to close, then the date for such payment shall be the next succeeding day which is not such a Saturday, Sunday, legal holiday, or day on which banking institutions are authorized to close; and payment on such date shall have the same force and effect as if made on the original date payment was due. TRANSFER, EXCHANGE AND REGISTRATION In the event the Book-Entry-Only System should be discontinued, the Bonds may be transferred and exchanged on the registration books of the Paying Agent/Registrar only upon presentation and surrender to the Paying Agent/Registrar and such transfer or exchange shall be without expense or service charge to the registered owner, except for any tax or other governmental charges required to be paid with respect to such registration, exchange and transfer. Bonds may be assigned by the execution of an assignment form on the Bonds or by other instrument of transfer and assignment acceptable to the Paying Agent/Registrar. New Bonds will be delivered by the Paying Agent/Registrar, in lieu of the Bonds being transferred or exchanged, at the Designated Trust Office of the Paying Agent/Registrar, or sent by United States mail, first class,

15
postage prepaid, to the new registered owner or his designee. To the extent possible, new Bonds issued in an exchange or transfer of Bonds will be delivered to the registered owner or assignee of the registered owner in not more than three business days after the receipt of the Bonds to be canceled, and the written instrument of transfer or request for exchange duly executed by the registered owner or his duly authorized agent, in form satisfactory to the Paying Agent/Registrar. New Bonds registered and delivered in an exchange or transfer shall be in any integral multiple of $5,000 for any one maturity and series and for a like aggregate designated amount and series as the Bonds surrendered for exchange or transfer. See "Book-Entry-Only System" herein for a description of the system to be utilized initially in regard to ownership and transferability of the Bonds. Neither the Issuer nor the Paying Agent/Registrar shall be required to transfer or exchange any Bond called for redemption, in whole or in part, within 45 days of the date fixed for redemption; provided, however, such limitation of transfer shall not be applicable to an exchange by the registered owner of the uncalled balance of the Bonds. LIMITATION ON TRANSFER OF BONDS CALLED FOR REDEMPTION Neither the Issuer nor the Paying Agent/Registrar shall be required (1) to make any transfer or exchange during a period beginning at the opening of business 15 days before the day of the first mailing of a notice of redemption of Bonds and ending at the close of business on the day of such mailing, or (2) to transfer or exchange any Bonds so selected for redemption when such redemption is scheduled to occur within 30 calendar days; provided, however, such limitation shall not be applicable to an exchange by the registered owner of the uncalled principal balance of a Bond. RECORD DATE FOR INTEREST PAYMENT The record date (“Record Date”) for the interest payable on the Bonds on any interest payment date means the close of business on the 15th day of the preceding month. In the event of a non-payment of interest on a scheduled payment date, and for 30 days thereafter, a new record date for such interest payment (a “Special Record Date”) will be established by the Paying Agent/Registrar, if and when funds for the payment of such interest have been received from the Issuer. Notice of the Special Record Date and of the scheduled payment date of the past due interest (“Special Payment Date”, which must be 15 days after the Special Record Date) will be sent at least five business days prior to the Special Record Date by United States mail, first class, postage prepaid, to the address of each registered owner of a Bond appearing on the registration books of the Paying Agent/Registrar at the close of business on the last business day next preceding the date of mailing of such notice. SOURCES AND USES OF FUNDS
(1)
The sources and uses of funds, shall be as follows:
SourcesPar Amount of Bonds 109,235,000$ Reoffering Premium 13,636,921 Total Sources of Funds 122,871,921$
UsesDeposit to Project Fund 100,000,000$ Deposit to Debt Service Reserve Fund 9,346,750 Deposit to Debt Service Fund (Capitalized Interest) 12,031,022 Deposit to Cost of Issuance Fund 866,297 Underwriters' Discount 627,852 Total Uses of Funds 122,871,921$
(1) Numbers are rounded.
DEFEASANCE
The Bond Resolution and the Indenture provide that the Issuer may discharge its obligations to the registered owners of any or all of the Bonds to pay principal, interest and redemption price thereon in any manner permitted by current law. Under current State law, such discharge may be accomplished either (i) by depositing with the Comptroller of Public Accounts of the State a sum of money equal to the principal of, premium, if any, and all interest to accrue on the Bonds to maturity or redemption or (ii) by depositing with any place of payment (paying agent) for obligations of the Issuer payable from revenues, amounts sufficient to provide for the payment and/or redemption of the Bonds; provided that such deposits may be invested and reinvested only in (1) direct obligations of the United States of America, including obligations that are unconditionally guaranteed by the United States of America, (2) noncallable obligations of an agency or instrumentality of the United States of America, including obligations that are unconditionally guaranteed or insured by the agency or instrumentality and that, on the date the Issuer adopts or approves proceedings authorizing the issuance of refunding bonds or, if such defeasance is not in connection with the issuance of refunding bonds, on the date the Issuer provides for the funding of an escrow to effect the defeasance of the Bonds, are rated as to investment quality by a nationally-recognized investment rating firm not less than "AAA" or its

16
equivalent, (3) noncallable obligations of a state or an agency or a county, municipality, or other political subdivision of a state that have been refunded and that, on the date the Issuer adopts or approves proceedings authorizing the issuance of refunding bonds or, if such defeasance is not in connection with the issuance of refunding bonds, on the date the Issuer provides for the funding of an escrow to effect the defeasance of the Bonds, are rated as to investment quality by a nationally-recognized investment rating firm not less than "AAA" or its equivalent or (4) any other then authorized securities or obligations that may be used to defease obligations such as the Bonds under then applicable laws of the State of Texas. The foregoing obligations may be in book entry form, and shall mature and/or bear interest payable at such times and in such amounts as will be sufficient to provide for the scheduled payment and/or redemption of the Bonds.
Upon such deposit as described above, such Bonds shall no longer be regarded to be outstanding or unpaid. After firm banking and financial arrangements for the discharge and final payment or redemption of the Bonds have been made as described above, all rights of the Issuer to initiate proceedings to call the Bonds for redemption or take any other action amending the terms of the Bonds are extinguished; provided, however, that the right to call the Bonds for redemption is not extinguished if the Issuer: (i) in the proceedings providing for the firm banking and financial arrangements, expressly reserves the right to call the Bonds for redemption; (ii) gives notice of the reservation of that right to the owners of the Bonds immediately following the making of the firm banking and financial arrangements; and (iii) directs that notice of the reservation be included in any redemption notices that it authorizes. OWNERS’ REMEDIES The Indenture specifies Events of Default with respect to the Bonds (see "THE BONDS – Events of Default”). If an Event of Default occurs, or the City fails to make payments to the Issuer under the terms of the Project Financing Agreement, the Owners may seek a writ of mandamus to compel officials of the Issuer or the City to carry out their legally imposed duties with respect to the Bonds if there is no other available remedy at law to compel performance of the Bonds, the Indenture or the Project Financing Agreement and the obligations of the Issuer or the City are not uncertain or disputed. The issuance of a writ of mandamus is controlled by equitable principles, and with the discretion of the court, but may not be arbitrarily refused. There is no acceleration of maturity of the Bonds in the event of default and, consequently, the remedy of mandamus may have to be relied upon from year to year. The Texas Supreme Court ruled in Tooke v. City of Mexia 197 S.W.3d 325 (Tex. 2006) that a waiver of sovereign immunity in a contractual dispute must be provided for by statute in “clear and unambiguous” language. Because it is unclear whether the Texas legislature has effectively waived the City’s sovereign immunity from a suit for money damages, bondholders may not be able to bring such a suit against the City for breach of the Project Financing Agreement covenants. Even if a judgment against the City could be obtained, it could not be enforced by direct levy and execution against the City's property. Further, the registered owners cannot themselves foreclose on property within the City or sell property within the City to enforce the tax lien on taxable property to pay the principal of and interest on the Bonds. Furthermore, the City and the Issuer are eligible to seek relief from its creditors under Chapter 9 of the U.S. Bankruptcy Code (“Chapter 9”). Chapter 9 includes an automatic stay provision that would prohibit, without Bankruptcy Court approval, the prosecution of any other legal action by creditors or bondholders of an entity which has sought protection under Chapter 9. Therefore, should the City or the Issuer avail itself of Chapter 9 protection from creditors, the ability to enforce would be subject to the approval of the Bankruptcy Court (which could require that the action be heard in Bankruptcy Court instead of other federal or state court); and the Bankruptcy Code provides for broad discretionary powers of a Bankruptcy Court in administering any proceeding brought before it. The opinion of Co-Bond Counsel will note that all opinions relative to the enforceability of the Indenture, the Bond Resolution, the Bonds and the Project Financing Agreement are qualified with respect to the customary rights of debtors relative to their creditors and by general principles of equity that permit the exercise of judicial discretion. For other information affecting the ownership of the Bonds, see "CERTAIN INVESTMENT CONSIDERATIONS” herein. EVENTS OF DEFAULT Under the Indenture, the following constitute "Events of Default": (A) failure to pay when due Principal Installments or interest on any General Airport Revenue Bond; or (B) failure to deposit to the Debt Service Fund money sufficient for the payment of any Principal Installments or interest payable on the General Airport Revenue Bonds by no later than the date when such Principal Installment or interest becomes due and payable; or (C) failure by the Issuer to observe or perform any other covenant, agreement or obligation on its part to be observed or performed contained in the Indenture or in the General Airport Revenue Bonds, which failure shall have continued for a period of thirty (30) days after written notice, either by registered or certified mail, to the Issuer specifying the failure and requiring that it be remedied, which notice may be given by the Trustee in its discretion and shall be given by the Trustee at the written request of the Holders of not less than 25 percent (25%) in aggregate principal amount of the General Airport Revenue Bonds then outstanding. TRUSTEE REMEDIES If an Event of Default shall occur and be continuing, then, in addition to all of the other rights and remedies granted to the Trustee under the Indenture, the Trustee in its discretion, subject to the provisions of the Indenture, may proceed to protect and enforce its rights and the rights of the Owners of General Airport Revenue Bonds by suit, action or proceeding in equity or at law or otherwise, whether for the specific performance of any covenant or agreement contained in the Indenture, the Bond Resolution or the General Airport Revenue Bonds or in aid of the execution of any power granted in the Indenture or for the enforcement of any other legal, equitable or other remedy, as the Trustee, being

17
advised by counsel, shall deem most effectual to protect and enforce any of the rights of the Trustee or such Owners of the General Airport Revenue Bonds, including, without limitation, the right to seek a writ of mandamus issued by a court of competent jurisdiction compelling the members of the Board or other officers of the Corporation or the City to make payment of the Net Revenues (but only from and to the extent of the sources provided in the Indenture and the Project Financing Agreement) or to observe and perform such covenant, obligations or conditions of the Indenture or the Project Financing Agreement. No remedy conferred upon or reserved to the Trustee under the Indenture is intended to be exclusive of any other available remedy or remedies, but each and every such remedy shall be cumulative and shall be in addition to every other remedy given under the Indenture or under the General Airport Revenue Bonds, or now or hereafter existing at law or in equity or by statute. Acceleration shall not be a remedy if an Event of Default occurs and is continuing. No delay or omission to exercise any right or power accruing upon any default shall impair any such right or power or shall be construed to be a waiver of any such default or acquiescence therein, and every such right and power may be exercised from time to time and as often as may be deemed expedient. AMENDMENTS TO THE INDENTURE Any modification, change or amendment of the Indenture may be made only by a supplemental indenture adopted and executed by the Issuer and the Trustee with the consent of the Owners of not less than a majority of the aggregate principal amount of the General Airport Revenue Bonds then Outstanding. Notwithstanding the preceding paragraph of this Section, the Issuer and the Trustee may, without the consent of the Owners of any of the General Airport Revenue Bonds, enter into one or more supplemental indentures, which shall form a part hereof, for any one or more of the following purposes:
(a) to cure any ambiguity, inconsistency or formal defect or omission in the Indenture;
(b) to grant to or confer upon the Trustee for the benefit of the Owners of the General Airport Revenue Bonds any additional rights, remedies, powers or authority that may lawfully be granted to or conferred upon the Owners of the General Airport Revenue Bonds or the Trustee or either of them;
(c) to subject to the lien of the Indenture additional revenues, properties or collateral;
(d) to modify, amend or supplement the Indenture or any supplemental indenture in such manner as to provide further assurances that interest on the General Airport Revenue Bonds will, to the greatest extent legally possible, be excludable from gross income for federal income tax purposes;
(e) to obtain bond insurance for any General Airport Revenue Bonds; and
(f) to permit the assumption of the Corporation obligations under the Indenture by any other entity that may become the legal successor to the Corporation;
provided, however, that no provision in such supplemental indenture shall be inconsistent with the Indenture or shall impair in any manner the rights of the Owners of the General Airport Revenue Bonds. The Trustee shall not be obligated to enter into any such supplemental indenture which adversely affects the Trustee’s own rights, duties or immunities under the Indenture. Notwithstanding the first two paragraphs of this Section, no modification, change or amendment to this Indenture shall, without the consent of the Owner of each General Airport Revenue Bond so affected, extend the time of payment of the Principal Installments or interest thereon, or reduce the Principal Installments or premium, if any, thereon, or the rate of interest thereon, or make the Principal Installments or interest thereon payable in any coin or currency other than that provided in the Indenture, or deprive such Owner of the lien of the Indenture on the revenues pledged under the Indenture. Moreover, without the consent of the Owner of each General Airport Revenue Bond then Outstanding, no modification, change or amendment to the Indenture shall permit the creation of any lien on the revenues pledged hereunder equal or prior to the lien hereof, or reduce the aggregate principal amount of General Airport Revenue Bonds, the Owners of which are required to approve any such modification, change or amendment of the Indenture.
PROJECT FINANCING AGREEMENT
The City and the Issuer have negotiated and plan to execute a Project Financing Agreement, dated as of July 1, 2015, pursuant to which the City and the Issuer have agreed to cooperate and coordinate for the financing, design, and construction of the Project. Under the provisions of the Project Financing Agreement, the Issuer has the authority to issue the Bonds and one or more future series of General Airport Revenue Bonds to finance the Project and the funding of any necessary reserve fund or capitalized interest account and the payment of the costs of issuance. The Bonds shall be repaid by the Issuer from payments made by the City from Net Revenues pursuant to the terms of the Project Financing Agreement. Debt service on the Bonds shall be secured, in whole or in part, by funds received from the City, including without limitation, the Net Revenues, and deposited by the Issuer from time to time in the Pledged Revenue Fund.

18
Under the terms of the Indenture, the Issuer has assigned to the Trustee all of the Issuer’s right, title and interest to the Project Financing Agreement, specifically the right to receive the Net Revenues of the Airport System. For a complete description of the duties of the City and the Issuer's obligations under the Project Financing Agreement, including, but not limited to, the Issuer's power to issue the Bonds, the permitted use of Net Revenues, and conditions on the disbursement of Bond proceeds, please see "Appendix E — PROJECT FINANCING AGREEMENT ". The Project Financing Agreement should be read in its entirety for an understanding of the obligations of the City to transfer Net Revenues to the Issuer, and the use of the Net Revenues by the Issuer in support of the Bonds.
THE PROJECT Pursuant to the terms of the Project Financing Agreement, the Project consists of the construction of a nine-level public parking garage to be located adjacent to the ticketing lobby at Love Field. Two levels will be below surface and the remaining seven levels will be above surface. The parking garage is expected to have approximately 5,000 parking spaces. In addition, the Project includes certain enabling projects, including: the development of a surface parking lot to accommodate short-term parking for persons with vehicles waiting to pick up passengers, including site modifications, storm water improvements, lighting, pavement markings, signage for the cell phone lot, an outdoor flight information display system, and landscaping; demolitions of the East Satellite Building; relocation of utility lines around the site of the proposed parking garage; the installation of a parking revenue control system to serve each of the parking garages at Love Field; the installation of a parking guidance system to serve each parking garage at Love Field; and finish out of temporary offices for various entities that provide essential services at Love Field, including the Dallas Police Department and the Airport Operations division. For additional information on the Project, see "Appendix B – Report of the Airport Consultant – Section I. B: The Project"
AIRPORT USE AND LEASE AGREEMENT The Airport Use and Lease Agreement (1) governs ongoing airline operations and use of Love Field both during and after the implementation of the Love Field Modernization Program, (2) defines and allocates Love Field gates, (3) establishes a rates and charges methodology, (4) develops terms for the use of Love Field, (5) develops guidelines for future capital improvements at Love Field, and (6) provides other provisions that are consistent with accomplishing the terms of the Five Party Agreement, which is an agreement between the City, the City of Fort Worth, Texas, the board of Dallas Fort Worth International Airport, Southwest, and American Airlines, wherein the City and Southwest initially agreed to the program referred to herein as the Love Field Modernization Program. The Airport Use and Lease Agreement became effective on October 1, 2008, with a 20-year term that will expire on September 30, 2028. The Airport Use and Lease Agreement also establishes priorities for the application of Airport System revenues. Airport System revenues are to be deposited into the Aviation Revenue Fund and applied first to pay operations and maintenance expenses and any required deposits to the Operations and Maintenance Reserve Account; then to pay debt service on outstanding General Airport Revenue Bonds and any required deposits to the General Airport Revenue Bond Debt Service Reserve Fund. Only after these obligations are met are Airport System revenues available to be applied to reimburse Southwest for certain facilities payments it has made pursuant to a facilities agreement and revenue credit agreement to the extent that the City receives certain Airport System revenues sufficient for such purpose. Pursuant to the terms of the Airport Use and Lease Agreement, Airport System revenues are to be deposited into the Aviation Revenue Fund and applied to the following funds and accounts in the following order of priority:
1. Operations and Maintenance Account – to pay operations & maintenance expenses. 2. Operation and Maintenance Reserve Account – to maintain a balance equal to three (3) months—twenty-five percent (25%) – of
the current annual operating budget for the Airport System. 3. General Airport Revenue Bond Debt Service Fund – to pay General Airport Revenue Bond Debt Service on any bonds, notes or
debt instruments that may be issued from time to time by the City or the Corporation to fund Airport System Capital Improvements. 4. General Airport Revenue Bond Debt Service Reserve Fund – to fund or restore the General Airport Revenue Bond Debt Service
Reserve Fund established in support of General Airport Revenue Bonds. 5. Southwest Reimbursement Account – to reimburse Southwest for Love Field Modernization Project Debt Service Facilities
Payments made by Southwest under its facilities agreement with the LFAMC. 6. Emergency Repair & Replacement Reserve – to replenish the balance in this fund to Five Million Dollars ($5,000,000). 7. Aviation Capital Fund – all remaining revenues, to be used to pay the net costs of Airport System capital improvements and for
other lawful purposes of the Airport System. For a more detailed discussion of the Airport Use and Lease Agreement, including its rate making methodology and description of cost-centers for the purposes of calculating rates and charges, as well as other financial analysis and forecasts, including both historical and projected Airport System revenues and expenses, see “Appendix B-Report of the Airport Consultant – Section V: Financial Analysis and Forecast,” particularly Subsection V.A.4.
19
For information about airline and non-airline revenues of the Airport System, see “Appendix B – Report of the Airport Consultant – Section V: Financial Analysis and Forecast,” particularly Subsection V.D.
REPORT OF THE AIRPORT CONSULTANT
The City has engaged Unison Consulting Inc. (the “Airport Consultant”) to evaluate the ability of the City to generate sufficient Net Revenues from the Airport System to meet the financial requirements established by the Indenture. See the report of the Airport Consultant (the “Report”) included herein as Appendix B. In the Report, the Airport Consultant identifies key factors upon which the future financial results of Love Field depend. Section I describes Love Field, the Project, presents the estimated costs of the Project, and describes the Aviation Department’s capital improvement program and funding plan. Section II describes Love Field’s air service area and discusses the local economic base. Section III analyzes the historical aviation activity at Love Field and presents forecasts of future aviation activity. Section IV analyzes the historical public parking activity at Love Field and presents forecasts of future public parking activity and revenues. Section V reviews the financial framework for the Airport System, reviews the recent historical financial performance of the Airport System, and examines the ability of the Airport System to generate sufficient Net Revenues to meet the payment obligations of the Bonds, the Series 2016 Bonds, and a potential future issue of General Airport Revenue Bonds during the forecast period. The Report should be read in its entirety for an understanding of the assumptions and rationale underlying the financial forecasts. As noted in the Report, any forecast is subject to uncertainties. Some of the assumptions used to develop the forecasts will not be realized, and unanticipated events and circumstances may occur. Therefore, there will be differences between the forecast and actual results, and those differences may be material. See “CERTAIN INVESTMENT CONSIDERATIONS” in this Official Statement. For the purposes of the Airport Consultant’s analysis, the Project and the Aviation Department’s capital improvement plan are taken into account, including projects that are designated to be funded, all or in part, with proceeds of the bonds to be issued by the Issuer.
[THE REMAINDER OF THIS PAGE INTENTIONALLY LEFT BLANK]

20
The following table extracted from the Report, provides the debt service coverage estimates and projections during the forecast period.
Budgeted (1)
2015 2016 2017 2018 2019 2020 2021 2022 2023 2024
Total Airport System Revenues 82,651,799$ 94,231,500$ 95,745,250$ 112,582,000$ 123,308,500$ 127,512,750$ 130,499,000$ 136,816,250$ 140,839,250$ 144,006,000$
O&M Expenses 56,695,400 66,730,000 69,039,000 71,744,000 74,546,000 77,261,000 80,087,000 83,034,000 86,110,000 89,313,000
Deposit to O&M Reserve Account 1,807,995 2,509,000 577,000 676,000 701,000 678,000 707,000 737,000 769,000 800,000
Net Revenues 24,148,404$ 24,992,500$ 26,129,250$ 40,162,000$ 48,061,500$ 49,573,750$ 49,705,000$ 53,045,250$ 53,960,250$ 53,893,000$
Debt Service on GARBs
Series 2015 Bonds -$ -$ -$ 9,346,750$ 9,342,500$ 9,343,750$ 9,344,750$ 9,345,000$ 9,344,000$ 9,346,250$
Series 2016 Bonds - - - - 7,932,750 7,933,000 7,935,000 7,933,250 7,937,500 7,937,000
Future Bonds - - - - - - - 3,600,000 3,600,000 3,600,000
Total GARBs -$ -$ -$ 9,346,750$ 17,275,250$ 17,276,750$ 17,279,750$ 20,878,250$ 20,881,500$ 20,883,250$
Remaining Net Revenues 24,148,404$ 24,992,500$ 26,129,250$ 30,815,250$ 30,786,250$ 32,297,000$ 32,425,250$ 32,167,000$ 33,078,750$ 33,009,750$
Transfer to Southwest Holding Account 12,994,750 12,645,250 12,278,250 18,327,750 19,988,000 19,988,000 19,986,000 19,987,000 19,984,750 19,988,250
Replenish of Emergency Reserve - - - - - - - - - -
Transfer to Capital Account 11,153,654$ 12,347,250$ 13,851,000$ 12,487,500$ 10,798,250$ 12,309,000$ 12,439,250$ 12,180,000$ 13,094,000$ 13,021,500$
Debt Service Coverage on GARBs N/A N/A N/A 4.30 2.78 2.87 2.88 2.54 2.58 2.58
Projected (1)
Fiscal Year Ending September 30,
Source: Unison Consulting, Inc. projections, revised to reflect updated estimated debt service requirements, based on the debt service for the bonds. (1)See “CERTAIN INVESTMENT CONSIDERATIONS – Forward-Looking Statements.”
[THE REMAINDER OF THIS PAGE INTENTIONALLY LEFT BLANK]
21
DESCRIPTION OF THE AIRPORT SYSTEM AND OPERATIONS
The Airport System consists of Love Field, a commercial and general aviation airport, Dallas Executive Airport, a general aviation airport, and a heliport located adjacent to the Dallas Convention Center in downtown Dallas. Owned and operated by the City, Love Field was originally designed as a World War I military training base on October 19, 1917. It was named in memory of Lieutenant Moss Lee Love who was killed in California in 1913 and was the eighth aviation officer to be killed in an airplane crash. Passenger service out of Love Field began on September 17, 1927. Located in the heart of Dallas, Love Field is just seven miles northwest of the City’s Central Business District. Its boundaries are Mockingbird Lane, Denton Drive, Shorecrest Lane and Lemmon Avenue. Love Field is surrounded by low-to high-income neighborhoods and local businesses. For calendar year 2013 (the latest year in which published data are available), Love Field ranked 43rd in the United States in terms of the number of passenger enplanements (Love Field had approximately 4.3 million enplanements), according to statistics compiled by Airports Council International – North America (ACI-NA). As of May 2015, Love Field is served by four airlines offering flights and non-stop services throughout the United States. Enplanements have increased 47% since the expiration of the Wright Amendment in October, 2014. Love Field sits on approximately 1,300 acres of land. It currently has three runways: (1) Runway 13L/31R is 7,752 feet x 150 feet, (2) Runway 13R/31L is 8,800 feet x 150 feet, (3) Runway 18/36 (crosswind) is 6,147 feet x 150 feet. Love Field has a new 20-gate T-shaped terminal concourse and two covered parking garages totaling 6,980 public parking spaces. Love Field generates revenue from leases for buildings and land leased for various types of uses, including: facilities operated by fixed based operators (FBOs), airline support facilities, aviation support facilities, rental car service areas, and concession support facilities. Building and ground rentals are received by the City for a number of categories of building space and land at Love Field, including office space, land parcels, hangars, and non-airline spaces in the terminal building complex. A $10 million state-of-the-art Baggage Handling System (BHS) at Love Field, which is owned by the Airport and operated by Southwest Airlines, is capable of processing more than 2,000 bags per hour. The 18,000 sq. ft. BHS located under the terminal has more than 7,000 feet of conveyor belt propelled by more than 500 computer controlled electric motors. Love Field is fully equipped with all the necessary aeronautical lighting, airport markings and air navigation radio aids to ensure its accessibility to aircraft even under highly adverse weather conditions. Its long parallel runways are enhanced with state of the art visual approach lighting aids and four instrumental landing systems. Other features include surveillance radar services, a windshear warning system and an FAA air traffic control tower that provides services 24 hours a day. For a description of changes in service by the airlines at Love Field, see “Appendix B – Report of the Airport Consultant – Section III: Aviation Activity Analysis and Forecasts,” particularly Subsection III.B. Dallas Executive Airport, owned and operated by the City, is 9 miles (15 minutes) south of the Central Business District. Dallas Executive Airport is a general aviation reliever airport positioned on 1,040 acres, which features two runways: a 3,800-foot north-south runway and a 6,452-foot northwest-southeast runway. Existing air traffic control facilities allow Dallas Executive Airport to accept a wide range of corporate and private aircraft, including jets. Additionally there are 322,000 square feet of hangar space, 47,000 square feet of office/shop space and surface parking for approximately 305 vehicles. In 1994 the Dallas Heliport/Vertiport (Heliport) began service as the world’s largest elevated facility built solely for the use of rotor and tilt-rotor aircraft. As a public use facility located immediately adjacent to the downtown Dallas Convention Center, the Heliport is easily accessible from all major population and industrial centers within the Metroplex. The flight deck covers approximately four acres and houses two lighted flight approach and take-off pads that can be converted to a rollway/runway for future tilt-rotor operations. Additional amenities include a passenger loading area, a terminal building housing a separate waiting facility, a conference room, pilot lounge, and an elevator that leads to a secured dedicated vehicle parking lot. The Heliport has hosted six international helicopter conventions accommodating as many as 100 aircrafts at one time. AIRPORT SYSTEM MANAGEMENT A Department Director administers the operations of the Airport System. There are two Assistant Director positions. Primary functions include budget, finance, human resources, information systems, operations, building maintenance, field maintenance, procurement, environmental compliance, planning and engineering, property management, and public information. The Airport System currently has approximately 250 employees. Mark Duebner, Director of Aviation. Mr. Duebner is responsible for management and oversight of Dallas Love Field, Dallas Executive Airport and the City’s Heliport. Previously Mr. Duebner was Executive General Manager for the Dallas Police Department, serving as the top civilian commander. His primary goal is to coordinate the City’s efforts and gain cooperation from other private and public organizations to overcome the challenges associated with difficult projects. Mr. Duebner has also served as Director of Business Development and Procurement Services, directly responsible for the management and procurement of over $200 million in goods and services for the City. While at the City Mr. Duebner has held positions in Public Works and Transportation, Streets, and the City Manager’s Office. Mr. Duebner has also served on the City Manager’s “Efficiency Team” identifying several million dollars in savings for Dallas through process evaluation and redesign. His main areas of expertise are finance, land use, real estate development, electronic government applications, and customer service delivery. Mr.

22
Duebner holds a Bachelor’s Degree in Philosophy from The University of Texas at Austin, and a Master’s Degree in Public Administration from the University of North Texas. He also served in the financial services industry before making the switch to public sector management. Lana Furra, Assistant Director, Capital Development and Planning. Ms. Furra is responsible for identifying, prioritizing and assigning funds to all capital projects within the Airport System. Her primary role is to develop and direct policies, procedures and processes for the design and implementation of capital improvement projects. Ms. Furra oversees small and large, multi-faceted construction projects, from initial planning and scoping through final construction. Ms. Furra directs all activities with new and existing airport capital expansion projects. Ms. Furra has been with the City for over 20 years in various positions with the Department of Aviation. Ms. Furra has former experience from Tampa International Airport and Fort Lauderdale Executive Airport. Ms. Furra has a Bachelor of Science in Aviation Business and Planning from Embry-Riddle Aeronautical University. Ms. Furra is Certified Member of American Association of Airport Executives and an active member of Airport Council International. Ms. Furra is also the Vice Chair of the Aviation Transportation Technical Advisory Committee for the North Central Texas Council of Government. Lynetta M. Kidd, Assistant Director, Facilities, Finance & Administration. Ms. Kidd is responsible for airport administration including financial accounting, customer service and airport communication, facilities maintenance, parking and ground transportation and airport concessions. Ms. Kidd has been with the City since 1996 serving in various capacities in Aviation, City Manager’s Office, Development Services, Code Compliance and Equipment and Building Services. Prior to joining the City’s Aviation Department in September 2014, her most recent positions were Assistant Director of Equipment and Building Services and Assistant Director of Code Compliance. Ms. Kidd has a Bachelor of Arts degree from The University of Texas at Austin and a Master of Public Administration degree from The University of Texas at Arlington.
Terry Mitchell, Assistant Director of Aviation. Mr. Mitchell is responsible for overseeing all security and operations in the Airport System. He has been an employee of the City for 22 years and previously served as Operations Manager for Love Field from 1984 to 1999. He was responsible for the management of all operational and security matters at the airport and the Noise Control Program. Mr. Mitchell served in the field of air traffic control in both a regular and reserve capacity in the United State Navy from 1972 until 1984. Mr. Mitchell has an Associate of Science Degree in Air Traffic Management from Mt. San Antonio College in Walnut, California, a Bachelor of Science Degree from California State Polytechnic University, Pomona, California and a Master of Science Degree in Business Management from Webster University in St. Louis, MO. Due to the fact that Dallas Fort Worth International Airport is a Large Hub Primary Airport with 165 passenger gates offering service to both domestic and international destinations and Love Field is a Medium Hub Primary Airport that is restricted by the provisions in the Wright Amendment Reform Act of 2006 (P.L. 109-352) to providing only domestic commercial travel from a maximum of 20 passenger gates; competition between the two airports is minimal. OPERATIONS The following table depicts the total enplaned domestic passengers at Love Field through March 2015, beginning with the fiscal year ended September 30, 2005. TABLE 1 – LOVE FIELD TOTAL ENPLANED PASSENGERS
For Fiscal Years Ended September 30
Fiscal Year Southwest Continental American AA Eagle Trans States Delta Seaport United Skywest Virgin TOTAL
2005 2,863,010 113,452 - - - - - - - - 2,976,462 2006 2,948,678 156,108 95,576 44,012 - - - - - - 3,244,374 2007 3,606,129 151,160 47,807 80,361 25,090 - - - - - 3,910,547 2008 3,853,325 135,146 - 79,797 - - - - - - 4,068,268 2009 3,722,812 102,828 - 36,385 - 9,662 - - - - 3,871,687 2010 3,823,138 90,891 - - - 35,093 - - - - 3,949,122 2011 3,916,851 61,632 - - - 38,365 552 273 - - 4,017,673 2012 3,973,171 11,367 - - - 29,442 2,839 37,980 19,368 - 4,074,167 2013 4,052,521 - - - - 55,725 3,064 49,515 43,826 - 4,204,651 2014 4,206,949 - - - - 66,005 2,103 70,774 12,055 - 4,357,886
Oct 2013 - Mar 2014 2,035,493 - - - - 29,702 943 30,168 9,876 - 2,106,182 Oct 2014 - Mar 2015 2,687,003 - - - - 64,526 1,255 39,437 251 165,133 2,957,605
Source: Airport records.
[THE REMAINDER OF THIS PAGE INTENTIONALLY LEFT BLANK]

23
The following table depicts landed weights by airline at Love Field through March 2015, beginning with the fiscal year ended September 30, 2012. TABLE 2 – LOVE FIELD LANDED WEIGHT BY AIRLINE
Fiscal Years Ended September 30
FY 2012 FY 2013 FY 2014Oct-Mar
2014Oct-Mar
2015 FY 2012 FY 2013 FY 2014Oct-Mar
2014Oct-Mar
2015Mainline
Southwest 5,062,670 5,051,308 4,993,832 2,482,608 3,068,672 96.7% 95.5% 95.9% 96.0% 88.2%Delta 68,640 2.0%Virgin America 262,452 7.7%
Subtotal 5,062,670 5,051,308 4,993,832 2,482,608 3,399,764 96.7% 95.5% 95.9% 96.0% 97.7%
RegionalUnited 76,411 112,853 85,287 41,640 42,915 1.5% 2.1% 1.6% 1.6% 1.2%Delta 43,146 74,213 71,863 34,404 8,992 0.8% 1.4% 1.4% 1.3% 0.3%SeaPort 9,172 8,624 4,454 2,397 n.a. 0.2% 0.2% 0.1% 0.1% n.a.
Subtotal 128,729 195,690 161,605 78,441 51,908 2.5% 3.7% 3.1% 3.0% 1.5%
Nonscheduled/Cargo 42,093 42,378 49,765 25,876 26,962 0.8% 0.8% 1.0% 1.0% 0.8%
Total 5,233,492 5,289,375 5,205,202 2,586,926 3,478,634 100.0% 100.0% 100.0% 100.0% 100.0%
Annual Change 0.7% 1.1% -1.6% 0.1% 34.5%
Landed Weight (in Thousand Pounds) Market Share
Airline
n.a. – Not Available. Source: Airport records. The following table depicts historical airline landings at Love Field through March 2015, beginning with the fiscal year ended September 30, 2012. TABLE 3 – LOVE FIELD HISTORICAL AIRLINE LANDINGS
Fiscal Years Ended September 30
FY 2012 FY 2013 FY 2014Oct-Mar
2014Oct-Mar
2015 FY 2012 FY 2013 FY 2014Oct-Mar
2014Oct-Mar
2015Mainline
Southwest 42,075 42,428 41,410 20,587 24,931 90.4% 88.1% 88.9% 87.0% 84.6%Delta 624 2.1%Virgin America 1,887 6.4%
Subtotal 42,075 42,428 41,410 20,587 27,442 90.4% 88.1% 88.9% 87.0% 93.2%
RegionalUnited 1,667 2,281 1,997 962 1,006 3.6% 4.7% 4.3% 4.1% 3.4%Delta 918 1,579 1,529 732 154 2.0% 3.3% 3.3% 3.1% 0.5%SeaPort 929 886 507 793 278 2.0% 1.8% 1.1% 3.4% 0.9%
Subtotal 3,514 4,746 4,033 2,487 1,438 7.6% 9.9% 8.7% 10.5% 4.9%
Nonscheduled/Cargo 954 978 1,135 584 573 2.0% 2.0% 2.4% 2.5% 1.9%
Total 46,543 48,152 46,578 23,658 29,453 100.0% 100.0% 100.0% 100.0% 100.0%
Annual Change 1.8% 3.5% -3.3% 0.5% 24.5%
Landings Market Share
Airline
Source: Airport records.

24
As of the date of the Official Statement, the airlines shown in the following table provide commercial air service at Love Field. TABLE 4 – LIST OF AIRLINES WITH SCHEDULED SERVICE AT LOVE FIELD
Mainline RegionalSouthwest AirlinesVirgin AmericaDelta Air Lines
SeaPort Airlines
Source: Airport records. Source: OAG Schedules Analyzer. The following table depicts airline market shares at Love Field for the first half of fiscal year 2015, ended March 31, 2015, based on the number of enplanements. TABLE 5 – LOVE FIELD AIRLINE MARKET SHARES
Love Field Airlines Market Share
Southwest Airlines 91.00%
Virgin America 6.00%
Delta Air Lines 2.00%
SeaPort Airlines 0.04%
United & Continental (1) 1.00%
Source: Airport records. (1) Ceased operations at Love Field in March, 2015.
[THE REMAINDER OF THIS PAGE INTENTIONALLY LEFT BLANK]

25
For additional information about the Airport System and its operations see “Appendix B – THE REPORT OF THE AIRPORT CONSULTANT”. The following table depicts revenues and expenses of the Airport System for fiscal years 2010 through 2014. TABLE 6 – COMPARATIVE STATEMENTS OF REVENUE, EXPENSES AND CHANGES IN AIRPORT REVENUES FUND NET ASSETS/POSITION
Operating revenues 2010 2011 2012 2013 2014
Customer Charges 59,229$ (1) 47,578$ 48,399$ (1) 54,768$ 67,883$
Intergovernmental 623 696 606 530 538
Other Receipts 454 1 753 653 6
Total operating revenues 60,306 48,275 49,758 55,951 68,427
Operating expenditures
Personnel Services 10,277 9,848 10,219 12,405 12,265
Supplies and Materials 3,840 4,274 5,001 5,650 5,911
Contractual and Other Services 15,994 20,923 40,281 26,436 28,739
Depreciation 12,587 17,098 16,486 19,803 24,176
Total operating expenditures 42,698 52,143 71,987 64,294 71,091
Operating income (loss) 17,608 (3,868) (22,229) (8,343) (2,664)
Nonoperating revenues
Investment income 554 730 567 433 290
Passenger facility charges - 16,878 15,653 15,785 16,543
Interest on bonds and notes (1,072) (11,066) (7,203) (13,222) (20,721)
Net gain (loss) on property disposals 10 3 - - 5
Total nonoperating revenues (expenses) (508) 6,545 9,017 2,996 (3,883)
Income (loss) before transfers and 17,100 2,677 (13,212) (5,347) (6,547)
contributions
Capital contributions 20,174 25,714 16,224 42,566 12,319
Transfers in/out (4) (182) (887) (831) (232)
Special item: Loss on impairment airport property - - - (22,066) (6,372)
20,170 25,532 15,337 19,669 5,715
Change in net assets/position 37,270 28,209 2,125 14,322 (832)
Net assets/position, beginning of year 470,736 508,006 536,205 (2) 538,330 552,652
Net assets/position, end of year 508,006$ 536,215$ 538,330$ 552,652$ 551,820$
Fiscal Year Ended September 30,
(1) Includes Passenger Facility Charges which were subsequently classified as nonoperating revenue. (2) Beginning Net Position was restated due to the implementation of GASB statements 63 and 65. Implementation of these statements also resulted in a change in terminology from Net Assets to Net Position.
[THE REMAINDER OF THIS PAGE INTENTIONALLY LEFT BLANK]

26
The following table depicts operating revenues of the Airport System for the fiscal years 2010 through 2014. TABLE 7 – AIRPORT SYSTEM OPERATING REVENUE DETAIL BY FISCAL YEAR
2010(3)
Actual2011
Actual2012
Actual2013
Actual2014*Actual
Airline Operating Revenue:Landing Fees 6,495$ 8,356$ 7,869$ 9,156$ 12,732$
Terminal Rental & Other Fees(1) 12,431 10,146 11,374 15,102 20,392 Total Airline Revenue 18,926$ 18,502$ 19,243$ 24,258$ 33,124$
Non-Airline Operating Revenue:Other Concessions and Parking 24,355 27,446 27,778 29,024 32,057
Miscellaneous Fees(2) 3,123 2,327 2,737 2,669 3,246 Total Non-Airline Revenue 27,478$ 29,773$ 30,515$ 31,693$ 35,303$
TOTAL OPERATING REVENUE 46,404$ 48,275$ 49,758$ 55,951$ 68,427$
Fiscal Year Ended September 30,(in thousands)
* Unaudited Airport System financial statement. (1) Includes Rental Fees and Other from Basic Financial Statements: Statement of Revenue, Expenses, and Changes in Fund Net Assets (2) Includes Intergovernmental, Fuel flow fees, and Charges for services from Basic Financial Statements: Statement of Revenue, Expenses, and Changes in Fund Net Assets/Position. (3) Fiscal Year 2010 was reclassified to conform with later Revenue reports.
PASSENGER FACILITY CHARGES Pursuant to the Aviation Safety and Capacity Act of 1990, as modified by the Wendell H. Ford Aviation Investment and Reform Act for the 21st Century (referred to collectively herein as the “PFC Act”), the FAA may authorize a public agency to impose a passenger facilities charge (“PFC”) of up to $4.50 on each passenger enplaned at any commercial service airport controlled by the public agency, subject to certain limitations. The City collects PFCs at both $3.00 and $4.50 on passengers enplaned at Love Field. The City has the approval from FAA to impose a PFC per eligible enplaned passenger at Love Field, and has been imposing the PFC since February 1, 2008. Since the PFC has been imposed at Love Field, through September 30, 2014, cumulative PFC revenues, including investment earnings, totaled $95,161,293 (unaudited information). Under FAA approvals received to date, the City is authorized to impose the PFC through November 1, 2025. The City has applied PFCs toward improvement costs at Love Field, including in connection with the terminal modernization and expansion project that was the principal component of the Love Field Modernization Program. Below is a table showing the City’s cumulative PFC revenues, including investment earnings, for the fiscal years ended September 30 in the years 2008 through 2014.
Cumulative PFC Revenues (Including Investment Earnings) by Fiscal Year
Fiscal Year Gross Revenues*2008 6,782,723$ 2009 15,794,731 2010 29,794,231 2011 46,805,621 2012 62,614,495 2013 78,543,354 2014 95,161,293
*Unaudited.
The proceeds of the PFCs are not part of the Net Revenues the City is obligated to make available to the Corporation under the terms of the Project Financing Agreement.

27
CERTAIN INVESTMENT CONSIDERATIONS GENERAL The Bonds are special and limited obligations of the Corporation payable solely from Pledged Revenues, which include Net Revenues from the operation of the Airport System payable by the City to the Corporation under the Project Financing Agreement. The following is a discussion of certain investor considerations that should be considered in evaluating an investment in the Bonds. This discussion does not purport to be either comprehensive or definitive. Any one or more of the risks and other considerations discussed below, or any others, could lead to a decrease in the market value and/or marketability or liquidity of the Bonds and no assurance can be given that other risk factors and investment considerations will not become material in the future. The order in which risks are presented is not intended to reflect either the likelihood that a particular event will occur or the relative significance of such an event. Many of the risks, most of which are outside the Corporation's and the City's control, are discussed in detail in the “REPORT OF THE AIRPORT CONSULTANT" in Appendix B. Moreover, there are other risks associated with an investment in the Bonds in addition to those set forth herein. Further, the financial forecasts in this Official Statement are based generally upon certain assumptions and projections as to estimated revenues and operating expenses. See "REPORT OF THE AIRPORT CONSULTANT" in Appendix B. Inevitably, some underlying assumptions and projections used to develop the forecasts will not be realized, and unanticipated events and circumstances may occur. Therefore, the actual results achieved during the forecast periods will vary from the forecasts, and such differences may be adverse and material.
LOVE FIELD The Airport is a medium hub airport serving the Dallas metropolitan region and the Dallas-Fort Worth metroplex. Love Field, which encompasses approximately 1,300 acres, is located within the Dallas city limits, approximately seven miles north of the City’s Central Business District. Love Field is owned and operated by the City. Southwest Airlines Co. (“Southwest”) is the dominant airline operating at Love Field and is headquartered adjacent to Love Field. Southwest has operated at Love Field since Southwest began passenger service in 1971. Currently, four commercial air carriers, including Southwest, fly out of Love Field (see "DESCRIPTION OF THE AIRPORT SYSTEM AND OPERATIONS – Table 4"). The financial strength and stability of Southwest and the other airlines serving Love Field are key determinants of future airline traffic at Love Field. Also, Love Field competes regionally with DFW airport. Changes to air service at DFW airport could adversely affect traffic at Love Field.
SOUTHWEST AIRLINES Southwest is the largest single airline at Love Field, which is a principal station in the route system of Southwest (See “DESCRIPTION OF THE AIRPORT SYSTEM AND OPERATIONS – Table 5”). In FY 2014, Southwest accounted for 96.5 percent of total enplaned passengers at Love Field. Since Southwest accounts for such a large percentage of traffic at Love Field, the financial condition, operations, and business plans of Southwest necessarily have implications for Love Field. As a result, any adverse effect to Southwest’s financial condition, operations, and/or business plans could have a material adverse effect on revenues generated at Love Field. Southwest has proven itself to be among the strongest U.S. airlines. It has grown from a small Texas regional carrier operating its first flights out of Love Field in June 1971 to become one of the largest domestic air carriers in the country.
With more than 47,000 employees, Southwest operates more than 3,600 flights a day, serving 94 destinations across the United States and six other countries. Southwest has been adding nonstop service from Love Field to various domestic destinations since October 2014, when the Wright Amendment restriction on nonstop service at Love Field was lifted. Through all the economic uncertainties since 2008, Southwest has been cautious in adding to its fleet. To remain profitable, it has been reallocating capacity and moving flights to airports where it can earn greater profits. So while Southwest has been expanding service at Love Field, it has been cutting service elsewhere.
See "THE REPORT OF THE AIRPORT CONSULTANT” in Appendix B, particularly subsection III.D, and “THE AIRLINES AND THE AIRLINE
INDUSTRY” in this Official Statement for additional information.
COMPETITION FROM DFW AIRPORT Love Field and DFW airport both serve the Dallas-Fort Worth metroplex. DFW is the larger airport with far more airlines providing more flights to more destinations, although Love Field has the advantages of being closer to downtown Dallas and having significantly lower airfares. The two airports have coexisted for decades and have complemented each other in providing a full array of choices in air service. Still, significant changes to air service at DFW airport could adversely affect traffic at Love Field.
THE WRIGHT AMENDMENT From 1979 to 2006, domestic air service at Love Field was restricted by a federal law commonly referred to as the “Wright Amendment.” The Wright Amendment limited nonstop airline service at Love Field to other destinations within Texas and a limited number of neighboring states. The Wright Amendment also prohibited the purchase of a single airline ticket from Love Field to any destination not in Texas or the neighboring states. A person could change planes in a permitted destination, but he or she had to purchase a separate ticket from that destination to his or her final destination.
28
On July 11, 2006, the City, the City of Fort Worth, The Dallas-Fort Worth International Airport Board, Southwest and American Airlines, Inc. entered into an agreement called the “Five Party Agreement,” which stipulated, among other things, that the parties agreed to seek to eliminate the Wright Amendment restrictions on domestic air service at Love Field. On October 13, 2006, the “Wright Amendment Reform Act of 2006” was signed into law. It immediately eliminated the restriction on “through ticketing” between Love Field and cities outside the neighboring states, enabling passengers to purchase a single ticket for one-stop or connecting flights. It also eliminated the Wright Amendment restrictions on non-stop domestic air service at Love Field effective October 13, 2014. As of May 2015, Love Field has nonstop service to 44 destinations, 30 of which would not have been allowed under the restrictions that had been in effect under the Wright Amendment. While the elimination of the Wright Amendment restrictions have resulted in an increase in non-stop service at Love Field, the Corporation and the City cannot predict the impact that any future legislation might have on Airport System Operations. Moreover, no assurance can be given that revenues at Love Field, despite recent trends or a demonstrated level of service, will continue to increase or that current traffic levels will continue.
THE LOVE FIELD MODERNIZATION PROGRAM AND ACCESS TO THE CREDIT MARKETS In the Five Party Agreement, the City and Southwest agreed to the significant redevelopment of portions of Love Field, including the modernization of the existing terminal facilities at Love Field, a program referred to as the Love Field Modernization Program. The modernization program is expected to be financed through multiple bond issuances and consists of the phased demolition of the then-existing terminal concourses, the phased construction of a new 20-gate terminal concourse, the redevelopment of ticketing and baggage handling facilities, and the main ticket lobby and other related infrastructure improvements, including the Project. Construction of the improvements to the terminal concourse commenced in July 2009, with the first twelve gates in the terminal concourse commencing operations in April 2013 and the remaining eight gates commencing operations in October 2014. Upon completion of the terminal improvements, a substantial portion of the Love Field Modernization Program has been completed.
The Corporation's future capital plans include raising additional funds through bond financings for construction of the Project, which is a component of the Love Field Modernization Program. Other than enabling the parking garage, there are no further projects within the Love Field Modernization Program’s scope. The credit markets experience substantial disruption from time to time. There can be no assurance as to the timing of any disruption or the extent of any recovery that may be made by the credit markets. If the Corporation is unable to access the credit markets as a result of any such disruption, it is likely to have to delay the completion of certain projects until such time as the capital markets rebound. The effect of such delays could result in increased costs for such projects and a delay in the receipt of revenues for such projects.
GENERAL FACTORS AFFECTING AIR CARRIER REVENUES The revenues of both Love Field and the airlines serving Love Field may be materially affected by many factors including, without limitation, the following: national economic conditions; declining demand; service and cost competition; the availability of alternatives to air travel, such as video conferencing or new train or bus routes; mergers; the availability and cost of fuel and other necessary supplies; high fixed costs; high capital requirements; the cost and availability of financing; technological changes; national and international disasters and hostilities; the cost and availability of employees; strikes and other employee disruptions; the maintenance and replacement requirements of aircraft; the availability of routes and slots at various airports; litigation liability; regulation by the federal government; environmental risks and regulations; public health risks affecting travel; noise abatement concerns and regulation; deregulation; federal and state bankruptcy and insolvency laws; and other risks. Many of these factors, most of which are outside of the Corporation’s and the City's control, are discussed in detail in “THE REPORT OF THE AIRPORT CONSULTANT” in Appendix B.
In particular, national economic conditions influence aviation activity at the Airport System. Economic expansion increases income, boosts consumer confidence, stimulates business activity, and increases demand. In contrast, an economic recession reduces income, diminishes consumer confidence, dampens business activity, and weakens demand. Many airlines, as a result of these and other factors, have operated at a loss in the past and several have filed for bankruptcy, ceased operations and/or have merged with other airlines. Although the national economy has improved, the recent domestic financial crisis has had, and may continue to have, negative repercussions upon the national economy, including a scarcity of credit, lack of confidence in the financial sector, extreme volatility in the financial markets, fluctuations in interest rates, reduced business activity, increased unemployment, increased consumer bankruptcies and increased business failures and bankruptcies.
In Texas the effect of falling oil prices on the state economy could influence aviation activity at the Airport. Although falling oil prices are advantageous to the operating costs of the airlines, Texas’ oil companies have already started cutting capital budgets and laying off workers. Although the Texas economy is now more diverse than it was in the 1980s and is expected to continue growing, the outlook could change if oil prices continue to fall deeper and for much longer. Decreases in aviation activity and enplaned passenger traffic at Love Field will result in reduced Net Revenues.
See "THE REPORT OF THE AIRPORT CONSULTANT” in Appendix B, particularly subsection III.D., for additional information.
GENERAL FACTORS AFFECTING AIRLINE ACTIVITY Airports benefit from stable or growing air service when airlines are profitable. They risk losing service when airlines suffer financial hardship. The price of jet fuel affects airlines’ financial health. The possibility for increases in fuel costs could escalate for a number of reasons, including if oil-producing countries are impacted by hostilities or choose to reduce output, which could also impact fuel availability. Until recently, rising fuel prices increased airline costs dramatically and contributed to significant industry losses.

29
There are numerous other factors that affect air traffic generally and the financial health of airlines. Demand for air travel is influenced by factors such as population, levels of disposable income, the nature, level and concentration of industrial and commercial activity in the service area and the price of air travel. The price of air travel is, in turn, affected by the number of airlines serving a particular airport and a particular destination, the financial condition, cost structure and strategies of the airlines serving an airport, the willingness of competing airlines to enter into an airport market, the cost of operating at an airport and operating constraints (due to capacity, environmental concerns or other related factors) limiting the frequency or timing of airport traffic within the national system or at a particular airport.
UNCERTAINTIES OF THE AIRLINE INDUSTRY Since the economic deregulation of the airline industry in 1978, the industry has undergone significant changes including the number of airline mergers, acquisitions, bankruptcies and closures. In addition, the financial results of the airline industry have been subject to substantial volatility since deregulation. The airline industry is highly competitive and susceptible to price discounting. Carriers have used discount fares to stimulate traffic during periods of slack demand, to generate cash flow and to increase market share. Airline profit levels are highly sensitive to changes in fuel costs, fare levels and passenger demand. Passenger demand and fare levels have in the past been influenced by, among other things, the general state of the economy (both internationally and domestically), international events, airline capacity and pricing actions taken by carriers. Further bankruptcy filings and major restructurings by airlines are still possible.
In recent years, the major U.S. airlines have sought to form marketing alliances with other U.S. and foreign air carriers. Such alliances generally provide for “code-sharing,” frequent flyer reciprocity, coordinated scheduling of flights of each alliance member to permit convenient connections and other joint marketing activities. Such arrangements permit an airline to market flights operated by other alliance members as its own. This increases the destinations, connections and frequencies offered by the airline, which provide an opportunity to increase traffic on such airline’s segment of flights connecting with alliance partners.
The financial strength and stability of Southwest and the other airlines serving Love Field are key determinants of future airline traffic at Love Field. In addition, individual decisions by Southwest and the other airlines regarding level of service at Love Field will affect total enplanements. No assurance can be given as to the levels of aviation activity that will be achieved by Love Field. There is no assurance that Love Field, despite a demonstrated level of airline service and operations over the years, will continue to maintain such levels in the future. The continued presence of Southwest and the other airlines serving Love Field, and the levels at which that service will be provided, are a function of a variety of factors. Future airline traffic of Love Field will be affected by, among other things, the growth or decline in the population and the economy of Love Field’s service region and by national and international economic conditions, federal regulatory actions, airline service, air fare levels and the operation of the air traffic control system.
See "THE REPORT OF THE AIRPORT CONSULTANT” in Appendix B, particularly subsection III.D. for additional information.
AIRLINE MERGERS In recent years, and particularly since its deregulation in 1978, the U.S. airline industry has undergone substantial consolidation, and it may in the future undergo additional consolidation. The most recent examples of large mergers include Delta and Northwest in 2009, United and Continental in 2010, Southwest and AirTran in 2011, and American and US Airways in 2013. Airline mergers affect service and traffic at airports when they consolidate facilities, optimize route networks, and route connecting traffic through other hubs. The impact on affected airports is often immediate. The impact can be significant or trivial, depending upon whether the merging airlines have a large market share at the airport, they serve the same markets, and they carry significant connecting traffic through the airport.
Southwest’s acquisition of AirTran Airways resulted in network changes and growth priorities that generally have benefitted Love Field. The Delta-Northwest and United-Continental mergers have had no significant effects because those airlines have had little activity at Love Field. The recent American-US Airways merger is not likely to affect Love Field directly. Neither airline operates at Love Field today, but American is the largest carrier at the DFW airport and competes in the same market with Southwest and other airlines at Love Field. See "THE REPORT OF THE AIRPORT CONSULTANT” in Appendix B.
EFFECT OF BANKRUPTCY ON AIRLINE LEASE AGREEMENTS In the event of bankruptcy proceedings involving one or more of the airlines operating at Love Field, the debtor or its bankruptcy trustee must determine within a time period determined by the court whether to assume or reject the applicable airline use and lease agreement or other lease agreements. In the event of assumption, the debtor would be required to cure any prior defaults and to provide adequate assurance of future performances under the relevant agreements. Rejection of a lease or executory contract by any of such airlines would give rise to an unsecured claim of the City for damages, the amount of which in the case of a lease is limited by the federal Bankruptcy Code.
NATIONAL SECURITY AND THREAT OF TERRORISM Even with tightened security, terrorism remains a serious threat to the aviation industry. The recurrence of terrorism incidents against either domestic or world aviation targets remains a risk to achieving forecast aviation activity at Love Field. The federal government controls aviation industry security requirements, which can significantly impact the economics of the industry. Security requirements due to unexpected events could increase costs directly and indirectly to the industry and could have an adverse effect on passenger demand. Stringent airport security screening and long waits at security screening lines discourage air travel particularly to destinations that can be reached by ground transportation within a reasonable amount of time. No assurance can be given that increased security precautions will be successful or that
30
increased security costs or uncertainty will not materially affect travel demand or profitability. Another terrorist attack or any other event that undermines confidence in the safety of air travel likely would have an immediate and material adverse effect on air travel demand.
THE AIRLINES AND THE AIRLINE INDUSTRY Certain of the certificated major domestic airlines (or their respective parent corporations), including Southwest, are subject to the information reporting requirements of the Securities Exchange Act of 1934, as amended, and thus must file reports and other information with the U.S. Securities and Exchange Commission (the “Commission”). Certain information, including financial information, as of particular dates, concerning the certificated major domestic airlines (or their respective parent corporations) is disclosed in such reports and statements filed with the Commission. Such reports and statements can be inspected and copied at the public reference facilities maintained by the Commission in Washington, D.C. and at the Commission’s regional offices around the country, which may be located by calling 1-800-SEC-0330. Copies of such reports and statements can be obtained from the Public Reference Section of the Commission at prescribed rates. The Commission also maintains a web site at http://www.sec.gov containing reports, proxy and information statements and other information regarding registrants that file electronically with the Commission. The Commission undertakes no responsibility for and makes no representations as to the accuracy or completeness of the content of such material. More information about Southwest, including quarterly and annual financial statements, can be found at the following website: http://southwest.investorroom.com. The City, the Corporation, the Corporation’s Financial Advisors and the Underwriters undertake no responsibility for and make no representations as to the accuracy or completeness of the content of any such material contained on the world wide web as described in the preceding sentences or elsewhere in this Official Statement, including but not limited to, updates of such information or links to other world wide web sites accessed through any such aforementioned web sites.
In addition, all major and certain other airlines are required to file periodic reports of financial and operating statistics with the United States Department of Transportation. Such reports can be obtained from the U.S. Department of Transportation at prescribed rates.
See "THE REPORT OF THE AIRPORT CONSULTANT” in Appendix B, particularly subsection III.D. for additional information.
LIMITED OBLIGATIONS Under the terms of the Project Financing Agreement between the City and the Corporation, the City has agreed to make available to the Corporation “Net Revenues” from the operation of the Airport System, in an amount sufficient to pay the principal of and interest on the Bonds. The Corporation has assigned its rights to the Project Financing Agreement and the Net Revenues to the Trustee under the terms of the Indenture (see “PROJECT FINANCING AGREEMENT”). The Bonds are not a general obligation of the City or the Corporation. The obligation of the City to make payments under the Project Financing Agreement is solely from the Net Revenues, and the City is not obligated to make payments under the Project Financing Agreement from monies raised or to be raised from taxation (see “THE BONDS – Security for the Bonds”).
ADDITIONAL PARITY BONDS The Corporation reserves the right to issue, for any lawful purpose one or more series of Additional Parity Bonds payable from and secured by a first lien on the Pledged Revenues, on a parity with the Bonds, and any previously issued Additional Parity Bonds, (see "THE BONDS – Additional Parity Bonds" herein.). Any schedule delays or cost increases could result in the need to issue more Additional Parity Bonds than is currently contemplated by the City.
REPORT OF THE AIRPORT CONSULTANT The revenue forecasts in the Report of the Airport Consultant are based upon certain assumptions set forth or incorporated therein. See "THE REPORT OF THE AIRPORT CONSULTANT” in Appendix B. The Report of the Airport Consultant is not a guarantee of any future events or trends and the forecasts therein are subject to future economic and social conditions and demographic developments that cannot be predicted with certainty. Further, the estimates and assumptions in the Report of the Airport Consultant are inherently subject to significant economic and competitive uncertainties and contingencies, many of which are beyond the control of the City and the Corporation. Neither the City, the Corporation, nor the Airport Consultant can be responsible if actual results differ from the forecasts. Failure to achieve or realize any of the assumptions listed in the Report of the Airport Consultant may have a materially adverse effect upon the Net Revenues actually realized. No representation is made or intended nor should any representation be inferred with respect to the likely existence of any particular set of facts or circumstances, and prospective purchasers of the Bonds are cautioned not to place undue reliance on the forecasts in the Report of the Airport Consultant or upon any other forecasts or projection.
PASSENGER FACILITY CHARGES The PFC Act provides that PFCs collected by the airlines constitute a trust fund held for the beneficial interest of the eligible agency (i.e., the City) imposing the PFCs, except for any handling fee (which currently is $0.11 per PFC) or retention of interest collected on unremitted proceeds. In addition, federal regulations require airlines to account for PFC collections separately and to disclose the existence and amount of funds regarded as trust funds in their respective financial statements. The airlines, however, are permitted to commingle PFC collections with other revenues, provided that they are not under bankruptcy protection. The bankruptcy courts have not fully addressed such trust arrangements. Therefore, the City cannot predict how a bankruptcy court might rule on this matter in the event of a bankruptcy filing by one or
31
more of the airlines operating at Love Field. The PFC Act requires an airline in bankruptcy protection to segregate PFC collections from all of its other revenues.
It is possible that the City could be held to be an unsecured creditor with respect to unremitted PFCs held by an airline that has filed for bankruptcy protection. Additionally, the City cannot predict whether an airline operating at Love Field that files for bankruptcy protection would have properly accounted for the PFCs owed to the City or whether the bankruptcy estate would have sufficient moneys to pay the City in full for PFCs owed by such airline. PFCs are not a component of the Net Revenues the City is obligated to make available to the Corporation under the terms of the Project Financing Agreement.
AIRPORT USE AND LEASE AGREEMENTS Pursuant to the terms of the Wright Amendment Reform Act of 2006, Pub. L. 109-352, 120 Stat. 2011 (October 13, 2006) (“WARA”), Love Field is limited to 20 passenger gates. Out of those 20 gates, Southwest Airlines Co. (“Southwest”) currently leases 16 gates directly from the City until 2028 and has subleased two gates at Love Field from United Airlines, Inc. (“United”) for the duration of United’s lease with the City (also until 2028). At one of its gates, Southwest has voluntarily agreed to share space with Delta Air Lines, Inc. (“Delta”) as an accommodated airline (which means an airline without a lease with the City that has sought gate space at Love Field under the City’s gate accommodation policy specified in the terms of the signatory airlines’ use and lease agreement). Virgin America Airlines, Inc. (“Virgin America”) uses two gates at Love Field that it subleases until 2028 from American Airlines, Inc. (“American”) because American was required to divest itself of those gate rights to satisfy objections raised by the United States Department of Justice to American’s merger with former US Airways in 2014. Virgin America is sharing one of these gates with Seaport Airlines, Inc. (“Seaport”) under a gate use license. As a result of the divestiture, American does not operate any gates at Love Field. Delta has requested accommodation for eight additional flights and American has requested accommodation for flights.
In a December 17, 2014 letter to the City, the United States Department of Transportation (“DOT”) opined that an accommodated airline must continue to be accommodated permanently as long as it continues its “pattern of service.” This position appears to conflict with the protection of preferential gate use rights at Love Field under leases that WARA explicitly protects. Delta, currently an accommodated airline, is seeking a permanent accommodation at Love Field in accordance with the DOT letter. In addition, Delta has requested accommodation for eight additional flights. American has also sought a permanent accommodation for four flights. American’s situation is atypical because it was forced to sublease its leased gates in connection with its merger but remains the gate lessee of record. It is unclear if it has any accommodation rights at Love Field as a “new entrant.”
The Airport and Use Lease Agreements give Southwest, United, and American preferential rights to use its gates and requires the City to mandate accommodation requests for gate use from new entrants to the airport but only to the extent that granting such request would not unduly interfere with a signatory airline flight schedule. In addition, if there is voluntary or mandatory gate accommodation but the signatory airline and the new entrant cannot agree on all necessary terms of gate use, the City must determine the missing terms. In response to the City’s request to DOT for clarification of its December 17, 2014 letter on how the City should reconcile the letter’s mandate with conflicting language in the City’s lease obligations, DOT, in a letter dated June 15, 2015, repeated its position that, under the provisions of federal statutes and regulations and under grant agreements and the airport competition plan signed by the City (the “Airport Competition Plan”), the City has an obligation to reasonably accommodate new entrants to Love Field for as long as such carriers maintain their pattern of service. However, in neither the December 17, 2014 letter nor the June 15, 2015 letter did DOT mention WARA or how WARA’s preferential gate protection provisions could be reconciled with DOT’s position on accommodation.
The City is aware that Southwest disagrees with the DOT position that an accommodated airline has the right to remain accommodated and continue to use the gates of the accommodating airlines as long as the accommodated airline continues its pattern of service. Southwest’s initial temporary agreement with Delta was to allow Delta to share gate space with Southwest until July 6, 2015. In February 2015, Southwest publicly announced an intention, as of July 2015, to fully use all 18 gates to which it currently has rights, for a total of 180 flights per day.
On February 13, 2015, Southwest filed a lawsuit against DOT in the U.S. Court of Appeals for the District of Columbia Circuit seeking a ruling that the positions expressed in the December 17, 2014 DOT letter were contrary to federal law, including WARA. The City is not a party to that proceeding. If Southwest is successful in such litigation, the two letters from DOT would not impose any legal obligations on Southwest or on the City, though DOT and Delta may still assert that the opinions and mandates expressed by the DOT letters are required by WARA and other federal laws as well as by the City’s other obligations.
After the City’s receipt of the June 15, 2015 DOT letter, and in an effort to resolve conflicting interpretations of the federal statutes and the disputes between the parties, the City initiated a lawsuit in the United States District Court for the Northern District of Texas (Case No. 3:15-cv-02069-K) seeking a declaratory judgment as to the rights of all parties to this controversy (the “Declaratory Judgment Suit”). Southwest, Delta, United, Seaport, Virgin America, American, DOT and the Federal Aviation Administration (“FAA”) are defendants in that lawsuit. Delta, Southwest and the City have filed applications for temporary injunctive relief. After a conference call initiated and conducted by the presiding judge, Southwest and Delta have agreed to extend the temporary accommodation for Delta’s current five flights at Southwest’s gate in order to allow time for the federal district court judge to rule on the request for preliminary injunction. During this period, Delta’s additional request for accommodation of eight more flights remains pending, as does the American request for permanent accommodation, in addition to all other issues in the lawsuit. The new temporary accommodation is expected to remain in place at least past Labor Day 2015, when the court is expected to hold a preliminary injunction hearing.

32
Pending the court’s ruling on the rights of the parties in dispute in the Declaratory Judgment Suit, the City does not expect to take any independent action if there are no further DOT or FAA directives. If the City were to take any action contrary to the DOT position, DOT or the FAA could make a finding that the City has acted in violation of the City’s Airport Competition Plan and its grant assurance obligations. Alternatively, DOT or FAA might issue a formal directive before the court rules that could require the City to take some action. DOT and FAA could, as a result of such finding or order, and after administrative proceedings, sanction the City by: (1) disallowing the City to charge future PFCs at Love Field; (2) requiring the City to repay certain federal grant funds that the City has received for Love Field improvements; and (3) requesting that the FAA make the City ineligible for federal grant funds and take other actions against the City. Under DOT policies, before any sanctions are imposed, the City would have the option of changing its position to come into compliance with DOT positions. Since the City does not plan to take any independent action pending the results of the lawsuit, and, if any actions were taken, the City would still retain the option to take remedial steps to avoid imposition of any sanction, the City Attorney’s Office and its external airport legal counsel believe that sanctions from DOT or the FAA are unlikely.
Since the signatory parties to the Airport Use and Lease Agreement are obligated to make rental payments to the City in accordance with the terms thereof, the City does not believe the collection of Net Revenues will be materially adversely affected by the litigation. Finally, since revenues generated through the collection of PFC revenues are not part of Net Revenues, any disallowance of the City’s ability to charge future PFC revenue would not have a material adverse impact on the amount of Net Revenues available to make payments on the Bonds.
LIMITATION AND ENFORCEABILITY OF REMEDIES The remedies available to owners of the Bonds upon an event of default under the Indenture are limited to the seeking of specific performance in a writ of mandamus or other suit, action or proceeding compelling and requiring the Corporation and its officers to observe and perform any covenant, condition or obligation prescribed in the Indenture (See “THE BONDS – Trustee Remedies”). In no event will owners have the right to have the maturity of the Bonds accelerated as a remedy in the event of a default by the Corporation. The enforcement of the remedy of mandamus may be difficult and time consuming. No assurance can be given that a mandamus or other legal action to enforce a default under the Indenture would be successful.
The remedies available under the Indenture are in many respects dependent upon regulatory and judicial actions that are often subject to discretion and delay. Under existing law, such remedies may not be readily available. In addition, enforcement of such remedies (i) may be subject to general principles of equity which may permit the exercise of judicial discretion, (ii) are subject to the exercise in the future by the State and its agencies and political subdivisions of the police power inherent in the sovereignty of the State, (iii) are subject, in part, to the provisions of the United States Bankruptcy Act and other applicable bankruptcy, insolvency, reorganization, moratorium or similar laws relating to or affecting the enforcement of creditors' rights generally, now or hereafter in effect, and (iv) are subject to the exercise by the United States of the powers delegated to it by the federal Constitution. The various legal opinions to be delivered concurrently with the delivery of the Bonds will be qualified to the extent that the enforceability of certain legal rights related to the Bonds is subject to limitations imposed by bankruptcy, reorganization, insolvency or other similar laws affecting the rights of creditors generally and by equitable remedies and proceedings generally. For additional information, see “THE BONDS – Owners’ Remedies”.
FORWARD-LOOKING STATEMENTS The statements contained in this Official Statement, and in other information provided by the City or the Corporation, that are not purely historical, are forward-looking statements, including statements regarding the City’s or the Corporation's expectations, hopes, intentions or strategies regarding the future and the projections in the Report of the Airport Consultant. All forward-looking statements included in this Official Statement are based on information available to the City and the Corporation on the date hereof, and the City and the Corporation assume no obligation to update any such forward-looking statements.
The forward-looking statements herein are necessarily based on various assumptions and estimates that are inherently subject to numerous risks and uncertainties, including risks and uncertainties relating to the possible invalidity of the underlying assumptions and estimates and possible changes or developments in social, economic, business, industry, market, legal and regulatory circumstances and conditions and actions taken or omitted to be taken by third parties, including customers, suppliers, business partners and competitors, and legislative, judicial and other governmental authorities and officials. Assumptions related to the foregoing involve judgments with respect to, among other things, future economic, competitive and market conditions and future business decisions, all of which are difficult or impossible to predict accurately and, therefore, there can be no assurance that the forward-looking statements included in this Official Statement will prove to be accurate.
[THE REMAINDER OF THIS PAGE INTENTIONALLY LEFT BLANK]

33
DEBT INFORMATION TABLE 8 – AIRPORT SYSTEM DEBT SERVICE REQUIREMENTS
(1)(3)
FYE The Bonds % of Principal
9/30 Principal Interest (2) Debt Service Retired
2015 -$ 1,107,522$ 1,107,522$ 2016 - 5,461,750 5,461,750 2017 - 5,461,750 5,461,750 2018 3,885,000 5,461,750 9,346,750 3.56%2019 4,075,000 5,267,500 9,342,500 2020 4,280,000 5,063,750 9,343,750 2021 4,495,000 4,849,750 9,344,750 2022 4,720,000 4,625,000 9,345,000 2023 4,955,000 4,389,000 9,344,000 24.18%2024 5,205,000 4,141,250 9,346,250 2025 5,465,000 3,881,000 9,346,000 2026 5,735,000 3,607,750 9,342,750 2027 6,025,000 3,321,000 9,346,000 2028 6,325,000 3,019,750 9,344,750 50.50%2029 6,640,000 2,703,500 9,343,500 2030 6,975,000 2,371,500 9,346,500 2031 7,320,000 2,022,750 9,342,750 2032 7,690,000 1,656,750 9,346,750 2033 8,070,000 1,272,250 9,342,250 84.09%2034 8,475,000 868,750 9,343,750 2035 8,900,000 445,000 9,345,000 100.00%
109,235,000$ 70,999,022$ 180,234,022$
(1) Numbers may not sum due to rounding. (2) The interest due and payable from issuance through November 1, 2017 will be paid from Bond proceeds representing capitalized interest. (3) Fiscal Year debt service includes debt service due on the following November 1 (e.g. Fiscal Year 2015 includes debt service due on November 1, 2015).
FUTURE BOND ISSUANCE Under the provisions of the Project Financing Agreement, the LFAMC has the authority to issue one or more future series of General Airport Revenue Bonds (referred to collectively as “Bonds” in the Project Financing Agreement) to finance improvements at Love Field, including specifically the Project. The Corporation anticipates issuing approximately $92,755,000 in aggregate principal amount of General Airport Revenue Bonds in December, 2016 to provide funds to complete the Project. It is anticipated that the requirements in clause (d) set forth in "THE BONDS – Additional Parity Bonds" will not apply to the anticipated 2016 bond issuance, since the sum of the principal amount of the Bonds and the anticipated 2016 bond issuance will not exceed $250,000,000 in principal amount.
[THE REMAINDER OF THIS PAGE INTENTIONALLY LEFT BLANK]

34
FINANCIAL INFORMATION
INVESTMENT POLICY The City invests its investable funds in investments authorized by the Public Funds Investment Act, Chapter 2256, Texas Government Code (the “PFIA”) and other applicable Texas law and in accordance with its Investment Policy. Both State law and the City’s Investment Policy are subject to change. The City Council last approved the Investment Policy on September 24, 2014. Funds of the Issuer will be invested in accordance with the City’s Investment Policy. Legal Investments ... Under Texas law, the City is authorized to invest in (1) obligations, including letters of credit, of the United States or its agencies and instrumentalities, (2) direct obligations of the State of Texas or its agencies and instrumentalities, (3) collateralized mortgage obligations directly issued by a federal agency or instrumentality of the United States, the underlying security for which is guaranteed by an agency or instrumentality of the United States, (4) other obligations, the principal and interest of which are unconditionally guaranteed or insured by, or backed by the full faith and credit of, the State of Texas or the United States or their respective agencies and instrumentalities, (5) obligations of states, agencies, counties, cities, and other political subdivisions of any state rated as to investment quality by a nationally recognized investment rating firm not less than “A” or its equivalent, (6) bonds issued, assumed, or guaranteed by the State of Israel, (7) certificates of deposit and share certificates (i) issued by a depository institution that has its main office or branch office in the State of Texas, that are guaranteed or insured by the Federal Deposit Insurance Corporation or the National Credit Union Share Insurance Fund, or are secured as to principal by obligations described in clauses (1) through (6) or in any other manner and amount provided by law for city deposits, or (ii) where (a) the funds are invested by the City through (i) a broker that has its main office or branch office in this state and is selected from a list adopted by the City; (ii) a depository institution that has a main office or branch office in this state and that is selected by the City; (b) the broker or depository institution selected by the City arranges for the deposit of funds in one or more federally insured depository institutions, wherever located; (c) the certificates of deposit are insured by the United States or an instrumentality of the United States; and (d) the City appoints the depository institution acts as a custodian for the City with respect to the certificates of deposit, and entity described by 2257.041(d) Government Code, or clearing broker-dealer registered with the Securities and Exchange Commission and operating pursuant to Securities and Exchange Commission Rule 15c3-3 (17 C.F.R., section 240.15c3-3); (8) fully collateralized repurchase agreements that have a defined termination date, are fully secured by obligations described in clause (1), and are placed through a primary government securities dealer or a financial institution doing business in the State of Texas, (9) bankers’ acceptances with a stated maturity of 270 days or less from the date of its issuance, if the short-term obligations of the accepting bank or its parent are rated at least “A-1” or “P-1” or the equivalent by at least one nationally recognized credit rating agency, (10) commercial paper that is rated at least “A-1” or “P-1” or the equivalent by either (a) two nationally recognized credit rating agencies or (b) one nationally recognized credit rating agency if the paper is fully secured by an irrevocable letter of credit issued by a U.S. or state bank, (11) no-load money market mutual funds registered with and regulated by the SEC that meet the requirements of the PFIA, and are rated not less than “Aaa” or its equivalent rating by at least one nationally recognized rating service, (12) no-load mutual funds registered with the SEC that have an average weighted maturity of less than two years, invest exclusively in obligations described in the preceding clauses, and are continuously rated as to investment quality by at least one nationally recognized investment rating firm of not less than “Aaa” or its equivalent, and (13) public funds investment pools that have an advisory board which includes participants in the pool and are continuously rated as to investment quality by at least one nationally recognized investment rating firm of not less than “Aaa” or its equivalent or no lower than investment grade. Texas law also permits the City to invest bond proceeds in a guaranteed investment contract, subject to limitations as set forth in the PFIA. A political subdivision such as the City may enter into securities lending programs if (i) the securities loaned under the program are 100% collateralized, a loan made under the program allows for termination at any time and a loan made under the program is either secured by (a) obligations that are described in clauses (1) through (6) above, (b) irrevocable letters of credit issued by a state or national bank that is continuously rated by a nationally recognized investment rating firm at not less than “A” or its equivalent or (c) cash invested in obligations described in clauses (1) through (6) above, clauses (10) through (12) above, or an authorized investment pool; (ii) securities held as collateral under a loan are pledged to the City, held in the City’s name and deposited at the time the investment is made with the City or a third party designated by the City; (iii) a loan made under the program through either a primary government securities dealer or a financial institution doing business in the State of Texas; and (iv) the agreement to lend securities has a term of one year or less. The PFIA specifically prohibits the City from investing in: (1) obligations whose payment represents the coupon payments on the outstanding principal balance of the underlying mortgage-backed security collateral and pays no principal; (2) obligations whose payment represents the principal stream of cash flow from the underlying mortgage-backed security collateral and bears no interest; (3) collateralized mortgage obligations that have a stated final maturity of greater than 10 years; and (4) collateralized mortgage obligations the interest rate of which is determined by an index that adjusts opposite to the changes in a market index. In addition, the City is prohibited from investing any portion of bond proceeds, reserves and funds held for debt service in no-load mutual funds. Additional Provisions ... Under Texas law, the City Council is required to designate one or more investment officers who are responsible for the investment of the City’s funds, under written investment policies that primarily emphasize safety of principal and liquidity; that address investment diversification, yield, maturity, and the quality and capability of investment management; and that include a list of authorized investments for City funds, maximum allowable stated maturity of any individual investment and the maximum average dollar-weighted maturity allowed for pooled fund groups. All City funds must be invested consistent with a formally adopted “Investment Strategy Statement” that specifically addresses each fund’s investment. Each Investment Strategy Statement will describe its objectives concerning: (1) suitability of
35
investment type, (2) preservation and safety of principal, (3) liquidity, (4) marketability of each investment, (5) diversification of the portfolio, and (6) yield. Under Texas law, City investments must be made “with judgment and care, under prevailing circumstances, that a person of prudence, discretion, and intelligence would exercise in the management of the person’s own affairs, not for speculation, but for investment, considering the probable safety of capital and the probable income to be derived.” At least quarterly, the investment officers of the City shall submit an investment report: (1) that describes in detail the investment position of the City, (2) that all investment officers jointly prepared and signed the report, (3) that contains a summary statement, which includes the beginning market value, the ending market value and fully accrued interest during the reporting period of each pooled fund group, (4) that states the book value and market value of each separately listed asset at the beginning and end of the reporting period, (5) that states the maturity date of each separately invested asset, (6) that states the account or fund or pooled fund group for which each individual investment was acquired, and (7) that states the compliance of the investment portfolio as it relates to: (a) adopted investment strategy statements and (b) State law. The investment officers responsible for the investment of City Funds must be designated by the City Council, and no person may invest City funds without express written authority from City Council. Under Texas law, the City additionally must: (1) annually review its adopted policies and strategies and adopt an ordinance or resolution stating that it has reviewed its investment policy and investment strategies and records any changes made to either its investment policy or investment strategy in the said ordinance or resolution; (2) require any investment officers with personal business relationships or relatives with firms seeking to sell securities to the entity to disclose the relationship and file a statement with the Texas Ethics Commission and the City Council; (3) adopt a rule, order, ordinance or resolution stating that it has reviewed its investment policy and investment strategies and records any changes made to either its investment policy or investment strategy in the respective rule, order, ordinance or resolution (4) require a qualified representative of firms seeking to sell securities to the City to: (a) receive and review the City’s investment policy, (b) acknowledge that reasonable controls and procedures have been implemented in an effort to preclude unauthorized investment activities, and (c) deliver a written statement attesting to these requirements; (5) perform an annual audit of the management controls on investments and adherence to the City’s investment policy; (6) provide specific investment training for the Treasurer, Chief Financial Officer and investment officers; (7) restrict reverse repurchase agreements to not more than 90 days and restrict the investment of reverse repurchase agreement funds to no greater than the term of the reverse repurchase agreement; (8) restrict the investment in non-money market mutual funds to no more than 15% of the entity’s monthly average fund balance, excluding bond proceeds and reserves and other funds held for debt service; (9) require local government investment pools to conform to the disclosure, rating, net asset value, yield calculation, and advisory board requirements of the PFIA; and (10) at least annually review, revise and adopt a list of qualified brokers that are authorized to engage in investment transactions with the City. Under Texas law, the City may contract with an investment management firm registered under the Investment Advisers Act of 1940 (15 U.S.C. Section 80b-1 et seq.) or with the State Securities Board to provide for the investment and management of its public funds or other funds under its control for a term up to two years, but the City retains ultimate responsibility as fiduciary of its assets. In order to renew or extend such a contract, the City must do so by order, ordinance, or resolution. City Investment Policy ... City policy requires investments in accordance with applicable Texas law, specifically the PFIA. The City’s Investment Policy does not permit the investment of City funds in all eligible investments permitted by Texas law. Of those eligible investments described above under “Legal Investments”, bankers’ acceptances, commercial paper, certain collateralized mortgage obligations, reverse repurchase agreements, no-load mutual funds, State of Israel bonds and guaranteed investment contracts are not authorized for investment purposes under the City’s Investment Policy. The City generally invests in obligations of the United States or its agencies and instrumentalities and in “Aaa”-rated no-load money market mutual funds and public funds investment pools. In addition to such limitations, the City’s Investment Policy permits the investment of bond funds (including debt service and reserve funds) in the manner permitted by the respective ordinances authorizing the issuance of bonds. Neither the PFIA nor the City’s Investment Policy govern the investment of pension and other deferred compensation funds, and those funds are not included in the investment totals below. Currently, there are no funds of the Issuer that are invested. TABLE 9 – CURRENT INVESTMENTS As of March 31, 2015, the following percentages by investment type applied to the City’s investable funds, which had an unaudited aggregate market value of $1,628,324,427. These amounts show the investments in the Airport Revenue Fund and all other City funds including its General Fund. Only amounts in the Airport Revenue Fund comprise Net Revenues which secure payment of the Bonds.
Market Value %
U.S. Agencies 1,360,304,427$ 83.54%
Money Market Mutual Funds and Pools 268,020,000 16.46%
36
TAX MATTERS OPINION On the date of initial delivery of the Bonds, Co-Bond Counsel will render their opinion that, in accordance with statutes, regulations, published rulings and court decisions existing on the date thereof (“Existing Law”), for federal income tax purposes, interest on the Bonds will be excludable from the gross income of the owners thereof, except for any owner who is treated pursuant to section 147(a) of the Code as a “substantial user” of the facilities financed with the proceeds of the Bonds or a “related person” to such user. Except as stated above, Co-Bond Counsel will express no opinions as to any other federal, state or local tax consequences of the purchase, ownership or disposition of the Bonds. See “APPENDIX G – FORM OF CO-BOND COUNSEL’S OPINION”. In rendering their opinion, Co-Bond Counsel will rely upon information furnished by the Issuer and the City, and particularly written representations of officers of the Issuer and the City with respect to certain material facts that are solely within their knowledge relating to the use and investment of the proceeds of the Bonds, the construction, use and management of the facilities to be financed with the proceeds of the Bonds and any election not to claim depreciation or investment tax credit in connection with the facilities to be financed with the proceeds of the Bonds. If the representations are determined to be inaccurate, or there is a failure to comply with the covenants or receive the allocation, then the interest on the Bonds could become includable in gross income retroactively to the date of issuance of the Bonds. The Code and the regulations promulgated thereunder contain a number of requirements that must be satisfied subsequent to the issuance of the Bonds in order for interest on the Bonds to be, and to remain, excludable from gross income for federal income tax purposes. Failure to comply with such requirements may cause interest on the Bonds to be included in gross income retroactively to the date of issuance of the Bonds. The opinion of Co-Bond Counsel is conditioned on compliance by the City with such requirements, and Co-Bond Counsel has not been retained to monitor compliance with these requirements subsequent to the issuance of the Bonds. Co-Bond Counsel’s opinion represents their legal judgment based upon their review of Existing Law and the reliance on the aforementioned information, representations and covenants. Co-Bond Counsel’s opinion is not a guarantee of a result. Existing Law is subject to change by the Congress and to subsequent judicial and administrative interpretation by the courts and the Department of the Treasury. There can be no assurance that Existing Law or the interpretation thereof will not be changed in a manner which would adversely affect the tax treatment of the purchase, ownership or disposition of the Bonds. A ruling was not sought from the Internal Revenue Service by the City with respect to the Bonds or the property financed or refinanced with proceeds of the Bonds. No assurances can be given as to whether the Internal Revenue Service will commence an audit of the Bonds, or as to whether the Internal Revenue Service would agree with the opinion of Co-Bond Counsel. If an Internal Revenue Service audit is commenced, under current procedures the Internal Revenue Service is likely to treat the Issuer as the taxpayer and the Bondholders may have no right to participate in such procedure. No additional interest will be paid upon any determination of taxability. FEDERAL INCOME TAX ACCOUNTING TREATMENT OF ORIGINAL ISSUE DISCOUNT The initial public offering price to be paid for one or more maturities of the Bonds may be less than the principal amount thereof or one or more periods for the payment of interest on the bonds may not be equal to the accrual period or be in excess of one year (the “Original Issue Discount Bonds”). In such event, the difference between (i) the “stated redemption price at maturity” of each Original Issue Discount Bond, and (ii) the initial offering price to the public of such Original Issue Discount Bond would constitute original issue discount. The “stated redemption price at maturity” means the sum of all payments to be made on the bonds less the amount of all periodic interest payments. Periodic interest payments are payments which are made during equal accrual periods (or during any unequal period if it is the initial or final period) and which are made during accrual periods which do not exceed one year. Under Existing Law, any U.S. Holder who has purchased a Bond as an Original Issue Discount Bond in the initial public offering is entitled to exclude from gross income (as defined in section 61 of the Code) an amount of income with respect to such Original Issue Discount Bond equal to that portion of the amount of such original issue discount allocable to the accrual period. For a discussion of certain collateral federal tax consequences, see discussion set forth below. In the event of the redemption, sale or other taxable disposition of such Original Issue Discount Bond prior to stated maturity, however, the amount realized by such U.S. Holder in excess of the basis of such Original Issue Discount Bond in the hands of such U.S. Holder (adjusted upward by the portion of the original issue discount allocable to the period for which such Original Issue Discount Bond was held by such initial owner) is includable in gross income. Under Existing Law, the original issue discount on each Original Issue Discount Bond is accrued daily to the stated maturity thereof (in amounts calculated as described below for each accrual period and ratably within each such accrual period) and the accrued amount is added to an initial owner's basis for such Original Issue Discount Bond for purposes of determining the amount of gain or loss recognized by such owner upon the redemption, sale or other disposition thereof. The amount to be added to basis for each accrual period is equal to (a) the sum of the issue price and the amount of original issue discount accrued in prior periods multiplied by the yield to stated maturity (determined on the basis of compounding at the close of each accrual period and properly adjusted for the length of the accrual period) less (b) the amounts payable as current interest during such accrual period on such Original Issue Discount Bond.

37
The federal income tax consequences of the purchase, ownership, redemption, sale or other disposition of Original Issue Discount Bonds which are not purchased in the initial offering at the initial offering price may be determined according to rules which differ from those described above. All owners of Original Issue Discount Bonds should consult their own tax advisors with respect to the determination for federal, state and local income tax purposes of the treatment of interest accrued upon redemption, sale or other disposition of such Original Issue Discount Bonds and with respect to the federal, state, local and foreign tax consequences of the purchase, ownership, redemption, sale or other disposition of such Original Issue Discount Bonds. COLLATERAL FEDERAL INCOME TAX CONSEQUENCES The following discussion is a summary of certain collateral federal income tax consequences resulting from the purchase, ownership or disposition of the Bonds. This discussion is based on Existing Law, which is subject to change or modification, retroactively. The following discussion is applicable to investors, other than those who are subject to special provisions of the Code, such as financial institutions, property and casualty insurance companies, life insurance companies, individual recipients of Social Security or Railroad Retirement benefits, individuals allowed an earned income credit, certain S corporations with accumulated earnings and profits and excess passive investment income, foreign corporations subject to the branch profits tax, taxpayers qualifying for the health insurance premium assistance credit, and taxpayers who may be deemed to have incurred or continued indebtedness to purchase tax-exempt obligations. THE DISCUSSION CONTAINED HEREIN MAY NOT BE EXHAUSTIVE. INVESTORS, INCLUDING THOSE WHO ARE SUBJECT TO SPECIAL PROVISIONS OF THE CODE, SHOULD CONSULT THEIR OWN TAX ADVISORS AS TO THE TAX TREATMENT WHICH MAY BE ANTICIPATED TO RESULT FROM THE PURCHASE, OWNERSHIP AND DISPOSITION OF TAX-EXEMPT OBLIGATIONS BEFORE DETERMINING WHETHER TO PURCHASE THE BONDS. Interest on the Bond is an item of tax preference, as defined in section 57(a)(5) of the Code, for purposes of determining the alternative minimum tax imposed on individuals and corporations by section 55 of the Code. Under section 6012 of the Code, holders of tax-exempt obligations, such as the Bonds, may be required to disclose interest received or accrued during each taxable year on their returns of federal income taxation. Section 1276 of the Code provides for ordinary income tax treatment of gain recognized upon the disposition of a tax-exempt obligation, such as the Bonds, if such obligation was acquired at a “market discount” and if the fixed maturity of such obligation is equal to, or exceeds, one year from the date of issue. Such treatment applies to “market discount bonds” to the extent such gain does not exceed the accrued market discount of such bonds; although for this purpose, a de minimis amount of market discount is ignored. A “market discount bond” is one which is acquired by the holder at a purchase price which is less than the stated redemption price at maturity or, in the case of a bond issued at an original issue discount, the “revised issue price” (i.e., the issue price plus accrued original issue discount). The “accrued market discount” is the amount which bears the same ratio to the market discount as the number of days during which the holder holds the obligation bears to the number of days between the acquisition date and the final maturity date. STATE AND LOCAL TAXES AND FOREIGN PERSONS Investors should consult their own tax advisors concerning the tax implications of the purchase, ownership or disposition of the Bonds under applicable state or local laws. Foreign investors should also consult their own tax advisors regarding the tax consequences unique to investors who are not United States persons. FUTURE AND PROPOSED LEGISLATION Tax legislation, administrative actions taken by tax authorities, or court decisions, whether at the federal or state level, may adversely affect the tax-exempt status of interest on the Bonds under federal or state law and could affect the market price or marketability of the Bonds. Any such proposal could limit the value of certain deductions and exclusions, including the exclusion for tax-exempt interest. The likelihood of any such proposal being enacted cannot be predicted. Prospective purchasers of the Bonds should consult their own tax advisors regarding the foregoing matters.
[THE REMAINDER OF THIS PAGE INTENTIONALLY LEFT BLANK]

38
OTHER INFORMATION RATINGS Moody's Investors Service, Inc. (“Moody's”), Standard & Poor's Ratings Services, a Standard & Poor’s Financial Services LLC business (“S&P”), and Fitch Inc. (“Fitch”, and together with Moody’s and S&P, the “Rating Agencies”), have assigned their municipal bond ratings of “A1”, “A”, and “A”, respectively, to the Bonds. An explanation of the significance of such ratings may be obtained from the Rating Agencies furnishing the rating. The ratings reflect only the respective views of the Rating Agencies and the Issuer makes no representation as to the appropriateness of the ratings. There is no assurance that such ratings will continue for any given period of time or that they will not be revised downward or withdrawn entirely by either or both of such rating companies, if in the judgment of either or both companies, circumstances so warrant. Any such downward revision or withdrawal of such ratings, or either of them, may have an adverse effect on the market price and marketability of the Bonds. LITIGATION The Issuer. To the knowledge of the Issuer, no action, suit or proceeding at law or in equity is pending against or affecting the Issuer, which would restrain or enjoin the issuance or sale of the Bonds or in any way contest the validity or affect the power of the Issuer with respect to the issuance and sale of the Bonds or the documents or instruments executed by the Issuer in connection therewith or the existence or power of the Issuer, nor to the knowledge of the Issuer, is there any basis therefor. The City. The City is a party to various lawsuits in the normal course of business. It is the opinion of the City Attorney and City Management that, except as described herein below, there is no pending litigation against the City that if decided adversely to the City, (i) would have a material adverse financial impact upon the City or its operations or (ii) would result in a judgment payable from Airport System revenues. The City is a defendant in six lawsuits, including two class actions, arising from City Ordinance No. 16084, adopted on January 22, 1979. All of the lawsuits allege that current and past police and fire pay schedules were adopted in violation of a referendum approved by the voters in 1979. All Plaintiffs claim that the City failed to maintain percentage pay differentials between grades in the sworn ranks as required by the referendum, and seek compensation for alleged underpayments of salaries and loss of value of retirement benefits. It is the City’s position that the 1979 referendum only mandated that pay raises be made in fiscal year 1978-1979 and that there was no continuing obligation of the City to maintain pay scale differentials, as alleged by the plaintiffs. The City has asserted its governmental immunity and various special exceptions and affirmative defenses, and disputes the Plaintiffs’ allegations in all of the lawsuits. The Plaintiffs in Albert, et al. v. City of Dallas (Cause No. 199-697-94) are 808 members of the Dallas Fire Department. The Plaintiffs in Arredondo, et al. v. City of Dallas (Cause No. 199-1743-99) are 16 members of the Dallas Fire Department who were originally plaintiffs in Albert but whose claims were severed in October 1999. The Plaintiffs in Barber, et al. v. City of Dallas (Cause No. 199-624-95) are 71 members of the Dallas Fire Department. The Plaintiffs in Willis, et al, v. City of Dallas (Cause No. 199-200-95) are 772 members of the Dallas Police Department. Parker et al. v. City of Dallas (Cause No. 1-95-107) is a class action lawsuit. The Parker Plaintiff class consists of all current, past or future members of the sworn ranks of the Dallas Police Department, as well as their spouses, heirs or estates. Martin, et al. v. City of Dallas (Cause No. 1-95-506) is the other class action lawsuit. The Martin Plaintiff class consists of current, past and future members of the sworn ranks of the Dallas Fire Department, as well as their spouses, heirs or estates. Both of the class action lawsuits have been certified. In addition, in September 1999, the Dallas Police and Fire Pension System intervened in the lawsuits seeking contributions from both its members (Plaintiffs) and the City of Dallas in the event of a final judgment awarding back pay to Plaintiffs. In the two class action lawsuits, Parker and Martin, the Plaintiffs have alleged damages of approximately $94,000,000. The amount of alleged damages has not been specified in the other lawsuits. The Plaintiffs also seek an award of attorney fees in an unspecified amount in connection with their breach of contract and declaratory relief claims. Although the City has stated that the total recovery in the cases could exceed $1 billion, any estimate of damage at this stage in the litigation is speculative. Unless the current Court of Appeals decision, as described below, is reversed, the City is not liable for back pay damages to the Plaintiffs and any damages would be significantly more limited. In August 1997, the trial court in Albert, the oldest of the cases, issued an order holding that the City had not maintained the percentage pay differentials between grades; however, the court also held that the remedy was within the City’s discretion and that salaries could be either raised or lowered to conform to the appropriate percentage differentials. The City adopted a resolution implementing a remedy which was submitted to the court for approval. In May 1999, the court determined that the City’s remedy was not adequate and, upon motion of 16 of the 824 Albert Plaintiffs, entered an Order Granting Partial Summary Judgment in favor of those 16 Plaintiffs, awarding damages of $1.7 million to the 16 Plaintiffs. Plaintiffs requested that the Court sever that portion of the case as to the 16 Plaintiffs and enter a final order in their favor. On October 20, 1999, the Court granted the Plaintiffs' motion for severance, making the Partial Summary Judgment final with respect to the 16 Plaintiffs, whose claims are now styled, Arredondo, et al v. City of Dallas (Cause No. 199-1743-99). On October 28, 1999, the 16 Plaintiffs appealed the Court's Final Summary Judgment order based on the measure of damages issue and on January 4, 2000, the City appealed the Final Summary Judgment as to both liability and damages issues. The Arredondo appeal (No. 05-99-01819-CV) was fully briefed and oral argument was held on November 28, 2000. On June 4, 2002, the Court of Appeals reversed the trial court’s judgment and remanded the case to the trial court, holding that the ordinance is patently ambiguous and that resolution of the ambiguity (regarding whether the word “maintain’ applies

39
only to the one-time raise provided in the ordinance or also to all future pay scales) would be a question for the finder of fact based on contemporaneous evidence of the voters’ intent in passing the referendum. The Arredondo plaintiffs filed a petition for review in the Texas Supreme Court. That petition was denied. On December 21, 2006, the Court of Appeals reversed the trial courts in all six cases and upheld the City’s governmental immunity from Plaintiffs’ breach-of-contract claims, including claims for declaratory relief to recover damages. However, the Court of Appeals affirmed the trial courts’ denial of the City’s pleas regarding the Plaintiffs’ claims for prospective declaratory relief, and found it appropriate to allow Plaintiffs the opportunity to argue to the trial court that the legislature has waived immunity from suit for breach of contract under Texas Local Government Code sections 271.151 to 271.160, which were enacted during the pendency of the appeals. In opinions on August 26, 2011, and December 16, 2011, the Texas Supreme Court reversed the court of appeals. The court held that the City has immunity from Plaintiffs’ requests for a declaratory judgment and that the adoption of an ordinance by referendum did not result in waiver or abrogation of the City’s immunity. The court remanded the cases to the trial court to consider whether, by adding sections 271.151 through 271.160 to the Texas Local Government Code, the legislature waived the City’s immunity. On remand in Albert, Arredondo, Barber, and Willis, the City filed pleas to the jurisdiction, asserting that Plaintiffs have not pleaded a written contract to invoke the waiver of the City’s governmental immunity in the Local Government Code. The district court denied the pleas, and the City filed interlocutory appeals to the court of appeals for review of whether the City’s immunity is waived under the Local Government Code. On August 13, 2013, the court of appeals reversed the denials in part and dismissed all Plaintiffs’ claims for declaratory relief and attorney fees, and affirmed the denials in part as to Plaintiffs’ breach-of-contract claims under section 271.152. The City filed a petition for review with the Texas Supreme Court, which remains pending. The court requested briefs on the merits. The City filed its principal brief on August 1, 2014. Plaintiffs filed their brief on the merits on October 22, 2014. The City’s reply brief was filed on January 7, 2015. The Texas Supreme Court denied the City’s petition for review on February 27, 2015. The City filed a motion for rehearing on April 15, 2015, and on May 26, 2015, the Court requested the Plaintiffs to file a response. The City is a defendant in two qui tam False Claims Act lawsuits, both styled United States ex rel. Lockey et al. v. City of Dallas, et al. The Dallas Housing Authority, Dallas County, and the Dallas County Housing Agency are also defendants. Curtis Lockey and Craig MacKenzie are the relators, claiming that each defendant falsely certified that it was affirmatively furthering fair housing when submitting applications for federal funds from the U.S. Department of Housing and Urban Development (HUD). Under their “false certification” legal theory, the relators contend that each defendant falsely obtained all HUD affordable housing funding received over the past six years. Thus, on behalf of the United States, relators claim that the City received more than $320 million based on the false claims and seek triple recovery of that sum and additional civil penalties against the City. They seek comparable dollar amounts based on the same formula from the other defendants. If the relators were to recover, the United States would receive the vast majority of the proceeds and the relators would receive the remainder. On February 3, 2010, the relators also filed a complaint with HUD that contains many of the same allegations that they have made in this lawsuit. In response to HUD’s inquiries, the City provided information to HUD in March and May 2010 and has not received any further communication from HUD. The first suit was originally filed under seal in February 2011. After receiving information from the City and the other defendants, the United States elected not to intervene. The court unsealed the case on November 14, 2011 and entered a partial scheduling order. Relators served the City on February 28, 2012. The City moved to dismiss for lack of jurisdiction because of prior litigation and administrative proceedings. On January 23, 2013, the district court granted the City’s motion to dismiss. Relators filed a notice of appeal. On December 5, 2013, Relators filed a motion in district court seeking an “indicative ruling” based on HUD’s November 22, 2013 letter of non-compliance. The district court denied the motion. Relators also appealed the denial of their “indicative” motion. The Fifth Circuit affirmed the trial court’s judgment on August 4, 2014, and issued the mandate on August 24, 2014. However, on October 3, 2014, Relator filed a motion to amend complaint or to file new action. On April 22, 2015, the Court denied the motion. On October 8, 2014, the Relators filed another lawsuit using a complaint identical to the one denied in their first lawsuit. The City has filed motions to dismiss this lawsuit. The City believes that the risk of liability is remote in this case. The City Attorney recently publicly reported to the City Council that Dallas Fire-Rescue (“DFR”) has misplaced approximately 14 laptops that may contain certain patient health information subject to privacy restrictions under the Health Insurance Portability and Accountability Act (“HIPAA”). Preliminary information has been conveyed to the U.S. Department of Health and Human Services (“HHS”) Office of Civil Rights (“OCR”), the agency that enforces HIPAA. By letter dated April 21, 2015, OCR notified DFR that it is investigating whether DFR is in compliance with the applicable federal standards for the protection of health information and the breach notification rule. OCR has requested DFR to respond to 13 requests for information. The City expects OCR to conduct a compliance review and investigation and anticipates that there may be regulatory enforcement action that could result in a fine being assessed against the City. Since the City entered into several contracts with third party vendors as part of its plan to comply with the regulations, the City is investigating whether it may have claims against those third party vendors and, if so, the amount of damages that may be recoverable to the City. If the City is fined by HHS, it is undetermined: (1) when the HHS determination as to the imposition of a fine against the City will be made; (2) whether the City would appeal the HHS determination; and (3) if, or when, the City would pay the fine amount. Based on the limited facts known to the City at this stage of the investigation, the City does not believe the amount of any fine would have a material adverse financial impact on the City or its operations.

40
For a description of the ongoing dispute between certain airlines involving the City’s Airport Use and Lease Agreement and the status of the City’s Declaratory Judgement Suit in connection therewith, please see “CERTAIN INVESTMENT CONSIDERATIONS – Airport Use and Lease Agreement.” CLEAN AIR ACT AMENDMENTS OF 1990 The United States Environmental Protection Agency (the “USEPA”) has established certain air quality standards for the North Texas Region consisting of Dallas, Collin, Denton and Tarrant counties (the “Region”). In 1993, the USEPA classified the Region as a non-attainment area under the USEPA’s one-hour ozone standard. In 1998, the USEPA downgraded the Region from an area of moderate non-attainment to an area of serious non-attainment. The Region was required to meet the one-hour ozone standards by a June 15, 2005 attainment date. A Texas State Implementation Plan (SIP), developed under the one-hour ozone standard, proposed emission reduction strategies necessary to meet the air quality standards. Concurrently, the USEPA developed its newer 8-hour clean air standards (based upon a different testing methodology). On April 15, 2004, the USEPA promulgated the new 8-hour standard, which also had the effect of enlarging the non-attainment Region by adding Ellis, Johnson, Kaufman, Parker and Rockwall counties (such counties, together with the Region, being the “North Texas Region”), as well as revoking the previous one-hour standard. The new “8-hour standard” required TCEQ to develop a new SIP by June 2007 that would show attainment of the standard by 2010. The 8-hour rule also established new guidelines for areas that had not met their legal obligations under the previous one-hour standard. The option chosen by TCEQ was to propose a “5% Rate of Progress SIP” by June 2005 that would establish a schedule of at least a 5% decrease in levels of NOx, thereby leading the way for compliance of the new standard. The TCEQ approved this “5% Rate of Progress SIP” and submitted it to the USEPA in June 2005. As a result of this submission, the area has now complied with its previous one-hour standard requirements. The finalization of the 8-hour standard and revocation of the one-hour standard also contributed to the resolution of a lawsuit brought by environmental groups against the USEPA for its failure to either approve or disapprove a SIP under the previous one-hour standard. In October 2004, a case styled Blue Skies Alliance et al. v. Leavitt was filed by four citizens groups in the U.S. District Court in Dallas, Texas. The suit sought to require the USEPA to either approve or disapprove the SIP submitted under the one-hour standard. The practical effect of the suit could have required the DFW area to a higher “severe” classification and cause disruption of all planning for federally funded highway projects in the region. However, the suit was settled and the USEPA agreed to a consent decree that proposed to approve some additional air quality measures submitted by the State, as well as additional studies on point source controls to be conducted by TCEQ. The TCEQ has also identified new control measures for consideration for the nine county area as well as certain regional controls. On December 13, 2006, the TCEQ presented a proposed plan to its Commissioners. That plan was formally adopted by the TCEQ Commissioners on May 26, 2007. On March 12, 2008, the USEPA revised the 8-hour ozone national ambient air quality standard. The new standard was established at 75 parts per billion (“ppb”). Due to the revision, new designations of ozone nonattainment were required by the Clean Air Act. States are to recommend to the USEPA nonattainment areas and boundaries by March 2009, and the USEPA was required by the Clean Air Act to finalize the designations by March 2010. On May 21, 2012, the USEPA designated the 10-county DFW area as “moderate nonattainment” with respect to the 8-hour ozone standard. In response, TCEQ proposed SIP revisions that were accepted in part and denied in part by the USEPA. Communication between TCEQ and the USEPA regarding these issues is ongoing. The attainment deadline for the 8-hour ozone standard is December 31, 2018. On July 14, 2008, the USEPA proposed conditional approval of the 1997 8-hour ozone attainment demonstration SIP revisions for the Dallas/Fort Worth area submitted to the USEPA by the State of Texas on May 30, 2007 and supplemented on April 23, 2008. The USEPA’s action was published in the Federal Register on July 14, 2008 at 73 FR 40203. The USEPA also proposed on July 11, 2008 a finding that the DFW area is currently attaining the 1-hour ozone standard. Details of this action are found in the Federal Register of July 11, 2008 at 73 FR 39897. In February 2009, the USEPA approved the 1997 8-hour ozone attainment demonstration SIP revisions for the Dallas/Fort Worth area. Details of this action are found in the Federal Register of January 14, 2009 at 74 FR 1927. However, in January 2010, the USEPA proposed to further strengthen the national ambient air quality standards for ground level ozone from the current standard 39 of 75 ppb. The USEPA has proposed to change the standard to a level between 60 ppb and 70 ppb. The USEPA has yet to change the standard. In May 2014, the Sierra Club filed a lawsuit against the USEPA in a federal district court in the District of Columbia seeking to require the USEPA to reclassify part or all of the DFW non-attainment area as being in severe or extreme nonattainment for ozone. Such a reclassification could have a significant effect on local businesses and economic development. The parties to the lawsuit have lodged a proposed consent decree with the court. The consent decree does not include a requirement that the USEPA immediately reclassify the Dallas/Fort Worth non-attainment area for ozone, but rather sets forth a timeframe for the USEPA to act on several ozone-related issues. The proposed consent decree does not dictate that the USEPA takes any particular action.

41
CONTINUING DISCLOSURE OF INFORMATION In the Bond Resolution, the Issuer has made the following agreement for the benefit of the holders and beneficial owners of the Bonds. The Issuer is required to observe the agreement for so long as it remains obligated to advance funds to pay the Bonds. Under the agreement, the Issuer will be obligated to provide certain updated financial information and operating data annually, and timely notice of specified material events, to the Municipal Securities Rulemaking Board (“MSRB”) through the Electronic Municipal Market Access (“EMMA”) system information system in accordance with Rule 15c2-12 (the “Rule”) promulgated by the SEC. This information will be available to securities brokers and others who subscribe to receive the information from the vendors. Investors will be able to access continuing disclosure information filed with the MSRB through EMMA free of charge at www.emma.msrb.org. In the Project Financing Agreement, the City agrees to provide the Issuer with the information described below to enable the Issuer to timely meet its continuing disclosure undertaking. ANNUAL REPORTS The Issuer will provide certain updated financial information and operating data to EMMA annually. The information to be updated includes all quantitative financial information and operating data with respect to the City of the general type included in this Official Statement under Tables numbered 1 through 9, and in Appendix C. The Issuer will update and provide this information within six months after the end of each fiscal year of the City ending in and after 2015. The Issuer will additionally provide audited financial information of the type described in the numbered tables when and if available, and in any event, within twelve months after the end of each fiscal year ending in or after 2015. If the audit of such financial statements is not complete within twelve months after any such fiscal year end, then the Issuer will file unaudited financial information of the type described in the numbered tables within such twelve month period and audited financial statements for the applicable fiscal year when and if the audit report on such statements becomes available. Any such financial statements will be prepared in accordance with the accounting principles described or incorporated by reference in Exhibit B to the Bond Resolution (the accounting principles described in the notes to such financial statements) or such other accounting principles as the Issuer may be required to employ from time to time pursuant to state law or regulation. The Issuer’s financial statements relating to the Airport System will be included within the Comprehensive Annual Financial Report of the City as a blended component unit of the Airport Revenue Fund. The City’s current fiscal year end is September 30. The Issuer has covenanted in the Indenture to maintain the same fiscal year as the City. Accordingly, the Issuer must provide updated information by March 31 in each year, unless the City changes its fiscal year. If the City changes its fiscal year, the Issuer will notify the MSRB of the change. DISCLOSURE EVENT NOTICES The Issuer will also provide timely notices of certain events to certain information vendors. The Issuer will provide notice of any of the following events with respect to the Bonds, if such event is material to a decision to purchase or sell the Bonds: (1) principal and interest payment delinquencies; (2) non-payment related defaults; (3) unscheduled draws on debt service reserves reflecting financial difficulties; (4) unscheduled draws on credit enhancements reflecting financial difficulties; (5) substitution of credit or liquidity providers, or their failure to perform; (6) adverse tax opinions, the issuance by the Internal Revenue Service of proposed or final determinations of taxability, Notices of Proposed Issue (IRS Form 5701- TEB) or other material notices or determinations with respect to the tax status of the Bonds, or other material events affecting the tax status of the Bonds; (7) modifications to rights of holders of the Bonds, if material; (8) Bond calls, if material, and tender offers; (9) defeasances; (10) release, substitution, or sale of property securing repayment of the Bonds, if material; (11) rating changes; (12) bankruptcy, insolvency, receivership or similar event of the Issuer or the City; (13) the consummation of a merger, consolidation, or acquisition involving the Issuer or the City, or the sale of all or substantially all of the assets of the Issuer or the City, other than in the ordinary course of business, the entry into a definitive agreement to undertake such an action or the termination of a definitive agreement relating to any such actions, other than pursuant to its terms, if material; and (14) appointment of a successor Trustee or Paying Agent/Registrar or change in the name of the Trustee or the Paying Agent/Registrar, if material. Neither the Bonds nor the Bond Resolution make any provision for liquidity or credit enhancement facilities. In addition, the Issuer will provide timely notice of any failure by the Issuer to provide information, data, or financial statements in accordance with its agreement described above under "Annual Reports." As used in clause 12 above, the phrase "bankruptcy, insolvency, receivership or similar event" means the appointment of a receiver, fiscal agent or similar officer for the Issuer or the City in a proceeding under the U.S. Bankruptcy Code or in any other proceeding under state or federal law in which a court or governmental authority has assumed jurisdiction over substantially all of the assets of the Issuer or the City, as applicable, or if jurisdiction has been assumed by leaving the Board of Directors of the Issuer and officials or officers of the Issuer, or the City Council of the City and officials or officers of the City, as applicable, in possession but subject to the supervision and orders of a court or governmental authority, or the entry of an order confirming a plan of reorganization, arrangement or liquidation by a court or governmental authority having supervision or jurisdiction over substantially all of the assets or business of the Issuer or the City, as applicable. LIMITATIONS AND AMENDMENTS The Issuer has agreed to update information and to provide notices of specified events only as described above. The Issuer has not agreed to provide other information that may be relevant or material to a complete presentation of its financial results of operations, condition, or prospects or agreed to update any information that is provided, except as described above. Neither the Issuer nor the City make any representation or warranty concerning such information or concerning its usefulness to a decision to invest in or sell Bonds at any future date.

42
The Issuer disclaims any contractual or tort liability for damages resulting in whole or in part from any breach of its continuing disclosure agreement or from any statement made pursuant to its agreement, although holders of Bonds may seek a writ of mandamus to compel the Issuer to comply with its agreement. The Issuer may amend its continuing disclosure agreement from time to time to adapt to changed circumstances that arise from a change in legal requirements, a change in law, or a change in the identity, nature, status, or type of operations of the Issuer, if (i) the agreement, as amended, would have permitted an underwriter to purchase or sell Bonds in the offering described herein in compliance with the Rule, taking into account any amendments or interpretations of the Rule to the date of such amendment, as well as such changed circumstances, and (ii) either (a) the holders of a majority in aggregate principal amount of the outstanding Bonds consent to the amendment or (b) any person unaffiliated with the Issuer (such as nationally recognized bond counsel) determines that the amendment will not materially impair the interests of the holders and beneficial owners of the Bonds. If the Issuer so amends the agreement, it has agreed to include with the next financial information and operating data provided in accordance with its agreement described above under “ANNUAL REPORTS” an explanation, in narrative form, of the reasons for the amendment and of the impact of any change in the type of financial information and operating data so provided. COMPLIANCE WITH PRIOR UNDERTAKINGS Prior to the issuance of the Bonds, the Corporation has not been obligated under the Rule to make any filings under the Rule. The City has been in compliance, in all material respects, during the last five years with its undertakings under the Rule. The City has identified instances in which certain segments of the Dallas-Fort Worth International Airport’s annual financial information for Fiscal Years 2009 and 2010, which the City believes are immaterial to the operations and financial condition of Love Field, were filed through incorporation by reference to Official Statements after the scheduled annual filing date for the respective years. Consolidation of tables and audited financial information in one document filing since Fiscal Year 2012 further assures timely and complete annual filings. REGISTRATION AND QUALIFICATION OF BONDS FOR SALE The sale of the Bonds has not been registered under the Federal Securities Act of 1933, as amended, in reliance upon the exemption provided thereunder by Section 3(a)(2); and the Bonds have not been qualified under the Securities Act of Texas in reliance upon various exemptions contained therein; nor have the Bonds been qualified under the securities acts of any other jurisdiction. The Issuer assumes no responsibility for qualification of the Bonds under the securities laws of any jurisdiction in which the Bonds may be sold, assigned, pledged, hypothecated or otherwise transferred. This disclaimer of responsibility for qualification for sale or other disposition of the Bonds shall not be construed as an interpretation of any kind with regard to the availability of any exemption from securities registration provisions. LEGAL INVESTMENTS AND ELIGIBILITY TO SECURE PUBLIC FUNDS IN TEXAS Section 1201.041 of the Public Security Procedures Act (Chapter 1201, Texas Government Code) provides that the Bonds are negotiable instruments governed by Chapter 8, Texas Business and Commerce Code, and are legal and authorized investments for insurance companies, fiduciaries, and trustees, and for the sinking funds of municipalities or other political subdivisions or public agencies of the State. With respect to investment in the Bonds by municipalities or other political subdivisions or public agencies of the State, the PFIA, requires that the Bonds be assigned a rating of not less than “A” or its equivalent as to investment quality by a national rating agency. See “OTHER INFORMATION – Ratings” above. In addition, various provisions of the Texas Finance Code provide that subject to a prudent investor standard, the Bonds are legal investments for state banks, savings bank, trust companies with capital of one million dollars or more, and savings and loan associations. The Bonds are eligible to secure deposits of any public funds of the State, its agencies, and its political subdivisions, and are legal security for those deposits to the extent of their market value. No review by the Issuer has been made of the laws in other states to determine whether the Bonds are legal investments for various institutions in those states. The Issuer has made no investigation of other laws, rules, regulations or investment criteria which might apply to such institutions or entities or which might limit the suitability of the Bonds for any of the foregoing purposes or limit the authority of such institutions or entities to purchase or invest in the Bonds for such purposes. The Issuer has made no review of laws in other states to determine whether the Bonds are legal investments for various institutions in those states. LEGAL OPINIONS The Issuer will furnish a complete transcript of proceedings held incident to the authorization and issuance of each series of the Bonds, including the unqualified approving legal opinion of the Attorney General of Texas approving the Bonds and to the effect that the Bonds are valid and legally binding special obligations of the Issuer, and based upon examination of such transcript of proceedings, the approving legal opinion of Co-Bond Counsel, to like effect. The customary closing papers, including a certificate to the effect that no litigation of any nature has been filed or is then pending to restrain the issuance and delivery of the Bonds, or which would affect the provision made for their payment or security, or in any manner questioning the validity of said Bonds will also be furnished. Co-Bond Counsel from time to time represents the Co-Financial Advisors and the members of the underwriting syndicate in matters not related to the Bonds. Co-Bond Counsel were not requested to participate, and did not take part, in the preparation of the Official Statement, and such firms have not assumed any responsibility

43
with respect thereto or undertaken independently to verify any of the information contained therein, except that, in capacity as Co-Bond Counsel, such firms have reviewed the information under the captions “INTRODUCTION,” “THE BONDS” (exclusive of the subcaptions “Book-Entry-Only System,” “Sources and Uses of Funds” and “Owners’ Remedies”), “PROJECT FINANCING AGREEMENT,” “TAX MATTERS” and the subcaptions “Continuing Disclosure of Information” (exclusive of the heading “Compliance with Prior Undertakings”), “Legal Investments and Eligibility to Secure Public Funds in Texas” and “Legal Opinions” under the caption “OTHER INFORMATION” in the Official Statement and Appendices D and G thereto, and Co-Bond Counsel is of the opinion that the information relating to the Bonds and the legal issues contained under such captions and subcaptions is an accurate and fair description of the laws and legal issues addressed therein and, with respect to the Bonds, such information conforms to the Indenture and the Bond Resolution The legal fees to be paid to Co-Bond Counsel for services rendered in connection with the issuance of the Bonds are contingent on the sale and delivery of the Bonds. In connection with the transaction described in this Official Statement, Co-Bond Counsel represents only the Issuer and the City. The legal opinion will accompany the Bonds deposited with DTC or will be printed on the Bonds in the event of the discontinuance of the Book-Entry-Only System. Certain legal matters will be passed upon for the City by Andrews Kurth LLP, Dallas, Texas and Gonzalez Saggio & Harlan LLP, Atlanta, Georgia, Co-Disclosure Counsel for the City. Certain other legal matters will be passed upon for the City by the City Attorney. Certain legal matters will be passed upon for the Underwriters by their Co-Counsel, Locke Lord LLP, Dallas, Texas and White & Wiggins, LLP, Dallas, Texas. The legal fees to be paid to co-counsel to the Underwriters for services rendered in connection with the issuance of the Bonds are contingent on the sale and delivery of the Bonds. The legal opinions to be delivered concurrently with the delivery of the Bonds express the professional judgment of the attorneys rendering the opinions as to the legal issues explicitly addressed therein. In rendering a legal opinion, the attorney does not become an insurer or guarantor of that expression of professional judgment, of the transaction opined upon, or of the future performance of the parties to the transaction, nor does the rendering of an opinion guarantee the outcome of any legal dispute that may arise out of the transaction. CO-FINANCIAL ADVISORS First Southwest Company, LLC and Estrada Hinojosa & Company, Inc. are employed as Co-Financial Advisors to the Issuer and the City in connection with the issuance of the Bonds. The Co-Financial Advisors' fees for services rendered with respect to the sale of the Bonds is contingent upon the issuance and delivery of the Bonds. First Southwest Company, LLC and Estrada Hinojosa & Company, Inc. have agreed, in their Co-Financial Advisor contracts with the City, not to bid for the Bonds, either independently or as a member of a syndicate organized to submit a bid for the Bonds. First Southwest Company, LLC and Estrada Hinojosa & Company, Inc., in their capacity as Co-Financial Advisors, have relied on the opinion of Co-Bond Counsel and have not verified and do not assume any responsibility for the information, covenants and representations contained in any of the legal documents with respect to the federal income tax status of the Bonds or the possible impact of any present, pending or future actions taken by any legislative or judicial bodies. In the normal course of business, the Co-Financial Advisors may from time to time sell investment securities to the Issuer or the City for the investment of bond proceeds or other funds of the Issuer or the City upon the request of the Issuer or the City. The Co-Financial Advisors have provided the following sentence for inclusion in this Official Statement. The Co-Financial Advisors have reviewed the information in this Official Statement in accordance with, and as part of, their responsibilities to the Issuer and the City and, as applicable, to investors under the federal securities laws as applied to the facts and circumstances of this transaction, but the Co-Financial Advisors do not guarantee the accuracy or completeness of such information. UNDERWRITING The Underwriters have agreed, subject to certain conditions, to purchase the Bonds from the Issuer, at a purchase price of par, plus a premium of $13,636,921.25and less an underwriting discount of $627,852.31. The Underwriters will be obligated to purchase all of the Bonds if any Bonds are purchased. The Bonds to be offered to the public may be offered and sold to certain dealers (including the Underwriters and other dealers depositing Bonds into investment trusts) at prices lower than the public offering prices of such Bonds, and such public offering prices may be changed, from time to time, by the Underwriters. Certain of the Underwriters and their respective affiliates are full service financial institutions engaged in various activities, which may include sales and trading, commercial and investment banking, advisory, investment management, investment research, principal investment, hedging, market making, brokerage and other financial and non-financial activities and services. Certain of the Underwriters and their respective affiliates have provided, and may in the future provide, a variety of these services to the Issuer and to persons and entities with relationships with the Issuer, for which they received or will receive customary fees and expenses. In the ordinary course of their various business activities, the Underwriters and their respective affiliates, officers, directors and employees may purchase, sell or hold a broad array of investments and actively trade securities, derivatives, loans, commodities, currencies, credit default swaps and other financial instruments for their own account and for the accounts of their customers, and such investment and trading activities may involve or relate to assets, securities and/or instruments of the issuer (directly, as collateral securing other obligations or otherwise) and/or persons and entities with relationships with the Issuer. The Underwriters and their respective affiliates may also communicate independent investment recommendations, market color or trading ideas and/or publish or express independent research views in respect of such assets,

44
securities or instruments and may at any time hold, or recommend to clients that they should acquire, long and/or short positions in such assets, securities and instruments. Citigroup Global Markets Inc., an underwriter of the Bonds, has entered into a retail distribution agreement with each of TMC Bonds L.L.C. (“TMC”) and UBS Financial Services Inc. (“UBSFS”). Under these distribution agreements, Citigroup Global Markets Inc. may distribute municipal securities to retail investors through the financial advisor network of UBSFS and the electronic primary offering platform of TMC. As part of this arrangement, Citigroup Global Markets Inc. may compensate TMC (and TMC may compensate its electronic platform member firms) and UBSFS for their selling efforts with respect to the Bonds. Loop Capital Markets LLC (“Loop Capital Markets”), one of the Underwriters of the Bonds, has entered into distribution agreements (each a “Distribution Agreement”) with each of Deutsche Bank Securities Inc. (“DBS”) and Credit Suisse Securities USA LLC (“CS”) for the retail distribution of certain securities offerings at the original issue prices. Pursuant to each Distribution Agreement, each of DBS and CS will purchase the Bonds from Loop Capital Markets at the original issue prices less a negotiated portion of the selling concession applicable to any Bonds that such firm sells. Piper Jaffray & Co. and Pershing LLC, a subsidiary of The Bank of New York Mellon corporation, entered into an agreement (the “Agreement”) which enables Pershing LLC to distribute certain new issue municipal securities underwritten by or allocated to Piper Jaffray & Co., including the Bonds. Under the Agreement, Piper Jaffray & Co. will share with Pershing LLC a portion of the fee or commission paid to Piper. Wells Fargo Securities is the trade name for certain securities-related capital markets and investment banking services of Wells Fargo & Company and its subsidiaries, including Wells Fargo Bank, National Association (“WFBNA”). WFBNA, one of the Underwriters of the Bonds, has entered into an agreement (the "Distribution Agreement") with its affiliate, Wells Fargo Advisors, LLC ("WFA"), for the distribution of certain municipal securities offerings, including the Bonds. Pursuant to the Distribution Agreement, WFBNA will share a portion of its underwriting or remarketing agent compensation, as applicable, with respect to the Bonds with WFA. WFBNA also utilizes the distribution capabilities of its affiliates, Wells Fargo Securities, LLC (“WFSLLC”), for the distribution of municipal securities offerings, including the Bonds. In connection with utilizing the distribution capabilities of WFSLLC, WFBNA pays a portion of WFSLLC’s expenses based on its municipal securities transactions. WFBNA, WFSLLC, and WFA are each wholly-owned subsidiaries of Wells Fargo & Company. WFBNA is serving as underwriter, trustee, paying agent and registrar for the Bonds. The Underwriters have reviewed the information in the Official Statement in accordance with their responsibilities to investors under the federal securities laws as applied to the facts and circumstances of this transaction, but the Underwriters do not guarantee the accuracy or completeness of such information.
*** The Bond Resolution approved the form and content of this Official Statement, and any addenda, supplement or amendment thereto, and authorized its further use in the reoffering of the Bonds by the Underwriters.
FOREST TURNER President, Board of Directors
Love Field Airport Modernization Corporation
JEANNE CHIPPERFIELD Chief Financial Officer City of Dallas, Texas
ATTEST: ROSA A. RIOS
City Secretary

APPENDIX A
GENERAL INFORMATION REGARDING THE CITY

[THIS PAGE INTENTIONALLY LEFT BLANK]

A - 1
LOCATION AND POPULATION. . .The City of Dallas is located in north central Texas approximately 300 miles north of the Gulf ofMexico. It is among the three largest cities in Texas and among the ten largest cities in the United States. Dallas is the county seatof Dallas County.
Dallas County encompasses an area of 880 square miles while the City of Dallas contains approximately 378 square miles. TheCity of Dallas’ corporate land extends into Collin, Denton and Rockwall Counties.
POPULATION TOTALS ARE:
2015 2014 2013 2012 2011 2010 2009Estimate Estimate Estimate Estimate Estimate Estimate Estimate
City 1,232,360 1,213,600 1,207,420 1,207,420 1,200,530 1,197,816 (2) 1,306,350County NA 2,518,638 2,480,331 2,453,843 2,380,510 2,492,850 2,471,000Metro Stat Area(1) NA NA 6,812,373 6,647,496 6,526,548 6,402,922 6,447,228
(1) Metropolitan Statistical Area (MSA) is a twelve-county area which includes Collin, Dallas, Delta, Denton, Ellis, Hunt, Johnson, Kaufman,Parker, Rockwall, Tarrant, and Wise Counties.
(2) U.S. Census.Sources: U.S. Census Bureau-American Fact Finder; North Central Texas Council of Governments.
ESTIMATED PER CAPITA INCOME2014(2) 2013 2012 2011 2010 2009
Dallas MD(1) $48,330 $48,591 $48,069 $45,404 $42,943 $41,948Dallas County 48,383 48,638 48,127 45,402 43,178 42,088Texas 43,095 43,552 42,638 40,147 37,747 36,500U.S. 44,139 44,543 43,735 41,560 39,937 38,846
(1) Metropolitan Divison (MD) is an eight-county area which includes Collin, Dallas, Delta, Denton, Ellis, Hunt, Kaufman, and RockwallCounties.
(2) The 2014 Per Capita Income is an average of 2013 and 2012.Sources: U.S. Department of Commerce; Bureau of Economic Analysis.
GOVERNMENT ORGANIZATION . . .The City of Dallas operates under a Council-Manager form of government. There are fourteensingle-district council members and a mayor elected at large. The Mayor and Council appoint the City Manager, City Attorney, CityAuditor, City Secretary and the Municipal Court Judges. The City Manager appoints all other department directors except twoappointed by the Civil Service Board and the Park and Recreation Board. The Mayor is elected to a four-year term and is limited totwo consecutive four-year terms. Council members are elected for two-year terms and can serve up to four consecutive two-yearterms.
TheMayor and City Council set the public agenda, adopt policy and laws and appoint the CityManager, who acts as chief executive,responsible for implementing council policy. The City Manager oversees City operations with an executive team of assistant citymanagers, each of whom has responsibility for various departments.
The City organization has approximately 13,000 full-time employees.
CITY SERVICES AND FACILITIES . . . The City provides the full range of municipal services contemplated by statute or charter. Thisincludes public safety (police and fire), streets, sanitation, health and human services, culture and recreation, public improvements,planning and zoning, and general administrative services. In addition to general government activities, the Dallas Water Utilities,Municipal Airport (Love Field), Convention Center, Municipal Radio and several other enterprise and internal service fund activitiesare a part of the City’s legal entity

A - 2
EMPLOYMENT DATA . . .A diverse economy and highly-skilled work force contribute to the strengths of the City. Dallas is a centerfor high technology, retail and wholesale trade, finance, major medical facilities, culture and recreation and a convention and visitordestination. The following exhibits show the City’s civilian employment over the last several years, the employment by sector andthe major employers within the Dallas area.
EMPLOYMENT STATISTICS
May2014
May2013
May2012
May2011
May2010
Civilian Labor Force (City of Dallas) 635,448 622,072 614,585 606,851 598,199Civilian Labor Force (Dallas MD*) 2,355,042 2,304,907 2,265,051 2,229,599 2,185,097Total Employed (City of Dallas) 601,726 582,324 571,318 558,745 548,493Total Employed (Dallas MD*) 2,237,139 2,164,698 2,115,472 2,062,838 2,014,486Total Unemployed (City of Dallas) 33,722 39,748 43,267 48,106 49,706Total Unemployed (Dallas MD*) 117,903 140,209 149,579 166,761 170,611% Unemployed (City of Dallas) 5.3% 6.4% 7.0% 7.9% 8.3%% Unemployed (Dallas MD*) 5.0% 6.1% 6.6% 7.5% 7.8%% Unemployed (Dallas County) 5.4% 6.5% 7.1% 8.0% 8.4%% Unemployed (Texas) 5.0% 6.2% 6.7% 7.0% 7.9%% Unemployed (U.S.) 6.1% 7.3% 7.9% 8.7% 9.3%
* Metropolitan Divison (MD) is an eight-county area which includes Collin, Dallas, Delta, Denton, Ellis, Hunt, Kaufman, and Rockwall Counties.Source: Bureau of Labor Statistics.
AVERAGE ANNUAL UNEMPLOYMENT RATES
2014 2013 2012 2011 2010City of Dallas 5.9% 6.8% 7.7% 8.7% 8.7%Dallas - MD(1) 5.0% 6.3% 7.1% 8.0% 8.2%State of Texas 5.1% 6.4% 7.1% 8.1% 8.2%United States 6.2% 7.4% 8.3% 9.2% 9.7%
(1) Dallas-Plano-Irving Metropolitan Division (MD) is an eight-county area which includes Collin, Dallas, Delta, Denton, Ellis, Kaufman, Hunt,and Rockwall Counties.
Sources: Texas Workforce Commission; U.S. Bureau of Labor Statistics.
MAJOR DALLAS AREA EMPLOYERS
Number of LocalCompany Product/Service Employees
Wal-Mart Stores Inc. Retailer 52,700American Airlines Airline 23,700Baylor Health Care System Health Care 22,000Dallas Independent School District Education 20,793Texas Health Resources Health Care 16,205Bank of America Financial Services 15,400JPMorgan Chase Financial Services 13,000Texas Instruments Inc. Semiconductor Design and Manufacturing 13,000City of Dallas City Government 13,000Lockheed Martin Aeronautics Semiconductor Design and Manufacturing 13,000
202,798
Source: The Dallas Business Journal Book of Lists 2015 (July 18, 2014).

A - 3
DALLAS – PLANO - IRVINGMETROPOLITAN DIVISION---NON-AGRICULTURALWAGE AND SALARY EMPLOYMENT BY SECTOR
2014 Average Annual 2013 Average AnnualIndustry(1) Employment Percentage Employment PercentageTrade, Transportation, & Utilities 475,000 20.6% 430,000 20.1%Professional, Business Services 439,000 19.0% 392,000 18.3%Health, Educational Services 288,000 12.1% 270,000 12.4%Government 279,000 12.5% 266,000 12.6%Leisure and Hospitality 226,000 9.8% 211,000 9.9%Financial Services 166,000 7.2% 163,000 7.6%Manufacturing 163,000 7.1% 153,000 7.1%Natural Resources & Mining and Construction 127,000 5.5% 117,000 5.5%Other Services 78,000 3.4% 76,000 3.5%Information 69,000 3.0% 64,000 3.0%
Non-farm Total 2,310,000 100.0% 2,142,000 100.0%
(1) Dallas-Plano-Irving Metropolitan Division (MD) is an eight-county area which includes Collin, Dallas, Delta, Denton, Ellis,Hunt, Kaufman, and Rockwall Counties.
Sources: Texas Workforce Commission; U.S. Bureau of Labor Statistics.
OFFICE AND INDUSTRIAL SPACE OCCUPANCY RATES. . . The City of Dallas’ office market consists of 118 million square feet ofspace. Average rents continue to rise reaching $21.82 per square foot. As of July 2015, over 1.2 million square feet of new officespace is under construction or renovation citywide. The citywide vacancy rate is 17.2 percent.
The City is committed to the long-term health of the Central Business District (CBD). A number of public/private projects havebeen completed within the CBD: Klyde Warren Park, the expanded Dallas Arts District, the Omni Dallas Convention Center Hoteland Belo Garden Park. A new streetcar system began service on April 2015 to improve mobility between the CBD and North OakCliff. The current CBD office vacancy rate is 20.6 percent. The market consists of 33.4 million square feet. As of July 2015, averagerents are $22.63 per square foot.
Industrial/distribution market consists of 193 million square feet with 4.3 percent vacant as of July 2015.
Source: City of Dallas Department of Economic Development (as of July 2015).
CONSTRUCTION VALUATION/BUILDING PERMIT ACTIVITY**
Valuation ($000) 2014 2013 2012 2011 2010 2009Residential $ 1,574,178 $ 1,270,705 $ 1,060,472 $ 673,100 $ 650,387 $ 481,664Commercial 1,792,730 1,402,317 1,249,854 2,426,771 1,308,526 1,381,078Total $ 3,366,908 $ 2,673,022 $ 2,310,326 $ 3,099,871 $ 1,958,913 $ 1,862,742
Source: City of Dallas Building Inspection Division.
Other is reflected in Commercial.These valuations are based on all building permit activity inclusive of single trade permits, new residential and new non-residentialconstruction, residential and non-residential rehabilitation with additions considered as new construction. Excluded are sign permits,barricades, excavations, demolitions, moving permits and tents.
** Permit data is fluid and may fluctuate for the following reasons after the initial data is reported:1) Permit cancellations.2) Permit addendums; reductions or augmentations to the original plans submitted that change the valuation of the project.3) Periodic audits that correct data entry errors after the reporting period has closed.
A - 4
TRANSPORTATION. . .Dallas’ success as a leader in transportation is a result of its excellent airports, rail routes, and interstatehighway systems. Positioned centrally to both the east and west coasts, Dallas is easily accessible to all areas of the UnitedStates, Mexico and Canada. Direct flight time to any North American city takes less than four hours. In addition, Dallas is thecenter point between North America’s five largest business centers - New York, Los Angeles, Chicago, Mexico City andToronto.
Dallas/Fort Worth International Airport is a major contributor to the City's diversified economy. It is among the world’s busiestairports in terms of total operation ranked fourth in the world. Approximately 61 million passengers traveled through the airport forthe previous 12 months, as of April 2015.
Dallas Love Field, located seven miles north of the Central Business District, is also extremely valuable to the Dallas economy.Approximately 7.1 million passengers were carried at Love Field during October 2014 and April 2015. It acts as a catalyst forbusiness by providing valuable scheduled air carrier and general aviation transportation services, and attracting and serving majorcompanies that assemble, overhaul and maintain aircraft. Love Field began major renovation to the facility starting in 2010. TheLove Field Modernization Program (LFMP) will increase efficiency for travelers while maintaining the convenience that Love Fieldcurrently offers passengers.
In the new modernization design, the terminal will decrease in size approximately 25 percent by replacing a large amount of unusedand outdated space with modern and efficient facilities. The three original concourses will be demolished and consolidated into oneconvenient, centrally located concourse for all airlines.
Dallas Executive Airport, formerly known as Redbird Airport, is a public airport located six miles (10 km) southwest of the centralbusiness district (CBD) of the City of Dallas, in Dallas County, Texas, USA. The airport is used entirely for general aviationpurposes and serves as a reliever airport for Dallas Love Field. It has two runways, the longest being 6,451 feet long by 150 feetwide. Facilities at the airport include a restaurant, a conference center, Fixed Based Operators and aircraft Hangar and tie-downareas. The airport is home to approximately 126 individual, enclosed T-hangars.
The Dallas Vertiport is a Facility located at the Dallas Convention Center at the Central Business District and built to accommodatehelicopters and tiltrotor type aircraft. It has two landing areas with independent approaches and facilities for flight planning andmeetings and 5 tie-down areas.
Dallas has a well-developed highway system. There are five interstate highways which run north/south and east/west includinga loop freeway encompassing the City. Dallas has 19 other major U.S. and state highways. Dallas is a principal trucking andfreight distribution center with approximately 120 trucking companies. Overnight pickup and delivery services are available tomost cities.
Dallas is a major hub for hundreds of rail routes. Major railroads that serve the Dallas area include Burlington Northern Santa FeRailway, Kansas City Southern Railway and Union Pacific. Amtrak provides passenger train service at Union Station in downtownDallas with three lines: Chicago, Los Angeles, and San Antonio.
The City is part of an integrated regional mass transit system – Dallas Area Rapid Transit (DART). DART consists of the City of Dallasand 13 cities and is funded by a 1.0% local sales tax assessed in the cities within the service area as well as fare revenues and federalfunds for certain capital projects. TheDARTServiceArea is approximately 700 squaremiles. TheDARTTransit SystemPlan is designedto provide a balanced combination of transit services and facilities to meet the region’s mobility needs. DART’s mission is made bothdifficult and necessary by the size and sprawl of the metroplex. Unlike some cities that funnel transportation into the central businessdistrict, the metroplex has multiple “cores” that have developed in suburban communities and along existing transportation routes. Thesemini-hubs complicate transportation service requirements and necessitate a range of mobility programs.
DART provides fixed-route bus service with a total of 612 vehicle fleet from three DART-owned facilities. DART currently operates85 miles of light rail. A 34-mile commuter rail service between downtown Dallas and Fort Worth is operated jointly by DART andthe Fort Worth Transportation Authority. Additionally, DART operates and maintains 75 freeway miles of high-occupancy vehicle(HOV) lanes and provides Paratransit service to more than 11,550 riders.
Sources: Greater Dallas Chamber; The Dallas Facts; Dallas Area Rapid Transit (DART); the City of Dallas, Dallas/Fort Worth International Airport.

A - 5
EDUCATION. . .The Dallas Independent School District (DISD) had approximately 160,253 students enrolled for the 2014-2015school year. DISD has 224 schools, including four elementary school vanguards (magnets), one elementary school vanguard/middleschool academy, two Montessori schools, six magnet middle/high schools, one middle school academy/magnet high school, andtwo high school/magnet high schools. In May 2008, a $1.35 billion bond program was approved to build fifteen new schools, 177new classrooms in existing schools and additional renovations.
There are 48 college and university campuses in the Dallas metroplex area, enrolling over 220,000 students. Twenty-six campusesoffer 4-year undergraduate degree programs, 19 offer 2-year associate degree programs and 22 offer advanced degrees.
Sources: Dallas Independent School District; Greater Dallas Chamber, The Dallas Facts.
MEDICAL . . .The Dallas metropolitan area is a major medical center providing "state-of-the-art" equipment and facilities. There are24 general hospitals in Dallas County which are licensed for nearly 8,000 beds. In addition, there are two pediatric, two psychiatricand several long-term/rehabilitation hospitals.
As a complement to its excellent medical treatment facilities, Dallas is becoming a leading force in biomedical research. TheUniversity of Texas Southwestern Medical Center at Dallas has five Nobel Prize winners on the faculty and staff. Nationallyrecognized medical and dental schools in Dallas include University of Texas Southwestern Medical Center, Texas A&MUniversitySystem - Baylor College of Dentistry and Baylor University School of Nursing.
Sources: The University of Texas Southwestern Medical Center at Dallas; The Texas State Board of Medical Examiners.
TOURISM . . .According to the Dallas Convention and Visitors Bureau, Dallas ranks among the top convention cities in the nation.April 24, 2013 City Council renamed the Dallas Convention Center the Kay Bailey Hutchison Convention Center, which has thelargest convention center of its kind in Texas with approximately 1.0 million square feet of total space. There are 96 meeting roomsand over one million square feet of exhibit space. The convention center also boasts the world’s largest column-free exhibit halland a fully equipped theater along with catering capabilities and a cafeteria. The Center has both open and covered parking and thefacilities include a Heliport/Vertiport. Dallas is one of the leading convention cities in the nation, attracting nearly four millionconvention delegates who contribute in excess of $4 billion to the local economy while attending more than 3,600 conventions ayear.
Dallas is the number one visitor and leisure destination in Texas. Annually, more than 30 million people visit metropolitan Dallas.The Dallas area annually receives $9.6 billion from visitors. There are approximately 65,000 hotel rooms.
On September 15, 2009, City broke ground on the 23-story Omni Dallas Convention Center Hotel. The 1,000 room hotel openedNovember 11, 2011. The Dallas Convention & Visitors Bureau has received commitments for meetings totaling 400,000 definiteroom nights for groups committed to Dallas for future years using the Omni Dallas Convention Center hotel.
Source: Dallas Convention Center; Dallas Convention and Visitors Bureau.
RECREATION . . .Dallas offers numerous recreational, cultural and entertainment opportunities. Within the City are 374 public parksand open spaces covering 23,331 acres plus 4,400 surface acres of water. There are over 60 lakes and reservoirs within 100 milesof Dallas covering more than 550,000 acres and four state parks within an hour of Dallas. There are 39 private and 34 municipalgolf courses in the area.
The Dallas metropolitan area hosts numerous national annual sporting events and has several large amusement parks. Major golftournaments include the EDS Byron Nelson and the Bank of America Colonial Golf Tournament. Dallas is one of few metropolitanareas with four professional sports teams, including the Dallas Cowboys football team, the Dallas Mavericks basketball team, theTexas Rangers baseball team and the Dallas Stars hockey team.
Key attractions include the Dallas Museum of Art, Nasher Sculpture Center, Crow Collection of Asian Art, Dallas Black DanceTheater Center, and Morton H Meyerson Symphony Center, home of the Dallas Symphony Orchestra. In October 2009, with theopening of the AT&T Performing Arts Center, three new cultural facilities were added to the Arts District: Winspear Opera House,Wyly Theater, and Sammons Performance Park. The Dallas area has a number of museums, galleries, theaters, orchestras and dancegroups.
Sources: City of Dallas, Parks and Recreation Department; City of Dallas, Office of Cultural Affairs.

[THIS PAGE INTENTIONALLY LEFT BLANK]

APPENDIX B
REPORT OF THE AIRPORT CONSULTANT

[THIS PAGE INTENTIONALLY LEFT BLANK]
June 8, 2015
Mr. Mark Duebner Director of Aviation City ofDallas Aviation Department Love Field Terminal Building 8008 Cedar Springs Road, LB 16 Dallas, Texas 75235
Subject: Financial Feasibility Report Love Field Airport Modernization Corporation General Airport Revenue Bonds, Series 2015
Dear Mr. Duebner:
Unison Consulting, Inc. (Unison) is pleased to submit the attached Financial Feasibility Report (Report) in connection with the planned issuance by the Love Field Airport Modernization Corporation of its General Airport Revenue Bonds, Series 2015 (the Series 2015 Bonds) in the approximate aggregate principal amount of $110.330 million. The proceeds of the Series 2015 Bonds and one subsequent series of General Airport Revenue Bonds (GARBs) will be used to fund the estimated capital costs of a proposed new public parking garage and related capital improvements (the Project) at Dallas Love Field (DAL, or the Airport).
Background and Description of the Financing
The City of Dallas (the City) created the Love Field Airport Modernization Corporation (LFAMC) as a local government corporation for the public purpose of acting on behalf of the City in the performance of its governmental functions to promote the City, including the development of the geographic areas of the City in the vicinity of the Airport. The City and the LFAMC have negotiated and plan to execute a Project Financing Agreement, dated as of July 1, 2015, pursuant to which the LFAMC and the City have agreed to cooperate and coordinate for the financing, design, and construction of the Project. Under the provisions of the Project Financing Agreement, the LFAMC has the authority to issue the Series 2015 Bonds and one or more future series of GARBs (referred to collectively as "Bonds" in the Project Financing Agreement) to finance the Project.
The source of funds to meet the City's obligation under the terms of the Project Financing Agreement to make payments to the LFAMC shall be limited to the Airport System Net Revenues. Such financial obligations of the City to the LFAMC shall not be payable from moneys raised or to be raised by taxation.
409 West Huron • Suite 400 • Chicago, Illinois 60654 • Tel: (312) 988-3360 • Fax: (312) 988-3370
Chicago, Illinois • Orange County, California • San Antonio, Texas • St Louis, Missouri

Mr. Mark Duebner June 8, 2015 Page 2
Under the prOVISIOns of the "Indenture of Trust By and Between Love Field Airport Modernization Corporation and Wells Fargo Bank, National Association, as Trustee," dated as of July 1,2015 (the Indenture), the LFAMC has pledged to the Trustee all of the LFAMC's rights, title, and interest in and the payments the LFAMC will receive from the City under the terms of the Project Financing Agreement, for the purpose of paying the debt service on the Series 2015 Bonds and any other GARBs issued to fmance the Project. The Indenture also contains a provision requiring that Airport System Net Revenues be at least 1.25 times debt service in order for the LFAMC to issue additional bonds on parity with the then-currently outstanding bonds (although the additional bonds coverage requirement does not apply to the first $250 million in bonds issued to finance the Project).
The Board of Directors of the LFAMC approved a resolution (the Bond Resolution) authorizing the issuance of the Series 2015 Bonds, in an aggregate principal amount not to exceed $150.0 million. The Bond Resolution also approved a bond purchase contract and other contract documents related to the Series 2015 Bonds. It is currently anticipated that the costs of designing and constructing the Project will be funded with the proceeds of the Series 2015 Bonds and one subsequent issue of GARBs, anticipated to be issued in 2016 (referred to as the "Series 2016 Bonds" in the attached Report). Together, the proceeds of the Series 2015 Bonds and the Series 2016 Bonds will be used to fund the design, planning, and construction of the Project; pay any associated costs including the funding of reserve funds and funding capitalized interest during construction, and costs of issuance of the Series 2015 Bonds and the Series 2016 Bonds.
The total estimated cost of design and construction of the Project is approximately $179.9 million. It is currently estimated that the Series 2015 Bonds will be issued in the aggregate principal amount of approximately $110.330 million, to fund approximately $100.0 million of the estimated design and construction costs of the Project, and associated costs including the funding of reserve funds, capitalized interest, and costs of issuance of the Series 2015 Bonds. It is estimated that the Series 2016 Bonds will be issued in 2016 in the aggregate principal amolmt of approximately $92.755 million, to fund the remaining $79.9 million estimated cost of constructing the Project, and associated costs including the funding of reserve funds, capitalized interest, and costs of issuance of the Series 2016 Bonds.
The Airport
The Airport is a medium hub airport serving the Dallas metropolitan region and the Dallas-Fort Worth metroplex. The Airport, which encompasses approximately 1,300 acres, is located within the Dallas city limits, approximately seven miles north of the City's central business district. The Airport is owned and operated by the City. The City also owns and operates Dallas Executive Airport, a general aviation reliever airport, and a downtown heliport (the Heliport). Together, the Airport, Dallas Executive Airport and the Heliport are referred to as the Dallas Airport System (the Airport System)l. The Airport System is managed and operated as a City department (the Aviation Department) under the direction of the City's Director of Aviation.
1 Section V of this Report presents a fmancial analysis of the Airport System, which is operated by the City as one department (the Aviation Department) of the City.

Mr. Mark Duebner June 8, 2015 Page 3
For calendar year 2013 (the latest year for which published data are available), the Airport ranked 43rd in the United States in terms of the number of passenger enplanements (DAL had approximately 4.3 million enplanements), according to statistics compiled by Airports Council International - North America (ACI-NA). In Fiscal Year 20142 the Airport accommodated almost 4.4 million enplaned passengers. In FY 2014, approximately 77 percent of Airport passengers were origination and destination (O&D) passengers (passengers who begin or end their trips at DAL) and 23 percent were connecting passengers.
Southwest Airlines Co. (Southwest) is headquartered adjacent to the Airport and has operated at the Airport since Southwest began passenger service in 1971. The Airport is a principal station in the route system of Southwest, which is the dominant airline at the Airport in terms of air traffic activity. In FY 2014, Southwest accounted for 96.5 percent of total enplaned passengers at the Airport.
The Wright Amendment
Prior to the opening of Dallas-Fort Worth International Airport (DFW) in 1974, the Airport was the principal air carrier airport serving the Dallas metropolitan region. Fort Worth was served by a separate air carrier airport. Southwest, which was not a party to the agreements related to the development of DFW, chose to continue operating its intrastate service (service within the state of Texas) at the Airport after DFW opened. The International Air Transportation Competition Act of 1979, as amended (the IATCA), imposed restrictions on air transportation to and from the Airport, following Southwest's inauguration of interstate service (service to destinations outside the state of Texas) at the Airport. A portion of the IATCA, commonly referred to as the "Wright Amendment," limited nonstop airline service at the Airport to other destinations within Texas and the following four neighboring states: Louisiana, Arkansas, Oklahoma, and New Mexico. The Wright Amendment also prohibited the purchase of a single airline ticket from DAL to any destination not in Texas or the four neighboring states. A person could change planes in a permitted destination, but he or she had to purchase a separate ticket from that destination to his or her final destination. In 1997, the Wright Amendment was modified by the Shelby Amendment3 to allow nonstop flights to the following three additional states (for a total of seven states): Alabama, Kansas, and Mississippi. However, "through ticketing" was still prohibited to cities on continuing flights to destinations outside the seven states allowed in the amended Wright Amendment. In 2005, Senator Kit Bond of Missouri attached an amendment to a transportation spending bill to permit nonstop flights to Missouri (the Bond Amendment).
On July 11,2006, the City, the City of Fort Worth, The Dallas-Fort Worth International Airport Board, Southwest and American Airlines, Inc. entered into an agreement called the "Five Party Agreement," which stipulated, among other things, that the parties agreed to seek to eliminate the Wright Amendment restrictions on domestic air service at the Airport. On October 13,2006, the "Wright Amendment Reform Act of 2006" was signed into law. It immediately eliminated the restriction on "through ticketing" between the Airport and cities outside the seven states, enabling passengers to purchase a single ticket for one-stop or connecting flights. It also
2 The City's fiscal year begins October 1st and ends the following September 30th. 3 A law introduced by Senator Richard Shelby of Alabama.
Mr. Mark Duebner June 8, 2015 Page 4
eliminated the Wright Amendment restrictions on non-stop domestic air service at the Airport effective October 13, 2014. As of May 2015, the Airport has nonstop service to 44 destinations, 30 of which would not have been allowed under the restrictions that had been in effect under the Wright Amendment, the Shelby Amendment, and the Bond Amendment.
The Love Field Modernization Program
In the Five Party Agreement, the City and Southwest agreed to the significant redevelopment of portions of the Airport, including the modernization of the existing terminal facilities at the Airport, a program referred to as the Love Field Modernization Program (LFMP). The LFMP consists of the phased demolition of the then-existing terminal concourses; the phased construction of a new 20-gate terminal concourse, the apron and hydrant fuel system to serve the new concourse gates; the redevelopment of ticketing and baggage handling facilities, and the main ticket lobby; the reconfiguration of the existing terminal roadway infrastructure; the relocation of airfield electrical vaults; and other related infrastructure improvements.
To facilitate the development of the LFMP, the City created the LF AMC, as described earlier in this section. Subsequently, the City, the LF AMC, and Southwest entered into a program development agreement, dated January 15,2009 (the Program Development Agreement), which provided that the City and Southwest would undertake the LFMP. It also provided that the LFAMC, at the request of Southwest, would issue bonds to finance major elements of the LFMP. The LFAMC issued the bonds in 2010 and 2012 (referred to as the Series 2010 Bonds and the Series 2012 Bonds) to fund a portion of the costs of the LFMP. The Series 2010 Bonds and the Series 2012 Bonds are secured by "Facilities Payments" payable by Southwest under the terms of a Special Facilities Agreement among the LFAMC, the City, and Southwest (the Special Facilities Agreement).
The City, the LFAMC, and Southwest entered into an Amended and Restated Lease of Terminal Building Premises (the Airport Use and Lease Agreement), which was executed February 13, 2009 and was made effective retroactively as of October 1, 2008. The Airport Use and Lease Agreement governs the operation and use of the Airport by the airlines operating at DAL.
The City and Southwest also entered into a revenue credit agreement (the Revenue Credit Agreement), which provides for the crediting back to Southwest of the Facilities Payments made by Southwest under the Special Facilities Agreement. This arrangement is made possible as a result of the rate making provisions of the Airport Use and Lease Agreement, which provide for the annual calculation of airline rates and charges sufficient to recover, among other things, debt service on the Series 2010 Bonds and the Series 2012 Bonds.
Under the priorities for the application of Airport System revenues established in the Airport Use and Lease Agreement, Airport System revenues are to be deposited into the Aviation Revenue Fund and applied first to pay O&M Expenses and any required deposits to the O&M Reserve Account; then to pay debt service on outstanding GARBs and any required deposits to the GARB Debt Service Reserve Fund. Only after these obligations are met are Airport System
Mr. Mark Duebner June 8, 2015 Page 5
Revenues available to be applied to reimburse Southwest for the Facilities Payments made by Southwest under the Special Facilities Agreement.
Report Organization
Unison has prepared the attached Report to evaluate the ability of the Board to meet the financial requirements established by the Bond Resolution. The following summary of the components of the attached Report provides an overview of the comprehensive analysis performed:
• Section I describes the Airport, the Project, presents the estimated costs of the Project, and describes the Aviation Department's capital improvement program and funding plan.
• Section II describes the Airport's air service area and discusses the local economic base.
• Section III analyzes the historical aviation activity at the Airport and presents forecasts of future aviation activity.
• Section IV analyzes the historical public parking activity at the Airport and presents forecasts of future public parking activity and revenues.
• Section V reviews the financial framework for the Airport System, reviews the recent historical fmancial performance of the Airport System, and examines the ability of the Airport System to generate sufficient Net Revenues to meet the payment obligations of the Series 2015 Bonds, the Series 2016 Bonds, and a potential future issue of GARBs during the forecast period.
Assumptions
The analysis and forecasts contained in the attached Report are based upon certain data, estimates, and assumptions that were provided by the Aviation Department, and certain data and projections from other independent sources as referenced therein. The attached Report should be read in its entirety for an understanding of the forecasts and the underlying assumptions. In our opinion, the data, estimates, and assumptions used in the report are reliable, and provide a reasonable basis for our forecast given the information available and circumstances as of the date of this Report. However, any forecast is subject to uncertainties. Inevitably, some assumptions will not be realized, and unanticipated events and circumstances may occur. Therefore, the actual results achieved may vary from the forecasts, and the variations could be material.
The major assumptions utilized in the attached Report are the following:
1. The Project will be completed within the budgeted costs and according to the estimated schedule.

Mr. Mark Duebner June 8, 2015 Page 6
2. The costs of the Project not funded with the proceeds of the Series 2015 Bonds will be funded with a second series of General Airport Revenue Bonds, which will be issued in 2016 (the Series 2016 Bonds).
3. Based on estimated debt service schedules provided by First Southwest Company, annual debt service on the Series 2015 Bonds and the Series 2016 Bonds is estimated to equal approximately $9.4 million in FY 20 18 (after the end of the capitalized interest period), and increase to $17.4 million in FY 2019 through FY 2021. The funding plan in the Master Plan anticipates that GARBs will be issued to fund a major airfield project, with approximately $3.6 million in debt service beginning in FY 2022. Annual debt service on all GARBs is estimated to total approximately $21.0 million in FY 2022 through FY 2024.
4. The forecasts of aviation activity were developed using a hybrid modeling framework that incorporates both supply and demand considerations. This approach features capacity-driven, short-term forecasts and demand-driven long-term forecasts. For the long-term forecasts, we use regression analysis to link growth in future airport activity to trends in key demand drivers. The regression models are consistent with sound economic theory, are well-supported by empirical trends, and pass statistical evaluation.
5. The base case enplanement forecast used to develop the forecast of public parking demand and the financial projections assumes that enplanements will be constrained beginning in FY 2016 due to the operational capacity of the 20-gate terminal concourse. Southwest currently operates on 16 gates (plus it shares one gate with Delta), Delta currently operates on two gates (one of which is shared with Southwest), and Virgin America currently operates on two gates. The constrained base case assumes a maximum of 10 turns per gate per day for the 16 gates used only by Southwest and a slightly lower average for the other 4 gates, to consider differences in operational efficiencies among the airlines.
6. The forecasts of public parking activity are presented in terms of vehicle exits, and were developed using multivariate regression modeling that considered forecast enplanements at the Airport. To get an unbiased estimate of the relationship between enplanements and vehicle exits, the regression models include two other variables that influence trends in vehicle exits: the price ofparking and customer income as measured by the area's per-capita personal income. The regression models are consistent with sound economic theory, are well-supported by empirical trends, and pass statistical evaluation.
Findings and Conclusions
Based upon the assumptions and analysis presented in the attached Report, we forecast that Airport System Revenues will be sufficient to make all required payments and transfers to various funds and accounts as provided for in the Airport Use and Lease Agreement, while

Mr. Mark Duebner June 8, 2015 Page 7
maintaining a reasonable airline cost per enplaned passenger. We also forecast that Airport System Revenues will be sufficient to exceed the minimum debt service coverage requirement specified in the Indenture as a condition for the issuance of potential future bonds. In addition, Airport System Net Revenues are forecast to be sufficient to provide for annual transfers to the Aviation Capital Fund ranging from approximately $10.7 million to $13.9 million during the forecast period.
Specifically, we conclude the following under the constrained base case air traffic forecast:
• Enplanements will increase to approximately 7.327 million in 2024.
• The Airport is projected to exceed the minimum debt service coverage requirement during the forecast period. Debt service coverage is projected to be no less than 2.53 times debt service during the forecast period.
• The Airport's airline cost per enplaned passenger is projected to reach $9.06 in FY 2024.
We also prepared financial projections based on the high and low enplanement forecast scenarios. Under the high enplanement forecast, the airline cost per enplanement is projected to equal $7.46 in FY 2024, and the annual deposits to the Aviation Capital Fund are projected to reach approximately $14.7 million in FY 2024. Under the low enplanement forecast, the airline cost per enplanement is projected to equal $10.43 in FY 2024, and the annual deposits to the Aviation Capital Fund are projected to reach $11.8 million in FY 2024. Under both of the alternate enplanement scenarios, the Airport is projected to exceed the minimum debt service coverage requirement during the forecast period, with debt service coverage projected to be no less than 2.59 times debt service under the high enplanement scenario and no less than 2.48 times debt service under the low enplanement scenario.
Based on the above, we conclude that it is financially feasible to proceed with the issuance of the Series 2015 Bonds.
Sincerely,
UNISON CONSULTING, INC.
~~J~'
FINANCIAL FEASIBILITY REPORT
DALLAS LOVE FIELD AIRPORT
Prepared by:
June 8, 2015

Unison Consulting, Inc. i
DALLAS LOVE FIELD Financial Feasibility Report
June 8, 2015
TABLE OF CONTENTS
I. Introduction ………………………………………………………………………….I-1 A. The Airport ............................................................................................ I-2 1. Wright Amendment .............................................................................. I-3 2. Love Field Modernization Program ...................................................... I-4 B. The Project ............................................................................................ I-7 C. Love Field Capital Program .................................................................... I-11 II. Economic Base ........................................................................................... II-1 A. Air Service Area ...................................................................................... II-1 B. Population ........................................................................................... II-4 C. Education Attainment .............................................................................. II-9 D. Labor Market ........................................................................................ II-11 E. Employment by Industry ........................................................................ II-19 F. Top Employers and Large Company Headquarters .............................. II-22 G. Advanced Industries .............................................................................. II-24 H. Tourism ................................................................................................ II-26 I. Economic Output ................................................................................... II-29 J. Income .................................................................................................. II-30 K. Cost of Living ........................................................................................ II-32 L. National Economy ................................................................................. II-33 M. Oil Prices ............................................................................................... II-36 N. Outlook for Texas and the MSA ............................................................ II-40 O. Summary ............................................................................................... II-43 III. Aviation Activity Analysis and Forecasts .................................................. III-1 A. Current Air Service ................................................................................. III-1 B. Historical Passenger Traffic Trends ....................................................... III-2
1. Enplanement Trends at DAL and the U.S. in the Past 10 Years ....... III-4 2. Enplanement Trends at DAL, DFW, and Select Medium-Hub,
Southwest Focus Airports in the Past Five Years ............................. III-4 3. Composition of Passenger Traffic at DAL ......................................... III-7 4. Monthly Enplanements ..................................................................... III-8 5. Enplanements by Airline ................................................................... III-8 6. Top O&D Markets ........................................................................... III-12 7. Scheduled Nonstop Passenger Airline Service ............................... III-14 8. Trends in Scheduled Seats at DAL, DFW, and Select
Medium Hub, Southwest Focus Airports ......................................... III-17 9. Trends in Fares and Yields at DAL, DFW, and Select
Medium Hub, Southwest Focus Airports ......................................... III-18 10. Commercial Aircraft Landings and Landed Weight ......................... III-19

DALLAS LOVE FIELD Financial Feasibility Report
Unison Consulting, Inc. ii
C. Forecast Commercial Aviation Activity ................................................. III-21 1. Capacity-Driven, Short-Term Forecast ........................................... III-21 2. Demand-Driven, Long-Term Forecasts........................................... III-22 3. Multivariate Regression Analysis .................................................... III-22 4. Monte Carlo Simulation ................................................................... III-25 5. Terminal Capacity Constraint .......................................................... III-27
6. Recommended Base, High, and Low Enplanement Scenarios ......... III-28 7. Comparison with Other Enplanement Forecasts ............................... III-28 8. Constrained Base Forecast Details ................................................... III-30
D. Sources of Forecast Risk and Uncertainty ........................................... III-30 1. Economic Conditions ...................................................................... III-30 2. Financial Health of the U.S. Airline Industry .................................... III-32 3. Price of Jet Fuel .............................................................................. III-33 4. Southwest Airlines .......................................................................... III-35 5. Airline Economics, Competition, and Airfares ................................. III-36 6. Airline Mergers ................................................................................ III-37 7. National Security and Threat of Terrorism ...................................... III-37 8. Competition from DFW Airport ........................................................ III-37
E. Summary .............................................................................................. III-38 IV. Airport Public Parking ................................................................................ IV-1
A. Current Public Parking Facilities ........................................................... VI-1 B. Effective Supply in Garages A and B .................................................... IV-4 C. Vehicle Exits ......................................................................................... IV-5 D. Enplanements and Vehicle Exits ........................................................... IV-8 E. Vehicle Exits by Facility ....................................................................... IV-11 F. Peak Parking Occupancy .................................................................... IV-13 G. Parking Duration ................................................................................. IV-17 H. Parking Revenue ................................................................................. IV-20 I. Forecast Methodology and Scenarios ................................................. IV-22 J. Forecast Vehicle Exits and Revenue .................................................. IV-24 K. Sources of Forecast Risk and Uncertainty .......................................... IV-39 L. Summary ............................................................................................. IV-39
V. Financial Analysis ........................................................................................ V-1 A. Framework for Airport System Financial Operations .............................. V-1
1. Project Financing Agreement ............................................................ V-1 2. Indenture ........................................................................................... V-2 3. Bond Resolution ............................................................................... V-3 4. Airport Use and Lease Agreement .................................................... V-3 5. Application of Revenues ................................................................... V-6
B. Debt Service ........................................................................................... V-8 C. Operation and Maintenance (O&M) Expenses ..................................... V-10 D. Revenues ............................................................................................. V-14
1. Airline Revenues ............................................................................. V-18
DALLAS LOVE FIELD Financial Feasibility Report
Unison Consulting, Inc. iii
2. Ground Transportation Revenues ................................................... V-23 3. Terminal Building Revenues ........................................................... V-24 4. Airfield and Apron Revenues .......................................................... V-26 5. Other Buildings and Areas; Other Revenues .................................. V-26 6. Dallas Executive Airport and Heliport ............................................. V-26
E. Application of Revenues....................................................................... V-27 F. Airline Cost per Enplanement ............................................................... V-27 G. Sensitivity Analysis ............................................................................... V-29
LIST OF TABLES I-1 Estimated Costs of the Project ................................................................... I-12 I-2 Estimated Sources and Uses of Bond Proceeds ........................................ I-13 I-3 Capital Improvement Program ................................................................... I-14 I-4 Capital Improvement Program Funding Plan ............................................. I-15 I-5 Airfield Projects Considered in Master Plan Update ................................... I-16 I-6 Landside Projects Considered in Master Plan Update ............................... I-17 II-1 Commercial Service Airports Within a Two-Hour Drive from DAL ............... II-4 II-2 Population in MSA, Texas, and the United States ....................................... II-5 II-3 Top Private Employers in the MSA ........................................................... II-22 II-4 Fortune 500 Headquarters in the MSA ...................................................... II-23 II-5 Other Large Company Headquarters in the MSA ...................................... II-23 II-6 Advanced Industries with Moderate to High Concentration in the MSA .... II-24 III-1 Signatory Air Carriers at DAL ..................................................................... III-1 III-2 DAL Enplanements by Airline ................................................................... III-11 III-3 DAL’s Top 25 O&D Metro Markets in FY 2014 and FY 2015 ................... III-13 III-4 DAL Aircraft Landings by Airline ............................................................... III-20 III-5 DAL Aircraft Landed Weight by Airline ..................................................... III-20 III-6 Base Scenario Forecast Commercial Aviation Activity at DAL ................. III-31 IV-1 DAL Public Parking Rates ......................................................................... IV-3 IV-2 Off-Airport Parking Options near DAL ....................................................... IV-4 IV-3 Garage A and Garage B Effective Supply ................................................. IV-5 IV-4 DAL Enplanements and Vehicle Exits ....................................................... IV-8 IV-5 Peak Parking Occupancy in Garage A and Garage B ............................. IV-14 IV-6 Number of Days Peak Occupancy Exceeded Stated and Effective Capacities in Garage A ........................................................................... IV-16 IV-7 Number of Days Peak Occupancy Exceeded Stated and Effective Capacities in Garage B ........................................................................... IV-17 IV-8 Distribution of Vehicle Exits by Parking Duration in Garages A and B .... IV-19 IV-9 Vehicle Exits, Gross Parking Revenue and Average Revenue per Vehicle Exit, FY 2010-FY 2015 ............................................................... IV-20

DALLAS LOVE FIELD Financial Feasibility Report
Unison Consulting, Inc. iv
V-1 Projected Debt Service............................................................................. V-10 V-2 Historical O&M Expenses ......................................................................... V-11 V-3 Projected O&M Expenses ........................................................................ V-15 V-4 Historical Revenues ................................................................................. V-16 V-5 Projected Revenues ................................................................................. V-17 V-6 Projected Airline Rates and Charges ....................................................... V-19 V-7 Projected Net Revenues or Deficit in Ancillary Cost Centers ................... V-21 V-8 Projected Application of Revenues .......................................................... V-30 V-9 Projected Airline Cost per Enplanement .................................................. V-31 V-10 Summary of Financial Projections for Base, High, and Low Enplanement Forecast Scenarios ............................................................ V-32
LIST OF FIGURES I-1 Diagram of Terminal Building and Parking Garages ...................................... I-9 II-1 Texas County Map and the Dallas-Fort Worth-Arlington MSA...................... II-2 II-2 Commercial Service Airports nearest to Love Field ...................................... II-3 II-3 Population Growth in the MSA, Texas, and the U.S. .................................... II-6 II-4 Texas County Population Shares ................................................................. II-7 II-5 County Population in Texas and Neighboring States ................................... II-8 II-6 Population Distribution in the MSA< Texas, and the U.S. ............................. II-9 II-7 Population 25 Years and Older with a College or Graduate Degree In the MSA, Texas, and the U.S. ................................................................ II-10 II-8 Growth of Business Establishments in the MSA, Texas, and the U.S. ....... II-11 II-9 Growth in Number of Employees in all Business Establishments In the MSA, Texas, and the U.S. ................................................................ II-12 II-10 Total Labor Force in the MSA, Texas, and the U.S. ................................... II-13 II-11 Employed Labor Force in the MSA, Texas, and the U.S. ........................... II-14 II-12 Unemployment Rate in the MSA, Texas, and the U.S. ............................... II-15 II-13 U.S. State Unemployment Rate Map .......................................................... II-17 II-14 Texas County Unemployment Rate Map .................................................... II-18 II-15 Employment Share by Industry in the MSA, Texas, and the U.S., CY 2000-CY 2014 ...................................................................................... II-19 II-16 Employment Growth by Industry in the MSA, Texas, and the U.S., CY 2009-CY 2014 ...................................................................................... II-20 II-17 Employment Growth by Industry in the MSA, Texas, and the U.S. ............. II-21 II-18 Annual Volume of Visitors in the MSA and Texas. ..................................... II-27 II-19 Origin of Visitors to the MSA and Texas ..................................................... II-28 II-20 Visitor Spending in the MSA and the Rest of Texas ................................... II-29 II-21 Growth in Real GDP in the MSA, Texas, and the U.S. ............................... II-30 II-22 Per Capita Personal Income in the MSA, Texas, and the U.S. ................... II-31 II-23 Average Annual Pay per Employee in the MSA, Texas, and the U.S. ........ II-32 II-24 Cost of Living in Selected Urban Areas ...................................................... II-33 II-25 U.S. Real Gross Domestic Product: Percent Change from Prior Period ..... II-34

DALLAS LOVE FIELD Financial Feasibility Report
Unison Consulting, Inc. v
II-26 Historical and Forecast Growth in U.S. Real GDP ...................................... II-36 II-27 U.S. Crude Oil Price ................................................................................... II-37 II-28 U.S. Crude Oil Production .......................................................................... II-38 II-29 U.S. Energy Information Administration Short-Term Outlook U.S. Crude Oil Prices ................................................................................. II-40 II-30 U.S. States Crude Oil Production ............................................................... II-41 II-31 Mining as a Share of the State Economy for Texas, Other Oil-Producing States, and the U.S. ................................................................................... II-42 III-1 Historical Enplanement Trends at DAL ........................................................ III-3 III-2 DAL and U.S. System Enplanement Growth Trends ................................... III-5III-3 Enplanements at DAL, DFW, and Other Medium Hub Southwest Focus Airports ............................................................................ III-6 III-4 O&D and Connecting Traffic Shares ........................................................... III-7 III-5 DAL Monthly Enplanements ........................................................................ III-8 III-6 DAL Enplanements by Airline ...................................................................... III-9 III-7 DAL’s Top 25 O&D Markets in 2014 .......................................................... III-14 III-8 Trends in Scheduled Air Service at DAL ................................................... III-15 III-9 Nonstop Destinations from DAL ................................................................ III-17 III-10 Scheduled Daily Seats at DAL, DFW, and Other Medium Hub Southwest Focus Airports .......................................................................... III-18 III-11 Average Fare and Yield at DAL, DFW, and Other Medium Hug Southwest Focus Airports .......................................................................... III-19 III-12 Projected Trends in Key Demand Drivers for the Base Forecast .............. III-24 III-13 DAL Enplanement Forecasts ..................................................................... III-26 III-14 Comparison of Enplanement Forecasts for DAL ....................................... III-29 III-15 U.S. Air Carriers’ Annual Net Profit ............................................................ III-33 III-16 U.S. Jet Fuel Price and Consumer Price Index ......................................... III-34 III-17 Jet Fuel Market Price and Crude Oil Price ................................................ III-35 IV-1 Parking Facilities ........................................................................................ IV-2 IV-2 Map of Public Parking Facilities .................................................................. IV-3 IV-3 Garage A and Garage B Vehicle Exits ....................................................... IV-6 IV-4 Valet Vehicle Exits ...................................................................................... IV-7 IV-5 Annual Trends in Enplanements and Vehicle Exits .................................... IV-9 IV-6 Monthly Trends in Enplanements and Vehicle Exits ................................. IV-10 IV-7 Ratio of Vehicle Exits to Enplanements .................................................... IV-11 IV-8 Vehicle Exits by Facility ............................................................................ IV-12 IV-9 Combined Peak Parking Occupancy in Garage A and Garage B ............. IV-15 IV-10 Gross Parking Revenue by Facility ........................................................... IV-21 IV-11 Forecast Enplanements ............................................................................ IV-23 IV-12 Forecast Annual Inflation and Growth in Local Per Capita Personal Income ..................................................................................................... IV-24IV-13 Scenario 1: Base Enplanements, No Parking Rate Increase – Forecast Vehicle Exits ............................................................................................. IV-26

DALLAS LOVE FIELD Financial Feasibility Report
Unison Consulting, Inc. vi
IV-14 Scenario 1: Base Enplanements, No Parking Rate Increase – Forecast Gross Parking Revenue ........................................................................... IV-26 IV-15 Scenario 2: Base Enplanements, Parking Rates Increase with Inflation – Forecast Vehicle Exits .............................................................. IV-27 IV-16 Scenario 2: Base Enplanements, Parking Rates Increase with Inflation – Forecast Gross Parking Revenue ............................................ IV-28 IV-17 Scenario 3: High Enplanements, No Parking Rate Increase – Forecast Vehicle Exits ............................................................................................. IV-29 IV-18 Scenario 3: High Enplanements, No Parking Rate Increase – Forecast Gross Parking Revenue ........................................................................... IV-30 IV-19 Scenario 4: High Enplanements, Parking Rates Increase with Inflation – Forecast Vehicle Exits .............................................................. IV-31 IV-20 Scenario 4: High Enplanements, Parking Rates Increase with Inflation – Forecast Gross Parking Revenue ............................................ IV-32 IV-21 Scenario 5: Low Enplanements, No Parking Rate Increase – Forecast Vehicle Exits ............................................................................................. IV-33 IV-22 Scenario 5: Low Enplanements, No Parking Rate Increase – Forecast Gross Parking Revenue ........................................................................... IV-34 IV-23 Scenario 6: Low Enplanements, Parking Rates Increase with Inflation – Forecast Vehicle Exits .............................................................. IV-35 IV-24 Scenario 6: Low Enplanements, Parking Rates Increase with Inflation – Forecast Gross Parking Revenue ............................................ IV-36 IV-25 Forecast Vehicle Exits: All Scenarios ....................................................... IV-37 IV-26 Forecast Gross Parking Revenue: All Scenarios ...................................... IV-38 V-1 Application of Revenues .............................................................................. V-7

Dallas Love Field Financial Feasibility Report
Unison Consulting, Inc. I - 1 June 8, 2015
SECTION I INTRODUCTION
The Love Field Airport Modernization Corporation (LFAMC) plans to issue the Love Field Airport Modernization Corporation General Airport Revenue Bonds, Series 2015 (the Series 2015 Bonds) and one subsequent series of General Airport Revenue Bonds (GARBs) to fund the estimated capital costs of a proposed new public parking garage and related capital improvements (the Project) at Dallas Love Field (DAL, or the Airport). The City of Dallas (the City) created the LFAMC as a local government corporation for the public purpose of acting on behalf of the City in the performance of its governmental functions to promote the City, including the development of the geographic areas of the City in the vicinity of the Airport. The City and the LFAMC have negotiated and plan to execute a Project Financing Agreement, dated as of July 1, 2015, pursuant to which the LFAMC and the City have agreed to cooperate and coordinate for the financing, design, and construction of the Project. Under the provisions of the Project Financing Agreement, the LFAMC has the authority to issue the Series 2015 Bonds and one or more future series of GARBs (referred to collectively as “Bonds” in the Project Financing Agreement) to finance the Project. The LFAMC and the City have agreed to certain duties and responsibilities pursuant to the Project Financing Agreement, including the following:
� LFAMC
o Issue Bonds in the amounts necessary to finance the design and construction, and related costs, of the Project;
o Deposit funds received from the City pursuant to the Project Financing Agreement into the Pledged Revenue Fund (as defined in the Indenture described later in this Section and in Section V); and
o Pay debt service on the Bonds issued to finance the Project (and any related reserve fund deposits, fees and expenses, and any other related costs), from payments made to the LFAMC by the City pursuant to the Project Financing Agreement.
� The City
o Throughout the term of the Bonds, own and operate the Airport and to
charge and collect rates, fees, and revenues for the use and operation of the Airport, in amounts sufficient to maintain the Airport, including the Project;
o Make deposits to the GARB Debt Service Fund and the GARB Debt Service Reserve Fund (pursuant to the requirements of the Indenture and the Airport Use and Lease Agreement); and
Dallas Love Field Financial Feasibility Report
Unison Consulting, Inc. I - 2 June 8, 2015
o Pay to the LFAMC, on a monthly basis, all monies then on deposit in the
GARB Debt Service Fund.
The source of funds to meet the City’s obligation under the terms of the Project Financing Agreement to make payments to the LFAMC shall be limited to the Airport System Net Revenues. Such financial obligations of the City to the LFAMC shall not be payable from moneys raised or to be raised by taxation. Under the provisions of the “Indenture of Trust By and Between Love Field Airport Modernization Corporation and Wells Fargo Bank, National Association, as Trustee,” dated as of July 1, 2015 (the Indenture), the LFAMC has pledged to the Trustee all of the LFAMC’s rights, title, and interest in and the payments the LFAMC will receive from the City under the terms of the Project Financing Agreement, for the purpose of paying the debt service on the Series 2015 Bonds and any other GARBs issued to finance the Project. The Board of Directors of the LFAMC approved a resolution (the Bond Resolution) authorizing the issuance of the Series 2015 Bonds, in an aggregate principal amount not to exceed $130.0 million. The Bond Resolution also approved a bond purchase contract and other contract documents related to the Series 2015 Bonds. It is currently anticipated that the costs of designing and constructing the Project will be funded with the proceeds of the Series 2015 Bonds and one subsequent issue of GARBs, anticipated to be issued in 2016 (referred to as the “Series 2016 Bonds” in this Report). Together, the proceeds of the Series 2015 Bonds and the Series 2016 Bonds will be used to fund the design, planning, and construction of the Project; pay any associated costs including the funding of reserve funds, capitalized interest during construction, and costs of issuance of the Series 2015 Bonds and the Series 2016 Bonds. The total estimated cost of design and construction of the Project is approximately $179.9 million. It is currently estimated that the Series 2015 Bonds will be issued in the aggregate principal amount of approximately $110.330 million, to fund approximately $100.0 million of the estimated design and construction costs of the Project, and associated costs including the funding of reserve funds, capitalized interest, and costs of issuance of the Series 2015 Bonds. It is estimated that the Series 2016 Bonds will be issued in 2016 in the aggregate principal amount of approximately $92.755 million, to fund the remaining $79.9 million estimated cost of constructing the Project, and associated costs including the funding of reserve funds, capitalized interest, and costs of issuance of the Series 2016 Bonds. The estimated sources and uses of funds for the Series 2015 Bonds and the Series 2016 Bonds are summarized later in this section. A. THE AIRPORT The Airport is a medium hub airport serving the Dallas metropolitan region and the Dallas-Fort Worth metroplex. The Airport, which encompasses approximately 1,300 acres, is located within the Dallas city limits, approximately seven miles north of the

Dallas Love Field Financial Feasibility Report
Unison Consulting, Inc. I - 3 June 8, 2015
City’s central business district. The Airport is owned and operated by the City. The City also owns and operates Dallas Executive Airport, a general aviation reliever airport, and a downtown heliport (the Heliport). Together, the Airport, Dallas Executive Airport and the Heliport are referred to as the Dallas Airport System (the Airport System)1. The Airport System is managed and operated as a City department (the Aviation Department) under the direction of the City’s Director of Aviation. For calendar year 2013 (the latest year in which published data are available), the Airport ranked 43rd in the United States in terms of the number of passenger enplanements (DAL had approximately 4.3 million enplanements), according to statistics compiled by Airports Council International – North America (ACI-NA). In Fiscal Year 20142 the Airport accommodated almost 4.4 million enplaned passengers. In FY 2014, approximately 77 percent of Airport passengers were origination and destination (O&D) passengers (passengers who begin or end their trips at DAL) and 23 percent were connecting passengers. Southwest Airlines Co. (Southwest) is headquartered adjacent to the Airport and has operated at the Airport since Southwest began passenger service in 1971. The Airport is a principal station in the route system of Southwest, which is the dominant airline at the Airport in terms of air traffic activity. In FY 2014, Southwest accounted for 96.5 percent of total enplaned passengers at the Airport. 1. The Wright Amendment Prior to the opening of Dallas-Fort Worth International Airport (DFW) in 1974, the Airport was the principal air carrier airport serving the Dallas metropolitan region. Fort Worth was served by a separate air carrier airport. Southwest, which was not a party to the agreements related to the development of DFW, chose to continue operating its intrastate service (service within the state of Texas) at the Airport after DFW opened. The International Air Transportation Competition Act of 1979, as amended (the IATCA), imposed restrictions on air transportation to and from the Airport, following Southwest’s inauguration of interstate service (service to destinations outside the state of Texas) at the Airport. A portion of the IATCA, commonly referred to as the “Wright Amendment,” limited nonstop airline service at the Airport to other destinations within Texas and the following four neighboring states: Louisiana, Arkansas, Oklahoma, and New Mexico. The Wright Amendment also prohibited the purchase of a single airline ticket from DAL to any destination not in Texas or the four neighboring states. A person could change planes in a permitted destination, but he or she had to purchase a separate ticket from that destination to his or her final destination. In 1997, the Wright Amendment was modified by the Shelby Amendment3 to allow nonstop flights to the following three additional states (for a total of seven states): Alabama, Kansas, and Mississippi. However, “through ticketing” was still prohibited to cities on continuing flights to 1 Section V of this Report presents a financial analysis of the Airport System, which is operated by the City as one department (the Aviation Department) of the City.
2 The City’s fiscal year begins October 1st and ends the following September 30th. 3 A law introduced by Senator Richard Shelby of Alabama.

Dallas Love Field Financial Feasibility Report
Unison Consulting, Inc. I - 4 June 8, 2015
destinations outside the seven states allowed in the amended Wright Amendment. In 2005, Senator Kit Bond of Missouri attached an amendment to a transportation spending bill to permit nonstop flights to Missouri (the Bond Amendment). On July 11, 2006, the City, the City of Fort Worth, The Dallas-Fort Worth International Airport Board, Southwest and American Airlines, Inc. entered into an agreement called the “Five Party Agreement,” which stipulated, among other things, that the parties agreed to seek to eliminate the Wright Amendment restrictions on domestic air service at the Airport. On October 13, 2006, the “Wright Amendment Reform Act of 2006” was signed into law. It immediately eliminated the restriction on “through ticketing” between the Airport and cities outside the seven states, enabling passengers to purchase a single ticket for one-stop or connecting flights. It also eliminated the Wright Amendment restrictions on non-stop domestic air service at the Airport effective October 13, 2014, and it also stipulated that a new terminal at DAL would be limited to 20 gates. As of May 2015, the Airport has nonstop service to 44 destinations, 30 of which would not have been allowed under the restrictions that had been in effect under the Wright Amendment, the Shelby Amendment, and the Bond Amendment. 2. The Love Field Modernization Program In the Five Party Agreement, the City and Southwest agreed to the significant redevelopment of portions of the Airport, including the modernization of the existing terminal facilities at the Airport, a program referred to as the Love Field Modernization Program (LFMP). The LFMP, the initial cost of which totaled approximately $519 million, consists of the following major elements:
� Phased demolition of the then-existing terminal concourses;
� Phased construction of a new 20-gate T-shaped terminal concourse;
� Phased reconstruction of the apron and hydrant fuel system to serve the new concourse gates;
� Redevelopment of ticketing and baggage handling facilities, and the main ticket lobby;
� Reconfiguration of the existing terminal roadway infrastructure to align with the functional changes in the terminal layout resulting from the LFMP;
� Relocation of airfield electrical vaults; and
� Other related infrastructure improvements such as the Project, improvements to the central utility plant and construction of central receiving and Dallas Police Department facilities at the Airport.

Dallas Love Field Financial Feasibility Report
Unison Consulting, Inc. I - 5 June 8, 2015
To facilitate the development of the LFMP, the City created the LFAMC, as described earlier in this section. Subsequently, the City, the LFAMC, and Southwest entered into a program development agreement, dated January 15, 2009 (the Program Development Agreement), which provided that the City and Southwest would undertake the LFMP. It also provided that the LFAMC, at the request of Southwest, would issue bonds to finance major elements of the LFMP. The LFAMC issued the following bonds in 2010 and 2012:
� Love Field Airport Modernization Corporation Special Facilities Revenue Bonds, Series 2010, in the par amount of $310.0 million (the Series 2010 Bonds); and
� Love Field Airport Modernization Corporation Special Facilities Revenue Bonds, Series 2012, in the par amount of $146.26 million (the Series 2012 Bonds).
The City, the LFAMC, and Southwest entered into a Special Facilities Agreement which obligates Southwest to make Facilities Payments to a trustee in an amount sufficient to pay the debt service on the Series 2010 Bonds and the Series 2012 Bonds. The Series 2010 Bonds and the Series 2012 Bonds are payable from and secured by a first lien on and pledge of the Facilities Payments made by Southwest pursuant to the Special Facilities Agreement. The Series 2010 Bonds and the Series 2012 Bonds are not general obligations of the City, the State of Texas, or any other political subdivision, nor are they secured by the Airport System Net Revenues. The debt service obligations for the Series 2010 Bonds and the Series 2012 Bonds are collectively referred to in this Report as the “Obligation for Revenue Credit Agreement.” The City, the LFAMC, and Southwest entered into an Amended and Restated Lease of Terminal Building Premises (the Airport Use and Lease Agreement), which was executed February 13, 2009 and was made effective retroactively as of October 1, 2008. The Airport Use and Lease Agreement governs the operation and use of the Airport by the airlines, and contains other provisions consistent with the terms of the Five Party Agreement. The City and Southwest also entered into a revenue credit agreement (the Revenue Credit Agreement), which provides for the crediting back to Southwest of the Facilities Payments made by Southwest under the Special Facilities Agreement. This arrangement is made possible as a result of the rate making provisions of the Airport Use and Lease Agreement, which provide for the annual calculation of airline rates and charges sufficient to recover, among other things, the Obligation for Revenue Credit Agreement. While the crediting back of moneys to Southwest under the Revenue Credit Agreement is done pursuant to a contractual agreement between the City and Southwest, such revenue credits are not pledged to the payment of the Obligation for Revenue Credit Agreement. However, the economic substance of the financing transactions is that revenues generated from airline rates and charges and other Airport System sources are sufficient to reimburse Southwest for the Facilities Payments it makes under the Special Facility Agreement.

Dallas Love Field Financial Feasibility Report
Unison Consulting, Inc. I - 6 June 8, 2015
The Airport Use and Lease Agreement established priorities for the application of Airport System revenues. Airport System revenues are to be deposited into the Aviation Revenue Fund and applied first to pay O&M Expenses and any required deposits to the O&M Reserve Account; then to pay debt service on outstanding GARBs and any required deposits to the GARB Debt Service Reserve Fund. Only after these obligations are met are Airport System Revenues available to be applied to reimburse Southwest for Facilities Payments made by Southwest under the Special Facilities Agreement. Construction of the new terminal commenced in July 2009. Southwest began operating out of the new terminal building in April 20134. Construction of the new terminal was completed in May 20155. The new terminal building encompasses approximately 814,000 square feet of enclosed space, including:
� A concourse encompassing 421,000 square feet and containing 20 aircraft gates with associated passenger loading bridges, and airline equipment systems;
� A ticketing hall encompassing 39,000 square feet;
� Main terminal lobby with 140,000 square feet; and
� Baggage claim area consisting of 77,000 square feet, including four inbound baggage claim systems and two oversized baggage claim devices.
The terminal building also includes an in-line automatic explosive detection screening and baggage handling system; an efficient security checkpoint, and expanded concessions space. The Airport’s airfield includes two parallel east-west runways and a third intersecting (crosswind) runway, all served by a system of parallel taxiways. The characteristics of the three runways are summarized below:
Runway Length (feet) Width (feet) Material
13L/31R 7,752 150 Concrete13R/31L 8,800 150 Concrete
18/36 6,147 150 Asphalt 4 Twelve of the 20 gates became operational effective when Southwest began operating from the new terminal in April 2013. The remaining eight gates became operational effective October 2014, the month in which the Wright Amendment restrictions were lifted. 5 Construction work continued on the terminal after all 20 gates became operational (in October 2014), to finish certain non-public spaces, including Aviation Department office space, a conference center, and modifications in the airside of the terminal to remove a utility tunnel that had supplied the old West Concourse.

Dallas Love Field Financial Feasibility Report
Unison Consulting, Inc. I - 7 June 8, 2015
Other facilities at the Airport include an air cargo building; a U.S. Customs and Border Protection facility (formerly the Legend Airlines terminal); and a hydrant fueling system integrated into the fuel tank farm located on the west side of the Airport. B. THE PROJECT The Project consists of a planned new parking garage (Garage C) located adjacent to the ticketing lobby. Garage C will contain nine levels – two levels below grade and seven levels above grade. It is planned to have approximately 5,000 parking spaces. Garage C will supplement the existing parking garages (Garage A and Garage B). Following is the current public parking capacity at the Airport:
Garage A (short term parking) 2,980 spaces Garage B (long term parking) 4,000 spaces Valet parking 743 spaces Total public parking spaces 7,723 spaces
With the completion of Garage C, the valet parking operation will be accommodated within Garage C, and the total public parking spaces available on Airport property will increase to approximately 12,000 spaces. Based on the significant increases in air traffic activity at the Airport since the ending of the Wright Amendment restrictions, it appears that additional parking spaces are needed to accommodate the associated increase in parking demand. In FY 2015 (the Wright Amendment restrictions ended in October 2014, the beginning of FY 2015), the number of daily aircraft departures at the Airport calculated based on the airline schedules for the entire fiscal year has increased to 172, compared to 127 average daily departures in FY 2014. During the first six full months after the end of the Wright Amendment restrictions (November 2014 through March 2015), the Airport’s enplanements (approximately 2.5 million) were 46.4 percent higher than the enplanements for the six month period of November 2013 through March 2014 (approximately 1.7 million). A diagram of the terminal building and the parking garages (including the planned Garage C) is presented in Figure I-1. In addition to Garage C, the Project includes the associated components listed below6. It is anticipated that all of the planning, design and construction costs of the Project (approximately $179.9 million, including all the associated components listed below), will be funded with the proceeds of the Series 2015 Bonds and the Series 2016 Bonds. Approximately $8.0 million of preliminary planning and design costs (which are included in the total estimated cost of the Project) are being funded from Aviation Department funds, which will be reimbursed from the proceeds of the Series 2015 Bonds.
6 Information obtained from the Love Field Modernization Program 2, Parking Garage C, Preliminary Program Definition Document, dated April 20, 2015.

Dallas Love Field Financial Feasibility Report
Unison Consulting, Inc. I - 8 June 8, 2015
� Enabling projects – the demolition and/or relocation of various existing facilities that are currently located on the site of the planned Garage C; a new revenue control system; and a parking guidance system, which are described in more detail below:
o Cell phone lot redevelopment – a surface parking lot will be developed in the former Gulfstream parking area to accommodate short-term parking for persons with vehicles waiting to pick up passengers. This project will include modifications to curbs and site drainage structures, storm water piping, pole mounted lighting, surface lot paving repairs, and modifications, pavement markings, way-finding signage for the cell phone lot, an outdoor Flight Information Display System (FIDS), and landscaping.
o Demolition of the East Satellite Building (ESB), including an assessment and environmental remediation of hazardous materials contained within the ESB.
o Relocation of utility lines around the footprint of Garage C.
o Parking Revenue Control System to be installed in Garages A, B, and C. The new system will replace the existing systems in Garages A and B.
o Parking Guidance System will be installed in Garages A, B, and C. This
component includes the implementation of an interim system for Garages A and B, which is planned to be operational by November 2015 (prior to the completion of Garage C).
o Tenant finish-out of temporary offices for the Dallas Police Department (DPD) and the Airport Operations division. These temporary offices, which will be located in the modular building formerly occupied by Aviation Department staff, will be in use during construction of the Project. The Project includes the development of a two-story building for permanent offices for DPD and Airport Operations, to be located adjacent to Garage C.
o Tenant finish-out offices in the terminal and in modular buildings, for various
functions that are currently housed in buildings located within the footprint of Garage C, including the Program Management Team, the Airport Communications Center, the Department’s Information Technology (IT) division, contract security personnel, and the Airport’s Badging office.

Dallas Love Field Financial Feasibility Report
Unison Consulting, Inc. I - 9 June 8, 2015
Figure I-1 DIAGRAM OF TERMINAL BUILDING AND PARKING GARAGES

Dallas Love Field Financial Feasibility Report
Unison Consulting, Inc. I - 10 June 8, 2015
� Elevated pedestrian corridor – an air conditioned interior corridor connecting
Garage C to the terminal building. The corridor will be located on the southwest façade of Garage C, elevated above Aviation Place. This component will include all terminal building modifications necessary to accommodate the attachment of the pedestrian corridor to the terminal building. The improvements will include structural modifications to the ticket lobby roof and the rerouting of existing cabling and mechanical systems that may interfere with the site below.
� Vertical circulation corridors – two vertical circulation cores, each with two elevators and one set of stairs, to join to the elevated pedestrian corridor. One core will be located directly south of the ticketing hall, and the other directly north of the ticketing hall.
� Vehicular exit roadway bridge – a vehicular bridge connecting to the third level of Garage C and also connecting with the existing road structure at ground level on the south side of Garage B. This component includes modifications to the existing underground drainage systems, the replacement of existing pavements with new pavement, way-finding signage related to the vehicular exit roadway bridge, supported roadway lighting, landscaping, a retaining wall, and pavement markings.
� Way-finding signage – to provide signage within the terminal building and in Garage C, the vertical circulation cores, and the elevated pedestrian corridor, to direct passengers to and from Garage C.
� Realignment of Aviation Place – re-pavement of the road to run south of Garage C.
� Valet operations and canopy – a valet operations area and booth to house the valet parking operations adjacent to the ticketing hall. A canopy will be constructed to cover patrons walking to and from the valet parking area.
� Landscaping – new landscaping features in several areas surrounding Garage C.
� A performance stage in the terminal concourse. The estimated design and construction costs of the Project are summarized on Table I-1. As described above, it is anticipated that the costs of the Project will be funded with the proceeds of the Series 2015 Bonds and the Series 2016 Bonds, as summarized on Table I-2. It is anticipated that the proceeds of the Series 2015 Bonds will fund the costs of the enabling projects, the cost of the Garage C foundation, and a significant portion of the rest of the cost of Garage C. Once the costs of the entire Project are refined (during construction), the amount of funding needed from the Series 2016 Bonds will be determined more precisely.

Dallas Love Field Financial Feasibility Report
Unison Consulting, Inc. I - 11 June 8, 2015
C. LOVE FIELD CAPITAL PROGRAM In addition to the Project, the Aviation Department has a Capital Improvement Program (CIP), which consists of various airfield capital projects intended to maintain existing airfield facilities and accommodate anticipated future demand at the Airport. The most current CIP, which covers the six-year period of FY 2015 through FY 2020, was submitted to the Federal Aviation Administration (FAA) on April 24, 2015 (summarized on Table I-3). The total estimated cost of the CIP is approximately $187.2 million. The anticipated funding sources for the CIP are FAA Airport Improvement Program (AIP) entitlement grants, AIP discretionary funds, Passenger Facility Charges (PFCs), and Aviation Department funds (summarized on Table I-4). The Aviation Department is also in the process of preparing a Master Plan update, which has not been finalized as of the date of this Report. In addition to the airfield capital projects that are included in the CIP, the Master Plan contemplates airfield capital projects during FY 2021 through FY 2024, and various non-airfield, or landside, projects through FY 2024. The airfield capital projects contemplated in the Master Plan, for FY 2021 through FY 2024 (the years subsequent to those covered by the Aviation Department’s current CIP, which consists of airfield capital projects), generally consist of pavement reconstruction and modification projects, are summarized on Table I-5. The Master Plan update contemplates funding the airfield projects with AIP grants, PFCs, Department funds, and future GARBs. The landside capital projects, their estimated costs, and the timing of the projects have not yet been finalized. The landside capital projects being contemplated in the Master Plan, for FY 2015 through FY 2024 (summarized on Table I-6)7, include Airport roadway improvements, lighting improvements for parking facilities, and General Aviation facilities (primarily hangars). The Master Plan update contemplates funding the landside projects with Aviation Department funds, City funds other than Aviation Department funds (for certain roadway improvements) and tenant/developer funds (for General Aviation hangars). The estimated effects of the amortization charges and debt service on future GARBs for projects included in the Department’s capital program are incorporated into the financial analysis presented in Section IV.
7 Table I-5 presents the airfield projects in the Master Plan for the years subsequent to the CIP (FY 2021 through FY 2025). Because the CIP includes only airfield projects, all of the Master Plan landside projects are presented on Table I-6, which are planned for FY 2015 through FY 2024.

Dallas Love Field Financial Feasibility Report
Unison Consulting, Inc. I - 12 June 8, 2015
Table I-1 ESTIMATED COSTS OF THE PROJECT 8
Project Component Planning Enabling Garage Roads/Bridges Other Projects TotalDesign Services $561,105 $595,860 $8,257,255 $844,889 $1,167,656 $11,426,765Construction
Utility Relocations 1,548,750 1,548,750Temporary Office Relocations 3,228,000 3,228,000ESB Abatement and Demolition 1,500,000 1,500,000Garage Construction 199,159 78,954,628 79,153,787Terminal Connecion behind T icket Hall 3,500,000 3,500,000Moving Walkway Corridor 4,000,000 4,000,000Aviation Place Roadway Reconstruction 1,819,900 1,819,900Vehicle Bridge 5,250,000 5,250,000Roadway Improvements 1,830,100 1,830,100Valet Parking Drop Off / Pick Up 3,250,000 3,250,000Revenue Control in Garages A & B 2,300,000 2,300,000Parking Guidance in Garages A & B 1,250,000 1,250,000Cell Phone Lot and Fountain Relocation 1,000,000 1,000,000Ticket Hall Expansion 2,000,000 2,000,000DPD / Ops Building 2,500,000 2,500,000
General Condition and Site Support 1,077,353 14,839,235 1,527,613 2,111,195 19,555,396Insurance, Permits, Contingency, & Fees 852,540 11,742,714 1,208,844 1,670,651 15,474,749Program Management 211,086 569,823 6,928,630 782,989 803,327 9,295,855Owner's Contingency Allowance 550,924 7,588,307 781,172 1,079,597 10,000,000Totals $971,350 $9,923,250 $135,810,769 $14,045,507 $19,132,426 $179,883,302
8 Source: Love Field Modernization Program 2 Parking Garage C, Preliminary Program Definition Document, April 20, 2015. It is anticipated that the proceeds of the Series 2015 Bonds will fund the costs of the enabling projects, the cost of the Garage C foundation, and a significant portion of the rest of the cost of Garage C. Once the costs of the entire Project are refined (during construction), the amount of funding needed from the Series 2016 Bonds will be determined more precisely.

Dallas Love Field Financial Feasibility Report
Unison Consulting, Inc. I - 13 June 8, 2015
Table I-2 ESTIMATED SOURCES AND USES OF BOND PROCEEDS
SERIES 2015 BONDS AND SERIES 2016 BONDS
Series 2015 Bonds
Series 2016 Bonds 1 Total
Sources of FundsPar Amount $110,330,000 $92,755,000 $203,085,000Bond Premium 12,663,076 4,913,154 17,576,230Total Sources of Funds $122,993,076 $97,668,154 $220,661,230
Uses of FundsProject Fund $100,000,000 $80,000,000 $180,000,000Debt Service Reserve Fund 9,338,500 7,850,375 17,188,875Capitalized Interest Fund 12,550,038 8,889,021 21,439,059Cost of Issuance 551,650 463,775 1,015,425Underwriter Discount 551,650 463,775 1,015,425Additional Proceeds 1,239 1,208 2,447Total Uses of Funds $122,993,077 $97,668,154 $220,661,231
Source: First Southwest Company.1 A future series of GARBs, estimated to be issued in 2016.

Dallas Love Field Financial Feasibility Report
Unison Consulting, Inc. I - 14 June 8, 2015
Table I-3
DALLAS LOVE FIELD CAPITAL IMPROVEMENT PROGRAM
Fiscal Years Ending September 30Project 2015 2016 2017 2018 2019 2020 Total
Rehabilitate Airfield Pavements $1,403,890 $13,218,139 $3,820,322 $26,859,506 $9,659,947 $2,858,982 $57,820,786Crossfield Geometry Reconfiguration 500,000 2,467,161 12,615,640 10,000,000 25,582,801Drainage Master Plan 2,000,000 10,000,000 12,000,000Runway 18-36 Conversion 833,504 5,355,948 2,284,506 8,473,958Taxicab Queuing Lot 575,000 5,025,000 5,600,000Airport Perimeter Road Rehabilitation 1,000,000 4,000,000 5,000,000Runway Holding Position Relocation 3,400,000 3,400,000Security Controls Enhancements 999,618 1,825,000 2,824,618ARFF Trucks 2,000,000 2,000,000Relocate Runway 31R Glideslope 450,000 750,000 1,200,000Stormwater Drainage Improvements 200,000 1,000,000 1,200,000Subtotal $7,912,012 $31,874,087 $13,321,989 $39,475,146 $29,659,947 $2,858,982 $125,102,163LFMP Apron and Fuel System 26,248,616 17,900,000 17,900,000 62,048,616Total Airfield Capital Projects $34,160,628 $49,774,087 $31,221,989 $39,475,146 $29,659,947 $2,858,982 $187,150,779
Source: City of Dallas, Department of Aviation, Dallas Love Field 5-Year Airside Capital Improvement Program , April 24, 2015.

Dallas Love Field Financial Feasibility Report
Unison Consulting, Inc. I - 15 June 8, 2015
Table I-4 DALLAS LOVE FIELD
CAPITAL IMPROVEMENT PROGRAM FUNDING PLAN
Total AIP GrantsAviation
Department TotalProject Cost Entitlements Discretionary PFCs Funds Funds
Rehabilitate Airfield Pavements $57,820,786 $4,169,237 $5,497,414 $31,275,924 $16,878,208 $57,820,783Crossfield Geometry Reconfiguration 25,582,801 2,364,975 7,135,025 8,580,986 7,501,815 25,582,801Drainage Master Plan 12,000,000 12,000,000 12,000,000Runway 18-36 Conversion 8,473,958 4,000,000 4,473,958 8,473,958Taxicab Queuing Lot over Tom Braniff Channell 5,600,000 5,600,000 5,600,000Airport Perimeter Road Rehabilitation 5,000,000 5,000,000 5,000,000Runway Holding Position Relocation 3,400,000 900,000 2,500,000 3,400,000Security Controls Enhancements 2,824,618 825,000 1,999,618 2,824,618ARFF Trucks 2,000,000 1,038,550 500,000 461,450 2,000,000Relocate Runway 31R Glideslope 1,200,000 1,200,000 1,200,000Stormwater Drainage Improvements 1,200,000 1,200,000 1,200,000Subtotal $125,102,163 $8,472,762 $12,632,439 $58,381,910 $45,615,049 $125,102,160LFMP Apron and Fuel System 62,048,616 2,700,000 21,000,000 38,348,616 0 62,048,616Total CIP $187,150,779 $11,172,762 $33,632,439 $96,730,526 $45,615,049 $187,150,776
Source: City of Dallas, Department of Aviation, Dallas Love Field 5-Year Airside Capital Improvement Program , April 24, 2015.
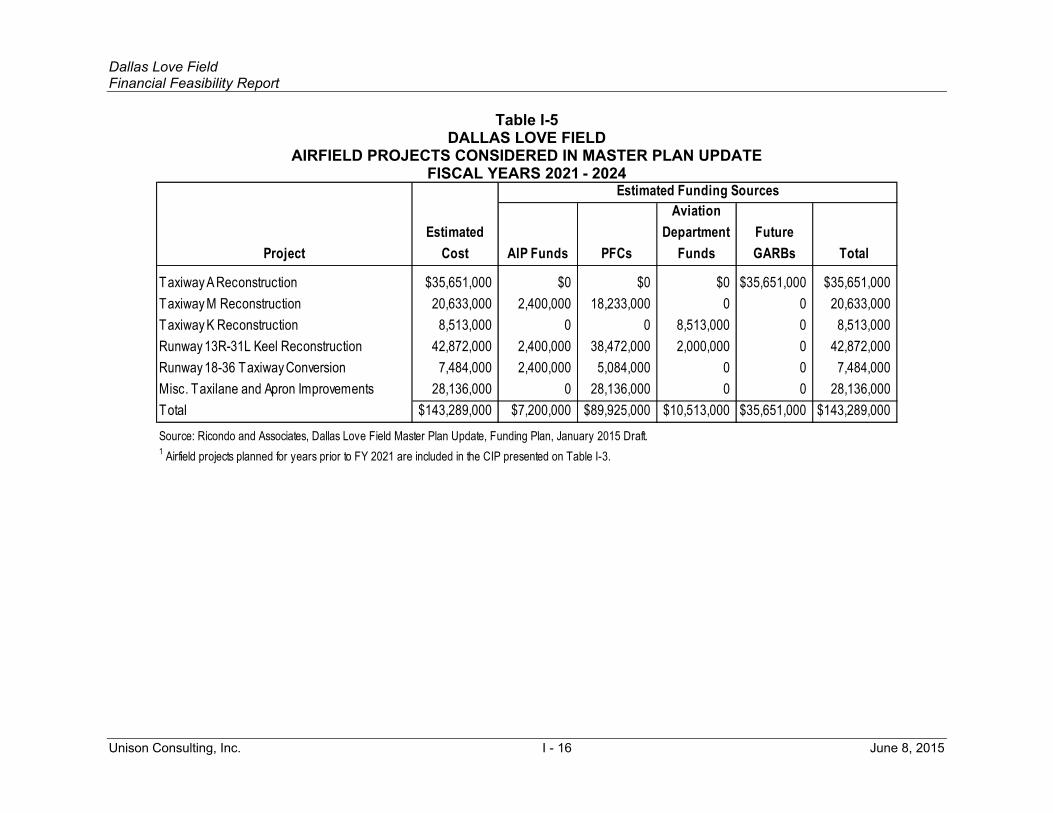
Dallas Love Field Financial Feasibility Report
Unison Consulting, Inc. I - 16 June 8, 2015
Table I-5 DALLAS LOVE FIELD
AIRFIELD PROJECTS CONSIDERED IN MASTER PLAN UPDATE
FISCAL YEARS 2021 - 2024 Estimated Funding Sources
ProjectEstimated
Cost AIP Funds PFCs
Aviation Department
FundsFuture GARBs Total
Taxiway A Reconstruction $35,651,000 $0 $0 $0 $35,651,000 $35,651,000Taxiway M Reconstruction 20,633,000 2,400,000 18,233,000 0 0 20,633,000Taxiway K Reconstruction 8,513,000 0 0 8,513,000 0 8,513,000Runway 13R-31L Keel Reconstruction 42,872,000 2,400,000 38,472,000 2,000,000 0 42,872,000Runway 18-36 Taxiway Conversion 7,484,000 2,400,000 5,084,000 0 0 7,484,000Misc. Taxilane and Apron Improvements 28,136,000 0 28,136,000 0 0 28,136,000Total $143,289,000 $7,200,000 $89,925,000 $10,513,000 $35,651,000 $143,289,000
1 Airfield projects planned for years prior to FY 2021 are included in the CIP presented on Table I-3.Source: Ricondo and Associates, Dallas Love Field Master Plan Update, Funding Plan, January 2015 Draft.
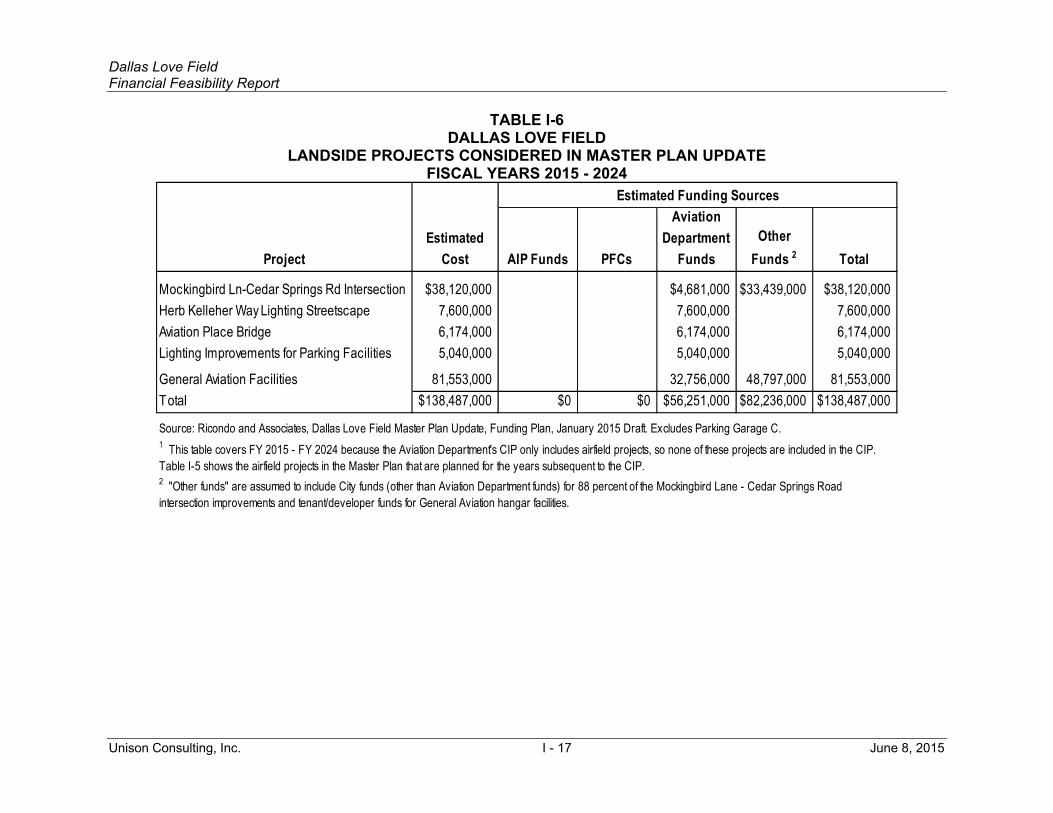
Dallas Love Field Financial Feasibility Report
Unison Consulting, Inc. I - 17 June 8, 2015
TABLE I-6 DALLAS LOVE FIELD
LANDSIDE PROJECTS CONSIDERED IN MASTER PLAN UPDATE FISCAL YEARS 2015 - 2024
Estimated Funding Sources
ProjectEstimated
Cost AIP Funds PFCs
Aviation Department
FundsOther
Funds 2 Total
$38,120,000 $4,681,000 $33,439,000 $38,120,000Herb Kelleher Way Lighting Streetscape 7,600,000 7,600,000 7,600,000Aviation Place Bridge 6,174,000 6,174,000 6,174,000Lighting Improvements for Parking Facilities 5,040,000 5,040,000 5,040,000
General Aviation Facilities 81,553,000 32,756,000 48,797,000 81,553,000Total $138,487,000 $0 $0 $56,251,000 $82,236,000 $138,487,000
2 "Other funds" are assumed to include City funds (other than Aviation Department funds) for 88 percent of the Mockingbird Lane - Cedar Springs Road intersection improvements and tenant/developer funds for General Aviation hangar facilities.
Mockingbird Ln-Cedar Springs Rd Intersection
Source: Ricondo and Associates, Dallas Love Field Master Plan Update, Funding Plan, January 2015 Draft. Excludes Parking Garage C.1 This table covers FY 2015 - FY 2024 because the Aviation Department's CIP only includes airfield projects, so none of these projects are included in the CIP. Table I-5 shows the airfield projects in the Master Plan that are planned for the years subsequent to the CIP.

DALLAS LOVE FIELD Financial Feasibility Report
Unison Consulting, Inc. II-1 June 8, 2015
SECTION II ECONOMIC BASE
Demographic and economic trends influence the demand for air travel through DAL, serving largely origin and destination (O&D) passenger traffic.1 Trends in the Airport’s air service area and the state of Texas contribute to the area’s potential to generate local demand for air travel and draw visitors. National trends determine demand for air travel nationwide and influence regional economic trends. This section discusses relevant demographic and economic trends in the Airport service area, Texas and the United States. It also provides an assessment of the outlook of both the regional and national economy. Demographic and economic trends show that Texas and the Airport’s air service area, Dallas-Fort Worth-Arlington Metropolitan Statistical Area (MSA), have been growing rapidly since the mid-2000s. While the recent oil boom—spurred by technology advances in shale drilling—contributed to the recent expansion, non-energy service-providing sectors—education and health services, leisure and hospitality, and professional and business services—are driving much of the growth in Texas and more so in the more economically diverse MSA. Set back only mildly by the Great Recession, overall growth in Texas and the MSA—since 2000 and since the end of the Great Recession in 2009—has outpaced national growth by a wide margin. This growth momentum is expected to continue, although the cuts in capital budgets and workforces in the oil industry, facing falling oil prices, are expected to slow the pace of growth in Texas and the MSA. Continued growth in the U.S. economy, which stands to reap net gains from falling oil prices, will support the growth momentum in Texas and the MSA. A. AIR SERVICE AREA Located in North Central Texas, the Airport’s primary service area covers thirteen counties in the MSA: Collin, Dallas, Denton, Ellis, Hunt, Kaufman, and Rockwall in the Dallas-Plano-Irving, TX, Metropolitan Division; and Hood, Johnson, Parker, Somervell, Tarrant, and Wise in the Fort Worth-Arlington, TX, Metropolitan Division (Figure II-1).2 The MSA has two principal cities: Dallas and Fort Worth. The MSA, often referred to as the Dallas-Fort Worth Metroplex, covers 9,640 square miles—larger than the states of Rhode Island and Connecticut combined.
1 O&D passenger traffic refers to passenger trips originating or ending in the area. 2 Office of Management and Budget, “Revised Delineations of Metropolitan Statistical Areas, Micropolitan Statistical Areas, and Combined Statistical Areas, and Guidance on Uses of the Delineations in These Areas,” OMB Bulletin No. 13-01, February 28, 2013, <http://www.whitehouse.gov/sites/default/files/omb/ bulletins/2013/b-13-01.pdf>.
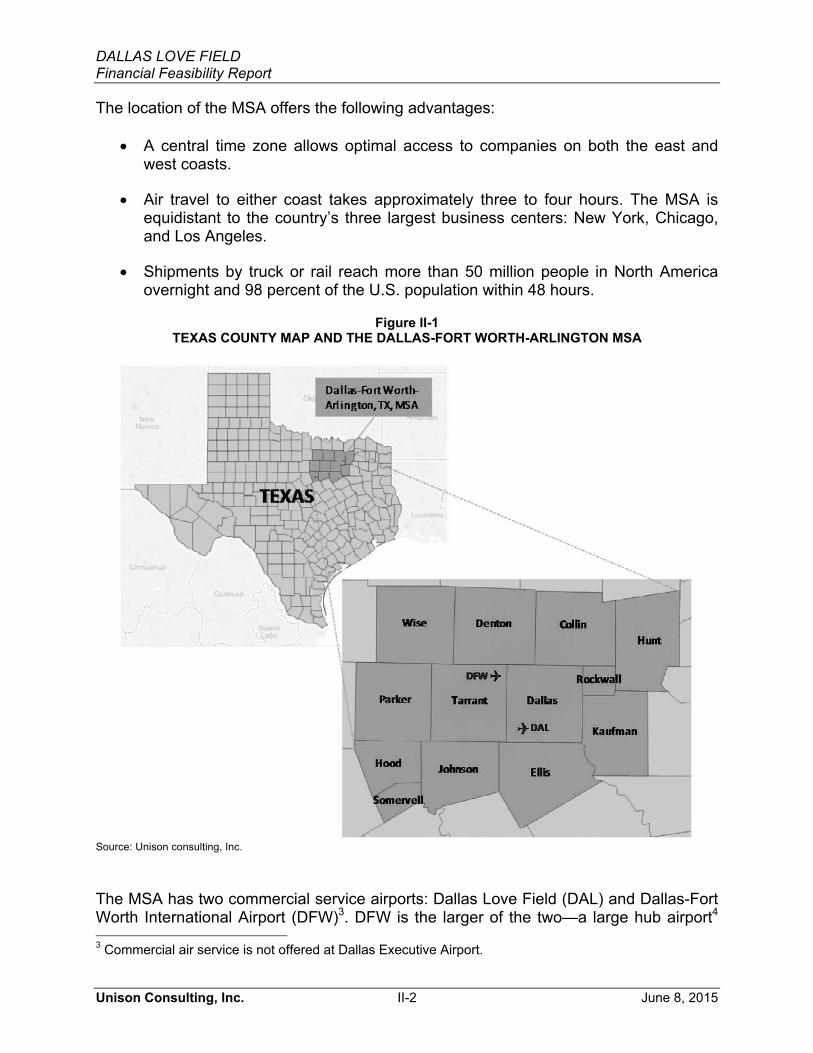
DALLAS LOVE FIELD Financial Feasibility Report
Unison Consulting, Inc. II-2 June 8, 2015
The location of the MSA offers the following advantages:
� A central time zone allows optimal access to companies on both the east and west coasts.
� Air travel to either coast takes approximately three to four hours. The MSA is equidistant to the country’s three largest business centers: New York, Chicago, and Los Angeles.
� Shipments by truck or rail reach more than 50 million people in North America overnight and 98 percent of the U.S. population within 48 hours.
Figure II-1 TEXAS COUNTY MAP AND THE DALLAS-FORT WORTH-ARLINGTON MSA
Source: Unison consulting, Inc. The MSA has two commercial service airports: Dallas Love Field (DAL) and Dallas-Fort Worth International Airport (DFW)3. DFW is the larger of the two—a large hub airport4 3 Commercial air service is not offered at Dallas Executive Airport.

DALLAS LOVE FIELD Financial Feasibility Report
Unison Consulting, Inc. II-3 June 8, 2015
with 29 million enplanements in CY 2013, compared with medium hub5 DAL’s 4 million.6 Located in Dallas County, in the city of Dallas, DAL is closer to downtown Dallas—less than 6 miles—than DFW, which is located in Tarrant County, 16 miles northwest of DAL and more than 20 miles from downtown Dallas. Outside the MSA, only two airports are less than a two-hour drive from DAL: Tyler Pounds Regional Airport in Smith County, Texas; and Waco Regional Airport in McLennan County, Texas (Figure II-2 and Table II-1). These are much smaller nonhub airports,7 each enplaning less than 100,000 passengers annually.
Figure II-2 COMMERCIAL SERVICE AIRPORTS NEAREST TO LOVE FIELD
The red bubble markers are sized relative to the Airport’s total enplanements in CY 2013. Sources: Federal Aviation Administration and Google Maps.
4 By FAA classification, a large hub airport handles 1 percent or more of annual U.S. enplanements. 5 A medium hub airport handles 0.25 percent to 0.99 percent of annual U.S. enplanements. 6 Enplanement figures are from the FAA report on Enplanements at All Commercial Airports (by Rank) for calendar year 2013. 7 A nonhub airport handles more than 10,000 annual enplanements but less than 0.05 of annual U.S. enplanements.

DALLAS LOVE FIELD Financial Feasibility Report
Unison Consulting, Inc. II-4 June 8, 2015
Table II-1 COMMERCIAL SERVICE AIRPORTS WITHIN A TWO-HOUR DRIVE FROM DALLAS LOVE FIELD
Sources: Federal Aviation Administration and Google Maps. Beyond a two-hour drive, the closest airport with comparable annual enplanements to DAL is Austin-Bergstrom International (AUS) in Austin, Texas. A medium hub airport like DAL, AUS served 4.9 million enplanements in CY 2013. AUS, however, is located 214 miles south of DAL, over a three-hour drive away. B. POPULATION The MSA offers a large and rapidly growing market for air travel. Its population of 7 million in mid-2014 is the fourth largest metropolitan area population in the country—behind the populations of the New York, Los Angeles and Chicago metropolitan areas. Since 2000, it has grown an average 2 percent a year, more than twice the national rate (0.9 percent) (Table II-2). The entire state’s population growth, which has been averaging 1.8 percent per year, is only slightly behind the MSA’s. Over the entire period from 2000 to 2014, the MSA population increased a total 33 percent, compared with 13 percent for the United States and 29 percent for the state (Figure II-3).
CY 2013Airport Enplanements City State Miles Time
Dallas Love Field (DAL) 4,023,779 Dallas TX N/A N/A
Dallas/Fort Worth International (DFW) 29,038,128Between Dallas and Fort Worth TX 16 20 minutes
Tyler Pounds Regional (TYR) 85,789 Tyler TX 100 1 hour 40 minutesWaco Regional (ACT) 62,634 Waco TX 104 1 hour 37 minutes
Drive from DAL

DALLAS LOVE FIELD Financial Feasibility Report
Unison Consulting, Inc. II-5 June 8, 2015
Table II-2 POPULATION IN DFW MSA, TEXAS, AND THE UNITED STATES
CY 2000-2014
Source: U.S. Census Bureau mid-year population estimates.
Area2000-2014
Dallas-Fort Worth-Arlington MSA Collin County 499,118 885,241 4.2% Dallas County 2,220,848 2,518,638 0.9% Denton County 438,791 753,363 3.9% Ellis County 112,330 159,317 2.5% Hood County 41,323 53,921 1.9% Hunt County 76,932 88,493 1.0% Johnson County 127,627 157,456 1.5% Kaufman County 72,270 111,236 3.1% Parker County 89,159 123,164 2.3% Rockwall County 43,755 87,809 5.1% Somervell County 6,940 8,694 1.6% Tarrant County 1,456,919 1,945,360 2.1% Wise County 49,373 61,638 1.6%
Total - Dallas-Fort Worth-Arlington MSA 5,235,385 6,954,330 2.0%
Texas 20,944,499 26,956,958 1.8%United States 282,162,411 318,857,056 0.9%
Growth RateAverage Annual
2000 2014
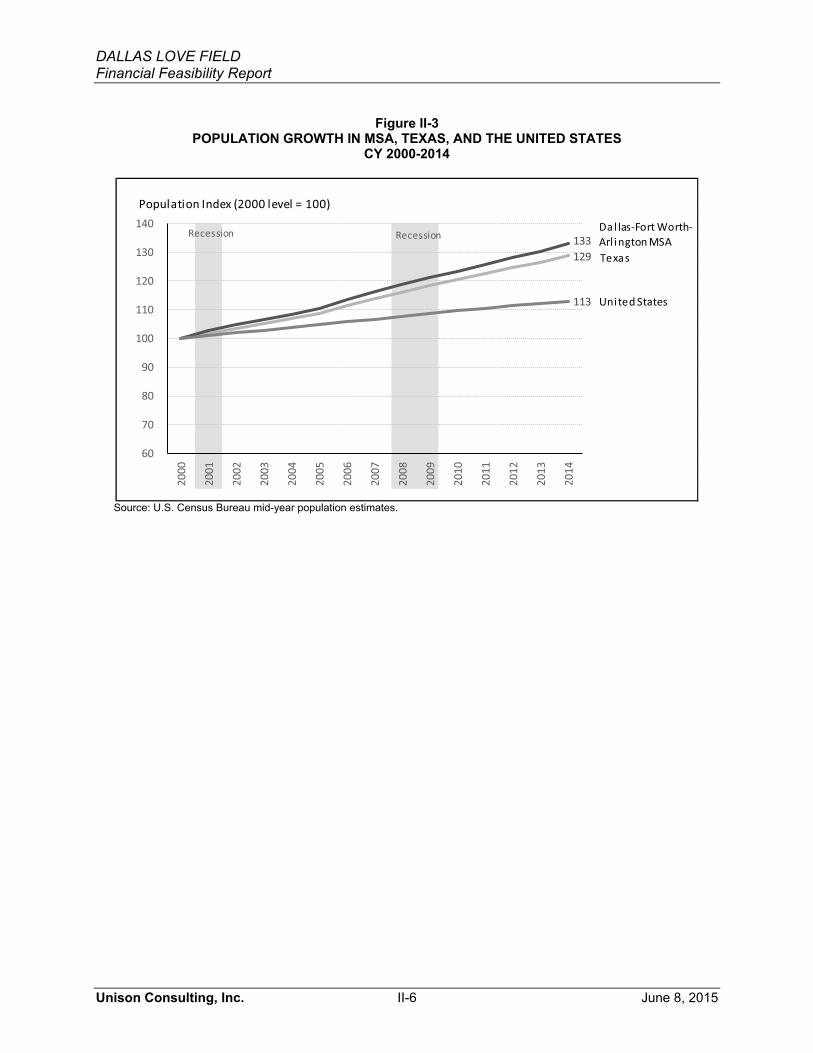
DALLAS LOVE FIELD Financial Feasibility Report
Unison Consulting, Inc. II-6 June 8, 2015
Figure II-3
POPULATION GROWTH IN MSA, TEXAS, AND THE UNITED STATES CY 2000-2014
Source: U.S. Census Bureau mid-year population estimates.
RecessionRecession
United�States
Dal las�Fort�Worth�Arl ington�MSATexas129
133
113
60
70
80
90
100
110
120
130
140
2000
2001
2002
2003
2004
2005
2006
2007
2008
2009
2010
2011
2012
2013
2014
Population�Index�(2000�level�=�100)

DALLAS LOVE FIELD Financial Feasibility Report
Unison Consulting, Inc. II-7 June 8, 2015
In 2014, the MSA population accounted for 26 percent of the state population (Figure II-4). Of the thirteen counties in the MSA, Dallas is the largest in the MSA and the second largest in the state (behind Harris County, where Houston is located). In 2014 Dallas County accounted for nearly 36 percent of the MSA population and 9 percent of the state population.
Figure II-4 TEXAS COUNTY POPULATION SHARES
CY 2014
Source: U.S. Bureau of the Census mid-year population estimates.
All other Texas counties
74%
Dallas9%
Tarrant7%
Collin3%
Denton3%
Others 3%
Dallas-Fort Worth-Arlington
MSA26%
By County
TEXAS POPULATION

DALLAS LOVE FIELD Financial Feasibility Report
Unison Consulting, Inc. II-8 June 8, 2015
The MSA’s Collin, Dallas, Denton and Tarrant counties have among the highest concentration of population in the state. The city of Fort Worth is in Tarrant County. Population levels fall quickly in counties outside the MSA (Figure II-5).
Figure II-5 COUNTY POPULATION IN TEXAS AND NEIGHBORING STATES
CY 2014
The shading indicates the relative 2014 county population size, which ranges from 86 in Loving County, Texas, to 4,441,370 in Harris County, Texas. Source: Unison Consulting, Inc., using U.S. Census Bureau mid-year population estimates.
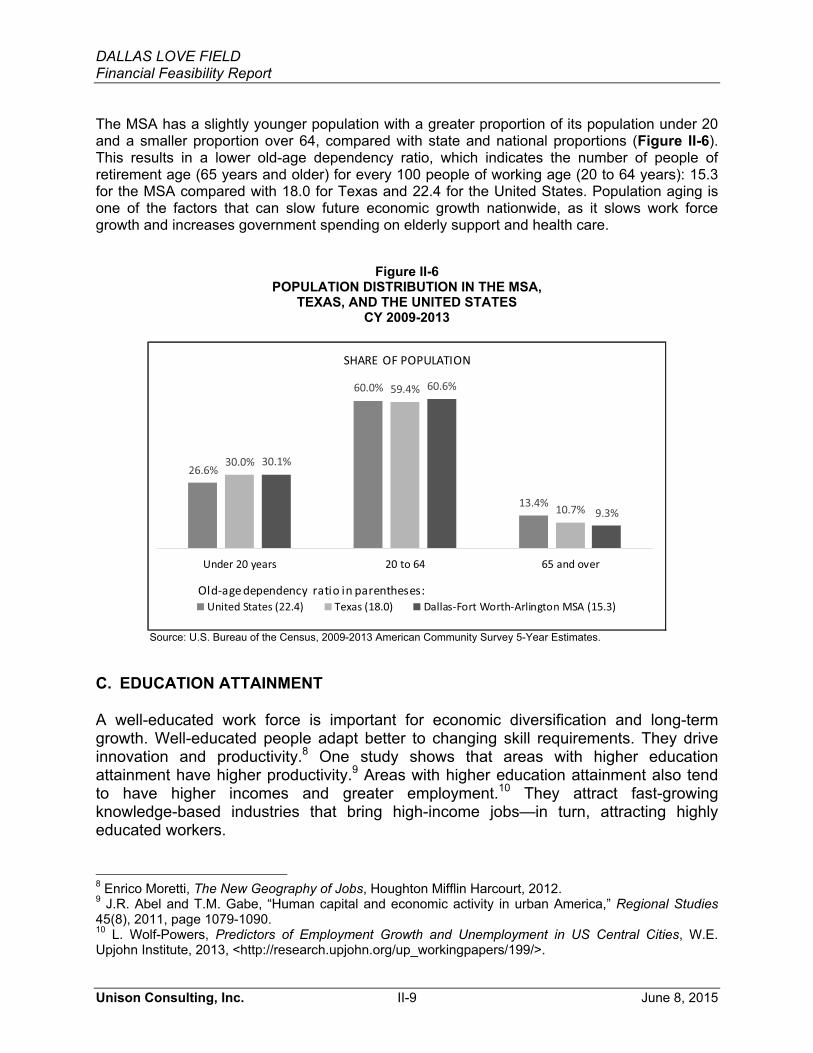
DALLAS LOVE FIELD Financial Feasibility Report
Unison Consulting, Inc. II-9 June 8, 2015
The MSA has a slightly younger population with a greater proportion of its population under 20 and a smaller proportion over 64, compared with state and national proportions (Figure II-6). This results in a lower old-age dependency ratio, which indicates the number of people of retirement age (65 years and older) for every 100 people of working age (20 to 64 years): 15.3 for the MSA compared with 18.0 for Texas and 22.4 for the United States. Population aging is one of the factors that can slow future economic growth nationwide, as it slows work force growth and increases government spending on elderly support and health care.
Figure II-6 POPULATION DISTRIBUTION IN THE MSA,
TEXAS, AND THE UNITED STATES CY 2009-2013
Source: U.S. Bureau of the Census, 2009-2013 American Community Survey 5-Year Estimates.
C. EDUCATION ATTAINMENT A well-educated work force is important for economic diversification and long-term growth. Well-educated people adapt better to changing skill requirements. They drive innovation and productivity.8 One study shows that areas with higher education attainment have higher productivity.9 Areas with higher education attainment also tend to have higher incomes and greater employment.10 They attract fast-growing knowledge-based industries that bring high-income jobs—in turn, attracting highly educated workers. 8 Enrico Moretti, The New Geography of Jobs, Houghton Mifflin Harcourt, 2012. 9 J.R. Abel and T.M. Gabe, “Human capital and economic activity in urban America,” Regional Studies 45(8), 2011, page 1079-1090. 10 L. Wolf-Powers, Predictors of Employment Growth and Unemployment in US Central Cities, W.E. Upjohn Institute, 2013, <http://research.upjohn.org/up_workingpapers/199/>.
26.6%
60.0%
13.4%
30.0%
59.4%
10.7%
30.1%
60.6%
9.3%
Under�20�years 20�to�64 65�and�over
United�States�(22.4) Texas�(18.0) Dallas�Fort�Worth�Arlington�MSA�(15.3)Old�age dependency� ratio�in�parentheses:
SHARE� OF�POPULATION

DALLAS LOVE FIELD Financial Feasibility Report
Unison Consulting, Inc. II-10 June 8, 2015
Relative to the nation and the state, the MSA has a higher share of college and graduate degree holders among residents 25 and older, although it has a lower share than the nation of residents with at least a high school diploma (Figure II-6). Focusing only on the 25 to 34 age group, the MSA matches the national share of college and graduate degree holders and maintains an advantage over the rest of the state (Figure II-7).
Figure II-7 POPULATION 25 YEARS AND OLDER WITH A COLLEGE OR GRADUATE DEGREE
IN THE MSA, TEXAS, AND THE UNITED STATES CY 2009-2013
Source: U.S. Census Bureau, 2009-2013 American Community Survey 5-Year Estimates.
Firms in knowledge-based industries prefer to locate in areas with a large pool of well-educated young workers, as do start-ups and young firms.11 The large presence of advanced business sectors in the MSA will continue to attract young, highly educated workers. In particular, Dallas and Tarrant counties have above-U.S. average to high concentrations of businesses in biotech & life sciences, information & electronics, professional services, financial services, aerospace & aviation, industrial manufacturing, petroleum & chemical products, logistics & transportation, and food & beverage processing.12 Above-average concentration means that the industry’s share of the area’s employment is 20 percent to 99 percent more than the industry’s national share, and high concentration means having at least double the national share.
11 Joe Cortright, “The Young and the Restless and the Nation’s Cities,” CityReport, October 2014, <http://cityobservatory.org/wp-content/uploads/2014/10/YNR-Report-Final.pdf>. 12 Texas Industry Concentrations, Texas Office of the Governor, Economic Development and Tourism, 2012, <https://texaswideopenforbusiness.com/sites/default/files/02/25/15/concentrations.pdf>.
86.0%
28.8%
81.2%
26.7%
83.8%
31.7%
High�school�graduate�or�higher Bachelor's�degree�or�higher
United�States Texas Dallas�Fort�Worth�Arlington�MSA
SHARE OF POPULATION 25 AND OLDER
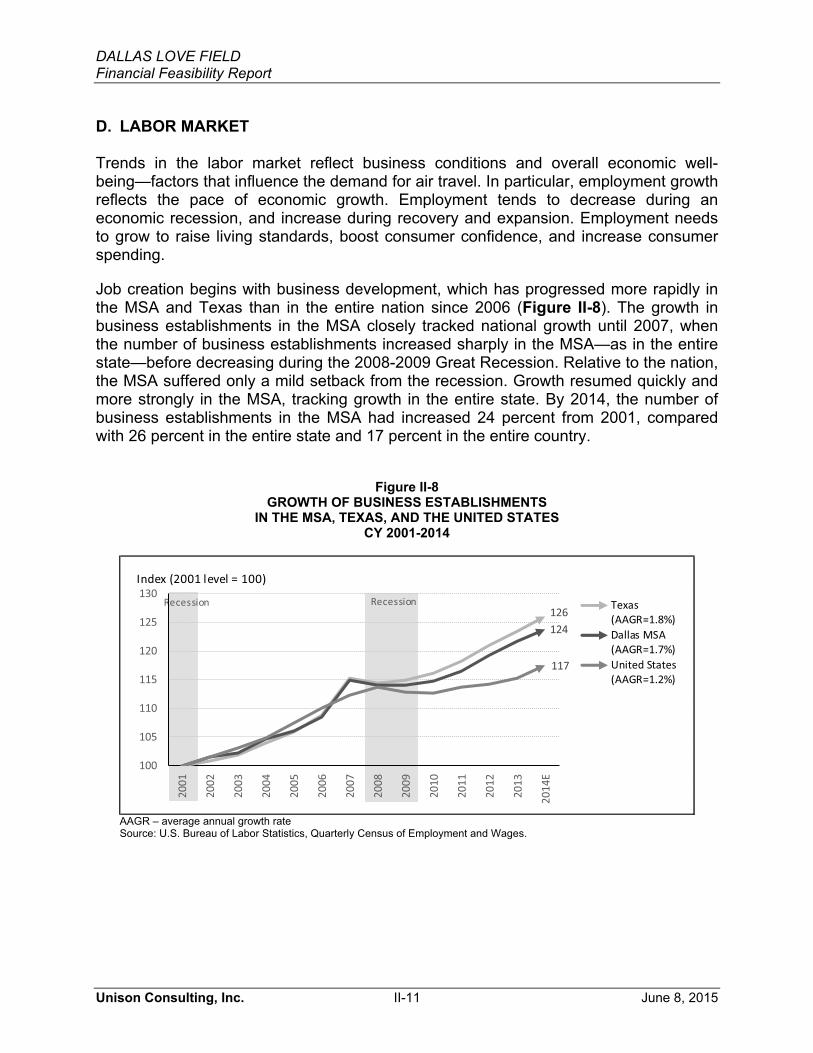
DALLAS LOVE FIELD Financial Feasibility Report
Unison Consulting, Inc. II-11 June 8, 2015
D. LABOR MARKET Trends in the labor market reflect business conditions and overall economic well-being—factors that influence the demand for air travel. In particular, employment growth reflects the pace of economic growth. Employment tends to decrease during an economic recession, and increase during recovery and expansion. Employment needs to grow to raise living standards, boost consumer confidence, and increase consumer spending.
Job creation begins with business development, which has progressed more rapidly in the MSA and Texas than in the entire nation since 2006 (Figure II-8). The growth in business establishments in the MSA closely tracked national growth until 2007, when the number of business establishments increased sharply in the MSA—as in the entire state—before decreasing during the 2008-2009 Great Recession. Relative to the nation, the MSA suffered only a mild setback from the recession. Growth resumed quickly and more strongly in the MSA, tracking growth in the entire state. By 2014, the number of business establishments in the MSA had increased 24 percent from 2001, compared with 26 percent in the entire state and 17 percent in the entire country.
Figure II-8
GROWTH OF BUSINESS ESTABLISHMENTS IN THE MSA, TEXAS, AND THE UNITED STATES
CY 2001-2014
AAGR – average annual growth rate Source: U.S. Bureau of Labor Statistics, Quarterly Census of Employment and Wages.
Recession Recession126124
117
100
105
110
115
120
125
130
2001
2002
2003
2004
2005
2006
2007
2008
2009
2010
2011
2012
2013
2014
E
Index�(2001�level�=�100)
Texas(AAGR=1.8%)Dallas�MSA(AAGR=1.7%)United�States(AAGR=1.2%)

DALLAS LOVE FIELD Financial Feasibility Report
Unison Consulting, Inc. II-12 June 8, 2015
Job growth (Figure II-9) proceeded more slowly than the growth in the number of business establishments, but the pattern is the same. Job growth in the MSA and the state proceeded faster than national growth. From 2001 to 2014, the number of employees in all business establishments increased 15 percent in the MSA and 21 percent in the entire state, compared with only 5 percent nationwide. Jobs are vulnerable to economic downturns. In the MSA, the state, and the entire nation, jobs decreased in 2002 and 2003 following the 2001 recession, and in 2009 at the depth of the Great Recession.
Figure II-9 GROWTH IN NUMBER OF EMPLOYEES IN ALL BUSINESS ESTABLISHMENTS
IN THE DALLAS-FORT WORTH-ARLINGTON MSA, TEXAS, AND THE UNITED STATES CY 2001-2014
AAGR – average annual growth rate Source: U.S. Bureau of Labor Statistics, Quarterly Census of Employment and Wages.
Civilian labor force data present a complete picture of the labor market situation by tracking residents of working age (16 years and older), who are either employed or unemployed but actively seeking employment. The data count all types of civilian employment, including agricultural, non-agricultural, and self-employment. They allow measurement of the unemployment rate, which counts unemployed working-age residents as a percentage of the labor force. The labor force trends are shown in Figure II-10 (total labor force), Figure II-11 (employed labor force), and Figure II-12 (unemployment rate).
Recession Recession121
115
105
90
95
100
105
110
115
120
125
2001
2002
2003
2004
2005
2006
2007
2008
2009
2010
2011
2012
2013
2014
E
Index�(2001�level�=�100)
Texas(AAGR=1.5%)
Dallas�MSA(AAGR=1.1%)
United�States(AAGR=0.4%)

DALLAS LOVE FIELD Financial Feasibility Report
Unison Consulting, Inc. II-13 June 8, 2015
People follow jobs, which have increased faster in the MSA and in Texas than in most other places in the nation. From 2000 to 2014, the labor force expanded 23 percent in the MSA and 26 percent in the entire state, while expanding only 9 percent nationwide (Figure II-10). Even through the 2008-2009 Great Recession, the labor force continued expanding in the MSA and in Texas, while staying flat nationally through the Great Recession and long after the recession was over. Elsewhere, many left the labor force after being laid off during the recession and discouraged from extended periods of unsuccessful job search.
Figure II-10 TOTAL LABOR FORCE IN THE MSA, TEXAS, AND THE UNITED STATES
CY 2000-2014
AAGR – average annual growth rate Source: U.S. Bureau of Labor Statistics, Current Population Survey and Local Area Unemployment Statistics.
RecessionRecession126
123
109
90
95
100
105
110
115
120
125
130
2000
2001
2002
2003
2004
2005
2006
2007
2008
2009
2010
2011
2012
2013
2014
Labor�Force�Index�(2000�level�=�100)
Texas�(AAGR=1.7%)
Dallas�Fort�Worth�Arlington�MSA(AAGR=1.5%)United�States(AAGR=0.6%)

DALLAS LOVE FIELD Financial Feasibility Report
Unison Consulting, Inc. II-14 June 8, 2015
During the Great Recession, employment declined in the MSA and the entire state, but less than it did nationally (Figure II-11). It also rebounded more quickly and more strongly in the MSA and Texas. From 2000 to 2014, employment increased 21 percent in the MSA and 25 percent in Texas, while increasing only 7 percent nationally.
Figure II-11 EMPLOYED LABOR FORCE IN THE MSA,
TEXAS, AND THE UNITED STATES CY 2000-2014
AAGR – average annual growth rate Source: U.S. Bureau of Labor Statistics, Current Population Survey and Local Area Unemployment Statistics.
Recession Recession
125
121
107
90
95
100
105
110
115
120
125
130
2000
2001
2002
2003
2004
2005
2006
2007
2008
2009
2010
2011
2012
2013
2014
Employment� Index�(2000�level�=�100)
Texas(AAGR=1.6%)
Dallas�Fort�Worth�Arlington�MSA(AAGR=1.4%)
United�States(AAGR=0.5%)

DALLAS LOVE FIELD Financial Feasibility Report
Unison Consulting, Inc. II-15 June 8, 2015
The MSA and state unemployment rates followed national trends—rising during recessions and for at least a year longer into the recovery phase. But they stayed below national unemployment rates beginning in 2007 (Figure II-12).
Figure II-12 UNEMPLOYMENT RATE IN THE MSA,
TEXAS, AND THE UNITED STATES CY 2000-2014
Source: U.S. Bureau of Labor Statistics, Current Population Survey and Local Area Unemployment Statistics.
The Federal Reserve Bank of Dallas predicts that the recent decline in oil prices will slow employment growth in Texas—the largest producer of crude oil among U.S. states13—as oil companies cut capital spending and begin layoffs. But the impact is expected to be milder than the experience in the mid-1980s when the decline in oil prices triggered a recession in Texas. The state economy is now more diverse and less vulnerable to a downturn in its energy sector. The decrease in gasoline prices is also
13 U.S. Energy Information Administration, U.S. State Rankings: Crude Oil Production, January 2015, <http://www.eia.gov/state/rankings/>.
Unemployment Rate
Recession Recession
United�States
Texas
Dal las�Fort�Worth�Arl ington�MSA
6.2%
5.1%5.0%
0%
2%
4%
6%
8%
10%
12%
2000
2001
2002
2003
2004
2005
2006
2007
2008
2009
2010
2011
2012
2013
2014

DALLAS LOVE FIELD Financial Feasibility Report
Unison Consulting, Inc. II-16 June 8, 2015
expected to compensate any losses in the oil industry by boosting consumer spending and promoting growth in non-energy sectors.14 Texas started to shed jobs in its oil and gas sector early in 2015, and total state employment declined in March for the first time since January 2013. The MSA was gaining jobs in all sectors until March, when total MSA employment also declined for the first time in 15 months.15 16 Despite recent job losses, Texas and the counties in the MSA continue to have lower unemployment rates than many areas in the country (Figure II-13 and Figure II-14). The Texas unemployment rate was 4.2 percent (seasonally unadjusted) in March 2015 and unemployment rates in the MSA counties were all below 5 percent (seasonally unadjusted) in February, while the national unemployment rate remained above 5 percent (5.5 percent in February and March, seasonally adjusted).17 March was the 99th consecutive month that Texas’ unemployment rate had been at or below the national rate.18
14 See the following sources:
Ana Campoy, “Oil Prices Will Slow the Texas Jobs Engine, Dallas Fed Says,” The Wall Street Journal, January 15, 2015. John Hilsenrath, “Plunging Oil Prices Test Texas’ Economic Boom, Downturn Has Many Wondering How Lone Star Will Weather a Bust,” The Wall Street Journal, January 4, 2015. James Osborne, Texas oil boom heading for bust in a hurry; downturn may be prolonged,” The Dallas Morning News, January 15, 2015 (updated January 16, 2015), < http://www.dallasnews.com/business/energy/20150115-texas-oil-boom-heading-for-bust-in-a-hurry.ece>. Keith Phillips, Senior Economist and Research Officer, Federal Reserve Bank of Dallas San Antonio Branch, 2015 Texas Economic Outlook: Tapping on the Brakes, January 13, 2015, < http://dallasfed.org/assets/documents/news/speeches/15outlook-phillips.pdf> Mark Vitner, Michael T. Wolf, and Alex V. Moehring, “Southern States: 2015 Economic Outlook,” Wells Fargo Securities Economics Group Special Commentary, February 12, 2015.
15 Federal Reserve Bank of Dallas, Texas Economic Indicators, April 30, 2015. 16 Federal Reserve Bank of Dallas, DFW Economic Indicators, March 31, 2015. 17 U.S. Bureau of Labor Statistics, Current Population Survey, February and March 2015, <http://www.bls.gov>. 18 Glen Hegar, Texas Comptroller of Public Accounts, “Economic Outlook,” The Texas Economy, updated April 30, 2015, <http://thetexaseconomy.org/economic-outlook/>.

DALLAS LOVE FIELD Financial Feasibility Report
Unison Consulting, Inc. II-17 June 8, 2015
Figure II-13
U.S. STATE UNEMPLOYMENT RATE MAP March 2015
Source: U.S. Bureau of Labor Statistics, Local Area Unemployment Statistics Map.
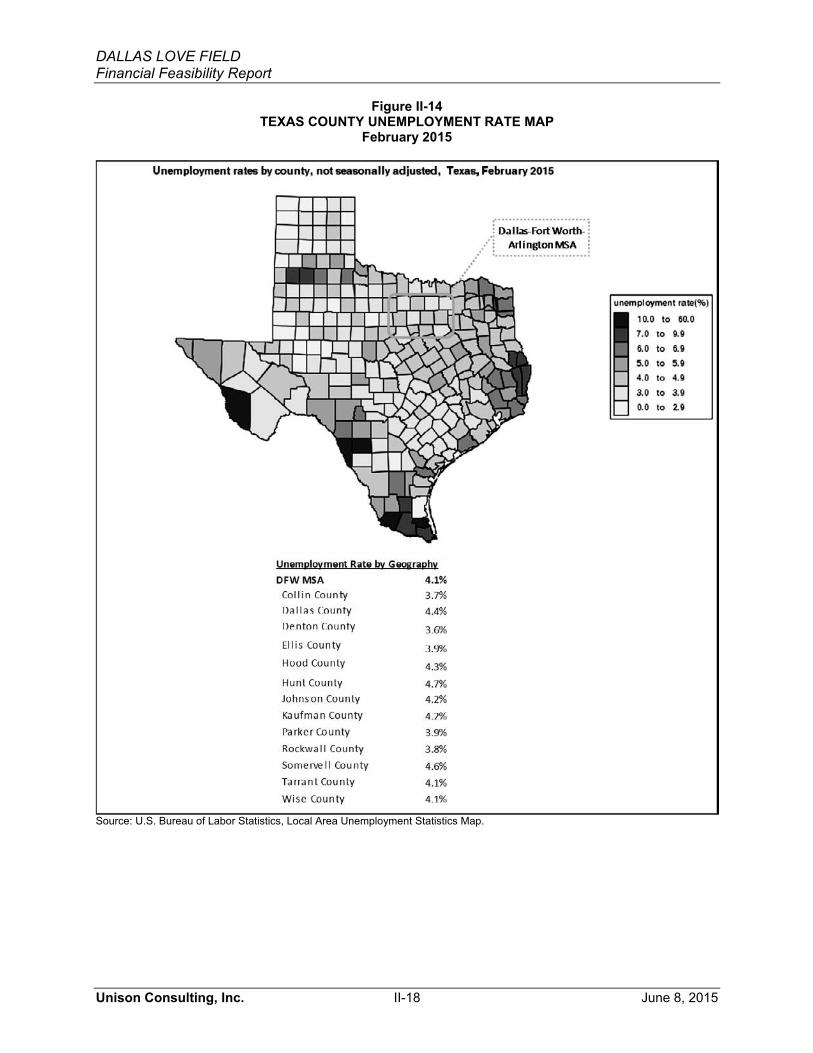
DALLAS LOVE FIELD Financial Feasibility Report
Unison Consulting, Inc. II-18 June 8, 2015
Figure II-14 TEXAS COUNTY UNEMPLOYMENT RATE MAP
February 2015
Source: U.S. Bureau of Labor Statistics, Local Area Unemployment Statistics Map.

DALLAS LOVE FIELD Financial Feasibility Report
Unison Consulting, Inc. II-19 June 8, 2015
E. EMPLOYMENT BY INDUSTRY The Texas economy has diversified since the 1980s’ oil bust and banking crisis. Trends since 2000 show that economic diversification has continued both in Texas and the MSA (Figure II-15).
Figure II-15 EMPLOYMENT SHARE BY INDUSTRY IN THE MSA,
TEXAS, AND THE UNITED STATES CY 2000 and 2014
Source: U.S. Bureau of Labor Statistics. As is the case nationally, the four largest industry sectors in Texas and the MSA include the government and three private service-providing sectors—namely, professional and business services, retail and wholesale trade, and education and health services. In 2014, these four sectors accounted for 57 percent of nonfarm employment in the MSA, 58 percent in the state, and 60 percent in the nation. Relative to the nation, the MSA has higher shares of nonfarm employment in professional and business services, retail and wholesale trade, information and financial services, and transportation and utilities. It has smaller shares of nonfarm employment in government, education and health services, leisure and hospitality, other services, manufacturing, and mining and construction, which includes oil drilling.
0% 5% 10% 15% 20%
Mining�&�Construction
Manufacturing
Other�Services
Transportation�&�Utilities
Leisure�&�Hospitality
Information�and�Financial�Activities
Education�and�Health�Services
Retail�and�Wholesale�Trade
Professional�and�Business�Services
Government
PRIV
ATE
GO
ODS�
PRO
DUCI
NG
PRIV
ATE�
SERV
ICE�
PRO
VIDI
NG
0% 5% 10% 15% 20%
Dallas�Fort�Worth�Arlington�MSA
Texas
United�States
2000 2014

DALLAS LOVE FIELD Financial Feasibility Report
Unison Consulting, Inc. II-20 June 8, 2015
Since 2000, the fastest growing industry sectors in the MSA have been education and health services, leisure and hospitality, and professional and business services—all service-providing sectors (Figure II-16). These three service-providing sectors have also led employment growth in the MSA since 2009 (Figure II-17). All other sectors, except manufacturing, have increased employment in the MSA since 2000 and since 2009. The decline in manufacturing employment is a national trend that began shortly after the North American Free Trade Agreement (NAFTA) of 1994 and has continued with global trade liberalization. Manufacturing jobs have been moving to other countries where labor and other business costs are lower. Government employment in the MSA and Texas as a whole seems unaffected by the automatic federal spending cuts—known as the sequester—that took effect in March 2013. Government employment in the MSA and Texas increased from 2009 to 2014, while decreasing nationwide.
Figure II-16 EMPLOYMENT GROWTH BY INDUSTRY IN THE MSA,
TEXAS, AND THE UNITED STATES CY 2000-CY 2014
Source: U.S. Bureau of Labor Statistics.
�3% �2% �1% 0% 1% 2% 3% 4%
Manufacturing
Information�and�Financial�Activities
Mining�&�Construction
Retail�and�Wholesale�Trade
Transportation�&�Utilities
Government
Other�Services
Professional�and�Business�Services
Leisure�&�Hospitality
Education�and�Health�Services
TOTAL
MAJ
OR�
INDU
STRY
�CLA
SSIF
ICAT
ION
Dallas�Fort�Worth�Arlington�MSATexas
United�States
Average Annual�Growth�Rate

DALLAS LOVE FIELD Financial Feasibility Report
Unison Consulting, Inc. II-21 June 8, 2015
Figure II-17 EMPLOYMENT GROWTH BY INDUSTRY IN THE MSA,
TEXAS, AND THE UNITED STATES CY 2009-CY 2014
Source: U.S. Bureau of Labor Statistics.
�1% 0% 1% 2% 3% 4% 5%
Manufacturing
Information�and�Financial�Activities
Mining�&�Construction
Retail�and�Wholesale�Trade
Transportation�&�Utilities
Government
Other�Services
Professional�and�Business�Services
Leisure�&�Hospitality
Education�and�Health�Services
TOTAL
MAJ
OR�
INDU
STRY
�CLA
SSIF
ICAT
ION
Dallas�Fort�Worth�Arlington�MSATexas
United�States
Average Annual�Growth�Rate

DALLAS LOVE FIELD Financial Feasibility Report
Unison Consulting, Inc. II-22 June 8, 2015
F. TOP EMPLOYERS AND LARGE COMPANY HEADQUARTERS Table II-3 lists the top private employers in the MSA. Table II-4 lists the Fortune 500 companies with headquarters in the area, and Table II-5 lists other large companies with headquarters in the area. The lists reflect the diversity of the area’s employers.
Table II-3
TOP PRIVATE EMPLOYERS IN THE DALLAS-FORT WORTH-ARLINGTON MSA
* AT&T, Walmart, Tom Thumb Food and Pharmacy, Walgreens, and Alcon Laboratories did not submit information, but they are believed to be among the area’s largest employers. Source: Dallas Office of Economic Development.
Company* Industry Description Local EmploymentTexas Health Resources Health care 21,100Bank of America Financial services 20,000American Airlines Airline 19,219Baylor Health Care System Health care 16,850Lockheed Martin Aeronautics Co. Aerospace manufacturing 16,000JPMorgan Chase Financial services 14,500Texas Instruments Inc. Semiconductor design and manufacturing 14,000Energy Future Holdings Energy 9,400United Parcel Service Logistics 9,209Target Retail 8,671HCA North Texas Division Health care 8,500Raytheon Co. Aerospace manufacturing 8,500Southwest Airlines Airline 7,708Verizon Communications Inc. Telecommunications 7,281Citi Financial services 7,200Bell Helicopter Aerospace manufacturing 7,000Wells Fargo Financial services 5,990Cook Children’s Health Care System Health care 5,850Children's Medical Center Health care 5,600Fidelity Investments Financial services 5,460Methodist Health System Health care 5,312J.C. Penney Co. Inc. Retail 4,758Brinker International Restaurants 4,362Ericsson Inc. Telecommunications 4,000

DALLAS LOVE FIELD Financial Feasibility Report
Unison Consulting, Inc. II-23 June 8, 2015
Table II-4 FORTUNE 500 HEADQUARTERS IN THE DALLAS-FORT WORTH-ARLINGTON MSA
Source: Fort Worth Chamber of Commerce.
Table II-5 OTHER LARGE COMPANY HEADQUARTERS IN THE DALLAS-FORT WORTH-ARLINGTON MSA
Source: Texas Office of the Governor, Economic Development and Tourism.
Fortune 500 Industry Location Rank in 2013ExxonMobil Oil and gas Irving 2AT&T Telecommunications Dallas 11Fluor Engineering Irving 110AMR/American Airlines Airlines Fort Worth 121Kimberly-Clark Paper products Irving 136HollyFrontier Oil refineries Dallas 143Energy Transfer Equity Oil and gas Dallas 161Southwest Airlines Airlines Dallas 164J.C. Penney Department stores Plano 215Dean Foods Dairy products Dallas 217Texas Instruments Semiconductors Dallas 218Tenet Healthcare Hospital management Dallas 269GameStop Software retail Grapevine 298Commercial Metals Fabricated metals Irving 335Celanese Chemicals Dallas 396Dr Pepper Snapple Group Soft drinks Plano 427Energy Future Holdings Utilities Dallas 447MetroPCS Communications Telecommunications Richardson 481
Company Industry LocationLargest Private CompaniesMichaels Stores, Inc. Hobby stores IrvingNeiman Marcus Group Department stores DallasLone Star Funds Asset management DallasHunt Oil Company Oil & gas exploration Dallas
Largest Corporate SubsidiariesNon-Texas Parent Company (Texas-based Subsidiary)7-Eleven, Inc. (Seven & I Holdings Co. Ltd. ) Gas stations and stores DallasBNSF Railway Company (Berkshire Hathaway) Rail transportation Fort WorthSamsung Telecom. America, LLC (Samsung Group) Telecom equipment RichardsonPizza Hut, Inc. (Yum! Brands) Restaurants PlanoHP Enterprise Services, LLC (Hewlett-Packard) Information technology Plano
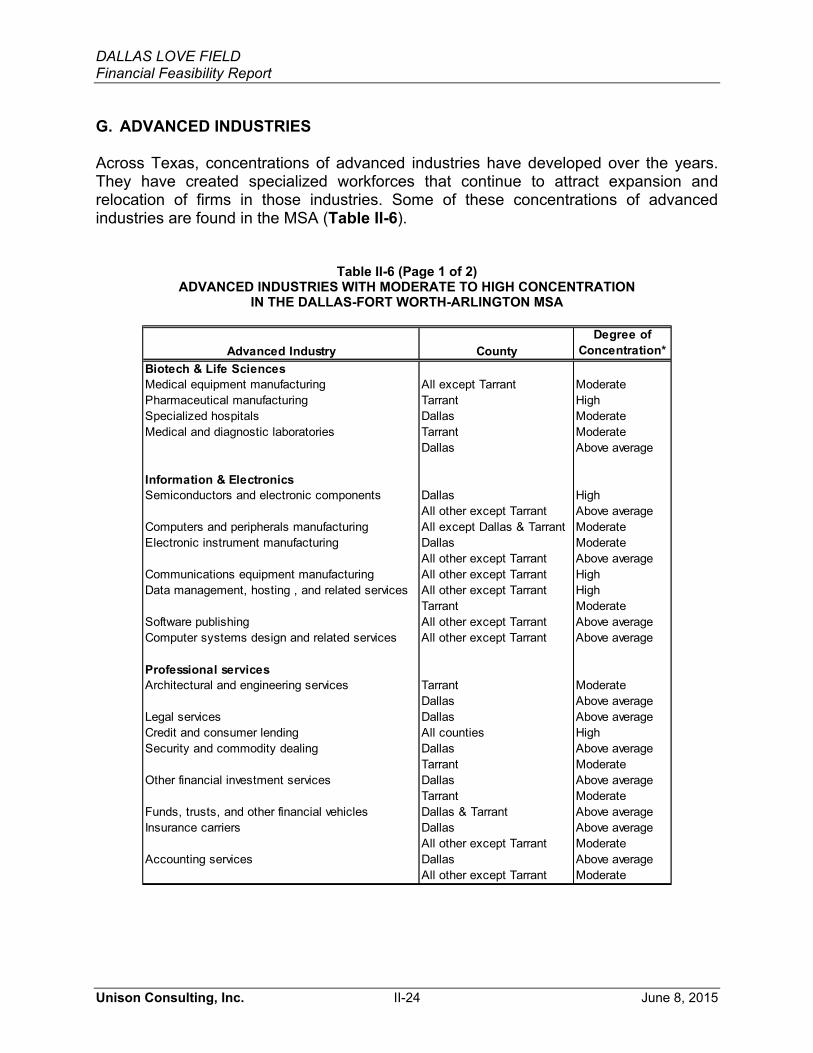
DALLAS LOVE FIELD Financial Feasibility Report
Unison Consulting, Inc. II-24 June 8, 2015
G. ADVANCED INDUSTRIES Across Texas, concentrations of advanced industries have developed over the years. They have created specialized workforces that continue to attract expansion and relocation of firms in those industries. Some of these concentrations of advanced industries are found in the MSA (Table II-6).
Table II-6 (Page 1 of 2) ADVANCED INDUSTRIES WITH MODERATE TO HIGH CONCENTRATION
IN THE DALLAS-FORT WORTH-ARLINGTON MSA
Advanced Industry CountyDegree of
Concentration*Biotech & Life SciencesMedical equipment manufacturing All except Tarrant ModeratePharmaceutical manufacturing Tarrant HighSpecialized hospitals Dallas ModerateMedical and diagnostic laboratories Tarrant Moderate
Dallas Above average
Information & ElectronicsSemiconductors and electronic components Dallas High
All other except Tarrant Above averageComputers and peripherals manufacturing All except Dallas & Tarrant ModerateElectronic instrument manufacturing Dallas Moderate
All other except Tarrant Above averageCommunications equipment manufacturing All other except Tarrant HighData management, hosting , and related services All other except Tarrant High
Tarrant ModerateSoftware publishing All other except Tarrant Above averageComputer systems design and related services All other except Tarrant Above average
Professional servicesArchitectural and engineering services Tarrant Moderate
Dallas Above averageLegal services Dallas Above averageCredit and consumer lending All counties HighSecurity and commodity dealing Dallas Above average
Tarrant ModerateOther financial investment services Dallas Above average
Tarrant ModerateFunds, trusts, and other financial vehicles Dallas & Tarrant Above averageInsurance carriers Dallas Above average
All other except Tarrant ModerateAccounting services Dallas Above average
All other except Tarrant Moderate
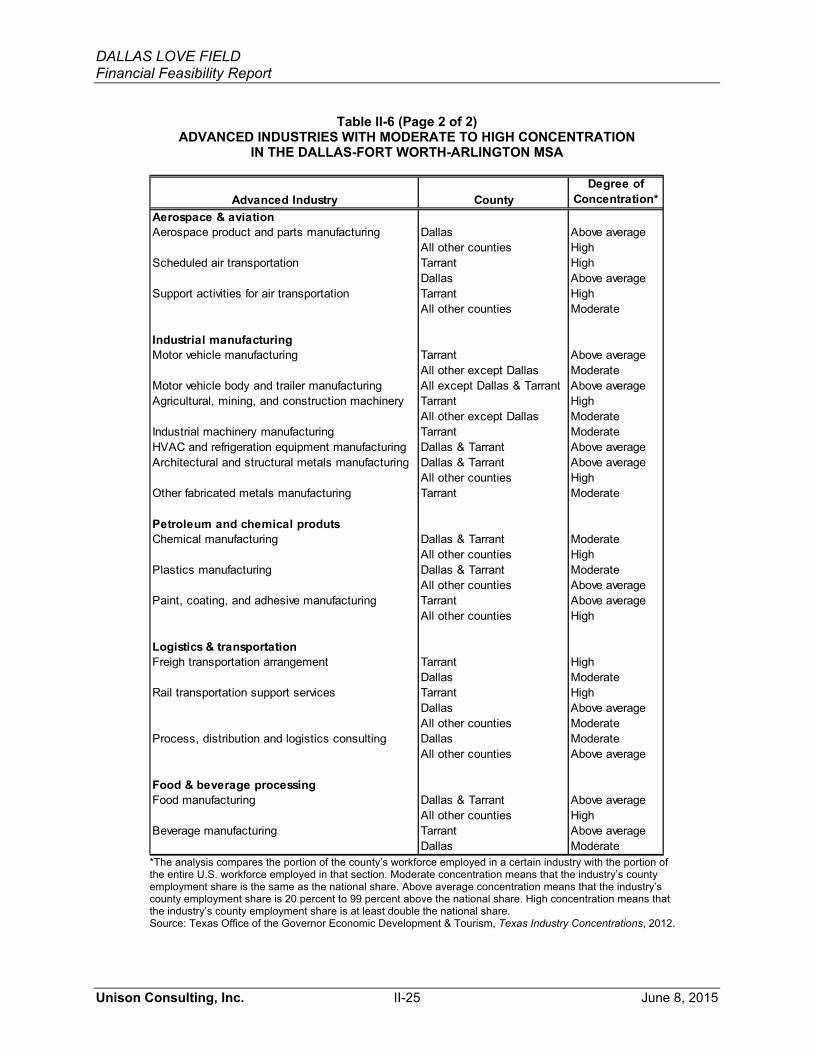
DALLAS LOVE FIELD Financial Feasibility Report
Unison Consulting, Inc. II-25 June 8, 2015
Table II-6 (Page 2 of 2)
ADVANCED INDUSTRIES WITH MODERATE TO HIGH CONCENTRATION IN THE DALLAS-FORT WORTH-ARLINGTON MSA
*The analysis compares the portion of the county’s workforce employed in a certain industry with the portion of the entire U.S. workforce employed in that section. Moderate concentration means that the industry’s county employment share is the same as the national share. Above average concentration means that the industry’s county employment share is 20 percent to 99 percent above the national share. High concentration means that the industry’s county employment share is at least double the national share. Source: Texas Office of the Governor Economic Development & Tourism, Texas Industry Concentrations, 2012.
Advanced Industry CountyDegree of
Concentration*Aerospace & aviationAerospace product and parts manufacturing Dallas Above average
All other counties HighScheduled air transportation Tarrant High
Dallas Above averageSupport activities for air transportation Tarrant High
All other counties Moderate
Industrial manufacturingMotor vehicle manufacturing Tarrant Above average
All other except Dallas ModerateMotor vehicle body and trailer manufacturing All except Dallas & Tarrant Above averageAgricultural, mining, and construction machinery Tarrant High
All other except Dallas ModerateIndustrial machinery manufacturing Tarrant ModerateHVAC and refrigeration equipment manufacturing Dallas & Tarrant Above averageArchitectural and structural metals manufacturing Dallas & Tarrant Above average
All other counties HighOther fabricated metals manufacturing Tarrant Moderate
Petroleum and chemical produtsChemical manufacturing Dallas & Tarrant Moderate
All other counties HighPlastics manufacturing Dallas & Tarrant Moderate
All other counties Above averagePaint, coating, and adhesive manufacturing Tarrant Above average
All other counties High
Logistics & transportationFreigh transportation arrangement Tarrant High
Dallas ModerateRail transportation support services Tarrant High
Dallas Above averageAll other counties Moderate
Process, distribution and logistics consulting Dallas ModerateAll other counties Above average
Food & beverage processingFood manufacturing Dallas & Tarrant Above average
All other counties HighBeverage manufacturing Tarrant Above average
Dallas Moderate

DALLAS LOVE FIELD Financial Feasibility Report
Unison Consulting, Inc. II-26 June 8, 2015
H. TOURISM Tourism not only drives demand for air transportation, but it also contributes to economic growth. Behind only Los Angeles and New York, North Texas is America’s third most desirable place to visit, according to a new study by Resonance Consultancy Ltd.19 Cities were reviewed as business and leisure destinations based on various criteria including tourist attractions, hotels, flights, traveler reviews, number of major league sports teams, and crime rate. Dallas’ ranking was boosted by an expanded Arts District and the recent additions of the Perot Museum, George W. Bush Presidential Center, and Klyde Warren Park. Dallas is also known for a leading business environment, the title of America's best sports city, the nation's largest urban arts district, the best shopping in the Southwest, 14 entertainment districts, a vibrant dining scene, and impressive accommodations and meeting spaces. Dallas’ tourist attractions include the following:
� numerous museums, libraries, and art displays;
� entertainment venues such as the Grapevine Opry and the Improv Comedy Club in Arlington;
� outdoor recreation;
� sports such as golf, horse racing, baseball, football, rodeos, shooting, and car racing; and
� amusement parks such as the Dallas Zoo, the Fort Worth Zoo, Six Flags Over Texas, and the Dallas World Aquarium.
Downtown Dallas’ Kay Bailey Hutchison Convention Center, one of the largest in the nation, has been recognized as "The Best-Run Convention Center in America." It is the site of major national and international conventions, meetings, concerts, antique and auto shows, and other special events. Figure II-18 shows the trends in the volume of visitors—measured by person-trips and person-days—in the MSA and Texas. In the past three years, the MSA had more than 45 million visitors a year, measured in person-trips. These account for an average 20 percent of annual visitor person-trips in the entire state. Total visitor person-trips to the MSA increased each year from 45.2 million in 2011 to 49.1 million in 2013, corresponding to total person-days which increased from 99.3 million in 2011 to 107.8 19 Reported by CBS Local Media, a division of CBS Radio, Inc. on July 31, 2014.

DALLAS LOVE FIELD Financial Feasibility Report
Unison Consulting, Inc. II-27 June 8, 2015
million in 2013. The growth in the volume of visitors to the entire state has not been as steady; the state total person trips and person-days dipped in 2012.
Figure II-18 ANNUAL VOLUME OF VISITORS IN THE MSA AND TEXAS
CY 2011-2013
Source: D. K. Shifflet & Associates, Ltd., 2013 Texas Tourism Region and MSA Visitor Profile.
2011 2012 2013 2011 2012 2013
Dallas�Fort�Worth�Arlington�MSA Texas
Person�Trips�(Millions)
Business
Leisure
45.2 47.3 49.1
237.6221.8
247.1
2011 2012 2013 2011 2012 2013
Dallas�Fort�Worth�Arlington�MSA Texas
Person�Days�(Millions)
Business
Leisure
99.3 103.9 107.8
482.3450.2
501.7

DALLAS LOVE FIELD Financial Feasibility Report
Unison Consulting, Inc. II-28 June 8, 2015
In the MSA, leisure visits accounted for an average 66 percent of total visits, and business visits accounted for the remaining 34 percent. In the entire state, leisure visits accounted for an average 72 percent of total visits—more than in the MSA; and business visits, an average 28 percent. While a majority of visits to both the MSA and Texas originate within the state, the MSA draws a bigger share of out-of-state visitors than Texas (Figure II-19).
Figure II-19 ORIGIN OF VISITORS TO THE MSA AND TEXAS
CY 2013
Source: D. K. Shifflet & Associates, Ltd., 2013 Texas Tourism Region and MSA Visitor Profile.
52%
68%
48%
33%
Dallas�Fort�Worth�ArlingtonMSA
Texas
From�Texas From�Out�of�State
Percent of�Person�Days

DALLAS LOVE FIELD Financial Feasibility Report
Unison Consulting, Inc. II-29 June 8, 2015
Visitor spending generates revenues for local businesses that, in turn, provide local jobs. Figure II-20 shows steady increases in visitor spending in the MSA and the rest of the state. Visitor spending in the MSA, which increased from $13.4 billion in 2010 to $15.8 billion in 2013, accounts for 27 percent of visitor spending in the entire state.
Figure II-20 VISITOR SPENDING IN THE MSA AND THE REST OF TEXAS
CY 2010-2013
Source: Dean Runyan Associates, The Economic Impact of Travel on Texas, 1990-2013P, prepared for Texas Office of the Governor, Texas Development & Tourism, June 2014.
I. ECONOMIC OUTPUT Airport passenger traffic tracks economic growth. The most comprehensive economic indicator is gross domestic product (GDP), which measures the value of all goods and services produced in an area. Growth in inflation-adjusted (real) GDP indicates an economic expansion, while steady decline over two or more quarters indicates a recession.
Figure II-21 compares real GDP growth trends from 2001 in the MSA and the entire state with national trends. Through 2005, economic growth in the MSA and the state tracked national growth closely. Then in 2006, the MSA and the state began to outperform the rest of the nation. Real GDP in the MSA and Texas did fall in the second year of the Great Recession, but they recovered more strongly than the U.S. real GDP, and they have been setting a new record each year since 2010. From 2001 to 2013, real GDP had grown 37.1 percent in the MSA, 43.6 percent in Texas, and only 21.7 percent nationally.
$13,435$14,584 $15,326 $15,813
$35,700 $39,276 $41,878 $43,213
2010 2011 2012 2013
Rest�of�Texas DFW�MSA
27% 27% 27% 27%
DFW�MSA�Share
Texas�Visitor�Expenditures�(Mill ions)
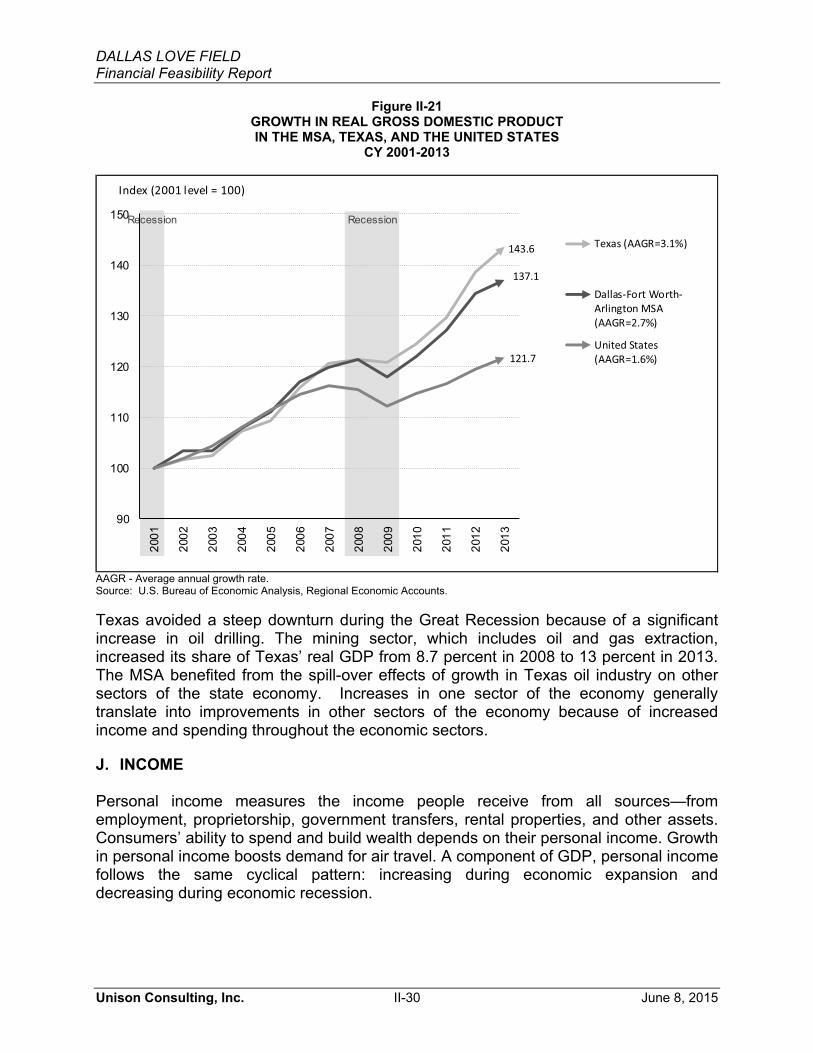
DALLAS LOVE FIELD Financial Feasibility Report
Unison Consulting, Inc. II-30 June 8, 2015
Figure II-21 GROWTH IN REAL GROSS DOMESTIC PRODUCT IN THE MSA, TEXAS, AND THE UNITED STATES
CY 2001-2013
AAGR - Average annual growth rate. Source: U.S. Bureau of Economic Analysis, Regional Economic Accounts. Texas avoided a steep downturn during the Great Recession because of a significant increase in oil drilling. The mining sector, which includes oil and gas extraction, increased its share of Texas’ real GDP from 8.7 percent in 2008 to 13 percent in 2013. The MSA benefited from the spill-over effects of growth in Texas oil industry on other sectors of the state economy. Increases in one sector of the economy generally translate into improvements in other sectors of the economy because of increased income and spending throughout the economic sectors.
J. INCOME Personal income measures the income people receive from all sources—from employment, proprietorship, government transfers, rental properties, and other assets. Consumers’ ability to spend and build wealth depends on their personal income. Growth in personal income boosts demand for air travel. A component of GDP, personal income follows the same cyclical pattern: increasing during economic expansion and decreasing during economic recession.
Recession
Index�(2001�level =�100)
Recession
143.6
137.1
121.7
90
100
110
120
130
140
150
2001
2002
2003
2004
2005
2006
2007
2008
2009
2010
2011
2012
2013
Texas�(AAGR=3.1%)
Dallas�Fort�Worth�Arlington�MSA(AAGR=2.7%)
United�States(AAGR=1.6%)

DALLAS LOVE FIELD Financial Feasibility Report
Unison Consulting, Inc. II-31 June 8, 2015
The MSA has a higher per capita income than Texas and the nation (Figure II-22). From 2000 to 2013, however, the MSA lagged behind Texas and the nation in income growth. Annual growth in per capita income averaged 2.6 percent in the MSA, 3.4 percent in Texas, and 3.0 percent in the United States—all above annual inflation of 2.4 percent.
Figure II-22 PER CAPITA PERSONAL INCOME (IN CURRENT DOLLARS)
IN THE MSA, TEXAS, AND THE UNITED STATES CY 2000-2013
AAGR – Average annual growth rate. Source: U.S. Bureau of Economic Analysis, Regional Economic Accounts.
$46,989$44,765$43,862
$0
$5,000
$10,000
$15,000
$20,000
$25,000
$30,000
$35,000
$40,000
$45,000
$50,000
2000
2001
2002
2003
2004
2005
2006
2007
2008
2009
2010
2011
2012
2013
Dallas-Fort Worth-Arlington MSA(AAGR=2.6%)
United States(AAGR=3.0%)
Texas(AAGR=3.4%)
Recession Recession

DALLAS LOVE FIELD Financial Feasibility Report
Unison Consulting, Inc. II-32 June 8, 2015
A component of personal income, wages and salaries in the MSA are also higher than the Texas and national averages (Figure II-23). But they have also increased at slower pace: an average 1.4 percent per year, compared with 2.5 percent in the entire state and 2.1 percent nationally.
Figure II-23 AVERAGE ANNUAL PAY PER EMPLOYEE (IN CURRENT DOLLARS)
IN THE MSA, TEXAS, AND THE UNITED STATES CY 2000-2013
AAGR – Average annual growth rate. Source: U.S. Bureau of Labor Statistics, Quarterly Census of Employment and Wages. The data include wages and salaries of workers covered by Unemployment Insurance and Unemployment Compensation for Federal Employees programs. K. COST OF LIVING A low cost of living helps attract workers and businesses to move into the area. The MSA has a lower cost of living than most other metropolitan areas with similar population, by either of the two measures shown in Figure II-24: (1) the Cost of Living Index (COLI) published by the Council for Community and Economic Research (C2ER) and (2) the Regional Price Parity (RPP) published by the U.S. Bureau of Economic Analysis (BEA). COLI measures regional differences in the cost of consumer goods and services, excluding taxes and non-consumer expenditures, for professional and managerial households in the top income quintile. In 2013, the cost of living in the MSA was 4.1 percent lower than the U.S. average and ranked third lowest among nine metropolitan areas—close in population size—participating in the COLI survey.
RecessionRecession
$26,085
$22,492
$22,363
$0
$5,000
$10,000
$15,000
$20,000
$25,000
$30,000
2000
2001
2002
2003
2004
2005
2006
2007
2008
2009
2010
2011
2012
2013
Dallas�Fort�Worth�Arlington�MSA(AAGR=1.4%)
United�States(AAGR=2.1%)
Texas�(AAGR=2.5%)
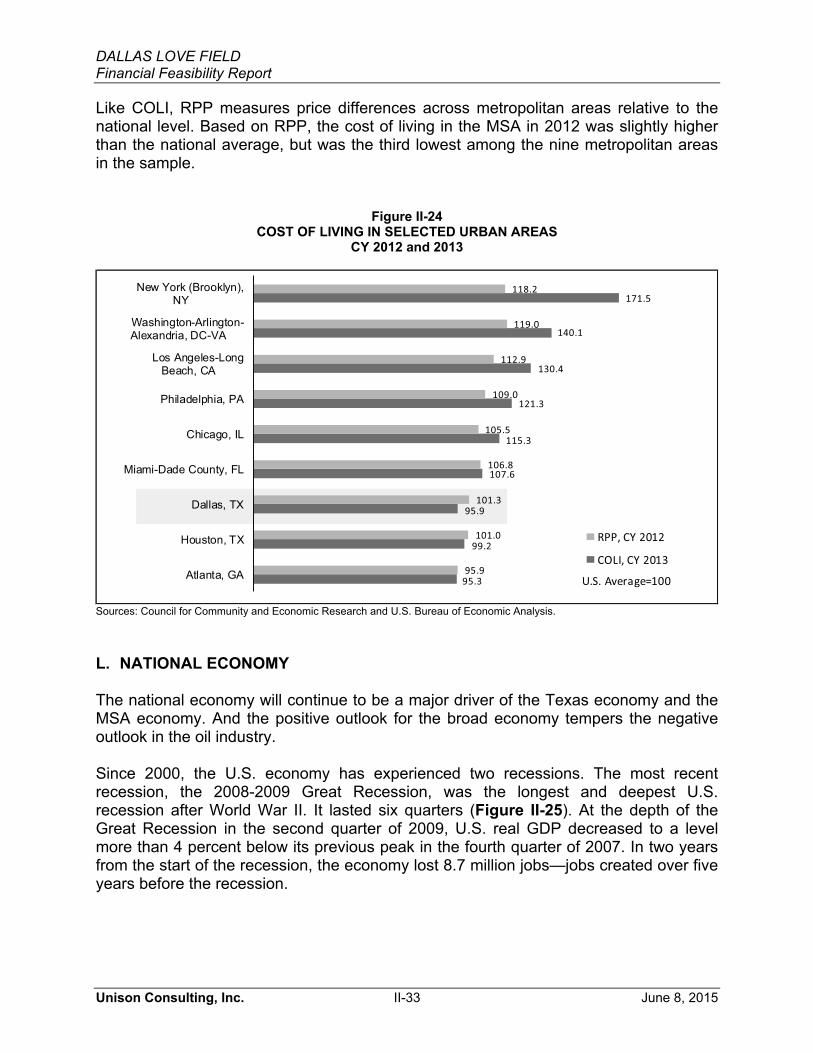
DALLAS LOVE FIELD Financial Feasibility Report
Unison Consulting, Inc. II-33 June 8, 2015
Like COLI, RPP measures price differences across metropolitan areas relative to the national level. Based on RPP, the cost of living in the MSA in 2012 was slightly higher than the national average, but was the third lowest among the nine metropolitan areas in the sample.
Figure II-24 COST OF LIVING IN SELECTED URBAN AREAS
CY 2012 and 2013
Sources: Council for Community and Economic Research and U.S. Bureau of Economic Analysis. L. NATIONAL ECONOMY The national economy will continue to be a major driver of the Texas economy and the MSA economy. And the positive outlook for the broad economy tempers the negative outlook in the oil industry. Since 2000, the U.S. economy has experienced two recessions. The most recent recession, the 2008-2009 Great Recession, was the longest and deepest U.S. recession after World War II. It lasted six quarters (Figure II-25). At the depth of the Great Recession in the second quarter of 2009, U.S. real GDP decreased to a level more than 4 percent below its previous peak in the fourth quarter of 2007. In two years from the start of the recession, the economy lost 8.7 million jobs—jobs created over five years before the recession.
95.3
99.2
95.9
107.6
115.3
121.3
130.4
140.1
171.5
95.9
101.0
101.3
106.8
105.5
109.0
112.9
119.0
118.2
Atlanta, GA
Houston, TX
Dallas, TX
Miami-Dade County, FL
Chicago, IL
Philadelphia, PA
Los Angeles-LongBeach, CA
Washington-Arlington-Alexandria, DC-VA
New York (Brooklyn),NY
RPP,�CY�2012
COLI,�CY�2013
U.S. Average=100

DALLAS LOVE FIELD Financial Feasibility Report
Unison Consulting, Inc. II-34 June 8, 2015
Figure II-25 U.S. REAL GROSS DOMESTIC PRODUCT: PERCENT CHANGE FROM THE PRIOR PERIOD
Fourth Quarter 2007-First Quarter 2015
Source: U.S. Bureau of Economic Analysis.
The recovery from the Great Recession has been the slowest in post-World War II history. Economic output, measured by the U.S. real GDP, took nearly four years to return to its pre-recession peak, compared with the average two years it took to recover from the previous 10 recessions. The U.S. nonfarm employment level took nearly 6 ½ years to return to its previous peak, compared with only 2 to 2½ years in recoveries from previous recessions. During the recovery, the U.S. economy contracted twice—in the first quarter of 2011 and in the first quarter of 2014. Blamed on a harsh winter, the contraction in the first quarter of 2014 was the deepest contraction that has taken place during economic recovery after the Great Depression. After the first quarter contraction, growth accelerated in the second and third quarter of 2014 at the fastest pace in more than a decade, despite renewed uncertainty in the global economy. In the first quarter of 2015, the U.S. economy continued to expand but at a very slow pace—following the previous year’s seasonal pattern. A number of factors slowed growth, including bad weather, a slowdown at West Coast ports, a stronger U.S. dollar, weak global demand, and lower oil prices. The strong U.S. dollar and weak global demand weighed down exports. Business investment in new structures slowed,
-10
-8
-6
-4
-2
0
2
4
6
2007
Q4
2008
Q1
2008
Q2
2008
Q3
2008
Q4
2009
Q1
2009
Q2
2009
Q3
2009
Q4
2010
Q1
2010
Q2
2010
Q3
2010
Q4
2011
Q1
2011
Q2
2011
Q3
2011
Q4
2012
Q1
2012
Q2
2012
Q3
2012
Q4
2013
Q1
2013
Q2
2013
Q3
2013
Q4
2014
Q1
2014
Q2
2014
Q3
2014
Q4
2015
Q1
Percent�Change
Recession

DALLAS LOVE FIELD Financial Feasibility Report
Unison Consulting, Inc. II-35 June 8, 2015
particularly in the oil sector. Consumption spending also slowed—despite lower gas prices and stronger job creation—partly because of severe winter weather.20 The U.S. economy is now in its sixth year of expansion, driven by consumer spending and business investment. Despite losses in the oil sector, the broad labor market continues to improve. Unemployment is approaching a level compatible with full employment, without increasing inflation. After a slow start in the first quarter of 2015, the economy is expected to rebound strongly, accelerate in the second quarter of 2015 through the end of 2016, and continue growing for a number of years (Figure II-26). Economic threats come mainly from abroad: the geopolitical conflicts in Ukraine and the Middle East, persistent high unemployment and sluggishness in the Euro Zone economies, continued weakness in Japan’s economy and slowing growth in emerging markets from China to Brazil. The effects of the recent sharp decline in oil prices, the threat of global deflation, and the appreciation of the U.S. dollar also add to the economic uncertainties. But the probability of another recession remains very low—less than 12 percent according to recent Wall Street Journal economic forecasting surveys.21
20 See the following sources:
Jeffrey Sparshott, “Beige Book: U.S. Economy Powers Through Headwinds,” The Wall Street Journal, April 15, 2015. Jeffrey Sparshott, “U.S. Economic Growth Nearly Stalls Out,” The Wall Street Journal, April 29, 2015. “At A Glance: First-Quarter GDP,” The Wall Street Journal, April 29, 2015.
21 “Recession Probability,” The Wall Street Journal Economic Forecasting Survey, January-April, 2015, <http://projects.wsj.com/econforecast/#ind=recession&r=60>.
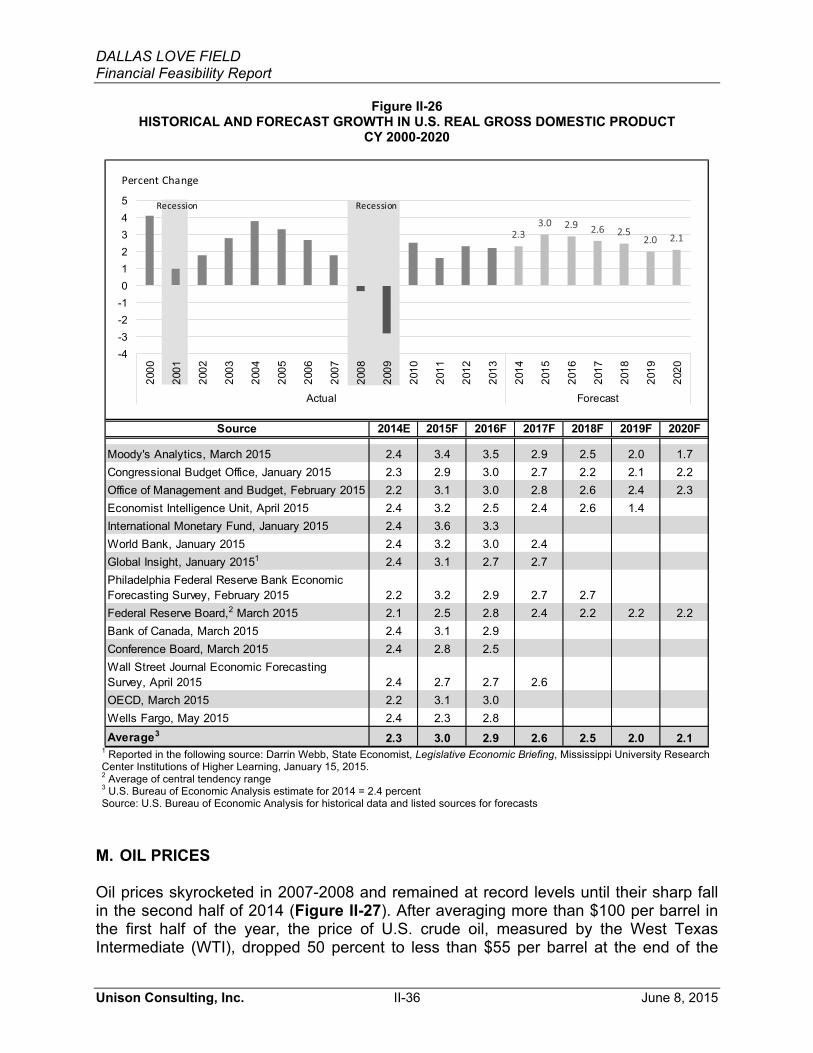
DALLAS LOVE FIELD Financial Feasibility Report
Unison Consulting, Inc. II-36 June 8, 2015
Figure II-26 HISTORICAL AND FORECAST GROWTH IN U.S. REAL GROSS DOMESTIC PRODUCT
CY 2000-2020
1 Reported in the following source: Darrin Webb, State Economist, Legislative Economic Briefing, Mississippi University Research Center Institutions of Higher Learning, January 15, 2015. 2 Average of central tendency range 3 U.S. Bureau of Economic Analysis estimate for 2014 = 2.4 percent Source: U.S. Bureau of Economic Analysis for historical data and listed sources for forecasts
M. OIL PRICES Oil prices skyrocketed in 2007-2008 and remained at record levels until their sharp fall in the second half of 2014 (Figure II-27). After averaging more than $100 per barrel in the first half of the year, the price of U.S. crude oil, measured by the West Texas Intermediate (WTI), dropped 50 percent to less than $55 per barrel at the end of the
Source 2014E 2015F 2016F 2017F 2018F 2019F 2020F
Moody's Analytics, March 2015 2.4 3.4 3.5 2.9 2.5 2.0 1.7Congressional Budget Office, January 2015 2.3 2.9 3.0 2.7 2.2 2.1 2.2Office of Management and Budget, February 2015 2.2 3.1 3.0 2.8 2.6 2.4 2.3Economist Intelligence Unit, April 2015 2.4 3.2 2.5 2.4 2.6 1.4International Monetary Fund, January 2015 2.4 3.6 3.3World Bank, January 2015 2.4 3.2 3.0 2.4Global Insight, January 20151 2.4 3.1 2.7 2.7Philadelphia Federal Reserve Bank Economic Forecasting Survey, February 2015 2.2 3.2 2.9 2.7 2.7Federal Reserve Board,2 March 2015 2.1 2.5 2.8 2.4 2.2 2.2 2.2Bank of Canada, March 2015 2.4 3.1 2.9Conference Board, March 2015 2.4 2.8 2.5Wall Street Journal Economic Forecasting Survey, April 2015 2.4 2.7 2.7 2.6OECD, March 2015 2.2 3.1 3.0Wells Fargo, May 2015 2.4 2.3 2.8Average3 2.3 3.0 2.9 2.6 2.5 2.0 2.1
2.33.0 2.9 2.6 2.5
2.0 2.1
-4-3-2-1012345
2000
2001
2002
2003
2004
2005
2006
2007
2008
2009
2010
2011
2012
2013
2014
2015
2016
2017
2018
2019
2020
Actual Forecast
Percent�Change
RecessionRecession
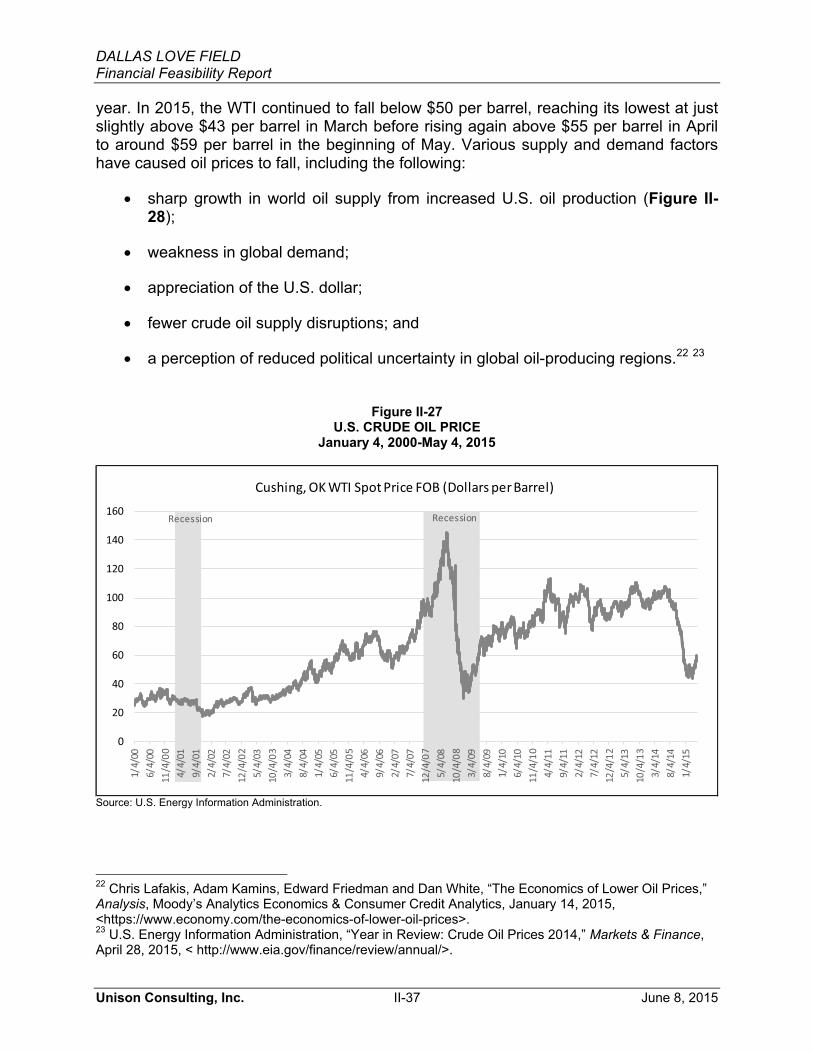
DALLAS LOVE FIELD Financial Feasibility Report
Unison Consulting, Inc. II-37 June 8, 2015
year. In 2015, the WTI continued to fall below $50 per barrel, reaching its lowest at just slightly above $43 per barrel in March before rising again above $55 per barrel in April to around $59 per barrel in the beginning of May. Various supply and demand factors have caused oil prices to fall, including the following:
� sharp growth in world oil supply from increased U.S. oil production (Figure II-28);
� weakness in global demand;
� appreciation of the U.S. dollar;
� fewer crude oil supply disruptions; and
� a perception of reduced political uncertainty in global oil-producing regions.22 23
Figure II-27 U.S. CRUDE OIL PRICE
January 4, 2000-May 4, 2015
Source: U.S. Energy Information Administration.
22 Chris Lafakis, Adam Kamins, Edward Friedman and Dan White, “The Economics of Lower Oil Prices,” Analysis, Moody’s Analytics Economics & Consumer Credit Analytics, January 14, 2015, <https://www.economy.com/the-economics-of-lower-oil-prices>. 23 U.S. Energy Information Administration, “Year in Review: Crude Oil Prices 2014,” Markets & Finance, April 28, 2015, < http://www.eia.gov/finance/review/annual/>.
0
20
40
60
80
100
120
140
160
1/4/
006/
4/00
11/4
/00
4/4/
019/
4/01
2/4/
027/
4/02
12/4
/02
5/4/
0310
/4/0
33/
4/04
8/4/
041/
4/05
6/4/
0511
/4/0
54/
4/06
9/4/
062/
4/07
7/4/
0712
/4/0
75/
4/08
10/4
/08
3/4/
098/
4/09
1/4/
106/
4/10
11/4
/10
4/4/
119/
4/11
2/4/
127/
4/12
12/4
/12
5/4/
1310
/4/1
33/
4/14
8/4/
141/
4/15
Cushing,�OK�WTI�Spot�Price�FOB�(Dollars�per�Barrel)
RecessionRecession

DALLAS LOVE FIELD Financial Feasibility Report
Unison Consulting, Inc. II-38 June 8, 2015
Figure II-28 U.S. CRUDE OIL PRODUCTION
January 2000-February 2015
Source: U.S. Energy Information Administration.
Many expect the recent slide in oil prices to boost economic growth by increasing consumer spending—which makes up two-thirds of the economy—and lowering production costs for manufacturers and transportation service providers (including airlines). The consensus so far is that these positive effects would outweigh the negative effects on the U.S. oil industry.24 24 See the following sources:
Chris Lafakis, Adam Kamins, Edward Friedman and Dan White, “The Economics of Lower Oil Prices,” Analysis, Moody’s Analytics Economics & Consumer Credit Analytics, January 14, 2015, <https://www.economy.com/the-economics-of-lower-oil-prices>. Jeffrey Sparshott, “Lower Oil Prices Will Help Boost Global Economy, IMF’s Lagarde Says,” The Wall Street Journal, December 1, 2018. Jeffrey Sparshott, “Beige Book: Hiring and Consumer Spending Look Solid at Start of Year,” The Wall Street Journal, March 4, 2015. Ian Talley, “Falling Oil Prices Spur New Bets on Global Economic Growth,” The Wall Street Journal, December 7, 2014. Bart van Ark and Willem Ovemeer, “Getting a Handle on Energy, The Economic and Business Impact of Changing Oil Price Scenarios,” Research Report R-1578-15, The Conference Board, April 2015, <https://www.conference-board.org/energy-global-growth>. The Wall Street Journal December 2014 Survey of Economists, as reported by Kathleen Madigan, “Economists See Strong Growth in 2015,” The Wall Street Journal, December 11, 2014. Mark Zandi, “U.S. Macro Outlook 2015: Spirits Unleashed,” Dismal Scientist, Moody’s Analytics, December 12, 2014.
0
50
100
150
200
250
300
350
Jan�
2000
Jul�2
000
Jan�
2001
Jul�2
001
Jan�
2002
Jul�2
002
Jan�
2003
Jul�2
003
Jan�
2004
Jul�2
004
Jan�
2005
Jul�2
005
Jan�
2006
Jul�2
006
Jan�
2007
Jul�2
007
Jan�
2008
Jul�2
008
Jan�
2009
Jul�2
009
Jan�
2010
Jul�2
010
Jan�
2011
Jul�2
011
Jan�
2012
Jul�2
012
Jan�
2013
Jul�2
013
Jan�
2014
Jul�2
014
Jan�
2015
Field�Production�of�Crude�Oil�(Million�Barrels)
United�States Texas

DALLAS LOVE FIELD Financial Feasibility Report
Unison Consulting, Inc. II-39 June 8, 2015
Whether oil prices will remain depressed or rebound depends on how oil producers respond. Figure II-29 shows that U.S. oil production continued to increase through the end of 2014, amid declining oil prices. In 2015, U.S. oil producers are starting to react by cutting investment and slowing production. Shale producers cut drilling rigs by about one-third, but maintain production levels by cutting costs—by laying off workers—and increasing productivity on remaining rigs. So production output may not decline significantly.25 On the contrary, February figures show U.S. oil production continued to rise, according to an International Energy Agency report.26 Uncertainty in the oil market remains very high,27 although some analysts predict that oil prices will stabilize in 2015 and slowly climb back up as low prices eventually force production cuts and the acceleration of the U.S. economy and the global economy increase oil demand.28 29 The U.S. Energy Information Administration’s latest projections show this pattern, but the agency cautions that the “future path of crude oil prices can vary substantially” (Figure II-29). The WTI oil spot price is projected to average $52.48 per barrel in 2015 and then increase to an average $70 per barrel in 2016.
25 Bart van Ark and Willem Ovemeer, “Getting a Handle on Energy, The Economic and Business Impact of Changing Oil Price Scenarios,” Research Report R-1578-15, The Conference Board, April 2015, <https://www.conference-board.org/energy-global-growth>. 26 Benoit Faucon, “IEA: Strong U.S. Production Could Set Stage for Oil Price Fall,” The Wall Street Journal, March 13, 2015. 27 U.S. Energy Information Administration, “Market Prices and Uncertainty Report,” Short-Term Energy Outlook, April 2015, <http://www.eia.gov/forecasts/steo/> 28 Mark Zandi, “U.S. Macro Outlook 2015: Spirits Unleashed,” Dismal Scientist, Moody’s Analytics, December 12, 2014. 29 “Oil Prices,” The Wall Street Journal Economic Forecasting Survey, April 2015.

DALLAS LOVE FIELD Financial Feasibility Report
Unison Consulting, Inc. II-40 June 8, 2015
Figure II-29 U.S. ENERGY INFORMATION ADMINISTRATION SHORT-TERM OUTLOOK
U.S. CRUDE OIL PRICES CY 2011-2016
Source: U.S. Energy Information Administration, “Table 2: U.S. Energy Prices,” Short-Term Energy and Summer Fuels Outlook, April 7, 2015.
N. OUTLOOK FOR TEXAS AND THE MSA The positive outlook of the U.S. economy bodes well for both Texas and the MSA. Clearly a decline in the oil industry poses a threat—more so to the state economy, which still has the largest oil industry in the country, than to the more diverse Dallas-Fort Worth-Arlington metro economy. The continued decline in oil prices in 2015 is starting to hurt the Texas economy as oil companies begin to cut new capital investment and lay off workers. The cuts in the oil industry are also causing a decline in manufacturing activity. But the Texas economy is so large—and also now much more diverse than it was during the oil busts in the 1970s and 1980s—that a decline in one industry is unlikely to cause the Texas economy to decline.30 Texas is the largest oil-producing state in the country (Figure II-30). In January 2015, Texas produced 107.29 million barrels of crude oil, accounting for 38 percent of total U.S. production (including federal offshore production). Behind Texas, North Dakota produced 36.9 million barrels—only one-third of Texas’ production.
30 Chris Lafakis, Adam Kamins, Edward Friedman and Dan White, “The Economics of Lower Oil Prices,” Analysis, Moody’s Analytics Economics & Consumer Credit Analytics, January 14, 2015, <https://www.economy.com/the-economics-of-lower-oil-prices>.
94.86 94.12 97.9193.26
52.48
70.00
2011 2012 2013 2014 2015 2016
Historical Forecast
WTI�Crude�Oil�Price�(Dollars�per�Barrel)

DALLAS LOVE FIELD Financial Feasibility Report
Unison Consulting, Inc. II-41 June 8, 2015
Figure II-30 U.S. STATES CRUDE OIL PRODUCTION
January 2015
Rankings are based on the full source data values, excluding federal offshore production. Source: U.S. Energy Information Administration, Rankings: Crude Oil Production, January 2015. While Texas’ oil production is the largest in the country, mining (which includes oil drilling) represents a relatively small share of the state economy—around 13 percent in 2013, the most recent year for which statistics are available (Figure II-31). So even if mining employment decreases significantly, the state economy should continue to grow overall, according to an analysis by Moody’s Analytics.31 Wells Fargo Securities Economics Group, in their 2015 economic outlook for southern states, also do not see a repeat of Texas’ experience in the 1980s, although they see growth slowing in Texas particularly in major oil markets such as Houston, Midland-Odessa, San Antonio, and Longview. The Wells Fargo study notes the considerable diversification of the Texas 31 Chris Lafakis, Adam Kamins, Edward Friedman and Dan White, “The Economics of Lower Oil Prices,” Analysis, Moody’s Analytics Economics & Consumer Credit Analytics, January 14, 2015, <https://www.economy.com/the-economics-of-lower-oil-prices>.

DALLAS LOVE FIELD Financial Feasibility Report
Unison Consulting, Inc. II-42 June 8, 2015
economy over the past 30 years, and this should allow Texas to weather the fall in oil prices.32
Figure II-31 MINING AS A SHARE OF THE STATE ECONOMY
FOR TEXAS, OTHER OIL-PRODUCING STATES, AND THE UNITED STATES CY 2003-2013
Source: U.S. Energy Information Administration using data from the U.S. Bureau of Economic Analysis.
The Federal Reserve Bank of Dallas’ 2015 Texas Economic Outlook sees job growth slowing in Texas from about 3.6 percent in 2014 to between 2 percent and 2.5 percent in 2015. Like Wells Fargo, the Dallas Fed does not see Texas going into recession like it did in the 1980s because the state economy is now more diverse.33 34 The Perryman Short-Term Economic Forecast for Texas projects an 11 percent increase in jobs and a 24 percent increase in economic output in Texas from 2014 to 2019.35 The MSA economy is even less vulnerable to the oil price decline. Moody’s Analytics puts the Dallas metropolitan division in the “No Risk” category and the Fort Worth
32 Mark Vitner, Michael T. Wolf, and Alex V. Moehring, “Southern States: Economic Outlook, Economic Development Drives Growth Across the South,” Special Commentary, Wells Fargo Securities Economics Group, February 12, 2015. 33 Keith Phillips, 2015 Texas Economic Outlook: Tapping on the Brakes, Federal Reserve Bank of Dallas San Antonio Branch, January 13, 2015. 34 “2015 Texas Job Growth Forecast Still Healthy Despite Oil Price Shock, Says Dallas Fed,” News Releases, Federal Reserve Bank of Dallas, January 13, 2015. 35 The Perryman Group, Selections from The Perryman Short-Term Economic Forecast, February 9, 2015, <http:\\www.perrymangroup.com>.

DALLAS LOVE FIELD Financial Feasibility Report
Unison Consulting, Inc. II-43 June 8, 2015
metropolitan division in the “Mid Risk” category.36 The Perryman Short-Term Economic Forecast expects continued growth in each metropolitan division, as follows:
� Dallas - a 12 percent increase in jobs and a 24 percent increase in economic output from 2014 to 2019
� Fort Worth - an 11 percent increase in jobs and also a 24 percent increase in economic output from 2014 to 2019
Supporting their forecast for the Dallas metropolitan division, The Perryman Group cites the area’s recent expansion at an impressive rate, Dallas’ ranking among the top 10 cities for technology in the United States, and Greater Dallas’ ability to attract large corporate headquarters. For their forecast for the Fort Worth metropolitan division, The Perryman Group notes recent business relocations and expansions in the area. 37 O. SUMMARY Demographic and economic trends in the Airport’s air service area, the state of Texas, and the nation influence passenger traffic at DAL. This section examined trends in key demographic and economic indicators, which all show the rapid expansion that has been taking place in Texas and in the MSA, the Airport’s air service area since the mid-2000s. While the recent oil boom—spurred by technology advances in shale drilling—contributed to the recent expansion, non-energy service-providing sectors—education and health services, leisure and hospitality, and professional and business services—are driving much of the growth in the state and more so in the more economically diverse MSA. Concentrations of advanced industries have also developed across Texas, some of them in the Dallas-Fort Worth-Arlington area. Set back only mildly by the Great Recession, overall growth in Texas and the MSA—since 2000 and since the end of the Great Recession in 2009—has outpaced national growth by a wide margin. This growth momentum is expected to continue, although the cuts in capital budgets and workforces in the oil industry, facing falling oil prices, are expected to slow the pace of growth in Texas and less so in the MSA. The acceleration of the national economy, which stands to reap net gains from falling oil prices, will help fuel the growth momentum in Texas and the MSA. Below are the major highlights of the analysis in this section:
� The air service area’s central location offers advantages in communication access to West and East Coast companies, air travel to the West and East Coast, and market reach for ground shipments.
36 Chris Lafakis, Adam Kamins, Edward Friedman and Dan White, “Most Vulnerable Metro Areas to Oil Price Decline,” in “The Economics of Lower Oil Prices – Frequently Asked Questions,” Analysis, Moody’s Analytics Economics & Consumer Credit Analytics, January 2015, <https://www.economy.com/the-economics-of-lower-oil-prices>. 37 The Perryman Group, Selections from The Perryman Short-Term Economic Forecast, February 9, 2015, <http:\\www.perrymangroup.com>.

DALLAS LOVE FIELD Financial Feasibility Report
Unison Consulting, Inc. II-44 June 8, 2015
� Having the fourth largest metro area population in the country, the MSA offers a large market that has been growing at more than twice the national population growth rate, in a state that has been growing at twice the national rate.
� Vibrant conditions in the MSA and Texas labor markets show in sharply increasing business establishments, jobs, labor force, and employment; and in falling unemployment rates that are well below national unemployment rates.
� The composition of the MSA and Texas employment by industry reflect diverse economies with private service-providing sectors as growth drivers. The Texas economy, while still the largest oil producing state in the country, has diversified considerably since the 1980s’ oil bust.
� Both the MSA and Texas have drawn a lot of large company headquarters. The MSA alone has 18 Fortune 500 company headquarters and 9 other large private company or corporate subsidiary headquarters.
� Concentrations of advanced industries have developed across Texas, many in the MSA. These have created specialized workforces that continue to attract expansion and relocation in the area of firms in the same or related industries.
� Tourism is one of the biggest drivers of the MSA and the Texas economy. The MSA is a popular destination for both business and leisure visitors.
� Growth in the MSA GDP and the Texas GDP have also far outpaced national growth since the mid-2000s. Proportionally, the metro area GDP grew 1.7 times as much as the U.S. GDP did from 2001 to 2013; the Texas GDP, twice as much.
� The MSA has higher per capital personal incomes and wages and salaries than Texas and the nation, although growth in these measures has been slower in the MSA.
� Relative to other metropolitan areas close in population size, the MSA has lower living costs, which combine strategically with higher wages and salaries in attracting workers and businesses.
� A major driver of both the MSA and the Texas economy, the U.S. economy is in an expansion phase. It is expected to accelerate during the remainder of 2015 through the end of 2016 and continue growing for a number of years after 2016. Threats to national growth come mainly from geopolitical conflicts and economic sluggishness abroad. The U.S. economy will suffer losses from a decline in the U.S. oil industry, but stands to gain more from the expected boost in consumer spending resulting from fuel cost savings.
� The sharp decline in oil prices is starting to hurt U.S. oil producers. So far they have reacted by shutting down less productive rigs, cutting capital budgets, and laying off

DALLAS LOVE FIELD Financial Feasibility Report
Unison Consulting, Inc. II-45 June 8, 2015
workers. The situation in the U.S. oil industry is tenuous. The outlook depends upon whether oil prices will fall further or climb back up.
� The cuts in the oil industry are starting to show in state employment and manufacturing activity data. Both declined in March. Despite these setbacks, the Texas economy—now more diverse than it was in the 1980s—is expected to continue growing, albeit at a slower pace.
� The MSA is even less vulnerable to a decline in the oil industry. The metro area economy has historically been very diverse, driven by private service-producing sectors unrelated to the oil industry. The MSA is also expected to continue growing at a slower pace.

DALLAS LOVE FIELD Financial Feasibility Report
Unison Consulting, Inc. III-1 June 8, 2015
SECTION III AVIATION ACTIVITY ANALYSIS AND FORECASTS
This section reviews the historical trends in commercial aviation activity at the Airport and presents forecasts of enplanements, aircraft departures and landed weight. The section also discusses the underlying market factors and relevant industry developments. A. CURRENT AIR SERVICE DAL is a medium hub airport, which is the FAA’s category of airports serving at least .25 percent but less than 1 percent of annual U.S. enplanements. Based on CY 2013 U.S. airport traffic data compiled by the Airports Council International-North America (the most recent year for which the data are available), DAL ranked 43rd in total passengers, behind Sacramento International Airport and ahead of San Antonio International Airport. It ranked 49th in total aircraft operations, behind Cleveland-Hopkins International Airport and ahead of San Antonio International Airport. In CY 2013, DAL served 8.47 million passengers and 177,417 aircraft operations. As of May 2015, the Airport had scheduled service by four air carriers: Southwest Airlines (Southwest), Virgin America (Virgin), Delta Air Lines (Delta), and SeaPort Airlines (SeaPort) – see Table III-1.
Table III-1 SCHEDULEDAIR CARRIERS AT DALLAS LOVE FIELD
As of May 2015
Southwest is a signatory airline at the Airport, with preferential use of 16 gates. Southwest also operates flights on two additional gates pursuant to a sublease agreement with United Airlines (United), which ceased operations at the Airport in March 2015. One of the two additional gates used by Southwest is shared with Delta, which also has a sublease agreement with United. Virgin operates from two gates pursuant to a sublease agreement with American Airlines (American), which was required to relinquish control over its two gates in 2013 as part of an antitrust settlement agreement between the U.S. Department of Justice and American and US Airways related to the merger of American and US Airways. Virgin shares one of its gates with SeaPort, which also has a sublease agreement with American. Charter airlines such as Miami Air International and Pace Airlines provided seasonal non-scheduled service. There are no scheduled all-cargo carriers at the Airport.
Mainline RegionalSouthwest Airlines SeaPort AirlinesVirgin AmericaDelta Air Lines
Source: Airport records.

DALLAS LOVE FIELD Financial Feasibility Report
Unison Consulting, Inc. III-2 June 8, 2015
B. HISTORICAL PASSENGER TRAFFIC TRENDS Over the years, the Airport’s passenger traffic has grown and declined with the U.S. economy. Growth, however, had been limited by restrictions on DAL air service placed by the Wright Amendment. These restrictions had been relaxed by amendments in 1997 and 2005, and repealed completely—in phases—by the Wright Amendment Reform Act of 2006. Figure III-1 shows the trends in annual enplanements from FY 1990 to 2014. The 1990s began with a U.S. economic recession that lasted from June 1990 to March 1991. The Airport weathered the recession with only 3 percent decline in enplanements in FY 1991. The recession was followed by an economic expansion through March 2001—the longest in U.S. history. The Airport’s enplanements recovered quickly in FY 1992 and increased 13 percent in FY 1993 as Southwest continued expanding service from DAL, within the limits placed by the Wright Amendment. A law introduced by Senator Richard Shelby of Alabama passed in October 1997, which modified the Wright Amendment to permit nonstop flights to Alabama, Kansas, and Mississippi (the Shelby Amendment). Litigation delayed new service resulting from the Shelby Amendment, and enplanements did not increase until FY 1999-2000. From FY 1990 to FY 2000, enplanements increased a total 21.6 percent (an average 2.1 percent per year). The 2000s has been an eventful decade for the entire aviation industry and the Airport. The following events created challenges for the entire industry:
� The long-running U.S. economic expansion from the early 1990s ended with the brief recession, which lasted from March to November 2001. While the U.S. economy was in recession, terrorists attacked U.S. aviation on September 11 2001, causing already weak air travel demand to plummet.
� The significant decline in air travel and the stringent airport security measures following the terrorist attacks prompted lasting structural changes in travel behavior and airline business practices.
� Meanwhile, jet fuel prices quadrupled from 2002 to 2008, and remained near record high levels before falling sharply in recent months.
� Amid record fuel prices, the U.S. economy entered the Great Recession from December 2007 to June 2009. The Great Recession was the longest and deepest recession since the Great Depression. The recovery from the Great Recession has also been the slowest of all recoveries from previous recessions since the Great Depression. The Great Recession weakened demand for both passenger and cargo air services.
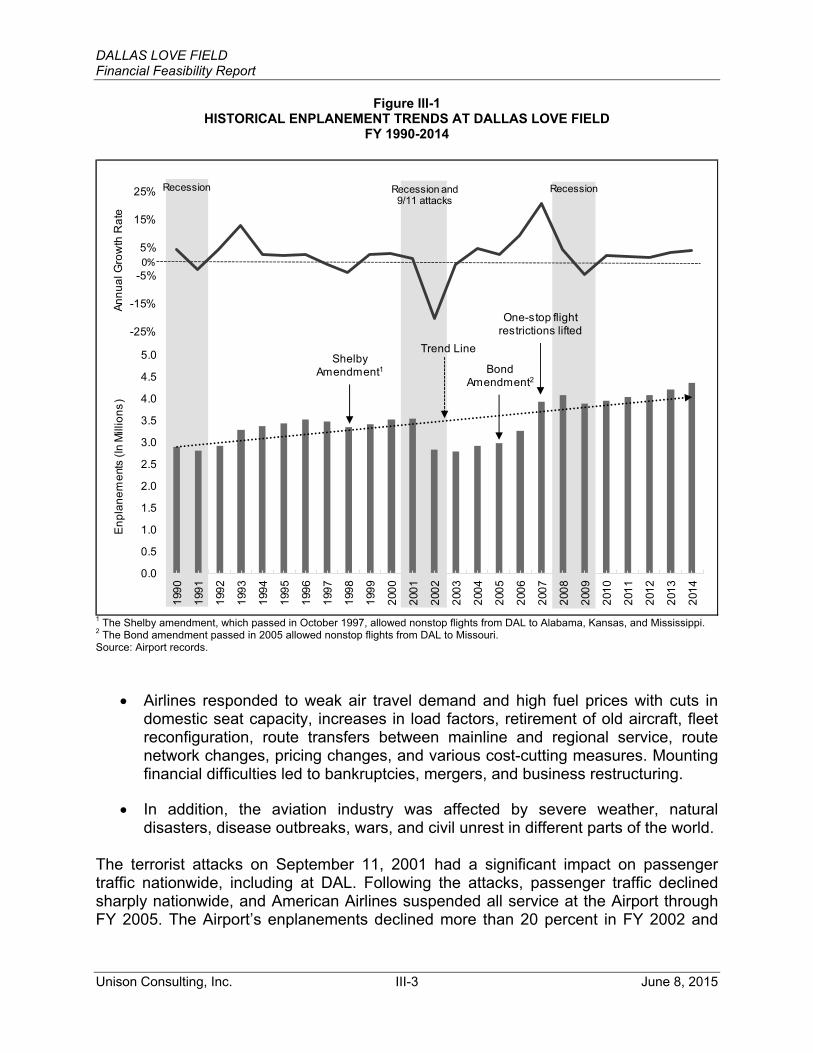
DALLAS LOVE FIELD Financial Feasibility Report
Unison Consulting, Inc. III-3 June 8, 2015
Figure III-1 HISTORICAL ENPLANEMENT TRENDS AT DALLAS LOVE FIELD
FY 1990-2014
1 The Shelby amendment, which passed in October 1997, allowed nonstop flights from DAL to Alabama, Kansas, and Mississippi. 2 The Bond amendment passed in 2005 allowed nonstop flights from DAL to Missouri. Source: Airport records.
� Airlines responded to weak air travel demand and high fuel prices with cuts in domestic seat capacity, increases in load factors, retirement of old aircraft, fleet reconfiguration, route transfers between mainline and regional service, route network changes, pricing changes, and various cost-cutting measures. Mounting financial difficulties led to bankruptcies, mergers, and business restructuring.
� In addition, the aviation industry was affected by severe weather, natural disasters, disease outbreaks, wars, and civil unrest in different parts of the world.
The terrorist attacks on September 11, 2001 had a significant impact on passenger traffic nationwide, including at DAL. Following the attacks, passenger traffic declined sharply nationwide, and American Airlines suspended all service at the Airport through FY 2005. The Airport’s enplanements declined more than 20 percent in FY 2002 and
0.0
0.5
1.0
1.5
2.0
2.5
3.0
3.5
4.0
4.5
5.0
1990
1991
1992
1993
1994
1995
1996
1997
1998
1999
2000
2001
2002
2003
2004
2005
2006
2007
2008
2009
2010
2011
2012
2013
2014
Enpl
anem
ents
(In
Mill
ions
)
-25%
-15%
-5%
5%
15%
25%
Annu
al G
row
th R
ate
RecessionRecession and 9/11 attacks
Recession
Shelby Amendment1 Bond
Amendment2
One-stop flight restrictions lifted
0%
Trend Line

DALLAS LOVE FIELD Financial Feasibility Report
Unison Consulting, Inc. III-4 June 8, 2015
another 1 percent in FY 2003. After FY 2003, the Airport enjoyed five years of steady growth, which was interrupted by the Great Recession. Before the Great Recession began in January 2008, the Airport benefitted from two more modifications to Wright Amendment restrictions. In 2005, Senator Kit Bond of Missouri attached an amendment to a transportation spending bill to permit nonstop flights to Missouri (the Bond amendment). In October 2006, the Wright Amendment Reform Act was passed to lift all remaining Wright Amendment restrictions. This new law allowed one-stop and connecting flights to any U.S. destination effective immediately and nonstop flights to any U.S. destination effective October 13, 2014. Air service at DAL expanded immediately after the law was passed. DAL’s enplanements increased more than 20 percent in FY 2007 and another 4 percent in FY 2008, the first year of the Great Recession. Weak demand and airline capacity cuts during the Great Recession finally caused Airport enplanements to decrease almost 5 percent in FY 2009. But since then, Airport enplanements have increased steadily as Southwest geared up to increase nonstop service from DAL. From FY 2000 to 2014, Airport enplanements increased a total 24 percent (an average 1.9 percent per year). 1. Enplanement Trends at DAL and the United States in the Past 10 Years Boosted by air service expansion following the lifting of all one-stop service restrictions in October 2006, DAL’s enplanements increased far more sharply than U.S. system enplanements over the past 10 years (Figure III-2). Enplanements at the Airport increased by 46 percent from approximately 3 million in FY 2005 to 4.4 million in FY 2014 (an average 4.3 percent annually). U.S. system enplanements increased only 2 percent (an average 0.2 percent annually) over the same 10 years. In FY 2014, they were still a percentage short of their pre-recession peak level in FY 2007. As a result, DAL’s share of U.S. total enplanements increased from 0.4 percent in FY 2005 to 0.57 percent in FY 2014. 2. Enplanement Trends at DAL, DFW, and Select Medium Hub, Southwest Focus
Airports in the Past Five Years Over the past five calendar years, DAL’s enplanements grew moderately relative to enplanements at DFW and six other medium hub airports in Southwest’s focus cities (Figure III-3). DAL’s enplanements increased 12 percent, a third less than DFW enplanements (17 percent). Five of the six other medium hub airports included in the figure gained enplanements, ranging from 3 percent at Lambert-St. Louis International Airport to 38 percent at Houston’s William P. Hobby Airport (HOU). The remaining medium hub airport, Milwaukee’s General Mitchell International Airport lost 31 percent. Southwest’s share of DAL’s enplanements in CY 2014 (97 percent) was the largest among the seven medium hub airports. Its share at HOU (89 percent) was the second largest; and at Oakland International Airport (76 percent), the third largest.

DALLAS LOVE FIELD Financial Feasibility Report
Unison Consulting, Inc. III-5 June 8, 2015
Figure III-2
DAL AND U.S. SYSTEM ENPLANEMENT GROWTH TRENDS FY 2005-2014
Sources: Airport records and U.S. Bureau of Transportation Statistics.
80
90
100
110
120
130
140
150
2005 2006 2007 2008 2009 2010 2011 2012 2013 2014
Enplanement Index (2005 level = 100)
US, 102
DAL, 146
-10%
-5%
0%
5%
10%
15%
20%
25%
2005 2006 2007 2008 2009 2010 2011 2012 2013 2014
Annual Growth Rate
0.40% 0.43% 0.51% 0.53% 0.55% 0.55% 0.54% 0.55% 0.56% 0.57%
2005 2006 2007 2008 2009 2010 2011 2012 2013 2014
Airport Share of U.S. Total
Recession
One stop flight restrictions lifted

DALLAS LOVE FIELD Financial Feasibility Report
Unison Consulting, Inc. III-6 June 8, 2015
Figure III-3
ENPLANEMENTS AT DAL, DFW, AND OTHER MEDIUM HUB, SOUTHWEST FOCUS AIRPORTS
CY 2010-2014
The numbers in parentheses indicate ranking among U.S. commercial service airports from highest to lowest total enplanements in CY 2014. Source: FAA Passenger Boarding (Enplanement) and All-Cargo Data for U.S. Airports.
60
70
80
90
100
110
120
130
140
150
CY 2010 CY 2011 CY 2012 CY 2013 CY 2014
Enplanement Index (CY 2010 Level = 100)
Love Field Milwaukee
Oakland Nashville
Houston Hobby St. Louis
New Orleans Dallas-Ft. Worth
-31.1%
2.6%
10.6%
12.2%
16.7%
16.8%
18.5%
37.6%
Milwaukee (49)
St. Louis (31)
Oakland (36)
Love Field (44)
Dallas-Ft. Worth (4)
Nashville (33)
New Orleans (37)
Houston Hobby (32)
Percentage Change from CY 2010-2014
97%89%
76%
49%42% 38% 38%
Southwest Airlines' Share of CY 2014 Airport Enplanements

DALLAS LOVE FIELD Financial Feasibility Report
Unison Consulting, Inc. III-7 June 8, 2015
3. Composition of Passenger Traffic at DAL DAL’s passenger traffic consists entirely of domestic passengers, mostly O&D. The O&D portion of DAL’s passenger traffic increased slightly from 75 percent in FY 2010 to 77 percent in FY 2014 (Figure III-4). The connecting portion decreased slightly from 25 percent to 23 percent—all carried by Southwest.
Figure III-4 O&D AND CONNECTING TRAFFIC SHARES
FY 2010-2014
Source: Airport records.
25% 26% 24% 24% 23%
75% 74% 76% 76% 77%
2 0 1 0 2 0 1 1 2 0 1 2 2 0 1 3 2 0 1 4
Connecting
O&D

DALLAS LOVE FIELD Financial Feasibility Report
Unison Consulting, Inc. III-8 June 8, 2015
4. Monthly Enplanements A seasonal pattern in enplanements is typical of most airports. At DAL, however enplanement levels do not vary much from month-to-month except in January and February when they are lowest (see trend lines for FY 2010-2014 in Figure III-5). They are highest in June and July, but not much higher than in other months. Figure III-5 shows how much passenger traffic has been growing each month since the remaining restriction on nonstop service from DAL was lifted on October 13, 2014—more than 43 percent year-over-year since November. Through March, FY 2015 enplanements are up 40 percent over the same period in FY 2014.
Figure III-5 DAL MONTHLY ENPLANEMENTS
October 2010-March 2015
The call-out boxes show the year-over-year growth in FY 2015. The remaining Wright Amendment restriction on nonstop service was lifted effective October 13, 2014. Source: Airport records. 5. Enplanements by Airline Four airline brands provide service at DAL, but Southwest has the largest market share (Figure III-6). Southwest has captured more than a 90 percent share of DAL’s enplanements since 1974, when all airlines except Southwest moved operations from DAL to the new Dallas-Fort Worth International Airport. Southwest began service just three years before—on June 18, 1971—with a schedule of 6 roundtrip flights between DAL and San Antonio International Airport, and 12 round trip flights between DAL and then Houston Intercontinental Airport (now George Bush Intercontinental Airport).
Share ofMonth FY TotalOctober 8.6%November 8.1%December 8.2%January 7.5%February 7.2%March 8.6%April 8.4%May 8.8%June 9.0%July 9.0%August 8.5%September 8.0%
Oct, up 13.3%
Nov, up 43.5%
Dec, up 46.5%Jan, up 47.8%
Feb, up 44.3%
Mar, up 49.7%
250,000
300,000
350,000
400,000
450,000
500,000
550,000
600,000
Oct Nov Dec Jan Feb Mar Apr May Jun Jul Aug Sep
Monthly Enplanements
2010 2011 2012 2013 2014 2015

DALLAS LOVE FIELD Financial Feasibility Report
Unison Consulting, Inc. III-9 June 8, 2015
Figure III-6 DALLAS LOVE FIELD ENPLANEMENTS BY AIRLINE
FY 2005-2015 (through March 2015)
Source: Airport records. Figure III-6 contains the following charts showing the trends in DAL enplanements by airline:
� a bar chart showing a breakdown of enplanements by airline since FY 2005,
� trend lines comparing growth in Southwest’s enplanements with growth in enplanements by all other carriers, and
� a pie chart showing airline market shares during the first half of FY 2015.
0.0
0.5
1.0
1.5
2.0
2.5
3.0
3.5
4.0
4.5
2005 2006 2007 2008 2009 2010 2011 2012 2013 2014
Mill
ions
Enplanements by Airline
SeaPort
Delta
American
United & Continental
Southwest
Southwest91%
United & Continental
1%
Virgin6%
Delta2%
SeaPort0.04%
Other9%
Airline Market Shares, 1st Half of FY 2015
50
100
150
200
250
300
2005 2006 2007 2008 2009 2010 2011 2012 2013 2014
Enplanement Index (2005 = 100)
Southwest All Others

DALLAS LOVE FIELD Financial Feasibility Report
Unison Consulting, Inc. III-10 June 8, 2015
Table III-2 shows the underlying airline enplanement data. Over the past 10 years, Southwest’s share of DAL’s annual enplanements ranged from a low 90.9 percent in FY 2006 to a high 97.5 percent in FY 2011 and 2012. The following carriers accounted for the remaining share, which ranged from 2.5 percent to 9.1 percent during the period of FY 2005 through the first six months of FY 2015:
� United and Continental Airlines (merged in October 2010) operated at DAL through March 2015.
� American operated from FY 2006 through FY 2009, offering mainline service through FY 2007 and regional service through FY 2009. American continued leasing two gates at DAL after it ended service, and subleased those gates to Delta. As part of an antitrust settlement agreement between the U.S. Department of Justice and American and US Airways related to the merger of American and US Airways, American was required to relinquish control over its gates at DAL in 2013.
� Delta began operations at DAL in FY 2009 with regional aircraft, also began mainline service at DAL in October 2014. Delta is currently operating on the one of the gates that had been used by United.
� Virgin America (Virgin) began operations at DAL in October 2014, operating on the two gates that had been used by American.
� SeaPort began operations at DAL in FY 2011. Based in Portland, Oregon, SeaPort is a scheduled commuter airline currently offering two flights a day from DAL to Hot Springs, Arkansas (as of May 2015) using nine-seat Cessna turboprop aircraft.
Of the air carriers mentioned above, the following scheduled air carriers are currently operating at DAL (as of May 2015): Southwest, Delta, Virgin, and SeaPort. Southwest currently operates on 18 gates (one of which it shares with Delta), Virgin currently operates on two gates, one of which it shares with SeaPort.

DALLAS LOVE FIELD Financial Feasibility Report
Unison Consulting, Inc. III-11 June 8, 2015
Table III-2 DALLAS LOVE FIELD ENPLANEMENTS BY AIRLINE
FY 2005-2015 (through March 2015)
Source: Airport records.
Airline FY 2005 FY 2006 FY 2007 FY 2008 FY 2009 FY 2010 FY 2011 FY 2012 FY 2013 FY 2014Oct-Mar
2014Oct-Mar
2015Mainline
Southwest 2,863,010 2,948,678 3,606,129 3,853,325 3,722,812 3,823,138 3,916,851 3,973,171 4,052,521 4,206,949 2,035,493 2,687,003American 95,576 47,807Delta 52,702Virgin 165133
Subtotal 2,863,010 3,044,254 3,653,936 3,853,325 3,722,812 3,823,138 3,916,851 3,973,171 4,052,521 4,206,949 2,035,493 2,904,838
RegionalUnited & Continental 113,452 156,108 151,160 135,146 102,828 90,891 61,905 68,715 93,341 82,829 40,044 39,688American 44,012 105,451 79,797 36,385Delta 9,662 35,093 38,365 29,442 55,725 66,005 29,702 11,824SeaPort 552 2,839 3,064 2,103 943 1,255
Subtotal 113,452 200,120 256,611 214,943 148,875 125,984 100,822 100,996 152,130 150,937 70,689 52,767
Total 2,976,462 3,244,374 3,910,547 4,068,268 3,871,687 3,949,122 4,017,673 4,074,167 4,204,651 4,357,886 2,106,182 2,957,605
Annual Change 2.5% 9.0% 20.5% 4.0% -4.8% 2.0% 1.7% 1.4% 3.2% 3.6% 4.8% 40.4%
Market ShareMainline 96.2% 93.8% 93.4% 94.7% 96.2% 96.8% 97.5% 97.5% 96.4% 96.5% 96.6% 98.2%Regional 3.8% 6.2% 6.6% 5.3% 3.8% 3.2% 2.5% 2.5% 3.6% 3.5% 3.4% 1.8%
Total 100.0% 100.0% 100.0% 100.0% 100.0% 100.0% 100.0% 100.0% 100.0% 100.0% 100.0% 100.0%
Enplanements

DALLAS LOVE FIELD Financial Feasibility Report
Unison Consulting, Inc. III-12 June 8, 2015
Southwest’s enplanements increased sharply in FY 2007 after through-ticketing restrictions were lifted on October 13, 2006. Since then, they have increased slowly and steadily, while enplanements by other airlines have fluctuated widely. Enplanements by all other airlines fell sharply after FY 2007, when American ended its mainline service at DAL, leaving only regional service that American pared down until ending DAL service completely in FY 2009. Delta has increased its traffic at DAL in the past two years. United also increased its traffic at DAL in the last two years, but it ended its DAL service in March 2015. Since American ended mainline service at DAL in FY 2007, Southwest had been the only airline providing mainline service until Virgin and Delta began mainline service in FY 2015. Virgin quickly captured a 5.6 percent share of total enplanements during the first six months of FY 2015, and Delta increased its share of DAL enplanements to 2.2 percent during the first six months of FY 2015, from 1.4 percent during the first six months of FY 2014. The increases in the market shares of Virgin and Delta resulted in a reduction in Southwest’s market share to 91 percent of Airport enplanements during the first six months of FY 2015, from 97 percent during the first six months of FY 2014. 6. Top O&D Markets O&D traffic accounts for more than three-quarters of the Airport’s enplanements. Table III-3 and Figure III-7 present the top 25 O&D markets from DAL in FY 2014, ranked by share of FY 2014 O&D enplanements. The table also shows the airports served in each market, the number of daily nonstop departures to each market from DAL in FY 2014 and 2015, and the airlines serving each market from DAL. The top 25 markets include 10 of the 25 largest metropolitan statistical areas in the United States based on 2014 population estimates. Eight are in Texas, and the other 17 are spread across the Southeastern, Southwestern and Midwestern portions of the country. Together these 25 markets account for nearly 86 percent of DAL’s O&D traffic and 116 of the total 127 flights per day from DAL in FY 2014. The number of flights to these markets increased 24 percent in FY 2015, to 144 out of 172 total. The top 5 markets by share of DAL’s O&D traffic are Houston, San Antonio, New Orleans, Austin, and Kansas City.
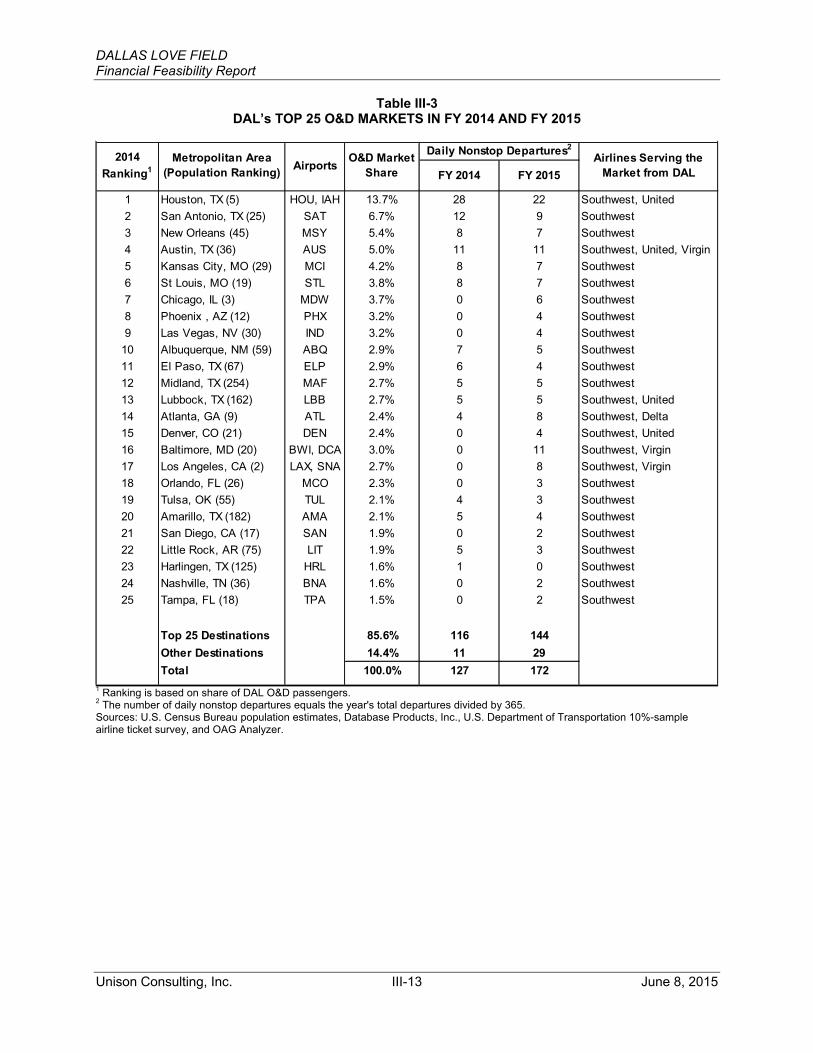
DALLAS LOVE FIELD Financial Feasibility Report
Unison Consulting, Inc. III-13 June 8, 2015
Table III-3 DAL’s TOP 25 O&D MARKETS IN FY 2014 AND FY 2015
1 Ranking is based on share of DAL O&D passengers. 2 The number of daily nonstop departures equals the year's total departures divided by 365. Sources: U.S. Census Bureau population estimates, Database Products, Inc., U.S. Department of Transportation 10%-sample airline ticket survey, and OAG Analyzer.
FY 2014 FY 2015
1 Houston, TX (5) HOU, IAH 13.7% 28 22 Southwest, United2 San Antonio, TX (25) SAT 6.7% 12 9 Southwest3 New Orleans (45) MSY 5.4% 8 7 Southwest4 Austin, TX (36) AUS 5.0% 11 11 Southwest, United, Virgin5 Kansas City, MO (29) MCI 4.2% 8 7 Southwest6 St Louis, MO (19) STL 3.8% 8 7 Southwest7 Chicago, IL (3) MDW 3.7% 0 6 Southwest8 Phoenix , AZ (12) PHX 3.2% 0 4 Southwest9 Las Vegas, NV (30) IND 3.2% 0 4 Southwest
10 Albuquerque, NM (59) ABQ 2.9% 7 5 Southwest11 El Paso, TX (67) ELP 2.9% 6 4 Southwest12 Midland, TX (254) MAF 2.7% 5 5 Southwest13 Lubbock, TX (162) LBB 2.7% 5 5 Southwest, United14 Atlanta, GA (9) ATL 2.4% 4 8 Southwest, Delta15 Denver, CO (21) DEN 2.4% 0 4 Southwest, United16 Baltimore, MD (20) BWI, DCA 3.0% 0 11 Southwest, Virgin17 Los Angeles, CA (2) LAX, SNA 2.7% 0 8 Southwest, Virgin18 Orlando, FL (26) MCO 2.3% 0 3 Southwest19 Tulsa, OK (55) TUL 2.1% 4 3 Southwest20 Amarillo, TX (182) AMA 2.1% 5 4 Southwest21 San Diego, CA (17) SAN 1.9% 0 2 Southwest22 Little Rock, AR (75) LIT 1.9% 5 3 Southwest23 Harlingen, TX (125) HRL 1.6% 1 0 Southwest24 Nashville, TN (36) BNA 1.6% 0 2 Southwest25 Tampa, FL (18) TPA 1.5% 0 2 Southwest
Top 25 Destinations 85.6% 116 144Other Destinations 14.4% 11 29Total 100.0% 127 172
Airlines Serving the Market from DAL
2014 Ranking1
Metropolitan Area (Population Ranking) Airports O&D Market
Share
Daily Nonstop Departures2

DALLAS LOVE FIELD Financial Feasibility Report
Unison Consulting, Inc. III-14 June 8, 2015
Figure III-7 DALLAS LOVE FIELD’S TOP 25 O&D MARKETS IN FY 2014
The bubble markers are sized relative to each market’s share of the Airport’s FY 2014 O&D enplanements. Sources: Database Products, Inc., U.S. Department of Transportation 10%-sample airline ticket survey, and OAG Analyzer. 7. Scheduled Nonstop Passenger Airline Service
Figure III-8 presents the trends in scheduled passenger service at the Airport from FY 2011 through 2015. The figure shows the trends in seats, departures, seats per departure, and nonstop destinations. By all measures, air service at DAL had been fairly steady, until the big expansion in FY 2015 with the lifting of domestic nonstop flight restrictions effective October 13, 2014.
The most important measure of service capacity is the number of seats per day, which ranged between 16,300 and 16,500 until a 44 percent increase to 23,500 in FY 2015. The number of departures per day ranged between 127 and 130 until a 36 percent increase to 172 in FY 2015. The number of seats per flight increased from a narrow range of 126-129 in the past four years to 136 in FY 2015, with the addition of the 175-seat 737-800 aircraft in Southwest’s fleet at DAL and the addition of new mainline service from Virgin and Delta.

DALLAS LOVE FIELD Financial Feasibility Report
Unison Consulting, Inc. III-15 June 8, 2015
Figure III-8 TRENDS IN SCHEDULED AIR SERVICE AT DALLAS LOVE FIELD
FY 2011-2015
Source: OAG Schedules Analyzer.
21 21 23 23
53
2 0 1 1 2 0 1 2 2 0 1 3 2 0 1 4 2 0 1 5
N O N � STOP�A I R POR T�D ES T IN ATI ONS: �A LL �A I R L INES
117 117 117 115150
2 0 1 1 2 0 1 2 2 0 1 3 2 0 1 4 2 0 1 5
A V ER AGE�DEP A RTURES �P ER �D A Y
Virgin
All�Others
Delta
United
Southwest
2 0 1 1 2 0 1 2 2 0 1 3 2 0 1 4 2 0 1 5
A V ER AGE�S EA TS�P ER �D A Y
Virgin
All�Others
Delta
United
Southwest
129 127 126 129 136
2 0 1 1 2 0 1 2 2 0 1 3 2 0 1 4 2 0 1 5
A V ER AGE�S EA TS�P ER �DEP A RTURE :A LL �A I R L I NES
128 130 130 127
172
16.5K 16.4K 16.3K
23.5K
16.4K
22
12131311

DALLAS LOVE FIELD Financial Feasibility Report
Unison Consulting, Inc. III-16 June 8, 2015
The average 172 departures per day scheduled for all of FY 2015 consist of an average of 150 Southwest flights out of 16 gates (plus one gate shared with Delta) and 22 flights by all other airlines (Delta, Virgin, and SeaPort), as follows: two gates used by Delta (one of which is shared with Southwest) and two gates used by Virgin. Due to the nature of its turboprop operations, SeaPort does not use a gate. These represent gate use rates for the entire year averaging 9.4 turns—close to Southwest’s target maximum of 10 turns—per day on each of the 16 gates used only by Southwest, and an average of 5.6 turns per day on each of the other 4 gates.
Service has been ramping up since nonstop flight restrictions were lifted in October 2014. In May 2015 Southwest already averages 10 turns per day on each of its 16 gates (which represents an increase since the October 2014, the beginning of FY 2015). Schedules show Southwest flights increasing further to average close to 11 turns per day per gate by September 2015. The other airlines together average 5.9 turns per day on each of the remaining 4 gates in May 2015. Their schedules show the average increasing to 6 turns per day by September 2015. The airline schedules indicate that the activity at the Airport may be approaching maximum capacity, since there is very little room to add more flights due to the limitation of the number of turns per day that the airlines can operate on the 20 gates in the terminal. The number of destinations with nonstop service from DAL increased slightly—from 21 to 23—over the past four years, and is estimated to nearly double to 53 for all of FY 2015 (based on published airline schedules)1. Figure III-9 shows the nonstop destinations from the Airport in FY 2014 and 2015.
1 The number of nonstop destinations cited on this page represents the airline schedules for all of FY 2015. This number is higher than the number cited previously in this section “as of May 2015” because the total for all of FY 2015 includes additional destinations for which the airlines have scheduled to begin service later in the fiscal year.

DALLAS LOVE FIELD Financial Feasibility Report
Unison Consulting, Inc. III-17 June 8, 2015
Figure III-9 NONSTOP DESTINATIONS FROM DAL
FY 2014 and 2015
Bubble markers that are half red and half blue indicate that the destination has nonstop service from DAL in both fiscal years. Source: OAG Schedules Analyzer and Bing Maps. 8. Trends in Scheduled Seats at DAL, DFW, and Select Medium Hub, Southwest
Focus Airports
Figure III-10 compares the trends in scheduled seats at DAL, DFW, and six other medium hub airports in Southwest’s focus cities from FY 2011 through 2015. Before FY 2015, the trend at DAL—of scheduled seats staying flat— compared most closely to the trend at Lambert-St. Louis International Airport. The sharp increase in seats at DAL in FY 2015 puts the Airport ahead of the other six medium hub airports, including DFW, in capacity growth. It also moved DAL to first in FY 2015—from sixth in FY 2014—in ranking by the average number of scheduled seats per day among the seven medium hub airports shown in the figure.
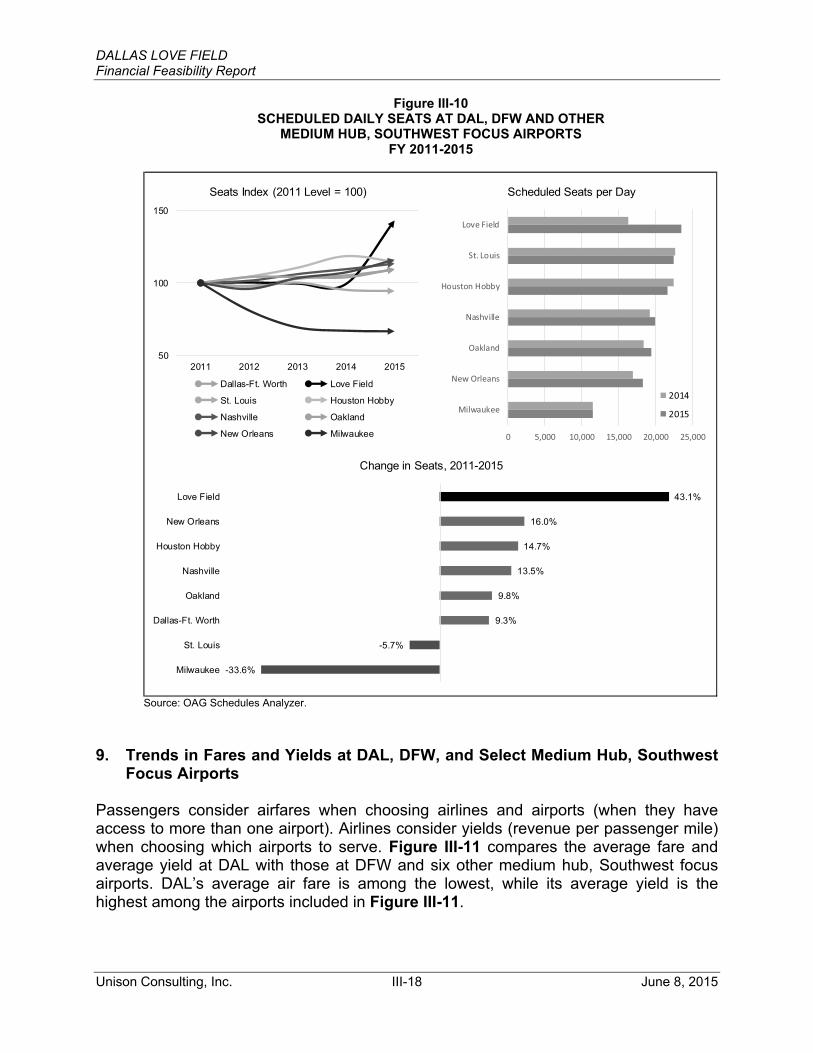
DALLAS LOVE FIELD Financial Feasibility Report
Unison Consulting, Inc. III-18 June 8, 2015
Figure III-10 SCHEDULED DAILY SEATS AT DAL, DFW AND OTHER
MEDIUM HUB, SOUTHWEST FOCUS AIRPORTS FY 2011-2015
Source: OAG Schedules Analyzer.
9. Trends in Fares and Yields at DAL, DFW, and Select Medium Hub, Southwest Focus Airports
Passengers consider airfares when choosing airlines and airports (when they have access to more than one airport). Airlines consider yields (revenue per passenger mile) when choosing which airports to serve. Figure III-11 compares the average fare and average yield at DAL with those at DFW and six other medium hub, Southwest focus airports. DAL’s average air fare is among the lowest, while its average yield is the highest among the airports included in Figure III-11.
50
100
150
2011 2012 2013 2014 2015
Seats Index (2011 Level = 100)
Dallas-Ft. Worth Love Field
St. Louis Houston Hobby
Nashville Oakland
New Orleans Milwaukee 0 5,000 10,000 15,000 20,000 25,000
Love�Field
St.�Louis
Houston�Hobby
Nashville
Oakland
New�Orleans
Milwaukee
Scheduled Seats per Day
2014
2015
-33.6%
-5.7%
9.3%
9.8%
13.5%
14.7%
16.0%
43.1%
Milwaukee
St. Louis
Dallas-Ft. Worth
Oakland
Nashville
Houston Hobby
New Orleans
Love Field
Change in Seats, 2011-2015

DALLAS LOVE FIELD Financial Feasibility Report
Unison Consulting, Inc. III-19 June 8, 2015
Figure III-11 AVERAGE FARE AND YIELD AT DAL, DFW AND OTHER
MEDIUM HUB, SOUTHWEST FOCUS AIRPORTS FY 2010-2014
The data exclude frequent flier, nonrevenue and other discounted fare tickets. Source: U.S. Department of Transportation 10%-sample airline ticket survey, accessed through Database Products, Inc.
10. Commercial Aircraft Landings and Landed Weight Table III-4 and Table III-5 show aircraft landings and landed weight at the Airport for the past three fiscal years and the first six months of FY 2015. The data reflect Southwest’s dominance of the DAL market, the flat service levels before FY 2015, and the expansion of service in FY 2015 with the lifting of all restrictions on domestic nonstop service. The data also show Virgin quickly surpassing the service levels provided by all other airlines (except Southwest) in FY 2015. Virgin surpassed Delta, which significantly increased its seat offerings at DAL in FY 2015 by bringing in its mainline fleet.
$0
$50
$100
$150
$200
$250
2010 2011 2012 2013 2014
Average�Fare�(Current�Dollars)
Dallas�Ft.�Worth
St.�Louis
New�Orleans
Nashville
Houston�Hobby
Milwaukee
Love�Field
Oakland
$0.00
$0.05
$0.10
$0.15
$0.20
$0.25
$0.30
2010 2011 2012 2013 2014
Average�Yield�(Current�Dollars)
Love�Field
Nashville
Houston�Hobby
Dallas�Ft.�Worth
New�Orleans
St.�Louis
Milwaukee
Oakland

DALLAS LOVE FIELD Financial Feasibility Report
Unison Consulting, Inc. III-20 June 8, 2015
Table III-4 DALLAS LOVE FIELD AIRCRAFT LANDINGS BY AIRLINE
FY 2012-2015 (Through March 2015)
Source: Airport records.
Table III-5 DALLAS LOVE FIELD AIRCRAFT LANDED WEIGHT BY AIRLINE
FY 2012-2015 (Through March 2015)
n.a. – not available Source: Airport records.
FY 2012 FY 2013 FY 2014Oct-Mar
2014Oct-Mar
2015 FY 2012 FY 2013 FY 2014Oct-Mar
2014Oct-Mar
2015Mainline
Southwest 42,075 42,428 41,410 20,587 24,931 90.4% 88.1% 88.9% 87.0% 84.6%Delta 624 2.1%Virgin America 1,887 6.4%
Subtotal 42,075 42,428 41,410 20,587 27,442 90.4% 88.1% 88.9% 87.0% 93.2%
RegionalUnited 1,667 2,281 1,997 962 1,006 3.6% 4.7% 4.3% 4.1% 3.4%Delta 918 1,579 1,529 732 154 2.0% 3.3% 3.3% 3.1% 0.5%SeaPort 929 886 507 793 278 2.0% 1.8% 1.1% 3.4% 0.9%
Subtotal 3,514 4,746 4,033 2,487 1,438 7.6% 9.9% 8.7% 10.5% 4.9%
Nonscheduled/Cargo 954 978 1,135 584 573 2.0% 2.0% 2.4% 2.5% 1.9%
Total 46,543 48,152 46,578 23,658 29,453 100.0% 100.0% 100.0% 100.0% 100.0%
Annual Change 1.8% 3.5% -3.3% 0.5% 24.5%
Airline
Landings Market Share
FY 2012 FY 2013 FY 2014Oct-Mar
2014Oct-Mar
2015 FY 2012 FY 2013 FY 2014Oct-Mar
2014Oct-Mar
2015Mainline
Southwest 5,062,670 5,051,308 4,993,832 2,482,608 3,068,672 96.7% 95.5% 95.9% 96.0% 88.2%Delta 68,640 2.0%Virgin America 262,452 7.7%
Subtotal 5,062,670 5,051,308 4,993,832 2,482,608 3,399,764 96.7% 95.5% 95.9% 96.0% 97.7%
RegionalUnited 76,411 112,853 85,287 41,640 42,915 1.5% 2.1% 1.6% 1.6% 1.2%Delta 43,146 74,213 71,863 34,404 8,992 0.8% 1.4% 1.4% 1.3% 0.3%SeaPort 9,172 8,624 4,454 2,397 n.a. 0.2% 0.2% 0.1% 0.1% n.a.
Subtotal 128,729 195,690 161,605 78,441 51,908 2.5% 3.7% 3.1% 3.0% 1.5%
Nonscheduled/Cargo 42,093 42,378 49,765 25,876 26,962 0.8% 0.8% 1.0% 1.0% 0.8%
Total 5,233,492 5,289,375 5,205,202 2,586,926 3,478,634 100.0% 100.0% 100.0% 100.0% 100.0%
Annual Change 0.7% 1.1% -1.6% 0.1% 34.5%
Airline
Landed Weight (in Thousand Pounds) Market Share

DALLAS LOVE FIELD Financial Feasibility Report
Unison Consulting, Inc. III-21 June 8, 2015
C. FORECAST COMMERCIAL AVIATION ACTIVITY Forecasts are presented for the three key measures of traffic—enplanements, aircraft landings, and landed weight—for the period FY 2015-2024. In developing the forecasts, we started with a hybrid forecasting framework that features capacity-driven, short-term forecasts and demand-driven, long-term forecasts. This framework produces unconstrained forecasts for FY 2015-2016 that are based largely on published flight schedules and, after FY 2016, are based on projected trends in key demand drivers. Multivariate regression analysis links growth in aviation activity to trends in key demand drivers, such as the price of air travel at an airport and economic factors. It provides a systematic framework for quantifying the contributions of multiple factors to air traffic growth, while controlling for the effects of structural changes and extraordinary events affecting both supply and demand for air service. It also reduces subjective inputs, while minimizing prediction errors. Recognizing uncertainty in the future trends of key demand drivers, we perform forecast risk analysis using a sampling method known as Monte Carlo simulation. This method is better than traditional scenario analysis because it provides a comprehensive process for modeling the effects of all possible future trends of the key explanatory variables. It also produces a range of unconstrained forecasts for Airport traffic, along with probability estimates. After developing the unconstrained passenger traffic forecasts, we consider the operational limits of the Airport’s 20-gate terminal. The Five Party Agreement allowed the modernization of the terminal on the condition that the terminal is limited to 20 gates. Therefore, passenger traffic growth is limited by the maximum number of turns per day that airlines can operate on 20 gates. For the base constrained forecast, we assume a maximum of 10 turns per day on each of the 16 gates used only by Southwest and close to 9 turns on each of the remaining 4 gates. For the high constrained forecasts, we assume a maximum of 11 turns per day on each of the 16 gates used only by Southwest and 10 turns on each of the remaining 4 gates. In all cases, we assume that Southwest can share the use of the remaining 4 gates to the extent that they are not used fully by other airlines. 1. Capacity-Driven, Short-Term Forecasts
The forecasts for FY 2015 and FY 2016 reflect the following:
� the actual passenger traffic growth at the Airport through March 2015;
� the scheduled flights and seats for April-September 2015 and the first few months of FY2016 (as of April 28, 2015);

DALLAS LOVE FIELD Financial Feasibility Report
Unison Consulting, Inc. III-22 June 8, 2015
� the trends in seats on each flight and boarding load factors, assuming with modest improvements consistent with FAA’s national projections;2
� changes in aircraft and the mix of mainline and regional service;
� the short-term outlook for the local and national economy, the airline industry as whole, and each of the major airlines serving the Airport; and
� the operational limit of the 20-gate terminal.
Through March in FY 2015, DAL enplanements increased 40.4 percent, year-over-year. In October 2014, enplanements increased only 13.3 percent, year-over-year, because the restriction on nonstop service was lifted on the 13th of the month. Since October, growth has accelerated each month from 43.5 percent growth in November to 49.7 percent in March 2015, year-over-year. For the remaining six months in FY 2015, the airline schedules indicate a 54 percent year-over-year increase in seats. Assuming a small annual increase in boarding load factors consistent with FAA’s national projection,3 we estimate that enplanements for the remainder of FY 2015 will increase 46 percent over the same period in FY 2014. For FY 2016, airline schedules as of April 2015 indicate an increase of approximately 18 percent in seats at DAL. This means that the growth momentum in DAL’s passenger traffic will continue, especially as it is supported by a positive outlook for the local and national economy. But the 20-gate terminal will begin to limit annual traffic growth at DAL. 2. Demand-Driven, Long-Term Forecasts
For FY 2017 and subsequent years, we used regression analysis to project unconstrained passenger traffic levels, linked to trends in key demand drivers. We then figured how much of the unconstrained forecast passenger traffic can be accommodated within the operational limit of the 20-gate terminal. We estimated the maximum number of flights that can be operated in each gate. We determined how many passengers can be accommodated on each flight given the seat capacity of aircraft operated by each airline and the trends in boarding load factors. 3. Multivariate Regression Analysis
The multivariate regression model used to project unconstrained traffic quantifies the relationship between passenger traffic trends and key demand drivers such as: (1) changes in the price of air travel; and (2) employment growth trends in Texas, which also indicate economic and income growth trends. To ensure that we get unbiased estimates for the contributions of these key demand drivers to passenger traffic growth,
2 FAA Aerospace Forecasts, FY 2015-2035, March 2015. 3 Ibid.

DALLAS LOVE FIELD Financial Feasibility Report
Unison Consulting, Inc. III-23 June 8, 2015
the regression model also includes variables to account for (1) significant changes in air service that have followed changes in the Airport’s legal environment and (2) the effects on historical trends of past significant events such as the terrorist attacks of September 11, 2001. We estimated the coefficients of the multivariate regression model using available historical data, going back to 1981. We evaluated different specifications of the regression model based on a number of statistical tests. We then selected the best model specification and calibrated it with future values of the explanatory variables to forecast unconstrained enplanement levels through 2024. The model explanatory variables—historical trends and base assumptions—are discussed below. Price of Air Travel The demand for air travel is sensitive to price changes. Holding all other factors constant, more people travel when air fares decrease, and fewer people travel when air fares increase. To measure the price of air travel, we use passenger yield—the average airline revenue per revenue passenger mile, adjusted for inflation. Real passenger yields have fallen since the airline industry deregulation in 1978, stimulating growth in air travel. At the Airport, the average real passenger yield declined an average 2 percent per year from FY 2000 to 2014. The following factors have caused yields to decline:
� productivity growth
� stringent competition among airlines
� the expansion of low-cost carriers
� weak demand during economic recessions
� increased ability of customers to search and compare airfares on the internet
� growing price consciousness among both leisure and business travelers In recent years, U.S. airlines were able to raise airfares by limiting domestic seat capacity. As a result, the U.S. average domestic passenger yield increased in real terms (more than inflation). The latest FAA industry forecast expects inflation-adjusted yields to continue increasing through FY 2022 before returning to their long-term trend of decline.4
4 FAA Aerospace Forecasts, FY 2015-2035, March 2015.

DALLAS LOVE FIELD Financial Feasibility Report
Unison Consulting, Inc. III-24 June 8, 2015
At DAL, the average passenger yield continued to decrease in real terms in recent years. The base assumption for the DAL traffic forecast is that the trend over the next 10 years will follow FAA’s projections for U.S. mainline carriers’ average domestic yield—an average 0.5 percent annual increase (Figure III-12).
Figure III-12 PROJECTED TRENDS IN KEY DEMAND DRIVERS FOR
THE BASE FORECAST FOR DAL FY 2014-2024
Actual FY 2014 and forecast FY 2015-2024.
Texas Employment Trends Employment growth reflects the pace of economic and income growth, which drives growth in air travel. As discussed in Section II, employment in the MSA and Texas has been growing faster than the national rate since the mid-2000s. Growth is projected to continue at a slower rate—slightly above the national rate—as Texas’ oil industry adjusts to the decline in oil prices. For the regression model, we obtained historical and forecast data on Texas state non-farm employment from Moody’s Analytics, an independent economic forecasting firm. Texas state non-farm employment increased an average 1.5 percent per year from FY 2000 to 2014. According to Moody’s Analytics, Texas employment will sustain growth at
-2.3%
2.7%
0.7% 0.6%0.2%
0.8%0.4%
0.6%
0.0%
-0.4%-0.1%
3.1%
2.2% 2.0%1.8%
1.5%1.1% 0.9% 1.0% 1.0% 1.0% 1.0%
2 01 4 2 01 5 2 01 6 2 01 7 2 01 8 2 01 9 2 02 0 2 02 1 2 02 2 2 02 3 2 02 4
AN N U AL C H AN GE
Real Yield Texas Non-Farm Employment

DALLAS LOVE FIELD Financial Feasibility Report
Unison Consulting, Inc. III-25 June 8, 2015
annual rates averaging 1.3 percent over the forecast period (Figure III-12). This projection drives the base regression enplanement forecast. Wright Amendment The Wright Amendment of 1979 restricted nonstop service from DAL using aircraft with more than 56 seats, to destinations within Texas and the four neighboring states of Louisiana, Arkansas, Oklahoma, and New Mexico (referred to as Love Field service area). It also banned the sale of one-stop and through-service between DAL and destinations outside the designated Love Field service area. The Love Field service area was expanded by subsequent laws: (1) the Shelby Amendment added Alabama, Kansas and Mississippi in October 1997; and (2) the Bond Amendment added Missouri in 2005. In October 2006, the Wright Amendment Reform Act lifted the restriction on one-stop and through service from DAL effective immediately and the remaining restrictions on nonstop service effective October 13, 2014. A variable was included in the regression model to account for the air service expansions that followed these changes to the law governing service at the Airport. Effects of the September 11, 2001, Terrorist Attacks As discussed in Part B, the Airport’s passenger traffic declined sharply after the terrorist attacks on September 11, 2001. The regression model includes a variable to account for the sharp traffic decline and the structural changes in the air travel industry that developed after the terrorist attacks. The regression model is based on sound economic theory. It is well-supported by empirical trends and passes statistical evaluation. The model explains close to 96 percent of the historical variation in annual enplanements at DAL. The results confirm that air travel demand increases as employment grows and decreases as the price of air travel increases, all other things equal. The reverse is also true. 4. Monte Carlo Simulation
We used the regression model to develop the base unconstrained forecast enplanements, assuming the projected trends in the Airport’s real passenger yield and Texas employment shown in Figure III-12. Those projections, however, represent only one possibility for the future trends of the key demand drivers. Monte Carlo simulation allowed us to consider thousands of possibilities, producing a range—instead of a single set—of enplanement forecasts for DAL. Monte Carlo simulation avoids the arbitrariness of traditional scenario analysis in setting forecast assumptions by using probability distributions to define the range of possible future trends of explanatory variables. Simulation involves running thousands of iterations of the regression model. Each iteration uses a different set of projections for the trends in the Airport’s real passenger yield and Texas employment. The result is a wide range of enplanement forecasts, summarized in Figure III-13 by the selected percentile results.

DALLAS LOVE FIELD Financial Feasibility Report
Unison Consulting, Inc. III-26 June 8, 2015
Figure III-13
DALLAS LOVE FIELD ENPLANEMENT FORECASTS
*Assuming terminal capacity allows 10 turns per gate per day. **Assuming terminal capacity allows 11 turns per gate per day.
Sources: Airport records for actual data in 2014 and Unison Consulting, Inc. for the forecasts. The forecast for 2015 includes actual data through March and an estimate for the remainder of the year based on schedules.
Base Scenario Low Scenario High Scenario
Fiscal YearUnconstrained
BaseConstrained at
10 Turns*Unconstrained
5-PercentileUnconstrained 25-Percentile
Unconstrained 75-Percentile
Unconstrained 95-Percentile
2014A 4,358 4,358 4,358 4,358 4,358 4,358 4,3582015E 6,244 6,244 5,900 6,104 6,383 6,584 6,2442016 7,031 7,028 6,517 6,833 7,237 7,546 7,7922017 7,166 7,072 6,553 6,920 7,414 7,775 7,8422018 7,282 7,115 6,596 6,984 7,561 7,926 7,8892019 7,366 7,156 6,538 7,050 7,707 8,085 7,9342020 7,438 7,195 6,550 7,134 7,781 8,254 7,9772021 7,512 7,229 6,594 7,156 7,863 8,398 8,0152022 7,592 7,262 6,620 7,205 7,957 8,592 8,0522023 7,673 7,295 6,614 7,241 8,070 8,752 8,0882024 7,754 7,327 6,691 7,326 8,178 8,877 8,124
2014-2015 43.3% 43.3% 35.4% 40.1% 46.5% 51.1% 43.3%2015-2016 12.6% 12.6% 10.5% 11.9% 13.4% 14.6% 24.8%2016-2024 1.2% 0.5% 0.3% 0.9% 1.5% 2.1% 0.5%
Average Annual Growth Rate
Maximum Capacity at 11
Turns**
Enplanements (In Thousands)
2,000
3,000
4,000
5,000
6,000
7,000
8,000
9,000
10,000
2005
2006
2007
2008
2009
2010
2011
2012
2013
2014
2015
2016
2017
2018
2019
2020
2021
2022
2023
2024
Historical Forecast
Enplanements (In Thousands)
Unconstrained�95�Percentile
Maximum�Capacity�at�11Turns**
High�Scenario�Unconstrained75�Percentile
Unconstrained�Base
Base�Scenario�Constrained�at10�Turns*
Unconstrained�25�Percentile
Low�Scenario�Unconstrained5�Percentile

DALLAS LOVE FIELD Financial Feasibility Report
Unison Consulting, Inc. III-27 June 8, 2015
Figure III-13 shows the 5-, 25-, 75-, and 95-percentile, along with the base regression forecast—all unconstrained by capacity. The base unconstrained regression forecast approximates the median (50-percentile). A percentile5 indicates the relative risk associated with a particular forecast. To illustrate, consider the following interpretation of the 25th percentile: The probability that the actual outcome would fall at or below the 25-percentile forecast is 25 percent, and the probability that the actual outcome would fall above the 25-percentile forecast is 75 percent. Therefore the likelihood of meeting the 25-percentile result is 75 percent. The median (50-percentile) has equal probabilities of being realized or not. The range of forecasts bounded by the 25-percentile and the 75-percentile is called the interquartile range—the middle 50 percent of unconstrained results fall within this range. The range bounded by the 5-percentile and the 95-percentile contains the middle 90 percent of unconstrained results. 5. Terminal Capacity Constraint The Five Party Agreement that resulted in the Wright Amendment Reform Act ending all the Wright amendment restrictions limited the Airport terminal to 20 gates. Southwest currently operates on 18 gates. Two of the 18 gates are used by Southwest pursuant to a sublease agreement with United. Delta also has a sublease agreement with United, pursuant to which it shares one of the gates used by Southwest. Virgin currently operates on two gates. Delta’s sublease agreement with United will expire on July 6, 2015. Delta has expressed interest in negotiating a new sublease agreement to enable it to continue operating at the Airport after that date. Regardless of the outcome of the negotiation, the forecasts assume that these gates will remain in use—either by Delta, Southwest, or both. Figure III-13 shows an adjusted base forecast, constrained beginning in FY 2016 by the operational capacity of the 20-gate terminal at a maximum 10 turns per gate per day, and the maximum enplanement levels at a higher operational capacity limit of 11 turns per gate per day. We applied the maximum turns to the 16 gates leased preferentially by Southwest and a slightly lower average for the other 4 gates, to consider differences in operational efficiencies among the airlines. Southwest is known to have shorter turn-around times than most other airlines. The airline schedules for DAL as of April 2015 indicate that, by November 2015, Southwest will average 10.3 turns per gate per day; Virgin, 9.3 turns; and Delta, just over 4 turns.
5 A percentile indicates the value at or below which a given percentage of results fall. For example, if we arrange 100 forecast results for one year from lowest to highest, 25 results (25 percent) will be at or below the 25-percentile, 75 results (75 percent) will be at or below the 75-percentile, and 50 results (50 percent) will be at or below the 50-percentile (also known as the median).

DALLAS LOVE FIELD Financial Feasibility Report
Unison Consulting, Inc. III-28 June 8, 2015
The capacity-constrained forecasts reflect small increases in aircraft seat capacity and boarding load factors over the forecast period, consistent with FAA industry projections. 6. Recommended Base, High, and Low Enplanement Scenarios
The recommended base, high, and low enplanement scenarios used in Sections IV and V are the following:
� Base Scenario - The constrained base forecast, which constrains annual enplanements beginning in FY 2016 to the 20-gate terminal’s capacity at a 10 turns per gate per day. This forecast falls below the unconstrained base forecast beginning in FY 2016 and approaches the 25-percentile forecast by FY 2024.
� High Scenario – The unconstrained 75-percentile forecast.
� Low Scenario – The unconstrained 5-percentile forecast.
7. Comparison with Other Enplanement Forecasts
Figure III-14 compares the recommended base, high, and low enplanement forecasts with the following alternative forecasts:
� Forecast resulting from the application of annual growth rates in the TAF beginning in FY 2015 (Adjusted FAA TAF). This approach uses the forecast growth rates under the TAF to grow DAL enplanements from their actual level in FY 2014.
� Forecast resulting from the application of FAA’s latest national growth projections (National Growth). This approach uses the forecast growth rates for U.S. system enplanements to grow DAL enplanements from their actual level in FY 2014. It is equivalent to taking the Airport’s share of forecast national enplanements.
The National Growth forecast produces the lowest annual enplanement levels, while the High scenario forecast produces the highest annual enplanement levels over the entire forecast period. The base forecast falls above the Adjusted FAA TAF forecast in FY 2015-FY 2016 and below the Adjusted FAA TAF forecast in FY 2017-2024.

DALLAS LOVE FIELD Financial Feasibility Report
Unison Consulting Inc. III-29 June 8, 2015
Figure III-14 COMPARISON OF ENPLANEMENT FORECASTS FOR DALLAS LOVE FIELD
*Assuming terminal capacity allows 10 turns per gate per day.
Fiscal Year
Base Scenario (Constrained at
10 Turns*)
High Scenario (Unconstrained 75-Percentile)
Low Scenario (Unconstrained
5-Percentile)Adjusted FAA
TAFNational Growth
2014 Actual 4,358 4,358 4,358 4,358 4,3582015 6,244 6,383 5,900 5,772 4,4702016 7,028 7,237 6,517 6,600 4,5392017 7,072 7,414 6,553 7,125 4,6222018 7,115 7,561 6,596 7,333 4,6982019 7,156 7,707 6,538 7,494 4,7572020 7,195 7,781 6,550 7,636 4,8382021 7,229 7,863 6,594 7,761 4,9032022 7,262 7,957 6,620 7,885 4,9712023 7,295 8,070 6,614 8,013 5,0482024 7,327 8,178 6,691 8,144 5,118
2014-2015 43.3% 46.5% 35.4% 32.4% 2.6%2015-2016 12.6% 13.4% 10.5% 14.3% 1.5%2016-2024 0.5% 1.5% 0.3% 2.7% 1.5%
Enplanements (In Thousands)
Average Annual Growth Rate
2,000
3,000
4,000
5,000
6,000
7,000
8,000
9,000
2014Actual
2015 2016 2017 2018 2019 2020 2021 2022 2023 2024
Enplanements (In Thousands)
Base Scenario (Constrainedat 10 Turns*)
High Scenario(Unconstrained 75-Percentile)Low Scenario(Unconstrained 5-Percentile)
Adjusted FAA TAF
National Growth

DALLAS LOVE FIELD Financial Feasibility Report
Unison Consulting Inc. III-30 June 8, 2015
8. Constrained Base Forecast Details
Table III-6 shows annual enplanements, aircraft landings, and landed weight for the constrained base forecast. The FY 2015 figures reflect actual activity through March 2015, and trends in flights and seats scheduled for the remainder of the year. Beyond 2015, terminal capacity begins to constrain the number of flights. Annual enplanements continue to grow marginally with small increases in the average number of seats on each flight and boarding load factors. Southwest and other airlines have been reconfiguring old aircraft to add more seats and ordering new aircraft with more seats. Annual landed weight also increases marginally as larger aircraft are brought into the fleet mix. D. SOURCES OF FORECAST RISK AND UNCERTAINTY We took a rigorous approach to forecast development by combining different techniques—a hybrid forecasting framework, multivariate regression analysis, Monte Carlo simulation, and a heuristic approach to determine capacity limits. But the future is uncertain. Actual traffic can differ from the forecasts for a variety of reasons. Forecasts are based on information available today and numerous assumptions about future conditions. Unexpected events, significant changes in the economic outlook and the aviation industry, significant changes in airlines’ financial positions and business plans (especially Southwest’s), significant changes in air service at Dallas-Fort Worth International Airport, and other factors can bring conditions that are very different from the forecast assumptions. Some of these factors are discussed below. 1. Economic Conditions National economic conditions influence aviation activity at the Airport. Economic expansion increases income, boosts consumer confidence, stimulates business activity, and increases demand. In contrast, an economic recession reduces income, diminishes consumer confidence, dampens business activity, and weakens demand. The U.S. economy is now in its sixth year of expansion after the Great Recession. The consensus among experts on the U.S. economy is that the current economic expansion will continue for a number of years, accelerating in CY 2015 and 2016. Independent sources predict modest annual growth rates in real U.S. GDP averaging 3 percent in CY 2015, 2.9 percent in CY 2016, 2.6 percent in CY 2017, and 2.5 percent in CY 2018, after which the pace of economic growth is expected to slow (see Figure II-27 in Section II).

DALLAS LOVE FIELD Financial Feasibility Report
Unison Consulting Inc. III-31 June 8, 2015
Table III-6 BASE SCENARIO FORECAST COMMERCIAL AVIATION ACTIVITY AT DAL
Actual Forecast2014 2015 2016 2017 2018 2019 2020 2021 2022 2023 2024 2014-2016 2016-2024
Enplanements (Thousands) 4,358 6,244 7,028 7,072 7,115 7,156 7,195 7,229 7,262 7,295 7,327 27.0% 0.5%Annual Change 3.6% 43.3% 12.6% 0.6% 0.6% 0.6% 0.5% 0.5% 0.5% 0.4% 0.4%
Southwest 4,207 5,567 6,275 6,315 6,353 6,390 6,425 6,455 6,485 6,514 6,543 22.1% 0.5% Other Scheduled 151 677 753 758 762 766 770 774 777 781 784 123.3% 0.5%
Aircraft Landings 46,578 63,158 69,327 69,327 69,327 69,327 69,327 69,327 69,327 69,327 69,327 22.0% 0.0%Annual Change -3.3% 35.6% 9.8% 0.0% 0.0% 0.0% 0.0% 0.0% 0.0% 0.0% 0.0%
Southwest 41,410 54,029 60,167 60,167 60,167 60,167 60,167 60,167 60,167 60,167 60,167 20.5% 0.0% Other Scheduled 4,038 8,000 8,030 8,030 8,030 8,030 8,030 8,030 8,030 8,030 8,030 41.0% 0.0% Non-Scheduled 1,130 1,130 1,130 1,130 1,130 1,130 1,130 1,130 1,130 1,130 1,130 0.0% 0.0%
Landed Weight (Million Pounds) 5,205 6,919 7,714 7,764 7,814 7,868 7,908 7,948 7,982 8,017 8,051 21.7% 0.5%Annual Change -99.9% 32.9% 11.5% 0.6% 0.6% 0.7% 0.5% 0.5% 0.4% 0.4% 0.4%
Southwest 4,994 6,562 7,354 7,401 7,450 7,500 7,539 7,577 7,609 7,642 7,674 21.4% 0.5% Other Scheduled 162 308 310 313 314 317 318 320 321 323 325 38.2% 0.6% Non-Scheduled 49 49 50 50 50 51 51 51 52 52 52 0.9% 0.5%
Avg. Annual Growth Rate

DALLAS LOVE FIELD Financial Feasibility Report
Unison Consulting, Inc. III-32 June 8, 2015
Falling oil prices, increases in consumer spending, and labor market improvements bode well for the U.S. economic outlook. Outside the United States, the outlook is not as good. The Euro Zone remains sluggish, the economies of Brazil and China are slowing, and Japan continues to struggle. Geopolitical conflicts are brewing in many parts of the world, especially in the Middle East and Ukraine. These problems abroad could slow or end the current economic expansion. So far the longest U.S. economic expansion lasted 10 years from March 1991 to March 2001. Even if the current expansion outlasts the 1991-2001 expansion, it is unlikely to continue over the 10-year forecast period. In Texas, the effect of falling oil prices on the state economy with the largest oil industry in the country is less benign (see the discussion on the Texas economy in Section II). Texas’ oil companies already started cutting capital budgets and laying off workers. State employment declined in March 2015 for the first time since January 2013. The Texas economy, now more diverse than it used to be in the 1980, is expected to overcome these setbacks and continue growing. But this outlook could change if oil prices continue to fall deeper and for much longer. 2. Financial Health of the U.S. Airline Industry Airports benefit from stable or growing air service when airlines are profitable. They risk losing service when airlines suffer financial hardship. Until 2010 the U.S. airline industry has struggled to make profits. From CY 2000 to 2014, the U.S. airline industry incurred losses during seven years totaling $84 billion and earned profits totaling only $55.1 billion during the other eight years (Figure III-15). All the losses were incurred in the past decade when fuel prices increased to record levels and the demand for air travel declined following the September 2001 terrorist attacks and during the Great Recession in 2008-2009. Mounting losses forced several airlines into bankruptcy and some into liquidation. Surviving airlines merged, cut costs, retired fuel-inefficient aircraft, scaled back networks, changed pricing of airline services, and took many other measures to improve financial results. These measures have affected airports in different ways. Smaller airports suffered cuts in service—even DAL. The industry began to see net profits in CY 2010 and has so far remained profitable. Restraining capacity growth amid traffic recovery after the Great Recession allowed airlines to raise airfares, and charging for various services that used to be free has increased airline revenues. Now falling fuel prices bode well for higher profits in CY 2015.

DALLAS LOVE FIELD Financial Feasibility Report
Unison Consulting, Inc. III-33 June 8, 2015
Figure III-15 U.S. AIR CARRIERS' ANNUAL PROFIT (IN BILLIONS)
CY 2000-2013
Source: U.S. Bureau of Transportation Statistics.
3. Price of Jet Fuel The price of jet fuel affects airlines’ financial health. Until recently, rising fuel prices increased airline costs dramatically and contributed to significant industry losses. From CY 2000 to CY 2014, the price of jet fuel increased 257.2 percent, while the U.S. Consumer Price Index (CPI)—which measures general price levels—increased only 37.5 percent (Figure III-16). As a result, fuel expenses, which historically ranged from 10 to 15 percent of U.S. passenger airline operating costs, rose to over 35 percent, according to Airlines for America.
$2.5
�$8.3�$11.4
�$1.7
�$9.1
�$27.2
$18.2
$7.7
�$23.7
�$2.6
$3.7$1.4 $0.4
$12.7$8.5
2000 2001 2002 2003 2004 2005 2006 2007 2008 2009 2010 2011 2012 2013 2014

DALLAS LOVE FIELD Financial Feasibility Report
Unison Consulting, Inc. III-34 June 8, 2015
Figure III-16 U.S. AVERAGE JET FUEL PRICE AND THE U.S. CONSUMER PRICE INDEX
CY 2000-2014
Source: U.S. Bureau of Transportation Statistics and U.S. Bureau of Labor Statistics. After reaching a peak $4 in July 2008, the average per-gallon price of jet fuel fell to $1.64 in March 2009 and then rose to levels close to $3 in April 2011, where it remained until recent months (Figure III-17). In June 2014, the price of jet fuel began to decline along with world oil prices. The decline accelerated as fuel contracts expired. The price of jet fuel fell to its lowest at $1.97 per gallon in January 2015, just 66 percent of its level less than a year ago. It rose again above $2 in February and March. Jet fuel prices follow world oil prices. From a June 2014 peak near $108 per barrel, the West Texas Intermediate spot oil price plunged to $43.93 per barrel on March 16, 2015 before rising to average $47.82 for the month (Figure III-17). It is uncertain how far prices will fall and how long they will stay low, but the decline so far has greatly improved U.S. airlines’ financial results in CY 2015.
0
50
100
150
200
250
300
350
400
45020
00
2001
2002
2003
2004
2005
2006
2007
2008
2009
2010
2011
2012
2013
2014
Pric
e�ind
ex�(2
000�
Leve
l�=�1
00)
Consumer Price Index, 2014=138
Jet Fuel Price Index, 2014=357

DALLAS LOVE FIELD Financial Feasibility Report
Unison Consulting, Inc. III-35 June 8, 2015
Figure III-17 U.S. JET FUEL PRICE AND CRUDE OIL PRICE*
January 2008-March 2015
*Monthly average of West Texas Intermediate (WTI) daily spot prices Sources: U.S. Bureau of Transportation Statistics and U.S. Energy Information Administration. 4. Southwest Airlines6 Accounting for more than 90 percent of traffic at DAL, Southwest’s financial condition, operations, and business plans can have implications for the Airport. Through the years—and all the downturns in the U.S. economy and airline industry, Southwest has proven itself to be the strongest U.S. airline, earning a profit in 42 consecutive years out of less than 44 years of service. In 2014, Southwest reported its 42nd consecutive annual profit of $1.1 billion, beating the previous year’s profit of $754 million. From a small Texas regional carrier operating its first flights out of DAL in June 1971, Southwest has grown to become the second largest scheduled domestic market U.S. carrier by share of U.S. system revenue passenger miles (16.7 percent for the 12 months ending in October 2014) and the nation’s largest carrier in terms of originating domestic passengers boarded. With more than 47,000 employees, Southwest operates more than 3,600 flights a day, serving 94 destinations across the United States and six other countries. Southwest
6 This brief on Southwest draws information from the airline’s website, <https://www.southwest.com>.
$0
$20
$40
$60
$80
$100
$120
$140
$160
0.00
0.50
1.00
1.50
2.00
2.50
3.00
3.50
4.00
4.50Ja
n�08
May
�08
Sep�
08
Jan�
09
May
�09
Sep�
09
Jan�
10
May
�10
Sep�
10
Jan�
11
May
�11
Sep�
11
Jan�
12
May
�12
Sep�
12
Jan�
13
May
�13
Sep�
13
Jan�
14
May
�14
Sep�
14
Jan�
15
Wor
ld�O
il�Pr
ice�(
$�pe
r�bar
rel)
Jet�F
uel�P
rice
�($�p
er�g
allo
n)
Jet�Fuel�Price Crude�Oil�Price
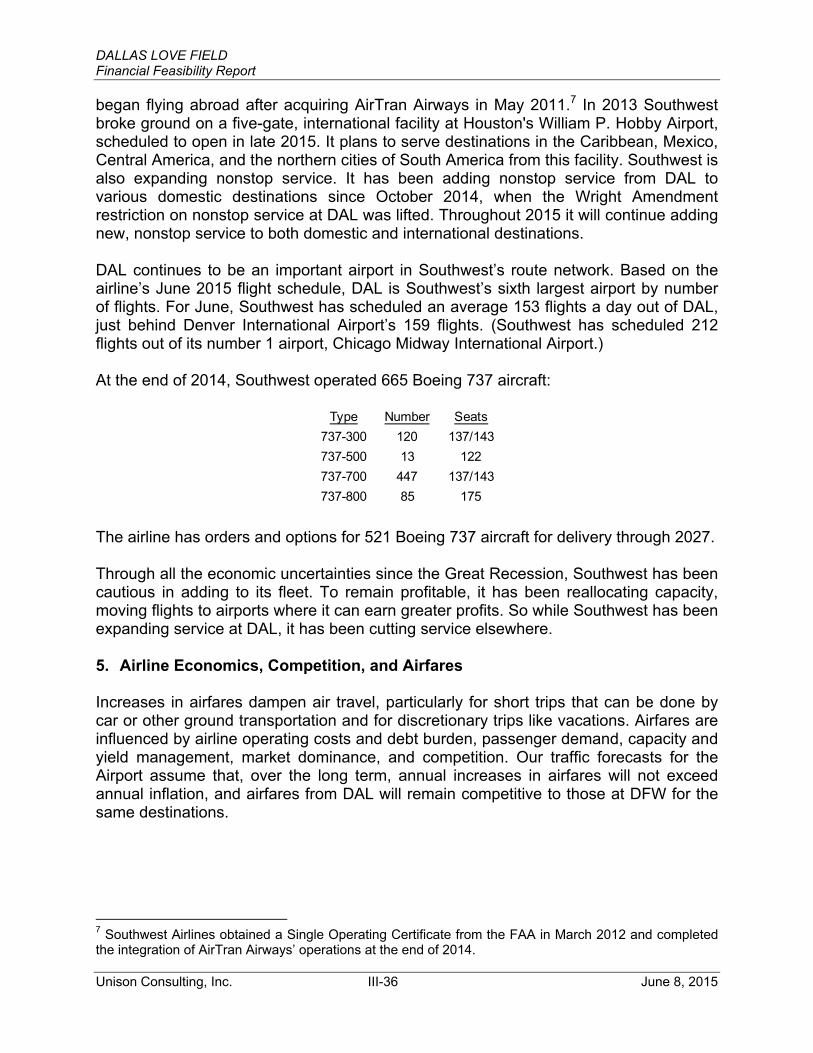
DALLAS LOVE FIELD Financial Feasibility Report
Unison Consulting, Inc. III-36 June 8, 2015
began flying abroad after acquiring AirTran Airways in May 2011.7 In 2013 Southwest broke ground on a five-gate, international facility at Houston's William P. Hobby Airport, scheduled to open in late 2015. It plans to serve destinations in the Caribbean, Mexico, Central America, and the northern cities of South America from this facility. Southwest is also expanding nonstop service. It has been adding nonstop service from DAL to various domestic destinations since October 2014, when the Wright Amendment restriction on nonstop service at DAL was lifted. Throughout 2015 it will continue adding new, nonstop service to both domestic and international destinations. DAL continues to be an important airport in Southwest’s route network. Based on the airline’s June 2015 flight schedule, DAL is Southwest’s sixth largest airport by number of flights. For June, Southwest has scheduled an average 153 flights a day out of DAL, just behind Denver International Airport’s 159 flights. (Southwest has scheduled 212 flights out of its number 1 airport, Chicago Midway International Airport.) At the end of 2014, Southwest operated 665 Boeing 737 aircraft:
The airline has orders and options for 521 Boeing 737 aircraft for delivery through 2027. Through all the economic uncertainties since the Great Recession, Southwest has been cautious in adding to its fleet. To remain profitable, it has been reallocating capacity, moving flights to airports where it can earn greater profits. So while Southwest has been expanding service at DAL, it has been cutting service elsewhere. 5. Airline Economics, Competition, and Airfares Increases in airfares dampen air travel, particularly for short trips that can be done by car or other ground transportation and for discretionary trips like vacations. Airfares are influenced by airline operating costs and debt burden, passenger demand, capacity and yield management, market dominance, and competition. Our traffic forecasts for the Airport assume that, over the long term, annual increases in airfares will not exceed annual inflation, and airfares from DAL will remain competitive to those at DFW for the same destinations.
7 Southwest Airlines obtained a Single Operating Certificate from the FAA in March 2012 and completed the integration of AirTran Airways’ operations at the end of 2014.
Type Number Seats737-300 120 137/143737-500 13 122737-700 447 137/143737-800 85 175

DALLAS LOVE FIELD Financial Feasibility Report
Unison Consulting, Inc. III-37 June 8, 2015
6. Airline Mergers Responding to pressures from competition, cost, and regulation, the airline industry has been consolidating. The most recent examples of large mergers include Delta and Northwest in 2009, United and Continental in 2010, Southwest and AirTran in 2011, and American and US Airways in 2013. Airline mergers affect service and traffic at airports when they consolidate facilities, optimize route networks, and route connecting traffic through other hubs. The impact on affected airports is often immediate. The impact can be significant or trivial, depending upon whether the merging airlines have a large market share at the airport, they serve the same markets, and they carry significant connecting traffic through the airport. Southwest’s acquisition of AirTran Airways resulted in network changes and growth priorities that have benefitted DAL. The Delta-Northwest and United-Continental mergers have had no significant effects because these airlines have had little activity at DAL. The recent American-US Airways merger is likely not going to affect DAL directly. Neither airline operates at DAL today, but American is the largest carrier at DFW and competes with DAL’s airlines from DFW. 7. National Security and Threat of Terrorism Even with tightened security measures implemented by the Department of Homeland Security, terrorism remains a serious threat to the aviation industry. Additionally, the stringent Airport security screening and long waits at security screening lines discourage air travel particularly to destinations that can be reached by ground transportation within a reasonable amount of time. 8. Competition from DFW Airport DAL and DFW both serve the Dallas-Fort Worth-Arlington MSA. DFW is the larger airport with far more airlines providing more flights to more destinations. DAL has the advantages of being closer to downtown Dallas and having significantly lower airfares, with Southwest and now Virgin operating more than 95 percent of flights at DAL. The two airports have coexisted for decades and have complemented each other in providing a full array of choices in air service. Still, significant changes to air service at DFW—good or bad—can affect traffic at DAL.

DALLAS LOVE FIELD Financial Feasibility Report
Unison Consulting, Inc. III-38 June 8, 2015
E. SUMMARY Air traffic trends drive important categories of airport revenues and costs. This section reviewed the historical trends in commercial aviation activity at the Airport and presented forecasts for FY 2015-FY 2024. Over the years, the Airport’s passenger traffic has grown and declined along with the U.S. economy. Until October 2014, growth had been constrained at the Airport by the Wright Amendment restrictions. The Wright Amendment was passed to protect air service at DFW, which was built to replace DAL as the principal commercial airport serving the Dallas-Fort Worth-Arlington metropolitan area. The Wright Amendment restrictions were later relaxed by other laws and eventually repealed completely by the Wright Amendment Reform Act of 2006. Each time a restriction was relaxed or lifted, DAL’s air service and passenger traffic increased. Air service and passenger traffic increased most sharply following the lifting of one-stop and through service restrictions in October 2006 and the lifting of the nonstop service restrictions in October 2014. Other events affected the Airport’s passenger traffic trends. The terrorist attacks in September 2001 caused passenger traffic at the Airport—and most other U.S. airports—to decline sharply. Following are some of the key trends over the past 10 years:
� Boosted by air service expansion following the lifting of one-stop service restrictions in October 2006, DAL’s enplanements increased 46 percent from approximately 3 million in FY 2005 to 4.4 million in FY 2014 (an average 4.3 percent annually).
� The remaining restriction on nonstop service was lifted in October 2014. DAL’s FY 2015 enplanements through March increased 40 percent over the same period in FY 2014.
� DAL’s passenger traffic consists entirely of domestic passengers, mostly O&D. The O&D share increased slightly from 75 percent in FY 2010 to 77 percent in FY 2014. The connecting share decreased slightly from 25 percent to 23 percent—all carried by Southwest.
� Through March 2015, four major airlines provided service at DAL. After March 2015, United stopped service, leaving Southwest, Virgin, Delta, and SeaPort. Southwest has served more than 90 percent of DAL’s enplanements since 1974. The highest share Southwest held was 97.5 percent in FY 2011 and 2012. During the first six months of FY 2015, Southwest’s share of DAL’s enplanements dropped to 91 percent, because Virgin started service, capturing a 5.6 percent share, and Delta expanded service, increasing its market share to 2.2 percent, from only 1.4 percent during the same period in the previous year.

DALLAS LOVE FIELD Financial Feasibility Report
Unison Consulting, Inc. III-39 June 8, 2015
We developed forecasts of commercial passenger traffic for the period FY 2015-FY 2024 using a combination of approaches:
� a hybrid forecasting framework that features capacity-driven, short-term forecasts and demand-driven, long-term forecasts;
� multivariate regression analysis to link growth in aviation activity to trends in key demand drivers;
� Monte Carlo simulation to produce a range of unconstrained enplanement forecasts with probability estimates; and
� a practical approach to determine the limit on annual aircraft departures and enplanement levels placed by the 20-gate terminal.
Using these approaches, we developed both unconstrained and capacity-constrained forecasts. Key details from the constrained base forecast are summarized below:
� Enplanements are forecast to increase from 4.4 million in FY 2014 to 7.3 million in FY 2024 (43 percent in FY 2015, 13 percent in FY 2016, and an average 0.5 annually after FY 2016).
� Aircraft landings (or departures) are forecast to increase from 46,578 in FY 2014 to approximately 69,000 in FY 2024 (36 percent in FY 2015, 10 percent in FY 2016, and no growth after FY 2016).
� Total aircraft landed weight is forecast to increase from 5.2 billion pounds in FY 2014 to 8 billion pounds in FY 2024 (33 percent in FY 2015, 12 percent in FY 2016, and an average 0.5 percent after FY 2016).
The approach to forecasting air traffic activity presented in this section is vigorous in that it combines different techniques. However, the future is uncertain and actual traffic can differ from the forecasts for a variety of reasons. Forecasts are based on information available today and numerous assumptions about future conditions. Unexpected events, significant changes in the economic outlook and the aviation industry, significant changes in airlines’ financial positions and business plans (especially Southwest’s), significant changes in air service at DFW Airport, and other factors can bring conditions that are very different from the forecast assumptions. Part D discussed some of these factors.
Dallas Love Field Financial Feasibility Report �
Unison Consulting, Inc. IV- 1 June 8, 2015
SECTION IV AIRPORT PUBLIC PARKING
This section describes the public parking facilities at the Airport and analyzes recent historical trends in public parking demand in terms of vehicle exits, occupancy levels, parking duration, and parking revenue. It also presents projections of vehicle exits and revenues for FY 2015-FY 2024 under the following scenarios:
� Base enplanement scenario, no parking rate increase
� Base enplanement scenario, parking rates increase with inflation
� High enplanement scenario, no parking rate increase
� High enplanement scenario, parking rates increase with inflation
� Low enplanement scenario, no parking rate increase
� Low enplanement scenario, parking rates increase with inflation A. CURRENT PUBLIC PARKING FACILITIES The Airport currently has two public parking garages and a valet parking operation (Figure IV-1 and Figure IV-2). The closest garage to the terminal is Garage A with 2,980 spaces intended for short-term parking. Next to Garage A, slightly farther away from the terminal, is Garage B with 4,000 spaces intended for long-term parking. The Airport offers valet parking, storing cars in a surface lot that contains 288 spaces. When this surface lot gets full, the valet operation has access to 455 more spaces in remote lots around the Airport. Parking in the garages for the first half hour is free. After that, rates start at $4 in Garage A, $3 in Garage B, and $8 for valet service for the second half hour and increase to a maximum $13 per day in Garage B, $17 in Garage A, and $24 for valet service (Table IV-1). The rates were last increased in August 2014: the daily maximum for Garage B was increased by $3, the daily maximum for valet was also increased by $3, and the daily maximum for Garage A was increased by $4. Before August 2014, smaller rate increases were implemented in October 2010. The Airport provides two parking options for Airport employees and other Airport workers at the following:
� the 350-space surface lot and the 700-space parking garage in the Love Hub off Lemmon Avenue (on the east side of the airfield) for $30 per month
� 110 spaces designated for employee parking in Garage B for $90 per month

Dallas Love Field Financial Feasibility Report �
Unison Consulting, Inc. IV- 2 June 8, 2015
Figure IV-I DALLAS LOVE FIELD PARKING FACILITIES
FY 2015 �
�1 Includes 288 spaces in valet surface lot and 455 spaces in four remote lots. 2 Includes 1,050 spaces at Love Hub and 110 spaces in Garage B. Source: Parking operator.
Parking Facility Spaces
Garage A (Short Term) 2,980
Garage B (Long Term) 4,000
Valet1 743
Total Public Spaces 7,723
Employee Parking2 1,160
Total Parking Spaces 8,883
Garage�A�(Short�Term)38%
Garage�B�(Long�Term)52%
Valet10%

Dallas Love Field Financial Feasibility Report �
Unison Consulting, Inc. IV- 3 June 8, 2015
Figure IV-2 MAP OF DALLAS LOVE FIELD PUBLIC PARKING FACILITIES
FY 2015
�Source: Airport records.
Table IV-1 DALLAS LOVE FIELD PUBLIC PARKING RATES
FY 2015
Source: Airport records.
0 to .5 .5 to 1 1 to 2 2 to 3 3 to 5 5 to 24Hour Hour Hours Hours Hours Hours
Garage A (Short-Term) Free $4 $6 $10 $13 $17Garage B (Long-Term) Free $3 $5 $7 $10 $13Valet $8 $13 $16 $19 $24
Parking Facility

Dallas Love Field Financial Feasibility Report �
Unison Consulting, Inc. IV- 4 June 8, 2015
Passengers can also park at off-airport parking facilities. There are three within a mile of the terminal, with more than 3,600 parking spaces in total (Table IV-2). All three provide complimentary shuttle service, and two offer free water and newspapers. Their rates range from $8.50 to $10.50 per day—lower than Airport rates.
Table IV-2 OFF-AIRPORT PARKING OPTIONS NEAR DALLAS LOVE FIELD
FY 2015
Source: Airport parking operator and parking websites.
B. EFFECTIVE SUPPLY IN GARAGES A AND B In determining available spaces, we distinguish between actual and effective parking supply. Effective parking supply is set 5 percent to 15 percent less than the actual number of parking spaces.1 It is common practice to keep a small percentage of open spaces to reduce the time customers spend searching for a space. In addition, improperly parked vehicles and maintenance work render certain spaces unusable at times.
Table IV-3 assesses the effective supply for Garage A and B at two levels of service (LOS):
� Level of Service A – 85 percent of the actual spaces in Garage A (short-term) and 90 percent of actual spaces in Garage B (long-term) for a total 6,133 effective spaces
� Level of Service B – 95 percent of the actual spaces in Garage A (short-term) and 97 percent of the actual spaces in Garage B (long-term) for a total 6,711 effective spaces
������������������������������������������������������������1 See Planners Press, Parking Management Best Practices, 2006; TDM Encyclopedia, Parking Evaluation, 2005, and Kay & Smith, “The Level of Service Approach” in Parking Issues, March 2000.
Uncovered CoveredThe Parking Spot 2,059 N/A $10.50The Parking Spot 2 918 $8.50 N/ABest Parking 665 N/A $9.95
Total 3,642
FacilityNo. of
SpacesDaily Rate

Dallas Love Field Financial Feasibility Report �
Unison Consulting, Inc. IV- 5 June 8, 2015
Table IV-3 GARAGE A AND GARAGE B EFFECTIVE SUPPLY
FY 2015
C. VEHICLE EXITS Until FY 2015, monthly vehicle exits in the two garages averaged no more than 84,000 in each year (Figure IV-3). In FY 2015, monthly vehicle exits have been increasing 23 percent to 35 percent year-over-year since November 2014, the first full month after the restriction on nonstop service at DAL was lifted. Through March in FY 2015, monthly vehicle exits averaged 93,795, and they exceeded 100,000 twice—in December 2014 and March 2015. In FY 2010-FY 2014, monthly vehicle exits did not reach 100,000 even during the peak months in each year. The monthly variations in vehicle exits closely follow the variations in monthly enplanements—reaching high levels in June and July, and low levels in January and February. In the past five fiscal years, annual vehicle exits in the two garages exceeded 1 million only in FY 2010. The October 2010 rate increase likely contributed to the decrease in annual vehicle exits to less than 1 million in 2011, where they remained through FY 2014. In FY 2015, the sharp increase in passenger traffic is likely to push total vehicle exits for the year well above 1 million, although the August 2014 rate increase can dampen the increase in vehicle exits. Vehicle exits totaled nearly 563,000 during the first six months of FY 2015, a 25 percent increase from the first half of FY 2014.
Garage A Garage B TotalTotal public parking spaces 2,980 4,000 6,980
Effective public parking supplyLevel of Service A
Efficiency factor 85% 90%Effective number of spaces 2,533 3,600 6,133
Level of Service BEfficiency factor 95% 97%Effective number of spaces 2,831 3,880 6,711

Dallas Love Field Financial Feasibility Report �
Unison Consulting, Inc. IV- 6 June 8, 2015
Figure IV-3
LOVE FIELD GARAGE A AND GARAGE B VEHICLE EXITS FY 2010-2015 (Through March 2015)
Peak monthly vehicle exits are shown in the table in bold font. Airport records.
Month 2010 2011 2012 2013 2014 2015October 99,983 83,370 77,977 79,619 77,105 86,575 November 80,294 76,330 75,583 76,187 72,534 98,086 December 82,085 80,091 77,888 73,530 81,934 100,619 January 71,725 72,922 70,462 66,945 72,412 89,367 February 69,192 64,000 71,920 64,445 67,240 83,132 March 85,173 81,827 81,700 79,520 80,007 104,992 April 81,606 74,355 77,642 74,305 77,697 May 82,695 80,207 81,462 81,022 87,211 June 90,484 82,202 84,313 84,289 91,852 July 92,581 82,303 85,636 84,618 93,199 August 89,071 82,593 86,707 81,226 84,861 September 76,495 72,148 71,387 70,563 70,185
Total 1,001,384 932,348 942,677 916,269 956,237 562,771Annual Growth -3.0% -6.9% 1.1% -2.8% 4.4%Oct '15-Mar '15 24.7%Monthly Average 83,449 77,696 78,556 76,356 79,686 93,795
Nov, up 35.2%
Dec, up 22.8%
Jan, up 23.4%
Feb, up 23.6%
Mar, up 31.2%
60,000
70,000
80,000
90,000
100,000
110,000
Oct Nov Dec Jan Feb Mar Apr May Jun Jul Aug Sep
2010 2011 2012 2013 2014 2015

Dallas Love Field Financial Feasibility Report �
Unison Consulting, Inc. IV- 7 June 8, 2015
Valet service began in April 2013 and quickly gained customers (Figure IV-4). The average number of monthly valet service vehicle exits tripled from 1,274 in FY 2013 to 3,880 in FY 2015 (through April). In FY 2015, monthly vehicle exits through April were up 75 percent to 112 percent year-over-year.
Figure IV-4 DALLAS LOVE FIELD VALET VEHICLE EXITS
April 2013-April 2015
Source: Airport records.
Month 2013 2014 2015October 1,812 3,389November 1,672 3,385December 1,810 3,604January 1,860 3,591February 2,047 3,574March 2,343 4,295April 824 2,515 5,320May 1,136 2,601June 1,352 2,903July 1,343 2,947August 1,487 2,755September 1,503 2,732Total 7,645 27,997 27,158Average 1,274 2,333 3,880
Oct, up 87% YOY
Nov ,up 103% YOY
Dec, up 99% YOY
Jan, up 93% YOY
Feb, up 75% YOY
Mar, up 83% YOY
Apr, up 112% YOY
0
1,000
2,000
3,000
4,000
5,000
6,000
Oct Nov Dec Jan Feb Mar Apr May Jun Jul Aug Sep
Vehicle Exits
2013 2014 2015

Dallas Love Field Financial Feasibility Report �
Unison Consulting, Inc. IV- 8 June 8, 2015
D. ENPLANEMENTS AND VEHICLE EXITS Passenger traffic generates much of the demand for public parking at the Airport, although, as explained later in this section, other factors have an impact also. Table IV-4 shows the data on both enplanements and vehicle exits at DAL in FY 2010-FY 2015 (through March 2015). The trends in enplanements and vehicle exits show close correlation (Figure IV-5 and Figure IV-6), although there were years when enplanements increased and vehicle exits decreased (FY 2010, FY 2011 and FY 2013). In the first half of FY 2015, vehicle exits increased less sharply than enplanements (26 percent versus 40 percent, year-over-year).
Table IV-4 DALLAS LOVE FIELD ENPLANEMENTS AND VEHICLE EXITS
FY 2010-2015 (Through March 2015)
*Public parking in Garage A and B, and valet parking. Source: Airport records.
2010 3,949 1,0012011 4,018 9322012 4,074 9432013 4,205 9242014 4,358 984
Oct '13- Mar '14 2,106 463Oct '14- Mar '15 2,958 585
Average Annual Growth Rate2010-2014 2.5% -2.6%
Oct '14- Mar '15 40.4% 26.3%
Fiscal Year Enplanements (000)
Vehicle Exits (000)
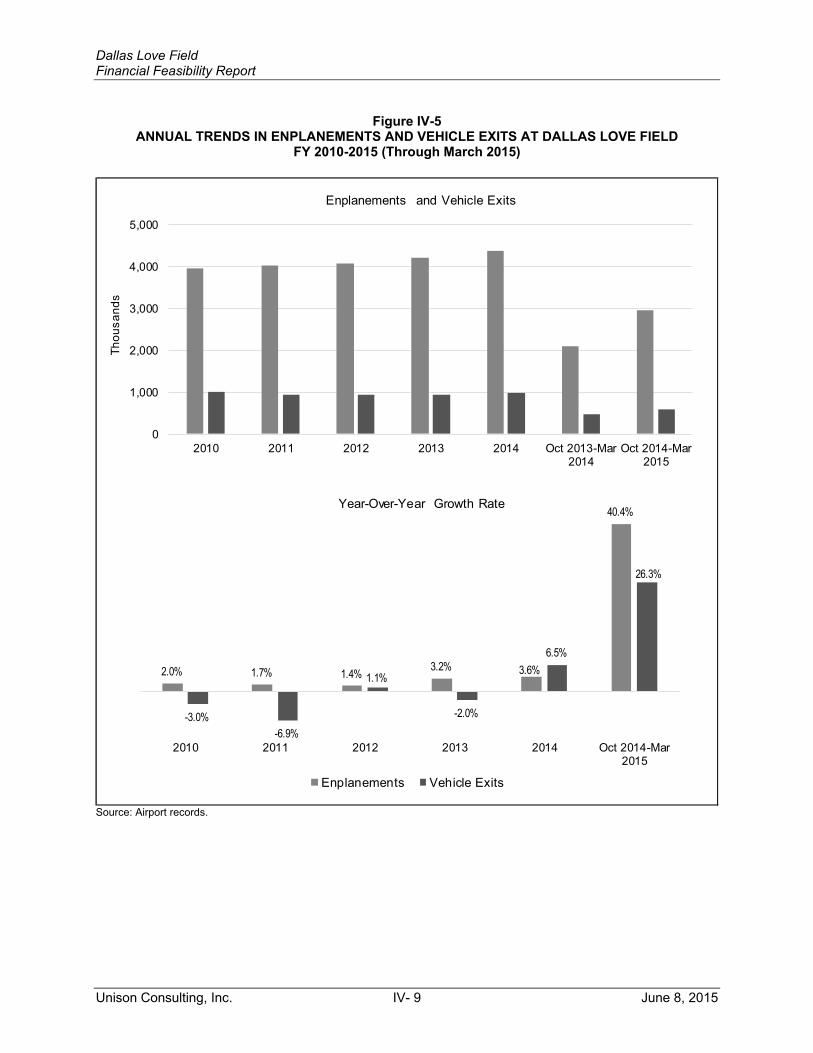
Dallas Love Field Financial Feasibility Report �
Unison Consulting, Inc. IV- 9 June 8, 2015
Figure IV-5
ANNUAL TRENDS IN ENPLANEMENTS AND VEHICLE EXITS AT DALLAS LOVE FIELD FY 2010-2015 (Through March 2015)
Source: Airport records.
0
1,000
2,000
3,000
4,000
5,000
2010 2011 2012 2013 2014 Oct 2013-Mar2014
Oct 2014-Mar2015
2.0% 1.7% 1.4% 3.2% 3.6%
40.4%
-3.0%-6.9%
1.1%
-2.0%
6.5%
26.3%
2010 2011 2012 2013 2014 Oct 2014-Mar2015
Enplanements Vehicle Exits
Enplanements and Vehicle Exits
Thou
sand
s
Year-Over-Year Growth Rate

Dallas Love Field Financial Feasibility Report �
Unison Consulting, Inc. IV- 10 June 8, 2015
Figure IV-6
MONTHLY TRENDS IN ENPLANEMENTS AND VEHICLE EXITS AT DALLAS LOVE FIELD October 2009-March 2015
Source: Airport records.
Besides enplanement levels, other factors affect parking demand—for example, changes in passengers’ choices of ground transportation, competition from off-airport parking facilities, and changes in the Airport’s parking rates. Increases in the Airport’s parking rates can dampen parking demand. The two most recent parking rate increases at the Airport took effect in October 2010 and August 2014. Parking rate increases and other factors explain why the trends in enplanements and vehicle exits are not perfectly correlated. The ratio of vehicle exits to enplanements is decreasing—from 254 vehicle exits per 1,000 enplanements in FY 2010 to 198 vehicle exits per 1,000 enplanements during the first half of FY 2015 (Figure IV-7).
0
20
40
60
80
100
120
140
160
180
Oct
-09
Dec
-09
Feb-
10A
pr-1
0Ju
n-10
Aug
-10
Oct
-10
Dec
-10
Feb-
11A
pr-1
1Ju
n-11
Aug
-11
Oct
-11
Dec
-11
Feb-
12A
pr-1
2Ju
n-12
Aug
-12
Oct
-12
Dec
-12
Feb-
13A
pr-1
3Ju
n-13
Aug
-13
Oct
-13
Dec
-13
Feb-
14A
pr-1
4Ju
n-14
Aug
-14
Oct
-14
Dec
-14
Feb-
15
Inde
x (O
ct. 2
004
Leve
l =
100)
Enplanements
Vehicle Exits

Dallas Love Field Financial Feasibility Report �
Unison Consulting, Inc. IV- 11 June 8, 2015
Figure IV-7
RATIO OF VEHICLE EXITS TO ENPLANEMENTS FY 2010-2015 (Though March 2015)
Source: Airport records.
E. VEHICLE EXITS BY FACILITY Figure IV-8 shows vehicle exits by facility. Garage A is the busiest, having accounted for 70 percent of total exits before valet service began and 66 percent after that. Garage B accounted for 30 percent, valet service accounted for 4 percent. In the last four years when annual vehicle exits were under 1 million, Garage A, serving mostly short-term parking, averaged 217 exits per space, while Garage B, serving mostly long-term parking, averaged 70 exits per space.

Dallas Love Field Financial Feasibility Report �
Unison Consulting, Inc. IV- 12 June 8, 2015
Figure IV-8
VEHICLE EXITS BY FACILITY AT DALLAS LOVE FIELD FY 2010-2015 (Through March 2015)
Source: Airport records.
Facility 2010 2011 2012 2013 2014Oct '14-Mar '15
Garage A (2,980 spaces) 698,604 659,073 659,285 645,857 656,552 384,540Garage B (4,000 spaces) 302,780 273,275 283,392 270,412 299,685 178,231Valet (743 spaces) 7,645 27,997 21,838Total 1,001,384 932,348 942,677 923,914 984,234 584,609
Vehicle Exits
0
200
400
600
800
1,000
1,200
2010 2011 2012 2013 2014 Oct '14-Mar '15
Thou
sand
s
Valet (743 spaces)
Garage B (4,000 spaces)
Garage A (2,980 spaces)
0
50
100
150
200
250
2010 2011 2012 2013 2014 Oct '14-Mar '15
Garage A (2,980 spaces) Garage B (4,000 spaces) Valet (743 spaces)
Vehicle Exits by Facility
Annual Vehicle Exits per Space by Facility

Dallas Love Field Financial Feasibility Report �
Unison Consulting, Inc. IV- 13 June 8, 2015
F. PEAK PARKING OCCUPANCY Parking occupancy measures the number of vehicles parked at a time. It is the basis for judging whether the supply of parking spaces is enough or short. The garage revenue control system tracks the number of cars parked in each garage for every 1-hour period every day, allowing us to determine peak occupancy—the largest number of vehicles parked within a 1-hour period. Table IV-5 presents three measures of peak occupancy:
� Monthly peak – the highest occupancy recorded each month
� Annual peak – the highest of the monthly peak occurrences, or the highest occupancy recorded in a year
� Average peak – the average of the monthly peak occupancies
Table IV-5 shows how many days occupancy reached or exceeded the average peak: 301 days in FY 2014 and 18 days during the first seven months of FY 2015. Occupancy has been exceeding the stated capacities of both garages (Figure IV-9). Occupancy in both garages reached 7,010 vehicles during each month in FY 2014, except May. Therefore the difference between the annual peak and the average peak measures is trivial. During the first seven months in FY 2015, occupancy reached or exceeded 7,010 vehicles in three months and came close to 7,000 vehicles in three other months. Occupancy reaches the annual peak on more than one day a year. Table IV-5 shows that occupancy hit the annual peak in both garages most frequently on Sundays in FY 2014 and Wednesdays during the first seven months in FY 2015.

Dallas Love Field Financial Feasibility Report �
Unison Consulting, Inc. IV- 14 June 8, 2015
Table IV-5
PEAK PARKING OCCUPANCY IN GARAGE A AND GARAGE B FY 2014-2015 (Through April 2015)
1 This refers to the year’s highest parking occupancy within a 1-hour period. 2 See Table IV-3. 3 This represents the average of each month’s highest parking occupancy within a 1-hour period. Source: Airport records.
Month FY 2014 FY 2015 FY 2014 FY 2015 FY 2014 FY 2015Monthly Peak OccupancyOctober 3,000 3,000 4,010 4,010 7,010 7,010November 3,000 3,866 4,010 4,010 7,010 7,876December 3,000 2,358 4,010 3,043 7,010 5,401January 3,000 2,882 4,010 3,829 7,010 6,711February 3,000 2,941 4,010 4,010 7,010 6,951March 3,000 3,000 4,010 4,010 7,010 7,010April 3,000 3,000 4,010 3,926 7,010 6,926May 3,000 3,932 6,932June 3,000 4,010 7,010July 3,000 4,010 7,010August 3,000 4,010 7,010September 3,000 4,010 7,010
Annual Peak Occupancy1 3,000 3,866 4,010 4,010 7,010 7,876as a Percentage of:Actual Spaces2 101% 130% 100% 100% 100% 113%LOS B effective spaces2 106% 137% 103% 103% 104% 117%LOS A effective spaces2 118% 153% 111% 111% 114% 128%
Average Peak Occupancy3 3,000 3,007 4,004 3,834 7,004 6,841as a Percentage of:Actual Spaces2 101% 101% 100% 96% 100% 98%LOS B effective spaces2 106% 106% 103% 99% 104% 102%LOS A effective spaces2 118% 119% 111% 107% 114% 112%
97 1 204 17 301 18
Day(s) of the Week Occupancy Reached the Period's Peak Most Frequently
Sunday and Monday
Wednesday Sunday Wednesday and
Thursday
Sunday Wednesday
Garage A (Short-Term) Garage B (Long-Term) Garage A & B
Number of Days Occupancy Reached or Exceeded the Average Peak

Dallas Love Field Financial Feasibility Report �
Unison Consulting, Inc. IV- 15 June 8, 2015
Figure IV-9
COMBINED PEAK PARKING OCCUPANCY IN GARAGES A AND B AT DALLAS LOVE FIELD FY 2014-2015 (Through April 2015)
See Table IV-5. Source: Airport records.
Table IV-6 and Table IV-7 present another way of evaluating occupancy in Garage A and B, respectively. We looked at peak occupancy counts each day and counted the days in which the day’s peak occupancy in each garage exceeded absolute capacity, LOS B effective capacity, LOS A effective capacity, and different utilization percentages (90 percent, 80 percent and 70 percent). The key findings are summarized below:
Garage A � In FY 2014, the daily peak occupancy never exceeded stated capacity, but it
exceeded LOS B effective capacity on 162 days (44 percent of 365 days) and exceeded LOS A effective capacity on 323 days (88 percent of 365 days).
� In FY 2015 (through April 2015), the daily peak occupancy exceeded stated
capacity on 2 days so far (1 percent of 212 days). It exceeded LOS B effective capacity on 54 days (25 percent of 212 days) and exceeded LOS A effective capacity on 116 days (55 percent of 212 days).
0
1,000
2,000
3,000
4,000
5,000
6,000
7,000
8,000
Oct
-13
Nov
-13
Dec
-13
Jan-
14
Feb-
14
Mar
-14
Apr-
14
May
-14
Jun-
14
Jul-1
4
Aug
-14
Sep
-14
Oct
-14
Nov
-14
Dec
-14
Jan-
15
Feb-
15
Mar
-15
Apr-
15
Peak Occupancy Total Spaces LOS B LOS A

Dallas Love Field Financial Feasibility Report �
Unison Consulting, Inc. IV- 16 June 8, 2015
Table IV-6
NUMBER OF DAYS PEAK OCCUPANCY EXCEEDED STATED AND EFFECTIVE CAPACITIES IN GARAGE A
FY 2014-2015 (Through April 2015)
Source: Airport records.
Number of Days
Percent of Total Days
Number of Days
Percent of Total Days
Actual Spaces 2,980 0 0% 2 1%90% 2,682 238 65% 77 36%80% 2,384 362 99% 149 70%70% 2,086 365 100% 180 85%
LOS B 2,831 162 44% 54 25%90% 2,548 317 87% 112 53%80% 2,265 365 100% 159 75%70% 1,982 365 100% 190 90%
LOS A 2,533 323 88% 116 55%90% 2,280 365 100% 159 75%80% 2,026 365 100% 186 88%70% 1,773 365 100% 193 91%
FY 2014 Oct. 2014-Apr. 2015Capacity Measure Spaces
Days Occupancy Exceeded Capacity Measure

Dallas Love Field Financial Feasibility Report �
Unison Consulting, Inc. IV- 17 June 8, 2015
Garage B � In FY 2014, the daily peak occupancy exceeded stated capacity on 268 days (73
percent of 365 days). It exceeded LOS B effective capacity on 329 days (90 percent of 365 days) and exceeded LOS A effective capacity on all but one day.
� In FY 2015 (through April 2015), the daily peak occupancy exceeded stated
capacity on 23 days so far (11 percent of 212 days). It exceeded LOS B effective capacity on 127 days (60 percent of 212 days) and exceeded LOS A effective capacity on 178 days (84 percent of 212 days).
Table IV-7 NUMBER OF DAYS PEAK OCCUPANCY EXCEEDED STATED AND
EFFECTIVE CAPACITIES IN GARAGE B FY 2014-2015 (Through April 2015)
Source: Airport records.
The planned new garage, scheduled for completion in 2018, will ease parking capacity constraints by adding approximately 5,000 spaces. G. PARKING DURATION Table IV-8 shows the distribution of vehicle exits in Garage A and B by parking duration—the length of time that cars are parked. From FY 2010 to 2014, the percentage of vehicles parked more than a day in both garages combined increased slightly from 39 percent to 41 percent, while the percentage of vehicles parked a day or less decreased slightly from 61 percent to 59 percent.
Number of Days
Percent of Total Days
Number of Days
Percent of Total Days
Actual Spaces 4,000 268 73% 23 11%90% 3,600 364 100% 177 83%80% 3,200 365 100% 178 84%70% 2,800 365 100% 180 85%
LOS B 3,880 329 90% 127 60%90% 3,492 364 100% 178 84%80% 3,104 365 100% 178 84%70% 2,716 365 100% 188 89%
LOS A 3,600 364 100% 178 84%90% 3,240 365 100% 178 84%80% 2,880 365 100% 186 88%70% 2,520 365 100% 193 91%
Days Occupancy Exceeded Capacity MeasureFY 2014 Oct. 2014-Apr. 2015Capacity
Measure Spaces

Dallas Love Field Financial Feasibility Report �
Unison Consulting, Inc. IV- 18 June 8, 2015
The distribution patterns in each garage are consistent with what we expect. In Garage A which is intended for short-term parking, the percentage of vehicles parked 1 day or less is higher than the percentage parked more than 1 day. In Garage B which is intended for long-term parking, the percentage of vehicles parked more than 1 day is higher than the percentage parked 1 day or less. The trends over the years reveal interesting patterns: In Garage A, the percentage of vehicles parked more than 1 day increased from 27 percent in FY 2010 to 34 percent in FY 2014. In Garage B, the percentage of vehicles parked 1 day or less increased from less than 35 percent in FY 2010 to 44 percent in FY 2014. The trends in FY 2015 so far indicate a reversal of these patterns.
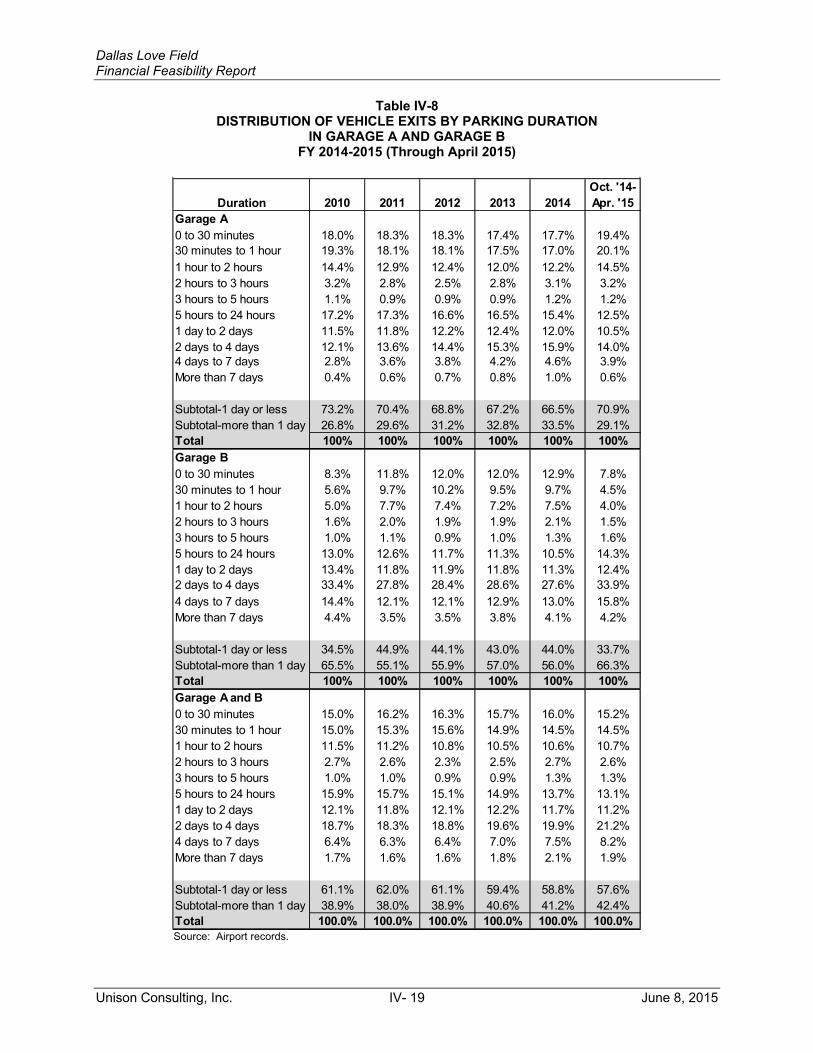
Dallas Love Field Financial Feasibility Report �
Unison Consulting, Inc. IV- 19 June 8, 2015
Table IV-8 DISTRIBUTION OF VEHICLE EXITS BY PARKING DURATION
IN GARAGE A AND GARAGE B FY 2014-2015 (Through April 2015)
Source: Airport records.
DurationGarage A0 to 30 minutes 18.0% 18.3% 18.3% 17.4% 17.7% 19.4%30 minutes to 1 hour 19.3% 18.1% 18.1% 17.5% 17.0% 20.1%1 hour to 2 hours 14.4% 12.9% 12.4% 12.0% 12.2% 14.5%2 hours to 3 hours 3.2% 2.8% 2.5% 2.8% 3.1% 3.2%3 hours to 5 hours 1.1% 0.9% 0.9% 0.9% 1.2% 1.2%5 hours to 24 hours 17.2% 17.3% 16.6% 16.5% 15.4% 12.5%1 day to 2 days 11.5% 11.8% 12.2% 12.4% 12.0% 10.5%2 days to 4 days 12.1% 13.6% 14.4% 15.3% 15.9% 14.0%4 days to 7 days 2.8% 3.6% 3.8% 4.2% 4.6% 3.9%More than 7 days 0.4% 0.6% 0.7% 0.8% 1.0% 0.6%
Subtotal-1 day or less 73.2% 70.4% 68.8% 67.2% 66.5% 70.9%Subtotal-more than 1 day 26.8% 29.6% 31.2% 32.8% 33.5% 29.1%Total 100% 100% 100% 100% 100% 100%Garage B0 to 30 minutes 8.3% 11.8% 12.0% 12.0% 12.9% 7.8%30 minutes to 1 hour 5.6% 9.7% 10.2% 9.5% 9.7% 4.5%1 hour to 2 hours 5.0% 7.7% 7.4% 7.2% 7.5% 4.0%2 hours to 3 hours 1.6% 2.0% 1.9% 1.9% 2.1% 1.5%3 hours to 5 hours 1.0% 1.1% 0.9% 1.0% 1.3% 1.6%5 hours to 24 hours 13.0% 12.6% 11.7% 11.3% 10.5% 14.3%1 day to 2 days 13.4% 11.8% 11.9% 11.8% 11.3% 12.4%2 days to 4 days 33.4% 27.8% 28.4% 28.6% 27.6% 33.9%4 days to 7 days 14.4% 12.1% 12.1% 12.9% 13.0% 15.8%More than 7 days 4.4% 3.5% 3.5% 3.8% 4.1% 4.2%
Subtotal-1 day or less 34.5% 44.9% 44.1% 43.0% 44.0% 33.7%Subtotal-more than 1 day 65.5% 55.1% 55.9% 57.0% 56.0% 66.3%Total 100% 100% 100% 100% 100% 100%Garage A and B0 to 30 minutes 15.0% 16.2% 16.3% 15.7% 16.0% 15.2%30 minutes to 1 hour 15.0% 15.3% 15.6% 14.9% 14.5% 14.5%1 hour to 2 hours 11.5% 11.2% 10.8% 10.5% 10.6% 10.7%2 hours to 3 hours 2.7% 2.6% 2.3% 2.5% 2.7% 2.6%3 hours to 5 hours 1.0% 1.0% 0.9% 0.9% 1.3% 1.3%5 hours to 24 hours 15.9% 15.7% 15.1% 14.9% 13.7% 13.1%1 day to 2 days 12.1% 11.8% 12.1% 12.2% 11.7% 11.2%2 days to 4 days 18.7% 18.3% 18.8% 19.6% 19.9% 21.2%4 days to 7 days 6.4% 6.3% 6.4% 7.0% 7.5% 8.2%More than 7 days 1.7% 1.6% 1.6% 1.8% 2.1% 1.9%
Subtotal-1 day or less 61.1% 62.0% 61.1% 59.4% 58.8% 57.6%Subtotal-more than 1 day 38.9% 38.0% 38.9% 40.6% 41.2% 42.4%Total 100.0% 100.0% 100.0% 100.0% 100.0% 100.0%
2012 2013 2014Oct. '14-Apr. '152010 2011

Dallas Love Field Financial Feasibility Report �
Unison Consulting, Inc. IV- 20 June 8, 2015
H. PARKING REVENUE During the period FY 2010-FY 2014, gross revenue increased 10.3 percent a year on average, from $14.6 million in FY 2010 to $21.6 million in FY 2014, despite annual vehicle exits decreasing from about 1 million in FY 2010 to less than 1 million in the each of the last four years (Table IV-9). The revenue increase is clearly due to rate increases and, to a lesser degree, the small increase in the proportion of vehicle exits parked more than a day. The average revenue per vehicle exit increased from $14.58 per exit in FY 2010 to $21.93 in 2014 by an average of 10.7 percent each year—far more than the average annual inflation of 2.1 percent. The first half of FY 2015 shows the effects of significant increases in both vehicle exits and parking rates. Gross parking revenue increased 58.6 percent year-over-year, and average revenue per vehicle exits increased 25.6 percent.
Table IV-9 VEHICLE EXITS, GROSS PARKING REVENUE AND AVERAGE REVENUE PER VEHICLE EXIT AT DAL
FY 2010-FY 2015 (Through March 2015)
Source: Airport records.
Figure IV-10 shows the breakdown of revenue by facility and the average revenue per vehicle exit by facility each year from FY 2010. Garage A accounted for 68 percent of annual revenue before valet service began and 59 percent after. Garage B accounted for 32 percent before valet service began and 35 percent after. Valet service so far accounted for 6 percent.
Vehicle Gross Parking Avg. RevenueExits (000) Revenue (000) per Vehicle Exit
2010 1,001 $14,600 $14.582011 932 $18,130 $19.452012 943 $18,649 $19.782013 924 $18,992 $20.562014 984 $21,579 $21.93
Oct '13-Mar '14 463 $9,780 $21.13Oct '14-Mar '15 585 $15,513 $26.54
2010-2014 -0.4% 10.3% 10.7% Oct '14-Mar '15 26.3% 58.6% 25.6%
Fiscal Year
Average Annual Growth Rate

Dallas Love Field Financial Feasibility Report �
Unison Consulting, Inc. IV- 21 June 8, 2015
Figure IV-10 GROSS REVENUE BY FACILITY AT DAL
FY 2010-2015 (Through March 2015)
Source: Airport records.
Garage A generates the lowest unit revenue—average revenue per vehicle exit—despite not having the lowest rates, because it serves mostly short-term parking. Valet service makes the highest unit revenue, because it has the highest rate and typically caters to long-term parkers.
Facility 2010 2011 2012 2013 2014Oct '14-Mar
'15Garage A (2,980 spaces) $9,683,033 $12,398,650 $12,819,772 $12,886,137 $13,546,977 $8,506,883Garage B (4,000 spaces) 4,917,124 5,731,129 5,829,290 5,852,741 6,920,002 5,887,597Valet (743 spaces) 252,927 1,112,365 1,118,312Total $14,602,167 $18,131,790 $18,651,074 $18,993,818 $21,581,358 $15,512,793
Gross Revenue
$0
$10
$20
$30
$40
$50
$60
2010 2011 2012 2013 2014 Oct '14-Mar '15
Garage A (2,980 spaces) Garage B (4,000 spaces) Valet (743 spaces)
Average Revenue per Vehicle Exit by Facility
$0
$5,000
$10,000
$15,000
$20,000
$25,000
2010 2011 2012 2013 2014 Oct '14-Mar'15
Thou
sand
s
Gross Revenue by Facility
Valet (743 spaces)
Garage B (4,000 spaces)
Garage A (2,980 spaces)

Dallas Love Field Financial Feasibility Report �
Unison Consulting, Inc. IV- 22 June 8, 2015
I. FORECAST METHODOLOGY AND SCENARIOS Public parking is a major source of non-airline revenue, and parking revenue forecasts are needed for the financial analysis in the next section. To forecast parking revenues, we first needed to forecast vehicle exits. We developed multivariate regression models to link growth in vehicle exits to forecast enplanements in Section III under three scenarios (Figure IV-11):
� Base enplanements – the base forecast enplanements constrained by terminal capacity of up to10 turns per day on each gate.
� High enplanements – the 75-percentile forecast enplanements, constrained only in FY 2024 by terminal capacity of up to 11 turns per day on each gate.
� Low enplanements – the 5-percentile forecast enplanements, which fall below terminal capacity at 10 turns per day on each gate throughout the 10-year forecast period.
Because the constrained base forecast is close to the 25-percentile forecast, we used the 5-percentile forecast for the low scenario. To get an unbiased estimate of the relationship between enplanements and vehicle exits, the regression models include other variables that influence trends in vehicle exits:
� the price of parking, measured by the average revenue per vehicle exit; and
� customer income, measured by per capita personal income in the Dallas-Fort Worth-Arlington MSA.
For the price of parking, we consider two scenarios: (1) no rate increase over the entire forecast period; and (2) with rates increasing with annual inflation (Figure IV-12). For customer income, we used forecast data from Moody’s Analytics that indicate growth in local per capita personal income at rates also shown in Figure IV-12. We used monthly data over a 10-year history to estimate the model parameters and therefore included variables for seasonal variations and serial correlation found in time series data. The regression models explain more than 94 percent of the trends in vehicle exits over the 10-year history.

Dallas Love Field Financial Feasibility Report �
Unison Consulting, Inc. IV- 23 June 8, 2015
Figure IV-11
FORECAST ENPLANEMENTS AT DAL FY 2014-2024
See Section III.
High EP Base EP Low EP2014 Actual 4,358 4,358 4,358
2015 6,383 6,244 5,9002016 7,237 7,028 6,5172017 7,414 7,072 6,5532018 7,561 7,115 6,5962019 7,707 7,156 6,5382020 7,781 7,195 6,5502021 7,863 7,229 6,5942022 7,957 7,262 6,6202023 8,070 7,295 6,6142024 8,124 7,327 6,691
2014-2016 28.9% 27.0% 22.3%2016-2024 1.5% 0.5% 0.3%
Enplanements (In Thousands)
Average Annual Growth Rates
Fiscal Year
4,0004,5005,0005,5006,0006,5007,0007,5008,0008,500
Enplanements (In Thousands)
High EP
Base EP
Low EP

Dallas Love Field Financial Feasibility Report �
Unison Consulting, Inc. IV- 24 June 8, 2015
Figure IV-12
FORECAST ANNUAL INFLATION AND GROWTH IN LOCAL PER CAPITA PERSONAL INCOME FY 2015-2024
Sources: U.S. Office of Management and Budget for forecast inflation and Moody’s Analytics for Dallas-Fort Worth-Arlington MSA per capita personal income.
J. FORECAST VEHICLE EXITS AND REVENUE The three enplanement scenarios and the two parking rate scenarios produce six scenarios for vehicle exits and revenue:
� Scenario 1: Base enplanements, no parking rate increase (Figure IV-13 and Figure IV-14).
� Scenario 2: Base enplanements, parking rates increasing with inflation (Figure IV-15 and Figure IV-16). This scenario is carried forward to Section V as the base forecast of parking revenues.
� Scenario 3: High enplanements, no parking rate increase (Figure IV-17 and Figure IV-18).
� Scenario 4: High enplanements, parking rates increasing with inflation (Figure IV-19 and Figure IV-20). This scenario is used in Section V for the sensitivity analysis (low forecast scenario).
� Scenario 5: Low enplanements, no parking rate increase (Figure IV-21 and Figure IV-22).
� Scenario 6: Low enplanements, parking rates increasing with inflation (Figure IV-23 and Figure IV-24). This scenario is used in Section V for the sensitivity analysis (high forecast scenario).
1.4% 1.
6% 1.8% 2.
0%
2.0%
2.0%
2.0%
2.0%
2.0%
2.0%2.
4%
3.7% 3.9%
4.8%
3.9%
3.1%
3.1%
3.1%
3.1%
3.1%
2 0 1 5 2 0 1 6 2 0 1 7 2 0 1 8 2 0 1 9 2 0 2 0 2 0 2 1 2 0 2 2 2 0 2 3 2 0 2 4
Inflation DFWA MSA Per Capita Personal Income

Dallas Love Field Financial Feasibility Report �
Unison Consulting, Inc. IV- 25 June 8, 2015
Figure IV-13
SCENARIO 1: BASE ENPLANEMENTS, NO PARKING RATE INCREASE FORECAST VEHICLE EXITS AT DAL
Garages Valet TotalHistorical 2005 874 0 874
2006 1,034 0 1,0342007 1,224 0 1,224 Previous Peak2008 1,199 0 1,1992009 1,032 0 1,0322010 1,001 0 1,0012011 932 0 9322012 943 0 9432013 916 8 9242014 956 28 984
Forecast 2015 1,171 46 1,2162016 1,291 50 1,3412017 1,307 51 1,3582018 1,327 52 1,3792019 1,345 52 1,3972020 1,360 53 1,4132021 1,375 54 1,4282022 1,390 54 1,4442023 1,405 55 1,4602024 1,420 55 1,476
Vehicle Exits (In Thousands)Fiscal Year
0200400600800
1,0001,2001,4001,600
2005
2006
2007
2008
2009
2010
2011
2012
2013
2014
2015
2016
2017
2018
2019
2020
2021
2022
2023
2024
Historical Forecast
Garages Valet
Vehicle Exits (In Thousands)

Dallas Love Field Financial Feasibility Report �
Unison Consulting, Inc. IV- 26 June 8, 2015
Figure IV-14 SCENARIO 1: BASE ENPLANEMENTS, NO PARKING RATE INCREASE
FORECAST GROSS PARKING REVENUE AT DAL
Note: this scenario is not carried forward to the financial analysis (Section V). Only the scenarios involving assumed parking rate increases are carried forward to Section V.
Garages Valet TotalHistorical 2014 $20,467 $1,112 $21,579Forecast 2015 $29,837 $2,450 $32,287
2016 $32,822 $2,706 $35,528 $33,8302017 $33,233 $2,741 $35,974 $33,8582018 $33,731 $2,782 $36,5132019 $34,179 $2,819 $36,9972020 $34,575 $2,851 $37,4262021 $34,952 $2,882 $37,8342022 $35,333 $2,914 $38,2472023 $35,717 $2,945 $38,6622024 $36,105 $2,977 $39,083
The new garage, opening in April 2018, will add 5,000 spaces.
Revenue (In Thousands)Fiscal Year
If garage vehicle exits are capped at the FY 2007 peak

Dallas Love Field Financial Feasibility Report �
Unison Consulting, Inc. IV- 27 June 8, 2015
Figure IV-15
SCENARIO 2: BASE ENPLANEMENTS, PARKING RATES INCREASE WITH INFLATION FORECAST VEHICLE EXITS AT DAL
Garages Valet TotalHistorical 2005 874 0 874
2006 1,034 0 1,0342007 1,224 0 1,224 Previous Peak2008 1,199 0 1,1992009 1,032 0 1,0322010 1,001 0 1,0012011 932 0 9322012 943 0 9432013 916 8 9242014 956 28 984
Forecast 2015 1,171 46 1,2162016 1,277 50 1,3272017 1,278 50 1,3282018 1,280 50 1,3302019 1,279 50 1,3292020 1,276 50 1,3262021 1,272 50 1,3222022 1,268 49 1,3182023 1,264 49 1,3132024 1,259 49 1,308
Fiscal YearVehicle Exits (In Thousands)
0200400600800
1,0001,2001,400
2005
2006
2007
2008
2009
2010
2011
2012
2013
2014
2015
2016
2017
2018
2019
2020
2021
2022
2023
2024
Historical Forecast
Garages Valet
Vehicle Exits (In Thousands)

Dallas Love Field Financial Feasibility Report �
Unison Consulting, Inc. IV- 28 June 8, 2015
Figure IV-16 SCENARIO 2: BASE ENPLANEMENTS, PARKING RATES INCREASE WITH INFLATION
FORECAST GROSS PARKING REVENUE AT DAL
Note: the garage vehicle exits used in the financial analysis (Section V) are not capped at the FY 2007 peak because the Aviation Department plans to utilize a remote surface lot when the garages become full.
Garages Valet TotalHistorical 2014 $20,467 $1,112 $21,579Forecast 2015 $29,837 $2,450 $32,287
2016 $32,980 $2,720 $35,700 $34,3302017 $33,571 $2,771 $36,342 $34,9282018 $34,275 $2,830 $37,1062019 $34,929 $2,886 $37,8152020 $35,532 $2,937 $38,4692021 $36,108 $2,986 $39,0942022 $36,686 $3,036 $39,7222023 $37,267 $3,085 $40,3532024 $37,850 $3,136 $40,985
If garage vehicle exits are capped at the FY 2007 peak
The new garage, opening in April 2018, will add 5,000 spaces.
Revenue (In Thousands)Fiscal Year

Dallas Love Field Financial Feasibility Report �
Unison Consulting, Inc. IV- 29 June 8, 2015
Figure IV-17
SCENARIO 3: HIGH ENPLANEMENTS, NO PARKING RATE INCREASE FORECAST VEHICLE EXITS AT DAL
Garages Valet TotalHistorical 2005 874 0 874
2006 1,034 0 1,0342007 1,224 0 1,224 Previous Peak2008 1,199 0 1,1992009 1,032 0 1,0322010 1,001 0 1,0012011 932 0 9322012 943 0 9432013 916 8 9242014 956 28 984
Forecast 2015 1,197 46 1,2442016 1,331 52 1,3822017 1,372 53 1,4252018 1,411 55 1,4662019 1,449 56 1,5052020 1,471 57 1,5282021 1,495 58 1,5532022 1,521 59 1,5802023 1,552 60 1,6122024 1,581 62 1,643
Vehicle Exits (In Thousands)Fiscal Year
0200400600800
1,0001,2001,4001,6001,800
2005
2006
2007
2008
2009
2010
2011
2012
2013
2014
2015
2016
2017
2018
2019
2020
2021
2022
2023
2024
Historical Forecast
Garages Valet
Vehicle Exits (In Thousands)

Dallas Love Field Financial Feasibility Report �
Unison Consulting, Inc. IV- 30 June 8, 2015
Figure IV-18
SCENARIO 3: HIGH ENPLANEMENTS, NO PARKING RATE INCREASE FORECAST GROSS PARKING REVENUE AT DAL
Note: this scenario is not carried forward to the financial analysis (Section V). Only the scenarios involving assumed parking rate increases are carried forward to Section V.
Garages Valet TotalHistorical 2014 $20,467 $1,112 $21,579Forecast 2015 $30,515 $2,495 $33,011
2016 $33,846 $2,792 $36,638 $33,9332017 $34,911 $2,879 $37,790 $34,0282018 $35,924 $2,962 $38,8862019 $36,888 $3,040 $39,9282020 $37,461 $3,087 $40,5472021 $38,073 $3,137 $41,2092022 $38,749 $3,192 $41,9402023 $39,531 $3,256 $42,7872024 $40,296 $3,318 $43,614
The new garage, opening in April 2018, will add 5,000 spaces.
Revenue (In Thousands)Fiscal Year
If garage vehicle exits are capped at the FY 2007 peak

Dallas Love Field Financial Feasibility Report �
Unison Consulting, Inc. IV- 31 June 8, 2015
Figure IV-19
SCENARIO 4: HIGH ENPLANEMENTS, PARKING RATES INCREASE WITH INFLATION FORECAST VEHICLE EXITS AT DAL
Garages Valet TotalHistorical 2005 874 0 874
2006 1,034 0 1,0342007 1,224 0 1,224 Previous Peak2008 1,199 0 1,1992009 1,032 0 1,0322010 1,001 0 1,0012011 932 0 9322012 943 0 9432013 916 8 9242014 956 28 984
Forecast 2015 1,197 46 1,2442016 1,317 51 1,3682017 1,343 52 1,3952018 1,364 53 1,4172019 1,384 54 1,4372020 1,387 54 1,4412021 1,392 54 1,4472022 1,399 54 1,4542023 1,410 55 1,4652024 1,420 55 1,475
Vehicle Exits (In Thousands)Fiscal Year
0200400600800
1,0001,2001,4001,600
2005
2006
2007
2008
2009
2010
2011
2012
2013
2014
2015
2016
2017
2018
2019
2020
2021
2022
2023
2024
Historical Forecast
Garages Valet
Vehicle Exits (In Thousands)
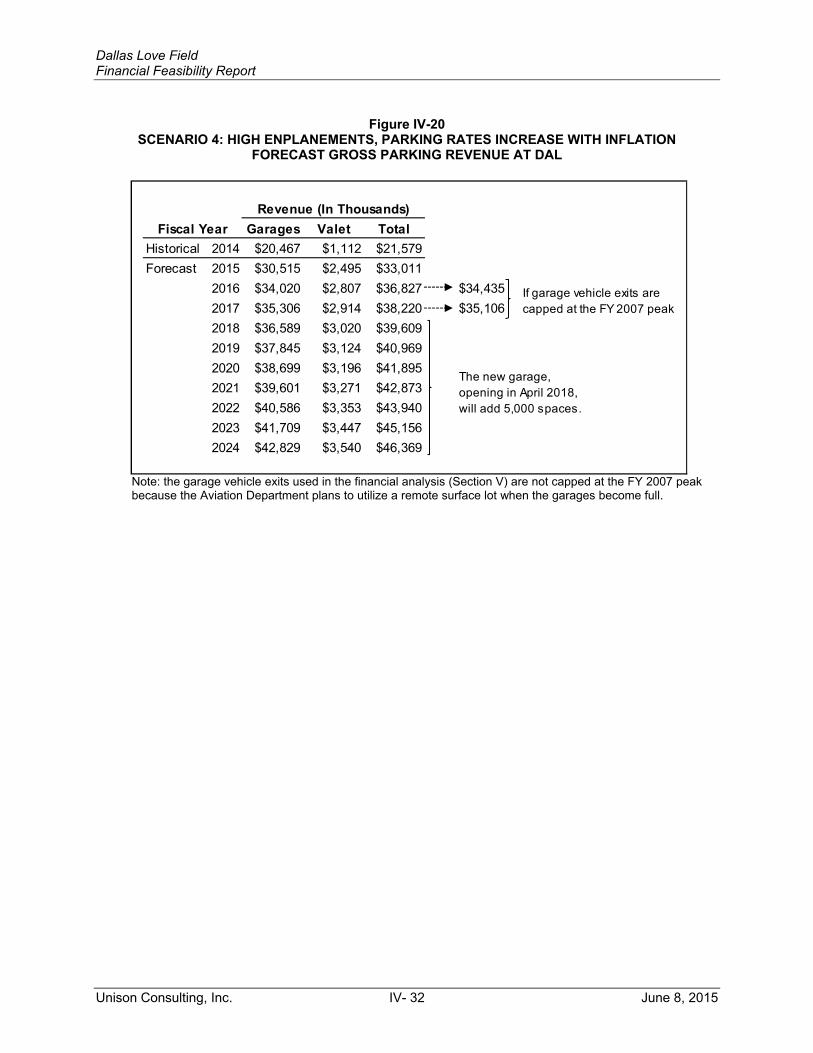
Dallas Love Field Financial Feasibility Report �
Unison Consulting, Inc. IV- 32 June 8, 2015
Figure IV-20
SCENARIO 4: HIGH ENPLANEMENTS, PARKING RATES INCREASE WITH INFLATION FORECAST GROSS PARKING REVENUE AT DAL
Note: the garage vehicle exits used in the financial analysis (Section V) are not capped at the FY 2007 peak because the Aviation Department plans to utilize a remote surface lot when the garages become full.
Garages Valet TotalHistorical 2014 $20,467 $1,112 $21,579Forecast 2015 $30,515 $2,495 $33,011
2016 $34,020 $2,807 $36,827 $34,4352017 $35,306 $2,914 $38,220 $35,1062018 $36,589 $3,020 $39,6092019 $37,845 $3,124 $40,9692020 $38,699 $3,196 $41,8952021 $39,601 $3,271 $42,8732022 $40,586 $3,353 $43,9402023 $41,709 $3,447 $45,1562024 $42,829 $3,540 $46,369
The new garage, opening in April 2018, will add 5,000 spaces.
Revenue (In Thousands)Fiscal Year
If garage vehicle exits are capped at the FY 2007 peak

Dallas Love Field Financial Feasibility Report �
Unison Consulting, Inc. IV- 33 June 8, 2015
Figure IV-21
SCENARIO 5: LOW ENPLANEMENTS, NO PARKING RATE INCREASE FORECAST VEHICLE EXITS AT DAL
Garages Valet TotalHistorical 2005 874 0 874
2006 1,034 0 1,0342007 1,224 0 1,224 Previous Peak2008 1,199 0 1,1992009 1,032 0 1,0322010 1,001 0 1,0012011 932 0 9322012 943 0 9432013 916 8 9242014 956 28 984
Forecast 2015 1,106 43 1,1492016 1,194 46 1,2412017 1,209 47 1,2562018 1,229 48 1,2772019 1,228 48 1,2762020 1,238 48 1,2862021 1,255 49 1,3042022 1,269 49 1,3182023 1,276 50 1,3262024 1,300 51 1,351
Vehicle Exits (In Thousands)Fiscal Year
0200400600800
1,0001,2001,4001,600
2005
2006
2007
2008
2009
2010
2011
2012
2013
2014
2015
2016
2017
2018
2019
2020
2021
2022
2023
2024
Historical Forecast
Garages Valet
Vehicle Exits (In Thousands)

Dallas Love Field Financial Feasibility Report �
Unison Consulting, Inc. IV- 34 June 8, 2015
Figure IV-22 SCENARIO 5: LOW ENPLANEMENTS, NO PARKING RATE INCREASE
FORECAST GROSS PARKING REVENUE AT DAL
Note: this scenario is not carried forward to the financial analysis (Section V). Only the scenarios involving assumed parking rate increases are carried forward to Section V.
Garages Valet TotalHistorical 2014 $20,467 $1,112 $21,579Forecast 2015 $28,156 $2,337 $30,492
2016 $30,322 $2,497 $32,8192017 $30,692 $2,528 $33,2202018 $31,189 $2,569 $33,7582019 $31,149 $2,567 $33,7162020 $31,415 $2,589 $34,0042021 $31,839 $2,624 $34,4632022 $32,186 $2,652 $34,8382023 $32,376 $2,668 $35,0442024 $32,988 $2,718 $35,706
Revenue (In Thousands)Fiscal Year

Dallas Love Field Financial Feasibility Report �
Unison Consulting, Inc. IV- 35 June 8, 2015
Figure IV-23
SCENARIO 6: LOW ENPLANEMENTS, PARKING RATES INCREASE WITH INFLATION FORECAST VEHICLE EXITS AT DAL
Garages Valet TotalHistorical 2005 874 0 874
2006 1,034 0 1,0342007 1,224 0 1,224 Previous Peak2008 1,199 0 1,1992009 1,032 0 1,0322010 1,001 0 1,0012011 932 0 9322012 943 0 9432013 916 8 9242014 956 28 984
Forecast 2015 1,106 43 1,1492016 1,181 46 1,2272017 1,180 46 1,2262018 1,182 46 1,2282019 1,162 45 1,2082020 1,155 45 1,2002021 1,152 45 1,1972022 1,147 45 1,1912023 1,135 44 1,1792024 1,139 44 1,183
Vehicle Exits (In Thousands)Fiscal Year
0200400600800
1,0001,2001,400
2005
2006
2007
2008
2009
2010
2011
2012
2013
2014
2015
2016
2017
2018
2019
2020
2021
2022
2023
2024
Historical Forecast
Garages Valet
Vehicle Exits (In Thousands)

Dallas Love Field Financial Feasibility Report �
Unison Consulting, Inc. IV- 36 June 8, 2015
Figure IV-24
SCENARIO 6: LOW ENPLANEMENTS, PARKING RATES INCREASE WITH INFLATION FORECAST GROSS PARKING REVENUE AT DAL
Garages Valet TotalHistorical 2014 $20,467 $1,112 $21,579Forecast 2015 $28,156 $2,337 $30,492
2016 $30,440 $2,508 $32,9472017 $30,943 $2,551 $33,4942018 $31,593 $2,606 $34,1992019 $31,669 $2,615 $34,2842020 $32,063 $2,649 $34,7122021 $32,623 $2,697 $35,3202022 $33,092 $2,737 $35,8292023 $33,376 $2,763 $36,1382024 $34,146 $2,828 $36,974
Revenue (In Thousands)Fiscal Year

Dallas Love Field Financial Feasibility Report �
Unison Consulting, Inc. IV- 37 June 8, 2015
Figure IV-25 compares the forecast vehicle exits under the six scenarios. For a particular enplanement scenario, implementing rate increases reduces forecast vehicle exits.
Figure IV-25 FORECAST VEHICLE EXITS AT DAL: ALL SCENARIOS
Fiscal YearHigh EP, No
Rate IncreaseHigh EP, With Rate Increase
Base EP, No Rate Increase
Base EP, With Rate Increase
Low EP, No Rate Increase
Low EP, With Rate Increase
2014 Actual 984 984 984 984 984 9842015 1,244 1,244 1,216 1,216 1,149 1,1492016 1,382 1,368 1,341 1,327 1,241 1,2272017 1,425 1,395 1,358 1,328 1,256 1,2262018 1,466 1,417 1,379 1,330 1,277 1,2282019 1,505 1,437 1,397 1,329 1,276 1,2082020 1,528 1,441 1,413 1,326 1,286 1,2002021 1,553 1,447 1,428 1,322 1,304 1,1972022 1,580 1,454 1,444 1,318 1,318 1,1912023 1,612 1,465 1,460 1,313 1,326 1,1792024 1,643 1,475 1,476 1,308 1,351 1,183
2014-2016 18.5% 17.9% 16.7% 16.1% 12.3% 11.6%2016-2024 2.2% 0.9% 1.2% -0.2% 1.1% -0.5%
Vehicle Exits (In Thousands)
Average Annual Growth Rates
800900
1,0001,1001,2001,3001,4001,5001,6001,700
2014Actual
2015 2016 2017 2018 2019 2020 2021 2022 2023 2024
Vehicle Exits (In Thousands)
High EP, No Rate Increase
High EP, With Rate Increase
Base EP, No Rate Increase
Base EP, With Rate Increase
Low EP, No Rate Increase
Low EP, With Rate Increase

Dallas Love Field Financial Feasibility Report �
Unison Consulting, Inc. IV- 38 June 8, 2015
Figure IV-26 compares the forecast parking revenue under the six scenarios. For a particular enplanement scenario, implementing rate increases raises forecast parking revenue even though it reduces forecast vehicle exits.
Figure IV-26 FORECAST GROSS PARKING REVENUE AT DAL: ALL SCENARIOS
Fiscal YearHigh EP, With Rate Increase
High EP, No Rate Increase
Base EP, With Rate Increase
Base EP, No Rate Increase
Low EP, With Rate Increase
Low EP, No Rate Increase
2014 Actual $21,579 $21,579 $21,579 $21,579 $21,579 $21,5792015 33,011 33,011 32,287 32,287 30,492 30,4922016 36,827 36,638 35,700 35,528 32,947 32,8192017 38,220 37,790 36,342 35,974 33,494 33,2202018 39,609 38,886 37,106 36,513 34,199 33,7582019 40,969 39,928 37,815 36,997 34,284 33,7162020 41,895 40,547 38,469 37,426 34,712 34,0042021 42,873 41,209 39,094 37,834 35,320 34,4632022 43,940 41,940 39,722 38,247 35,829 34,8382023 45,156 42,787 40,353 38,662 36,138 35,0442024 46,369 43,614 40,985 39,083 36,974 35,706
2014-2016 30.6% 30.3% 28.6% 28.3% 23.6% 23.3%2016-2024 2.9% 2.2% 1.7% 1.2% 1.5% 1.1%
Revenue (In Thousands)
Average Annual Growth Rates
$20,000
$25,000
$30,000
$35,000
$40,000
$45,000
$50,000
2014Actual
2015 2016 2017 2018 2019 2020 2021 2022 2023 2024
Revenue (In Thousands)
High EP, With Rate Increase
High EP, No Rate Increase
Base EP, With Rate Increase
Base EP, No Rate Increase
Low EP, With Rate Increase
Low EP, No Rate Increase

Dallas Love Field Financial Feasibility Report �
Unison Consulting, Inc. IV- 39 June 8, 2015
K. SOURCES OF FORECAST RISK AND UNCERTAINTY A number of factors can cause actual results to differ from forecast. Some of them are discussed below:
• Uncertainty about the future trends of explanatory variables. The analysis used the most recent available forecasts for key explanatory variables such as enplanements and local per capita personal income. The actual trends in these variables can deviate significantly from those considered in the forecasts.
• Other factors that could affect airport parking demand. Other factors, not explicitly considered in the forecast model, could cause future airport parking demand and revenue to be higher and lower than forecast. These include the mix of business and leisure passengers, the mix of residents and non-residents, and the relative convenience and cost of public and other for-hire ground transportation.
• Relative convenience and cost of off-Airport parking. If off-Airport parking facilities become more competitive on the basis of price, service offerings or location, future airport parking demand and revenue could be lower than forecast.
L. SUMMARY Public parking is a major source of non-airline revenue. This section described the public parking facilities at the Airport and analyzed recent historical trends in public parking demand in terms of vehicle exits, occupancy levels, parking duration, and parking revenue. It also presented projections of vehicle exits and revenues for the next 10 years. Following are the key findings in this section:
� The Airport currently has two public parking garages and a valet parking operation. The garages have 6,980 spaces, and the valet parking operation has access to 743 spaces in surface lots.
� In the past five fiscal years, annual vehicle exits in the two garages exceeded 1 million only in FY 2010. In FY 2015, the sharp increase in passenger traffic is likely to push total vehicle exits for the year well above 1 million. Vehicle exits totaled nearly 563,000 during the first six months of FY 2015. The recent rate increase, however, likely dampened the growth in parking demand, because the 25 percent year-over-year increase in vehicle exits during the first half of FY 2015 is significantly less than the 40 percent year-over-year increase in enplanements.
� Occupancy, which measures the number of vehicles parked at a time, has been frequently exceeding the garages’ effective capacities. The planned new garage,

Dallas Love Field Financial Feasibility Report �
Unison Consulting, Inc. IV- 40 June 8, 2015
scheduled to open in 2018, will greatly ease capacity constraints by adding approximately 5,000 spaces.
� Gross revenue from public parking increased from $14.6 million in FY 2010 to $21.6 million in FY 2014. The first half of FY 2015 shows gross revenue increasing nearly 59 percent. For the entire FY 2015, gross revenue is forecast to exceed $30 million.
� Forecasts of vehicle exits and gross revenue are presented for six scenarios. For the base enplanement scenario with parking rates increasing with inflation, annual vehicle exits are forecast to increase from 984,000 in FY 2014 to 1.3 million in FY 2016, and remain at around 1.3 million through FY 2024. Even with vehicle exits levelling off, moderate parking rate increases to keep up with inflation result in annual gross revenue increasing steadily from $21.6 million in FY 2014 to almost $41 million in FY 2024.

Dallas Love Field Financial Feasibility Report
Unison Consulting, Inc. V - 1 June 8, 2015
SECTION V FINANCIAL ANALYSIS AND FORECAST
This section presents a discussion of the framework for the financial operation of the Airport, the components of Operation and Maintenance (O&M) Expenses, the sources of Airport System Revenues, forecasts of O&M Expenses and Revenues, and the application of Revenues to certain funds and accounts. A. FRAMEWORK FOR AIRPORT SYSTEM FINANCIAL OPERATIONS The framework for the issuance of the Series 2015 Bonds and the financial operation of the Airport System is provided by the following documents:
� Project Financing Agreement � Indenture � Bond Resolution � Airport Use and Lease Agreement
Each of these documents is discussed below. 1. Project Financing Agreement The City and the LFAMC have negotiated and plan to execute a Project Financing Agreement, dated as of July 1, 2015, pursuant to which the LFAMC and the City have agreed to cooperate and coordinate for the financing, design, and construction of the Project. Under the provisions of the Project Financing Agreement, the LFAMC has the authority to issue the Series 2015 Bonds and one or more future series of GARBs (referred to collectively as “Bonds” in the Project Financing Agreement) to finance the Project. The LFAMC and the City have agreed to certain duties and responsibilities pursuant to the Project Financing Agreement, including the following:
� LFAMC
o Issue Bonds in the amounts necessary to finance the design and construction, and related costs, of the Project;
o Deposit funds received from the City pursuant to the Project Financing Agreement into the Pledged Revenue Fund (as defined in the Indenture described later in this Section); and
o Pay debt service on the Bonds issued to finance the Project (and any related reserve fund deposits, fees and expenses, and any other related costs), from payments made to the LFAMC by the City pursuant to the Project Financing Agreement.

Dallas Love Field Financial Feasibility Report
Unison Consulting, Inc. V - 2 June 8, 2015
� The City
o Throughout the term of the Bonds, own and operate the Airport System and to charge and collect rates, fees, and revenues for the use and operation of the Airport System, in amounts sufficient to maintain the Airport, including the Project;
o Make deposits to the GARB Debt Service Fund and the GARB Debt Service Reserve Fund (pursuant to the requirements of the Indenture and the Airport Use and Lease Agreement); and
o Pay to the LFAMC, on a monthly basis, all monies then on deposit in the
GARB Debt Service Fund. The source of funds to meet the City’s obligation under the terms of the Project Financing Agreement to make payments to the LFAMC shall be limited to the Airport System Net Revenues. Such financial obligations of the City to the LFAMC shall not be payable from moneys raised or to be raised by taxation. 2. Indenture Under the provisions of the “Indenture of Trust By and Between Love Field Airport Modernization Corporation and Wells Fargo Bank, National Association as Trustee,” dated as of July 1, 2015 (the Indenture), the LFAMC has pledged to the Trustee the payments the LFAMC will receive from the City under the terms of the Project Financing Agreement, for the purpose of paying the debt service on the Series 2015 Bonds and any other GARBs issued to finance the Project. The Indenture establishes certain funds, and the order of priority for the application of moneys received by the LFAMC from the City into those funds1. Immediately upon receipt by the LFAMC of moneys from the City, the LFAMC shall deposit such moneys into the Pledged Revenue Fund. Moneys in the Pledged Revenue Fund shall be held in trust by the Trustee and applied in the following order of priority:
� First, to the Debt Service Fund the amounts necessary to make the balance therein equal to the interest and principal payments due on the GARBs in the then current Fiscal Year;
� Second, to the Reserve Fund the amounts required to attain or maintain the Reserve Requirement;
� Third, to the payment of the fees and expenses of the Trustee and Paying Agent/Registrar due and owing in the then current Fiscal Year;
������������������������������������������������������������1 All capitalized terms used in this sub-section are defined terms in the Indenture.
Dallas Love Field Financial Feasibility Report
Unison Consulting, Inc. V - 3 June 8, 2015
� Fourth, to any fund or account created for the benefit of any Subordinate Lien Obligation, under certain conditions; and
� Fifth, as directed by the LFAMC, to the Project Fund to pay for any services, improvements, or other Project costs agreed to by the City and the LFAMC, under certain conditions.
3. Bond Resolution The Board of Directors of the LFAMC approved a resolution (the Bond Resolution) authorizing the issuance of the Series 2015 Bonds, in an aggregate principal amount not to exceed $150.0 million. The Bond Resolution also approved a bond purchase contract and other contract documents related to the Series 2015 Bonds. It is currently anticipated that the costs of designing and constructing the Project will be funded with the proceeds of the Series 2015 Bonds and one subsequent issue of GARBs, estimated to be issued in 2016 (referred to as the “Series 2016 Bonds” in this Report). The proceeds of the Series 2015 Bonds and the Series 2016 Bonds will be used to fund the design and planning of the Project; pay any associated costs including the funding of reserve funds, capitalized interest, and costs of issuance of the Series 2015 Bonds and the Series 2016 Bonds. 4. Airport Use and Lease Agreement The Airport Use and Lease Agreement (1) governs ongoing airline operations and use of the Airport both during and after the implementation of the LFMP, (2) defines and allocates Airport gates, (3) establishes a new rates and charges methodology, (4) develops terms for the use of the Airport, (5) develops guidelines for future capital improvements at the Airport, and (6) provides other provisions that are consistent with accomplishing the terms of the Five Party Agreement. The Airport Use and Lease Agreement became effective on October 1, 2008, with a 20-year term that will expire on September 30, 2028. Three airlines are signatories to the Airport Use and Lease Agreement: Southwest, American, and United. However, as of the date of this Report, American and United no longer operate at the Airport. Delta, Virgin, and SeaPort operate under the provisions of the Airport Use and Lease Agreement via subleases with American (Virgin and SeaPort) and United (Delta). At the beginning of the term of the Airport Use and Lease Agreement, the airlines were obligated to pay fixed, negotiated terminal building rental rates and landing fee rates for their use of the then-existing facilities prior to the completion of the first major phase of the LFMP. The new rate-making methodology of the Airport Use and Lease Agreement became effective as the date of beneficial occupancy of the initial phase – completion of the first 12 gates of the new concourse – which occurred in April 2013. The new rate-making methodology established under the Airport Use and Lease Agreement is a “cost center residual cost” rate methodology, in which certain non-airline revenues are credited to the airline rate base, as described below.

Dallas Love Field Financial Feasibility Report
Unison Consulting, Inc. V - 4 June 8, 2015
The rate methodology defines the following primary cost centers:
� Airfield � Apron Area � Terminal Building � Other Building and Areas � Parking and Ground Transportation Area � Terminal Roadways
The Airfield, Apron Area, and Terminal Building cost centers are considered the airline cost centers for the purposes of calculating and assessing airline rates and charges. The following costs allocable to these cost centers are:
� Direct and indirect O&M Expenses � Debt service on the Bonds and any general airport revenue bonds the City may
issue in the future � Amortization of the net cost of each capital project placed in service in the
Terminal Building on or after October 1, 2008 � Additional deposits to, or replenishment of, certain reserve funds
In calculating the Annual Terminal Building Requirement the following amounts are credited against the Terminal Building Cost:
� Seventy-five percent of all concession revenues generated in the Terminal Building
� One hundred percent of the nonairline terminal building space rentals � Other ancillary Terminal Building revenues � Interest income on the certain funds and accounts.
In addition, seventy-five percent of the net revenues generated in the Parking and Ground Transportation Area cost center are credited to the Annual Terminal Building Requirement and the Annual Airfield Requirement, with the percentage attributable to each of the two cost centers to be agreed upon annually. Currently, the City credits all of the 75 percent of the net revenues of the Parking and Ground Transportation cost center to the Terminal Building cost center. The net revenues of the Parking and Ground Transportation cost center are calculated as Parking and Ground Transportation revenues minus the following costs allocated to the Parking and Ground Transportation cost center: (1) O&M Expenses; (2) Deposits to O&M Reserve Fund; (3) Debt Service requirements; (4) amortization of City-funded assets; and (5) 50% of the net deficit of the Terminal Roadways cost center. The net deficit in the Terminal Roadways cost center is allocated equally to the Parking and Ground Transportation cost center (50 percent) and the Terminal Building cost center (50 percent).

Dallas Love Field Financial Feasibility Report
Unison Consulting, Inc. V - 5 June 8, 2015
The average Terminal Building rental rate is then calculated by dividing the net Terminal Building Cost by the amount of airline leased space in the terminal complex. In calculating the Annual Apron Area Requirement, the following amounts are credited against the Apron Area Cost:
� Apron fees charged to non-Signatory Airline users of the Apron Area � Other ancillary Apron Area revenues, including remain overnight (RON) parking
charges � Interest income on the certain funds and accounts
The apron fee rate is then calculated by dividing the net Apron Area cost by the number of aircraft gates (20). The Annual Airfield Requirement is calculated by crediting the following amounts against Total Airfield Costs:
� General aviation fuel flowage fees; � Non-signatory Airline landing fees; � Other ancillary Airfield revenues, if any; � Interest income on the certain funds and accounts established pursuant to the
Trust Indenture; and � A portion of the net revenues generated in the Parking and Ground
Transportation Area Cost Center (see discussion above). The City generates surplus annual net revenues from its operation of the Airport System in the approximate amount of the sum of: (1) the net revenues of the Other Buildings & Areas cost center, (2) 25 percent of the net revenues in the Parking & Ground Transportation Area cost center, and (3) 25 percent of Terminal concession revenues, less any deficits incurred by the City in the operation of Dallas Executive Airport and the Heliport. These net revenues will flow to the credit of the Aviation Capital Fund to be used to fund future Airport System Capital Improvements and other lawful Airport System purposes. From the commencement of the Airport Use and Lease Agreement through FY 2014, funds may accumulate without limit in the Aviation Capital Fund to provide funding for the LFMP and other capital projects. Effective in FY 2015, the ending balance in the Aviation Capital Fund will be “capped” at $30 million (in 2015 dollars). The “cap” amount will be increased thereafter by the percent change in the Consumer Price Index (CPI). In the annual rate settlement process, if the ending balance in the Aviation Capital Fund in a particular Fiscal Year exceeds the $30 million “cap” (as adjusted for inflation), the amount of such excess funds is to be transferred to the Revenue Fund and applied as further credits to the airlines in the final calculation of terminal rentals, apron fees and landing fees for that Fiscal Year, subject to certain limitations.

Dallas Love Field Financial Feasibility Report
Unison Consulting, Inc. V - 6 June 8, 2015
5. Application of Revenues The Airport Use and Lease Agreement establishes priorities for the application of Airport System Revenues. Airport System Revenues are to be deposited into the Aviation Revenue Fund and applied to the following funds and accounts in the following order of priority:
1. O&M Account – to pay O&M Expenses.
2. O&M Reserve Account – to maintain a balance equal to three (3) months—twenty-five percent (25%)--of the current annual operating budget for the Airport System.
3. GARB Debt Service Fund – to pay GARB Debt Service on any bonds, notes or debt instruments that may be issued from time to time by the City or the LFAMC to fund Airport System Capital Improvements.
4. GARB Debt Service Reserve Fund – to fund or restore the GARB Debt Service Reserve Fund established in support of GARBs.
5. Southwest Reimbursement Account – to reimburse Southwest for LFMP Debt Service Facilities Payments made by Southwest under the Facilities Agreement with the LFAMC and the City.
6. Emergency Repair & Replacement Reserve – to replenish the balance in this fund to Five Million Dollars ($5,000,000).
7. Aviation Capital Fund – all remaining revenues, to be used to pay the Net Costs of Airport System Capital Improvements and for any other lawful purposes of the Airport System.
The application of Airport System Revenues and the principal flows among the various funds and accounts pursuant to the Airport Use and Lease Agreement are illustrated on Figure V-1.

Dallas Love Field Financial Feasibility Report
Unison Consulting, Inc. V - 7 June 8, 2015
Figure V-1 FLOW OF FUNDS
AIRPORT USE AND LEASE AGREEMENT
AIRPORT SYSTEM REVENUES
AVIATION REVENUE FUND
O&M ACCOUNT
To pay O&M Expenses
O&M RESERVE ACCOUNT
To maintain a balance equal to three months (25 percent) of the current annual operating budget
GARB DEBT SERVICE FUND
To pay GARB Debt Service on any bonds, notes or debt instruments that may be issued to fund Capital Improvements
GARB DEBT SERVICE RESERVE FUND
To fund or restore the GARB Debt Service Reserve Fund
SOUTHWEST REIMBURSEMENT ACCOUNT
To reimburse Southwest for LFMP Debt Service Facilities Payments made by Southwest under the Facilities Agreement
EMERGENCY REPAIR & REPLACEMENT RESERVETo replenish the balance in this fund to $5,000,000
AVIATION CAPITAL FUND
All remaining revenues, to be used to pay the Net Costs of Airport System Capital Improvements and for other lawful purposes of the Airport System

Dallas Love Field Financial Feasibility Report
Unison Consulting, Inc. V - 8 June 8, 2015
B. DEBT SERVICE Table V-1 summarizes (1) the debt service requirements associated with the General Airport Revenue Bonds, consisting of the Series 2015 Bonds, the Series 2016 Bonds, and the potential revenue bonds anticipated in the financial plan for the draft Master Plan; and (2) the Obligation of Revenue Credit Agreement (defined below), providing funds to reimburse Southwest for the Facilities Payments made by Southwest under the Special Facilities Agreement. The Airport Use and Lease Agreement established priorities for the application of Airport System revenues. Airport System revenues are to be deposited into the Aviation Revenue Fund and applied first to pay O&M Expenses and any required deposits to the O&M Reserve Account; then to pay debt service on outstanding GARBs and any required deposits to the GARB Debt Service Reserve Fund. Only after these obligations are met are Airport System Revenues available to be applied to reimburse Southwest for Facilities Payments made by Southwest under the Special Facilities Agreement (the Obligation for Revenue Credit Agreement). Annual debt service on the Series 2015 Bonds and the Series 2016 Bonds is projected to equal approximately $9.4 million in FY 2018 (after the end of the capitalized interest period), and increase to $17.4 million in FY 2019 through FY 2021. The funding plan in the Master Plan anticipates that revenue bonds will be issued to fund a major airfield project, with approximately $3.6 million in debt service beginning in FY 2022. Annual debt service on all General Airport Revenue Bonds is projected to total approximately $21.0 million in FY 2022 through FY 2024. The annual Obligation for Revenue Credit Agreement is approximately $30.0 million. The following items are applied to the annual Obligation for Revenue Credit Agreement:
� A portion of PFC collections. To date, the City has received approval from the FAA to collect and use approximately $397.3 million in PFCs, at a $4.50 collection rate. The FAA approved the use of PFCs for the payment of the Obligation for Revenue Credit Agreement to help defray the costs of the LFMP. Therefore, the City applies $10.0 million in annual PFC collections to the debt service requirements for the Series 2010 and Series 2012 Bonds (the bonds issued to fund a portion of the LFMP capital costs for the terminal renovation and expansion).
� FAA grant payments. The City received a multi-year FAA Letter of Intent (LOI)
grant totaling approximately $56.3 million to fund a portion of the apron and fuel system costs that were included in the LFMP. The LOI grant payments, which are scheduled to continue through FY 2018, are being applied to the Obligation for Revenue Credit Agreement.

Dallas Love Field Financial Feasibility Report
Unison Consulting, Inc. V - 9 June 8, 2015
Table V-1 CITY OF DALLAS AIRPORT SYSTEM
PROJECTED DEBT SERVICE For Fiscal Years Ending September 30
2015 2016 2017 2018 2019 2020 2021 2022 2023 2024OUTSTANDING BONDS
General Airport Revenue BondsSeries 2015 Bonds 0 0 0 9,436,500 9,440,500 9,439,500 9,438,250 9,436,250 9,438,000 9,437,750Series 2016 Bonds 0 0 0 0 7,932,750 7,933,000 7,935,000 7,933,250 7,937,500 7,937,000Series 2022 Bonds (Airfield project) 0 0 0 0 0 0 0 3,600,000 3,600,000 3,600,000
Total General Airport Revenue Bonds $0 $0 $0 $9,436,500 $17,373,250 $17,372,500 $17,373,250 $20,969,500 $20,975,500 $20,974,750
Obligation for Revenue Credit AgreementSeries 2010 $16,275,000 $16,275,000 $16,275,000 $16,275,000 $16,275,000 $16,275,000 $16,275,000 $16,275,000 $16,275,000 $16,275,000Series 2012 13,709,750 13,710,250 13,713,250 13,712,750 13,713,000 13,713,000 13,711,000 13,712,000 13,709,750 13,713,250Less amounts applied: PFCs (10,000,000) (10,000,000) (10,000,000) (10,000,000) (10,000,000) (10,000,000) (10,000,000) (10,000,000) (10,000,000) (10,000,000) LOI grant payments (6,990,000) (7,340,000) (7,710,000) (1,660,000) 0 0 0 0 0 0
Total Obligation for Revenue Credit Agreement $12,994,750 $12,645,250 $12,278,250 $18,327,750 $19,988,000 $19,988,000 $19,986,000 $19,987,000 $19,984,750 $19,988,250
Total Debt Service $12,994,750 $12,645,250 $12,278,250 $27,764,250 $37,361,250 $37,360,500 $37,359,250 $40,956,500 $40,960,250 $40,963,000
Debt Service by Cost CenterAirfield $139,991 $136,226 $132,272 $197,443 $215,328 $215,328 $215,307 $3,815,318 $3,815,293 $3,815,331Terminal Building 10,107,522 9,835,675 9,550,217 14,255,613 15,546,982 15,546,982 15,545,426 15,546,204 15,544,454 15,547,177Apron Area 2,081,791 2,025,800 1,967,006 2,936,151 3,202,127 3,202,127 3,201,806 3,201,967 3,201,606 3,202,167Parking and Ground Transportation 631,524 614,539 596,703 10,327,199 18,344,634 18,343,884 18,344,537 18,340,836 18,346,726 18,346,146Terminal Roadways 0 0 0 0 0 0 0 0 0 0Other Buildings and Areas 33,923 33,010 32,052 47,844 52,178 52,178 52,173 52,176 52,170 52,179Executive Airport 0 0 0 0 0 0 0 0 0 0Heliport 0 0 0 0 0 0 0 0 0 0
Total Debt Service $12,994,750 $12,645,250 $12,278,250 $27,764,250 $37,361,250 $37,360,500 $37,359,250 $40,956,500 $40,960,250 $40,963,0001 Annual debt service is shown based on the timing required for the monthly deposits in order to accumulate the necessary amounts for the debt service payments when due.

Dallas Love Field Financial Feasibility Report
Unison Consulting, Inc. V - 10 June 8, 2015
The annual Obligation for Revenue Credit Agreement, net of PFC revenues and LOI grant payments, available for debt service is projected to equal $12.6 million in FY 2016 and $12.3 million in FY 2017 before increasing to $18.3 million in FY 2018, with the completion of the LOI grant payments. The annual Obligation for Revenue Credit Agreement, net of PFC revenues, is projected to equal $20.0 million in FY 2019 and subsequent years. Annual debt service on all bonds, net of PFCs and LOI grant payments applied to the Obligation for Revenue Credit Agreement, is projected to equal approximately $27.8 million in FY 2018, and then increase to $37.4 million in FY 2019 through FY 2021, after the ending of the LOI grant payments. Total debt service is projected to increase in FY 2022 with the revenue bonds projected to be issued to fund airfield costs anticipated in the Master Plan update. Annual debt service on all bonds, net of PFCs applied to the annual Obligation for Revenue Credit Agreement, is projected to equal approximately $41.0 million in FY 2022 through FY 2024. C. OPERATION AND MAINTENANCE (O&M) EXPENSES Table V-2 summarizes historical O&M Expenses (FY 2012 through FY 2014) and budgeted FY 2015 O&M Expenses, by expense category and by cost center. The historical O&M Expenses presented on Table V-2 are based on Aviation Department accounting reports that were prepared pursuant to the airline rate methodology contained in the Airport Use and Lease Agreement. These amounts differ from the expenses presented on the Aviation Department’s annual audited financial statements, due to differences in accounting methodology and the treatment of certain expense items, as follows: (1) the accounting reports prepared for purposes of airline rates and charges consider only the Aviation Department’s operating fund, whereas the financial statements include all Aviation Department funds; (2) the accounting reports prepared for purposes of airline rates and charges are on a cash accounting basis and do not include accrued items or non-cash items such as depreciation and amortization expense; and (3) the financial statements include non-budget expenses and reclassified journal entries. The Aviation Department O&M Expenses totaled approximately $35.7 million in FY 2011 and FY 2012. Total O&M Expenses increased to $39.6 million in FY 2013 (a 10.8 percent increase), to $42.0 million in FY 2014 (a 6.0 percent increase), and are budgeted to increase to $56.7 million in FY 2015 (a 35.0 percent increase). These increases in O&M Expenses are mostly related to the completion of the new terminal and the significant increase in passenger activity resulting from the repeal of the Wright Amendment restrictions. Twelve of the 20 gates in the new terminal became operational effective when Southwest began operating from the new terminal in April 2013 (the middle of FY 2013), and the remaining eight gates became operational in October 2014 (the beginning of FY 2015). As described in Section III, the significant increase in passenger activity is occurring in FY 2015 (the repeal of the Wright Amendment restrictions having taken effect in October 2014) – meaning that increases in O&M Expenses are continuing in FY 2015. Therefore, various categories of O&M

Dallas Love Field Financial Feasibility Report
Unison Consulting, Inc. V - 11 June 8, 2015
Expenses had significant increases in FY 2013 and FY 2014, and further increases are budgeted in FY 2015.
Table V-2 CITY OF DALLAS AIRPORT SYSTEM
HISTORICAL O&M EXPENSES For Fiscal Years Ended September 30
Budget2011 2012 2013 2014 2015
Personnel ServicesSalaries and Wages $5,582,830 $5,944,832 $6,713,699 $7,348,169 $10,022,786Fringe benefits 2,349,105 2,345,889 2,914,610 3,008,894 2,555,840Total Personnel Services $7,931,935 $8,290,721 $9,628,308 $10,357,063 $12,578,626
Utilities 2,558,907 2,460,656 2,496,056 2,603,480 3,224,909Supplies 1,371,632 1,809,452 2,320,910 2,433,242 3,412,121Contractual Services
Security Services 5,209,047 5,874,591 5,760,510 6,851,776 7,946,609Administration Overhead Distribution 50,077 61,993 5,408,492 4,946,495 5,351,780Fire Station Reimbursement 4,209,027 4,039,561 4,309,244 4,453,610 5,137,231Repair & Maintenance of Buildings 1,284,831 1,280,382 1,953,611 1,773,817 2,383,223Special Services 1,604,095 1,606,899 1,603,592 1,662,498 3,714,998Professional and Custodial Services 3,923 12,030 668,681 1,364,493 5,080,392City Forces 5,366,276 6,014,242 1,295,862 1,314,453 1,342,100Other 5,567,469 3,637,835 3,652,231 3,978,223 5,679,081Total Contractual Services $23,294,744 $22,527,533 $24,652,223 $26,345,366 $36,635,414
Equipment 579,235 617,273 467,297 217,676 844,330Total O&M Expenses $35,736,452 $35,705,635 $39,564,794 $41,956,827 $56,695,400By Cost CenterAirfield $9,989,155 $10,694,084 $11,761,672 $11,127,359 $15,230,345Terminal Building 10,995,116 12,184,157 13,367,884 13,689,975 15,570,338Parking and Ground Transportation 3,184,892 3,449,529 3,854,911 4,407,783 6,668,846Terminal Roadways 2,481,412 2,685,283 2,727,366 2,784,043 3,341,304Other Buildings & Areas 1,179,412 1,299,871 1,596,179 1,546,886 2,107,326Executive Airport 3,455,534 3,466,683 3,494,842 3,903,226 5,161,595Heliport 567,687 457,744 378,863 386,955 513,058Total Direct Cost Centers $31,853,207 $34,237,352 $37,181,715 $37,846,227 $48,592,812Administration 3,883,245 1,468,283 2,383,079 4,110,600 8,102,588Total O&M Expenses $35,736,452 $35,705,635 $39,564,794 $41,956,827 $56,695,400
Actual

Dallas Love Field Financial Feasibility Report
Unison Consulting, Inc. V - 12 June 8, 2015
The main factors underlying the recent significant increases in various categories of O&M Expenses are summarized below: Personnel Services The Personnel Services category, which consists of Salaries & Wages and Employee Benefits, accounted for 24.3 percent of total O&M Expenses in FY 2013, 24.7 percent in FY 2014, and is budgeted to total 22.2 percent of total O&M Expenses in FY 2015. This category increased 16.1 percent in FY 2013 due to increases in staffing and employee benefit costs. The increase in Salaries & Wages was due to an increase in the number of full-time equivalent (FTE) positions that were filled (200 FTEs at the end of FY 2013, compared to 181 FTEs at the end of FY 2012). The additional FTEs were maintenance positions that were filled to adequately maintain the Airport’s facilities. In addition, Employee Benefits increased due to an increase in pension costs in FY 2013. Personnel Services continued to increase in FY 2014 (a 7.6 percent increase), and the category is budgeted to increase 21.4 percent in FY 2015. The FY 2015 budget includes 15 new FTEs to increase the Aviation Department’s staffing in maintenance, IT, and customer service – to meet the additional demands resulting from the new terminal and related facilities and the increased use of the facilities after the repeal of the Wright Amendment restrictions. Contractual Services As the largest category of O&M Expenses, the Contractual Services category accounted for 62.3 percent of total O&M Expenses in FY 2013, 62.8 percent in FY 2014, and is budgeted to account for 64.6 percent of the total FY 2015 budget. This category, which includes a number of contractual expense items, increased from $24.7 million in FY 2013 to $26.3 million in FY 2014 (a 6.9 percent increase), and is budgeted to increase to $36.6 million (a 39.1 percent increase) in FY 2015. Most of the increases are related to the completion of the new terminal and the significant increase in passenger activity, particularly after the repeal of the Wright Amendment restrictions. The most significant increases in Contractual Services are the following:
� The Security Services category increased almost $1.1 million (18.9 percent) in FY 2014 and is budgeted to increase almost $1.1 million (16.0 percent) in FY 2015 due to increases in the number of Dallas Police Department officers assigned to the Airport because of the significant increase in passengers (and vehicular traffic) at the Airport. Also contributing to the increase in FY 2014 was an increase in passenger screening checkpoint supplies and materials, which were needed due to the increase in passenger activity.
� Repair and Maintenance of Building expenses increased 52.6 percent in FY 2013 (from $1.3 million in FY 2012 to almost $2.0 million in FY 2013) due to additional repairs that were necessary for the old terminal facilities and related equipment.

Dallas Love Field Financial Feasibility Report
Unison Consulting, Inc. V - 13 June 8, 2015
� Special Services expense, which includes costs incurred for major maintenance
costs, special training costs, fire alarm monitoring services, and other special contractual services, is budgeted to increase by over $2.0 million in FY 2015, mainly due to major maintenance costs for airfield fence reconstruction.
� The Professional and Custodial Services category increased from approximately $0.7 million in FY 2013 to $1.4 million in FY 2014, and is budgeted to increase significantly in FY 2015 (to $5.1 million in FY 2015), mainly due to the outsourcing of custodial services and increases in Information Technology (IT) expenses related to the IT systems in the new terminal.
� The Other Contractual Services category is budgeted to increase significantly in FY 2015 (from $4.0 million in FY 2014 to $5.7 million in FY 2015), mainly due to increases in control tower staffing and environmental assessment costs at Dallas Executive Airport; and increased employee parking shuttle expenses.
On a cost center basis, the most significant increases in O&M Expenses occurred in the Administration cost center, which increased from $2.3 million in FY 2013 to $4.1 million in 2014 and $8.1 million in FY 2015. The Administration cost center included two budget organizational units (ORGs) created in 2013 (Airport Electronic Systems and Environmental), for which expenditures were relatively minor in 2013. The expenditures for these two ORGs increased significantly in FY 2014 and FY 2015 due to increased personnel staffing and consulting services, and expenditures for information technology. In FY 2016, these ORGs were removed from the Administration cost center and are now allocated across multiple costs centers. The Airfield cost center also showed a large increase in the FY 2015 budget (from $11.1 million in FY 2014 to $15.2 million in FY 2015), due to major maintenance costs budgeted for airfield fence reconstruction, as mentioned in the discussion of Contractual Services above. The Terminal Building cost center had an increase in the FY 2015 budget, from $13.7 million in FY 2014 to $15.6 million in FY 2015, mainly due to staffing increases explained above in the discussion of Personnel Services, and expenses related to Security Services and new IT systems in the terminal, as mentioned in the discussion of Contractual Services above. The FY 2015 budget for the Parking and Ground Transportation cost center ($6.7 million) is almost $2.3 million higher than the 2014 total ($4.4 million), mainly due to additional costs for an employee shuttle operation and contractual services for a taxi starter contract and parking revenue control system maintenance. FY 2016 Budget The Aviation Department’s FY 2016 operating budget reflects increases in O&M Expenses to account for anticipated increases in the following categories:
� Additional major maintenance costs for airfield fence reconstruction and pavement maintenance;

Dallas Love Field Financial Feasibility Report
Unison Consulting, Inc. V - 14 June 8, 2015
� Additional equipment purchases related to the fire prevention and security systems in the terminal;
� Additional costs related to increased security measures, including additional staffing from the Dallas Police Department to provide enhanced checkpoint security, perimeter patrols, traffic management, vehicle inspections, and other security measures;
� Anticipated increases in electricity costs for facilities throughout the Airport; and
� Increases in various costs related to Executive Airport due to increased staffing and additional equipment purchases.
Projections of O&M Expenses The projections of O&M Expenses are based on the Aviation Department’s FY 2016 operating budget, and consider (1) historical trends in various expense categories; (2) the estimated effects of future inflation; and (3) estimates for the effect of certain capital projects planned to be completed during the forecast period, including Garage C. Total O&M Expenses are forecast to increase from $66.7 million in FY 2016 to $89.3 million in FY 2024. O&M Expenses are classified by cost center for purposes of the airline rates and charges calculations. Table V-3 shows the projections of O&M expenses by cost center. D. REVENUES Airport System Revenues consist of revenues generated at Dallas Love Field and Dallas Executive Airport.2 With the opening of the new terminal in April 2013, airline revenues changed significantly due to the provisions of the Airport Use and Lease Agreement. At the beginning of the term of the Airport Use and Lease Agreement, the airlines were obligated to pay fixed, negotiated terminal building rental rates and landing fee rates for their use of the then-existing facilities prior to the completion of the first major phase of the LFMP. The new airline rate methodology specified in the Airport Use and Lease Agreement became effective as the date of beneficial occupancy of the initial phase – completion of the first 12 gates of the new concourse – which occurred in April 2013. Historical Revenues are summarized on Table V-4, and projected Revenues are presented on Table V-5. The historical Revenues presented on Table V-4 are based on Aviation Department accounting reports that were prepared pursuant to the airline rate methodology contained in the Airport Use and Lease Agreement. These amounts differ from the revenues presented on the Aviation Department’s annual audited financial statements, due to PFCs and AIP grant receipts that are not included in Revenues for purposes of airline rates and charges.
������������������������������������������������������������2 Although the Heliport is also part of the Airport System, it does not generate revenues.

Dallas Love Field Financial Feasibility Report
Unison Consulting, Inc. V - 15 June 8, 2015
Table V-3 CITY OF DALLAS AIRPORT SYSTEM
PROJECTED O&M EXPENSES For Fiscal Years Ending September 30
2016 2017 2018 2019 2020 2021 2022 2023 2024
Direct Cost CentersAirfield $18,445,000 $19,046,000 $19,669,000 $20,316,000 $20,998,000 $21,707,000 $22,444,000 $23,211,000 $24,008,000Terminal Building 21,468,000 22,200,000 22,963,000 23,755,000 24,619,000 25,517,000 26,452,000 27,429,000 28,447,000Parking and Ground Transportation 8,176,000 8,490,000 9,118,000 9,761,000 10,165,000 10,587,000 11,029,000 11,492,000 11,975,000Terminal Roadways 4,203,000 4,315,000 4,432,000 4,552,000 4,677,000 4,806,000 4,939,000 5,077,000 5,218,000Other Buildings & Areas 2,947,000 3,053,000 3,164,000 3,279,000 3,400,000 3,526,000 3,658,000 3,796,000 3,939,000Executive Airport 6,604,000 6,832,000 7,068,000 7,315,000 7,578,000 7,853,000 8,141,000 8,441,000 8,753,000Heliport 1,078,000 1,120,000 1,163,000 1,209,000 1,258,000 1,309,000 1,362,000 1,418,000 1,477,000Subtotal $62,921,000 $65,056,000 $67,577,000 $70,187,000 $72,695,000 $75,305,000 $78,025,000 $80,864,000 $83,817,000Administration 3,809,000 3,983,000 4,167,000 4,359,000 4,566,000 4,782,000 5,009,000 5,246,000 5,496,000
Total O&M Expenses $66,730,000 $69,039,000 $71,744,000 $74,546,000 $77,261,000 $80,087,000 $83,034,000 $86,110,000 $89,313,000
Allocation of AdministrationAirfield $1,058,000 $1,107,000 $1,118,000 $1,143,000 $1,217,000 $1,274,000 $1,386,000 $1,459,000 $1,532,000Terminal Building 1,032,000 1,076,000 1,308,000 1,461,000 1,524,000 1,603,000 1,660,000 1,743,000 1,830,000 Parking and Ground Transportation 1,077,000 1,130,000 1,072,000 1,074,000 1,117,000 1,167,000 1,199,000 1,247,000 1,304,000 Terminal Roadways 127,000 132,000 137,000 141,000 147,000 153,000 159,000 165,000 171,000 Other Buildings & Areas 268,000 279,000 264,000 261,000 270,000 280,000 286,000 297,000 308,000 Executive Airport 213,000 225,000 232,000 241,000 252,000 264,000 276,000 289,000 303,000 Heliport 34,000 34,000 36,000 38,000 39,000 41,000 43,000 46,000 48,000
$3,809,000 $3,983,000 $4,167,000 $4,359,000 $4,566,000 $4,782,000 $5,009,000 $5,246,000 $5,496,000Total by Cost Center
Airfield $19,503,000 $20,153,000 $20,787,000 $21,459,000 $22,215,000 $22,981,000 $23,830,000 $24,670,000 $25,540,000Terminal Building 22,500,000 23,276,000 24,271,000 25,216,000 26,143,000 27,120,000 28,112,000 29,172,000 30,277,000 Parking and Ground Transportation 9,253,000 9,620,000 10,190,000 10,835,000 11,282,000 11,754,000 12,228,000 12,739,000 13,279,000 Terminal Roadways 4,330,000 4,447,000 4,569,000 4,693,000 4,824,000 4,959,000 5,098,000 5,242,000 5,389,000 Other Buildings & Areas 3,215,000 3,332,000 3,428,000 3,540,000 3,670,000 3,806,000 3,944,000 4,093,000 4,247,000 Executive Airport 6,817,000 7,057,000 7,300,000 7,556,000 7,830,000 8,117,000 8,417,000 8,730,000 9,056,000 Heliport 1,112,000 1,154,000 1,199,000 1,247,000 1,297,000 1,350,000 1,405,000 1,464,000 1,525,000
Total O&M Expenses $66,730,000 $69,039,000 $71,744,000 $74,546,000 $77,261,000 $80,087,000 $83,034,000 $86,110,000 $89,313,000

Dallas Love Field Financial Feasibility Report
Unison Consulting, Inc. V - 16 June 8, 2015
Table V-4 DALLAS AIRPORT SYSTEM
HISTORICAL REVENUES For Fiscal Years Ended September 30
Actual Budgeted2011 2012 2013 2014 2015
AIRLINE REVENUESLanding Fees (Signatory) $8,262,704 7,790,209.98 $9,018,107 $12,582,194 $17,429,914Terminal Rentals 2,201,835 2,014,206 3,044,645 6,853,024 9,878,022Apron rentals 404,449 429,889 1,112,635 3,581,536 3,874,791Total Airline Revenues $10,868,988 $10,234,305 $13,175,386 $23,016,754 $31,182,727
NON-AIRLINE REVENUESGround Transportation
Parking 15,167,904 15,567,340 15,765,305 17,526,654 20,108,000Rental Cars and Ground Transportation 6,710,656 7,230,258 7,518,185 8,026,642 8,714,000Total Ground Transportation $21,878,560 $22,797,598 $23,283,490 $25,553,296 $28,822,000
Terminal BuildingConcessions
Food and Beverage 2,553,947 2,190,198 2,805,686 3,683,154 5,496,000Retail 1,211,256 1,303,695 1,557,679 1,802,305 2,792,000Advertising 1,585,688 1,316,500 1,256,201 827,174 1,487,000Other 199,301 156,698 406,868 180,613 232,000
Total Concessions 5,550,192 4,967,092 6,026,434 6,493,246 10,007,000Non-airline Rentals and Other 1,394,366 1,701,415 1,440,209 2,312,038 1,720,000Total Terminal Building $6,944,558 $6,668,507 $7,466,643 $8,805,284 $11,727,000
Airfield and Apron Area 1,264,541 1,136,306 1,238,926 1,322,558 1,327,072Other Buildings and Areas; Interest 6,224,418 7,671,935 9,617,017 8,663,588 8,851,000Total Love Field $47,181,065 $48,508,651 $54,781,462 $67,361,480 $81,909,799
Executive Airport 730,337 744,943 739,885 744,990 727,000Total Revenues $47,911,402 $49,253,594 $55,521,347 $68,106,470 $82,636,799

Dallas Love Field Financial Feasibility Report
Unison Consulting, Inc. V - 17 June 8, 2015
Table V-5 CITY OF DALLAS AIRPORT SYSTEM
PROJECTED REVENUES For Fiscal Years Ending September 30
2016 2017 2018 2019 2020 2021 2022 2023 2024
AIRLINE REVENUESLanding Fees (Signatory) $19,426,000 $19,803,000 $21,175,000 $22,087,000 $24,103,000 $24,771,000 $29,010,000 $30,431,000 $31,349,000Terminal Rentals 4,010,500 3,774,250 16,815,000 24,947,500 25,612,750 26,558,000 27,217,250 28,400,250 29,221,000Apron rentals 4,008,000 4,013,000 5,046,000 5,379,000 5,454,000 5,531,000 5,616,000 5,700,000 5,787,000Total Airline Revenues $27,444,500 $27,590,250 $43,036,000 $52,413,500 $55,169,750 $56,860,000 $61,843,250 $64,531,250 $66,357,000
NON-AIRLINE REVENUESGround Transportation
Parking 27,536,000 28,018,000 28,591,000 29,123,000 29,710,000 30,179,000 30,649,000 31,122,000 31,596,000Rental Cars and Ground Trans. 13,490,000 13,776,000 14,066,000 14,356,000 14,649,000 14,938,000 15,229,000 15,525,000 15,825,000Total Ground Transportation $41,026,000 $41,794,000 $42,657,000 $43,479,000 $44,359,000 $45,117,000 $45,878,000 $46,647,000 $47,421,000
Terminal BuildingConcessions
Food and Beverage 6,847,000 6,994,000 7,142,000 7,291,000 7,441,000 7,588,000 7,737,000 7,889,000 8,042,000Retail 4,050,000 4,136,000 4,224,000 4,312,000 4,401,000 4,488,000 4,576,000 4,666,000 4,757,000Advertising 1,487,000 1,524,000 1,562,000 1,601,000 1,641,000 1,682,000 1,724,000 1,767,000 1,811,000Other 414,000 427,000 440,000 454,000 468,000 482,000 496,000 511,000 526,000
Total Concessions 12,798,000 13,081,000 13,368,000 13,658,000 13,951,000 14,240,000 14,533,000 14,833,000 15,136,000Non-airline Rentals and Other 2,115,000 2,139,000 2,162,000 2,186,000 2,210,000 2,235,000 2,260,000 2,286,000 2,313,000Total Terminal Building $14,913,000 $15,220,000 $15,530,000 $15,844,000 $16,161,000 $16,475,000 $16,793,000 $17,119,000 $17,449,000
Airfield and Apron Area 1,327,000 1,354,000 1,389,000 1,420,000 1,461,000 1,492,000 1,549,000 1,586,000 1,620,000Other Buildings and Areas; Interest 8,851,000 9,038,000 9,212,000 9,391,000 9,571,000 9,756,000 9,945,000 10,138,000 10,333,000Total Love Field $93,561,500 $94,996,250 $111,824,000 $122,547,500 $126,721,750 $129,700,000 $136,008,250 $140,021,250 $143,180,000
Executive Airport 670,000 749,000 758,000 761,000 791,000 799,000 808,000 818,000 826,000Total Revenues $94,231,500 $95,745,250 $112,582,000 $123,308,500 $127,512,750 $130,499,000 $136,816,250 $140,839,250 $144,006,000

Dallas Love Field Financial Feasibility Report
Unison Consulting, Inc V - 18 June 8, 2015
The major sources of Revenues, recent historical trends in Revenues, and the basis for the projections of Revenues, are discussed below. 1. Airline Revenues Charges for the airline cost centers are calculated based on the rate methodology specified in the Airport Use and Lease Agreement, as described earlier in this Section. Airline revenues increased significantly from FY 2012 through FY 2014 (from approximately $10.2 million in FY 2012 to $13.2 million in FY 2013 and $23.0 million in FY 2014) due to the new terminal and the calculation of airline rates and charges under the new airline rate methodology. The new terminal became operational in April 2013 (the middle of FY 2013), which caused an increase in airline rates and charges. Further increases occurred in FY 2014 because it was the first full fiscal year of the operation of the terminal. Airline revenues are estimated to increase to approximately $31.2 million in FY 2015, based on the Aviation Department’s FY 2015 budget. The higher airline revenues reflect increases in the airline rates and charges that are primarily due to the increases in various categories of O&M Expenses in the FY 2015 budget, as discussed previously in this Section. Airline revenues are projected to decrease to $27.4 million in FY 2016 and $27.6 million in FY 2017, due to a projected decrease in the Terminal Building airline requirement, as discussed below. Total airline revenues are projected to increase to $43.0 million in FY 2018, and increase thereafter to $66.3 million in FY 2024. The factors underlying these projected amounts for airline revenues reflect the projected calculations of airline rates and charges, as discussed in the following paragraphs. The costs allocable to the Terminal Building, Apron, and Airfield cost centers are:
� Direct and indirect O&M Expenses � Debt service on the Bonds and any general airport revenue bonds the City or the
LFAMC may issue in the future � Amortization of the net cost of each capital project placed in service in the
Terminal Building on or after October 1, 2008 � Additional deposits to, or replenishment of, certain reserve funds
Certain credits are deducted from the costs for each of the airline cost centers, as described earlier in this Section. The projected airline revenues and rates, based on the airline rate methodology, are summarized on Table V-6. Incorporated into the calculations are the projected revenues and expenses of the ancillary cost centers, as presented on Table V-7. The net deficit in the Terminal Roadways cost center is allocated equally to the Parking and Ground Transportation cost center (50 percent) and the Terminal Building cost center (50 percent). The net revenue of the Parking and Ground Transportation cost center is allocated as follows: 75 percent to the Terminal Building cost center and 25 percent retained by the City.

Dallas Love Field Financial Feasibility Report
Unison Consulting, Inc. V - 19 June 8, 2015
Table V-6 (Page 1 of 2) CITY OF DALLAS AIRPORT SYSTEM
PROJECTED AIRLINE RATES AND CHARGES For Fiscal Years Ending September 30
Budgeted Projected2015 2016 2017 2018 2019 2020 2021 2022 2023 2024
TERMINAL BUILDING REQUIREMENTO&M Expenses $17,525,000 $22,502,000 $23,276,000 $24,271,000 $25,216,000 $26,142,000 $27,118,000 $28,109,000 $29,168,000 $30,272,000Deposit to O&M Reserve Fund 436,000 681,000 156,000 212,000 235,000 226,000 237,000 244,000 255,000 266,000 Obligations for Revenue Credit Agreement 10,107,522 9,836,000 9,550,000 14,256,000 15,547,000 15,547,000 15,545,000 15,546,000 15,544,000 15,547,000 Amortization of DAL-Funded Assets 848,000 848,000 848,000 848,000 848,000 848,000 848,000 848,000 848,000 848,000 Share of Terminal Roadways deficit 2,232,000 2,688,000 2,933,000 3,186,000 3,289,000 3,298,000 3,543,000 3,612,000 3,936,000 4,010,000 Subtotal - Airline Requirement $31,148,522 $36,555,000 $36,763,000 $42,773,000 $45,135,000 $46,061,000 $47,291,000 $48,359,000 $49,751,000 $50,943,000
Less Credits:Pre-LFMP airline space rentals $0 $0 $0 $0 $0 $0 $0 $0 $0 $0Concession revenues $7,070,500 $9,598,500 $9,810,750 $10,026,000 $10,243,500 $10,463,250 $10,680,000 $10,899,750 $11,124,750 $11,352,000Other Terminal Building nonairline revenues 1,720,000 2,115,000 2,139,000 2,162,000 2,186,000 2,210,000 2,235,000 2,260,000 2,286,000 2,313,000 Interest income allocable to the Terminal 19,000 26,000 31,000 37,000 40,000 40,000 41,000 41,000 41,000 42,000
$8,809,500 $11,739,500 $11,980,750 $12,225,000 $12,469,500 $12,713,250 $12,956,000 $13,200,750 $13,451,750 $13,707,000
Revenue Sharing -- Parking & Ground Trans. 12,461,000 20,805,000 21,008,000 13,732,000 7,717,000 7,735,000 7,776,000 7,940,000 7,899,000 8,015,000 Credit for Tenant Revenue ServicesTotal Credits $21,270,500 $32,544,500 $32,988,750 $25,957,000 $20,186,500 $20,448,250 $20,732,000 $21,140,750 $21,350,750 $21,722,000
Net requirement $9,878,022 $4,010,500 $3,774,250 $16,816,000 $24,948,500 $25,612,750 $26,559,000 $27,218,250 $28,400,250 $29,221,000Divided by Airline Rented Space (sq. ft.) 211,847 211,847 211,847 211,847 211,847 211,847 211,847 211,847 211,847 211,847
Terminal Building Rental Rate (per sq. ft.) $46.63 $18.93 $17.82 $79.38 $117.77 $120.90 $125.37 $128.48 $134.06 $137.93

Dallas Love Field Financial Feasibility Report
Unison Consulting, Inc. V - 20 June 8, 2015
Table V-6 (Page 2 of 2) CITY OF DALLAS AIRPORT SYSTEM
PROJECTED AIRLINE RATES AND CHARGES For Fiscal Years Ending September 30
Budgeted Projected2015 2016 2017 2018 2019 2020 2021 2022 2023 2024
APRON AREA REQUIREMENTO&M Expenses (10% of Airfield) $1,777,000 $1,951,000 $2,015,000 $2,079,000 $2,146,000 $2,221,000 $2,298,000 $2,383,000 $2,467,000 $2,554,000Obligations for Revenue Credit Agreement 2,081,791 2,026,000 1,967,000 2,936,000 3,202,000 3,202,000 3,202,000 3,202,000 3,202,000 3,202,000 Amortization of DAL-Funded Assets 46,000 46,000 46,000 46,000 46,000 46,000 46,000 46,000 46,000 46,000 Subtotal - Airline Requirement $3,904,791 $4,023,000 $4,028,000 $5,061,000 $5,394,000 $5,469,000 $5,546,000 $5,631,000 $5,715,000 $5,802,000Less RON aircraft parking charges 15,000 15,000 15,000 15,000 15,000 15,000 15,000 15,000 15,000 15,000Net requirement 3,889,791$ 4,008,000$ 4,013,000$ 5,046,000$ 5,379,000$ 5,454,000$ 5,531,000$ 5,616,000$ 5,700,000$ 5,787,000$ Divided by Number of Gates 20 20 20 20 20 20 20 20 20 20 Apron Fee Rate (per gate) $194,490 $200,400 $200,650 $252,300 $268,950 $272,700 $276,550 $280,800 $285,000 $289,350
AIRFIELD REQUIREMENTO&M Expenses $17,765,000 $19,505,000 $20,154,000 $20,787,000 $21,458,000 $22,214,000 $22,980,000 $23,828,000 $24,667,000 $25,536,000less: O&M Expenses allocated to the Apron (10%) (1,777,000) (1,951,000) (2,015,000) (2,079,000) (2,146,000) (2,221,000) (2,298,000) (2,383,000) (2,467,000) (2,554,000) Deposit to O&M Reserve Fund 564,995 697,000 160,000 181,000 183,000 180,000 188,000 204,000 214,000 222,000
139,991 136,000 132,000 197,000 215,000 215,000 215,000 3,815,000 3,815,000 3,815,000 Amortization of DAL-Funded Assets 2,073,000 2,378,000 2,743,000 3,493,000 3,813,000 5,193,000 5,195,000 5,114,000 5,807,000 5,970,000 Subtotal - Airline Requirement $18,765,986 $20,765,000 $21,174,000 $22,579,000 $23,523,000 $25,581,000 $26,280,000 $30,578,000 $32,036,000 $32,989,000Less Credits:
Nonairline revenues $1,312,072 $1,312,000 $1,339,000 $1,374,000 $1,405,000 $1,446,000 $1,477,000 $1,534,000 $1,571,000 $1,605,000Interest income allocable to the Airfield 24,000 27,000 32,000 31,000 31,000 32,000 32,000 34,000 35,000 35,000 Total Credits $1,336,072 $1,339,000 $1,371,000 $1,405,000 $1,436,000 $1,478,000 $1,509,000 $1,568,000 $1,606,000 $1,640,000
Net requirement $17,429,914 $19,426,000 $19,803,000 $21,174,000 $22,087,000 $24,103,000 $24,771,000 $29,010,000 $30,430,000 $31,349,000Divided by Landed weight (in 1,000 pound units) 6,919,000 7,714,000 7,764,000 7,814,000 7,868,000 7,908,000 7,948,000 7,982,000 8,017,000 8,051,000 Landing Fee Rate (per 1,000 pound unit) $2.52 $2.52 $2.55 $2.71 $2.81 $3.05 $3.12 $3.63 $3.80 $3.89
Obligations for Revenue Credit Agreement and Debt Service on future GARBs

Dallas Love Field Financial Feasibility Report
Unison Consulting, Inc. V - 21 June 8, 2015
Table V-7 CITY OF DALLAS AIRPORT SYSTEM
PROJECTED NET REVENUES OR DEFICIT IN ANCILLARY COST CENTERS
For Fiscal Years Ending September 30 Budgeted Projected
2015 2016 2017 2018 2019 2020 2021 2022 2023 2024
TERMINAL ROADWAYSO&M Expenses $3,620,000 $4,330,000 $4,447,000 $4,569,000 $4,693,000 $4,824,000 $4,959,000 $5,098,000 $5,242,000 $5,389,000Deposit to O&M Reserve Fund 62,000 84,000 19,000 22,000 23,000 22,000 23,000 23,000 24,000 25,000 Obligations for Revenue Credit Agreement 631,524 615,000 597,000 891,000 971,000 971,000 971,000 971,000 971,000 971,000 Amortization of DAL-Funded Assets 154,000 349,000 807,000 894,000 894,000 783,000 1,136,000 1,136,000 1,638,000 1,638,000 Total Costs $4,467,524 $5,378,000 $5,870,000 $6,376,000 $6,581,000 $6,600,000 $7,089,000 $7,228,000 $7,875,000 $8,023,000Less: Allocated Interest Income 3,000 3,000 4,000 4,000 4,000 4,000 4,000 4,000 4,000 4,000 Net Deficit $4,464,524 $5,375,000 $5,866,000 $6,372,000 $6,577,000 $6,596,000 $7,085,000 $7,224,000 $7,871,000 $8,019,000
Allocation of Terminal Roadways net deficitTerminal Building $2,232,000 $2,688,000 $2,933,000 $3,186,000 $3,289,000 $3,298,000 $3,543,000 $3,612,000 $3,936,000 $4,010,000Parking & Ground Transportation 2,232,000 2,688,000 2,933,000 3,186,000 3,289,000 3,298,000 3,543,000 3,612,000 3,936,000 4,010,000
Net Deficit $4,464,000 $5,376,000 $5,866,000 $6,372,000 $6,578,000 $6,596,000 $7,086,000 $7,224,000 $7,872,000 $8,020,000PARKING & GROUND TRANSPORTATIONRevenues plus allocated Interest Income $28,843,000 $41,053,000 $41,827,000 $42,687,000 $43,508,000 $44,388,000 $45,146,000 $45,907,000 $46,677,000 $47,451,000Less:
O&M Expenses $8,837,000 $9,255,000 $9,622,000 $10,191,000 $10,834,000 $11,280,000 $11,752,000 $12,225,000 $12,735,000 $13,274,000Deposit to O&M Reserve Fund 484,000 711,000 164,000 174,000 173,000 166,000 172,000 176,000 182,000 189,000 Obligation for Revenue Credit Agreement and Debt Service on GARBs 632,000 615,000 597,000 10,327,000 18,345,000 18,344,000 18,345,000 18,341,000 18,347,000 18,346,000 Amortization Charges 44,000 44,000 500,000 500,000 578,000 987,000 966,000 966,000 945,000 945,000 50% of Terminal Roadways Net Deficit 2,232,000 2,688,000 2,933,000 3,186,000 3,289,000 3,298,000 3,543,000 3,612,000 3,936,000 4,010,000 Total Deductions $12,229,000 $13,313,000 $13,816,000 $24,378,000 $33,219,000 $34,075,000 $34,778,000 $35,320,000 $36,145,000 $36,764,000
Net Revenue $16,614,000 $27,740,000 $28,011,000 $18,309,000 $10,289,000 $10,313,000 $10,368,000 $10,587,000 $10,532,000 $10,687,000
Terminal Building share @ 75% $12,461,000 $20,805,000 $21,008,000 $13,732,000 $7,717,000 $7,735,000 $7,776,000 $7,940,000 $7,899,000 $8,015,000City share @ 25% 4,154,000 6,935,000 7,003,000 4,577,000 2,572,000 2,578,000 2,592,000 2,647,000 2,633,000 2,672,000Net Revenue $16,615,000 $27,740,000 $28,011,000 $18,309,000 $10,289,000 $10,313,000 $10,368,000 $10,587,000 $10,532,000 $10,687,000
OTHER BUILDINGS & AREASRevenues plus allocated Interesst Income $8,620,000 $8,598,000 $8,769,000 $8,941,000 $9,118,000 $9,297,000 $9,481,000 $9,668,000 $9,859,000 $10,053,000Less:
O&M Expenses $2,764,000 $3,210,000 $3,329,000 $3,427,000 $3,542,000 $3,673,000 $3,812,000 $3,953,000 $4,103,000 $4,260,000Deposit to O&M Reserve Fund 147,000 173,000 40,000 43,000 42,000 41,000 42,000 43,000 45,000 47,000 Obligations for Revenue Credit Agreement 34,000 33,000 32,000 48,000 52,000 52,000 52,000 52,000 52,000 52,000 Amortization of DAL-Funded Assets 225,000 225,000 225,000 225,000 225,000 225,000 225,000 225,000 175,000 175,000
Total Deductions $3,170,000 $3,641,000 $3,626,000 $3,743,000 $3,861,000 $3,991,000 $4,131,000 $4,273,000 $4,375,000 $4,534,000
Net Revenue $5,450,000 $4,957,000 $5,143,000 $5,198,000 $5,257,000 $5,306,000 $5,350,000 $5,395,000 $5,484,000 $5,519,000

Dallas Love Field Financial Feasibility Report
Unison Consulting, Inc. V - 22 June 8, 2015
The Terminal Building rental rate is projected to decrease significantly in FY 2016, from approximately $47 in FY 2015 to less than $19 in FY 2016 and less than $18 in FY 2017. The projected decrease in the rental rate is mainly due to the following factors:
� The higher Parking concession revenue beginning in FY 2015, based on the projections presented in Section IV and also discussed in the next sub-section;
� The capitalized interest period on the Series 2015 Bonds and the Series 2016 Bonds, which will extend through mid-FY 2018; and
� The ending of the LOI grant receipts, which are currently used to offset the
amount of the Obligation for Revenue Credit Agreement (the majority of which are allocated to the Terminal Building cost center) to be paid by Southwest.
The first two factors listed above are projected to result in a significant increase in net revenue of the Parking and Ground Transportation cost center in FY 2016 and FY 2017, seventy-five percent of which is credited to the Terminal Building rental rate calculation. This period will coincide with the last fiscal years in which LOI grant receipts are scheduled to be applied to offset the debt service costs included in the calculation of costs for the Terminal Building rental rate. The combined effect of these factors is projected to result in a significant decrease in the Terminal Building rental rate in FY 2016 and FY 2017, followed by a significant increase in the rental rate in FY 2018 and FY 2019. The terminal rental rate is projected to increase to almost $118 in FY 2018 and $120 in FY 2019. The terminal rental rate is projected to continue to increase in FY 2020 through 2024, to approximately $138 in FY 2024, due to projected increases in O&M Expenses allocated to the Terminal Building cost center. The Apron fee rate and the landing fee rate are projected to increase in FY 2018 and FY 2019, mainly due to the increase in debt service requirements allocated to the Apron and the Airfield cost centers in those years. Those projected increases in debt service are mainly due to the lower LOI grant payments scheduled to be received in FY 2018 and the end of the LOI grant payments effective in FY 2019. The Apron fee rate is projected to increase from approximately $200,000 in FY 2017 to $252,000 in FY 2018 and $269,000 in FY 2019. The Apron fee is then projected to increase modestly each year after FY 2019, based on continue increases in projected O&M Expenses, and is projected to equal approximately $289,000 in FY 2024. The landing fee rate is projected to increase from $2.55 in FY 2017 to $2.71 in FY 2018 and $2.81 in FY 2019, mainly due to the lower LOI grant payments scheduled to be received in FY 2018 and the end of the LOI grant payments effective in FY 2019. The landing fee rate is projected to increase to $3.63 in FY 2022 due to the projected new debt service associated with the revenue bonds contemplated in the funding plan for the Master Plan. The landing fee rate is then projected to increase in FY 2023 and FY 2024, to $3.89 in FY 2024, due to continued increases in projected O&M Expenses.

Dallas Love Field Financial Feasibility Report
Unison Consulting, Inc. V - 23 June 8, 2015
2. Ground Transportation Revenues Parking Concession Revenue Public automobile parking is the largest single source of non-airline revenue for the Airport. The City has a parking services concession contract (Parking Contract) with APA Parking Associates, L.P. (APA). The original term of the Parking Contract commenced on September 1, 2004 and ended on August 31, 2009. By amendment approved by the City Council on June 10, 2009, the term was extended to August 31, 2014. On May 23, 2012, the City extended the term of the Parking Contract to August 31, 2017. Pursuant to the provisions of the Parking Contract, APA has agreed to “provide all labor, materials and equipment necessary to perform the services required to operate the Parking Facilities.” The Parking Contract defined “Parking Facilities” as “all of the parking facilities at the Airport that Contractor is authorized under this Contract to operate, including, but not necessarily limited to, Garage A and Garage B.” The Parking Contract also set an annual concession fee to be paid by APA to the City, in the amount of 90.25 percent of Net Revenues or the Minimum Annual Guarantee (MAG), whichever is greater. The term “Gross Revenues” as defined in the Parking Contract means all moneys (both cash and credit) collected by APA through its operation of the parking concession at the Airport. The term “Net Revenues” as defined in the Parking Contract means gross revenues minus: any federal, state or municipal taxes, which are collected by APA from the parking customers and payable to a taxing authority; and credit card fees, AVI fees, and other applicable transaction fees. In addition to extending the term, the extension of the Parking Contract that was approved in 2012 also (1) added valet parking services to the “Description of Services” section of the Parking Contract; and (2) increased the annual concession fee paid by APA to the City from 90.25 percent to 91.25 percent of Net Parking Revenues or the MAG, whichever is greater. Parking concession revenue increased from $15.2 million in FY 2011 to $15.8 million in FY 2013, due to the factors discussed in Section IV. Parking concession revenue increased to $17.5 million in FY 2014 and is budgeted to increase to $20.1 million in FY 2015, due to the increased passenger traffic resulting from the opening of the new terminal and ending of the Wright Amendment restrictions, as well as the parking rate increases that have been implemented. Gross Revenues projected to be generated from parking operations at the Airport during the forecast period were presented in the detailed analysis contained in Section IV. The analysis in this section reflects parking concession revenues based on the provisions of the Parking Contract. Parking concession revenue is projected to increase from approximately $27.5 million in FY 2015 to $31.6 million in FY 2024. Rental Car Concession Revenue The following nine rental car brands serve the DAL market: ACE, Alamo, Avis, Budget, Dollar, Enterprise, Hertz, National, and Thrifty. The rental car companies pay to the City
Dallas Love Field Financial Feasibility Report
Unison Consulting, Inc. V - 24 June 8, 2015
a concession fee of 10% of their reported gross revenues for their operations at the Airport.
The rental car companies reported total gross revenue of $73.6 million for FY 2013 and $77.0 million in FY 2014, which equated to slightly more than $17.50 per enplanement in each of those fiscal years. Rental car gross revenues reported for the first six months of FY 2015 totaled approximately $45.9 million, which represents an average of $21.78 per enplanement. Due to the significant increase in enplanements estimated for FY 2015 and the year-to-date increase in average rental car gross revenues per enplanement (conservatively estimated at $19.00 per enplanement for the entire fiscal year), rental car gross revenues are estimated to increase to approximately $118.6 million in FY 2015. For FY 2016 and subsequent years, rental car gross revenues are projected to increase in accordance with forecast increases in passenger activity, as presented in Section III, and general price inflation. The Aviation Department also receives Ground Transportation fees from ground transportation providers such as hotel courtesy vehicles, taxicabs, and other commercial ground transportation providers (including bus and limousine companies) for their use of the Airport roadways. A City ordinance dated December 1, 2006 requires all ground transportation vehicles operating at the Airport to use an automatic vehicle identification (AVI) tag. Fees paid by ground transportation providers consist of: an annual registration fee; an annual decal fee; and per-trip fees. Total rental car concession revenue and Ground Transportation fees are projected to increase to approximately $13.5 million in FY 2016 and to $15.8 million in FY 2024. 3. Terminal Building Revenues Terminal Concessions Terminal concessions consist of food and beverage, retail (news/gifts and specialty shops), advertising, and other miscellaneous concessions.
The City has entered into food and beverage concession agreements with several concessionaires, for the operation of food and beverage concessions in the terminal. Under the terms of the agreements, the concessionaires pay to the City concession fees ranging between 11% and 20% of the concessionaires’ gross sales, depending on the category of food and beverages, subject to minimum annual guarantees that apply to the various concession locations. The minimum annual guarantees for all the food and beverage concessionaires total approximately $5.1 million for FY 2015. The City has entered into retail concession agreements with several operators, for the operation of gift/news and other retail concessions in the terminal. The retail concessionaires pay to the City concession fees ranging between 11% and 20% of the concessionaires’ gross sales, depending on the category of merchandise sold, subject to minimum annual guarantees that apply to the various retail concession locations.

Dallas Love Field Financial Feasibility Report
Unison Consulting, Inc. V - 25 June 8, 2015
The minimum annual guarantees for all the retail concessionaires total approximately $3.5 million for FY 2015. Advertising display services in various locations at the Airport and at Executive Airport are provided through an advertising concession contract between the City and Corey S/W Joint Venture d/b/a Corey Airport Services. Advertising display areas include locations on interior and exterior spaces at the Airport’s terminal and the terminal at Executive Airport; locations at the DAL parking facilities; locations on the roadways at adjacent medians at the DAL and at Executive Airport; and locations at the Heliport. The concessionaire pays to the City the greater of percentage fees or a minimum annual guarantee that increases each year of the contract. The percentage fees range from 58.1 percent to 73.0 percent of the concessionaire’s gross revenues, depending on the type of advertising, the location of the advertising, and the contract year. Advertising concession revenues are projected to increase with general inflation trends and increases in the percentage fee rates scheduled in the concession contract. Other terminal concessions include baggage cart rentals, automated teller machines, shoeshine, and other miscellaneous concessionaires. With the opening of the new terminal, the amount of space dedicated to food and beverage and retail concessions increased significantly, compared to the space that had been available in the old terminal. Additionally, the design of the new terminal, with all gates in a single concourse, allows for better exposure to passenger flows and more efficient utilization of concession space. All passengers flow through a central “concession village” area, with additional concession units clustered outside of the “village.” The new terminal also provides a greater variety of concession offerings than had been available in the old terminal. The increased amount of concession space in the new terminal, the improved layout of the concession space, the greater variety of concession offerings, and the significant increase in passenger traffic since the opening of the new terminal have all contributed to significant increases in gross sales reported by the terminal concessionaires, which has translated into significant increases in terminal concession revenue received by the Aviation Department. Total terminal concession revenue increased from approximately $6.0 million in FY 2013 to $6.5 million in FY 2014, and is estimated to increase to $10.0 million in FY 2015. The projection of terminal concession revenue is based on estimated FY 2015 gross sales per enplanement applied to forecast enplanements and multiplied by the appropriate percentage fees. Total terminal concession revenue is projected to increase from approximately $12.8 million in FY 2016 to $15.1 million in FY 2024. Non-airline Terminal Rentals and Other Charges Office and storage space in the existing terminal building complex is leased to various non-airline tenants, including the rental car companies, the FAA, the Transportation Security Administration (TSA), cell phone providers, and others. This revenue category also includes electricity reimbursements from various tenants in the terminal building,
Dallas Love Field Financial Feasibility Report
Unison Consulting, Inc. V - 26 June 8, 2015
and security charges paid by terminal building tenants. Non-airline terminal rentals revenue is budgeted to total approximately $2.1 million in FY 2016. This revenue category is projected to increase with inflation and as rate adjustment provisions take effect, to approximately $2.3 million in FY 2024. 4. Airfield and Apron Revenues Airfield and Apron fees consist mainly of fuel flowage fees and unscheduled landing fees and remain overnight (RON) aircraft parking charges. General aviation users of the airfield pay a fuel flowage fee of $0.07 per gallon of fuel. Fuel flowage fees are not assessed on fuel sold to operators of aircraft on which a landing fee is assessed. Revenues from these sources are budgeted to total approximately $1.3 million in FY 2015. It is assumed that fuel volumes will adjust with general aviation operations and that the $0.07 per-gallon fuel flowage fee will remain in place during the forecast period. Airfield and Apron fees are projected to increase from approximately $1.3 million in FY 2016 to $1.6 million in FY 2024. 5. Other Buildings and Areas; Other Revenues The Airport generates rentals from leases for buildings and land leased for various types of uses, including: facilities operated by Fixed Based Operators (FBOs), airline support facilities, aviation support facilities, rental car service areas, and concession support facilities. Building and ground rentals are received by the City for a number of categories of building space and land at the Airport, including office space, land parcels, hangars, and non-airline spaces in the terminal building complex. The lease terms vary, from month-to-month or other short term durations to long term leases with and without options to renew. Many of the leases include escalation clauses. This category also includes interest income generated by the City on the investment of balances in various Airport System funds and accounts. Most of this income flows to the Revenue Fund as part of Airport System Revenues. This revenue category is budgeted to total approximately $8.9 million in FY 2015. The total of this revenue category is projected to increase with inflation as rate adjustment provisions in the various leases take effect, and is projected to increase from approximately $8.9 million in FY 2015 to $10.3 million in FY 2024. 6. Dallas Executive Airport and the Heliport3 Revenues generated by the Executive Airport include building and ground rentals from leases for buildings and land lease for various types of uses including facilities operated by FBOs, aviation support facilities, the FAA, the Dallas Police Department, a fuel farm, and other facilities. Building and ground rentals are received by the City for a number of categories of building space and land at the Executive Airport, including office space, improved ground, unimproved ground, and hangars. Many of the leases include ������������������������������������������������������������3 Although the Heliport is also part of the Airport System, it does not generate revenues.

Dallas Love Field Financial Feasibility Report
Unison Consulting, Inc. V - 27 June 8, 2015
escalation clauses. Building and ground rentals for the Executive Airport are budgeted to total approximately $727,000 in FY 2015. Revenues from the Executive Airport are projected to increase with inflation and as rate adjustment provisions in the various leases take effect, to approximately $826,000 in FY 2024. E. APPLICATION OF REVENUES Table V-8 presents the projected application of Airport System Revenues pursuant to the provisions of the Airport Use and Lease Agreement, and as illustrated earlier in Figure V-1. Airport System Revenues are first applied to pay O&M Expenses, and then to maintain the required balance in the O&M Reserve Account. Remaining Airport System Revenues are then applied first to pay debt service on outstanding Airport System Revenue Bonds, which will include the Series 2015 Bonds and the Series 2016 Bonds. Next in the order of priority is the payment of any deposits required to the Debt Service Reserve Fund. Airport System Net Revenues are then applied to make transfers to the Southwest Holding Account to reimburse Southwest Airlines for its Facilities Payments related to the annual Obligation for Revenue Credit Agreement, and then to maintain the required balance in the Emergency Repair and Replacement Reserve. All remaining Net Revenues are deposited into the Aviation Capital Fund to be used to pay the net costs of future capital improvements and for any other lawful Airport System purposes. As indicated in Table V- 8, total Airport System Revenues are forecast to be sufficient to make all required payments and transfers to various funds and accounts as provided for in the Airport Use and Lease Agreement. Revenues are also forecast to be sufficient to provide for annual transfers to the Aviation Capital Fund ranging from approximately $10.7 million to $13.9 million during the forecast period, with a projected deposit of $12.9 million in FY 2024. Table V-8 also shows the projected debt service coverage on the General Airport Revenue Bonds (GARBs) – the Series 2015 Bonds, the Series 2016 Bonds, and the future revenue bonds anticipated in the funding plan for the Master Plan. The Indenture contains a provision requiring that Airport System Net Revenues be at least 1.25 times debt service in order for the LFAMC to issue additional bonds on parity with the then-currently outstanding bonds (although the additional bonds coverage requirement does not apply to the first $250 million in bonds issued to finance the Project). Debt service coverage on the GARBs is projected to be no less than 2.53 times debt service throughout the forecast period.

Dallas Love Field Financial Feasibility Report
Unison Consulting, Inc. V - 28 June 8, 2015
Table V-8 CITY OF DALLAS AIRPORT SYSTEM
PROJECTED APPLICATION OF REVENUES For Fiscal Years Ending September 30
Budgeted Projected2015 2016 2017 2018 2019 2020 2021 2022 2023 2024
Total Airport System Revenues [A] $82,651,799 $94,231,500 $95,745,250 $112,582,000 $123,308,500 $127,512,750 $130,499,000 $136,816,250 $140,839,250 $144,006,000
O&M Expenses [B] 56,695,400 66,730,000 69,039,000 71,744,000 74,546,000 77,261,000 80,087,000 83,034,000 86,110,000 89,313,000Deposit to O&M Reserve Account [C] 1,807,995 2,509,000 577,000 676,000 701,000 678,000 707,000 737,000 769,000 800,000
Net Revenues [A-B-C=D] $24,148,404 $24,992,500 $26,129,250 $40,162,000 $48,061,500 $49,573,750 $49,705,000 $53,045,250 $53,960,250 $53,893,000
Debt Service on GARBsSeries 2015 Bonds $0 $0 $0 $9,436,500 $9,440,500 $9,439,500 $9,438,250 $9,436,250 $9,438,000 $9,437,750Series 2016 Bonds 0 0 0 0 7,932,750 7,933,000 7,935,000 7,933,250 7,937,500 7,937,000Future Bonds 0 0 0 0 0 0 0 3,600,000 3,600,000 3,600,000
Total GARBs [E] $0 $0 $0 $9,436,500 $17,373,250 $17,372,500 $17,373,250 $20,969,500 $20,975,500 $20,974,750
Remaining Net Revenues [D-E=F] $24,148,404 $24,992,500 $26,129,250 $30,725,500 $30,688,250 $32,201,250 $32,331,750 $32,075,750 $32,984,750 $32,918,250
Transfer to Southwest Holding Account 12,994,750 12,645,250 12,278,250 18,327,750 19,988,000 19,988,000 19,986,000 19,987,000 19,984,750 19,988,250 Replenishment of Emergency Reserve 0 0 0 0 0 0 0 0 0 0
Transfer to Capital Account [F-G-H] $11,153,654 $12,347,250 $13,851,000 $12,397,750 $10,700,250 $12,213,250 $12,345,750 $12,088,750 $13,000,000 $12,930,000
Debt Service Coverage on GARBs [D/E] N/A N/A N/A 4.26 2.77 2.85 2.86 2.53 2.57 2.57
Dallas Love Field Financial Feasibility Report
Unison Consulting, Inc. V - 29 June 8, 2015
F. AIRLINE COST PER REVENUE ENPLANED PASSENGER Table V-9 shows projected airline cost per enplaned passenger for each year of the forecast period. The projected changes in the airline cost per enplanement reflect the various factors that have been discussed previously in this Section, primarily the following:
� The higher Parking concession revenue beginning in FY 2015;
� The capitalized interest period on the Series 2015 Bonds and the Series 2016 Bonds through mid-FY 2018;
� The ending of the LOI grant receipts, which are currently used to offset the
amount of the Obligation for Revenue Credit Agreement (the majority of which are allocated to the Terminal Building cost center) to be paid by Southwest; and
� Incremental debt service is projected beginning in FY 2022, associated with future revenue bonds anticipated in the funding plan for the Master Plan, to finance certain airfield capital costs.
The first two factors listed above are projected to result in a significant increase in net revenue of the Parking and Ground Transportation cost center in FY 2016 and FY 2017, seventy-five percent of which is credited to the Terminal Building rental rate calculation. This period will coincide with the last fiscal years in which LOI grant receipts are scheduled to be applied to offset the debt service costs included in the calculation of costs for the Terminal Building rental rate. The combined effect of these factors is projected to result in a significant decrease in the Terminal Building rental rate in FY 2016 and FY 2017, followed by a significant increase in the rental rate in FY 2018 and FY 2019. The incremental debt service beginning in FY 2022 is projected to cause an increase in the landing fee rate. These fluctuations in the Terminal Building rental rate and the landing fee rate are reflected in the projected airline cost per enplanement. The airline cost per enplanement is projected to decrease from $4.99 in FY 2015 to $3.90 in FY 2015 and FY 2016, and then increase to $7.87 in FY 2021 and to $9.06 in FY 2024. Based on our knowledge of comparable airports and our experience in providing financial consulting services to a variety of airports, we believe the projected airline cost per enplanement is reasonable in comparison with other major airports that have recently completed or are currently implementing major capital improvement programs. As the dominant carrier at the Airport, Southwest has a particular interest in keeping the cost per enplanement at the Airport as low as possible. Southwest has exercised an active role in managing major elements of the LFMP, including the planning of Garage C. Southwest also has direct control over its future utilization of the Airport through its scheduling decisions and, to a considerable extent, should be able to maintain future traffic levels to achieve the forecasts of air traffic activity presented in this Report.
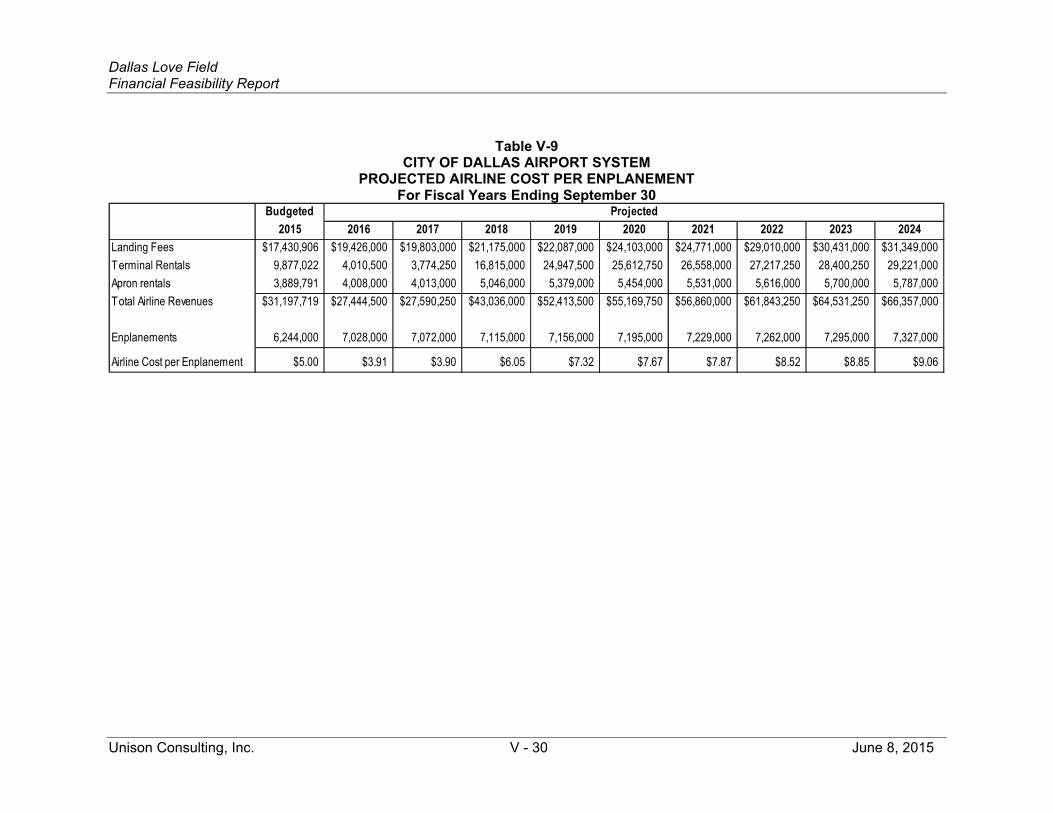
Dallas Love Field Financial Feasibility Report
Unison Consulting, Inc. V - 30 June 8, 2015
Table V-9 CITY OF DALLAS AIRPORT SYSTEM
PROJECTED AIRLINE COST PER ENPLANEMENT For Fiscal Years Ending September 30
Budgeted Projected2015 2016 2017 2018 2019 2020 2021 2022 2023 2024
Landing Fees $17,430,906 $19,426,000 $19,803,000 $21,175,000 $22,087,000 $24,103,000 $24,771,000 $29,010,000 $30,431,000 $31,349,000Terminal Rentals 9,877,022 4,010,500 3,774,250 16,815,000 24,947,500 25,612,750 26,558,000 27,217,250 28,400,250 29,221,000Apron rentals 3,889,791 4,008,000 4,013,000 5,046,000 5,379,000 5,454,000 5,531,000 5,616,000 5,700,000 5,787,000Total Airline Revenues $31,197,719 $27,444,500 $27,590,250 $43,036,000 $52,413,500 $55,169,750 $56,860,000 $61,843,250 $64,531,250 $66,357,000
Enplanements 6,244,000 7,028,000 7,072,000 7,115,000 7,156,000 7,195,000 7,229,000 7,262,000 7,295,000 7,327,000
Airline Cost per Enplanement $5.00 $3.91 $3.90 $6.05 $7.32 $7.67 $7.87 $8.52 $8.85 $9.06

Dallas Love Field Financial Feasibility Report
Unison Consulting, Inc. V - 31 June 8, 2015
G. SENSITIVITY ANALYSIS The financial projections presented above relate to the base enplanement forecast presented in Section IV. We also prepared financial projections based on the high and low enplanement forecast scenarios. The key results of the sensitivity analysis are presented on Table V-10. Under the high enplanement forecast, the airline cost per enplanement is projected to equal $7.46 in FY 2024, and the annual deposits to the Aviation Capital Fund are projected to reach approximately $14.7 million in FY 2024. Under the low enplanement forecast, the airline cost per enplanement is projected to equal $10.43 in FY 2024, and the annual deposits to the Aviation Capital Fund are projected to reach $11.8 million in FY 2024. Under both of the alternate enplanement scenarios, the Airport is projected to exceed the minimum debt service coverage requirement during the forecast period, with debt service coverage projected to be no less than 2.59 times debt service under the high enplanement scenario and no less than 2.48 times debt service under the low enplanement scenario.

Dallas Love Field Financial Feasibility Report
Unison Consulting, Inc. V - 32 June 8, 2015
Table V-10
CITY OF DALLAS AIRPORT SYSTEM SUMMARY OF FINANCIAL PROJECTIONS FOR BASE, HIGH, AND LOW ENPLANEMENT FORECAST SCENARIOS
For Fiscal Years Ending September 30 2016 2017 2018 2019 2020 2021 2022 2023 2024
BASE FORECASTEnplanements 7,028,000 7,072,000 7,115,000 7,156,000 7,195,000 7,229,000 7,262,000 7,295,000 7,327,000Airline Cost per Enplanement $3.91 $3.90 $6.05 $7.32 $7.67 $7.87 $8.52 $8.85 $9.06Transfer to Capital Account $12,347,250 $13,851,000 $12,397,750 $10,700,250 $12,213,250 $12,345,750 $12,089,750 $13,000,000 $12,930,000Debt Service Coverage N/A N/A 4.26 2.77 2.85 2.86 2.53 2.57 2.57
HIGH FORECASTEnplanements 7,237,000 7,414,000 7,561,000 7,707,000 7,781,000 7,863,000 7,957,000 8,070,000 8,178,000Airline Cost per Enplanement $3.66 $3.49 $5.38 $6.40 $6.66 $6.76 $7.25 $7.41 $7.46Transfer to Capital Account $12,632,250 $14,397,250 $13,159,250 $11,683,500 $13,287,750 $13,534,750 $13,425,250 $14,531,750 $14,654,500Debt Service Coverage N/A N/A 4.34 2.82 2.92 2.93 2.59 2.65 2.65
LOW FORECASTEnplanements 6,517,000 6,553,000 6,596,000 6,538,000 6,550,000 6,594,000 6,620,000 6,614,000 6,691,000Airline Cost per Enplanement $4.56 $4.57 $6.89 $8.48 $8.92 $9.12 $9.85 $10.31 $10.43Transfer to Capital Account $11,598,250 $13,068,750 $11,603,000 $9,690,750 $11,131,750 $11,266,250 $10,974,500 $11,783,000 $11,794,250Debt Service Coverage N/A N/A 4.17 2.71 2.79 2.80 2.48 2.51 2.52

[THIS PAGE INTENTIONALLY LEFT BLANK]

APPENDIX C
EXCERPTS FROM THE
CITY OF DALLAS, TEXAS
COMPREHENSIVE ANNUAL
FINANCIAL REPORT
For the Year Ended September 30, 2014
The information contained in this Appendix consists of excerpts from the City of Dallas, Texas Comprehensive Annual Financial Report for the Year Ended September 30, 2014 and is not intended to be a complete statement of the City’s financial condition. Reference is made to complete Report for further information.
Although this Appendix contains financial statements, with accompanying notes and supplementary information, for all of the City’s governmental and proprietary funds, only amounts in the Airport Revenue Fund comprise Net Revenues which secure payment of the Bonds.

[THIS PAGE INTENTIONALLY LEFT BLANK]

CITY OF DALLAS, TEXAS
COMPREHENSIVE ANNUAL FINANCIAL REPORT For Fiscal Year Ended September 30, 2014
Issued by City Controller's Office
Jeanne Chipperfield, Chief Financial Officer
Edward R. Scott, CPA, CGMA, City Controller Lance Sehorn, CPA, CGMA, Assistant City Controller
Jenifer West, Financial Reporting Manager
Dennis Clotworthy Kevin Levin Ester Dogans Theresa Lu Prakash Gautam Cynthia Mendez Nancy Hong Adam Wong

“Dallas, the City that works: diverse, vibrant and progressive.”

CITY OF DALLAS, TEXAS
COMPREHENSIVE ANNUAL FINANCIAL REPORT YEAR ENDED SEPTEMBER 30, 2014
TABLE OF CONTENTS I. INTRODUCTORY SECTION (Unaudited) PAGE
Letter of Transmittal v List of Officials xv City of Dallas Organizational Chart xvi GFOA Certificate of Achievement xvii
II. FINANCIAL SECTION Independent Auditors’ Report 1
A. MANAGEMENT’S DISCUSSION AND ANALYSIS (Unaudited) 3
B. BASIC FINANCIAL STATEMENTS
Government-Wide Financial Statements Statement of Net Position 13 Statement of Activities 14 Fund Financial Statements Governmental Fund Financial Statements Balance Sheet 16 Reconciliation of the Balance Sheet of Governmental Funds to the Statement of Net Position 17 Statement of Revenues, Expenditures, and Changes in Fund Balances 18 Reconciliation of the Statement of Revenues, Expenditures, and Changes in Fund Balances of Governmental Funds to the Statement of Activities 19 Budget and Actual Comparison General Fund Statement of Revenues, Expenditures and Changes in Fund Balances-Non-GAAP Budgetary Basis 20
Proprietary Fund Financial Statements Statement of Net Position 22 Statement of Revenues, Expenses, and Changes in Fund Net Position 24 Statement of Cash Flows 26 Fiduciary Fund Financial Statements Statement of Fiduciary Net Position 30 Statement of Changes in Fiduciary Net Position 31 Notes to the Basic Financial Statements 32
C. REQUIRED SUPPLEMENTARY INFORMATION (Unaudited)
Schedule of Funding Progress – Employee’s Retirement Fund 94
i

CITY OF DALLAS, TEXAS
COMPREHENSIVE ANNUAL FINANCIAL REPORT YEAR ENDED SEPTEMBER 30, 2014
TABLE OF CONTENTS (continued) PAGE
Schedule of Funding Progress – Other Postemployment Benefits 95
D. COMBINING FINANCIAL STATEMENTS
Nonmajor Governmental Funds
Combining Balance Sheet 100 Combining Statement of Revenues, Expenditures, and 104 Changes in Fund Balances
Nonmajor Enterprise Funds
Combining Statement of Net Position 111
Combining Statement of Revenues, Expenses, and Changes in Fund Net Position 112
Combining Statement of Cash Flows 113 Internal Service Funds Combining Statement of Net Position 115 Combining Statement of Revenues, Expenses, and
Changes in Fund Net Position 116
Combining Statement of Cash Flows 117 Fiduciary Funds Combining Statement of Plan Net Position 119 Combining Statement of Changes in Plan Net Position 120 Combining Statement of Changes in Agency Assets and Liabilities 121 Debt Service Fund Budgetary Comparison Schedule-Debt Service Fund 123
Discretely Presented Component Units Combining Statement of Net Position 125 Combining Statement of Revenues, Expenses, and
Changes in Net Position 126
E. CAPITAL ASSETS USED IN THE OPERATION OF GOVERNMENTAL FUNDS Schedules by Source 128 Schedule by Function and Activity 129 Schedule of Changes by Function and Activity 130
ii

CITY OF DALLAS, TEXAS
COMPREHENSIVE ANNUAL FINANCIAL REPORT YEAR ENDED SEPTEMBER 30, 2014
TABLE OF CONTENTS
(continued)
III. STATISTICAL SECTION (UNAUDITED)
TABLE PAGE Net Position by Component 1 132 Change in Net Position 2 134 Fund Balances, Governmental Funds 3 136 Changes in Fund Balances, Governmental Funds 4 138 Assessed Value and Estimated Actual Value of Taxable Property 5 140 City Tax Rate Distribution 6 141 Property Tax Rates - All Direct and Overlapping Tax Rates 7 142 Property Tax Levies and Collections 8 143 Principal Property Taxpayers 9 144 Direct and Overlapping Governmental Activities Debt
10
145
Ratio of Outstanding Debt by Type 11 146 Legal Debt Margin 12 148 Schedule of Revenue Bond Coverage-Dallas Water Utilities 13 150 Schedule of Revenue Bond Coverage-Convention Center Fund 14 151 Demographic Statistics and Economic Statistics 15 152 Principal Employers 16 153 Capital Assets Statistics by Function/Program 17 154 Operating Indicators By Function/Program 18 156 Full-Time Equivalent City Government Employees By Function/Program
19
158
iii

“Dallas, the City that works: diverse, vibrant and progressive.”
iv

INTRODUCTORY SECTION

to facilitate the reconstruction of Love Field Airport with modern, convenient air travel facilities. More information regarding the LFAMC is included in Note 10 (J) and (K). Discretely presented component units are other legally separate entities which are also included in the City's reporting entity based on the criteria set forth in the Codification of Governmental Accounting Standards, Section 2100, Defining the Financial Reporting Entity. The criteria considered in determining the activities to be reported within the City's financial statements are included in Note 1(B). Based on those criteria, the following organizations are included as discretely presented component units of the City of Dallas for financial reporting purposes: • The Housing Finance Corporation issues tax-exempt mortgage revenue bonds to assist low-to-
moderate income citizens in purchasing homes. • The Housing Acquisition and Development Corporation provides safe and affordable housing
for low and moderate income persons. • The Dallas Development Fund was organized to assist in carrying out the economic
development program and objectives of the City by generating private investment capital through the New Markets Tax Credit Program to be made available for investment in low-income communities.
• The Downtown Dallas Development Authority is a separate legal entity which was established to promote economic development of the downtown area and improve the tax base.
• The North Oak Cliff Municipal Management District was organized to promote, develop, encourage and maintain employment, commerce, transportation, housing, tourism, recreation, and the arts, entertainment, economic development, safety, the public welfare in the District, and educational scholarships for college-bound students residing in or out of the District.
• The Cypress Waters Municipal Management District was organized to promote, develop, encourage and maintain employment, commerce, transportation, housing, tourism, recreation, and the arts, entertainment, economic development, safety, and the public welfare in the District.
• The Dallas Convention Center Hotel Development Corporation was created to promote the development of the geographic area of the City included at or in the vicinity of the Dallas Convention Center, in furtherance of the promotion, development, encouragement and maintenance of employment, commerce, convention and meeting activity, tourism, and economic development in the City including specifically, without limitation, the development and financing of a convention center hotel located within 1,000 feet of the Dallas Convention Center.
Related organizations not included as part of the reporting entity are the Dallas/Fort Worth International Airport, the Dallas Housing Authority, and Dallas Area Rapid Transit. The reason for not including these entities is because the City's accountability does not extend beyond appointing members to the Boards. Economic Condition and Outlook The City of Dallas is the largest local economy in the nation’s fourth largest metropolitan area. The City is home to over 62,000 businesses (Reference USA). Dallas’ diverse industry employment mix continues to support steady and progressive local economic growth and to dampen the negative effects of any single industry downturn. Professional and Business services were the largest employment
vi

industry within the City, marking a change from the last two years where the Trade, Transportation and Utilities sector was the largest. The Government and Education and Health Services sectors employment shares were the third and fourth largest in fiscal 2014. (Bureau of Labor Statistics and Census Labor-
Employment Dynamics). (Figure 1.) Since fiscal 2011, monthly sales tax revenue has increased by 17.8 percent. Indicators such as the unemployment rate, job change and housing values reflect Dallas’ continued improved performance. (Bureau of Labor Statistics).
(Bureau of Labor Statistics and Census Labor-Employment Dynamics)
The Dallas monthly labor force (Dallas residents only) averaged 596,473 during fiscal 2014. A monthly average of 34,977 residents were unemployed over this time. Dallas’ unemployment has remained below the U.S. average for nearly seven fiscal years. (U.S. Bureau of Labor Statistics). Dallas’ employment base uses a large inventory of business facilities including over 118 million square feet of office space, 198 million square feet of industrial/flex space, and 76 million square feet of retail space (CoStar). The following charts highlight Dallas’ major economic indicators, presenting a continued modest recovery from the negative effects of the recession. The economy in fiscal 2014 shows a growing local economy.
vii
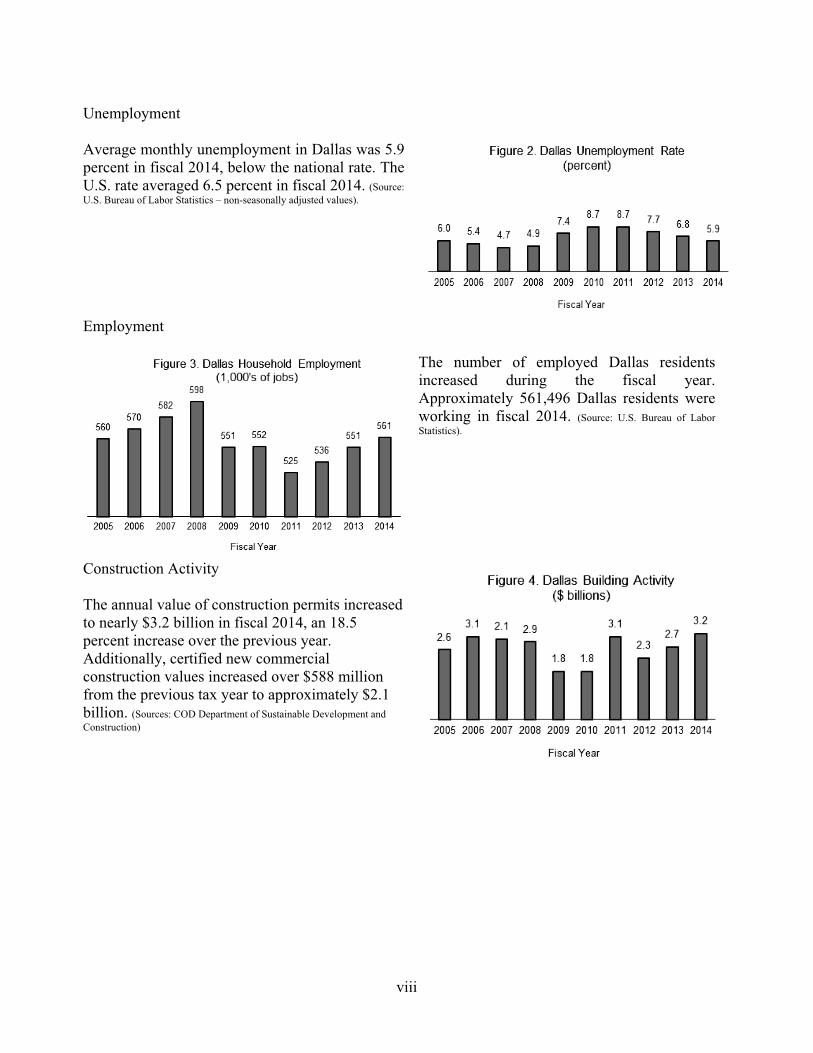
Unemployment Average monthly unemployment in Dallas was 5.9 percent in fiscal 2014, below the national rate. The U.S. rate averaged 6.5 percent in fiscal 2014. (Source: U.S. Bureau of Labor Statistics – non-seasonally adjusted values).
Employment
The number of employed Dallas residents increased during the fiscal year. Approximately 561,496 Dallas residents were working in fiscal 2014. (Source: U.S. Bureau of Labor Statistics).
Construction Activity The annual value of construction permits increased to nearly $3.2 billion in fiscal 2014, an 18.5 percent increase over the previous year. Additionally, certified new commercial construction values increased over $588 million from the previous tax year to approximately $2.1 billion. (Sources: COD Department of Sustainable Development and Construction)
viii
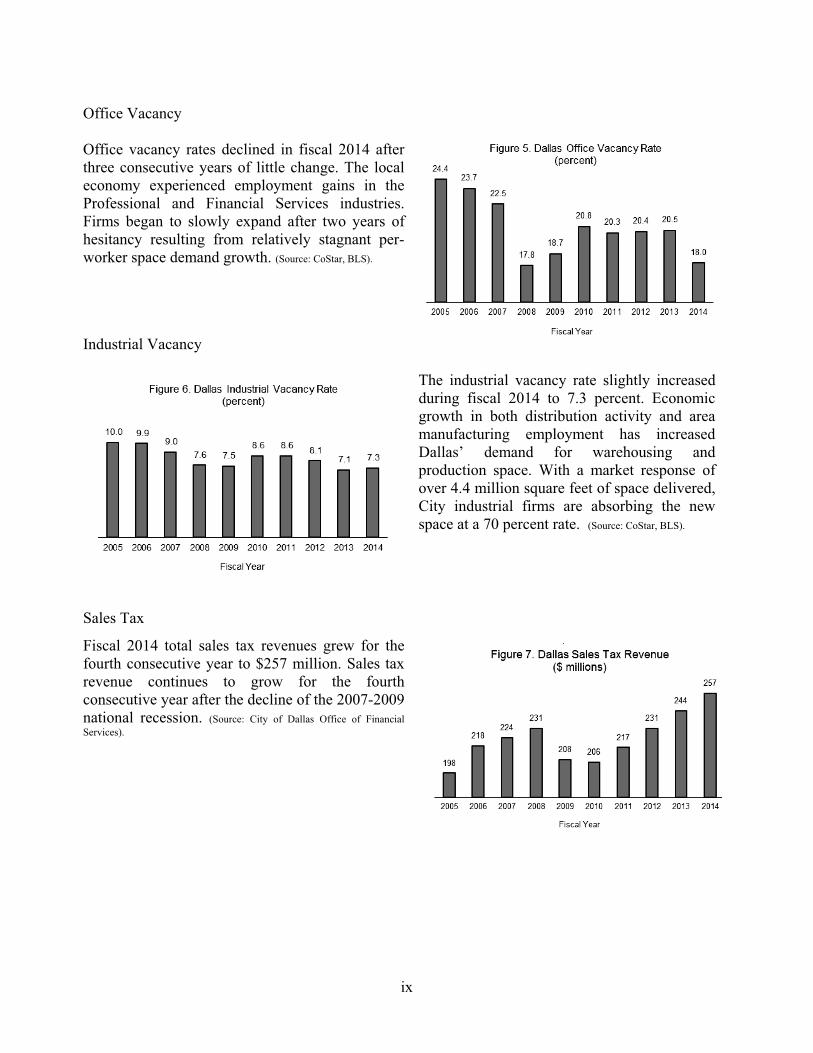
Office Vacancy Office vacancy rates declined in fiscal 2014 after three consecutive years of little change. The local economy experienced employment gains in the Professional and Financial Services industries. Firms began to slowly expand after two years of hesitancy resulting from relatively stagnant per-worker space demand growth. (Source: CoStar, BLS).
Industrial Vacancy
The industrial vacancy rate slightly increased during fiscal 2014 to 7.3 percent. Economic growth in both distribution activity and area manufacturing employment has increased Dallas’ demand for warehousing and production space. With a market response of over 4.4 million square feet of space delivered, City industrial firms are absorbing the new space at a 70 percent rate. (Source: CoStar, BLS).
Sales Tax
Fiscal 2014 total sales tax revenues grew for the fourth consecutive year to $257 million. Sales tax revenue continues to grow for the fourth consecutive year after the decline of the 2007-2009 national recession. (Source: City of Dallas Office of Financial Services).
ix

Commercial Property Dallas’ commercial tax base grew over seven percent to $35.1 billion in fiscal 2014. This positive growth coincides with the first major commercial vacancy rate decline in three fiscal years. This reflects the beginning of strong post-recession job growth resulting in demand for commercial space. (Source: Certified Tax Rolls, Office of Financial Services).
Residential Property
The residential tax base increased by nearly two percent to $39.1 billion in fiscal 2014. Dallas’ increased valuations reflect continued inward migration and a diverse housing stock that can accommodate various household needs. (Source: Certified Tax Rolls, Office of Financial Services).
Total Property Total taxable value of property increased to $87.3 billion in fiscal 2014 from $83.7 billion in fiscal 2013. This is a 4.3 percent increase. (Source: Certified Tax Rolls, Office of Financial Services).
x
Economic Development Strategy Dallas’ economy continued to perform well. This can be attributed to a diverse local economy, a resilient real estate market and continued favorable migration to the region. Dallas’ development strategy also contributed positively to the way the local economy responded to the recession. A coordinated effort since 2005 has strengthened the downtown housing market, promoted industrial and transit-oriented development in Southern Dallas and facilitated the relocation of major national corporations to the City. The City continued to monitor the changing national economic condition and identified remaining gaps that need to be addressed in the next strategic plan. The Strategic Plan for economic development is driven by four key goals: growth in the economy through expanding employment and the size of the labor force, increased economic opportunities for City residents, a broadened and diversified tax base, and development assistance toward more sustainable communities. Dallas’ updated plan places special emphasis on two focus areas. First is an expanded downtown, supporting a thriving urban economy centered on connection to revitalized in-town neighborhoods and the rest of the city through transit. Second is a revitalized Southern Dallas through leveraging public sector funding in key focus areas to stimulate private investment. Additionally, ongoing initiatives include increasing Dallas’ share of global and regional trade (including retail, wholesale and logistics), recruitment and retention of businesses and marketing Dallas nationally and globally. Central Business District and Expanded Downtown At the end of fiscal 2014, 7,884 residential units were either available or under construction in the Central Business District (CBD), supporting an estimated downtown residential population of over 7,750 (COD estimate based on Census ACS). When including a one mile band adjacent to the CBD, the available or under construction residential unit count increases to 23,553. Hotel occupancy in the Downtown, Market Center and Uptown segment through August 2014 was 67 percent, up 5.7 percentage points from the prior year (Dallas Convention & Visitors Bureau). Business relocations including Santander Consumer USA Inc.; Active Network, LLC; and Omnitracs, LLC combined to bring over 2,800 jobs and $22 million in leasehold and business personal property improvements to Downtown. Developments completed during the fiscal year such as the Farmers Market Square Townhomes (Phase I) and Lone Star Gas Lofts Atmos (Phase II) totaled nearly $50 million. Additionally, events including the US Conference of Mayors, the New Cities Summit 2014 and the Mary Kay Annual Seminar reinforce Downtown Dallas’ position as a convention center by generating over $700 million in economic impact. Aviation The City of Dallas and the Commemorative Air Force (CAF) have agreed to the relocation and expansion of CAF’s headquarters operations to Dallas Executive Airport from Midland, Texas. CAF will construct a new museum and hangar building on approximately 85,000 square feet and will lease approximately 45 acres of improved and unimproved land for an aircraft hangar, ramp and automobile parking. CAF estimates annual attendance of between 20,000 and 60,000 people per year will visit its major events and estimates 150,000 to 275,000 tourists per year to the museum. Additionally, the Texas Department of Transportation will begin Phase I of a runway reconstruction project at Dallas
xi

Executive Airport in March 2015. The four-phase project is expected to be completed by December 2017. University of North Texas Dallas Fall 2014 enrollment at the University of North Texas Dallas (UNT Dallas) campus was 2,578, with full-time enrollment at 1,413 students. The new campus is expected to ultimately enroll 25,000 students. Area improvements include an extension of DART’s Blue Line to the campus with service scheduled to begin in 2016. Additionally, the City’s Park Department is currently designing the $3.3 million Runyon Creek Trail improvement project beginning at Glendale Park and linking to the UNT Dallas station. The design team is currently working with UNT Dallas staff to identify a trail alignment serving the students as well as providing accessibility to the DART station. International Inland Port of Dallas (IIPOD) During fiscal 2014, progress continued at the IIPOD, a major logistics hub in the southeast quadrant of the City. Approximately 2,500 acres of land within the City limits (of 7,500 acres for the total project) have become the gateway to a major distribution hub that will exceed 60 million square feet of industrial and warehouse space at completion. Transit-Oriented Development (TOD) The number of DART light rail stations within the City of Dallas remained at 44 during fiscal 2014. The City of Dallas continues to work with private developers to pursue projects near station areas that complement the transit system through new housing and employment opportunities. Additionally, light-rail service connects the City with the Dallas/Fort Worth (DFW) International Airport. The Orange Line from Bachman Station extends through Irving and ends at DFW Airport. The Orange Line extension to the airport became available for public use on August 18, 2014. Trinity River Corridor Project The Trinity River Corridor Project remains one of the largest and most complex urban development projects in the nation, operating within the guidelines of the Balanced Vision Plan (BVP). The project provides flood protection, transportation components, recreation elements, environmental stewardship, and business development along 20 miles and 10,000 acres of the Trinity River. Rated to withstand at least a 1,500+ year flood level, future plans include adjustment to existing levees, continued implementing the BVP project, and additional improvements of the interior drainage facilities behind the East and West Levees. Projects opening in the spring of 2015 are Sylvan Avenue Bridge, Sylvan Boat Launch, Pavaho Wetlands, Baker Pump Station and Texas Horse Park. Projects opening in the summer of 2015 include the South Central Joppa Gateway and Joppa Connector Trail. Projects opening later include Cadiz from Riverfront Blvd. to Lamar St., the “Horseshoe” Project (McDermott Bridge/IH-30/IH-35), Able Pump Station, Upper Chain of Wetlands, AT&T Trail, Trinity Forest Golf Course and S.M. Wright Phase I (TxDOT’s project) .
xii

New projects ready for exploration include MoneyGram Complex, California Crossing Boat Launch, Continental Bridge and West Dallas Gateway, Trinity Skyline Trail, Moore Gateway Park connection to the Santa Fe Trestle Trail, Martin Luther King Jr./Cedar Crest Bridge, and Great Trinity Forest Gateway and Horse Trails. Projects under design include S.M. Wright Phase II and Trinity Phase I Lakes. The Dallas Floodway Environmental Impact Statement (EIS) and the Trinity Parkway Final Environmental Impact Statement (FEIS) both received federal approval in April 2015. This will facilitate the start of construction for phased lakes in the Dallas Floodway. Financial Information Discussion of Controls. The City's management is responsible for establishing and maintaining internal controls designed to ensure that the assets of the government are protected from loss, theft or misuse, and to ensure adequate accounting data are compiled to allow for preparation of financial statements in conformity with accounting principles generally accepted in the United States of America. Internal accounting controls are designed to provide reasonable, but not absolute, assurance regarding: 1) the safeguarding of assets against loss from unauthorized use or disposition, 2) the reliability of financial records for preparing financial statements, and 3) accountability for assets. The concept of reasonable assurance recognizes the cost of a control should not exceed the benefits likely to be derived, and the evaluation of costs and benefits requires estimates and judgments by management. The City Council is required by Charter to appoint a City Auditor who is independent of City management and reports directly to the City Council. The City Auditor supports the internal control structure within the City by performing independent evaluations of existing accounting and administrative controls and by ascertaining compliance with existing plans, policies and procedures. Annually, each department is required to conduct a self-assessment of internal controls. The results of these assessments are reported to the City Manager with an action plan to correct any identified deficiencies. The City Auditor reviews, on a sample basis, the departments' internal control evaluations each year to ensure the integrity of the program and provide constructive comments for improvement. Furthermore, as a recipient of federal and state assistance, the City is also responsible for ensuring adequate internal controls are in place to comply with applicable laws, regulations, contracts, and grants related to those programs. Internal controls are subject to periodic evaluation by management and the City Auditor. As part of the City's single audit, tests are made to determine the adequacy of the internal control, including that portion relative to federal and state financial awards, as well as to determine whether the City has complied with applicable laws, regulations, contracts, and grants. All internal control evaluations occur within the above framework. We believe the City’s internal accounting controls adequately safeguard assets and provide reasonable assurance of proper recording of financial transactions. Budgetary controls. The City Charter provides that the City Council shall annually appropriate adequate funds in an amount to execute the policies and service delivery plans of the City. City management annually prepares the plan of services for the upcoming fiscal year and the estimated costs. The plan is reviewed by the City Council and is formally adopted by the passage of a budget
xiii

CITY OF DALLASFISCAL YEAR 2014 ELECTED OFFICIALS
CITY MANAGER
xv
FRONT ROW (Seated, left to right): Vonciel Jones Hill - District 3Jerry R. Allen - District 10Deputy Mayor Pro Tem Monica R. Alonzo - District 6Dallas Mayor Mike RawlingsMayor Pro Tem Tennell Atkins - District 8Adam Medrano - District 2Carolyn R. Davis - District 7
BACK ROW (Standing, left to right): Scott Griggs - District 1Sandy Greyson - District 12Lee M. Kleinman - District 11Rick Callahan - District 5Jennifer S. Gates - District 13Sheffie Kadane - District 9Philip T. Kingston - District 14Dwaine R. Caraway - District 4
A. C. Gonzalez
“Dallas, the City that works:diverse, vibrant and progressive.”

City of Dallas Organizational Chart September 30, 2014
xvi

xvii

“Dallas, the City that works: diverse, vibrant and progressive.”
xviii

FINANCIAL SECTION
�

�

CITY OF DALLAS, TEXAS MANAGEMENT’S DISCUSSION AND ANALYSIS
September 30, 2014 (Unaudited)
As management of the City of Dallas (the City), we offer readers of the City’s financial statements this narrative overview and analysis of the financial activities of the City for the fiscal year ended September 30, 2014. The City’s management’s discussion and analysis is designed to (1) assist the reader in focusing on significant issues, (2) provide an overview of the City’s financial activity, (3) identify changes in the City’s financial position (its ability to address the next and subsequent year challenges), (4) identify any material deviations from the financial plan (the approved budget), and (5) identify individual major fund issues or concerns. We encourage readers to consider the information presented here in conjunction with the accompanying transmittal letter, which can be found on pages v-xiv of this report. All amounts, unless otherwise indicated, are expressed in thousands of dollars.
FINANCIAL HIGHLIGHTS
�� The assets of the City exceeded its liabilities at the close of the most recent fiscal year by approximately $5.6 billion (net position).
� The City’s governmental activities net position increased by $81.2 million while the business-type activities net position increased by $113.5 million.
� As of the close of fiscal year 2014, the City’s governmental funds reported combined ending fund balances of $576.7 million, a decrease of $154.6 million in comparison to the prior year fund balance.
� At the end of the current fiscal year, unassigned fund balance for the general fund was $129.2 million, or approximately 12% of the total general fund expenditures, including transfers out.
� The City’s governmental long-term liabilities had a net decrease of $73.4 million from the prior year’s balance of $2.4 billion and business-type activities increased $215.7 million from the prior year’s balance of $3.2 billion. The decrease for governmental activities occurred primarily from a net decrease in general obligation bonds, notes and certificates of obligation of $140.8 million and a net decrease in bond premiums and discounts of $19.4 million. Additionally, the decrease in long-term liabilities was offset, due to net accretion on pension obligation bonds of $9 million, a net increase of $18.7 million in other postemployment benefits, a net increase in landfill closure/post closure liabilities of $1.4 million, a net increase in notes payable of $.7 million, a net increase in the net pension obligation of $6 million and a net increase of $9.3 million in capital leases. Commercial paper notes payable increased $26.5 million. The increase in long-term liabilities of business-type activities was primarily due to a net decrease of $102.5 million in water and sewer revenue refunding bonds, and a $4.4 million decrease in convention center debt, due to principal payments for bonds and notes payable, offset by an increase of $122.8 million in commercial paper notes payable for Dallas Water Utilities.
OVERVIEW OF THE FINANCIAL STATEMENTS The City’s basic financial statements are comprised of three components: 1) government-wide financial statements, 2) fund financial statements and 3) notes to the financial statements. This report also contains other supplementary information in addition to the basic financial statements themselves. Government-wide financial statements: The government-wide financial statements are designed to provide readers with a broad overview of the City’s finances, in a manner similar to a private-sector business and are made up of the following two statements: the statement of net position and the statement of activities. Both of these statements are prepared using the economic resources measurement focus and the accrual basis of accounting. The statement of net position presents information on all of the City’s assets and deferred outflows of resources, and liabilities and deferred inflows of resources with the difference reported as net position. Over time, increases or decreases in net position may serve as a useful indicator of whether the financial position of the City is improving or deteriorating. The statement of net position combines and consolidates governmental funds current financial resources (short-term spendable resources) with capital assets and long-term obligations. Other non-financial factors should also be taken into consideration, such as changes in the City’s property tax base, the condition of the City’s property tax base, and the condition of the City’s infrastructure (i.e. roads, drainage improvements, storm and sewer lines, etc.) to assess the overall health or financial condition of the City. The statement of activities presents information showing how the City’s net position changed during the fiscal year. All changes in net position are reported when the underlying event giving rise to the change occurs, regardless of the timing of related cash flows. Thus, revenues and expenses are reported in this statement for some items that will result in cash flows in future fiscal periods (e.g. uncollected taxes and unused compensated absences). Both of the government-wide financial statements distinguish functions of the City that are principally supported by taxes and intergovernmental revenues (governmental activities) from functions that are intended to recover all or a portion of their costs through user fees and charges (business-type activities). The governmental activities of the City include general government, public safety, streets, environmental and health services, public works and transportation, equipment and building services, cultural and recreation services, and housing and human services.
3
CITY OF DALLAS, TEXAS MANAGEMENT’S DISCUSSION AND ANALYSIS
September 30, 2014 (Unaudited)
The business-type activities of the City include water utilities, convention center, airport, municipal radio and building inspections. The airport revenue fund includes the activities of the Love Field Airport Modernization Corporation (LFAMC), a blended component unit. The government-wide financial statements reflect not only the activities of the City itself (known as the primary government), but also those of the seven separate legal entities for which the City is financially accountable – the Housing Finance Corporation, the Housing Acquisition and Development Corporation, Dallas Development Fund, the Downtown Dallas Development Authority (DDDA), the North Oak Cliff Municipal Management District, the Cypress Waters Municipal Management District and the Dallas Convention Center Hotel Development Corporation, which are reported as discretely presented component units separately from the primary government itself. The government-wide financial statements can be found on pages 13-15 of this report. Fund Financial Statements: A fund is a grouping of related accounts that is used to maintain control over resources that have been segregated for specific activities or objectives. The City, like other state and local governments, uses fund accounting to ensure and demonstrate compliance with finance-related legal requirements. All of the funds of the City can be divided into three categories: governmental funds, proprietary funds and fiduciary funds. Governmental Funds: Governmental funds are used to account for essentially the same functions reported as governmental activities in the government-wide financial statements. However, unlike the government-wide financial statements, governmental fund financial statements focus on current sources and uses of spendable resources, as well as on balances of spendable resources available at the end of the fiscal year. Such information may be useful in evaluating a government’s near-term financing requirements. Because the focus of governmental funds is narrower than that of the government-wide financial statements, it is useful to compare the information presented for governmental funds with similar information presented for governmental activities in the government-wide financial statements. By doing so, readers may better understand the long-term impact of the government’s near-term financing decisions. Both the governmental funds balance sheet and the governmental funds statement of revenues, expenditures, and changes in fund balances provide a reconciliation to facilitate this comparison between governmental funds and governmental activities. The City maintains twenty-three individual governmental funds. Information is presented separately in the governmental funds balance sheet and in the governmental funds statement of revenues, expenditures, and changes in fund balances for the general and debt service funds, which are considered to be major funds. Data from the other twenty-one funds are combined into a single, aggregated presentation. Individual fund data for each of these non-major governmental funds is provided in the combining financial statements section of this report. The City adopts an annual appropriated budget for its general fund. A budgetary comparison statement has been provided for the general fund to demonstrate compliance with this budget. The basic governmental fund financial statements can be found on pages 16, 18, 20 and 21 of this report. Proprietary Funds: Proprietary funds are generally used to account for services for which the City charges customers – either outside customers, or to other units within the City. Proprietary funds are accounted for using the economic resources measurement focus and the accrual basis of accounting. The proprietary funds financial statements provide the same type of information as shown in the government-wide financial statements, only in more detail. The City maintains two types of proprietary funds:
�� Enterprise funds are used to report the same functions presented as business-type activities in the government-wide financial statements. The City uses enterprise funds to account for the airport, convention center, municipal radio, building inspection and water utilities operations. All of the City’s enterprise funds, except the municipal radio and building inspection, are considered major funds.
� Internal Service funds accumulate and allocate costs internally among the City’s various functions. The City uses its
internal service funds to account for its equipment services, communication equipment, office supplies, information services, and risk management programs. Because these services predominantly benefit governmental rather than business-type functions, they have been included within governmental activities in the government-wide financial statements. All internal service funds are combined into a single aggregated presentation in the proprietary fund financial statements. Individual fund data for the internal service funds is provided in the combining financial statements elsewhere in this report.
The basic proprietary fund financial statements can be found on pages 22-29 of this report.
4

CITY OF DALLAS, TEXAS MANAGEMENT’S DISCUSSION AND ANALYSIS
September 30, 2014 (Unaudited)
Fiduciary Funds: Fiduciary funds are used to account for resources held for the benefit of parties outside the City. The City’s pension trust and agency funds are reported under the fiduciary funds. Since the resources of these funds are not available to support the City’s own programs, they are not reflected in the government-wide financial statements. The accounting used for fiduciary funds is much like that used for proprietary funds. The basic fiduciary fund financial statements can be found on pages 30-31 of this report. Notes to the Basic Financial Statements: The notes provide additional information that is essential to a full understanding of the data provided in the government-wide and fund financial statements. The notes can be found immediately following the basic financial statements. The notes to the financial statements can be found on pages 32-93 of this report.
Other Information: In addition to the basic financial statements and accompanying notes, this report presents certain required supplementary information concerning the City’s progress in funding its obligation to provide pension and other postemployment benefits to City employees. Required supplementary information can be found on pages 94 and 95 of this report. The combining statements referred to earlier in connection with non-major governmental funds, non-major enterprise funds, internal service funds, and discretely presented component units are presented immediately following the required supplementary information on pensions. Combining and individual fund statements and schedules can be found on pages 100-126 of this report. GOVERNMENT-WIDE FINANCIAL ANALYSIS The City’s combined net position was approximately $5.6 billion as of September 30, 2014. Analyzing the net position of governmental and business-type activities separately, the business-type activities net position was approximately $3.4 billion and the governmental activities were approximately $2.2 billion. This analysis focuses on the assets and deferred outflows, and liabilities and deferred inflows and net position (Table 1) and changes in revenues and expenses (Table 2) of the City’s governmental and business-type activities.
2014 2013 2014 2013 2014 2013Current and other assets 1,219,448$ 1,357,700$ 1,107,683$ 1,004,622$ 2,327,131$ 2,362,322$ Capital assets 3,595,822 3,413,315 5,807,550 5,592,196 9,403,372 9,005,511 Total assets 4,815,270 4,771,015 6,915,233 6,596,818 11,730,503 11,367,833 Deferred outflows 17,518 22,735 29,691 34,180 47,209 56,915 Long-term liabilities 2,352,574 2,425,992 3,403,521 3,187,805 5,756,095 5,613,797 Other liabilities 235,598 204,340 184,380 199,712 419,978 404,052 Total liabilities 2,588,172 2,630,332 3,587,901 3,387,517 6,176,073 6,017,849
Net position:Net investment in capital assets 2,406,821 2,241,628 2,770,931 2,738,208 5,177,752 4,979,836 Restricted 144,269 216,280 223,230 212,472 367,499 428,752 Unrestricted (306,474) (294,490) 362,862 292,801 56,388 (1,689) Total net postion 2,244,616 2,163,418 3,357,023 3,243,481 5,601,639 5,406,899
Governmental Activities Business-type Activities TotalsNet Position (in thousands)
The largest portion of the City’s net position reflects its investments in capital assets (e.g., land, building, equipment, improvements, construction in progress and infrastructure), less any debt used to acquire those assets that is still outstanding. The City uses these capital assets to provide service to citizens, and consequently, they are not available for future spending. Although the City’s investment in capital assets is reported net of related debt, it should be noted that the resources needed to repay this debt must be provided from other sources, since the capital assets themselves cannot be used to liquidate these liabilities. The current and other assets in governmental activities decreased from the prior year by $138.3 million. The decrease in current and other assets was mostly due to a decrease in cash and cash equivalents of $155.7 million mostly related to spending previously issued bond funds for capital asset acquisitions, a decrease in the net pension asset of $7.6 million, and a decrease in ambulance receivables of $11.7 million, offset by an increase in Section 108 Loans receivable of $5.7 million, an increase in developer receivables of $26.9 million, and an increase in due from other governments of $3.6 million. An additional portion of the City’s net position (7.7% governmental activities and 6.7% business-type activities) represents resources that are subject to external restrictions on how they may be used. The remaining balance in net position is unrestricted.
5
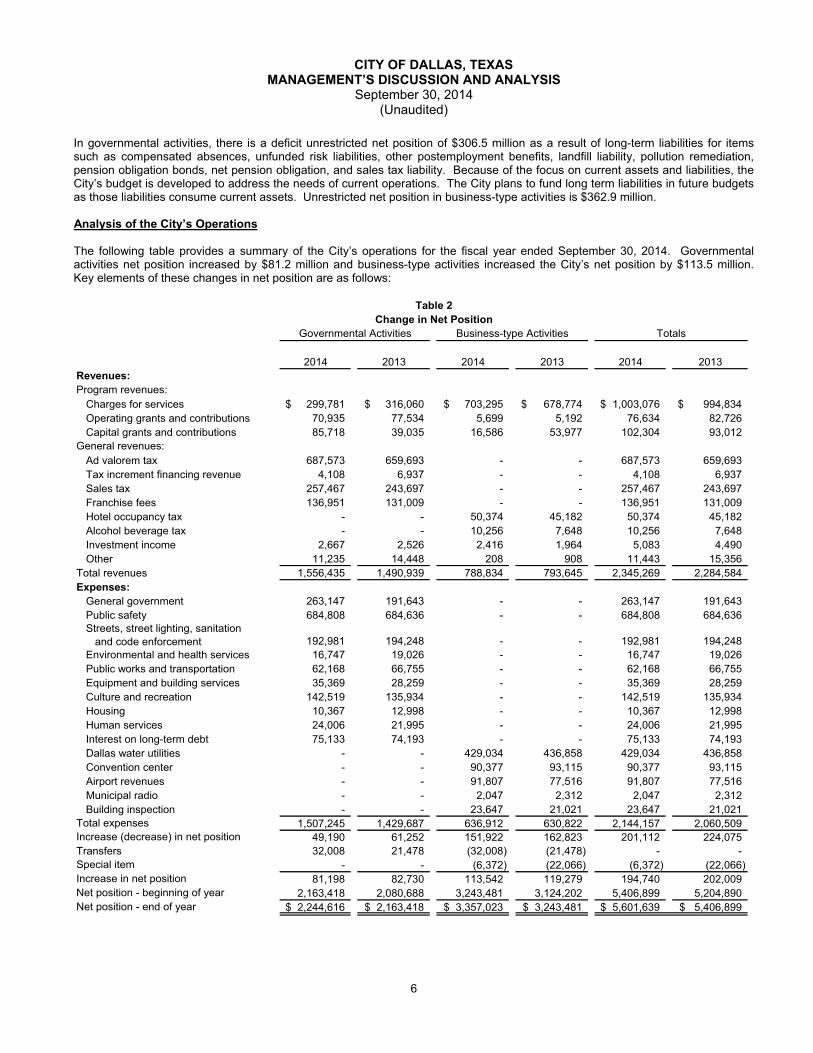
CITY OF DALLAS, TEXAS MANAGEMENT’S DISCUSSION AND ANALYSIS
September 30, 2014 (Unaudited)
In governmental activities, there is a deficit unrestricted net position of $306.5 million as a result of long-term liabilities for items such as compensated absences, unfunded risk liabilities, other postemployment benefits, landfill liability, pollution remediation, pension obligation bonds, net pension obligation, and sales tax liability. Because of the focus on current assets and liabilities, the City’s budget is developed to address the needs of current operations. The City plans to fund long term liabilities in future budgets as those liabilities consume current assets. Unrestricted net position in business-type activities is $362.9 million. Analysis of the City’s Operations
The following table provides a summary of the City’s operations for the fiscal year ended September 30, 2014. Governmental activities net position increased by $81.2 million and business-type activities increased the City’s net position by $113.5 million. Key elements of these changes in net position are as follows:
2014 2013 2014 2013 2014 2013
Charges for services 299,781$ 316,060$ 703,295$ 678,774$ 1,003,076$ 994,834$ Operating grants and contributions 70,935 77,534 5,699 5,192 76,634 82,726 Capital grants and contributions 85,718 39,035 16,586 53,977 102,304 93,012
Ad valorem tax 687,573 659,693 - - 687,573 659,693 Tax increment financing revenue 4,108 6,937 - - 4,108 6,937 Sales tax 257,467 243,697 - - 257,467 243,697 Franchise fees 136,951 131,009 - - 136,951 131,009 Hotel occupancy tax - - 50,374 45,182 50,374 45,182 Alcohol beverage tax - - 10,256 7,648 10,256 7,648 Investment income 2,667 2,526 2,416 1,964 5,083 4,490 Other 11,235 14,448 208 908 11,443 15,356
Total revenues 1,556,435 1,490,939 788,834 793,645 2,345,269 2,284,584 Expenses:
General government 263,147 191,643 - - 263,147 191,643 Public safety 684,808 684,636 - - 684,808 684,636 Streets, street lighting, sanitation and code enforcement 192,981 194,248 - - 192,981 194,248 Environmental and health services 16,747 19,026 - - 16,747 19,026 Public works and transportation 62,168 66,755 - - 62,168 66,755 Equipment and building services 35,369 28,259 - - 35,369 28,259 Culture and recreation 142,519 135,934 - - 142,519 135,934 Housing 10,367 12,998 - - 10,367 12,998 Human services 24,006 21,995 - - 24,006 21,995 Interest on long-term debt 75,133 74,193 - - 75,133 74,193 Dallas water utilities - - 429,034 436,858 429,034 436,858 Convention center - - 90,377 93,115 90,377 93,115 Airport revenues - - 91,807 77,516 91,807 77,516 Municipal radio - - 2,047 2,312 2,047 2,312 Building inspection - - 23,647 21,021 23,647 21,021
1,507,245 1,429,687 636,912 630,822 2,144,157 2,060,509 49,190 61,252 151,922 162,823 201,112 224,075
Transfers 32,008 21,478 (32,008) (21,478) - - - - (6,372) (22,066) (6,372) (22,066)
81,198 82,730 113,542 119,279 194,740 202,009 2,163,418 2,080,688 3,243,481 3,124,202 5,406,899 5,204,890 2,244,616$ 2,163,418$ 3,357,023$ 3,243,481$ 5,601,639$ 5,406,899$
Governmental Activities Business-type Activities Totals
Table 2Change in Net Position
Revenues:
Increase in net positionNet position - beginning of yearNet position - end of year
Program revenues:
General revenues:
Total expensesIncrease (decrease) in net position
Special item
6
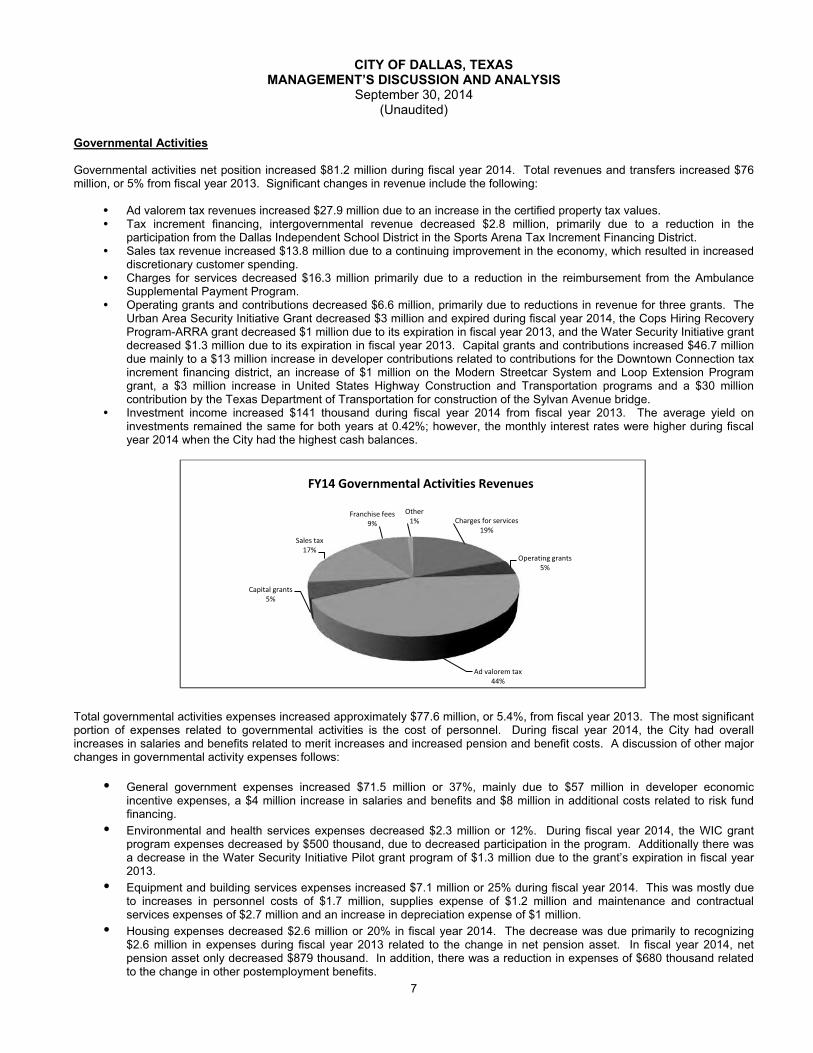
CITY OF DALLAS, TEXAS MANAGEMENT’S DISCUSSION AND ANALYSIS
September 30, 2014 (Unaudited)
Governmental Activities Governmental activities net position increased $81.2 million during fiscal year 2014. Total revenues and transfers increased $76 million, or 5% from fiscal year 2013. Significant changes in revenue include the following:
�� Ad valorem tax revenues increased $27.9 million due to an increase in the certified property tax values. � Tax increment financing, intergovernmental revenue decreased $2.8 million, primarily due to a reduction in the
participation from the Dallas Independent School District in the Sports Arena Tax Increment Financing District. � Sales tax revenue increased $13.8 million due to a continuing improvement in the economy, which resulted in increased
discretionary customer spending. � Charges for services decreased $16.3 million primarily due to a reduction in the reimbursement from the Ambulance
Supplemental Payment Program. � Operating grants and contributions decreased $6.6 million, primarily due to reductions in revenue for three grants. The
Urban Area Security Initiative Grant decreased $3 million and expired during fiscal year 2014, the Cops Hiring Recovery Program-ARRA grant decreased $1 million due to its expiration in fiscal year 2013, and the Water Security Initiative grant decreased $1.3 million due to its expiration in fiscal year 2013. Capital grants and contributions increased $46.7 million due mainly to a $13 million increase in developer contributions related to contributions for the Downtown Connection tax increment financing district, an increase of $1 million on the Modern Streetcar System and Loop Extension Program grant, a $3 million increase in United States Highway Construction and Transportation programs and a $30 million contribution by the Texas Department of Transportation for construction of the Sylvan Avenue bridge.
� Investment income increased $141 thousand during fiscal year 2014 from fiscal year 2013. The average yield on investments remained the same for both years at 0.42%; however, the monthly interest rates were higher during fiscal year 2014 when the City had the highest cash balances.
Total governmental activities expenses increased approximately $77.6 million, or 5.4%, from fiscal year 2013. The most significant portion of expenses related to governmental activities is the cost of personnel. During fiscal year 2014, the City had overall increases in salaries and benefits related to merit increases and increased pension and benefit costs. A discussion of other major changes in governmental activity expenses follows:
� General government expenses increased $71.5 million or 37%, mainly due to $57 million in developer economic incentive expenses, a $4 million increase in salaries and benefits and $8 million in additional costs related to risk fund financing.
� Environmental and health services expenses decreased $2.3 million or 12%. During fiscal year 2014, the WIC grant program expenses decreased by $500 thousand, due to decreased participation in the program. Additionally there was a decrease in the Water Security Initiative Pilot grant program of $1.3 million due to the grant’s expiration in fiscal year 2013.
� Equipment and building services expenses increased $7.1 million or 25% during fiscal year 2014. This was mostly due to increases in personnel costs of $1.7 million, supplies expense of $1.2 million and maintenance and contractual services expenses of $2.7 million and an increase in depreciation expense of $1 million.
� Housing expenses decreased $2.6 million or 20% in fiscal year 2014. The decrease was due primarily to recognizing $2.6 million in expenses during fiscal year 2013 related to the change in net pension asset. In fiscal year 2014, net pension asset only decreased $879 thousand. In addition, there was a reduction in expenses of $680 thousand related to the change in other postemployment benefits.
Charges for services 19%
Operating grants 5%
Ad valorem tax 44%
Capital grants 5%
Sales tax 17%
Franchise fees 9%
Other 1%
FY14 Governmental Activities Revenues
7

CITY OF DALLAS, TEXAS MANAGEMENT’S DISCUSSION AND ANALYSIS
September 30, 2014 (Unaudited)
Business-type Activities Business-type activities net position increased $113.5 million during fiscal year 2014. Total operating revenues increased $23.6 million from fiscal year 2013 and total revenues decreased $4.8 million from fiscal year 2013. Significant changes in revenues include the following:
�� During fiscal year 2014, airport operating revenues increased $12.5 million, due to higher rates and charges, which resulted in higher landing fees, rental and concession fees. Additionally, parking garage revenue increased due to the implementation of a higher parking rate in the later portion of fiscal year 2014. Capital grants and contributions decreased by $30.2 million, mostly due to contributions from airport tenants and other agencies decreasing from $24.5 million in fiscal year 2013 to $1.8 million in fiscal year 2014. Additionally, the capital grants were $7.5 million less in fiscal year 2014.
� During fiscal year 2014, Dallas Water Utilities customer charges increased $12.9 million from a 3.5% retail rate increase, offset by decreased consumption during the fiscal year due to more favorable weather conditions. Capital contributions declined due to decreases in amounts spent on construction by outside developers.
� Convention Center customer charges decreased $3.7 million from the previous fiscal year primarily from a change in the type of events held at the Dallas Convention Center Hotel and related event revenue. Major events held during the fiscal year included Great American Trucking Show, the American Heart Association Annual Scientific Sessions, the Mary Kay annual convention, the National Congress of Christian Education and the Lone Star Classic volleyball tournament. Hotel occupancy tax revenues increased $5.2 million during the fiscal year due to increased travel to the City of Dallas.
Total business-type activities expenses, including a special item, decreased by $9.6 million during the fiscal year. The following expense items contributed to changes in expenses during fiscal year 2014:
� Airport contractual services increased $2.3 million due to additional services related to the new gates opened in 2013 at Love Field with a full year of operations during 2014. Depreciation expense increased $4.4 million due to completed building renovations at the airport during 2013 with a full year of depreciation recorded in fiscal year 2014. During fiscal year 2013, the airport incurred a $22.1 million impairment of capital assets related to the renovations of the airport. During fiscal year 2014, a $6.4 million special item for the loss on impairment of airport property was recorded as a result of the stoppage of construction on the Love Field people mover connector, Love Field taxiway “M” reconstruction and extension and Love Field perimeter road airport.
� Dallas Water Utilities personnel services decreased $3 million due to an increase in capitalized labor related to construction in progress, which reduces salaries and benefits expense, as well as a decrease in expenses related to other post-employment benefits, offset by an increase in salaries and benefits due to merit increases. Supplies and materials expenses decreased $6.6 million primarily due to a decrease in chemical supplies and power expenses, related to a lower volume of pumpage and sales.
� Convention Center contractual services increased $1.4 million due mainly to increases in advertising expenses.
Financial Analysis of the Government’s Funds As noted earlier, the City uses fund accounting to ensure and demonstrate compliance with finance-related legal requirements.
General government 18%
Public safety 45%
Streets 13%
Public works 4%
Culture and recreation 9%
Other 6%
Interest 5%
FY14 Governmental Activities Expenses
8

CITY OF DALLAS, TEXAS MANAGEMENT’S DISCUSSION AND ANALYSIS
September 30, 2014 (Unaudited)
Governmental funds: The focus of the City’s governmental funds is to provide information on near-term inflows, outflows, and balances of spendable resources. Such information is useful in assessing the City’s financing requirements. In particular, unassigned fund balance may serve as a useful measure of a government’s net resources available for spending at the end of the fiscal year. As of the end of fiscal year 2014, the City’s governmental funds reported combined ending fund balance of $576.7 million, a decrease of $154.6 million in comparison with the prior fiscal year. Approximately $129 million constitutes unassigned fund balance, which is available for spending at the government’s discretion. The remainder of fund balance is nonspendable, restricted, committed, or assigned to indicate that it is not available for new spending because it is 1) nonspendable in form or required to be maintained intact; 2) restricted for a specific purpose by constitution, external resource providers, or through enabling legislation; 3) committed by a formal action of Council for a specific purpose; or 4) assigned and intended to be used by the government for a specific purpose for contracts and purchase orders of the prior period. The general fund is the chief operating fund of the City. At the end of fiscal year 2014, unassigned fund balance of the general fund was $129.2 million while total fund balance was $180.7 million. As a measure of the general fund’s liquidity, it may be useful to compare both unassigned fund balance and total fund balance to total fund expenditures. Unassigned fund balance represents 11.8% of total general fund expenditures and transfers out, while total fund balance represents 16.5% of that same amount. The City’s general fund balance increased $23.7 million during fiscal year 2014, primarily from increases in ad valorem revenue and sales tax revenue. Ad valorem tax revenue increased $28.9 million due to an increase in certified tax values. Sales tax revenue increased $13.8 million due to improvements in the economy. Services to others revenue increased $20.6 million due to a $17 million increase in reimbursements from Ambulance Supplemental Payment Program, a $1 million increase in reimbursements for services provided to other departments and a $1.5 million increase in sanitation collection fees. Transfers in increased $12.5 million due to an increase of $6.8 million in transfers from the Convention Center for the Sports Arena lease, an increase of $2.8 million in transfers for payment in lieu of taxes from Dallas Water Utilities and an increase of $2.8 million in transfers from the internal service funds for payments related to lease agreements. The increases in revenues and transfers in were offset by a $4 million increase in general government expenditures for salaries and benefits, as well as a $7.7 million increase in general government expenditures for payments to the risk fund. Public safety expenditures increased $27.8 million, due mainly to an increase in salaries and benefits of $13.9 million and a $13 million increase in contractual services related to professional services, contractor services, programming services, medical and laboratory fees, equipment and automobile services, data processing and equipment rental. Streets, street lighting, sanitation and code enforcement expenses increased $9.4 million, due primarily to an increase of $5.1 million in personnel services and $4 million in contractual services. The debt service fund had a total fund balance of $3.5 million at September 30, 2014 restricted for the payment of debt service. The decrease in the debt service fund balance during the current year of $2.5 million was primarily from a decrease in revenues, transfers in and bond proceeds of $38 million. This was offset by a decrease in payments to refunded bond escrow agent and debt service payments of $385.3 million. Proprietary funds: The City’s proprietary funds provide the same type of information found in the government-wide financial statements, but in more detail. Unrestricted net position in Dallas Water Utilities at the end of the year amounted to $204 million, Convention Center was $40 million and Airport Revenues was $95 million. The total change in net position was an increase of $119 million in Dallas Water Utilities, a decrease of $9 million in Convention Center and a decrease of $1 million in Airport Revenues Fund. Factors regarding the finances of these funds have already been addressed in the discussion of the City’s business-type activities. General Fund Budgetary Highlights During the fiscal year, the final amended revenue budget including interfund transfers in increased $12.2 million over the original budget, primarily due to an increase in sales tax of $5.9 million, an increase of $1.9 million in services to others, an increase of $2 million in other tax and franchise revenues and an increase of $2.3 million from transfers in. Final budgeted expenditures and interfund transfers out increased $12.2 million over the original expense budget. This was primarily due to increases in expenses related to the Dallas Police Department of $2.5 million, the Dallas Fire Department of $2.7 million, Building Services of $2.4 million. Additionally, transfers out increased $7.9 million. These increases were offset by a decrease in non-departmental expenditures of $3.5 million and a reduction in street lighting expenditures of $1 million.
9
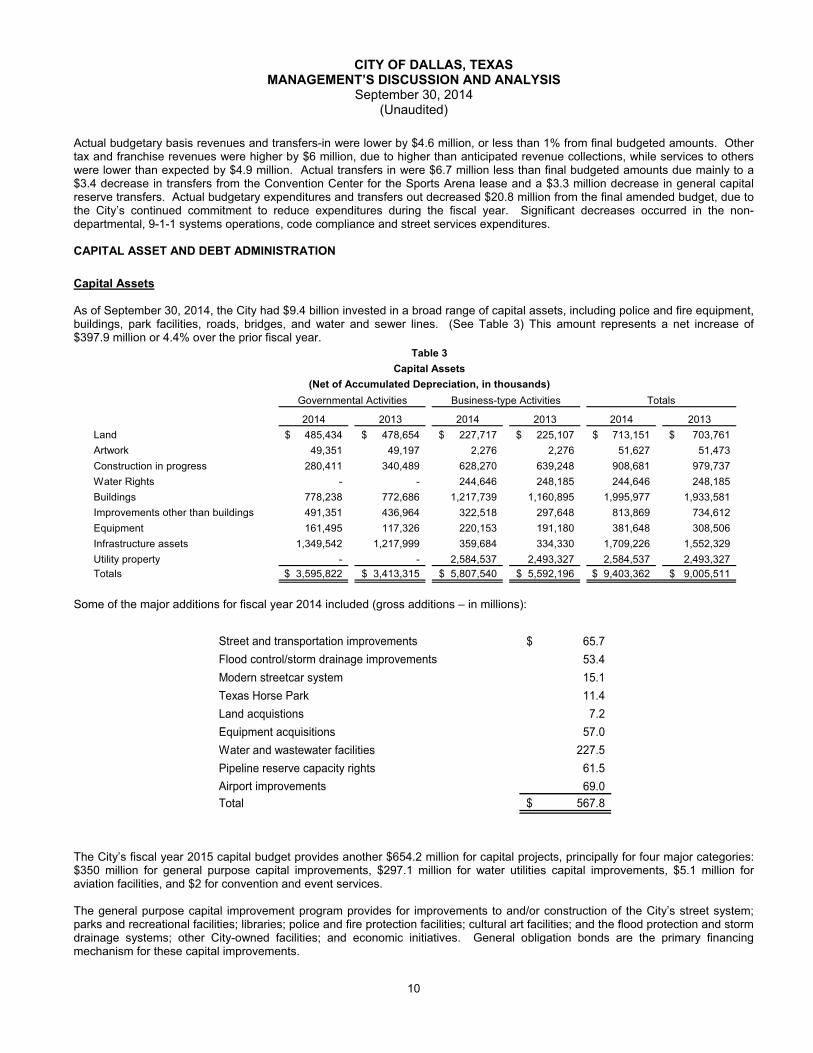
CITY OF DALLAS, TEXAS MANAGEMENT’S DISCUSSION AND ANALYSIS
September 30, 2014 (Unaudited)
Actual budgetary basis revenues and transfers-in were lower by $4.6 million, or less than 1% from final budgeted amounts. Other tax and franchise revenues were higher by $6 million, due to higher than anticipated revenue collections, while services to others were lower than expected by $4.9 million. Actual transfers in were $6.7 million less than final budgeted amounts due mainly to a $3.4 decrease in transfers from the Convention Center for the Sports Arena lease and a $3.3 million decrease in general capital reserve transfers. Actual budgetary expenditures and transfers out decreased $20.8 million from the final amended budget, due to the City’s continued commitment to reduce expenditures during the fiscal year. Significant decreases occurred in the non-departmental, 9-1-1 systems operations, code compliance and street services expenditures. CAPITAL ASSET AND DEBT ADMINISTRATION Capital Assets As of September 30, 2014, the City had $9.4 billion invested in a broad range of capital assets, including police and fire equipment, buildings, park facilities, roads, bridges, and water and sewer lines. (See Table 3) This amount represents a net increase of $397.9 million or 4.4% over the prior fiscal year.
2014 2013 2014 2013 2014 2013Land 485,434$ 478,654$ 227,717$ 225,107$ 713,151$ 703,761$ Artwork 49,351 49,197 2,276 2,276 51,627 51,473 Construction in progress 280,411 340,489 628,270 639,248 908,681 979,737 Water Rights - - 244,646 248,185 244,646 248,185 Buildings 778,238 772,686 1,217,739 1,160,895 1,995,977 1,933,581 Improvements other than buildings 491,351 436,964 322,518 297,648 813,869 734,612 Equipment 161,495 117,326 220,153 191,180 381,648 308,506 Infrastructure assets 1,349,542 1,217,999 359,684 334,330 1,709,226 1,552,329 Utility property - - 2,584,537 2,493,327 2,584,537 2,493,327 Totals 3,595,822$ 3,413,315$ 5,807,540$ 5,592,196$ 9,403,362$ 9,005,511$
Governmental Activities Business-type Activities Totals
Table 3Capital Assets
(Net of Accumulated Depreciation, in thousands)
Some of the major additions for fiscal year 2014 included (gross additions – in millions):
Street and transportation improvements 65.7$ Flood control/storm drainage improvements 53.4 Modern streetcar system 15.1 Texas Horse Park 11.4 Land acquistions 7.2 Equipment acquisitions 57.0 Water and wastewater facilities 227.5 Pipeline reserve capacity rights 61.5 Airport improvements 69.0 Total 567.8$
The City’s fiscal year 2015 capital budget provides another $654.2 million for capital projects, principally for four major categories: $350 million for general purpose capital improvements, $297.1 million for water utilities capital improvements, $5.1 million for aviation facilities, and $2 for convention and event services. The general purpose capital improvement program provides for improvements to and/or construction of the City’s street system; parks and recreational facilities; libraries; police and fire protection facilities; cultural art facilities; and the flood protection and storm drainage systems; other City-owned facilities; and economic initiatives. General obligation bonds are the primary financing mechanism for these capital improvements.
10

CITY OF DALLAS, TEXAS MANAGEMENT’S DISCUSSION AND ANALYSIS
September 30, 2014 (Unaudited)
The capital improvement program for the enterprise funds consists primarily of improvements to and/or construction of water and wastewater systems, venues for convention activities, and air transportation facilities. The transfer of enterprise revenues and the issuance of debt such as commercial paper and/or revenue bonds fund these projects. More detailed information about the City’s capital assets is presented in Note 7 to the financial statements. Debt At fiscal year-end, the City had $4.5 billion in bonds, an obligation for revenue credit agreement (including accrued unpaid interest), and water transmission facilities financing agreement outstanding for both governmental and business-type activities, as shown in Table 4.
2014 2013 2014 2013 2014 2013General obligation bonds 1,235,765$ 1,352,940$ -$ -$ 1,235,765$ 1,352,940$ Equipment acquisition obligations 4,685 9,375 - - 4,685 9,375 Certificates of obligation 24,250 33,725 - - 24,250 33,725 Pension obligation bonds 211,047 220,472 71,480 74,672 282,527 295,144 Revenue bonds - - 2,229,253 2,322,438 2,229,253 2,322,438 Water transmission facilities financing agreement - - 328,115 129,005 328,115 129,005 Obligation for revenue credit agreement - - 446,095 442,074 446,095 442,074 Total 1,475,747$ 1,616,512$ 3,074,943$ 2,968,189$ 4,550,690$ 4,584,701$
Governmental Activities Business-type Activities Totals
Table 4Outstanding Debt at Fiscal Year-end (in thousands)
Bond proceeds for governmental activities will be used to pay costs of various equipment purchases, street systems, playgrounds, recreation facilities, library facilities, and other City infrastructure and facilities. The City’s General Obligation, General Obligation Pension Bonds, Waterworks and Sewer System, Civic Center Convention Complex, and Dallas Convention Center Development Corp Bond underlying ratings are listed below.
Moody's Investors Service
Standard & Poor's
Aa1 AA+Aa1 AA+
Waterworks and Sewer System……………………….. Aa1 AAACivic Center Convention Complex…………………….. A1 A
A1 A+
General Obligation Bonds…………………………………General Obligation Pension Bonds………………………Revenue Bonds:
Dallas Convention Center Development Corp…………..
More detailed information about the City’s long-term liabilities is presented in Note 10 to the financial statements. ECONOMIC FACTORS AND NEXT YEAR’S BUDGETS AND RATES The Dallas City Council has identified key focus areas – Public Safety; Economic Vibrancy; Clean, Healthy Environment; Culture, Arts and Recreation; Educational Enhancements; and E3 Government, that is an efficient, effective, economical government. Property values increased 4.3 percent during the current fiscal year from $83.7 billion to $87.3 billion. The adopted fiscal year 2014-15 tax rate of $79.70 per $100 valuation will remain the same as the fiscal year 2013-2014 adopted tax rate and most fees will not be increased. The fiscal year 2014-15 budget of $2.8 billion is balanced, utilizing various cost containment strategies, revenue enhancements, and operational efficiencies.
11

CITY OF DALLAS, TEXAS MANAGEMENT’S DISCUSSION AND ANALYSIS
September 30, 2014 (Unaudited)
With the multitude of water challenges across Texas, the City will continue to focus on maintaining infrastructure, conserving resources, and providing for future needs through replacement of 9,000 miles of aged water and wastewater mains; improvements at water treatment plants to improve reliability and water quality as well as increase capacity; continued water conservation efforts; and the Tarrant Regional Water District integrated pipeline project to connect Lake Palestine to Dallas’ water supply system to meet future needs. In order to achieve these goals, it is necessary to implement a water and wastewater rate increase of 3.5% for retail revenue and 2.2% for wholesale revenue. While the Texas economy churns on a path of expansion, the City continues its post-recession stabilization and is experiencing areas of measured economic growth. The City’s unemployment rate of 5.9% is below the national average of 6.5% and existing home sales and housing starts are increasing. Although this period of growth is expected to continue, the City maintains a cautionary approach, realizing that a world event could slow or moderate expansion in the Dallas economy during the next 12 months. The Mayor, City Council and City management have worked diligently over the past six years to offset the economic effects of the global recession by operating with the City’s resources; establishing priorities; focusing on core services; finding operational efficiencies and positioning the City for recovery. Key revenue resources are recovering, and there is encouraging news in the numbers. Property tax revenue is the single largest revenue source and accounts for 43% of General fund revenue. Fiscal year 2015 will mark the third consecutive year of growth, with values increasing 6.75%, which amounts to approximately $46.9 million in additional revenue. Guiding principles includes the following:
�� Improve the vitality of our neighborhoods; � Maintain our momentum in public safety; and � Restore previously reduced services.
Development goals include the following:
� Initiate comprehensive planning to address infrastructure needs regarding streets, drainage, alleys, signal lights and buildings.
� Identify efficiency opportunities within public safety such as civilianization in the Dallas Police Department and Community Paramedics approach in Dallas Fire-Rescue.
� Expand opportunities for economic development through public-private partnerships and continue to grow the tax base. � Reimagine our approach to housing by focusing on neighborhood sustainability and approaching this issue holistically.
CONTACTING THE CITY’S FINANCIAL MANAGEMENT The financial report is designed to provide our citizens, taxpayers, customers, investors and creditors with a general overview of the City’s finances and to show the City’s accountability for the money it receives. If you have questions about this report or need any additional financial information, contact the City Controller’s Office, at City of Dallas, 1500 Marilla, Room 2BS, Dallas, Texas 75201.
12
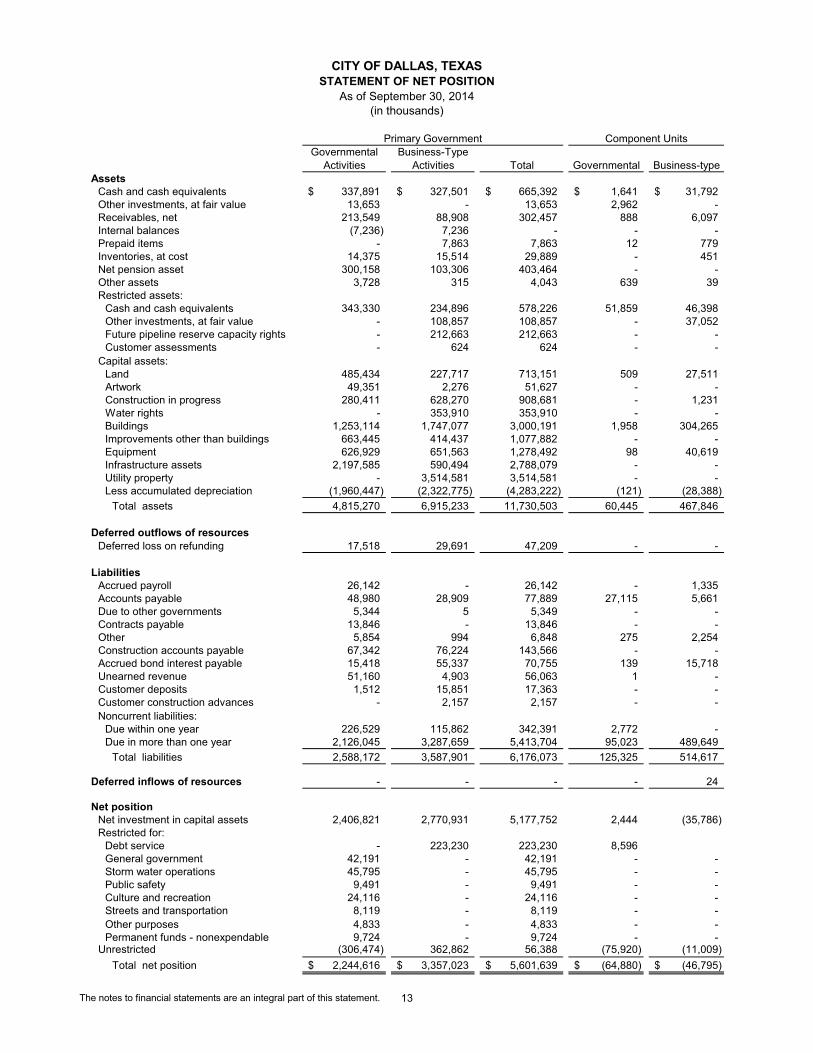
Governmental Business-TypeActivities Activities Total Governmental Business-type
AssetsCash and cash equivalents 337,891$ 327,501$ 665,392$ 1,641$ 31,792$ Other investments, at fair value 13,653 - 13,653 2,962 - Receivables, net 213,549 88,908 302,457 888 6,097 Internal balances (7,236) 7,236 - - - Prepaid items - 7,863 7,863 12 779 Inventories, at cost 14,375 15,514 29,889 - 451 Net pension asset 300,158 103,306 403,464 - - Other assets 3,728 315 4,043 639 39 Restricted assets:
Cash and cash equivalents 343,330 234,896 578,226 51,859 46,398 Other investments, at fair value - 108,857 108,857 - 37,052 Future pipeline reserve capacity rights - 212,663 212,663 - - Customer assessments - 624 624 - -
Capital assets:Land 485,434 227,717 713,151 509 27,511 Artwork 49,351 2,276 51,627 - - Construction in progress 280,411 628,270 908,681 - 1,231 Water rights - 353,910 353,910 - - Buildings 1,253,114 1,747,077 3,000,191 1,958 304,265 Improvements other than buildings 663,445 414,437 1,077,882 - - Equipment 626,929 651,563 1,278,492 98 40,619 Infrastructure assets 2,197,585 590,494 2,788,079 - - Utility property - 3,514,581 3,514,581 - - Less accumulated depreciation (1,960,447) (2,322,775) (4,283,222) (121) (28,388)
Total assets 4,815,270 6,915,233 11,730,503 60,445 467,846
Deferred outflows of resourcesDeferred loss on refunding 17,518 29,691 47,209 - -
LiabilitiesAccrued payroll 26,142 - 26,142 - 1,335 Accounts payable 48,980 28,909 77,889 27,115 5,661 Due to other governments 5,344 5 5,349 - - Contracts payable 13,846 - 13,846 - - Other 5,854 994 6,848 275 2,254 Construction accounts payable 67,342 76,224 143,566 - - Accrued bond interest payable 15,418 55,337 70,755 139 15,718 Unearned revenue 51,160 4,903 56,063 1 - Customer deposits 1,512 15,851 17,363 - - Customer construction advances - 2,157 2,157 - - Noncurrent liabilities:
Due within one year 226,529 115,862 342,391 2,772 - Due in more than one year 2,126,045 3,287,659 5,413,704 95,023 489,649
Total liabilities 2,588,172 3,587,901 6,176,073 125,325 514,617
Deferred inflows of resources - - - - 24
Net positionNet investment in capital assets 2,406,821 2,770,931 5,177,752 2,444 (35,786) Restricted for:
Debt service - 223,230 223,230 8,596 General government 42,191 - 42,191 - - Storm water operations 45,795 - 45,795 - - Public safety 9,491 - 9,491 - - Culture and recreation 24,116 - 24,116 - - Streets and transportation 8,119 - 8,119 - - Other purposes 4,833 - 4,833 - - Permanent funds - nonexpendable 9,724 - 9,724 - -
Unrestricted (306,474) 362,862 56,388 (75,920) (11,009) Total net position 2,244,616$ 3,357,023$ 5,601,639$ (64,880)$ (46,795)$
Primary Government Component Units
CITY OF DALLAS, TEXASSTATEMENT OF NET POSITION
As of September 30, 2014(in thousands)
The notes to financial statements are an integral part of this statement.
13

Operating Capital Charges for Grants and Grants and
Expenses Services Contributions ContributionsFunction/Program Activities
Primary Government:Governmental activities:
General government 263,147$ 100,673$ 12,718$ 29,123$ Public safety 684,808 59,061 11,896 85 Streets, street lighting, sanitation and code enforcement 192,981 102,621 2,342 613 Environmental and health services 16,747 - 15,924 - Public works and transportation 62,168 13,143 336 52,930 Equipment and building services 35,369 882 - - Culture and recreation 142,519 21,021 1,362 2,967 Housing 10,367 2,234 1,000 - Human services 24,006 146 25,357 - Interest on long-term debt 75,133 - - -
Total governmental activities 1,507,245 299,781 70,935 85,718
Business-type activities:Dallas water utilities 429,034 564,546 - 4,267 Convention center 90,377 24,207 5,161 - Airport revenues 91,807 84,426 538 12,319 Municipal radio 2,047 1,908 - - Building inspection 23,647 28,208 - -
Total business-type activities 636,912 703,295 5,699 16,586
Total primary government 2,144,157 1,003,076 76,634 102,304
Component units:Governmental 33,981 2,005 - - Business-type 103,507 85,322 7,816 -
Total component units 137,488 87,327 7,816 -
General revenues:Ad valorem taxTax increment financing, intergovernmental revenueSales taxesFranchise feesHotel occupancy taxAlcohol beverage taxInvestment incomeOther
TransfersSpecial item: loss on impairment of airport propertyTotal general revenues and transfers
Change in net position
Net position, beginning of year (governmental component unit restated - see note 20)
Net position, end of year
CITY OF DALLAS, TEXASSTATEMENT OF ACTIVITIES
Year Ended September 30, 2014(in thousands)
Program Revenues
The notes to financial statements are an integral part of this statement. 14

Governmental Business-TypeActivities Activities Total Governmental Business-type
(120,633)$ -$ (120,633)$ -$ -$ (613,766) - (613,766) - - (87,405) - (87,405) - -
(823) - (823) - - 4,241 - 4,241 - -
(34,487) - (34,487) - - (117,169) - (117,169) - -
(7,133) - (7,133) - - 1,497 - 1,497 - -
(75,133) - (75,133) - -
(1,050,811) - (1,050,811) - -
- 139,779 139,779 - - - (61,009) (61,009) - - - 5,476 5,476 - - - (139) (139) - - - 4,561 4,561 - - - 88,668 88,668 - -
(1,050,811) 88,668 (962,143) - -
(31,976) -
- (10,369) (31,976) (10,369)
687,573 - 687,573 - - 4,108 - 4,108 13,430 -
257,467 - 257,467 - - 136,951 - 136,951 - -
- 50,374 50,374 - - - 10,256 10,256 - -
2,667 2,416 5,083 4 1,103 11,235 208 11,443 (251) 8,866 32,008 (32,008) - - -
- (6,372) (6,372) - - 1,132,009 24,874 1,156,883 13,183 9,969
81,198 113,542 194,740 (18,793) (400)
2,163,418 3,243,481 5,406,899 (46,087) (46,395)
2,244,616$ 3,357,023$ 5,601,639$ (64,880)$ (46,795)$
Net (Expense) Revenue and Changes in Net PositionPrimary Government
Component Units
15

General Debt Service
Nonmajor Governmental
Funds
Total Governmental
Funds Assets
Pooled cash and cash equivalents 152,920$ 3,060$ 131,181$ 287,161$ Other investments, at fair value - - 13,653 13,653 Receivables:
Ad valorem tax 28,179 12,511 - 40,690 Sales tax 43,892 - - 43,892 Notes 98 - 60,021 60,119 Accounts 93,314 - 48,169 141,483 Accrued interest 145 3 552 700 Allowance for uncollectible accounts (54,976) (10,695) (33,136) (98,807)
Due from other governments - - 19,917 19,917 Due from other funds 5,646 - - 5,646 Prepaid items - - 1,018 1,018 Inventories, at cost 10,044 - - 10,044 Special assessments-paving notes - - 5,419 5,419 Restricted cash and cash equivalents - - 343,330 343,330 Notes receivable from other funds - - 4,161 4,161
Total assets 279,262 4,879 594,285 878,426
Liabilities, deferred inflows, and fund balances
LiabilitiesAccrued payroll 26,124 - 18 26,142 Accounts payable 27,261 - 13,501 40,762 Due to other funds 268 - 6,113 6,381 Unearned revenue 6,702 - 44,848 51,550 Due to other governments 3,218 - 2,126 5,344 Construction accounts payable - - 67,342 67,342 Notes payable to other funds - - 10,674 10,674 Customer deposits 1,491 - 21 1,512 Contracts payable - - 13,846 13,846 Other 1,426 - 2,549 3,975
Total liabilities 66,490 - 161,038 227,528
Deferred inflows of resourcesUnavailable revenue 32,098 1,387 40,694 74,179
Fund balancesNonspendable 10,044 - 13,885 23,929 Restricted 11,236 3,492 364,127 378,855 Committed 1,250 - 14,541 15,791 Assigned 28,905 - - 28,905 Unassigned 129,239 - - 129,239
Total fund balance 180,674 3,492 392,553 576,719 Total liabilities, deferred inflows, and fund balance 279,262$ 4,879$ 594,285$ 878,426$
(in thousands)
CITY OF DALLAS, TEXASBALANCE SHEET
GOVERNMENTAL FUNDSAs of September 30, 2014
The notes to financial statements are an integral part of this statement. 16

Total fund balances - governmental funds 576,719$
Amounts reported for governmental activities in the statement of net position are different because:
Net pension assets are not financial resources and therefore are not reportedin the funds. These are:
Net Pension Asset 300,158
Capital assets used in governmental activities are not financial resources and therefore are not reported in the funds. These assets consist of:
Land 483,738 Artwork 49,351 Construction in progress 280,411 Infrastructure assets 2,195,763 Buildings 1,248,679 Improvements other than buildings 662,456 Equipment 493,093 Accumulated depreciation (1,835,059) Total capital assets 3,578,432
Deferred outflows represent a consumption of net position that applies to future periods and therefore will not be recognized as an outlfow of resources until then. The amount is deferred 17,518 and amortized over the shorter of the life of the refunded or refunding debt.
Other long-term assets are not available to pay for current period expenditures and, therefore,are reported as unavailable revenue in the funds. 74,179
Internal service funds are used by management to charge the costs of certain activities,such as equipment services, communication equipment services, office services,information services, and insurance. The assets and liabilities of the internal servicefunds are included in the governmental activities in the statement of net position (9,759)
A portion of unearned revenue represents funds received in advance for Section 108 loansthat have not been loaned to developers. 390
Some long-term liabilities are not due and payable in the current period and therefore are not reported in the funds. Those liabilities consist of:
Bonds payable, plus unamortized bond premium and accretion 1,754,337 Capital leases 26,991 Accrued interest on bonds and notes 15,418 Developer payable 56,057 Notes payable 58,877 Compensated absences 117,255 Sales tax refund 10,901 Other postemployment benefits 185,393 Pollution remediation 5,449 Net pension obligation - police and fire 27,769 Landfill closure & post-closure 34,574 Total long-term liabilities (2,293,021)
Net position of governmental activities 2,244,616$
CITY OF DALLAS, TEXASRECONCILIATION OF THE BALANCE SHEET
OF GOVERNMENTAL FUNDS TO THE STATEMENT OF NET POSITIONAs of September 30, 2014
(in thousands)
The notes to financial statements are an integral part of this statement. 17

General Debt Service
Nonmajor Governmental
Funds Total Revenues:
Ad valorem tax 466,363$ 197,419$ 24,109$ 687,891$ Tax increment financing, intergovernmental - - 4,108 4,108 Sales tax 257,467 - - 257,467 Franchise fees 136,951 - - 136,951 Licenses and permits 6,232 - - 6,232 Intergovernmental 8,203 - 91,123 99,326 Service to others 189,321 - 66,676 255,997 Fines and forfeitures 25,278 - 8,801 34,079 Investment income 468 50 2,024 2,542 Contributions and gifts 40 - 32,017 32,057 Confiscated money awards - - 3,493 3,493 Other 5,204 1,396 1,071 7,671
Total revenues 1,095,527 198,865 233,422 1,527,814
Current expenditures:General government 98,928 - 128,267 227,195 Public safety 647,591 - 9,350 656,941 Streets,street lighting,sanitation and code enforcement 172,427 - 3,426 175,853 Environmental and health services - - 16,662 16,662 Public works and transportation 6,121 - 13,346 19,467 Equipment and building services 25,604 - 44 25,648 Culture and recreation 111,570 - 8,628 120,198 Housing 10,290 - - 10,290 Human services - - 20,741 20,741
Debt service:Principal 6,412 140,765 - 147,177 Interest and fiscal charges 1,153 77,840 263 79,256
Capital outlay 11,787 - 253,475 265,262 Total expenditures 1,091,883 218,605 454,202 1,764,690
Excess (deficiency) of revenues over (under) expenditures 3,644 (19,740) (220,780) (236,876)
Other financing sources (uses): Transfers in 22,065 17,240 17,717 57,022 Transfers out (5,961) - (12,686) (18,647) Proceeds from sale of capital assets 260 - 1,978 2,238 Capital lease 3,661 - 9,772 13,433 Proceeds from notes issued - - 28,183 28,183
Total other financing sources (uses) 20,025 17,240 44,964 82,229
Net change in fund balances 23,669 (2,500) (175,816) (154,647)
Fund balances, beginning of year 157,005 5,992 568,369 731,366 Fund balances, end of year 180,674$ 3,492$ 392,553$ 576,719$
(in thousands)
CITY OF DALLAS, TEXASSTATEMENT OF REVENUES, EXPENDITURES, AND CHANGES IN FUND BALANCES
GOVERNMENTAL FUNDSYear Ended September 30, 2014
The notes to finanical statements are an integral part of this statement. 18

Net change in fund balances--total governmental funds (154,647)$
Amounts reported for governmental activities in the statement of activities aredifferent because:
statement of activities, the cost of those assets is allocated over theirestimated useful lives as depreciation expense. This is the amount bywhich capital outlays exceeded depreciation in the current period.
Capital outlay 265,262 Capital contributions 30,701 Depreciation expense (105,761) Net adjustment 190,202
Governmental funds only report the disposal of capital assets to the extent proceeds are received from the sale. In the statement of activities, a gain or loss is reported for each disposal. Proceeds from sale of capital assets (2,238) Gain on disposal of capital assets (1,187)
(3,425) Revenues in the statement of activities that do not provide current financialresources are not reported as revenues in the funds. This adjustment is to recognizethe net change in “unavailable” revenues. (19,159)
The issuance of long-term debt (e.g., bonds, certificates of obligation) providescurrent financial resources to governmental funds, but issuing debt increaseslong-term liabilities in the statement of net position. Repayment of long-termdebt principal is an expenditure in the governmental funds, but the repaymentreduces long-term liabilities in the statement of net position. Also, governmentalfunds report the effect of issuance costs, premiums, discounts, and similaritems when debt is first issued, whereas these amounts are deferred andamortized in the statement of activities. This amount is the net effect of thesedifferences in the treatment of long-term debt and related items.
Debt issued:Commercial paper notes payable (26,475) Notes payable (1,708) Capital leases (13,433)
Repayments:Capital lease principal payment 4,179 Sales tax refund liability 1,292 Note principal payment 941 Bond principal payments 140,765
Net adjustment 105,561
Some expenses reported in the statement of activities do not require the useof current financial resources and therefore are not reported as expendituresin governmental funds.
Increase in accrued interest payable (1,003) Amortization of premium, discount and refunding deferral 14,153 Accretion on capital appreciation bonds (9,027) Decrease in net pension asset (7,986) Increase in net pension obligation - police and fire (6,046) Increase in other postemployment benefits (18,109) Decrease in pollution remediation liability 2,929 Increase in compensated absences (1,293) Increase in landfill closure cost (1,380) Increase in developer payable (20,514)
Total adjustment (48,276)
Internal service funds are used by management to charge the costs of certainactivities, such as fleet management, insurance, compensated absences andcomputer replacement, to individual funds. The external revenue generated by thesefunds (interest income and gain on sale of equipment) is reported with the governmental activities. 10,942
Change in net position of governmental activities 81,198$
The notes to financial statements are an integral part of this statement.
Governmental funds report capital outlays as expenditures. However, in the
(in thousands)
CITY OF DALLAS, TEXASRECONCILIATION OF THE STATEMENT OF REVENUES, EXPENDITURES AND CHANGES IN
FUND BALANCES OF GOVERNMENTAL FUNDS TO THE STATEMENT OF ACTIVITIESYear Ended September 30, 2014
19

Actual Variance withAmounts Final Budget-
(Budgetary PositiveOriginal Final Basis) (Negative)
Revenues:Ad valorem tax 483,898$ 483,898$ 483,297$ (601)$ Sales tax 249,565 255,519 255,716 197 Other tax and franchise revenues 125,468 127,468 133,499 6,031 Licenses and permits 9,090 9,090 9,761 671 Intergovernmental 6,203 6,203 6,861 658 Services to others 171,832 173,711 168,790 (4,921) Fines and forfeitures 33,227 33,227 32,848 (379) Investment income 632 632 551 (81) Miscellaneous revenue 11,109 11,109 11,638 529
Total revenues 1,091,024 1,100,857 1,102,961 2,104
Expenditures:General government
City attorney's office 13,920 14,456 14,355 101 City auditor's office 2,391 2,391 2,371 20 Office of financial services 2,886 2,826 2,480 346 Independent audit 919 919 919 - Dallas central appraisal district 3,345 3,345 3,337 8 Dallas county tax collection 532 534 534 - Non-departmental 38,059 34,577 32,777 1,800 City controller's office 4,471 4,471 4,309 162 City manager's office 1,559 1,671 1,670 1 Municipal court - Judiciary 3,528 3,528 3,086 442 Court and detention services 11,400 11,325 10,860 465 Jail contract-Lew Sterrett 8,714 8,714 8,714 - Civil service 2,126 2,126 1,876 250 Sustainable development and construction 1,788 1,613 1,480 133 Office of economic development 1,122 1,122 1,120 2 Mayor and city council 3,911 3,911 3,748 163 Office of management services 5,968 5,568 5,541 27 Human resources 4,080 4,121 3,895 226 Business development and procurement services 2,655 2,655 2,487 168 Elections 1,096 1,096 1,047 49 City secretary's office 1,783 1,848 1,779 69
Total general government 116,253 112,817 108,385 4,432
Public safety Dallas police department 426,401 428,943 428,306 637 Dallas fire department 219,029 221,718 221,469 249 9-1-1 systems operations 19,758 19,758 10,386 9,372
Total public safety 665,188 670,419 660,161 10,258
Streets, street lighting, sanitation and code enforcementCode compliance 33,720 33,720 32,397 1,323 Sanitation services 74,399 74,797 74,743 54 Street services 61,742 61,742 60,147 1,595 Street lighting 19,201 18,201 17,390 811
Total streets, street lighting, sanitation and code enforcement 189,062 188,460 184,677 3,783
Public works and transportation 7,121 7,121 6,979 142
continued
CITY OF DALLAS, TEXASGENERAL FUND STATEMENT OF REVENUES, EXPENDITURES AND CHANGES
IN FUND BALANCES-NON-GAAP BUDGETARY BASISYear Ended September 30, 2014
(in thousands)
Budgeted Amounts
The notes to finanical statements are an integral part of this statement. 20
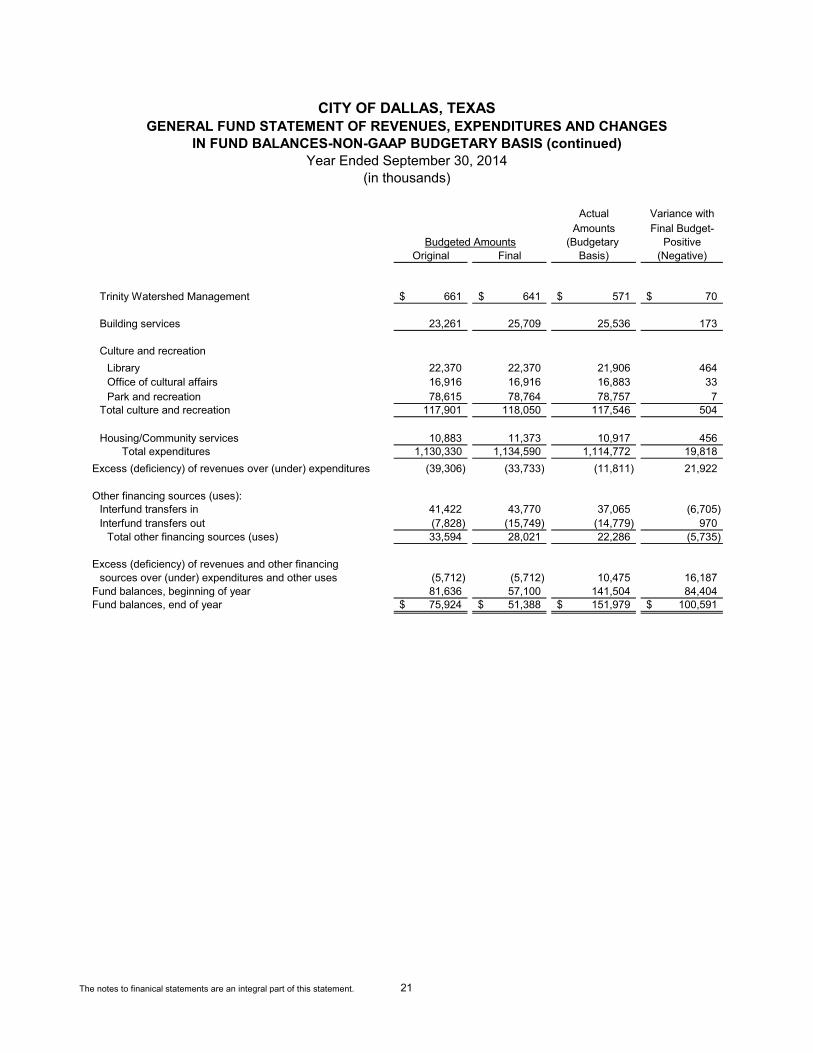
Actual Variance withAmounts Final Budget-
(Budgetary PositiveOriginal Final Basis) (Negative)
Trinity Watershed Management 661$ 641$ 571$ 70$
Building services 23,261 25,709 25,536 173
Culture and recreationLibrary 22,370 22,370 21,906 464 Office of cultural affairs 16,916 16,916 16,883 33 Park and recreation 78,615 78,764 78,757 7
Total culture and recreation 117,901 118,050 117,546 504
Housing/Community services 10,883 11,373 10,917 456 Total expenditures 1,130,330 1,134,590 1,114,772 19,818 Excess (deficiency) of revenues over (under) expenditures (39,306) (33,733) (11,811) 21,922
Other financing sources (uses):Interfund transfers in 41,422 43,770 37,065 (6,705) Interfund transfers out (7,828) (15,749) (14,779) 970
Total other financing sources (uses) 33,594 28,021 22,286 (5,735)
Excess (deficiency) of revenues and other financingsources over (under) expenditures and other uses (5,712) (5,712) 10,475 16,187
Fund balances, beginning of year 81,636 57,100 141,504 84,404 Fund balances, end of year 75,924$ 51,388$ 151,979$ 100,591$
Budgeted Amounts
CITY OF DALLAS, TEXASGENERAL FUND STATEMENT OF REVENUES, EXPENDITURES AND CHANGES
IN FUND BALANCES-NON-GAAP BUDGETARY BASIS (continued)Year Ended September 30, 2014
(in thousands)
The notes to finanical statements are an integral part of this statement. 21

Business-type Activities Enterprise Funds
GovernmentalDallas Nonmajor Activities-Water Convention Airport Enterprise InternalUtilities Center Revenues Funds Total Service Funds
AssetsCurrent assets:
Pooled cash and cash equivalents 147,384$ 36,796$ 103,698$ 39,623$ 327,501$ 50,730$ Receivables:
Accounts 73,142 3,739 4,730 519 82,130 89 Taxes - 6,777 - - 6,777 - Accrued interest 437 67 82 41 627 47 Allowance for uncollectibles (10,108) (636) (1) (2) (10,747) -
Due from other governments - - 10,121 - 10,121 - Due from other funds 352 371 - - 723 12 Prepaid items 5,563 - 2,300 - 7,863 875 Inventories, at cost 14,099 488 927 - 15,514 4,331 Restricted assets:
Customer assessments 624 - - - 624 - Pooled cash and cash equivalents
for current debt service 138,229 3,477 - - 141,706 - Cash and cash equivalents
Held for construction purposes 31,373 12,212 - - 43,585 - Customer deposits:
Pooled cash and cash equivalents 13,197 - - - 13,197 - Other 315 - - - 315 1,835
Total current assets 414,607 63,291 121,857 40,181 639,936 57,919
Noncurrent assets:Capital Assets:
Land 91,000 82,728 53,089 900 227,717 1,696 Artwork - - 2,276 - 2,276 - Construction in progress 549,230 16,255 62,483 302 628,270 - Water rights 353,910 - - - 353,910 - Buildings 524,418 576,445 645,877 337 1,747,077 4,435 Improvements other than buildings 80,068 64,133 269,963 273 414,437 989 Infrastructure assets 576,346 9,252 4,896 - 590,494 1,822 Equipment 542,013 41,670 64,072 3,808 651,563 133,836 Utility property 3,514,581 - - - 3,514,581 - Accumulated depreciation (1,840,715) (282,372) (195,780) (3,908) (2,322,775) (125,388)
Total capital assets 4,390,851 508,111 906,876 1,712 5,807,550 17,390
Other noncurrent assets:Restricted assets: Future pipeline reserve capacity rights 212,663 - - - 212,663 -
Held for construction purposes:LFAMC cash and cash equivalents - - 5,541 - 5,541 -
Pooled cash and cash equivalentsfor future debt service 8,446 4,325 3,324 - 16,095 -
Other investmentsfor future debt service at fair value 89,932 18,925 - - 108,857 -
Cash and cash equivalents held by escrow agent 14,772 - - - 14,772 - Notes receivable from other funds 6,513 - - - 6,513 - Net pension asset 76,688 5,485 7,176 13,957 103,306 -
Total other noncurrent assets 409,014 28,735 16,041 13,957 467,747 - Total noncurrent assets 4,799,865 536,846 922,917 15,669 6,275,297 17,390
Total assets 5,214,472$ 600,137$ 1,044,774$ 55,850$ 6,915,233$ 75,309$
Deferred outflows of resourcesDeferred loss on refunding 22,496 7,123 24 48 29,691 -
(in thousands)
CITY OF DALLAS, TEXASSTATEMENT OF NET POSITION
PROPRIETARY FUNDSAs of September 30, 2014
The notes to financial statements are an integral part of this statement. 22

Business-type Activities Enterprise Funds Governmental
Dallas Nonmajor Activities-Water Convention Airport Enterprise InternalUtilities Center Revenues Funds Total Service Funds
Liabilities Current liabilities:
Accounts payable 13,345$ 6,359$ 8,881$ 324$ 28,909$ 8,218$ Compensated absences 4,971 321 625 975 6,892 1,841 Due to other governments - 5 - - 5 - Unearned revenue - 612 942 3,349 4,903 - Estimated unpaid health claims - - - - - 5,733 Estimated unpaid claims - general - - - - - 4,597 Workers' compensation - - - - - 8,246 Accrued interest on bonds and notes 225 16 1 41 283 - Pension obligation bonds 1,622 116 152 295 2,185 - Pollution remediation - - 15 - 15 - Notes payable - 1,944 256 - 2,200 - Other - - - 994 994 1,879
Total current liabilities 20,163 9,373 10,872 5,978 46,386 30,514
Current liabilities (payable from restricted assets):Construction accounts payable 57,773 2,786 15,665 - 76,224 - Accrued interest payable 43,428 2,012 9,614 - 55,054 - Water transmission facilities financing agreement 5,385 - - - 5,385 - Revenue bonds 94,545 4,640 - - 99,185 - Total current liabilities (payable from
restricted assets) 201,131 9,438 25,279 - 235,848 - Total current liabilities 221,294 18,811 36,151 5,978 282,234 30,514
Noncurrent liabilities:Notes payable - 1,981 527 - 2,508 - Commercial paper notes payable 122,840 - - - 122,840 - Revenue bonds 1,909,227 308,480 - - 2,217,707 - Obligation for revenue credit agreement - - 442,309 - 442,309 - Accreted interest on pension obligation bonds 25,603 1,827 2,399 4,663 34,492 - Pension obligation bonds 74,376 5,295 6,969 13,551 100,191 - Water transmission facilities financing agreement 322,730 - - - 322,730 -
Total long-term debt 2,454,776 317,583 452,204 18,214 3,242,777 -
Other long-term liabilities:Estimated unpaid claims - general - - - - - 11,811 Other postemployment benefits 26,319 1,366 3,470 4,504 35,659 8,434 Workers compensation - - - - - 31,954 Customer deposits 13,854 1,997 - - 15,851 - Customer construction advances 2,157 - - - 2,157 - Pollution remediation - 59 355 - 414 - Compensated absences 6,354 411 798 1,246 8,809 2,355
Total other long-term liabilities 48,684 3,833 4,623 5,750 62,890 54,554 Total noncurrent liabilities 2,503,460 321,416 456,827 23,964 3,305,667 54,554
Total liabilities 2,724,754 340,227 492,978 29,942 3,587,901 85,068
Net PositionNet investment in capital assets 2,115,067 200,492 453,660 1,712 2,770,931 17,390 Restricted:
Debt service 193,179 26,727 3,324 - 223,230 - Unrestricted 203,968 39,814 94,836 24,244 362,862 (27,149)
Total net position 2,512,214$ 267,033$ 551,820$ 25,956$ 3,357,023$ (9,759)$
(in thousands)
CITY OF DALLAS, TEXASSTATEMENT OF NET POSITION
PROPRIETARY FUNDS (continued)As of September 30, 2014
The notes to financial statements are an integral part of this statement. 23

Business-type Activities Enterprise Funds
GovernmentalDallas Nonmajor Activities-Water Convention Airport Enterprise Internal
Utilities Center Revenues Funds Total Service Funds
Operating revenues:Customer charges 564,353$ 24,207$ 67,883$ 30,116$ 686,559$ -$ Charges to other City departments - - - - - 163,225 Service to others - - - - - 98,954 Intergovernmental 193 5,161 538 - 5,892 - Other - 89 6 113 208 680
Total operating revenues 564,546 29,457 68,427 30,229 692,659 262,859
Operating expenses:Personnel services 83,859 6,393 12,265 17,610 120,127 41,492 Supplies and materials 76,227 4,290 5,911 568 86,996 32,959 Contractual and other services 91,095 43,923 28,739 6,393 170,150 167,271 Depreciation 108,386 17,485 24,176 160 150,207 4,491
Total operating expenses 359,567 72,091 71,091 24,731 527,480 246,213
Operating income (loss) 204,979 (42,634) (2,664) 5,498 165,179 16,646
Nonoperating revenues (expenses): Investment income 1,744 269 290 113 2,416 125 Alcohol beverage tax - 10,256 - - 10,256 - Hotel occupancy tax - 50,374 - - 50,374 - Passenger facility charges - - 16,543 - 16,543 - Interest on bonds and notes (69,658) (17,442) (20,721) (963) (108,784) - Net gain (loss) on property disposals 191 (844) 5 - (648) 538
Total nonoperating revenues (expenses) (67,723) 42,613 (3,883) (850) (29,843) 663
Income (loss) before contributions and transfers 137,256 (21) (6,547) 4,648 135,336 17,309
Capital contributions 4,267 - 12,319 - 16,586 - Transfers in 950 - - - 950 - Transfers out (23,259) (9,223) (232) (244) (32,958) (6,367) Special item: Loss on impairment of airport property - - (6,372) - (6,372) -
(18,042) (9,223) 5,715 (244) (21,794) (6,367)
Change in net position 119,214 (9,244) (832) 4,404 113,542 10,942
Net position, beginning of year 2,393,000 276,277 552,652 21,552 3,243,481 (20,701)
Net position, end of year 2,512,214$ 267,033$ 551,820$ 25,956$ 3,357,023$ (9,759)$
(in thousands)
PROPRIETARY FUNDSYear Ended September 30, 2014
CITY OF DALLAS, TEXASSTATEMENT OF REVENUES, EXPENSES, AND CHANGES IN FUND NET POSITION
The notes to financial statements are an integral part of this statement. 24

“Dallas, the City that works: diverse, vibrant and progressive.”
25
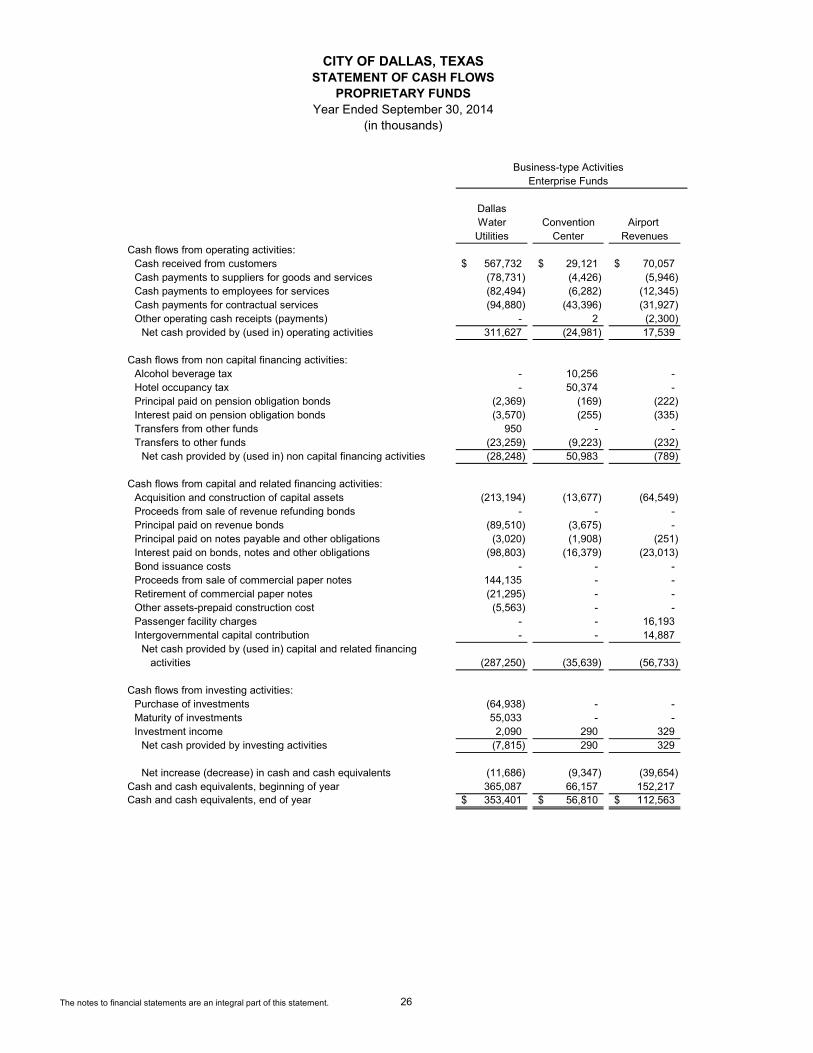
DallasWater Convention Airport Utilities Center Revenues
Cash flows from operating activities:Cash received from customers 567,732$ 29,121$ 70,057$ Cash payments to suppliers for goods and services (78,731) (4,426) (5,946) Cash payments to employees for services (82,494) (6,282) (12,345) Cash payments for contractual services (94,880) (43,396) (31,927) Other operating cash receipts (payments) - 2 (2,300)
Net cash provided by (used in) operating activities 311,627 (24,981) 17,539
Cash flows from non capital financing activities:Alcohol beverage tax - 10,256 - Hotel occupancy tax - 50,374 - Principal paid on pension obligation bonds (2,369) (169) (222) Interest paid on pension obligation bonds (3,570) (255) (335) Transfers from other funds 950 - - Transfers to other funds (23,259) (9,223) (232)
Net cash provided by (used in) non capital financing activities (28,248) 50,983 (789)
Cash flows from capital and related financing activities: Acquisition and construction of capital assets (213,194) (13,677) (64,549) Proceeds from sale of revenue refunding bonds - - - Principal paid on revenue bonds (89,510) (3,675) - Principal paid on notes payable and other obligations (3,020) (1,908) (251) Interest paid on bonds, notes and other obligations (98,803) (16,379) (23,013) Bond issuance costs - - - Proceeds from sale of commercial paper notes 144,135 - - Retirement of commercial paper notes (21,295) - - Other assets-prepaid construction cost (5,563) - - Passenger facility charges - - 16,193 Intergovernmental capital contribution - - 14,887
Net cash provided by (used in) capital and related financing activities (287,250) (35,639) (56,733)
Cash flows from investing activities:Purchase of investments (64,938) - - Maturity of investments 55,033 - - Investment income 2,090 290 329
Net cash provided by investing activities (7,815) 290 329
Net increase (decrease) in cash and cash equivalents (11,686) (9,347) (39,654) Cash and cash equivalents, beginning of year 365,087 66,157 152,217 Cash and cash equivalents, end of year 353,401$ 56,810$ 112,563$
Enterprise FundsBusiness-type Activities
CITY OF DALLAS, TEXASSTATEMENT OF CASH FLOWS
PROPRIETARY FUNDSYear Ended September 30, 2014
(in thousands)
The notes to financial statements are an integral part of this statement. 26
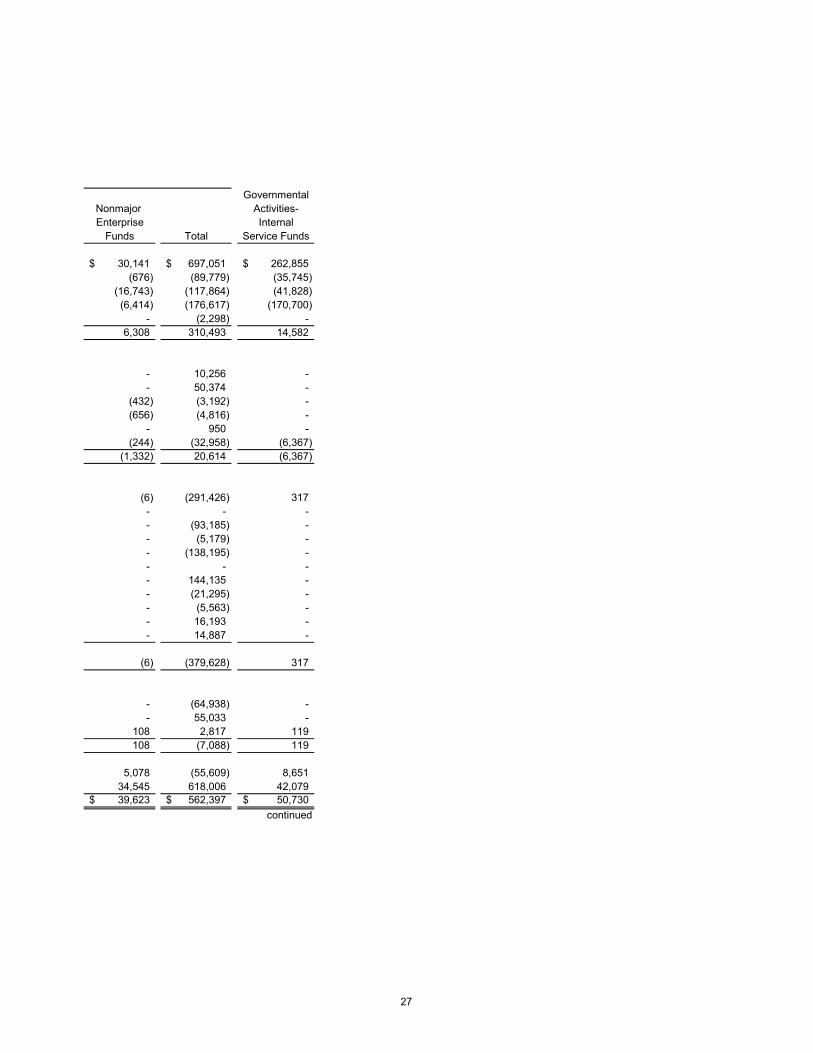
GovernmentalNonmajor Activities-Enterprise Internal
Funds Total Service Funds
30,141$ 697,051$ 262,855$ (676) (89,779) (35,745)
(16,743) (117,864) (41,828) (6,414) (176,617) (170,700)
- (2,298) - 6,308 310,493 14,582
- 10,256 - - 50,374 -
(432) (3,192) - (656) (4,816) -
- 950 - (244) (32,958) (6,367)
(1,332) 20,614 (6,367)
(6) (291,426) 317 - - - - (93,185) - - (5,179) - - (138,195) - - - - - 144,135 - - (21,295) - - (5,563) - - 16,193 - - 14,887 -
(6) (379,628) 317
- (64,938) - - 55,033 -
108 2,817 119 108 (7,088) 119
5,078 (55,609) 8,651 34,545 618,006 42,079 39,623$ 562,397$ 50,730$
continued
27

DallasWater Convention Airport Utilities Center Revenues
Reconciliation of operating income (loss) to net cashprovided by (used in) operating activities:
Operating income (loss) 204,979$ (42,634)$ (2,664)$
Adjustments not affecting cash:Depreciation 108,386 17,485 24,176 Change in assets and liabilities
(Increase) Decrease in accounts and other receivables 2,763 (1,079) 1,419 (Increase) Decrease in notes receivables from other funds 379 - - (Increase) Decrease in inventories (2,504) (136) (35) (Increase) Decrease in other assets 2,040 146 (2,109) (Increase) Decrease in due to other governments - 2 - (Increase) Decrease in due from other funds - - - Increase (Decrease) in accounts payable (4,063) 527 (3,016) Increase (Decrease) in accrued payroll (2,914) (168) (366) Increase (Decrease) in compensated absences 208 (35) (69) Increase (Decrease) in allowance for doubtful accounts (1,759) 2 (5) Increase (Decrease) in unearned revenue - 4 216 Increase (Decrease) in customer deposits 1,803 737 - Increase (Decrease) in other post employment benefits 2,031 168 164 Increase (Decrease) in customer construction advances 278 - - Increase (Decrease) in other liabilities - - (172)
Total adjustments 106,648 17,653 20,203
Net cash provided by (used in) operating activities 311,627 (24,981) 17,539
Current Assets:Pooled cash and cash equivalents 147,384 36,796 103,698 Pooled cash and cash equivalents for current debt service 138,229 3,477 - Customer Deposits pooled cash and cash equivalents 13,197 - - Cash and cash equivalents held by escrow agent 14,772 - -
Cash and cash equivalentsHeld for construction purposes 31,373 12,212 5,541 For future debt service 8,446 4,325 3,324
Total cash and cash equivalents end of year 353,401$ 56,810$ 112,563$
Noncash investing, capital, and financing activities:Capital contributions 4,267 - 1,804 Change in fair value of non-pooled investments (41) (74) - Change in fair value of pooled investments (280) (261) (97) Premium/discount amortization 12,939 713 57 Accretion on capital appreciation bonds 2,270 138 212 Amortization of deferred gain/loss on refunding 3,310 1,350 3 Capital assets acquired through water transmission financing agreement 54,860 - - Other assets acquired through water transmission financing agreement 147,270 - -
Business-type ActivitiesEnterprise Funds
CITY OF DALLAS, TEXASSTATEMENT OF CASH FLOWS
PROPRIETARY FUNDS (continued)Year Ended September 30, 2014
(in thousands)
The notes to financial statements are an integral part of this statement. 28

GovernmentalNonmajor Activities-Enterprise Internal
Funds Total Service Funds
5,498$ 165,179$ 16,646$
160 150,207 4,491
(85) 3,018 (4) - 379 - - (2,675) (456)
372 449 (784) - 2 - - - (1,054)
(21) (6,573) (2,779) (506) (3,954) -
72 176 95 - (1,762) -
(3) 217 - - 2,540 -
929 3,292 623 - 278 -
(108) (280) (2,196) 810 145,314 (2,064)
6,308 310,493 14,582
39,623 327,501 50,730 - 141,706 - - 13,197 - - 14,772 -
- 49,126 - - 16,095 -
39,623$ 562,397$ 50,730$
- 6,071 - - (115) -
(30) (668) (31) 107 13,816 - 412 3,032 -
6 4,669 -
- 54,860 -
- 147,270 -
29

Agency PensionFunds Trust Funds (1)
AssetsPooled cash and cash equivalents 6,213$ -$ Cash and cash equivalents - 434,368 Receivables:
Accounts 32 275,818 Accrued interest 5 15,596
Domestic equities - 1,023,549 U.S. and foreign government securities - 188,392 Domestic corporate fixed income - 692,360 International equities and fixed income - 929,064 Commingled index funds - 80,972 Private equities and venture capital funds - 93,939 Other investments 120 - Plan interest in Group Master Trust - 3,572,950
Total assets 6,370 7,307,008
LiabilitiesAccounts payable 2,973 5,961 Payable for securities purchased - 15,402 Securities lending obligation - 336,590 Other 3,397 257,859
Total liabilities 6,370 615,812
Net PositionHeld in trust for pension benefits - 6,691,196
Total net position -$ 6,691,196$
(1) Information presented for the pension trust funds is as of December 31, 2013.
(in thousands)
CITY OF DALLAS, TEXASSTATEMENT OF FIDUCIARY NET POSITION
FIDUCIARY FUNDSAs of September 30, 2014
The notes to financial statements are an integral part of this statement. 30
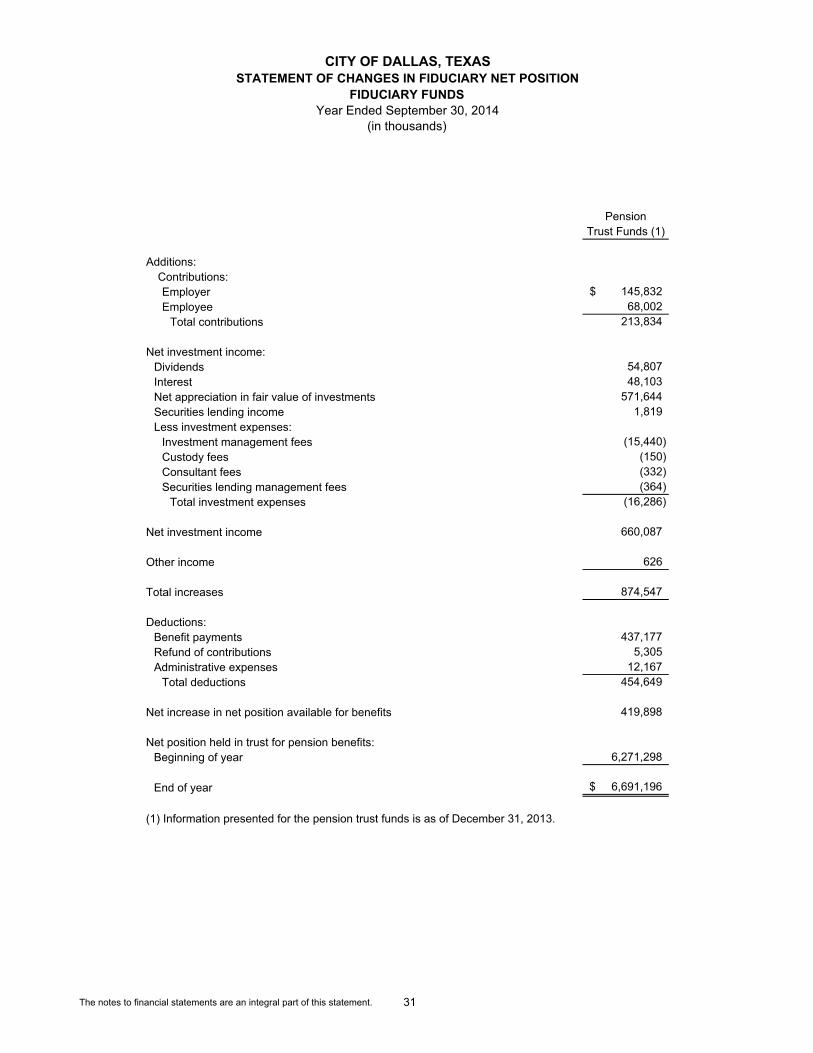
PensionTrust Funds (1)
Additions:Contributions:Employer 145,832$ Employee 68,002
Total contributions 213,834
Net investment income:Dividends 54,807 Interest 48,103 Net appreciation in fair value of investments 571,644 Securities lending income 1,819 Less investment expenses:
Investment management fees (15,440) Custody fees (150) Consultant fees (332) Securities lending management fees (364)
Total investment expenses (16,286)
Net investment income 660,087
Other income 626
Total increases 874,547
Deductions:Benefit payments 437,177 Refund of contributions 5,305 Administrative expenses 12,167
Total deductions 454,649
Net increase in net position available for benefits 419,898
Net position held in trust for pension benefits:Beginning of year 6,271,298
End of year 6,691,196$
(1) Information presented for the pension trust funds is as of December 31, 2013.
(in thousands)
CITY OF DALLAS, TEXASSTATEMENT OF CHANGES IN FIDUCIARY NET POSITION
FIDUCIARY FUNDSYear Ended September 30, 2014
The notes to financial statements are an integral part of this statement. 31
CITY OF DALLAS, TEXAS NOTES TO THE BASIC FINANCIAL STATEMENTS
Year Ended September 30, 2014 �
32 �
���
INDEX PAGE Note 1. - Summary of Significant Accounting Policies 33 Note 2. - Stewardship, Compliance and Accountability 42 Note 3. - Cash, Deposits and Investments 45 Note 4. - Receivables 58 Note 5. - Restricted Assets 59 Note 6. - Joint Ventures 59 Note 7. - Capital Assets 60 Note 8. - Interfund Receivables, Payables and Transfers 62 Note 9. - Accounts Payable and Accrued Expenses 63 Note 10. - Long-term Debt 64 Note 11. - Leases 79 Note 12. - Defeasance of Debt 81 Note 13. - Risk Management – Estimated Claims and Judgments Payable 81 Note 14. - Accrued Landfill Liability 82 Note 15. - Pollution Remediation 83 Note 16. - Pension Plans 84 Note 17. - Commitments and Contingencies 90 Note 18. - Other Postemployment Benefits 90 Note 19. - Subsequent Events 92 Note 20. - Component Unit Net Position Restatement 93
������������

CITY OF DALLAS, TEXAS NOTES TO THE BASIC FINANCIAL STATEMENTS
Year Ended September 30, 2014 �
33 �
Note 1. Summary of Significant Accounting Policies
A. General
The City of Dallas, Texas (“the City”) is a municipal corporation incorporated under Article XI, Section 5 of the Constitution of the State of Texas (Home Rule Amendment). The City operates under the Council-Manager form of government and provides such services as are authorized by its charter to advance the welfare, health, comfort, safety, and convenience of the City and its inhabitants. The accounting policies of the City conform to accounting principles generally accepted in the United States of America (GAAP) as applicable to state and local governments. The Governmental Accounting Standards Board (GASB) is the accepted standard-setting body for establishing governmental accounting and financial reporting principles. Unless otherwise indicated, amounts are presented in thousands (000’s). The more significant accounting and reporting policies and practices used by the City are described below.
B. Reporting Entity
The accompanying basic financial statements present the City and its component units, entities for which the government is considered to be financially accountable. The criteria considered in determining activities to be reported within the City’s basic financial statements include whether:
� the organization is legally separate (can sue and be sued in their own name) � the City appoints a voting majority of the organization’s board � the City is able to impose its will on the organization � the organization has the potential to impose a financial benefit/burden on the City � there is fiscal dependency by the organization on the City
The City’s municipal services, which include public safety (police and fire), streets, sanitation, environmental and health services, code enforcement, public works and transportation, equipment and building, culture and recreation, housing and human services, and general administrative services, are included in the accompanying basic financial statements. In addition, the City owns and operates certain enterprise funds including water utilities, convention services, airport and other enterprise activities that are also included in the accompanying basic financial statements.
Blended Component Units Blended component units, although legally separate entities, are included as part of the primary government because they meet the above criteria as well as serve or benefit the City exclusively. Thus, blended component units are appropriately presented as funds of the primary government. The information reported for the pension trust funds is as of December 31, 2013 and the Love Field Airport Modernization Corporation (LFAMC) is as of September 30, 2014.
� Pension Trust Funds – The Pension Trust Funds have a December 31 year-end. The primary functions of the pension entities are investment and benefit management activities. Each board has contracted with various investment managers and banks for management of the portfolios of the plans. The City contributes on behalf of its employees to three defined benefit pension plans administered by two legally separate entities: the Employees’ Retirement Fund of the City of Dallas, at 600 North Pearl Street, Suite 2450, Dallas, TX 75201; and Dallas Police and Fire Pension System, at 4100 Harry Hines Boulevard, Ste. 100, Dallas, TX 75219. Complete financial statements of each plan may be obtained at the administrative offices.
� Love Field Airport Modernization Corporation (LFAMC) – The City created the LFAMC, a Texas nonprofit local government corporation organized under Subchapter D of Chapter 431 of the Texas Transportation Code. The Corporation was formed to serve as a conduit financing entity for the purpose of issuing bonds to promote the development of the geographic area of the City included at or in the vicinity of Love Field Airport to promote, develop, and maintain the employment, commerce, aviation activity, tourism, and economic development in the City.
Discretely Presented Component Units – The following legally separate entities are reported as discretely presented component units of the City because the City appoints a voting majority of the boards, approves budgets and maintains the ability to impose its will on the entities. Each discretely presented component unit is reported in a separate column in the government-wide financial statements to emphasize that it is legally separate from the government. The information reported for the Dallas Convention Center Hotel Development Corporation and the Housing Finance Corporation is as of December 31, 2013 and all others are as of September 30, 2014.

CITY OF DALLAS, TEXAS NOTES TO THE BASIC FINANCIAL STATEMENTS
Year Ended September 30, 2014 �
34 �
Note 1. Summary of Significant Accounting Policies (continued) � Housing Finance Corporation – organized to issue tax-exempt mortgage revenue bonds to encourage low to
moderate-income citizens opportunities for single-family residential home ownership. � Housing Acquisition and Development Corporation – organized solely and exclusively for the public purpose of
providing safe, affordable housing facilities for low and moderate income persons. � Dallas Development Fund – organized to assist in carrying out the economic development program and objectives
of the City by generating private investment capital through the New Markets Tax Credit Program to be made available for investment in low-income communities.
� Downtown Dallas Development Authority – The primary function of the Downtown Dallas Development Authority (DDDA) is to increase the property tax base in the downtown area of the City. The DDDA operates in a manner similar to other tax increment financing zones of the City, but has a separate board. Its primary purpose is to issue revenue bonds to finance major improvements by developers.
� North Oak Cliff Municipal Management District – organized to promote, develop, encourage, and maintain employment, commerce, transportation, housing, tourism, recreation, and the arts, entertainment, economic development, safety, the public welfare in the District, and educational scholarships for college-bound students residing in or out of the District.
� Cypress Waters Municipal Management District – organized to promote, develop, encourage, and maintain employment, commerce, transportation, housing, tourism, recreation, and the arts, entertainment, economic development, safety, and the public welfare in the District.
� Dallas Convention Center Hotel Development Corporation – organized to promote the development of the geographic area of the City included at or in the vicinity of the Dallas Convention Center, in furtherance of the promotion, development, encouragement and maintenance of employment, commerce, convention and meeting activity, tourism, and economic development in the City, including specifically, without limitation, the development and financing of a convention center hotel which is located within 1,000 feet of the Dallas Convention Center.
Entity financial statements are available for all of the above entities by contacting the City Controller’s Office, 1500 Marilla, Room 2BS, Dallas, TX 75201. Related Organizations City officials are also responsible for appointing members to the boards of the following organizations, but the City’s accountability for the organization does not extend beyond making appointment. The Dallas/Fort Worth International Airport (DFW Airport) is jointly governed by the cities of Dallas and Fort Worth. The Cities approve the Airport’s annual budget and all bond sales, but have no responsibility for the DFW Airport’s debt service requirements. DFW Airport is governed by a 12-member board (Board) comprised of seven members representing the City of Dallas, four members representing the City of Fort Worth, and on an annual basis, one non-voting member from the neighboring cities of Irving, Grapevine, Euless and Coppell. Members of the Board are appointed by the respective City Councils. The Board is a semi-autonomous body charged with governing the Airport and may enter into contracts without approval of the city councils. The Dallas Housing Authority (Authority) is an independent organization, which has a scope of public service within the geographic boundaries of the City. Under Texas State Statutes, the responsibility for the administration and operations of the Authority is vested solely with the Authority’s Board of Commissioners. The Authority is dependent on Federal funds from the Department of Housing and Urban Development and, as a result, is not financially dependent on the City. In addition, the City is not responsible for any deficits incurred and has no fiscal management control. The governing body of the Authority is its Board of Commissioners, composed of five members appointed by the Mayor of the City of Dallas. The Authority is not considered a component unit of the City, as defined by pronouncements of GASB 14, amended by GASB 39 and GASB 61, since the City is not financially accountable for the operations of the Authority, has no responsibility to fund deficits or receive surpluses, and has not guaranteed the Authority’s debt. The Dallas Area Rapid Transit (DART) is a regional transportation authority under Chapter 452 of the Texas Transportation Code and is controlled by a 15-member board. The Dallas City Council appoints seven members and participating suburban city councils appoint eight board members. Its purpose is to provide transportation services in the DART service area. The voters in the DART service area approved a one percent sales tax to fund the authority annually. DART is not fiscally dependent on the City.

CITY OF DALLAS, TEXAS NOTES TO THE BASIC FINANCIAL STATEMENTS
Year Ended September 30, 2014 �
35 �
Note 1. Summary of Significant Accounting Policies (continued)
C. Government-wide and Fund Financial Statements
The government-wide financial statements (i.e., the statement of net position and the statement of activities) report information on the primary government and its non-fiduciary component units. For the most part, the effect of interfund activity has been removed from these statements. Governmental activities, which normally are supported by taxes and intergovernmental revenues, are reported separately from business-type activities, which rely to a significant extent on fees and charges for support. Likewise, the primary government is reported separately from certain legally separate component units for which the primary government is financially accountable.
The statement of activities demonstrates the degree to which the direct expenses of a given function or program are offset by program revenues. Direct expenses are those that are clearly identifiable with a specific function or program. Program revenues include 1) charges to customers or applicants who purchase, use, or directly benefit from goods, services, or privileges provided by a given function or segment and 2) grants and contributions that are restricted to meeting operational or capital requirements of a particular function or segment. Taxes and other items not properly included among program revenues are reported instead as general revenues. Separate fund level financial statements are provided for governmental funds, proprietary funds, and fiduciary funds, even though the latter are excluded from the government-wide financial statements. Major individual governmental funds and individual enterprise funds are reported as separate columns in the fund financial statements.
D. Measurement Focus, Basis of Accounting, and Financial Statement Presentation
The government-wide financial statements are reported using the economic resources measurement focus and the accrual basis of accounting, as are the proprietary fund and fiduciary fund financial statements. Revenues are recognized when earned and expenses are recognized when a liability is incurred, regardless of the timing of related cash flows; however, agency funds report only assets and liabilities and have no measurement focus.
The governmental fund financial statements are reported using the current financial resources measurement focus and the modified accrual basis of accounting. Revenues are recognized as soon as they are both measurable and available. Revenues are considered to be available when they are collectible within the current period or soon enough thereafter to pay liabilities of the current period. For this purpose, the City considers revenues received within 60 days of year-end to be available, in accordance with the City’s accounting policy, except as noted in the paragraph below. Revenues susceptible to accrual include ad valorem taxes, sales tax, sanitation collection fees, disposal fees, ambulance fees, parking fines, franchise fees and interest. In applying the susceptible to accrual concept to Federal and State grants, revenues are recognized when applicable eligibility requirements, including time requirements, are met. The grant revenues and developer and intergovernmental contributions availability period is considered to be one year. All other revenue items are considered to be measurable and available only when the City receives the cash as the resulting net receivables are deemed immaterial, such as court fines and fees. Expenditures generally are recorded when the liability is incurred, as under accrual accounting. However, debt service expenditures as well as expenditures related to compensated absences, rebatable arbitrage, claims and judgments, landfill closure and post-closure care costs, other postemployment benefits, and pollution remediation are recorded only when matured and payment is due. The City reports the following major governmental funds:
The General Fund is the general operating fund of the City. It is used to account for all financial resources except those required to be accounted for in another fund. The Debt Service Fund is used to account for the accumulation of resources for, and the payment of, general long-term debt principal, interest and related costs.
CITY OF DALLAS, TEXAS NOTES TO THE BASIC FINANCIAL STATEMENTS
Year Ended September 30, 2014 �
36 �
Note 1. Summary of Significant Accounting Policies (continued)
The City reports the following non-major governmental funds:
The Capital Project Funds are used to account for and report financial resources that are restricted, committed, or assigned to expenditure for capital outlays, including the acquisition or construction of capital facilities and other capital assets. Capital projects funds exclude those types of capital-related outflows financed by proprietary funds or for assets that will be held in trust for individuals, private organizations, or other governments.
The Special Revenue Funds are used to account for proceeds of specific revenue sources that are restricted or committed to expenditures for specified purposes other than debt service or capital projects.
The Permanent Funds are used to account for private endowments whereby interest earnings are restricted in accordance with the endowment terms.
Proprietary Funds are accounted for using the economic resources measurement focus and the accrual basis of accounting. The accounting objectives are determinations of operating income, change in net position, financial position and cash flow. All assets, deferred outflows, liabilities, and deferred inflows are included on the statement of net position. The City reports the following major proprietary funds:
The Dallas Water Utilities Fund accounts for water and wastewater services for Dallas, area customer cities and governmental entities. Activities necessary to provide such services are accounted for in the fund, including, but not limited to, administration, operations, maintenance, finance, and related debt service.
The Convention Center Fund accounts for convention and event services for the Dallas Convention Center. Activities necessary to provide such services are accounted for in the fund, including, but not limited to, administration, operations, maintenance, finance, and related debt service.
The Airport Revenues Fund accounts for Dallas Airports System, which includes airport services and administration of Dallas Love Field, Executive Airport and Heliport. Activities necessary to provide such services are accounted for in the fund, including, but not limited to, administration, operations, maintenance, finance, and related debt service. DFW airport activity is not included in the financial statements.
The City reports the following non-major proprietary funds:
The non-major proprietary funds consist of Enterprise Funds, which are used to account for operations, other than the major proprietary funds listed above, and are operated in a manner similar to private business enterprises. Non-major Enterprise Funds include the operation of the municipal radio station and building inspections.
Additionally, the City reports the following funds:
The Internal Service Funds are used to allocate associated costs of centralized services on a cost-reimbursement basis. The services provided to other City departments are vehicles, vehicle maintenance and fuel and lubrication, providing communication services, providing data processing and programming services, providing office supplies, printing, copying and mailing services and providing risk financing and insurance-related activities. The Pension Trust Fund accounts for the activities of the City’s three contributory defined benefit pension plans:
Employees’ Retirement System; Police and Fire Pension System; and Supplemental Police and Fire Pension Plan.
The Agency Funds are used to account for assets held by the City, as an agent for individuals (employee war and savings bond fund, cash escrow, confiscated money, disposal deposit fund), a private organization (Deferred Compensation) and other funds for assets held by the City, in a trustee capacity (tax distribution, and employee benefits).

CITY OF DALLAS, TEXAS NOTES TO THE BASIC FINANCIAL STATEMENTS
Year Ended September 30, 2014 �
37 �
Note 1. Summary of Significant Accounting Policies (continued)
As a general rule, the effect of interfund activity has been eliminated from the government-wide financial statements. Exceptions to this general rule are payments-in-lieu of taxes (PILOT) and other charges between the Dallas Water Utilities Fund and various other functions of the City. Elimination of these charges would distort the direct costs and program revenues reported for various functions concerned. Proprietary funds distinguish operating revenues and expenses from non-operating items. Operating revenues and expenses generally result from providing services in connection with a proprietary fund’s principal ongoing operations. Operating revenues of the City’s enterprise funds are charges to customers for sales and services, charges to other City departments, services to others, intergovernmental revenue and other revenues. Operating expenses include cost of sales and services, administrative expenses, and depreciation on capital assets. All revenues and expenses not meeting this definition are reported as non-operating revenues and expenses.
E. Cash and Cash Equivalents
Cash and cash equivalents include amounts in pooled cash as well as short-term investments with the exception of the Pension Trust Funds (which consider short-term investments as regular investments). Investment income on the pooled investments is prorated monthly based upon the average daily cash balance in each fund. Investments in certificates of deposits, U.S. government obligations and other investments are recorded at fair value based on quoted market prices. Pension investments are recorded at fair value based on quoted market values, where available. The amounts recorded in the Pension Trust Funds for real estate funds and venture capital funds represent estimated fair values based upon appraised values or other comparable methods. The Commingled Index Funds estimated fair values are based upon audited financial statements.
F. Property Taxes
The City’s property tax is levied each October 1 on the assessed value as of the previous January 1 for all real and income-producing (or business personal) property. Appraised values are established by the Dallas, Denton, Collin, and Rockwall Central Appraisal Districts equal to 100 percent of appraised market value as required under the State Property Tax Code. The value of real property within the Appraisal District must be reviewed every three years. The City may challenge appraised values established by the Appraisal District through various appeals and, if necessary, legal action. The City establishes tax rates on property within its jurisdiction. If the adopted tax rate, excluding tax rates for bonds and other contractual obligations, exceeds the effective tax rate by more than eight percent, qualified voters of the City may petition for an election to determine whether to limit the tax rate increase to no more than eight percent above the effective tax rate. Property taxes attach as an enforceable lien on property as of January 1 of the subsequent year. Taxes are due October 1. Full payment can be made prior to the following January 31 to avoid penalty and interest charges. Current tax collections for the year ended September 30, 2014 were 97.52 percent of the tax levy. The City is permitted by Article XI, Section 5 of the State of Texas Constitution to levy taxes up to $2.50 per one hundred dollars of assessed valuation for general governmental services including the payment of principal and interest on general obligation long-term debt. The tax rate for fiscal year 2014 was $0.797 per $100 dollars of assessed valuation, $0.5601 for general governmental services and $0.2369 for the payment of principal and interest on general obligation long-term debt.
G. Federal and State Grants and Entitlements
Grants and entitlements received for purposes normally financed through the general government are accounted for within the Special Revenue Funds. Community Development Block Grants are the more significant grants so classified. Grants and similar items are recognized as revenue as soon as all applicable eligibility requirements, excluding time requirements, have been met. Amounts received before time requirements are met, but after all other eligibility requirements have been met are reported as a deferred inflow of resources.
H. Inventories
Inventory is valued at average cost. Inventory for all funds generally consists of expendable supplies and automotive parts held for consumption and are recorded as expenditures (or expenses) when consumed.

CITY OF DALLAS, TEXAS NOTES TO THE BASIC FINANCIAL STATEMENTS
Year Ended September 30, 2014 �
38 �
Note 1. Summary of Significant Accounting Policies (continued)
I. Prepaid Items
Prepaid items are payments made to vendors for services that will benefit periods beyond September 30, 2014. Prepaid items are recorded using the consumption method.
J. Restricted Assets
Proceeds of Enterprise Fund revenue bonds, commercial paper notes, and other financing arrangements, as well as resources set aside for revenue bond repayment, are classified as restricted assets on the balance sheet when their use is limited by applicable covenants. The Capital Project Funds record proceeds of debt issuances restricted for construction. The current Debt Service Funds are used to segregate resources accumulated for debt service payments over the next 12 months. The assets restricted for revenue bond future debt service are used to report resources set aside to fulfill revenue bond debt reserve requirements. Other restricted assets include funds restricted for construction from revenue bond proceeds, contractual obligation debt service funds, unspent grant proceeds, and customer deposits. Assets restricted for a specific purpose are utilized before the use of unrestricted assets to pay related obligations when authorized to do so.
K. Capital Assets
Capital assets, which include property, plant, equipment and infrastructure assets (examples include streets and bridges), are reported in the applicable governmental or business-type activities columns, in both the government-wide and proprietary fund level statement of net position. Generally, equipment with an individual cost of at least $5 thousand, infrastructure with a cost of at least $25 thousand, and buildings with a cost of at least $50 thousand and an estimated useful life of more than one year, are capitalized. Purchased or constructed capital assets are valued at historical cost or estimated historical cost if actual cost is not available. Assets acquired by donation are recorded at estimated fair value on the date received. The costs of normal maintenance and repairs that do not add to the value of the asset or materially extend assets lives are not capitalized. Major outlays for capital assets and improvements are capitalized as projects are constructed. The business-type activities and proprietary funds capitalized interest costs during construction. Interest capitalized in the Dallas Water Utilities and Aviation Revenues during the year ended September 30, 2014 was $28 million and $2.5 million, respectively. Depreciation, which includes amortization of assets under capital leases, is computed using the straight-line method over the estimated useful or service lives of the related assets beginning on the date of acquisition or the date placed in service.
The estimated useful lives of the primary government’s capital assets are as follows:
Useful Life Governmental
Activities Business-type
Activities
Infrastructure………………………………………. 10-50 years 50-100 years Reservoirs and water rights………………………. N/A 100 years Buildings……………………………………………. 10-50 years 10-50 years Improvements other than buildings……………… 10-50 years 10-100 years Equipment………………………………………… 3-20 years 3-25 years Utility property……………………………………… N/A 33-75 years
Artwork is capitalized but not depreciated. These assets are maintained for public exhibition, education or research and are being preserved for future generations. The proceeds from sales of any pieces of the collection are used to purchase other items for the collection.
CITY OF DALLAS, TEXAS NOTES TO THE BASIC FINANCIAL STATEMENTS
Year Ended September 30, 2014 �
39 �
Note 1. Summary of Significant Accounting Policies (continued)
L. Compensated Absences
The City’s employees earn vacation, sick, and attendance incentive leave which may be used or accumulated up to certain amounts. Unused vacation and attendance incentive leave is paid upon death, retirement or termination. Unused sick leave is reduced to a specified limit when paid upon retirement, certain terminations, or death. In accordance with the criteria established in the Codification of Governmental Accounting Standards, Section C60, “Compensated Absences,” a liability is recorded for vacation leave earned by employees attributable to past service and sick leave earned by employees attributable to past service only to the extent it is probable that such leave will result in termination pay. In addition, a liability has been recorded for certain salary related payments associated with the payment of accrued vacation and sick leave. In the government-wide and proprietary fund statements of net position, all compensated absence liabilities incurred are recorded as liabilities. However, a liability is recorded in the governmental funds balance sheet only if they have matured and are due as a result of employee resignations, retirements, or termination.
�M. Risk Management
The City is self-funded for workers’ compensation, employee health insurance, most property damage and the majority of tort liability exposures. Commercial insurance is used where it is legally required, contractually required, or judged to be the most effective way to finance risk. Indemnity and insurance protection are also required for all City contractors, vendors, lessees and permit holders. Claims and judgments are recorded when it is probable that an asset has been impaired or a liability has been incurred and the amount of loss can be reasonably estimated. The recorded estimated liability for claims and judgments includes a provision for Incurred but Not Reported (IBNR) liabilities for workers’ compensation, tort cases, and employee health insurance.
N. Deferred Inflows/Outflows of Resources �
In addition to assets, the statement of net position will sometimes report a separate section for deferred outflows of resources. This separate financial statement element, deferred outflows of resources, represents a consumption of net position that applied to a future period and so will not be recognized as an outflow of resources (expense/expenditure) until then. The City only has one item that qualifies for reporting in this category. It is the deferred charge on refunding reported in the government-wide statement of net position. A deferred charge on refunding results from the difference in the carrying value of refunded debt and its reacquisition price. This amount is deferred and amortized over the shorter of the life of the refunded or refunding debt. In addition to liabilities, the statement of financial position will sometimes report a separate section for deferred inflows of resources. This separate financial statement element, deferred inflows of resources, represents an acquisition of net position that applies to a future period and so will not be recognized as an inflow of resources (revenue) until that time. The City has only one type of item which arises only under a modified accrual basis of accounting that qualifies for reporting in this category. Accordingly, the item, unavailable revenue, is reported only in the governmental funds balance sheet. These amounts are deferred and recognized as an inflow of resources in the period that the amounts become available. The deferred inflow is reclassified to revenue on the government-wide financial statements. The Dallas Convention Center Hotel Development Corporation discretely presented component unit also reports a deferred inflow as a result of the advance for the Build America Bonds rebate.
O. Long-term Obligations
In the government-wide financial statements and proprietary fund financial statements, long-term debt and other long-term obligations are reported as liabilities in the applicable governmental activities, business-type activities or proprietary fund financial statements of net position. General obligation bonds are issued to fund capital projects of both the general government and certain proprietary funds and are to be repaid from tax revenues of the City. Accreted interest on capital appreciation bonds is reflected as interest expense in the governmental activities statement of activities and as an addition to non-current liabilities in the statement of net position.

CITY OF DALLAS, TEXAS NOTES TO THE BASIC FINANCIAL STATEMENTS
Year Ended September 30, 2014 �
40 �
Note 1. Summary of Significant Accounting Policies (continued)
P. Bond Premiums, Discounts, and Issuance Costs
In the government-wide financial statements and proprietary fund financial statements, bond premiums and discounts are deferred and amortized over the life of the bonds using the effective interest method. Bonds payable are reported net of the applicable premium or discount. Issuance costs, except any portion related to prepaid insurance costs (if applicable), are recognized as an expense in the period incurred.
In the fund financial statements, governmental fund types recognize bond premiums and discounts as well as issuance costs in the current period. The face amount of debt issued is reflected as other financing sources. Premiums are reported as other financing sources while discounts are reported as other financing uses. Issuance costs, whether or not withheld from the actual debt proceeds received, are reported as debt service expenditures.
�Q. Interfund Receivables and Payables
During the course of operations, numerous transactions occur between individual funds for goods provided or services rendered. These receivables and payables are classified as “due from other funds” or “due to other funds” on the fund level balance sheets/statement of net position. Any residual balances outstanding between the governmental activities and business-type activities are reported in the government-wide financial statements as “internal balances”. Short-term and long-term interfund loans are classified as notes receivable or payable from other funds with interest rates ranging from 4.25% to 5.44%.
�R. Transactions Between Funds
Transactions between funds, which would have been treated as revenues, expenditures, or expenses if they involved organizations external to the government unit, are accounted for as revenues, expenditures, or expenses in the funds involved. Transactions which constitute reimbursements of a fund for expenditures of expenses initially made from that fund which are properly applicable to another fund are recorded as expenditures or expenses in the reimbursing fund and as reductions of the expenditure or expenses in the fund reimbursed. All other nonreciprocal transactions between funds which are not reimbursements and where the funds do not receive equivalent goods or services for the transaction are classified as transfers.
S. Deferred Compensation Plan
There are three deferred compensation plans. Two of these plans are voluntary for City employees who participate in the City’s pension plans. The third plan is mandatory for all employees and council members who are not covered by the City’s pension plans. These plans comply with sections 401(k) and 457(b) of the Internal Revenue Code.
Participants in the City’s voluntary 457 and 401(k) plans have full discretion to choose investments from a list of standard plan options, a linked brokerage account, and a commingled pool managed by Fidelity Management Trust Company. The list of standard plan options includes mutual funds with varying styles and levels of investment risk. All the account balances in the mandatory 457 plan are invested in the same commingled pool. All contributions to these plans are deferred by plan participants from their compensation and all the earnings are allocated to each participant’s account. Distributions from all the deferred compensation plans are available after termination of employment. Additionally, participants in the City’s voluntary plans may also take out loans and may receive hardship withdrawals in accordance with federal regulations. The assets held in these plans are not included in the City’s financial statements and cannot be used for purposes other than the exclusive benefit of the participants or their beneficiaries or to pay the reasonable expenses of plan administration.
T. Net Position
In the government-wide and proprietary funds financial statements, the net position is reported in three components: (1) net investment in capital assets; (2) restricted; and (3) unrestricted. Net investment in capital assets represents the City’s total investment in capital assets, net of depreciation, reduced by the outstanding balances of any borrowings used for the acquisition, construction or improvement of those assets. Nonexpendable restricted net position consists of endowment and similar type funds in which donors or other outside sources have stipulated, as a condition of the gift instrument, that the principal is to be maintained in perpetuity, and invested for the purpose of producing present and future income, which may be either expended for operation and maintenance of City parks or added to principal. The City is subject to the State of Texas Uniform Prudent Management of Institutional Funds Act (UPMIFA) in relation to endowment funds.

CITY OF DALLAS, TEXAS NOTES TO THE BASIC FINANCIAL STATEMENTS
Year Ended September 30, 2014 �
41 �
Note 1. Summary of Significant Accounting Policies (continued) The risk fund has a deficit net position of $42 million associated with the City’s self-insured workers’ compensation, auto, and general liability activities. The deficit results from the recognition of certain liabilities that will be paid in future periods. Those liabilities will be funded in the fiscal year in which they will be paid through annual budget appropriations. The City’s approach for addressing this deficit is consistent with the budgetary basis of accounting for all funds as indicated in Note 2.B.
U. Statement of Cash Flows
For purposes of the statement of cash flows, the City considers pooled cash and all highly liquid debt instruments purchased with an original maturity of three months or less or that have general characteristics of demand deposits in that additional funds may be deposited or withdrawn at any time without prior notice or penalty to be cash equivalents.
V. Use of Estimates
The preparation of financial statements in conformity with GAAP requires management to make estimates and assumptions that affect certain reported amounts and disclosures. Accordingly, actual results could differ from those estimates.
W. New Accounting Pronouncements
During fiscal year 2014, the City has adopted the following Governmental Accounting Standard Board (GASB) Statements:
GASB Statement Number 67, “Financial Reporting for Pension Plans – an amendment of GASB Statement No. 25,” improves financial reporting by state and local government pension plans. The implementation of this statement did not result in any changes to the financial statements.
GASB Statement Number 70, “Accounting and Financial Reporting for Nonexchange Financial Guarantees,” improves accounting and financial reporting by state and local governments that extend and receive nonexchange financial guarantees. The implementation of this statement did not result in any changes to the financial statements.
The GASB has issued the following statements which will be effective in futures years as described below: GASB Statement Number 68, “Accounting and Financial Reporting for Pensions – an amendment of GASB Statement No. 27,” will be implemented as required by GASB during the fiscal year ending September 30, 2015. The objective of this statement is to improve accounting and financial reporting by state and local government pensions and improve the decision-usefulness of information in contributing entity financial reports and will enhance its value for assessing accountability and interperiod equity by requiring recognition of the entire net pension liability and a more comprehensive measure of pension expense. This statement establishes standards for measuring and recognizing liabilities, deferred outflows of resources, and deferred inflows of resources, and expense/expenditures. Note disclosure and required supplementary information requirements about pensions also are addressed. This statement requires the liability of employers and nonemployer contributing entities to employees for defined benefit pension (net pension liability) to be measured as the portion of the present value of projected benefit payments to be provided through the pension plan to current active and inactive employees that is attributed to those employees’ past periods of service (total pension liability), less the amount of the pension plan’s fiduciary net position. The City is currently evaluating potential changes to the financial statements as a result of the implementation of this statement. The impact of the implementation of this statement is expected to be significant. GASB Statement Number 69, “Government Combinations and Disposals of Government Operations,” will be implemented by the City as required by GASB during fiscal year ending September 30, 2015. This statement establishes accounting and financial reporting standards related to government combinations and disposals of government operations, which includes a variety of transactions referred to as mergers, acquisitions, and transfers of operations. The implementation of this statement is not expected to result in any changes to the financial statements.

CITY OF DALLAS, TEXAS NOTES TO THE BASIC FINANCIAL STATEMENTS
Year Ended September 30, 2014 �
42 �
Note 1. Summary of Significant Accounting Policies (continued) GASB Statement Number 71, “Pension Transition for Contributions Made Subsequent to the Measurement Date – an Amendment of GASB Statement No. 68,” will be implemented by the City as required by GASB during fiscal year ending September 30, 2015. The objective of this statement is to address an issue regarding application of the transition provisions of Statement No. 68, Accounting and Financial Reporting for Pensions. The City is currently evaluating potential changes to the financial statements as a result of the implementation of this statement. �GASB Statement Number 72, Fair Value Measurement and Application, will be implemented by the City as required by GASB during fiscal year ending September 30, 2016. The objective of this statement is to address accounting and financial reporting issues related to fair value measurements. The definition of fair value is the price that would be received to sell an asset or paid to transfer a liability in an orderly transaction between market participants at the measurement date. This Statement provides guidance for determining a fair value measurement for financial reporting purposes. This Statement also provides guidance for applying fair value to certain investments and disclosures related to all fair value measurements. The City is currently evaluating potential changes to the financial statements as a result of the implementation of this statement.
Note 2. Stewardship, Compliance and Accountability
A. Legal Compliance – Budgets
The City Council adheres to the following procedures in establishing the budgets reflected in the accompanying combined financial statements.
1) By the fifteenth day of August each year, the City Manager is required to submit to the City Council a proposed budget for the fiscal year beginning the following October 1. The operating budget includes proposed expenditures and the means of financing them.
2) Public hearings are conducted to obtain taxpayers’ comments. 3) Prior to October 1, the budget is legally enacted by the City Council through passage of an ordinance. 4) The City Manager is authorized to transfer budgeted amounts between accounts within any department;
however, any revisions that alter the total expenditures of any department must be approved by the City Council. The legal level of budgetary control is the department level.
5) Formal budgetary integration is employed as a management control device during the year for the general fund and debt service fund. Formal budgetary integration is employed as a management control device in the capital project funds for the life of the projects.
6) Annual budgets are legally adopted for the general fund, debt service fund and proprietary funds. Certain differences exist between the basis of accounting used for budgetary purposes and that used for financial reporting in accordance with GAAP. Budgets for the capital project funds are normally established pursuant to the terms of the related bond ordinances on a project basis.
B. Budgets and Budgetary Basis of Accounting
The City prepares its annual appropriated general fund, debt service fund and proprietary operating funds’ budgets on the budget basis which differs from the GAAP basis. The budget and all transactions of the general fund are presented in accordance with the City’s budget basis in the general fund statement of revenues, expenditures and changes in fund balances – non-GAAP budgetary basis to provide a meaningful comparison of actual results with the budget. The major differences between the budget and GAAP basis are attributable to the elimination of certain revenues and expenditures budgeted on a non-annual basis and the fact that encumbrances are recorded as the equivalent of expenditures (budget) rather than fund balance (GAAP) in the governmental funds. Adjustments necessary to convert the excess of revenues and other financing sources over expenditures and other uses on the budget basis to a GAAP basis for the general fund are provided below:

CITY OF DALLAS, TEXAS NOTES TO THE BASIC FINANCIAL STATEMENTS
Year Ended September 30, 2014 �
43 �
Note 2. Stewardship, Compliance and Accountability (continued)
Excess (deficiency) of revenues and other financing sources over expenditures and other uses--budgetary basis 10,475$ Change in fair market value of investments (103) Change in encumbrances 14,466 Funds not included in general fund budget (141) Revenue recognized for GAAP basis but not budgetary basis 3,661 Other items budgeted on a non-GAAP basis (4,689) Excess (deficiency) of revenues and other financing sources over expenditures and other uses--GAAP basis 23,669$
�Encumbrance accounting, under which purchase orders, contracts and other commitments for the expenditure of monies are recorded in order to assign that portion of the applicable appropriation, is utilized as an extension of formal budgetary integration in the governmental funds. For budgetary purposes, appropriations lapse at fiscal year-end except for that portion related to encumbered amounts. For the general fund, outstanding encumbrances are reported as assigned fund balances. For other governmental funds, encumbrances are reported as either restricted or committed. These balances do not constitute expenditures or liabilities for GAAP purposes since the goods and services have not been received. Encumbrances outstanding at year-end are carried forward to the new fiscal year. Such encumbrances constitute the equivalent of expenditures for budgetary purposes and, accordingly, the accompanying financial statements present comparisons of actual results to budget of governmental funds on the budget basis of accounting.
C. Nature and Purpose of Classifications of Fund Balance
Fund balance for governmental funds should be reported in classifications that comprise a hierarchy based primarily on the extent to which the government is bound to honor constraints on the specific purposes for which amounts in those funds can be spent. The nonspendable fund balance classification includes amounts that cannot be spent because they are either not in spendable form or legally or contractually required to be maintained intact. Fund balance should be reported as restricted when constraints placed on the use of resources are either externally imposed by creditors (such as through debt covenants), grantors, contributors, or laws or regulations of other governments, or imposed by law through constitutional provision or enabling legislation. Fund balance should be reported as committed when amounts can only be used for specific purposes pursuant to constraints imposed by formal action of the government’s highest level of decision-making authority. Those committed amounts cannot be used for any other purpose unless the government removes or changes the specified use by taking the same type of action it employed to previously commit those amounts. Committed fund balance also includes contractual obligations to the extent that existing resources in the fund have been specifically committed for use in satisfying those contractual requirements. Fund balance should be reported as assigned for amounts that are constrained by the government’s intent to be used for specific purposes, but are neither restricted nor committed. Intent should be expressed by the governing body itself or a body or official to which the governing body has delegated the authority to assign amounts to be used for specific purposes. Unassigned fund balance is the residual classification for the General Fund and includes amounts that are available for any purpose. Positive amounts are reported only in the General Fund. The City Council is the City’s highest level of decision-making authority and the formal action that is required to be taken to establish, modify, or rescind a fund balance commitment is a resolution approved by the City Council. This can also be done through adoption or amendment of the budget. The resolution must either be approved or rescinded, as applicable, prior to the last day of the fiscal year for which the commitment is made. The amount subject to the constraint may be determined in the subsequent period. The City Council has authorized the City Manager as the official authorized to assign fund balance $50 to $70 thousand, depending on the type of goods or services by administrative action, pursuant to Section 2-30 of the City Code. Such assignments cannot exceed the available (spendable, unrestricted, uncommitted) fund balance in any particular fund. When multiple categories of fund balance are available for expenditure (for example, a construction project is being funded partly by a grant, funds set aside by the City Council, and unassigned fund balance), the City will start with the most restricted category and spend those funds first before the next category with available funds.

CITY OF DALLAS, TEXAS NOTES TO THE BASIC FINANCIAL STATEMENTS
Year Ended September 30, 2014 �
44 �
Note 2. Stewardship, Compliance and Accountability (continued)
It is the desire of the City to maintain adequate General Fund balance to maintain liquidity and in anticipation of economic downturns or natural disasters. The City Council has adopted a financial standard to maintain a general fund minimum unassigned fund balance of not less than 5 percent of the General Fund operating expenditures less debt service. The table below presents additional detail of fund balances as of September 30, 2014.
General Debt ServiceSpecial
Revenue Capital Projects Permanent Total
Inventory 10,044$ -$ -$ -$ -$ 10,044$ Long-term note receivable - - - 4,161 - 4,161 Permanent fund principal - - - - 9,724 9,724
Total nonspendable 10,044 - - 4,161 9,724 23,929 Restricted for
9 -1 -1 11,236 - - - - 11,236 Debt service - 3,492 - - - 3,492 Culture and recreation - - 8,060 13,243 - 21,303 Public safety - - 8,895 - - 8,895 Community development - - 3,533 - - 3,533 Health and human services - - 996 - - 996 Economic development - - 16,355 - - 16,355 Municipal court technology - - 4,531 - - 4,531 Public television cable system - - 7,578 - - 7,578 Grants and other purposes - - 11,077 - - 11,077 Storm water operations - - 42,918 - - 42,918 Streets and transportation - - 7,609 164,424 - 172,033 Other capital projects - - - 74,908 - 74,908
Total restricted 11,236 3,492 111,552 252,575 - 378,855 Committed to
Risk reserve 1,250 - - - - 1,250 Culture and recreation - - 14,541 - - 14,541
Total committed 1,250 - 14,541 - - 15,791 Assigned to
Code enforcement services 1,690 - - - - 1,690 Communication and - information technology 587 - - - - 587 Community development 628 - - - - 628 Cultural affairs 1,062 - - - - 1,062 Fire safety services 386 - - - - 386 Library services 315 - - - - 315 Municipal court services 222 - - - - 222 Parks and recreation 1,337 - - - - 1,337 Police safety services 3,420 - - - - 3,420 Public works 1,073 - - - - 1,073 Sanitation services 3,639 - - - - 3,639 Streets and transportation 10,037 - - - - 10,037 General government services 4,509 - - - - 4,509
Total assigned 28,905 - - - - 28,905 Unassigned 129,239 - - - - 129,239
Total fund balance 180,674$ 3,492$ 126,093$ 256,736$ 9,724$ 576,719$
Fund balances
Nonspendable
�

CITY OF DALLAS, TEXAS NOTES TO THE BASIC FINANCIAL STATEMENTS
Year Ended September 30, 2014 �
45 �
Note 3. Cash, Deposits and Investments�
The City maintains a cash and investment pool available for use by all City funds. Each fund’s portion of this pool is displayed on the balance sheet/statement of net position as “Pooled cash and cash equivalents.” The City treats pooled investments and short-term non-pooled investments as cash equivalents. Long-term non-pooled investments are reported as “Other investments, at fair-value” in the appropriate funds. In addition, several City funds have investments, which are separately held. A fund may overdraw its account in the pool, with the overdrafts reported as liabilities (due to other funds) on the balance sheet.
�In 1987, the City Council adopted the City’s Investment Policy which was in compliance with federal and state law and the City Charter. Subsequent amendments were made by the City Council to incorporate changes to the Public Funds Investment Act (Chapter 2256, Texas Government Code) and to improve management of the City’s investments. The Public Funds Investment Act requires that investments shall be made in accordance with written policies approved at least annually by the governing body. Investment policies must address safety of principal, liquidity, yield, diversification and maturity, with primary emphasis on safety of principal. In accordance with this Policy, the City may invest in direct or guaranteed obligations of the U.S. Treasury, certain U.S. agencies and instrumentalities, and the State of Texas or its agencies and instrumentalities with a credit rating no less than A; fully collateralized certificates of deposit and repurchase agreements; no-load money market mutual funds and local government investment pools with credit ratings no less than AAA. The City’s Investment Pool is an aggregation of the majority of City Funds which includes tax receipts, enterprise fund revenues, fine and fee revenues, as well as some, but not all, bond proceeds, grants, gifts and endowments. This portfolio is maintained to meet anticipated daily cash needs for City of Dallas operations, capital projects and debt service. The City is precluded from investing in bankers’ acceptances, commercial paper, collateralized mortgage obligations, reverse repurchase agreements, and obligations of cities, counties and political subdivisions of other states, all of which are authorized by State law.
Employees’ Retirement Fund and Police and Fire Pension Plans, component units of the City, are included under Pension Trust in the following table. Police and Fire Pension Plans include Dallas Police and Fire Pension System (the System) and Supplemental Police and Fire Pension Plan (supplemental plan). A summary of pooled cash and other investments for all City funds, including blended and discretely presented component units and $6.2 million held in agency funds is presented below. Balances are presented as of September 30, 2014 or December 31, 2013, depending on the fiscal year of the entity.
Cash and Pooled
Investments with City Treasury
Other Cash and
Investments Pension Trust Total
Cash with Discretely Presented
Component Units
Pooled cash and investments $ 671,605 -$ 671,605$ -$ Cash and cash equivalents - 434,368 434,368 33,433 Other investments 13,653 6,581,226 6,594,879 2,962 Restricted cash and investments 687,083 - 687,083 135,309 Total $ 1,372,341 7,015,594$ 8,387,935$ 171,704$
�A summary of the carrying amount of cash on hand, deposits and investments at September 30, 2014, is as follows:
Cash and Pooled
Investments with City Treasury
Other Cash and
Investments Pension Trust Total
Cash with Discretely Presented
Component Units
Deposits 153,604$ 434,368$ 587,972$ 131,690$ Investments 1,218,737 6,581,226 7,799,963 40,014 Total 1,372,341$ 7,015,594$ 8,387,935$ 171,704$
�

CITY OF DALLAS, TEXAS NOTES TO THE BASIC FINANCIAL STATEMENTS
Year Ended September 30, 2014 �
46 �
Note 3. Cash, Deposits and Investments (continued) At September 30, 2014, the City had the following investments: �
Total
Federal Agricultural Mortgage Corporation Notes 67,122$ Federal Farm Credit Bank Notes 167,353 Federal Home Loan Bank Notes 160,505 Federal Home Loan Bank Notes Callable 114,820 Federal Home Loan Mortgage Corporation Notes 172,282 Federal Home Loan Mortgage Corporation Notes Callable 84,820 Federal Home Loan Mortgage Association Notes 230,672 Federal Home Loan Mortgage Association Notes Callable 29,869
Total Categorized Investments 1,027,443$
Investments Not Categorized:
BlackRock Money Muni Fund 109 BlackRock Temp Fund 3,317 Columbia Government Fund - Trinity Escrow Fund 546 Columbia Government Fund - Oncor Escrow Fund 55 First American Government Obligation Money Market Fund 14,772 Bank of American Money Market Fund 16,000 Fidelity Money Market Fund 9,000 LOGIC Local Government Investment Pool 87,000 Federated Tax-Free Fund 3 AIM Government Fund 20 Reserve Primary Fund 4 Non-Expendable Trust Funds 9,724 Goldman Sachs Financial Square Tax-Free Money Market Funds 5,473 Wells Fargo Advantage Municipal Cash Mgt Money Market Funds 75 Morgan Stanley Prime Money Market Funds 3,000 TexPool - Money Market Mutual Funds 5,022 TexStar - Money Market Mutual Funds 4,085 Western Asset Prime Money Market Mutual Funds 33,089 Total Investments Not Categorized 191,294$
Total General and Investment Pool Programs 1,218,737$
Type of Investment Categorized Investments:
�������������
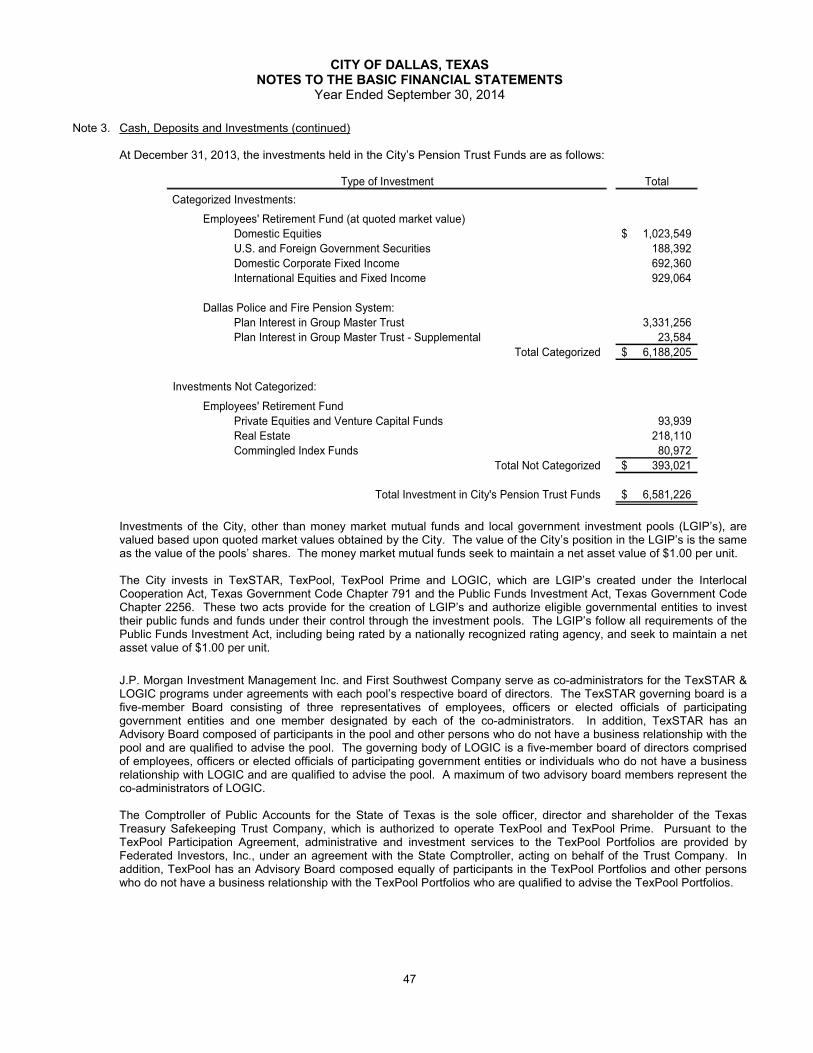
CITY OF DALLAS, TEXAS NOTES TO THE BASIC FINANCIAL STATEMENTS
Year Ended September 30, 2014 �
47 �
Note 3. Cash, Deposits and Investments (continued)
At December 31, 2013, the investments held in the City’s Pension Trust Funds are as follows:
Total
Employees' Retirement Fund (at quoted market value)Domestic Equities 1,023,549$ U.S. and Foreign Government Securities 188,392 Domestic Corporate Fixed Income 692,360 International Equities and Fixed Income 929,064
Dallas Police and Fire Pension System:Plan Interest in Group Master Trust 3,331,256 Plan Interest in Group Master Trust - Supplemental 23,584
Total Categorized 6,188,205$
Investments Not Categorized:
Employees' Retirement FundPrivate Equities and Venture Capital Funds 93,939 Real Estate 218,110 Commingled Index Funds 80,972
Total Not Categorized 393,021$
Total Investment in City's Pension Trust Funds 6,581,226$
Type of Investment Categorized Investments:
�Investments of the City, other than money market mutual funds and local government investment pools (LGIP’s), are valued based upon quoted market values obtained by the City. The value of the City’s position in the LGIP’s is the same as the value of the pools’ shares. The money market mutual funds seek to maintain a net asset value of $1.00 per unit. The City invests in TexSTAR, TexPool, TexPool Prime and LOGIC, which are LGIP’s created under the Interlocal Cooperation Act, Texas Government Code Chapter 791 and the Public Funds Investment Act, Texas Government Code Chapter 2256. These two acts provide for the creation of LGIP’s and authorize eligible governmental entities to invest their public funds and funds under their control through the investment pools. The LGIP’s follow all requirements of the Public Funds Investment Act, including being rated by a nationally recognized rating agency, and seek to maintain a net asset value of $1.00 per unit.
�J.P. Morgan Investment Management Inc. and First Southwest Company serve as co-administrators for the TexSTAR & LOGIC programs under agreements with each pool’s respective board of directors. The TexSTAR governing board is a five-member Board consisting of three representatives of employees, officers or elected officials of participating government entities and one member designated by each of the co-administrators. In addition, TexSTAR has an Advisory Board composed of participants in the pool and other persons who do not have a business relationship with the pool and are qualified to advise the pool. The governing body of LOGIC is a five-member board of directors comprised of employees, officers or elected officials of participating government entities or individuals who do not have a business relationship with LOGIC and are qualified to advise the pool. A maximum of two advisory board members represent the co-administrators of LOGIC. The Comptroller of Public Accounts for the State of Texas is the sole officer, director and shareholder of the Texas Treasury Safekeeping Trust Company, which is authorized to operate TexPool and TexPool Prime. Pursuant to the TexPool Participation Agreement, administrative and investment services to the TexPool Portfolios are provided by Federated Investors, Inc., under an agreement with the State Comptroller, acting on behalf of the Trust Company. In addition, TexPool has an Advisory Board composed equally of participants in the TexPool Portfolios and other persons who do not have a business relationship with the TexPool Portfolios who are qualified to advise the TexPool Portfolios.

CITY OF DALLAS, TEXAS NOTES TO THE BASIC FINANCIAL STATEMENTS
Year Ended September 30, 2014 �
48 �
Note 3. Cash, Deposits and Investments (continued) At year end, the following deposits and bank balance were covered by federal depository insurance or by collateral held by the City’s third-party agents pledged in the City’s name which is category 1 as defined in the Codification of Governmental Accounting Standards Section C20. “Cash Deposits with Financial Institutions.” The fair value of these deposits approximates their costs. The collateral pledged to the City is held in a joint safekeeping account at the Federal Reserve Bank.
Primary Government Carrying Value Bank Balance
Pooled Demand Deposits -$ 165,204$ Cash and cash equivalents - Pension Trust Funds 434,368 434,368
Total 434,368$ 599,572$
�Plan interest in Group Master Trust The Dallas Police and Fire Pension System’s (the System) investments are held in the Group Master Trust (Group Trust). JP Morgan Chase served as custodian for the year ended December 31, 2013. The book value of the System interests in the Group Trusts is based on the unitized interests that it has in the Group Trust. The System’s interest in the Group Trust was approximately 99.29% at December 31, 2013. The Supplemental Plan’s interest in the Group Trust was approximately 0.71% at December 31, 2013. The allocation of investment income between the System and the Supplemental Plan is based on the number of units owned of the Group Trust. Benefits, contributions and administrative expenses are allocated to each plan directly.
This remainder of this page intentionally left blank.
��

CITY OF DALLAS, TEXAS NOTES TO THE BASIC FINANCIAL STATEMENTS
Year Ended September 30, 2014 �
49 �
Note 3. Cash, Deposits and Investments (continued)
Investments and Plan Interest in Group Master Trust: The following disclosures on investments and plan interest in Group Trust are as of and for the year ended December 31, 2013. The following summarizes the book value of investments for the Group Trust as of December 31, 2013.
�Investments
Cash and cash equivalents 230,182$ United States Government Securities 12,831 United States government sponsored enterprises 6,392 Foreign government securities 74,385 Commingled funds 1,372,204 Domestic equities 498,951 International equities 296,781 Corporate securities 210,009
Investments - real estate equity funds 1,230,121 Total investments 3,931,856
ReceivablesAccrued interest and dividends 6,815 Forward currency contracts 47,997 Securities sold 13,504
Total receivables 68,316 Total assets 4,000,172
Liabilities and Net PositionPayable for securities purchased 663 Professional fees payable 2,336 Forward currency contracts 47,753 Securities lending collateral 174,237 Line of Credit 420,343
Total liabilities 645,332 Net position in the Group Trust 3,354,840$
����������������

CITY OF DALLAS, TEXAS NOTES TO THE BASIC FINANCIAL STATEMENTS
Year Ended September 30, 2014 �
50 �
Note 3. Cash, Deposits and Investments (continued)
Deposit and Investment Risk Disclosures GASB Statement No. 40, “Deposit and Investment Risk Disclosures,” requires disclosure information related to common risks inherent in deposit and investment transactions. Investments are subject to certain types of risks, including custodial credit risk, concentration of credit risk, interest rate risk and foreign currency risk. Exposure of deposited funds and investment risk are disclosed in the following sections of this note. Custodial Credit Risk Custodial credit risk is the risk that, in the event of the failure of the counterparty, the City will not be able to recover the value of its deposit or collateral securities that are in the possession of an outside party. The City’s pension plans do not have policies for custodial credit risk. As of September 30, 2014, $164,954 million was fully collateralized by U.S. Federal Agency securities and $250 thousand was insured by the Federal Deposit Insurance Corporation. The collateral pledged to the City is held in the City’s name at the Federal Reserve Bank. The FDIC insures demand accounts up to $250 thousand in the aggregate. At September 30, 2014, total uninsured deposits were $164,954 million. Fully collateralized and insured deposits held by custodian banks:
Demand Deposits $ 250 thousand
Safekeeping of investment securities is provided by the City’s depository and trust institutions. Securities are held in street name with the bank as nominee. As of September 30, 2014, the City’s investments held by the counterparty, and not insured, are as follows:
Security Type Fair Value
U.S. Agency Securities 1,027,443$ �
The Dallas Police and Fire Pension System security investments that were not subject to custodial credit risk were the investments in fixed income and equity investments. The Employees’ Retirement Fund had $2.7 million, or .08% of the total Plan investments of $3.3 billion exposed to custodial credit risk as follows:
�� � Uninsured and uncollateralized held by custodian bank outside the United States $ 2.7 million
Concentration of Credit Risk Investments that individually represent 5% or more of net portfolio assets are stated below. Investments issued or explicitly guaranteed by the U.S. government and investments in mutual funds and external investment pools are excluded. Concentration of Credit Risk (continued)
�
Agency Securities by Issuer Fair Value % of Total Portfolio
Federal Agricultural Mortgage Corporation (FMAC) 67,122$ 6.53%Federal National Mortgage Association (FNMA) 260,541 25.36%Federal Home Loan Mortgage Corporation (FHLMC) 257,102 25.02%Federal Home Loan Bank (FHLB) 275,325 26.80%Federal Farm Credit Bank (FFCB) 167,353 16.29%
Total Agency Securities 1,027,443$ 100.00%
�

CITY OF DALLAS, TEXAS NOTES TO THE BASIC FINANCIAL STATEMENTS
Year Ended September 30, 2014 �
51 �
Note 3. Cash, Deposits and Investments (continued) The Employees’ Retirement Fund board has contracted with investment managers to manage the investment portfolio of the Plan, subject to the policies and guidelines established by the board. Northern Trust Company, as the Plan’s custodian bank, had responsibility for the safekeeping of certain investments, handling of transactions based on the instructions of investment managers, and accounting for the investment transactions. The Plan had no investments that individually represented 5% or more of the net position available for benefits at December 31, 2013. The Plan’s concentration of credit risk policy is communicated to individual managers in their guidelines through limitations or restrictions to securities, sectors, debt ratings, and other factors that may be applicable to a particular manager. Credit Risk Credit risk is the risk that an issuer or other counterparty to an investment will not fulfill its obligations. Money market Mutual Funds and Local Government Investment Pools in the City’s portfolio are rated AAAm by Standard & Poor’s and/or Aaa by Moody’s. U.S. Treasury Notes and Bills are obligations of the U.S. government and are not considered to have credit risk and thus are not rated (NR). Long-term bond ratings are used for the U.S. Government Agencies. Ratings for the City’s portfolio are listed on the following table.
Security Type Fair Value % of Total
Portfolio S&P/Moody's
Ratings
Money Market Mutual Funds and Pools 191,294$ 15.70% AAAm/AaaU.S. Agency Securities 1,027,443 84.30% AAA/Aaa
Total Portfolio 1,218,737$ 100.00%
�Credit Risk (continued) The Employees’ Retirement Fund Investment policy allocates 30 percent of the total assets to fixed income. The policy provides for investments of up to 15 percent of fixed income assets in investment grade assets and up to 15 percent of fixed income assets in below investment grade assets. The investment grade allocation allows the managers to invest up to 20 percent of their portfolio assets in non-US dollar issues. Long term bond ratings for the Employees’ Retirement fund as of December 31, 2013 are as follows on the subsequent page.
The remainder of this page intentionally left blank.

CITY OF DALLAS, TEXAS NOTES TO THE BASIC FINANCIAL STATEMENTS
Year Ended September 30, 2014 �
52 �
Note 3. Cash, Deposits and Investments (continued)
Quality Rating Fair Value % of Bond
Portfolio AAA 114,022$ 12.93%AA+ 14,117 1.61%AA 7,002 0.80%AA- 12,449 1.41%A+ 3,975 0.45%A 26,054 2.96%A- 47,948 5.44%BBB+ 25,208 2.86%BBB+ 20,802 2.36%BBB- 18,355 2.08%BB+ 33,616 3.82%BB 49,455 5.62%BB- 79,946 9.08%B+ 68,770 7.81%B 74,347 8.44%B- 63,860 7.25%CCC+ 63,852 7.25%CCC 7,759 0.88%CCC- 2,165 0.25%CC 1,475 0.17%DDD 538 0.06%D 421 0.05%Not Rated 70,500 8.00%U.S. Government fixed income securities - NR 74,116 8.42%
Total 880,752$ 100.00%
�������������

CITY OF DALLAS, TEXAS NOTES TO THE BASIC FINANCIAL STATEMENTS
Year Ended September 30, 2014 �
53 �
Note 3. Cash, Deposits and Investments (continued)
Credit Risk (continued)
The Dallas Police and Fire Pension System does not have a formal policy limiting investment credit risk, but rather mandates such limits within the Investment Management Services Contract. The System’s exposure to investment credit risk in fixed income securities as of December 31, 2013 is as follows:
�
Quality Rating
Corporate Bonds
U.S. Government
Treasury Securities
U.S. Government
Agencies
Foreign Government Securities
Grand Total Book Value
Percentage of Holdings
AAA 10,073$ -$ -$ 9,598$ 19,671$ 6.48%AA+ 1,003 - - 5,997 7,000 2.31%AA 2,148 - - - 2,148 0.71%AA- 1,780 - - 5,305 7,085 2.33%A+ 1,592 - - 5,339 6,931 2.28%A 2,987 - - 8,730 11,717 3.86%A- 3,052 - - 14,354 17,406 5.73%BBB+ 436 - - 2,070 2,506 0.83%BBB+ 4,370 - - 235 4,605 1.52%BBB- 4,952 - - - 4,952 1.63%BB+ 12,324 - - - 12,324 4.06%BB 20,956 - - 1,575 22,531 7.42%BB- 26,137 - - 1,197 27,334 9.00%B+ 4,507 - - 71 4,578 1.51%B 10,764 - - - 10,764 3.55%B- 4,772 - - - 4,772 1.57%Below CCC 75,518 - - - 75,518 24.86%NA 22,638 12,831 6,392 19,914 61,775 20.35%Subtotal 210,009$ 12,831$ 6,392$ 74,385$ 303,617$ 100.00%
Total credit risk debt securities 303,617$ 7.72%Other investments 3,628,239 92.28%Total investments 3,931,856$ 100.00%
�
The remainder of this page intentionally left blank. �����������
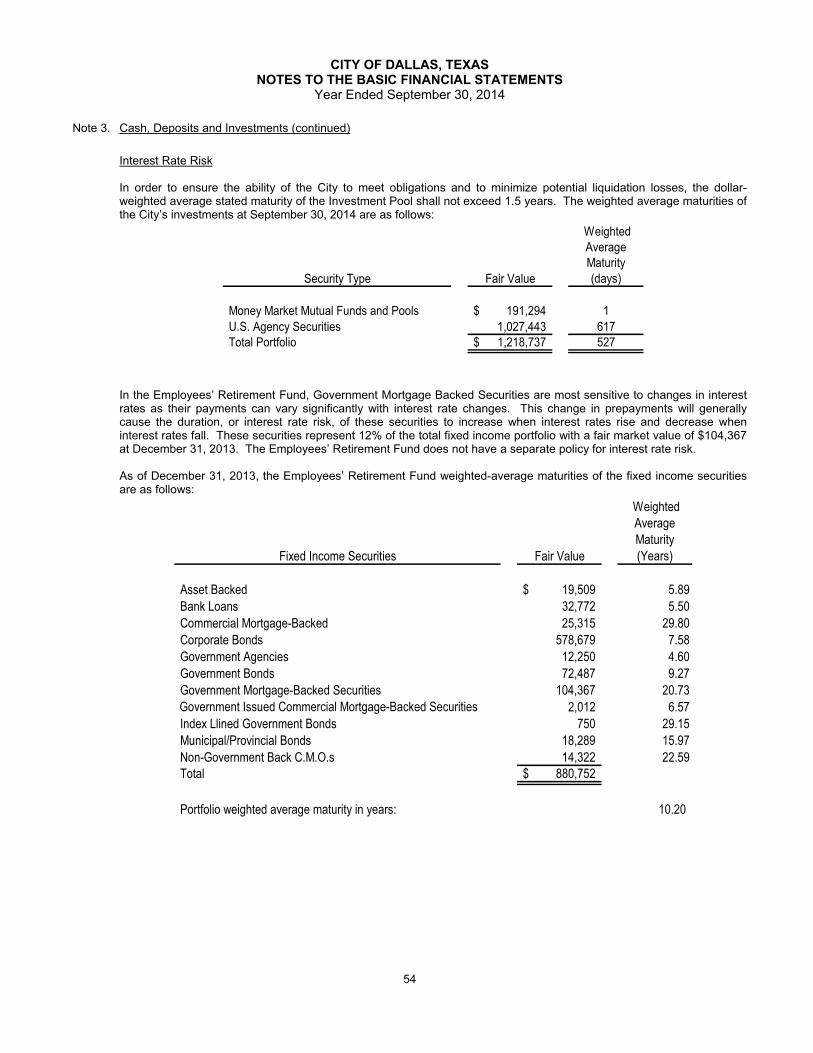
CITY OF DALLAS, TEXAS NOTES TO THE BASIC FINANCIAL STATEMENTS
Year Ended September 30, 2014 �
54 �
Note 3. Cash, Deposits and Investments (continued) �
Interest Rate Risk In order to ensure the ability of the City to meet obligations and to minimize potential liquidation losses, the dollar-weighted average stated maturity of the Investment Pool shall not exceed 1.5 years. The weighted average maturities of the City’s investments at September 30, 2014 are as follows:
Security Type Fair Value
Weighted Average Maturity (days)
Money Market Mutual Funds and Pools 191,294$ 1U.S. Agency Securities 1,027,443 617Total Portfolio 1,218,737$ 527
��
In the Employees’ Retirement Fund, Government Mortgage Backed Securities are most sensitive to changes in interest rates as their payments can vary significantly with interest rate changes. This change in prepayments will generally cause the duration, or interest rate risk, of these securities to increase when interest rates rise and decrease when interest rates fall. These securities represent 12% of the total fixed income portfolio with a fair market value of $104,367 at December 31, 2013. The Employees’ Retirement Fund does not have a separate policy for interest rate risk. As of December 31, 2013, the Employees’ Retirement Fund weighted-average maturities of the fixed income securities are as follows:
Fixed Income Securities Fair Value
Weighted Average Maturity (Years)
Asset Backed 19,509$ 5.89Bank Loans 32,772 5.50Commercial Mortgage-Backed 25,315 29.80Corporate Bonds 578,679 7.58Government Agencies 12,250 4.60Government Bonds 72,487 9.27Government Mortgage-Backed Securities 104,367 20.73
Government Issued Commercial Mortgage-Backed Securities 2,012 6.57Index Llined Government Bonds 750 29.15Municipal/Provincial Bonds 18,289 15.97Non-Government Back C.M.O.s 14,322 22.59Total 880,752$
Portfolio weighted average maturity in years: 10.20�
�������

CITY OF DALLAS, TEXAS NOTES TO THE BASIC FINANCIAL STATEMENTS
Year Ended September 30, 2014 �
55 �
Note 3. Cash, Deposits and Investments (continued) �
Interest Rate Risk (continued) As of December 31, 2013, the Dallas Police and Fire Pension Plans had the following investments and maturities:
�
Book Value Less Than
1 Year 1 - 5 Years 6 - 10 Years More Than 10 Years
Fixed maturity domestic:U.S. Treasury Securities 12,832$ 320$ 4,492$ 2,009$ 6,011$ U.S. Gov't Agency Securities 6,392 - - - 6,392 Corporate Bonds 210,009 9,188 70,837 77,177 52,807
International government bonds:Australian Dollar 12,369 191 6,967 5,211 - Brazilian Real 764 - 235 529 - British Pound Sterling 3,880 3,880 - - - Canadian Dollar 2,390 - 2,390 - - EURO Currency 12,281 415 3,950 2,361 5,555 Hungarian Forint 1,576 - 1,576 - - Indonesian Rupiah 2,107 2,107 - - - Japanese Yen 4,249 671 2,312 580 686 Malaysian Ringgit 609 - - 609 - Mexican New Peso 13,383 - 1,619 3,446 8,318 New Zealand Dollar 2,471 - 1,023 1,448 - Polish New Zloty 7,518 - 3,324 4,194 - South African Rand 2,360 - - 842 1,518 South Korean Won 2,875 - 2,233 642 - Swedish Krona 5,554 1,354 - 4,200 -
Total 303,619$ 18,126$ 100,958$ 103,248$ 81,287$
Investment Type
Investment Maturity in Years
While the Plans do not have a specific investment policy to limit investment maturities as a means of managing their exposure to interest rate risk, the Plans do manage this exposure by mandating maturity limits within the Investment Management Service Contracts.
��������������

CITY OF DALLAS, TEXAS NOTES TO THE BASIC FINANCIAL STATEMENTS
Year Ended September 30, 2014 �
56 �
Note 3. Cash, Deposits and Investments (continued)
Foreign Currency Risk
The Employees’ Retirement Fund investment policies limit the aggregate amount that can be invested in each class of investments. The equity investment policy sets an allocation of 22.5% of assets to international equity. The fixed income policy permits up to 20% of the global manager’s portfolio to be invested in global investment grade fixed income bonds. The Fund’s positions in these equity securities, invested directly and through commingled funds, was 28.86% of invested assets at December 21, 2013. The Fund’s positions in such fixed income assets invested directly were 5.85% of invested assets at December 21, 2013. Employees’ Retirement fund non-US Dollar denominated investments at December 31, 2013 were as follows:
Currency Investment Type
Balance of Investment
(U.S. Dollars)
Australian Dollars Equity 14,983$ Australian Dollars Fixed Income 8,710 Austrian Schilling Equity 1,703 Belgian Franc Equity 5,649 Brazilian Real Equity 8,699 Brazilian Real Fixed Income 8,592 British Pound Sterling Equity 82,638 Canadian Dollars Equity 41,690 Danish Krone Equity 1,318 Dutch Guilder Equity 10,160 Euro Equity 13,147 Finnish Markka Equity 2,417 French Francs Equity 32,782 German Marks Equity 23,659 Hong Kong Dollars Equity 36,801 Hungarian Forint Equity 120 Indonesian Rupiahs Equity 2,841 Israeli Shekel Equity 885 Italian Lira Equity 10,511 Japanese Yen Equity 105,054 South Korean Won Equity 22,456 Malaysian Ringgit Equity 7,459 Mexican New Peso Equity 2,774 Mexican New Peso Fixed Income 8,600 Norwegian Krone Equity 20,602 Phillipino Peso Equity 299 Polish Zlotych Equity 3,692 Portuguese Escudos Equity 1,276 Singaporean Dollars Equity 5,080 South African Rand Equity 6,983 Spanish Pesos Equity 7,608 Swedish Krona Equity 7,080 Swiss Francs Equity 29,187 Thai Baht Equity 4,985 Turkish Lira Equity 4,733
545,173$
��
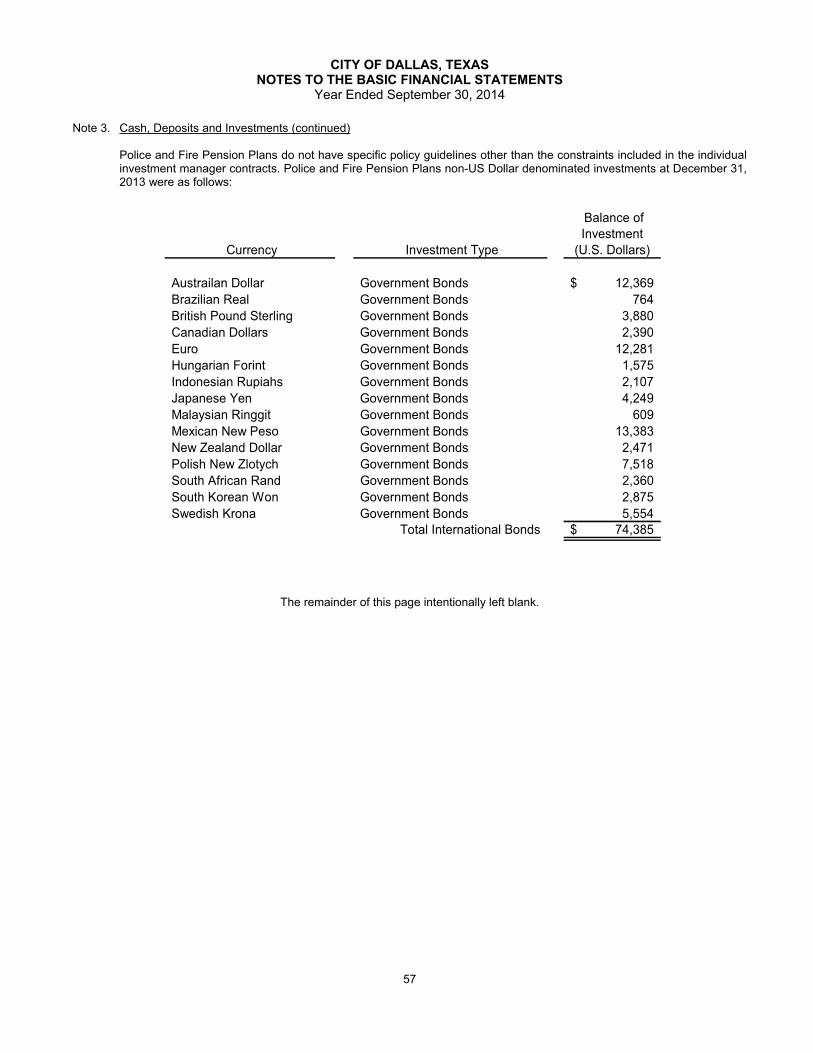
CITY OF DALLAS, TEXAS NOTES TO THE BASIC FINANCIAL STATEMENTS
Year Ended September 30, 2014 �
57 �
Note 3. Cash, Deposits and Investments (continued)
Police and Fire Pension Plans do not have specific policy guidelines other than the constraints included in the individual investment manager contracts. Police and Fire Pension Plans non-US Dollar denominated investments at December 31, 2013 were as follows:
�
Currency Investment Type
Balance of Investment
(U.S. Dollars)
Austrailan Dollar Government Bonds 12,369$ Brazilian Real Government Bonds 764 British Pound Sterling Government Bonds 3,880 Canadian Dollars Government Bonds 2,390 Euro Government Bonds 12,281 Hungarian Forint Government Bonds 1,575 Indonesian Rupiahs Government Bonds 2,107 Japanese Yen Government Bonds 4,249 Malaysian Ringgit Government Bonds 609 Mexican New Peso Government Bonds 13,383 New Zealand Dollar Government Bonds 2,471 Polish New Zlotych Government Bonds 7,518 South African Rand Government Bonds 2,360 South Korean Won Government Bonds 2,875 Swedish Krona Government Bonds 5,554
Total International Bonds 74,385$
���
The remainder of this page intentionally left blank. ��

CITY OF DALLAS, TEXAS NOTES TO THE BASIC FINANCIAL STATEMENTS
Year Ended September 30, 2014 �
58 �
Note 4. Receivables
Receivables at September 30, 2014 for the government’s individual major and nonmajor governmental and internal service funds, including the applicable allowances for uncollectible accounts, consist of the following:
�
General Debt
Service Nonmajor
Internal Service Funds
Total Governmental
Activities
Ad valorem tax 28,179$ 12,511$ -$ -$ 40,690$ Sales tax 43,892 - - - 43,892 Notes 98 - 60,021 - 60,119 Accounts 93,314 - 48,169 89 141,572 Accrued interest 145 3 552 47 747 Due from other governments - - 19,917 - 19,917 Special Assessments - paving notes - - 5,419 - 5,419 Gross receivables 165,628 12,514 134,078 136 312,356 Less allowance for doubtful accounts (54,976) (10,695) (33,136) - (98,807)
110,652$ 1,819$ 100,942$ 136$ 213,549$
Receivables:
Net total receivables
�Receivables at September 30, 2014 for the primary government’s individual major and nonmajor enterprise funds in the aggregate including the applicable allowances for uncollectible accounts, consist of the following:
Dallas Water Utilities
Convention Center
Airport Revenues
Nonmajor Enterprise
Total Business-
type Activities
Accounts 73,142$ 3,739$ 4,730$ 519$ 82,130$ Taxes - 6,777 - - 6,777 Accrued interest 437 67 82 41 627 Due from other governments - - 10,121 - 10,121 Gross receivables 73,579 10,583 14,933 560 99,655 Less allowance for doubtful accounts (10,108) (636) (1) (2) (10,747)
Net total receivables 63,471$ 9,947$ 14,932$ 558$ 88,908$
Receivables:
�Governmental funds report deferred inflows in connection with receivables for revenues that are not considered to be available to liquidate liabilities of the current period. Governmental funds also defer revenue recognition in connection with resources that have been received, but not yet earned. Intergovernmental revenues and related receivables arise through funding received from federal and state grants. These revenues and receivables are earned through expenditures of monies for grant purposes. At September 30, 2014, the various components of deferred inflows – unavailable revenue and unearned revenue reported in the governmental funds were as follows:
Total Governmental
Unearned
Deferred Inflows Unavailable
Revenue
Taxes -$ 4,527$ Accounts 6,702 28,958 Intergovernmental 44,848 40,694 Total 51,550$ 74,179$
�

CITY OF DALLAS, TEXAS NOTES TO THE BASIC FINANCIAL STATEMENTS
Year Ended September 30, 2014 �
59 �
Note 5. Restricted Assets
The primary government’s governmental and business-type restricted assets of $343 million and $557 million, respectively, are composed of the following at September 30, 2014:
Governmental
Activities Business-Type
Activities
Cash and Investments:Pooled Cash and Cash Equivalents 343,330$ 234,896$ Other Investments - 108,857
Future pipeline reserve capacity rights - 212,663 Customer Assessments - 624
Total 343,330$ 557,040$
�The restricted amounts are for accumulated resources for debt service payments, deposits from service users, unspent bond and other proceeds for construction, retention guarantees from contractors, and future pipeline reserve capacity rights (see Note 10.R for additional information).
Note 6. Joint Ventures
Dallas/Fort Worth International Airport (DFW) DFW Airport is owned jointly by the cities of Dallas and Fort Worth and operated by a 12-member board comprised of seven members from Dallas and four members from Fort Worth appointed by the respective City Councils. One additional non-voting member is appointed from the neighboring cities of Irving, Grapevine, Euless, and Coppell on a rotating basis. Joint Revenue Bonds were previously issued to construct DFW Airport. Additional bonds have been issued for the purpose of improving, constructing, replacing, or otherwise extending DFW. Revenues derived from the ownership and operations of the Airport are pledged to meet debt service requirements of the bonds issued pursuant to the Controlling Ordinances. The Controlling Ordinances require DFW to annually adopt a schedule of charges that is: (1) reasonably estimated to produce gross revenues in an amount at least sufficient to pay operation and maintenance expense plus 1.25 times accrued aggregate debt service and (2) reasonably estimated to at least produce current gross revenues in an amount at least sufficient to pay operation and maintenance expense plus 1.00 times accrued aggregate debt service. The outstanding debt and related debt service are accounted for by the DFW Airport Board. The Joint Revenue Bonds outstanding at September 30, 2014 were $6.7 billion which is net of unamortized discount/premium. The summary financial information for DFW Airport as of September 30, 2014 is presented below and is not included in the City’s financial statements. �
Total assets and deferred outflows of resources 7,767,057$ Less: Total liabilities (7,066,105) Total net position 700,952$
Operating revenues 624,662$ Non-operating revenues (expenses) (91,907) Less: Operating expenses (667,660) Plus: Capital contributions 15,984 Less: Special item (12,281) Change in net position (131,202) Net position, beginning of year 949,710 Restatement - Change in accounting principle (117,556) Net position, end of year 700,952$
���

CITY OF DALLAS, TEXAS NOTES TO THE BASIC FINANCIAL STATEMENTS
Year Ended September 30, 2014 �
60 �
Note 6. Joint Ventures (continued)
Dallas/Fort Worth International Airport (continued) The Board has entered into agreements with air carriers and other parties utilizing DFW Airport to provide for adjustments to rentals, fees and other charges which management believes precludes the need for a maintenance tax. To date, the cities have levied no maintenance tax. To obtain the financial statements of the joint venture contact the finance department of DFW Airport at (972) 973-5443.
�Note 7. Capital Assets
Capital asset activity for the year ended September 30, 2014 is as follows:
Balance, Beginning of
Year Additions
Transfers and
Retirements
Balance, End
of Year Governmental Activities:Capital assets, not being depreciated:
Land 478,654$ 7,262$ (482)$ 485,434$ Artwork 49,197 154 - 49,351 Construction in progress 340,489 201,086 (261,164) 280,411
Total capital assets, not being depreciated 868,340 208,502 (261,646) 815,196 Capital assets, being depreciated:
Buildings 1,222,996 30,118 - 1,253,114 Improvements other than buildings 592,135 71,310 - 663,445 Equipment 581,417 57,707 (12,195) 626,929 Infrastructure assets 2,010,629 186,956 - 2,197,585
Total capital assets, being depreciated: 4,407,177 346,091 (12,195) 4,741,073 Less accumulated depreciation for:
Buildings (450,310) (24,566) - (474,876) Improvements other than buildings (155,171) (16,923) - (172,094) Equipment (443,941) * (33,500) 12,007 (465,434) Infrastructure assets (812,780) * (35,263) - (848,043)
Total accumulated depreciation (1,862,202) (110,252) 12,007 (1,960,447) Total capital assets being depreciated, net 2,544,975 235,839 (188) 2,780,626 Governmental activities capital assets, net 3,413,315$ 444,341$ (261,834)$ 3,595,822$
* Accumulated depreciation in the amount of $20,150 has been reclassified between equipment and infrastructure assets. �
�Depreciation expense charged to functions:
General government 16,299$ Public safety 10,925 Streets, street lighting, sanitation and code enforcement 4,955 Environment and health services 295 Public works and transportation 43,014 Equipment and building services 13,588 Culture and recreation 20,888 Housing 240 Human Services 48
Total depreciation expense - governmental activities 110,252$ (includes $4,491 of depreciation expense for the Internal Service Funds �

CITY OF DALLAS, TEXAS NOTES TO THE BASIC FINANCIAL STATEMENTS
Year Ended September 30, 2014 �
61 �
Note 7. Capital Assets (continued) �
Balance, Beginning
of Year Additions Deletions Balance, End
of Year Business-type Activities:Capital assets, not being depreciated:
Land 225,107$ 2,610$ -$ 227,717$ Artwork 2,276 - - 2,276 Construction in progress 639,248 345,624 (356,602) 628,270
Total capital assets, not being depreciated 866,631 348,234 (356,602) 858,263 Capital assets, being depreciated:
Water rights 353,910 - - 353,910 Buildings 1,660,421 96,622 (9,966) 1,747,077 Improvements other than buildings 378,530 35,949 (42) 414,437 Equipment 600,599 53,152 (2,188) 651,563 Infrastructure assets 555,480 35,288 (284) 590,484 Utililty property 3,360,900 155,874 (2,193) 3,514,581
Total capital assets, being depreciated: 6,909,840 376,885 (14,673) 7,272,052 Less accumulated depreciation for:
Water rights (105,725) (3,539) - (109,264) Buildings (499,526) (37,617) 7,805 (529,338) Improvements other than buildings (80,882) (11,067) 30 (91,919) Equipment (409,419) (24,179) 2,188 (431,410) Infrastructure assets (221,150) (9,650) - (230,800) Utility property (867,573) (64,155) 1,684 (930,044)
Total accumulated depreciation (2,184,275) (150,207) 11,707 (2,322,775) Total capital assets being depreciated, net 4,725,565 226,678 (2,966) 4,949,277 Business-type activities capital assets, net 5,592,196$ 574,912$ (359,568)$ 5,807,540$
�Depreciation expense charged to business-type activities:
Dallas Water Utillities 108,386$ Convention Center 17,485 Aiport Revenues 24,176 Nonmajor Enterprise Funds 160 Total depreciation expense - business-type activities 150,207$
� The Airport Revenues fund reported a special item related to stopping construction on certain Love Field projects. The loss totaled $6.4 million.
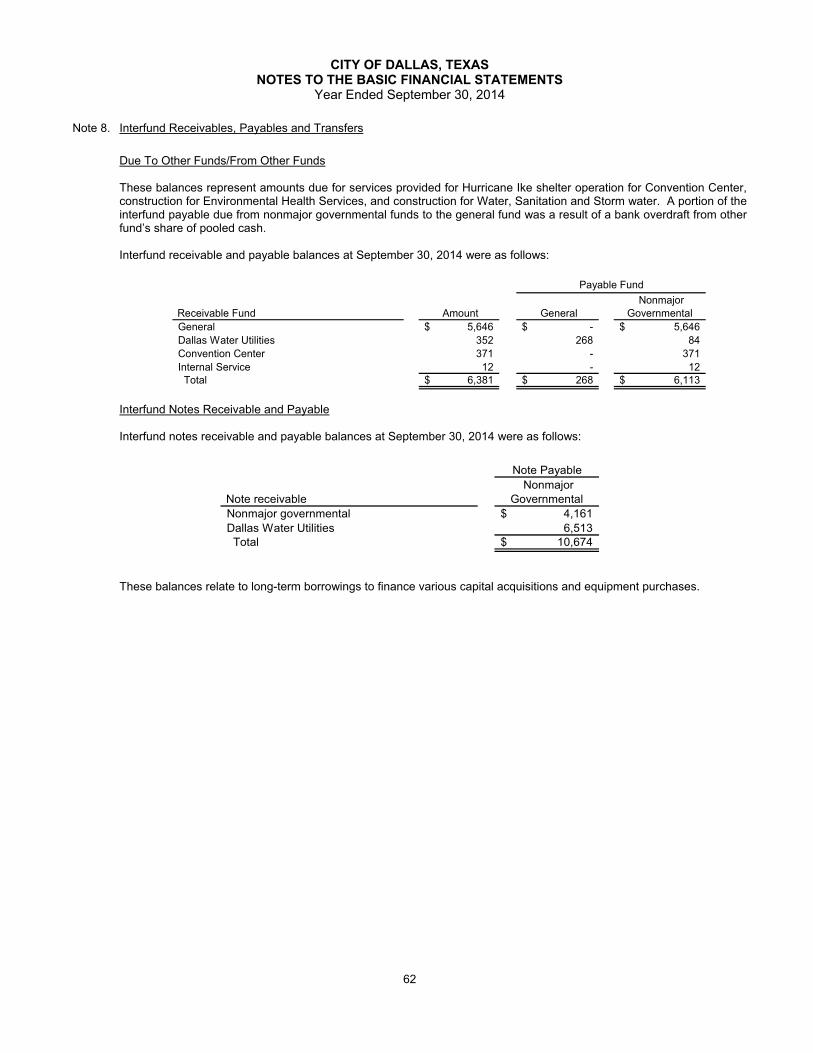
CITY OF DALLAS, TEXAS NOTES TO THE BASIC FINANCIAL STATEMENTS
Year Ended September 30, 2014 �
62 �
Note 8. Interfund Receivables, Payables and Transfers �
Due To Other Funds/From Other Funds These balances represent amounts due for services provided for Hurricane Ike shelter operation for Convention Center, construction for Environmental Health Services, and construction for Water, Sanitation and Storm water. A portion of the interfund payable due from nonmajor governmental funds to the general fund was a result of a bank overdraft from other fund’s share of pooled cash. Interfund receivable and payable balances at September 30, 2014 were as follows:
Receivable Fund Amount General Nonmajor
Governmental General 5,646$ -$ 5,646$ Dallas Water Utilities 352 268 84 Convention Center 371 - 371 Internal Service 12 - 12 Total 6,381$ 268$ 6,113$
Payable Fund
�Interfund Notes Receivable and Payable Interfund notes receivable and payable balances at September 30, 2014 were as follows: �
Note Payable
Note receivable Nonmajor
Governmental Nonmajor governmental 4,161$ Dallas Water Utilities 6,513 Total 10,674$
��
These balances relate to long-term borrowings to finance various capital acquisitions and equipment purchases.

CITY OF DALLAS, TEXAS NOTES TO THE BASIC FINANCIAL STATEMENTS
Year Ended September 30, 2014 �
63 �
Note 8. Interfund Receivables, Payables and Transfers (continued)
Transfers In/Out Transfers made between funds during the fiscal year are listed below:
Transfers In Amount
Transferred General Nonmajor
Governmental Dallas Water
Utilities Convention
Center Airport
Revenues
Nonmajor Enterprise
Funds Internal Service
General 22,065$ -$ 131$ 12,368$ 6,800$ -$ -$ 2,766$ Debt Service 17,240 5,470 6,044 291 1,493 232 109 3,601 Nonmajor Governmental 17,717 491 5,561 10,600 930 - 135 - Dallas Water Utilities 950 - 950 - - - - - Total 57,972$ 5,961$ 12,686$ 23,259$ 9,223$ 232$ 244$ 6,367$
Transfers Out
�These transfers were primarily for support of operation and maintenance, construction projects, equipment purchases, and to service the debt associated with the respective funds. Transfers were also made from Dallas Water Utilities fund for payments-in-lieu-of-taxes (PILOT), which are recorded as transfers rather than operation and maintenance expenses due to the nonreciprocal nature of the transactions. Under the terms of the bond ordinance, PILOT and other similar payments are not considered operation and maintenance of the Water Utilities Fund; therefore, they are not included in the debt coverage calculation. A transfer was made from the Convention Center to the General fund for the sports arena lease. Transfers were made from the internal service and nonmajor governmental funds to the general fund for payments related to lease agreements.
Note 9. Accounts Payable and Accrued Expenses
The primary government’s accounts payable and accrued expenses at September 30, 2014 are as follows: �
General Nonmajor
Governmental Internal Service
Total Governmental
Activities Accrued payroll 26,124$ 18$ -$ 26,142$ Accounts payable 27,261 13,501 8,218 48,980 Due to other governments 3,218 2,126 - 5,344 Construction accounts payable - 67,342 - 67,342 Contracts payable - 13,846 - 13,846 Other 1,426 2,549 1,879 5,854 Total 58,029$ 99,382$ 10,097$ 167,508$
�
Dallas Water Utilities
Convention Center
Airport Revenues Nonmajor
Total Business-type
Activities Accounts payable 13,345$ 6,359$ 8,881$ 324$ 28,909$ Due to other governments - 5 - - 5 Construction accounts payable 57,773 2,786 15,665 - 76,224 Other - - - 994 994 Total 71,118$ 9,150$ 24,546$ 1,318$ 106,132$
�

CITY OF DALLAS, TEXAS NOTES TO THE BASIC FINANCIAL STATEMENTS
Year Ended September 30, 2014 �
64 �
Note 10. Long-Term Debt
A. Governmental Activities
The changes in the governmental activities long-term liabilities for the year ended September 30, 2014 are as follows:
Beginning Balance Additions Deletions
Ending Balance
Due Within One Year
Refunding Bonds Series 2003-A 7,860$ -$ 7,860$ -$ -$ Refunding Bonds Series 2005 53,425 - 16,335 37,090 19,120 Series 2005 9,405 - 9,405 - - Series 2006 23,350 - 11,675 11,675 11,675 Series 2007 78,455 - 6,540 71,915 6,540 Refunding Series 2007A 192,955 - 19,490 173,465 19,455 Series 2008 143,545 - 11,045 132,500 11,045 Refunding Series 2010A 176,900 - 7,975 168,925 8,250 Building America Bonds Series 2010B 85,380 - - 85,380 - Refunding Bonds Series 2010C 134,200 - 10,070 124,130 18,810 Refunding Bonds Series 2012 210,380 6,540 203,840 3,510 Refunding Bonds Series 2013A 194,470 - 10,240 184,230 10,240 Refunding Bonds Series 2013B 42,615 - - 42,615 300
Series 2005 960 480 480 480 Series 2010 8,415 - 4,210 4,205 4,205
Series 2004 685 - 685 - - Series 2005 1,470 - 720 750 750 Series 2007 2,440 - 610 1,830 610 Series 2008A 3,000 - 600 2,400 600 Series 2010 5,990 - 4,915 1,075 215 Series 2012 20,140 - 1,945 18,195 1,985
Taxable Series 2005A 93,259 - 4,482 88,777 - Series 2005B 70,340 - 4,943 65,397 6,452 Taxable Refunding Bonds Series 2010 56,873 - - 56,873 -
Total Bonds, Obligations, and Certificates 1,616,512 - 140,765 1,475,747 124,242 Add: Unamortized Premium/Discount 196,122 - 19,370 176,752 - Add: Accretion 92,811 15,977 6,950 101,838 - Total Bonds, Obligations, and Certificates 1,905,445 15,977 167,085 1,754,337 124,242 Other Liabilities:
Commercial paper notes payable - 26,475 - 26,475 - Compensated absences 120,063 53,452 52,064 121,451 54,469 Other postemployment benefits 175,095 30,612 11,880 193,827 - Landfill closure/post closure 33,194 1,591 211 34,574 243 Pollution remediation 8,378 1,333 4,262 5,449 1,708 Developer payable 35,543 48,052 27,538 56,057 10,638 Estimated unpaid claims 64,986 76,976 79,621 62,341 18,576 Notes payable 31,635 1,708 941 32,402 975 Net pension obligation 21,723 114,314 108,268 27,769 - Sales tax refund liability 12,193 - 1,292 10,901 9,557 Capital leases 17,737 13,433 4,179 26,991 6,121
Total other liabilities 520,547 367,946 290,256 598,237 102,287 Total governmental long-term debt 2,425,992$ 383,923$ 457,341$ 2,352,574$ 226,529$
General Obligation Bonds
Equipment Acquisition Obligations
Tax and Revenue Certificates
Pension Obligation Bonds
����

CITY OF DALLAS, TEXAS NOTES TO THE BASIC FINANCIAL STATEMENTS
Year Ended September 30, 2014 �
65 �
Note 10. Long-Term Debt (continued)
The liabilities for the arbitrage rebate and commercial paper notes will be fully liquidated by the Debt Service Fund. The liabilities for the compensated absences and other postemployment benefits will be liquidated by General Fund, Community Development Fund, Health and Human Services Fund, Library Fund, Police Fund, Recreation Fund, Management Improvement Fund, Storm Water Operations Fund, Municipal Fund, General Citizen Fund, Equipment Services Fund, Communication Equipment Services Fund, Office Services Fund, Information Systems Fund, and the Risk Fund. The liabilities for the landfill closure/post closure and pollution remediation will be fully liquidated by the General Fund. The liability for the developer payable will be liquidated by the Neighborhood Projects Fund. The entire estimated unpaid claims liability is reported in the Risk Fund and will be liquidated by that fund. The liabilities for the notes payable, net pension obligation, sales tax refund, and capital leases will be liquidated by the General Fund.
�B. Governmental General Obligation Bonds (GO Bonds)
General obligation bonds are direct obligations of the City for which its full faith and credit are pledged and are payable from taxes levied on all taxable property located within the City. The General Obligation Bonds outstanding as of September 30, 2014 are as follows:
����������
The Equipment Acquisition Contractual Obligations outstanding as of September 30, 2014 are as follows:
Final Interest Rates Amount
Series 608 2015 3.5% to 4.0% 480$ Series 633 2015 3.0% to 5.0% 4,205 Total 4,685$
�The Certificates of Obligation outstanding as of September 30, 2014 are as follows:
� Final Interest Rates Amount
Series 607 2015 3.75% to 4.125% 750$ Series 617 2017 3.50% to 4.00% 1,830 Series 622 2018 3.50% to 5.00% 2,400 Series 629 2019 2.00% to 4.00% 1,075 Series 635 2022 2.00% to 5.00% 18,195 Total 24,250$
�
Final Interest Rates Amount Series 604 2020 5.00% 37,090$ Series 611 2026 4.5% to 5% 11,675 Series 614 2027 5.0% to 5.25% 71,915 Series 615 2027 4.0% to 5.0% 173,465 Series 620 2028 4.0% to 5.25% 132,500 Series 627 2020 3.0% to 5.0% 168,925 Series 628 2030 4.39% to 5.61% 85,380 Series 631 2023 3.0% to 5.0% 124,130 Series 637 2026 2.0% to 5.0% 203,840 Series 638 2032 0.76% to 5.0% 226,845 Total 1,235,765$

CITY OF DALLAS, TEXAS NOTES TO THE BASIC FINANCIAL STATEMENTS
Year Ended September 30, 2014 �
66 �
Note 10. Long-Term Debt (continued)
The Pension Obligation Bonds outstanding as of September 30, 2014 are as follows:
Final Interest Rates Amount Series 600 2035 3.24% to 5.19% 88,777$ Series 601 2035 4.10% to 5.48% 65,397 Series 632 2024 0.295% to 4.66% 56,873 Total 211,047$
�C. Long-term Notes Payable
In fiscal year 2014 and previous fiscal years, the City issued notes for the purpose of making utility efficiency improvements to various buildings owned by the City and for building improvements. These notes are payable in quarterly installments. In addition, the City recorded three U.S. Department of Housing and Urban Development Section 108 HUD notes. The total outstanding notes payable as of September 30, 2014 are as follows:
Final
Maturity Payments Due Interest Rates Amount
Suntrust 2018 Quarterly 1.89% 2,443$ State Energy Conservation Office 2015 Quarterly 3.00% 409 State Energy Conservation Office N/A N/A N/A 1,708 Section 108 B-09-MC-48-0009 2021 Semi-Annually Variable 7,600 Section 108 B-09-MC-48-0009-A 2032 Quarterly Variable 11,750 Section 108 B-09-MC-48-0009-B 2022 Quarterly Variable 8,492 Total 32,402$
��
D. General Obligation Commercial Paper Notes
The commercial paper notes are supported by two credit agreements through two banks. The credit agreement supporting Series A notes is through JP Morgan Chase, and extends through December 2, 2016. The Series A has an aggregate available principal amount not to exceed approximately $214.8 million, which includes $200 million of principal together with approximately $14.8 million of accrued interest for a maximum maturity date not to exceed 270 days at a rate not to exceed 10% per annum. The credit agreement supporting Series C notes, through Wells Fargo Bank extends to December 2, 2016. The Series C has an aggregate available principal amount not to exceed approximately $161.1 million, which includes $150 million of principal together with $11.1 million of accrued interest for a maximum maturity date not to exceed 270 days at a rate not to exceed 10% per annum. The two commercial paper programs constitute an obligation subordinate to the City’s general obligation bonds. Any advances for payments of commercial paper under the line of credit are secured by proceeds of the applicable portion of the tax levy as set forth in the Credit Agreements. During fiscal year 2014, $26.5 million was issued. Upon maturity, the notes will be remarketed by the commercial paper dealers or extinguished with long-term debt.
The remainder of this page intentionally left blank. �
��������

CITY OF DALLAS, TEXAS NOTES TO THE BASIC FINANCIAL STATEMENTS
Year Ended September 30, 2014 �
67 �
Note 10. Long-Term Debt (continued)
E. Governmental Debt Service Requirements
The following is a summary of the future debt service principal and interest payment requirements for the City’s General Obligation, Equipment Acquisition Obligations, Tax Increment Bonds, Pension Obligation Bonds and Contractual Obligations at September 30, 2014.
Fiscal Year Principal Interest Total
2015 124,242$ 75,827$ 200,069$ 2016 117,474 71,246 188,720 2017 113,426 66,263 179,689 2018 110,458 61,778 172,236 2019 108,501 58,064 166,565
2020-2024 559,200 158,891 718,091 2025-2029 262,065 179,742 441,807 2030-2034 69,223 179,311 248,534
2035 11,158 34,056 45,214 Total 1,475,747$ 885,178$ 2,360,925$
�
The following is a summary of the future principal and interest payment requirements for the City’s long-term notes payable at September 30, 2014.
Fiscal Year Principal Interest Total
2015 975$ 338$ 1,313$ 2016 1,177 307 1,484 2017 2,711 284 2,995 2018 2,736 227 2,963 2019 1,520 180 1,700
2020-2024 16,053 363 16,416 2025-2029 4,520 101 4,621 2030-2032 2,710 20 2,730
Total 32,402$ 1,820$ 34,222$
The remainder of this page intentionally left blank. �����������������
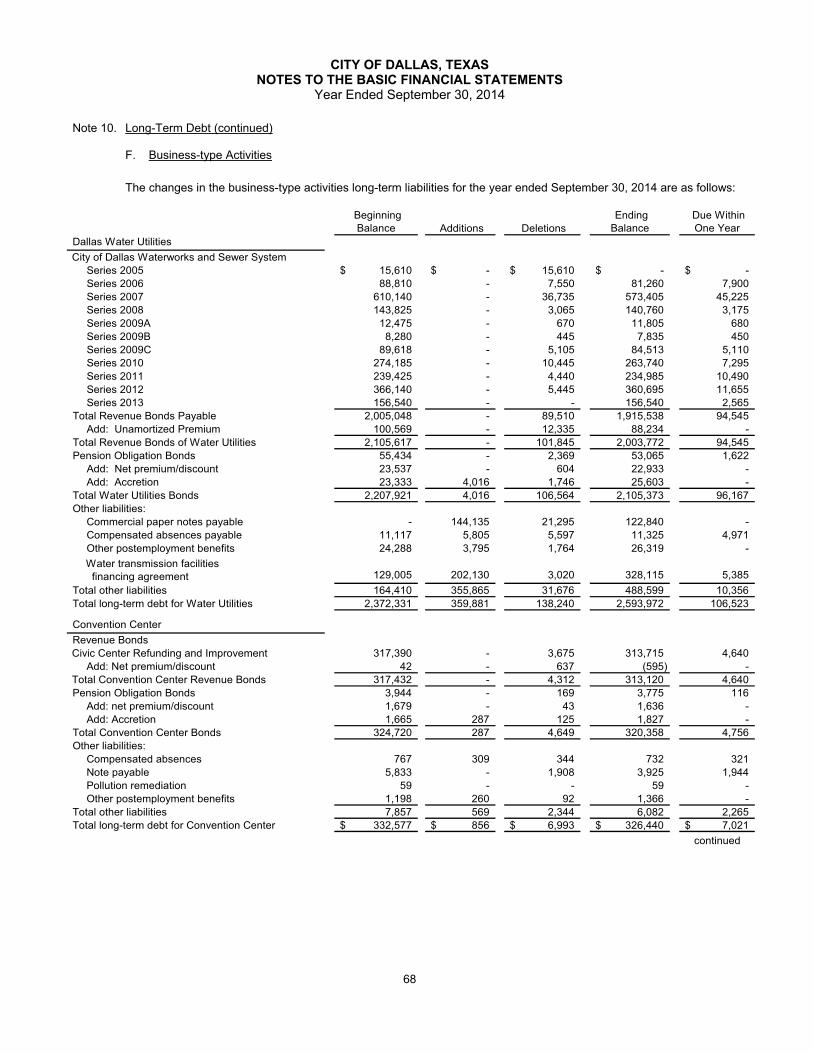
CITY OF DALLAS, TEXAS NOTES TO THE BASIC FINANCIAL STATEMENTS
Year Ended September 30, 2014 �
68 �
Note 10. Long-Term Debt (continued)
F. Business-type Activities �
The changes in the business-type activities long-term liabilities for the year ended September 30, 2014 are as follows:
Beginning Balance Additions Deletions
Ending Balance
Due Within One Year
Series 2005 15,610$ -$ 15,610$ -$ -$ Series 2006 88,810 - 7,550 81,260 7,900 Series 2007 610,140 - 36,735 573,405 45,225 Series 2008 143,825 - 3,065 140,760 3,175 Series 2009A 12,475 - 670 11,805 680 Series 2009B 8,280 - 445 7,835 450 Series 2009C 89,618 - 5,105 84,513 5,110 Series 2010 274,185 - 10,445 263,740 7,295 Series 2011 239,425 - 4,440 234,985 10,490 Series 2012 366,140 - 5,445 360,695 11,655 Series 2013 156,540 - - 156,540 2,565
Total Revenue Bonds Payable 2,005,048 - 89,510 1,915,538 94,545 Add: Unamortized Premium 100,569 - 12,335 88,234 -
Total Revenue Bonds of Water Utilities 2,105,617 - 101,845 2,003,772 94,545 Pension Obligation Bonds 55,434 - 2,369 53,065 1,622
Add: Net premium/discount 23,537 - 604 22,933 - Add: Accretion 23,333 4,016 1,746 25,603 -
Total Water Utilities Bonds 2,207,921 4,016 106,564 2,105,373 96,167 Other liabilities:
Commercial paper notes payable - 144,135 21,295 122,840 - Compensated absences payable 11,117 5,805 5,597 11,325 4,971 Other postemployment benefits 24,288 3,795 1,764 26,319 -
Water transmission facilities financing agreement 129,005 202,130 3,020 328,115 5,385
Total other liabilities 164,410 355,865 31,676 488,599 10,356 Total long-term debt for Water Utilities 2,372,331 359,881 138,240 2,593,972 106,523
Revenue Bonds317,390 - 3,675 313,715 4,640
Add: Net premium/discount 42 - 637 (595) - 317,432 - 4,312 313,120 4,640
Pension Obligation Bonds 3,944 - 169 3,775 116 Add: net premium/discount 1,679 - 43 1,636 - Add: Accretion 1,665 287 125 1,827 -
Total Convention Center Bonds 324,720 287 4,649 320,358 4,756 Other liabilities:
Compensated absences 767 309 344 732 321 Note payable 5,833 - 1,908 3,925 1,944 Pollution remediation 59 - - 59 - Other postemployment benefits 1,198 260 92 1,366 -
Total other liabilities 7,857 569 2,344 6,082 2,265 Total long-term debt for Convention Center 332,577$ 856$ 6,993$ 326,440$ 7,021$
continued
Dallas Water Utilities City of Dallas Waterworks and Sewer System
Convention Center
Civic Center Refunding and Improvement
Total Convention Center Revenue Bonds
�

CITY OF DALLAS, TEXAS NOTES TO THE BASIC FINANCIAL STATEMENTS
Year Ended September 30, 2014 �
69 �
Note 10. Long-Term Debt (continued)
Beginning Balance Additions Deletions
Ending Balance
Due Within One Year
Pension Obligation Bonds 5,194$ -$ 222 4,972$ 152$ Add: Net Premium/Discount 2,205 - 56 2,149 - Add: Accretion 2,187 376 164 2,399 -
Total Airport Bonds 9,586 376 442 9,520 152 Other Liabilities:
Compensated absences 1,492 742 811 1,423 625 Note payable 1,034 - 251 783 256 Pollution remediation 542 - 172 370 15 Obligation for Revenue Credit Agreement 446,095 - - 446,095 - Revenue credit agreement Net premium/discount (3,519) - 267 (3,786) - Other postemployment benefits 3,306 397 233 3,470 -
Total other liabilities 448,950 1,139 1,734 448,355 896 Total long-term debt for airport revenues 458,536 1,515 2,176 457,875 1,048
Pension Obligation Bonds 10,100 - 432 9,668 295 Add: Net premium/discount 4,288 - 110 4,178 - Add: Accretion 4,249 731 317 4,663 -
Total Non-Major Business-Type Bonds 18,637 731 859 18,509 295 Other liabilities:
Compensated absences 2,149 1,125 1,053 2,221 975 Other postemployment benefits 3,575 1,231 302 4,504 -
Total other liabilities 5,724 2,356 1,355 6,725 975 24,361 3,087 2,214 25,234 1,270
3,187,805$ 365,339$ 149,623$ 3,403,521$ 115,862$
Airport Revenues
Non-Major Business-Type
yp Business-type Funds long-term liabilities
G. Water Works and Sewer System Revenue Bonds and Pension Obligation Bonds
The Waterworks and Sewer System debt service fund provides for the payment of principal and interest on the water department outstanding revenue bonds. Operating revenues from water operations and interest earned on the cash balance in the debt service fund are pledged for repayment of the debt. Revenues are transferred from the Water Operating Fund to the debt service fund to meet annual principal and interest obligations. Pension Obligation bonds are paid through increased contributions to the debt service fund. The Water Works and Sewer System bonds outstanding as of September 30, 2014 are as follows:

CITY OF DALLAS, TEXAS NOTES TO THE BASIC FINANCIAL STATEMENTS
Year Ended September 30, 2014 �
70 �
Note 10. Long-Term Debt (continued)
Series Description Final Maturity Interest Rates Amount
610 Rev Bonds 2036 4.25% - 5.50% 81,260$
613 Rev Bonds 2037 4.00% - 5.00% 573,405
619 Rev Bonds 2038 4.00% - 5.00% 140,760
624 Rev Bonds 2029 0.423% - 2.877% 11,805
625 Rev Bonds 2029 1.303% - 2.877% 7,835
626 Rev Bonds 2029 0.148% - 3.018% 84,513
630 Rev Bonds 2030 3.00% - 5.00% 263,740
634 Rev Bonds 2040 3.00% - 5.00% 234,985
636 Rev Bonds 2042 0.595% - 5.00% 360,695
639 Rev Bonds 2043 2.00% - 5.00% 156,540
Total Revenue Bonds 1,915,538 Pension Obligation Bonds 2035 0.295% - 5.48% 53,065 Total Outstanding 1,968,603$
�
Utility Revenues Pledged The City has pledged future water and wastewater customer revenues, net of specified operating expenses, to repay $2 billion in water and wastewater system revenue bonds, which were issued in prior fiscal years. Proceeds from the bonds provided financing for construction. The bonds are payable solely from water customer net revenues and are payable through fiscal year 2043. Net revenues for each year are expected to be at least equal to 1.25 times the principal and interest requirements of all outstanding previously issued bonds and additional bonds for the year. The total principal and interest remaining to be paid on the bonds at September 30, 2014 is $3 billion. Principal and interest paid during fiscal year 2014 was $89.5 million and $84.3 million, respectively.
H. Convention Center (Revenue Bonds, Pension Obligation Bonds, and Note Payable)
The 7% Hotel Occupancy Tax, operating revenues of the Convention Center Complex, and interest earned on cash balances in the bond reserve and debt service funds are pledged for repayment of the debt. Pension Obligation bonds are paid through increased contributions to the Debt Service Fund. Additionally, the City has reserve funds to provide for the payment of operating and maintenance expenses of the Convention Center Complex, should a shortfall in Convention Center revenues occur. Revenue from the Convention Center operating fund is transferred to the debt service fund to meet annual principal and interest payments. The Convention Center bonds outstanding as of September 30, 2014 are as follows:
Series Description Final Maturity Interest Rates Amount
Civic Center Convention Complex 2038 3.00% - 5.25% 313,715$
Pension Obligation Bonds 2035 0.295% - 5.48% 3,775 Total Outstanding 317,490$
��
In a previous fiscal year, the City issued notes with an interest rate of 3.92% for the purpose of making utility efficiency improvements to the Convention Center. The notes are payable in quarterly installments and reach final maturity during fiscal year 2017. The total outstanding note payable as of September 30, 2014 is $3,925.
�����
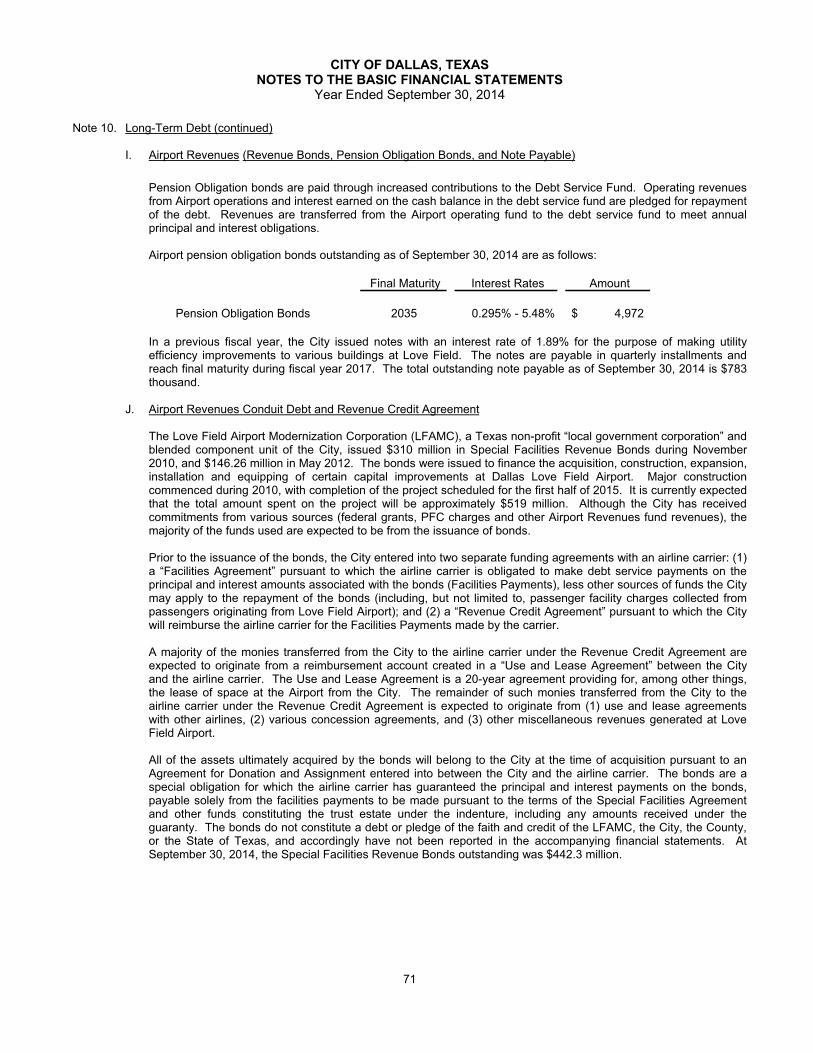
CITY OF DALLAS, TEXAS NOTES TO THE BASIC FINANCIAL STATEMENTS
Year Ended September 30, 2014 �
71 �
Note 10. Long-Term Debt (continued)
I. Airport Revenues (Revenue Bonds, Pension Obligation Bonds, and Note Payable) �
Pension Obligation bonds are paid through increased contributions to the Debt Service Fund. Operating revenues from Airport operations and interest earned on the cash balance in the debt service fund are pledged for repayment of the debt. Revenues are transferred from the Airport operating fund to the debt service fund to meet annual principal and interest obligations. Airport pension obligation bonds outstanding as of September 30, 2014 are as follows:
Final Maturity Interest Rates Amount
Pension Obligation Bonds 2035 0.295% - 5.48% 4,972$ �
In a previous fiscal year, the City issued notes with an interest rate of 1.89% for the purpose of making utility efficiency improvements to various buildings at Love Field. The notes are payable in quarterly installments and reach final maturity during fiscal year 2017. The total outstanding note payable as of September 30, 2014 is $783 thousand.
J. Airport Revenues Conduit Debt and Revenue Credit Agreement
The Love Field Airport Modernization Corporation (LFAMC), a Texas non-profit “local government corporation” and blended component unit of the City, issued $310 million in Special Facilities Revenue Bonds during November 2010, and $146.26 million in May 2012. The bonds were issued to finance the acquisition, construction, expansion, installation and equipping of certain capital improvements at Dallas Love Field Airport. Major construction commenced during 2010, with completion of the project scheduled for the first half of 2015. It is currently expected that the total amount spent on the project will be approximately $519 million. Although the City has received commitments from various sources (federal grants, PFC charges and other Airport Revenues fund revenues), the majority of the funds used are expected to be from the issuance of bonds.
Prior to the issuance of the bonds, the City entered into two separate funding agreements with an airline carrier: (1) a “Facilities Agreement” pursuant to which the airline carrier is obligated to make debt service payments on the principal and interest amounts associated with the bonds (Facilities Payments), less other sources of funds the City may apply to the repayment of the bonds (including, but not limited to, passenger facility charges collected from passengers originating from Love Field Airport); and (2) a “Revenue Credit Agreement” pursuant to which the City will reimburse the airline carrier for the Facilities Payments made by the carrier.
A majority of the monies transferred from the City to the airline carrier under the Revenue Credit Agreement are expected to originate from a reimbursement account created in a “Use and Lease Agreement” between the City and the airline carrier. The Use and Lease Agreement is a 20-year agreement providing for, among other things, the lease of space at the Airport from the City. The remainder of such monies transferred from the City to the airline carrier under the Revenue Credit Agreement is expected to originate from (1) use and lease agreements with other airlines, (2) various concession agreements, and (3) other miscellaneous revenues generated at Love Field Airport.
All of the assets ultimately acquired by the bonds will belong to the City at the time of acquisition pursuant to an Agreement for Donation and Assignment entered into between the City and the airline carrier. The bonds are a special obligation for which the airline carrier has guaranteed the principal and interest payments on the bonds, payable solely from the facilities payments to be made pursuant to the terms of the Special Facilities Agreement and other funds constituting the trust estate under the indenture, including any amounts received under the guaranty. The bonds do not constitute a debt or pledge of the faith and credit of the LFAMC, the City, the County, or the State of Texas, and accordingly have not been reported in the accompanying financial statements. At September 30, 2014, the Special Facilities Revenue Bonds outstanding was $442.3 million.

CITY OF DALLAS, TEXAS NOTES TO THE BASIC FINANCIAL STATEMENTS
Year Ended September 30, 2014 �
72 �
Note 10. Long-Term Debt (continued)
K. Airport Revenues Obligation for Revenue Credit Agreement
The Revenue Credit Agreement entered into between the City and the airline carrier was made possible as a result of the rate making provisions of the Airport Use and Lease Agreement which provide for the annual calculation of airline rates and charges sufficient to recover among other things, debt service on the bonds. While the crediting back of money to the airline carrier under the Revenue Credit Agreement will be done pursuant to a contractual agreement between the City and the airline carrier, such revenue credits are not pledged to the payment of debt service on the Bonds. The City has determined the obligation under the Revenue Credit Agreement to be a liability, and accordingly has recorded the obligation in the accompanying financial statements. The interest rates for the obligation range between 4.39% to 5.48%, and the obligation will be amortized over a period of 30 years. The balance of the obligation for the Revenue Credit Agreement was $446 million less the net premium/discount of $4 million for a total balance of $442 million, at September 30, 2014. The schedule of principal and interest payments required for the obligation is provided below (in thousands):
Fiscal Year Principal Interest Total2015 -$ 22,995$ 22,995$ 2016 6,990 22,820 29,810 2017 7,340 22,462 29,802 2018 7,710 22,086 29,796 2019 8,095 21,690 29,785
2020-2024 46,595 102,216 148,811 2025-2029 62,745 88,996 151,741 2030-2034 105,440 67,215 172,655 2035-2039 136,175 35,668 171,843
2040 65,005 3,456 68,461 446,095$ 409,604$ 855,699$
Airport Revenue - LFAMC Obligation for Revenue Credit Agreement
The remainder of this page intentionally left blank.

CITY OF DALLAS, TEXAS NOTES TO THE BASIC FINANCIAL STATEMENTS
Year Ended September 30, 2014 �
73 �
Note 10. Long-Term Debt (continued) �
L. Non-Major Enterprise Fund (Pension Obligation Bonds)
The non-major enterprise funds provide for the payment of principal and interest on a portion of Pension Obligation bonds, which are paid through increased contributions to the Debt Service Fund. The bonds outstanding as of September 30, 2014 are as follows:
Series Description Final Maturity Interest Rates Amount
Pension Obligation Bonds 2035 0.295% - 5.48% 9,668$ �
M. Business-Type Activities Debt Service Requirements
The debt service principal and interest payment requirement to maturity at September 30, 2014 for the business-type activities revenue bonds and pension obligation bonds are as follow:
Fiscal Year Principal Interest Total Principal Interest Total2015 94,545$ 84,134$ 178,679$ 1,622$ 4,478$ 6,100$ 2016 93,825 80,399 174,224 1,513 4,707 6,220 2017 95,365 76,535 171,900 1,543 4,806 6,349 2018 89,370 72,819 162,189 1,678 4,863 6,541 2019 94,540 68,853 163,393 1,623 5,117 6,740
2020-2024 465,980 280,429 746,409 27,182 9,811 36,993 2025-2029 331,118 194,502 525,620 7,549 37,225 44,774 2030-2034 288,495 123,844 412,339 7,549 44,510 52,059 2035-2039 267,875 53,019 320,894 2,806 8,563 11,369 2040-2043 94,425 7,028 101,453 - - -
1,915,538$ 1,041,562$ 2,957,100$ 53,065$ 124,080$ 177,145$ (continued)
Revenue BondsDallas Water Utilities
Pension Obligation Bonds
The remainder of this page intentionally left blank.

CITY OF DALLAS, TEXAS NOTES TO THE BASIC FINANCIAL STATEMENTS
Year Ended September 30, 2014 �
74 �
Note 10. Long-Term Debt (continued)
Fiscal Year Principal Interest Total Principal Interest Total2015 4,640$ 16,098$ 20,738$ 116$ 319$ 435$ 2016 5,740 15,866 21,606 108 336 444 2017 6,945 15,579 22,524 110 343 453 2018 8,250 15,232 23,482 120 347 467 2019 8,665 14,820 23,485 116 365 481
2020-2024 50,260 67,151 117,411 1,927 700 2,627 2025-2029 64,150 53,263 117,413 539 2,656 3,195 2030-2034 82,280 35,133 117,413 539 3,176 3,715 2035-2038 82,785 11,144 93,929 200 611 811
313,715$ 244,286$ 558,001$ 3,775$ 8,853$ 12,628$
Fiscal Year Principal Interest Total Principal Interest Total2015 1,944$ 60$ 2,004$ 295$ 815$ 1,110$ 2016 1,981 23 2,004 275 857 1,132 2017 - - - 281 875 1,156 2018 - - - 306 886 1,192 2019 - - - 295 932 1,227
2020-2024 - - - 4,957 1,787 6,744 2025-2029 - - - 1,374 6,778 8,152 2030-2034 - - - 1,375 8,105 9,480
2035 - - - 510 1,559 2,069 3,925$ 83$ 4,008$ 9,668$ 22,594$ 32,262$
Fiscal Year Principal Interest Total Principal Interest Total2015 152$ 313$ 465$ 256$ 13$ 269$ 2016 142 334 476 261 8 269 2017 145 450 595 266 3 269 2018 157 456 613 - - - 2019 152 479 631 - - -
2020-2024 2,547 919 3,466 - - - 2025-2029 707 3,488 4,195 - - - 2030-2034 707 4,171 4,878 - - -
2035 263 802 1,065 - - - 4,972$ 11,412$ 16,384$ 783$ 24$ 807$
Pension Obligation Bonds Long-Term Notes Payable Airport Revenues
Long-Term Notes Payable Pension Obligation Bonds Convention Center Non-Major Enteprise Funds
Revenue Bonds Pension Obligation BondsConvention Center
���

CITY OF DALLAS, TEXAS NOTES TO THE BASIC FINANCIAL STATEMENTS
Year Ended September 30, 2014 �
75 �
Note 10. Long-Term Debt (continued)
N. Discretely Presented Component Unit Debt Service Requirements
The changes in the DDDA discretely presented component unit’s long- term liabilities for the year ended September 30, 2014 are as follows:
Balance09/30/13 Additions Deletions
Balance09/30/14
Due Within One Year
Tax Increment RevenueBonds - Series 2006 44,767$ -$ 1,706$ 43,061$ 1,051$ Bonds - Series 2007 27,868 - 810 27,058 1,721
Total Bonds 72,635 - 2,516 70,119 2,772 Accretion 24,828 4,202 1,354 27,676 -
97,463$ 4,202$ 3,870$ 97,795$ 2,772$ Total Bonds
�The changes in the Dallas Convention Center Hotel Development Corporation discretely presented component unit’s long-term liabilities for the year ended December 31, 2013 are as follows:
� Balance12/31/12 Additions Deletions
Balance12/31/13
Due Within One Year
2009A Current Interest Bonds 62,530$ -$ -$ 62,530$ -$ 2009A Capital Appreciation Bonds 11,881 - - 11,881 - 2009B Taxable Build America Bonds 388,175 - - 388,175 - 2009C Taxable Bonds 17,235 - - 17,235 - Total Revenue Bonds 479,821 - - 479,821 -
Add: Unamortized Premium 721 - 80 641 - Less: Unamortized Discount (314) 28 - (286) - Add: Accretion on Capital - - - - -
Appreciation Bonds 2,590 883 - 3,473 - Key Money Payable 6,000 - - 6,000 -
488,818$ 911$ 80$ 489,649$ -$ Total Long-Term Debt
����
The remainder of this page intentionally left blank. .

CITY OF DALLAS, TEXAS NOTES TO THE BASIC FINANCIAL STATEMENTS
Year Ended September 30, 2014 �
76 �
Note 10. Long-Term Debt (continued)
The DDDA discretely presented component unit has issued tax increment bonds that are payable solely from the pledged tax increments of the zone. The tax increment bonds outstanding as of September 30, 2014 are as follows:
Series Description Final Maturity Interest Rates Amount
Series DDDA - Series 2006 2036 5.25% - 5.66% 43,061$ Series DDDA - Series 2007 2036 5.49% - 6.28% 27,058 Total Outstanding 70,119$
�
The Dallas Convention Center Hotel Development Corporation discretely presented component unit bonds outstanding as of December 31, 2013 are as follows:
Series Description Final Maturity Interest Rates Amount
2009A Current Interest Bonds 2024 4.25% - 5.25% 62,530$ 2009A Capital Appreciation Bonds 2026 5.43% - 6.46% 11,881 2009B Taxable Build America Bonds 2042 7.09% 388,175 2009C Taxable Bonds 2018 4.99% - 5.58% 17,235 Total Outstanding 479,821$
�
The debt service principal and interest payment requirement to maturity at September 30, 2014 for the DDDA discretely presented component unit activities tax increment financing bonds and at December 31, 2013 for the Dallas Convention Center Hotel Development Corporation bonds are as follows:
Fiscal Year Principal Interest Total Principal Interest Total2015 2,772$ 3,182$ 5,954$ 2014 -$ 31,607$ 31,607$ 2016 2,831 3,522 6,353 2015 3,700 31,514 35,214 2017 2,769 3,795 6,564 2016 5,790 31,266 37,056 2018 2,715 4,059 6,774 2017 7,415 30,907 38,322 2019 2,753 4,416 7,169 2018 5,437 33,355 38,792
2020-2024 15,538 25,002 40,540 2019-2023 49,695 147,535 197,230 2025-2029 13,215 29,369 42,584 2024-2028 57,440 146,314 203,754 2030-2034 19,191 29,965 49,156 2029-2033 93,450 108,428 201,878 2035-2036 8,335 11,465 19,800 2033-2037 126,325 69,705 196,030
Total 70,119$ 114,775$ 184,894$ 2038-2042 137,570 19,156 156,726 Total 486,822$ 649,787$ 1,136,609$
DDDA Calendar Year
Dallas Convention Center Hotel Development Corporation
���������

CITY OF DALLAS, TEXAS NOTES TO THE BASIC FINANCIAL STATEMENTS
Year Ended September 30, 2014 �
77 �
Note 10. Long-Term Debt (continued)
O. Bonds Authorized and Unissued
The following is a schedule of authorized but unissued bonds at September 30, 2014:
Date of Authorization
Amount Authorized
Amount Unissued
1998 Capital Improvement Program 5/2/1998 246,000$ 31,837$ 2006 Capital Improvement Program 11/7/2006 1,338,940 356,225 2012 Capital Improvement Program 11/6/2012 642,000 616,823
Total 2,226,940$ 1,004,885$
�P. Compliance with Debt Covenants
For the year ended September 30, 2014, management of the City believes that it was in compliance with all financial bond covenants on outstanding revenue and general obligation bonded debt.
Q. Dallas Water Utilities Commercial Paper Notes
The commercial paper notes are supported by liquidity agreements through one bank and one pension fund. The liquidity agreement supporting the Series D notes is through State Street Bank and Trust Company and the California State Teachers’ Retirement System, and extends to March 16, 2015. The Series D has an aggregate available principal amount not to exceed $326.6 million, which includes $300 million of principal together with approximately $26.6 million of accrued interest for a maximum maturity date not to exceed 270 days at a rate of 12% per annum. The commercial paper program constitutes an obligation subordinate to the City’s general obligation bonds. Any advances for payments of commercial paper under the line of credit are secured by a subordinate lien on water and wastewater revenues. During fiscal year 2014, $144 million was issued and $21 million was repaid. Upon maturity, the notes will be remarketed by the commercial paper dealers or extinguished with long-term debt.
R. Dallas Water Utilities Obligation for Water Transmission Facilities Financing Agreement
Tarrant Regional Water District (TRWD), water control and improvement district and political subdivision of the State of Texas, issued $131.9 million in February 2012 and $202.1 million in January 2014 in Water Facilities Contract Revenue Bonds. The bonds were issued to finance the DWU share of costs for designing, acquiring, constructing, improving, repairing, rehabilitating, and or replacing water transmission facilities capable of delivering additional raw water supply to the customers of the DWU and TRWD for their respective customers (the Project). The Project is tentatively scheduled to be completed in 2025. The City’s share of the total cost of the Project is estimated to be $832 million. Upon completion of the Project, DWU will have reserved capacity rights in the amount of 150 million gallons per day. Depending on the timing of construction, additional bonds are expected to be issued throughout the construction period.

CITY OF DALLAS, TEXAS NOTES TO THE BASIC FINANCIAL STATEMENTS
Year Ended September 30, 2014 �
78 �
Note 10. Long-Term Debt (continued)
In order to ensure adequate funding from Dallas Water Utilities for the payment of principal and interest, the City entered into a separate funding agreement with TRWD, a Water Transmission Facilities Financing Agreement (the Agreement). Under this Agreement, the City is obligated to make payments to TRWD for the principal and interest amounts associated with the bonds. The Agreement establishes through State statutes that those payments will be treated as operating and maintenance expenses. The treatment of payments to TRWD as operating and maintenance expenses is only being applied to the Schedule of Revenue Bond Coverage for the Dallas Water Utilities and for purposes of establishing rates.
The Agreement establishes that TRWD shall own and operate the Project, subject to Dallas’ reserve capacity rights in the Project. The bonds are a special obligation of TRWD. Principal and interest are secured by and payable solely from payments to be received by TRWD from the City to the extent required and provided in the Agreement. The bonds do not constitute a debt or pledge of the faith and credit of the City and accordingly have not been reported in the accompanying financial statements. At September 30, 2014, the TRWD Water Facilities Contract Revenue Bonds outstanding was $328.6 million.
The City has determined the obligation under the Agreement to be a liability to the extent that such obligations are for the payment of bonds issued to fund Dallas Water Utilities’ share of costs for the Project. The City has capitalized the development of an intangible asset, Pipeline Reserve Capacity Rights, in Construction in Progress for the actual Project costs incurred by TRWD. The unspent proceeds held by TRWD for future construction costs have been recorded in Other Noncurrent Assets – Future Pipeline Reserve Capacity Rights. The interest rates for the obligation range from 2.0% to 6.0%. The obligation will be amortized over a period of 30 years. The balance of the obligation for the Agreement was $328.1 million at September 30, 2014. The schedule of principal and interest payments required for the obligation is provided below:
Fiscal Year Principal Interest Total
2015 5,385$ 14,068$ 19,453$ 2016 6,090 15,051 21,141 2017 6,310 14,715 21,025 2018 6,535 14,366 20,901 2019 6,775 14,004 20,779
2020-2024 37,925 64,088 102,013 2025-2029 47,005 54,068 101,073 2030-2034 58,935 43,484 102,419 2035-2039 74,875 28,686 103,561 2040-2044 78,280 10,677 88,957
Total 328,115$ 273,207$ 601,322$
��������������

CITY OF DALLAS, TEXAS NOTES TO THE BASIC FINANCIAL STATEMENTS
Year Ended September 30, 2014 �
79 �
Note 11. Leases
A. As Lessee
As lessee, the City is committed under various leases for building and office space, data processing and communications equipment. These leases are considered for accounting purposes to be operating leases. Lease expenditures for the fiscal year ended September 30, 2014, amounted to $7.2 million. Future minimum lease payments for these leases are as follows:
Year Ending September 30 Total Rental
Payments Governmental
Activities Business-Type
Activities 2015 6,951$ 5,603$ 1,348$ 2016 6,567 5,238 1,329 2017 3,759 2,412 1,347 2018 2,847 2,286 561 2019 2,143 1,984 159
2020-2024 6,174 5,297 877 2025-2029 1,203 176 1,027 Thereafter 628 262 366
Minimum Future Rentals 30,272$ 23,258$ 7,014$
�
The City is also committed under capital leases for the purchase of computer equipment, vehicles and heavy equipment and for the purchase of a parking garage. The liability for future capital lease payments totals $27 million. Future minimum lease payments for capital leases including interest and principal are as follows:
Fiscal Year Rental Payments
2015 6,678$ 2016 6,369 2017 5,046 2018 2,832 2019 1,838
2020-2024 6,768 Total minimum future lease payments 29,531 Less: Amount representing interest (2,540) Present value of net minimum lease payments 26,991$
�
The following schedule provides an analysis of the City’s investments in capital assets under capital lease arrangements as of September 30, 2014.
Building and equipment 34,053$ Less: Accumulated depreciation (19,736) Total 14,317$
�
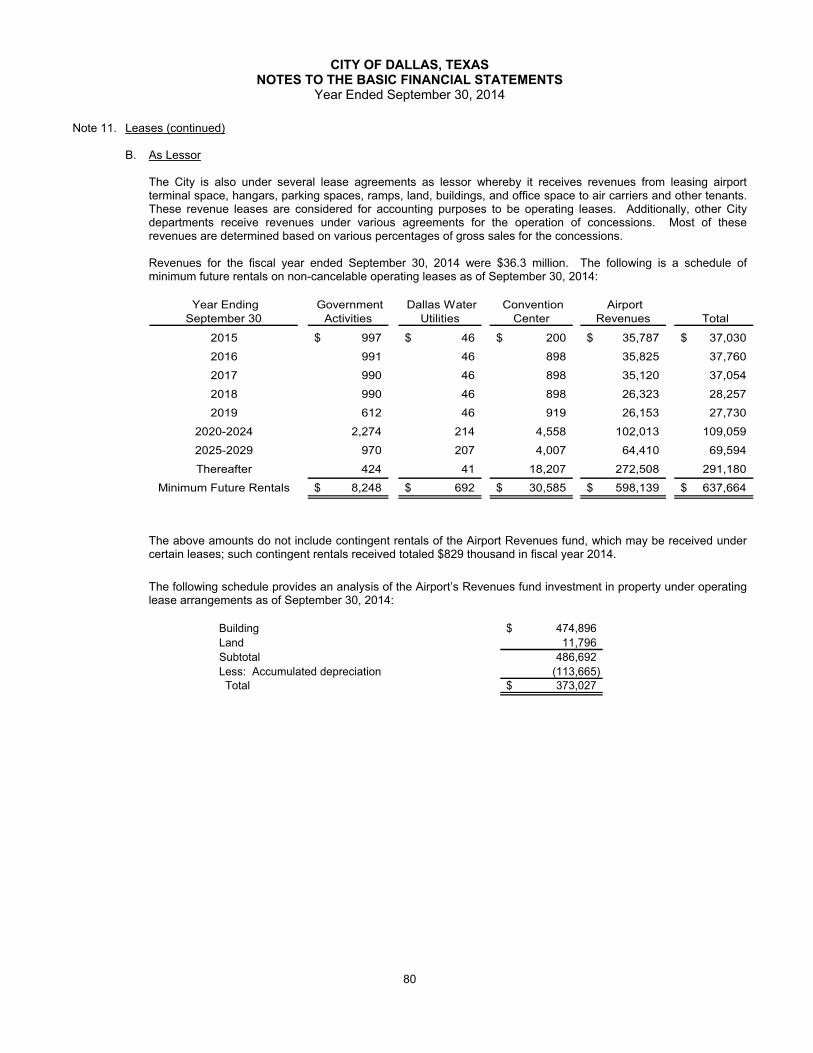
CITY OF DALLAS, TEXAS NOTES TO THE BASIC FINANCIAL STATEMENTS
Year Ended September 30, 2014 �
80 �
Note 11. Leases (continued)
B. As Lessor
The City is also under several lease agreements as lessor whereby it receives revenues from leasing airport terminal space, hangars, parking spaces, ramps, land, buildings, and office space to air carriers and other tenants. These revenue leases are considered for accounting purposes to be operating leases. Additionally, other City departments receive revenues under various agreements for the operation of concessions. Most of these revenues are determined based on various percentages of gross sales for the concessions. Revenues for the fiscal year ended September 30, 2014 were $36.3 million. The following is a schedule of minimum future rentals on non-cancelable operating leases as of September 30, 2014:
Year Ending September 30
Government Activities
Dallas Water Utilities
Convention Center
Airport Revenues Total
2015 997$ 46$ 200$ 35,787$ 37,030$
2016 991 46 898 35,825 37,760
2017 990 46 898 35,120 37,054
2018 990 46 898 26,323 28,257
2019 612 46 919 26,153 27,730
2020-2024 2,274 214 4,558 102,013 109,059
2025-2029 970 207 4,007 64,410 69,594
Thereafter 424 41 18,207 272,508 291,180
Minimum Future Rentals 8,248$ 692$ 30,585$ 598,139$ 637,664$
�The above amounts do not include contingent rentals of the Airport Revenues fund, which may be received under certain leases; such contingent rentals received totaled $829 thousand in fiscal year 2014.
�The following schedule provides an analysis of the Airport’s Revenues fund investment in property under operating lease arrangements as of September 30, 2014:
Building 474,896$ Land 11,796 Subtotal 486,692 Less: Accumulated depreciation (113,665) Total 373,027$
�
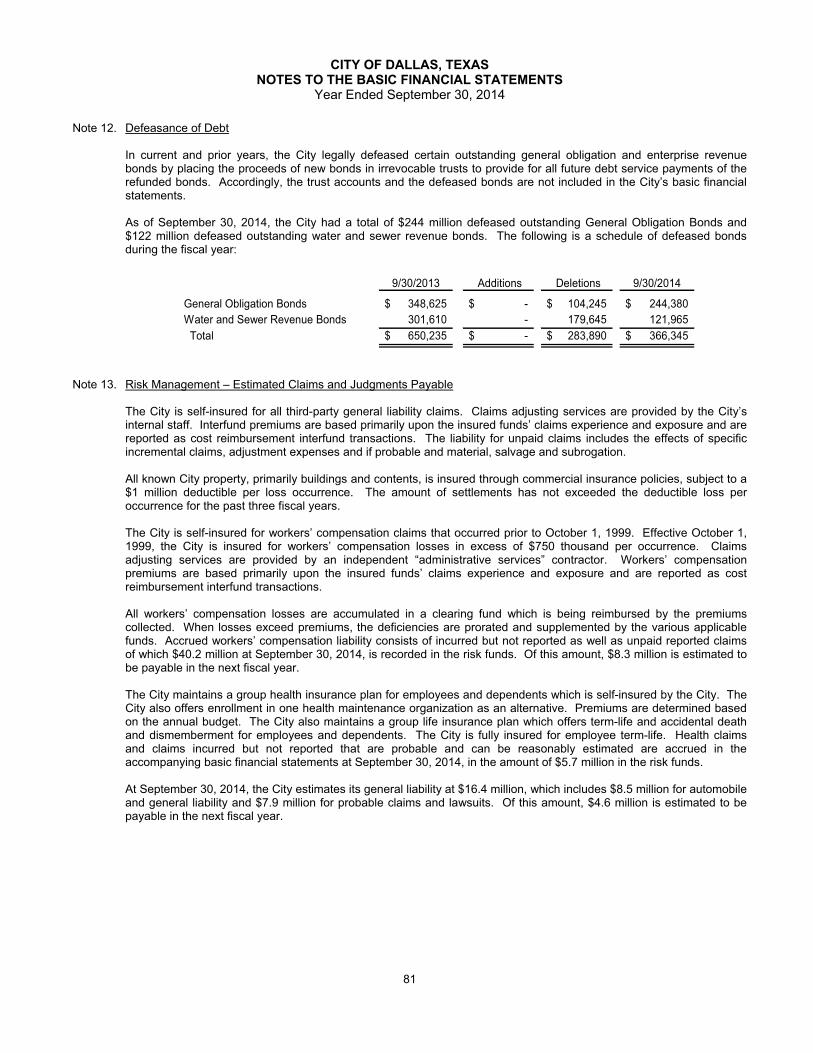
CITY OF DALLAS, TEXAS NOTES TO THE BASIC FINANCIAL STATEMENTS
Year Ended September 30, 2014 �
81 �
Note 12. Defeasance of Debt
In current and prior years, the City legally defeased certain outstanding general obligation and enterprise revenue bonds by placing the proceeds of new bonds in irrevocable trusts to provide for all future debt service payments of the refunded bonds. Accordingly, the trust accounts and the defeased bonds are not included in the City’s basic financial statements. As of September 30, 2014, the City had a total of $244 million defeased outstanding General Obligation Bonds and $122 million defeased outstanding water and sewer revenue bonds. The following is a schedule of defeased bonds during the fiscal year:
9/30/2013 Additions Deletions 9/30/2014
General Obligation Bonds 348,625$ -$ 104,245$ 244,380$ Water and Sewer Revenue Bonds 301,610 - 179,645 121,965 Total 650,235$ -$ 283,890$ 366,345$
� Note 13. Risk Management – Estimated Claims and Judgments Payable
The City is self-insured for all third-party general liability claims. Claims adjusting services are provided by the City’s internal staff. Interfund premiums are based primarily upon the insured funds’ claims experience and exposure and are reported as cost reimbursement interfund transactions. The liability for unpaid claims includes the effects of specific incremental claims, adjustment expenses and if probable and material, salvage and subrogation. All known City property, primarily buildings and contents, is insured through commercial insurance policies, subject to a $1 million deductible per loss occurrence. The amount of settlements has not exceeded the deductible loss per occurrence for the past three fiscal years. The City is self-insured for workers’ compensation claims that occurred prior to October 1, 1999. Effective October 1, 1999, the City is insured for workers’ compensation losses in excess of $750 thousand per occurrence. Claims adjusting services are provided by an independent “administrative services” contractor. Workers’ compensation premiums are based primarily upon the insured funds’ claims experience and exposure and are reported as cost reimbursement interfund transactions. All workers’ compensation losses are accumulated in a clearing fund which is being reimbursed by the premiums collected. When losses exceed premiums, the deficiencies are prorated and supplemented by the various applicable funds. Accrued workers’ compensation liability consists of incurred but not reported as well as unpaid reported claims of which $40.2 million at September 30, 2014, is recorded in the risk funds. Of this amount, $8.3 million is estimated to be payable in the next fiscal year. The City maintains a group health insurance plan for employees and dependents which is self-insured by the City. The City also offers enrollment in one health maintenance organization as an alternative. Premiums are determined based on the annual budget. The City also maintains a group life insurance plan which offers term-life and accidental death and dismemberment for employees and dependents. The City is fully insured for employee term-life. Health claims and claims incurred but not reported that are probable and can be reasonably estimated are accrued in the accompanying basic financial statements at September 30, 2014, in the amount of $5.7 million in the risk funds. At September 30, 2014, the City estimates its general liability at $16.4 million, which includes $8.5 million for automobile and general liability and $7.9 million for probable claims and lawsuits. Of this amount, $4.6 million is estimated to be payable in the next fiscal year.

CITY OF DALLAS, TEXAS NOTES TO THE BASIC FINANCIAL STATEMENTS
Year Ended September 30, 2014 �
82 �
Note 13. Risk Management – Estimated Claims and Judgments Payable (continued)
Changes in the balances of claims liabilities during the past fiscal year are as follows:
2014 2013 2014 2013 2014 2013Unpaid claims, beginning of year 41,200$ 41,951$ 7,016$ 9,556$ 16,770$ 12,897$
Incurred claims, including incurred but not reported claims (IBNRs) and changes in estimates 8,698 6,564 56,236 82,489 12,042 9,905 Claim payments (7,968) (7,579) (62,292) (84,682) (9,444) (5,410) Changes to prior year estimates (IBNR) (1,730) 264 4,773 (347) (2,960) (622) Unpaid claims, end of year 40,200$ 41,200$ 5,733$ 7,016$ 16,408$ 16,770$
Compensation Health LiabilityWorkers' General
�
Note 14. Accrued Landfill Liability
The City owns and operates the McCommas Bluff landfill located in the southern portion of the City. The developed 379 acres of the landfill has an estimated remaining useful life of 1 year. The undeveloped 431 acres of the landfill has an estimated useful life of 50 years. Closure and post-closure care of this landfill is subject to the requirements of Subtitle D of the Resource Conservation and Recovery Act (P.L. 94-580) and Sections 330.250-256 of Title 30 of the Texas Administrative Code administered by the Texas Commission on Environmental Quality (TCEQ). These regulations require the City to place a final cover on each cell of the landfill when it ceases to accept waste and perform certain maintenance and monitoring functions for thirty years after the closure of each cell. Because final contours have not been achieved, the City has not yet initiated closure of any of this landfill or incurred closure expenses. Therefore, the estimated $29 million liability for closure/post-closure care is based on 89.6 percent of the capacity of the developed landfill subject to TCEQ regulations—none of which is expected to be paid from current available resources. The City also owns and operates three transfer stations. The estimated post closure cost is $225 thousand for the transfer stations at September 30, 2014. The estimated total liability of $30.8 million is based on current dollar average cost per acre calculations for this specific landfill as originally provided by consulting firms and has been revised annually by the City to accommodate inflation, deflation, technology, and developmental or regulation changes. In accordance with the provisions of Codification of Governmental Accounting and Financial Reporting Standards, Section L10, “Landfill Closure and Post Closure Care Costs,” the City has recorded a closure and post-closure liability of $29 million as a long-term liability. Closure and Post-closure Care are funded through current general fund revenues generated by landfill operations. Effective April 9, 1997, Sections 330.280-284 of Title 30 of the Texas Administrative Code (TAC) require landfill owners to demonstrate financial assurance on an annual basis that they will have sufficient financial resources to satisfy closure and post-closure care expenditures at such time as these become payable. The City also owns the Deepwood & Loop 12 landfill located at South Miller Road, southwest of Loop 12. This landfill is closed. The estimated total liability for post closure care costs for the entire 47 acres of the closed landfill (132 acres of the Landfill Property) is estimated to be $5.3 million during the next 22 years, of which $243 thousand is due within one year. The total closure and post-closure liability for both landfills and three transfer stations at September 30, 2014 is $34.6 million.
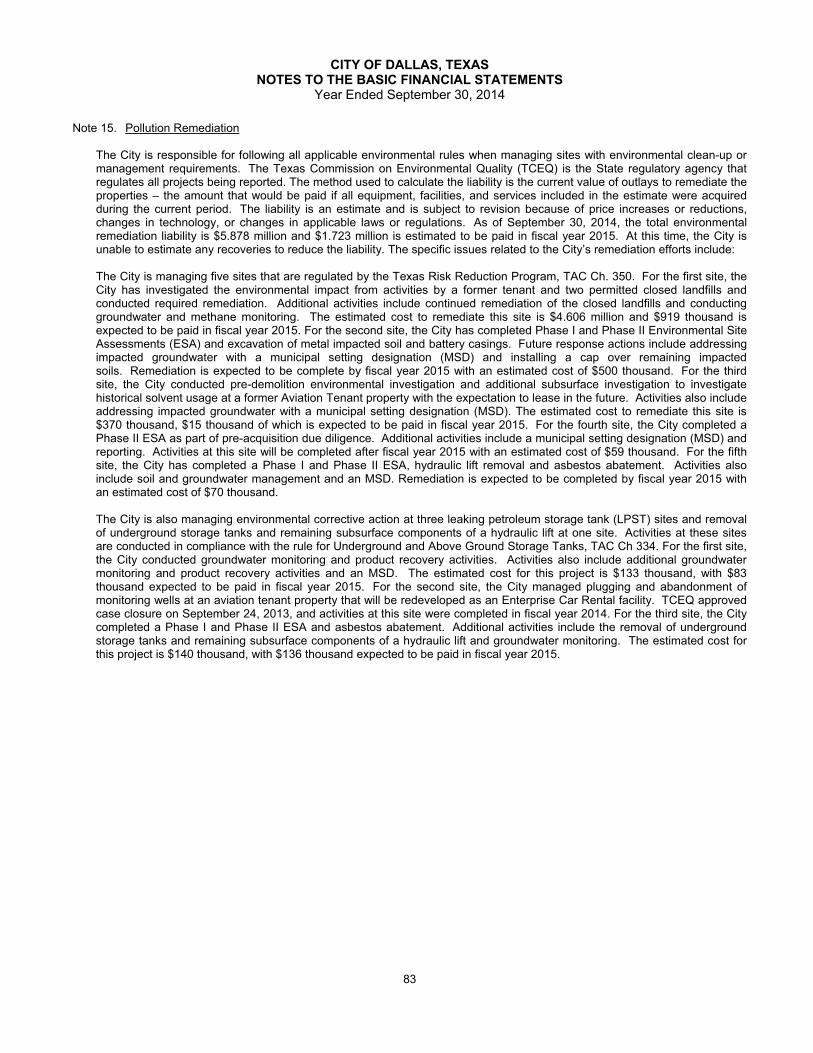
CITY OF DALLAS, TEXAS NOTES TO THE BASIC FINANCIAL STATEMENTS
Year Ended September 30, 2014 �
83 �
Note 15. Pollution Remediation
The City is responsible for following all applicable environmental rules when managing sites with environmental clean-up or management requirements. The Texas Commission on Environmental Quality (TCEQ) is the State regulatory agency that regulates all projects being reported. The method used to calculate the liability is the current value of outlays to remediate the properties – the amount that would be paid if all equipment, facilities, and services included in the estimate were acquired during the current period. The liability is an estimate and is subject to revision because of price increases or reductions, changes in technology, or changes in applicable laws or regulations. As of September 30, 2014, the total environmental remediation liability is $5.878 million and $1.723 million is estimated to be paid in fiscal year 2015. At this time, the City is unable to estimate any recoveries to reduce the liability. The specific issues related to the City’s remediation efforts include: The City is managing five sites that are regulated by the Texas Risk Reduction Program, TAC Ch. 350. For the first site, the City has investigated the environmental impact from activities by a former tenant and two permitted closed landfills and conducted required remediation. Additional activities include continued remediation of the closed landfills and conducting groundwater and methane monitoring. The estimated cost to remediate this site is $4.606 million and $919 thousand is expected to be paid in fiscal year 2015. For the second site, the City has completed Phase I and Phase II Environmental Site Assessments (ESA) and excavation of metal impacted soil and battery casings. Future response actions include addressing impacted groundwater with a municipal setting designation (MSD) and installing a cap over remaining impacted soils. Remediation is expected to be complete by fiscal year 2015 with an estimated cost of $500 thousand. For the third site, the City conducted pre-demolition environmental investigation and additional subsurface investigation to investigate historical solvent usage at a former Aviation Tenant property with the expectation to lease in the future. Activities also include addressing impacted groundwater with a municipal setting designation (MSD). The estimated cost to remediate this site is $370 thousand, $15 thousand of which is expected to be paid in fiscal year 2015. For the fourth site, the City completed a Phase II ESA as part of pre-acquisition due diligence. Additional activities include a municipal setting designation (MSD) and reporting. Activities at this site will be completed after fiscal year 2015 with an estimated cost of $59 thousand. For the fifth site, the City has completed a Phase I and Phase II ESA, hydraulic lift removal and asbestos abatement. Activities also include soil and groundwater management and an MSD. Remediation is expected to be completed by fiscal year 2015 with an estimated cost of $70 thousand. The City is also managing environmental corrective action at three leaking petroleum storage tank (LPST) sites and removal of underground storage tanks and remaining subsurface components of a hydraulic lift at one site. Activities at these sites are conducted in compliance with the rule for Underground and Above Ground Storage Tanks, TAC Ch 334. For the first site, the City conducted groundwater monitoring and product recovery activities. Activities also include additional groundwater monitoring and product recovery activities and an MSD. The estimated cost for this project is $133 thousand, with $83 thousand expected to be paid in fiscal year 2015. For the second site, the City managed plugging and abandonment of monitoring wells at an aviation tenant property that will be redeveloped as an Enterprise Car Rental facility. TCEQ approved case closure on September 24, 2013, and activities at this site were completed in fiscal year 2014. For the third site, the City completed a Phase I and Phase II ESA and asbestos abatement. Additional activities include the removal of underground storage tanks and remaining subsurface components of a hydraulic lift and groundwater monitoring. The estimated cost for this project is $140 thousand, with $136 thousand expected to be paid in fiscal year 2015.

CITY OF DALLAS, TEXAS NOTES TO THE BASIC FINANCIAL STATEMENTS
Year Ended September 30, 2014 �
84 �
Note 16.��Pension Plans A. Plan Descriptions
The City participates in funding three contributory, defined benefit employee pension plans. These plans are single-employer pension plans and use the entry-age-normal cost method. Membership is a condition of employment for all full-time, permanent employees.
The excess of contributions made to the Employees’ Retirement Fund over required pension contributions (as computed in accordance with GASB No. 27) is recorded as a net pension asset in the statement of net position in accordance with Codification of Governmental Accounting Standards, Section P20. The City is also legally obligated to fund the Dallas Police & Fire Pension Plan and the Supplemental Police and Fire Pension Plan in amount actuarially determined each year. In the opinion of the City Attorney, the City is not legally obligated to fund any additional amounts. The activities of the entities as of December 31, 2013 are reported in the City’s Pension Trust Funds. Their separate audited financial statements may be obtained through the City.
The schedule of funding progress, presented as required supplementary information following the notes to the financial statements, presents multiyear trend information that shows whether the actuarial value of plan assets is increasing or decreasing over time relative to the actuarial accrued liabilities for benefits. Employees’ Retirement Fund: The legal authority for this plan is Chapter 40A of the Dallas City Code. This plan is for the benefit of all eligible employees of the City, excluding firefighters and police officers. Members have vested rights to retirement benefits after five years of service. Benefits are based on credited service and the average monthly earnings for the three highest paid calendar years. Members of the Fund are entitled to normal retirement pension at age 60; early retirement pension at age 55 if employed prior to May 9, 1972 or age 50 and years of service total 78; service retirement pension at any age after 30 years of credited service and disability retirement pension as determined by the board of trustees. Contribution percentages of covered wages are 13.06% for employees and 22.23% for the City. The City’s contribution of 22.23% is divided into 12.94% cash to the Plan and 9.29% for debt service payments on the pension obligation bonds. The maximum contribution percentage of covered wages is 36%, with 63% from the City and 37% from employees. The maximum increase or decrease from one year to the next is 10%.
2013
Membership 7,499
Current members:Vested 4,939Non vested 2,054
Subtotal 6,993 Total 14,492
Retirees and beneficiaries currently receiving
�

CITY OF DALLAS, TEXAS NOTES TO THE BASIC FINANCIAL STATEMENTS
Year Ended September 30, 2014 �
85 �
Note 16.��Pension Plans (continued)
Dallas Police and Fire Pension System: The System is a retirement fund for police officers and firefighters employed by the City of Dallas. The System is comprised of a single defined benefit pension plan, called the “Combined Pension Plan,” designed to provide retirement, death and disability benefits for firefighters and police officers (members). The legal authority for the Plan is former Article 6243a-1 of the Revised Civil Statutes of Texas. All active, eligible police officers and firefighters employed by the City are required to participate. The Plan consists of Group A and Group B membership. No member elected contribution under Group A. Group A members may elect to receive one of two benefit structures Options 1 and 2. Option 1: members with 20 years or more of pension service are entitled to normal monthly pension benefits beginning at age 50 equal to 50% of the base pay as defined as the maximum monthly civil service pay established by the City at the time of retirement plus 50% of the longevity pay the member was receiving at the time he or she left active service with the City or the effective date the member joined the Deferred Retirement Option Plan (DROP). Option 2: members with 20 years or more of pension service are entitled to normal monthly pension benefits beginning at age 55 equal to 3% of the base pay computed as noted in Option 1 for each year with a maximum of 32 years. In addition, a member receives 50% of the longevity pay and 1/24 of any City service incentive pay the member was receiving at the time he or she left active service with the City or the effective date the member joined DROP. Under Group B, members with five or more years of pension service are entitled to monthly pension benefits beginning at age 50 equal to 3% of the member’s average computation pay determined over the highest 36 consecutive months of computation pay, multiplied by the number of years of pension service, up to maximum of 32 years. In addition, Group B benefits are increased by 4% of the initial benefit amount each October 1. The City is required to make contributions of 27.5% of total wages and salaries as defined in the System’s plan document. The contribution percentage for members in Group A is 6.5% of their base pay. Group B members are required to contribute 8.5% of their computation pay. The System’s membership approved the following changes to Plan provisions in an election conducted in February 2011: removing the 0.25% restricted on DROP interest rate changes; requiring member contributions while in active DROP; allowing a one-time opportunity for active DROP election; providing benefits for members hired after February 28, 2011 with the following provision: 2% accrual rate for the first 20 years of service, 2.5% accrual rate for the next 5 years of service and 3% accrual rate for service after 25 years, average computation pay based on 60 months of pay, and retirement eligibility at age 55 with 20 years of service; disability benefits with the following provisions: own occupation definition for the first two years of disability, any occupation definition after two years of disability, on-duty disability retirement benefit based on a minimum of 25% of average computation pay; and survivor benefits for members who die while on active service based on a minimum of 25% of average computation pay.
2013
Membership Consisted of
Firefighters 1,627Police Officers 2,263
122Total inactive members 4,012
Firefighters 1,445Police Officers 2,738
Firefighters 446Police Officers 768
Total current employees 5,397
Nonactive Member:Retirees and beneficiaries currently receiving
Current Vested Employees:
Current Nonvested Employees:
Terminated vested members not yet receiving benefits
�

CITY OF DALLAS, TEXAS NOTES TO THE BASIC FINANCIAL STATEMENTS
Year Ended September 30, 2014 �
86 �
Note 16.��Pension Plans (continued)
Supplemental Police and Fire Pension Plan: The legal authority for this Plan is Subsection 35 of Chapter II of the Charter of the City of Dallas and Ordinance 14084 of 1973. This plan includes officials in the Fire and Police Departments who hold rank higher than the highest corresponding Civil Service rank available as a result of competitive examination. Employees with five or more years of service are entitled to annual pension benefits beginning at normal retirement age 50. Members of the Supplemental Plan contribute 8.5% of their pay that is applicable to the Supplemental Plan on a bi-weekly basis. The City does make an annual contribution to the Supplemental Plan based on the actuarial analysis. For 2013 the City contribution was $1.9 million.
2013
Membership Consisted of
Firefighters 52Police Officers 68
Total non-active members 120
Firefighters 14Police Officers 24
Total current employees 38
Nonactive Member:Retirees and beneficiaries currently receiving benefits :
Current Vested Employees:
�
B. Schedule of Employer Contributions
Annual Required
ContributionPercentage Contributed
Annual Required
ContributionPercentage Contributed
Annual Required
ContributionPercentage Contributed
9/30/2014 62,756$ 71.41% 113,622$ 95.29% 1,936$ 100.00%9/30/2013 54,289$ 65.42% 113,550$ 93.13% 1,944$ 100.00%9/30/2012 37,822$ 76.46% 119,863$ 85.46% 1,544$ 100.00%
Annual Pension Cost
Percentage Contributed
Annual Pension Cost
Percentage Contributed
Annual Pension Cost
Percentage Contributed
9/30/2014 55,551$ 80.68% 114,314$ 94.71% 1,936$ 100.00%9/30/2013 46,886$ 75.75% 113,980$ 92.78% 1,954$ 100.00%9/30/2012 30,393$ 95.14% 119,742$ 85.54% 1,544$ 100.00%
Employees' Retirement Dallas Police and Fire Supplemental Police and Fire
Employees' Retirement Dallas Police and Fire Supplemental Police and Fire
�

CITY OF DALLAS, TEXAS NOTES TO THE BASIC FINANCIAL STATEMENTS
Year Ended September 30, 2014 �
87 �
Note 16.��Pension Plans (continued)
C. Employees’ Retirement Fund – Net Pension Asset (NPA) for 2014, 2013, and 2012
9/30/2014 9/30/2013 9/30/2012
Annual required contribution (ARC) 62,756$ 54,289$ 37,822$ Interest on NPA (34,171) (35,109) (35,231) Adjustment to the ARC 26,966 27,706 27,802 Annual Pension Cost 55,551 46,886 30,393 Contribution Made (44,816) (35,515) (28,917) Change in NPA 10,735 11,371 1,476 NPA, beginning of year (414,199) (425,570) (427,046) NPA, end of year (403,464)$ (414,199)$ (425,570)$
�
The amounts above are calculated as of the City’s fiscal year-end, September 30, rather than the year-end of the Dallas Employees’ Retirement Fund, December 31. The net pension asset has been allocated between governmental activities and business-type activities based on percentage of contribution by each. For governmental activities, this was 74.4% ($300,158) and for business-type activities, 25.6% ($103,306). The amount of net pension asset allocated by business-type activity is 19.0% ($76,688) to Dallas Water Utilities; 1.4% ($5,485) to Convention Center, 1.8% ($7,176) to Airport Revenues; and 3.4% ($13,957) to nonmajor enterprise funds. The percent contributed may vary from the legally required rate as the annual required contributions are based upon covered payroll as of the actuarial valuation date, January 1, whereas contributions are calculated and paid based upon actual payrolls throughout the year.
D. Police and Fire Pension – Net Pension Asset (NPA) for 2014, 2013, and 2012
Dallas Police and Fire Pension System 9/30/2014 9/30/2013 9/30/2012
Annual required contribution (ARC) 113,622$ 113,550$ 119,863$ Interest on NPO 1,846 1,147 (324) Adjustment to the ARC (1,154) (717) 203 Annual Pension Cost 114,314 113,980 119,742 Contribution Made (108,268) (105,753) (102,431) Change in NPO 6,046 8,227 17,311 NPO (NPA), beginning of year 21,723 13,496 (3,815) NPO (NPA), end of year 27,769$ 21,723$ 13,496$
� Supplemental Police and Fire Pension 9/30/2014 9/30/2013 9/30/2012
Annual required contribution (ARC) 1,936$ 1,954$ 1,544$ Interest on NPO - - - Adjustment to the ARC - - - Annual Pension Cost 1,936 1,954 1,544 Contribution Made (1,936) (1,954) (1,544) Change in NPO - - - NPO (NPA), beginning of year - - - NPO (NPA), end of year -$ -$ -$
�
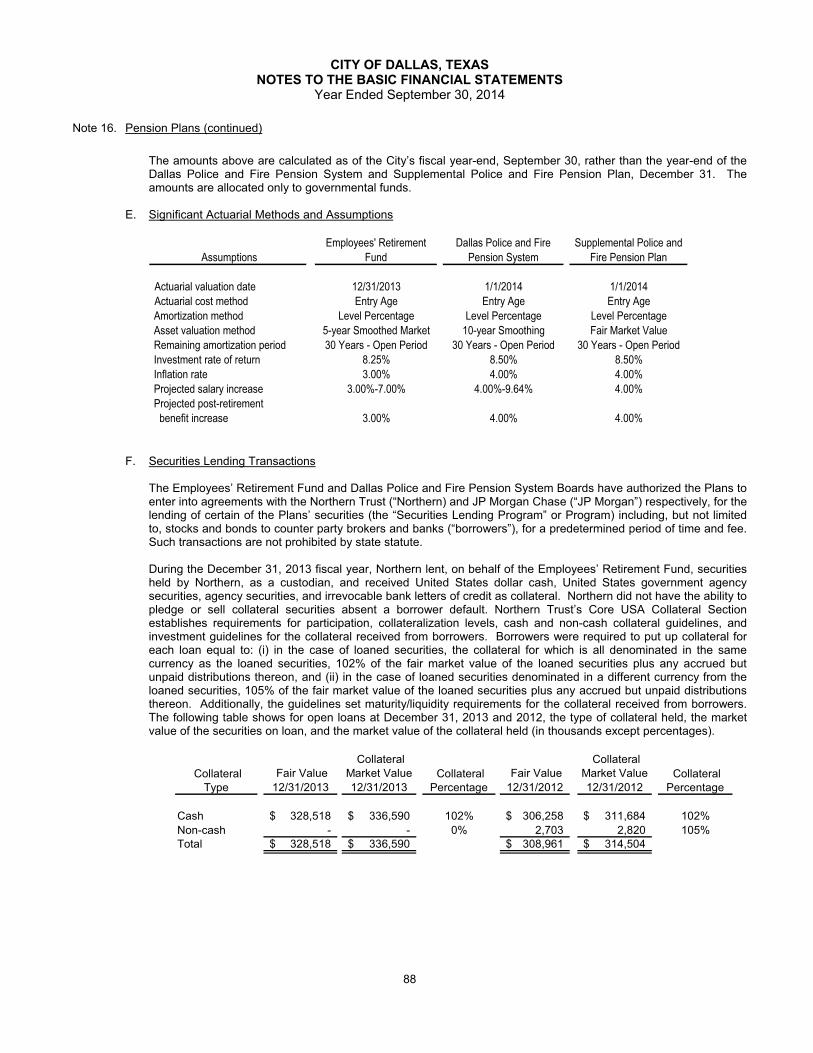
CITY OF DALLAS, TEXAS NOTES TO THE BASIC FINANCIAL STATEMENTS
Year Ended September 30, 2014 �
88 �
Note 16.��Pension Plans (continued) �
The amounts above are calculated as of the City’s fiscal year-end, September 30, rather than the year-end of the Dallas Police and Fire Pension System and Supplemental Police and Fire Pension Plan, December 31. The amounts are allocated only to governmental funds.
E. Significant Actuarial Methods and Assumptions
Assumptions Employees' Retirement
FundDallas Police and Fire
Pension SystemSupplemental Police and
Fire Pension Plan
Actuarial valuation date 12/31/2013 1/1/2014 1/1/2014Actuarial cost method Entry Age Entry Age Entry Age
Amortization method Level Percentage Level Percentage Level Percentage Asset valuation method 5-year Smoothed Market 10-year Smoothing Fair Market Value Remaining amortization period 30 Years - Open Period 30 Years - Open Period 30 Years - Open Period Investment rate of return 8.25% 8.50% 8.50% Inflation rate 3.00% 4.00% 4.00% Projected salary increase 3.00%-7.00% 4.00%-9.64% 4.00% Projected post-retirement benefit increase 3.00% 4.00% 4.00%
�
F. Securities Lending Transactions
The Employees’ Retirement Fund and Dallas Police and Fire Pension System Boards have authorized the Plans to enter into agreements with the Northern Trust (“Northern) and JP Morgan Chase (“JP Morgan”) respectively, for the lending of certain of the Plans’ securities (the “Securities Lending Program” or Program) including, but not limited to, stocks and bonds to counter party brokers and banks (“borrowers”), for a predetermined period of time and fee. Such transactions are not prohibited by state statute.
During the December 31, 2013 fiscal year, Northern lent, on behalf of the Employees’ Retirement Fund, securities held by Northern, as a custodian, and received United States dollar cash, United States government agency securities, agency securities, and irrevocable bank letters of credit as collateral. Northern did not have the ability to pledge or sell collateral securities absent a borrower default. Northern Trust’s Core USA Collateral Section establishes requirements for participation, collateralization levels, cash and non-cash collateral guidelines, and investment guidelines for the collateral received from borrowers. Borrowers were required to put up collateral for each loan equal to: (i) in the case of loaned securities, the collateral for which is all denominated in the same currency as the loaned securities, 102% of the fair market value of the loaned securities plus any accrued but unpaid distributions thereon, and (ii) in the case of loaned securities denominated in a different currency from the loaned securities, 105% of the fair market value of the loaned securities plus any accrued but unpaid distributions thereon. Additionally, the guidelines set maturity/liquidity requirements for the collateral received from borrowers. The following table shows for open loans at December 31, 2013 and 2012, the type of collateral held, the market value of the securities on loan, and the market value of the collateral held (in thousands except percentages).
Fair Value Collateral
Market Value Fair Value Collateral
Market Value 12/31/2013 12/31/2013 12/31/2012 12/31/2012
Cash 328,518$ 336,590$ 102% 306,258$ 311,684$ 102%Non-cash - - 0% 2,703 2,820 105%Total 328,518$ 336,590$ 308,961$ 314,504$
Collateral Percentage
Collateral Percentage
Collateral Type
�

CITY OF DALLAS, TEXAS NOTES TO THE BASIC FINANCIAL STATEMENTS
Year Ended September 30, 2014 �
89 �
Note 16.��Pension Plans (continued)
During fiscal year ended December 31, 2013, JP Morgan lent, on behalf of the Dallas Police and Fire Pension System, securities held by JP Morgan as a custodian, and received United States dollar cash and United States Government securities as collateral. JP Morgan did not have the ability to pledge or sell collateral securities absent a borrower default. Borrowers were required to put up collateral for each loan equal to: (i) in the case of loaned securities denominated in United States dollars or whose primary trading market was in the United States or sovereign debt issued by foreign governments, 102% of the fair market value of the loaned securities, and (ii) in the case of loaned securities not denominated in United States dollars or whose primary trading market was not in the United States dollars, 105% of the fair market value of the loaned securities. At year-end, the System has no credit risk exposure to borrowers because the amounts the System owes the borrowers exceed the amounts the borrowers owe the System. The collateral held for the System as of December 31, 2013 and December 31, 2012 was $174 and $196 million, respectively.
The Boards did not impose any restrictions during the fiscal year on the amount of the loans that Northern and JP Morgan made on their behalf. There were no failures by any borrowers to return the loaned securities or pay distributions thereon during the fiscal year. Moreover, there were no losses during the fiscal years resulting from a default of the borrowers or Northern and JP Morgan. Northern is contractually obligated to fully indemnify the Plan for a borrower’s failure to return the loaned securities.
During the fiscal year, the Board and the borrowers maintained the right to terminate all securities lending transactions on demand. The cash collateral was invested, together with the collateral of other qualified tax-exempt plan lenders, in a collective investment pool maintained by Northern and JP Morgan. The relationship between the average maturities of the investment pool and the Plan’s loans were affected by the maturities of the loans made by other plans’ entities that invested cash collateral in the collective investment pool, which the Board could not determine. On December 31, 2013 and 2012, the Plan had no credit risk exposure to borrowers.
G. Funding Policy and Annual Pension Cost
The Board of Trustees of each plan establishes and may amend the contribution requirements of plan members and the City. The City’s annual pension cost for the current year and related information for each plan is as follows:
Employees' Retirement Fund
Dallas Police and Fire Pension
System
Supplemental Police and Fire Pension Plan
City 22.23% 27.50% N/APlan members 13.06% N/A 8.50% (2)Plan members-Group A N/A 6.5% (1) N/APlan members-Group B N/A 8.50% N/A
55,551$ 114,314$ 1,936$ 44,816$ 108,268$ 1,936$
compensation of the Civil Service rank held as a result of competitive testing.
Annual pension cost (9/30/2014)
Contribution rates:
Contribution made (9/30/2014)
(2) The 8.5% represents the excess of their compensation for the rank held over the
(1) No member elected contribution under Group A.
�

CITY OF DALLAS, TEXAS NOTES TO THE BASIC FINANCIAL STATEMENTS
Year Ended September 30, 2014 �
90 �
Note 16.��Pension Plans (continued)
H. Funded Status and Funding Progress
The funded status of the plan as of January 1, 2014, (the most recent valuation date) was as follows (in millions):
Employees' Retirement Fund
Dallas Police and Fire Pension
System
Supplemental Police and Fire Pension Plan
Actuarial accrued liability (AAL) 3,611$ 5,129$ 39$ Actuarial value of plan assets 3,074$ 3,877$ 24$ Unfunded actuarial accrued liability (UAAL) 537$ 1,252$ 15$ Funded ratio (actuarial value of plan assets / AAL) 85.10% 75.60% 61.53%Covered payroll 352$ 378$ 0.5$
UAAL as a percentage of covered payroll 152.56% 331.20% 2879.08%�
Note 17. Commitments and Contingencies
A. Pending Lawsuits and Claims
Various claims and lawsuits are pending against the City. Those judgments which are considered “probable” and estimable are accrued, while those claims and judgments which are considered “reasonably possible” are disclosed but not accrued. In the opinion of the City Attorney, the potential loss resulting from all significant claims which are considered reasonably possible, excluding condemnation proceedings, is approximately $5 million as of September 30, 2014. At September 30, 2014, approximately $7.9 million has been recorded in the risk funds for claims and lawsuits considered to be probable. In the opinion of the City Attorney, this is the total of all such claims which represent probable loss to the City.
B. Commitments and Contingencies
The City participates in a number of federally assisted and state grant programs. Principally, the Community Development Block Grant; Women, Infants and Children; and HOME Programs. The programs are subject to program compliance audits by the grantors or their representatives. The amount, if any, of the expenditures which may be disallowed by the granting agencies cannot be determined at this time although the City expects such amount, if any, to be immaterial. The City has several major construction projects planned or in progress as of September 30, 2014. These projects are evidenced by contractual commitments and include the following: $208 million for General Purpose Capital Improvements and $304 million for Water Utilities Capital Improvements.
Note 18. Other Postemployment Benefits
In addition to pension benefits, various Council resolutions require the City to provide certain healthcare and life insurance benefits for retired employees. Employees who are permanent, full-time employees are eligible to participate in the benefits at retirement. The City is self-insured for these programs. The City eliminated subsidization of the plan for individuals hired on or after January 1, 2010. For retired employee over 65, the City pays on average $426 (not in thousands) per month for Medicare “A” if the retirees are not eligible for Social Security coverage. The retirees are responsible for Medicare “B”. For retirees who qualify and choose the City health plan, the City pays approximately 50 percent of the retiree premium and the retiree pays the other 50 percent. Spouses of retirees, like active employees, pay 100% of premiums. There were 2,007 retired participants and surviving spouses in the health plan at September 30, 2014, the latest data used for this evaluation.

CITY OF DALLAS, TEXAS NOTES TO THE BASIC FINANCIAL STATEMENTS
Year Ended September 30, 2014 �
91 �
Note 18. Other Postemployment Benefits (continued)
The City’s annual other postemployment benefit (OPEB) expense is calculated based on the annual required contribution (ARC), an amount actuarially determined in accordance with GASB Statement No. 45. The actuarial cost method used in this valuation to determine the actuarial accrued liability and the annual required contribution (ARC) is the projected unit credit method with service prorated. The ARC represents a level of funding that, if paid on an ongoing basis, is projected to cover normal cost each year and amortize any unfunded actuarial liabilities over a period not to exceed 30 years. The City has elected to amortize the unfunded actuarial liability over 30 years as a level percentage of payroll on an open basis. The discount rate used for the determination of the expense for fiscal year 2014 is 4%. The annual healthcare trend rates range from 8% to 4.5% per year. Total claim payments for fiscal year 2014 were approximately $14.3 million net of participants’ contributions.
Actuarial Valuations Actuarial valuations of an ongoing plan involve estimates of the value of reported amounts and assumptions about the probability of occurrence of events far into the future. Examples include assumptions about future employment, mortality, and the healthcare cost trend. Amounts determined regarding the funded status of the plan and the annual required contributions of the City are subject to continual revision as actual results are compared with past expectations and new estimates are made about the future. The schedule of funding progress, presented as required supplementary information following the notes to the financial statements, presents multiyear trend information that shows whether the actuarial value of plan assets is increasing or decreasing over time relative to the actuarial accrued liabilities for benefits. Projections of benefits for financial reporting purposes are based on the substantive plan (the plan as understood by the City and plan members) and include the types of benefits provided at the time of each valuation. The actuarial methods and assumptions used include techniques that are designed to reduce the effects of short-term volatility in actuarial accrued liabilities and the actuarial value of assets, consistent with the long-term perspective of the calculations. The following table shows the components of the City’s annual OPEB cost for fiscal year 2014, the amount actually contributed to the plan, and changes in the City’s net OPEB obligation (in thousands):
Actuarial required contribution 35,925$ Interest on net OPEB obligation 8,298 Adjustment to annual required contribution (7,928) Annual OPEB 36,295
Contributions made (14,271) Increase in net OPEB 22,024 Net OPEB obligation, beginning of year 207,462 Net OPEB obligation, end of year 229,486$
�Net OPEB obligation reported by governmental funds 185,393$ Net OPEB obligation reported in business type activities funds 35,659 Net OPEB obligation reported in internal service funds 8,434 Net OPEB obligation, end of year 229,486$
�
The City’s annual OPEB cost, the percentage of annual OPEB cost contributed to the plan, and the net OPEB obligation for fiscal years 2014, 2013, and 2012 are as follows (in thousands):
Fiscal Year Ended
Net OPEB Obligation
Beginning of Year
Annual OPEB Cost
Employer Contributions
Net OPEB Obligation
End of Year
Percentage of Annual
OPEB Cost Contributed
2014 207,462$ 36,295$ 14,271$ 229,486$ 39.32%2013 170,086$ 49,853$ 12,477$ 207,462$ 25.03%2012 126,232$ 50,094$ 6,240$ 170,086$ 12.46% �

CITY OF DALLAS, TEXAS NOTES TO THE BASIC FINANCIAL STATEMENTS
Year Ended September 30, 2014 �
92 �
Note 18. Other Postemployment Benefits (continued)
The funded status of the plan for fiscal years 2014, 2013, and 2012 are as follows (in thousands):
Actuarial Valuation
Value
Actuarial Value of Assets
Actuarial Accrued
Liability (AAL)Unfunded
AAL (UAAL) Funded
Ratio Covered Payroll
UAAL as a Percentage of Covered
Payroll
9/30/2014 -$ 611,397$ 611,397$ 0% 767,664$ 79.64%9/30/2013 -$ 635,815$ 635,815$ 0% 681,861$ 93.25%9/30/2012 -$ 627,980$ 627,980$ 0% 684,196$ 91.78%
�
The actuarial accrued liability of $611,397 includes $371,572 for active employees and 239,825 for retirees.
This table present multiyear trend information about whether the actuarial value of plan assets is increasing or decreasing over time relative to the actuarial accrued liabilities for benefits.
Uniformed Non-
Uniformed Total Active participants not eligible to retire 2,874 4,423 7,297 Active participants eligible to retire 1,730 1,157 2,887 Total active participants 4,604 5,580 10,184
At September 30, 2014, membership was as follows:
��Note 19. Subsequent Events
A. Issuance of Debt From October 1, 2014 through March 31, 2015, the City issued $123 million in Dallas Water Utilities commercial paper notes, with an average interest rate of 0.08%.
On December 10, 2014, the City issued $529.4 million in Series 2014 general obligation refunding bonds with an interest rate of 4 to 5 percent and a final maturity of February 15, 2034, to refund previously issued general obligation bonds and commercial paper notes, as well as to fund various permanent public improvements within the City. On March 11, 2015, the City issued Waterworks and Sewer Revenue Series 2015A refunding bonds with an interest rate of 1 to 5 percent and a final maturity of October 1, 2037, to refund previously issued waterworks and sewer revenue bonds as well as commercial paper notes. In addition, the City issued Waterworks and Sewer Revenue Series 2015B refunding bonds with an interest rate of 1.96 to 2.796 percent and a final maturity of October 1, 2023, to refund previously issued waterworks and sewer revenue bonds as well as commercial paper notes.
B. Establishment of Escrow Account
Lake Fork is owned and operated by the Sabine River Authority (Authority) and is on Lake Fork Creek, a tributary of the Sabine River. Lake Fork is located in Wood, Hopkins and Rains Counties, approximately 70 miles east of the City. Construction of the reservoir began in June 1975 and the gates of the dam were closed to begin impoundment in February 1980.
On October 1, 1981, the City purchased water supply rights from Sabine River Authority for approximately $117 million. Financial obligations of the City’s share of Lake Fork water supply rights were fully paid as of December 2004. The City now has a contract with the Authority for 74% of the water available from Lake Fork.

CITY OF DALLAS, TEXAS NOTES TO THE BASIC FINANCIAL STATEMENTS
Year Ended September 30, 2014 �
93 �
Note 19. Subsequent Events (continued) The City is required to pay the Authority for a pro rata share of the operation and maintenance costs associated with Lake Fork, which was approximately $3,332,000 in the fiscal year ended September 30, 2014. The pro rata share of the operation and maintenance costs owed to the Authority for the renewal of the Lake Fork contract was to be mutually negotiated with the Authority prior to the year 2014 pursuant to the terms of the contract. Negotiation attempts with the Authority have failed. In October 2014, the Authority unilaterally established a rate which would require the City to pay approximately an additional $24 million annually for the water to which it is entitled. The City has challenged the rate by filing petitions with the Public Utilities Commission of Texas (PUC) and district courts in Travis and Orange counties in Texas. The PUC has ordered an administrative law judge to consider setting an interim rate while this dispute is pending. To date, the Authority has not produced any documents showing that it has a need for the additional revenue that it seeks or how it will spend the additional revenues.
On April 2, 2015, the administrative law judge ruled that the interim rate must be paid by Dallas until the rate case is resolved. The rate set is by the Authority on a take-or-pay basis, without a cost escalator requested by the Authority. This interim rate will be retroactive to November 2, 2014. The amounts the City will pay in accordance with the interim rate are to be deposited into an interest-bearing escrow account, established by the Authority, pending the final outcome of the rate case.
Note 20. Component Unit Net Position Restatement
During 2013, management of the Dallas Housing Finance Corporation discovered that the Corporation was not recognizing its investments in JubileeSeniors and Hines 68 in the financial statements in accordance with GAAP, resulting in a misstatement of the 2012 financial statements. The investments in JubileeSeniors and Hines 68 should have been recorded as of December 31, 2012, which led to an understatement of the Corporation’s total assets, liabilities and net position as of December 31, 2012.
In addition, during 2013, management also noted grant funds of $625 thousand that the Corporation had received to fund the loan made from the Corporation to Hines 68 was not reflected on the statement of net position. As a result, as of December 31, 2012, the Corporation’s loan receivable and net position were understated by $625 thousand.
The table below reflects the net effect of the restatement on the prior year statement of net position.
As OriginallyReported As Restated
December 31, 2012 Restatement December 31, 2012Assets: Current Assets: Cash and cash equivalents 132$ -$ 132$ Investments at fair value 451 - 451 Receivables - 3,153 3,153 Capital Assets: - Buildings - 509 509 Land - 1,958 1,958 Furniture, fixtures and equipment - 98 98 Less: Accumulated depreciation - (40) (40) Total Assets 583 5,678 6,261
Liabilities: - Accounts payable 39 2 41 Other - 2 2 Total Liabilities 39 4 43
Net position 544$ 5,674$ 6,218$
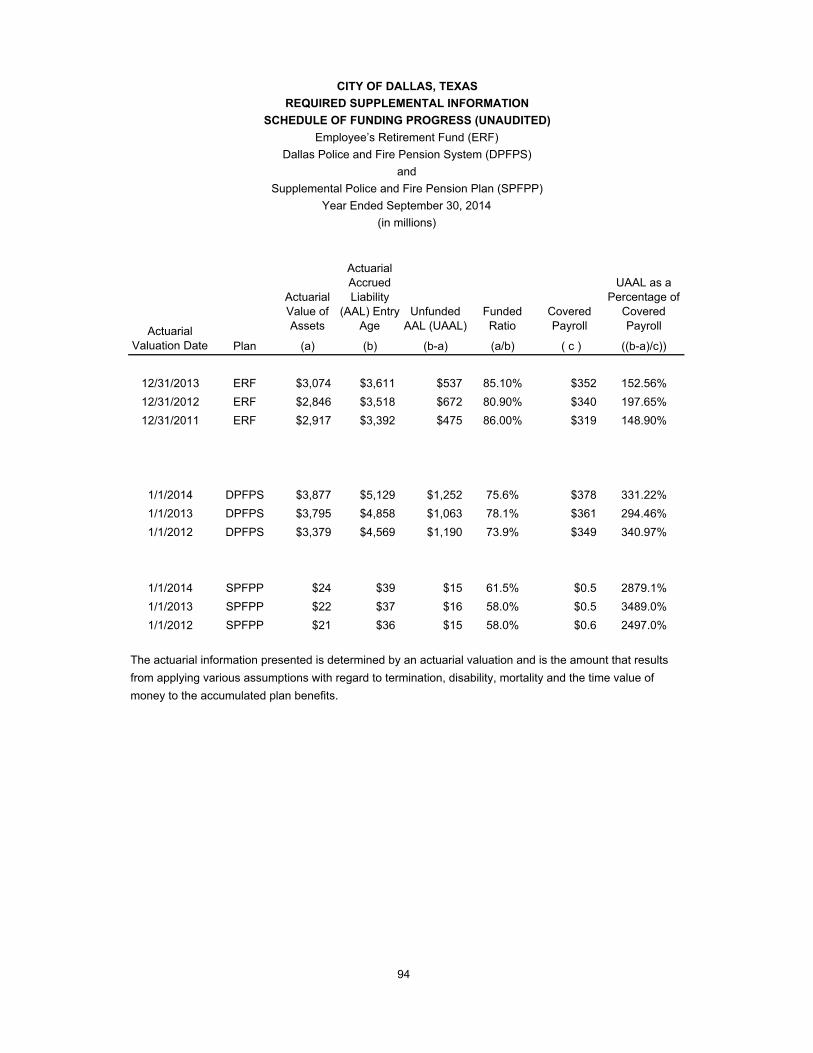
Actuarial Value of Assets
Actuarial Accrued Liability
(AAL) Entry Age
Unfunded AAL (UAAL)
Funded Ratio
Covered Payroll
UAAL as a Percentage of
Covered Payroll
Plan (a) (b) (b-a) (a/b) ( c ) ((b-a)/c))
12/31/2013 ERF $3,074 $3,611 $537 85.10% $352 152.56%12/31/2012 ERF $2,846 $3,518 $672 80.90% $340 197.65%12/31/2011 ERF $2,917 $3,392 $475 86.00% $319 148.90%
1/1/2014 DPFPS $3,877 $5,129 $1,252 75.6% $378 331.22%1/1/2013 DPFPS $3,795 $4,858 $1,063 78.1% $361 294.46%1/1/2012 DPFPS $3,379 $4,569 $1,190 73.9% $349 340.97%
1/1/2014 SPFPP $24 $39 $15 61.5% $0.5 2879.1%1/1/2013 SPFPP $22 $37 $16 58.0% $0.5 3489.0%1/1/2012 SPFPP $21 $36 $15 58.0% $0.6 2497.0%
CITY OF DALLAS, TEXAS
The actuarial information presented is determined by an actuarial valuation and is the amount that results from applying various assumptions with regard to termination, disability, mortality and the time value of money to the accumulated plan benefits.
94
Employee’s Retirement Fund (ERF)Dallas Police and Fire Pension System (DPFPS)
andSupplemental Police and Fire Pension Plan (SPFPP)
Year Ended September 30, 2014(in millions)
SCHEDULE OF FUNDING PROGRESS (UNAUDITED)REQUIRED SUPPLEMENTAL INFORMATION
Actuarial Valuation Date

Actuarial Value of Assets
Actuarial Accrued Liability (AAL)
Unfunded AAL (UAAL)
Funded Ratio
Covered Payroll
UAAL as a Percentage of Covered
Payroll
(a) (b) (b-a) (a/b) ( c ) ((b-a)/c))
9/30/2014 $ - $611,397 $611,397 0.00% $767,664 79.64%9/30/2013 $ - $635,815 $635,815 0.00% $681,861 93.25%9/30/2012 $ - $627,980 $627,980 0.00% $684,196 91.78%
95
Other Postemployment BenefitsYear Ended September 30, 2014
(in thousands)
The actuarial information presented is determined by an actuarial valuation and is the amount that results from applying various assumptions with regard to future employment, mortality, and the healthcare cost trend.
CITY OF DALLAS, TEXASREQUIRED SUPPLEMENTAL INFORMATION
SCHEDULE OF FUNDING PROGRESS (UNAUDITED)
Actuarial Valuation Date

“Dallas, the City that works: diverse, vibrant and progressive.”
96

NONMAJOR GOVERNMENTAL FUNDS
SPECIAL REVENUE FUNDS
Special revenue funds are used to account for and report the proceeds of specific revenue sources that are restricted or committed to expenditure for specified purposes other than debt service or capital projects.
Community Development Fund – to account for funds received by the City of Dallas pursuant to the Community Development Act of 1974, as amended, and grant funds for community development type programs.
Health and Human Services Fund – to account for private and grant funds received for public health and human services programs.
Library Fund – to account for private and grant funds received for acquisition of library materials and expansion of library services.
Police Fund – to account for private and grant funds received for crime prevention and law enforcement programs.
Recreation Fund – to account for private and grant funds received for summer recreation and other recreation programs.
Transportation Fund – to account for private and grant funds received for transportation studies and construction.
Management Improvement Fund – to account for private and grant funds received for management productivity improvements.
Storm Water Operations Fund – to account for the administration and operational activities of the Storm Water Program. Financing is provided by a Storm Water fee.
Municipal Fund – to account for private contributions restricted to the provision of various employee and citizen municipal purposes.
General Citizen Fund – to account for private contributions restricted to the provision of various general governmental projects.
Arts and Cultural Fund – to account for private contributions restricted for the financing of Museum operations and functions.
CAPITAL PROJECTS FUNDS
Capital projects funds are used to account for and report financial resources that are restricted, committed, or assigned for capital outlays, including the acquisition or construction of capital facilities and other capital assets which are not financed by Enterprise Funds, Internal Service Funds, and Trust Funds.
Neighborhood Projects – to account for construction of neighborhood facilities and paving projects.
Parks – to account for construction of parks, playgrounds, and recreational facilities.
Streets and Drainage – to account for construction of streets and storm sewers.
Buildings – to account for construction of City-owned buildings
Transportation – to account for construction of traffic signals and controls.
97

NONMAJOR GOVERNMENTAL FUNDS
PERMANENT FUNDS
Permanent funds are used to report resources that are legally restricted to the extent that only earnings, not principal, may be used for purposes that support the reporting government’s programs that is, for the benefit of the government or its citizenry.
Samuell Park – to account for the private donation by Dr. W.W. Samuell. The income from this fund is restricted to the operation and improvement of Samuell Park.
Grauwyler Memorial – to account for the private donation by Mrs. Emma H. Grauwyler. The income from the trust is to be used to improve and beautify Grauwyler Park.
Craddock Park – to account for the private donation by Mr. and Mrs. L. Craddock. The earnings from the trust are to be used for improving and maintaining Craddock Park.
Martin Weiss Park – to account for the private donations by Mr. and Mrs. Martin Weiss, the earnings from which are restricted to the use for further improvements of the Martin Weiss Park.
Hale Davis – to account for private donations by Hale Davis, restricted for municipal purposes.
98

“Dallas, the City that works: diverse, vibrant and progressive.”
99

Community Health andDevelopment Human Services Library Police Recreation
AssetsPooled cash and cash equivalents 3,066$ -$ 1,933$ 8,664$ 21,159$ Other investments, at fair value - - 1,000 - - Receivables:
Notes 37,871 - - - - Accounts 268 20 12 - 104 Accrued interest 4 1 2 11 58 Allowance for uncollectible accounts (8,733) - - - (3)
Due from other governments 4,388 3,358 - 1,872 - Prepaid Expenses - - - - - Special assessments- paving notes - - - - - Restricted cash and cash equivalents - - - - - Notes receivable from other funds - - - - -
Total assets 36,864 3,379 2,947 10,547 21,318
Liabilities, deferred inflows, and fund balances
Liabilities Accrued payroll - - - 18 -
Accounts payable 1,197 242 104 755 418 Due to other governments - - - - - Due to other funds - 2,141 - - - Unearned revenue 556 - - 794 19 Construction accounts payable - - - - - Notes payable to other funds - - - - 6,183 Customer deposits - - - - 12 Contracts payable - - - - - Other 2,180 - 3 85 56
Total liabilities 3,933 2,383 107 1,652 6,688
Deferred inflows of resources Unavailable revenue 29,398 - - - 89
Fund balancesNonspendable - - - - - Restricted 3,533 996 2,840 8,895 - Committed - - - - 14,541 Total fund balances 3,533 996 2,840 8,895 14,541
Total liabilities, deferred inflows and fund balance 36,864$ 3,379$ 2,947$ 10,547$ 21,318$
(in thousands)
Special Revenue
CITY OF DALLAS, TEXASCOMBINING BALANCE SHEET
NONMAJOR GOVERNMENTAL FUNDS As of September 30, 2014
100

TotalNonmajor
Management Storm Water General Arts and Special RevenueTransportation Improvement Operations Municipal Citizen Cultural Funds
7,414$ 17,418$ 41,951$ 23,845$ 2,754$ 2,977$ 131,181$ - - - - - 2,239 3,239
- - - 9,818 - - 47,689 11,075 601 9,132 72 - - 21,284
8 16 13 27 2 4 146 (3,992) - (4,345) (3,118) - - (20,191)
334 336 - - - - 10,288 - - 15 - - - 15 - - - - - - - - - - - - - - - - - - - - -
14,839 18,371 46,766 30,644 2,756 5,220 193,651
- - - - - - 18 156 400 3,510 6,672 47 - 13,501
- 1 - 2,125 - - 2,126 841 2,132 - - - - 5,114
- - - 782 - - 2,151 - - - - - - - - - - - - - 6,183 - - - - - - 12 - - - - - - - - 25 154 39 7 - 2,549
997 2,558 3,664 9,618 54 - 31,654
6,233 - 184 - - - 35,904
- - - - - - - 7,609 15,813 42,918 21,026 2,702 5,220 111,552
- - - - - - 14,541 7,609 15,813 42,918 21,026 2,702 5,220 126,093
14,839$ 18,371$ 46,766$ 30,644$ 2,756$ 5,220$ 193,651$ continued
101

TotalNonmajor
Neighborhood Streets and Trans- Capital ProjectProjects Parks Drainage Building portation Funds
AssetsPooled cash and cash equivalents -$ -$ -$ -$ -$ -$ Other investments, at fair value 85 - 2 2 601 690 Receivables:
Notes 10,832 - - 1,500 - 12,332 Accounts 26,885 - - - - 26,885 Accrued interest 37 16 28 237 88 406 Allowance for uncollectible accounts (8,787) - (2,658) (1,500) - (12,945)
Due from other governments - - - 6,702 2,927 9,629 Prepaid Expenses - - - - 1,003 1,003 Special assessments- paving notes - - 5,419 - - 5,419 Restricted cash and cash equivalents 39,525 14,494 105,307 56,198 127,806 343,330 Notes receivable from other funds - - 4,161 - - 4,161
Total assets 68,577 14,510 112,259 63,139 132,425 390,910
Liabilities, deferred inflows, and fund balances
Liabilities Accrued payroll - - - - - -
Accounts payable - - - - - - Due to other governments - - - - - - Due to other funds 955 - - 44 - 999 Unearned revenue - 361 6 42,330 42,697 Construction accounts payable 35,139 873 14,544 6,460 10,326 67,342 Notes payable to other funds 4,491 - - - - 4,491 Customer deposits - - 9 - - 9 Contracts payable 5,083 33 3,355 2,590 2,785 13,846 Other - - - - - -
Total liabilities 45,668 1,267 17,914 9,094 55,441 129,384
Deferred inflows of resources Unavailable revenue 2,045 - 2,745 - - 4,790
Fund balancesNonspendable - - 4,161 - - 4,161 Restricted 20,864 13,243 87,439 54,045 76,984 252,575 Committed - - - - - - Total fund balances 20,864 13,243 91,600 54,045 76,984 256,736
. Total liabilities, deferred inflows and fund balance 68,577$ 14,510$ 112,259$ 63,139$ 132,425$ 390,910$
(in thousands)
Capital Projects
NONMAJOR GOVERNMENTAL FUNDS (continued)As of September 30, 2014
CITY OF DALLAS, TEXASCOMBINING BALANCE SHEET
102

TotalMartin Total Nonmajor
Samuell Grauwyler Craddock Weiss Hale Permanent GovernmentalPark Memorial Park Park Davis Funds Funds
AssetsPooled cash and cash equivalents -$ -$ -$ -$ -$ -$ 131,181$ Other investments, at fair value 8,226 98 903 87 410 9,724 13,653 Receivables:
Notes - - - - - - 60,021 Accounts - - - - - - 48,169 Accrued interest - - - - - - 552 Allowance for uncollectible accounts - - - - - - (33,136)
Due from other governments - - - - - - 19,917 Prepaid Expenses - - - - - - 1,018 Special assessments- paving notes - - - - - - 5,419 Restricted cash and cash equivalents - - - - - - 343,330 Notes receivable from other funds - - - - - - 4,161
Total assets 8,226 98 903 87 410 9,724 594,285
Liabilities, deferred inflows, and fund balances
Liabilities Accrued payroll - - - - - - 18
Accounts payable - - - - - - 13,501 Due to other governments - - - - - - 2,126 Due to other funds - - - - - - 6,113 Unearned revenue - - - - - - 44,848 Construction accounts payable - - - - - - 67,342 Notes payable to other funds - - - - - - 10,674 Customer deposits - - - - - - 21 Contracts payable - - - - - - 13,846 Other - - - - - - 2,549
Total liabilities - - - - - - 161,038
Deferred inflows of resources Unavailable revenue - - - - - - 40,694
Fund balancesNonspendable 8,226 98 903 87 410 9,724 13,885 Restricted - - - - - - 364,127 Committed - - - - - - 14,541 Total fund balances 8,226 98 903 87 410 9,724 392,553
Total liabilities, deferred inflows and fund balance 8,226$ 98$ 903$ 87$ 410$ 9,724$ 594,285$
Permanent Funds
(in thousands)
CITY OF DALLAS, TEXASCOMBINING BALANCE SHEET
NONMAJOR GOVERNMENTAL FUNDS (continued)As of September 30, 2014
103

Community Health andDevelopment Human Services Library Police Recreation
Revenues:Ad valorem tax -$ -$ -$ -$ -$ Tax increment financing, intergovernmental - - - - - Franchise fees - - - - - Intergovernmental 36,045 15,924 - 10,913 68 Customer charges Service to others 2,933 - 10 - 5,483 Fines and forfeits - - - 290 - Investment income 7 1 7 24 66 Contributions and gifts 408 439 371 3 1,142 Confiscated money awards - - - 3,493 - Other 3 9 - - -
Total revenues 39,396 16,373 388 14,723 6,759
Expenditures:Current
General government 14,960 - - - - Public safety 115 - - 8,895 - Streets, street lighting, sanitation and code enforcement 20 - - - - Environmental and health services - 16,662 - - - Public works and transportation - - - - - Equipment and building services - - - - - Culture and recreation 624 - 122 - 5,878 Human services 20,741 - - - -
Debt service:Interest and fiscal charges - - - - 263
Capital outlay 2,941 - 136 5,377 947 Total expenditures 39,401 16,662 258 14,272 7,088
Excess (deficiency) of revenues over (under) expenditures (5) (289) 130 451 (329)
Other financing sources (uses): Transfers in - - - 391 464 Transfers out (592) (1) - (7) - Premium on bonds issued - - - - - General obligation bonds issued - - - - - Proceeds from sale of fixed assets - - - - - Capital lease - - - - - Proceeds from notes issued - - - - -
Total other financing sources (uses) (592) (1) - 384 464
Net change in fund balances (597) (290) 130 835 135
Fund balances, beginning of year 4,130 1,286 2,710 8,060 14,406
Fund balances, end of year 3,533$ 996$ 2,840$ 8,895$ 14,541$
Special Revenue
Year Ended September 30, 2014(in thousands)
CITY OF DALLAS, TEXASCOMBINING STATEMENT OF REVENUES, EXPENDITURES, AND CHANGES IN FUND BALANCES
NONMAJOR GOVERNMENTAL FUNDS
104
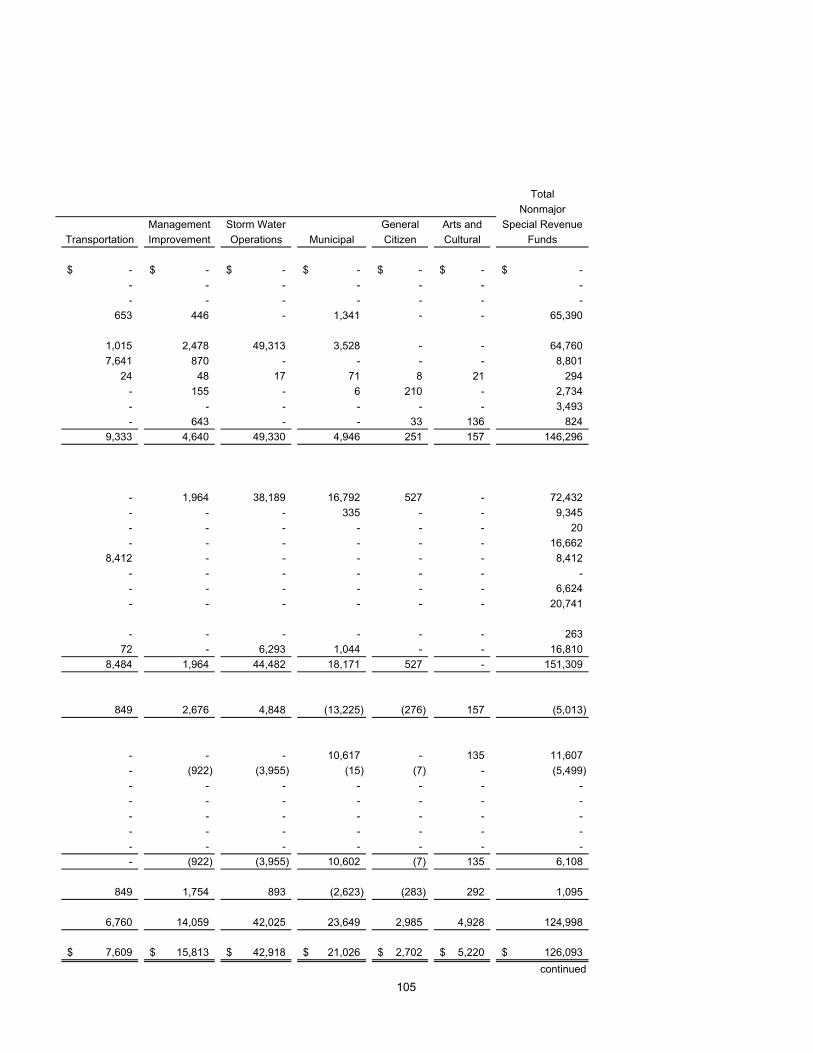
TotalNonmajor
Management Storm Water General Arts and Special RevenueTransportation Improvement Operations Municipal Citizen Cultural Funds
-$ -$ -$ -$ -$ -$ -$ - - - - - - - - - - - - - -
653 446 - 1,341 - - 65,390
1,015 2,478 49,313 3,528 - - 64,760 7,641 870 - - - - 8,801
24 48 17 71 8 21 294 - 155 - 6 210 - 2,734 - - - - - - 3,493 - 643 - - 33 136 824
9,333 4,640 49,330 4,946 251 157 146,296
- 1,964 38,189 16,792 527 - 72,432 - - - 335 - - 9,345 - - - - - - 20 - - - - - - 16,662
8,412 - - - - - 8,412 - - - - - - - - - - - - - 6,624 - - - - - - 20,741
- - - - - - 263 72 - 6,293 1,044 - - 16,810
8,484 1,964 44,482 18,171 527 - 151,309
849 2,676 4,848 (13,225) (276) 157 (5,013)
- - - 10,617 - 135 11,607 - (922) (3,955) (15) (7) - (5,499) - - - - - - - - - - - - - - - - - - - - - - - - - - - - - - - - - - - - (922) (3,955) 10,602 (7) 135 6,108
849 1,754 893 (2,623) (283) 292 1,095
6,760 14,059 42,025 23,649 2,985 4,928 124,998
7,609$ 15,813$ 42,918$ 21,026$ 2,702$ 5,220$ 126,093$ continued
105
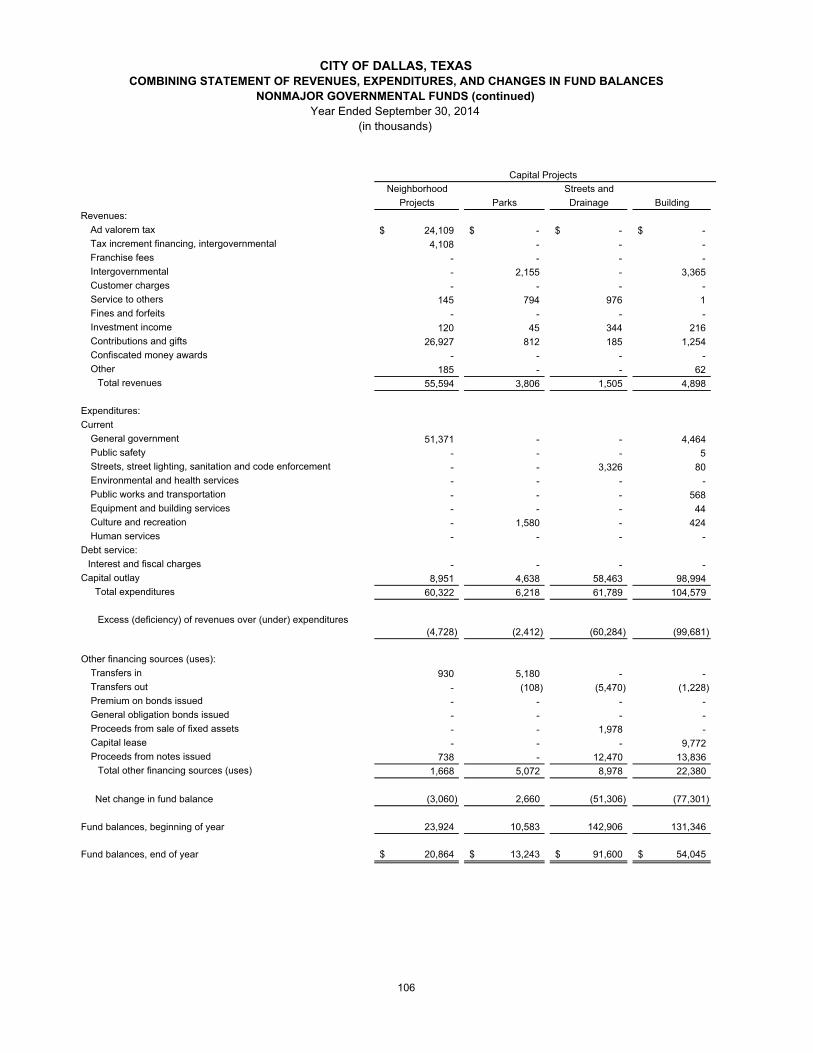
Neighborhood Streets andProjects Parks Drainage Building
Revenues: Ad valorem tax 24,109$ -$ -$ -$ Tax increment financing, intergovernmental 4,108 - - - Franchise fees - - - - Intergovernmental - 2,155 - 3,365 Customer charges - - - - Service to others 145 794 976 1 Fines and forfeits - - - - Investment income 120 45 344 216 Contributions and gifts 26,927 812 185 1,254 Confiscated money awards - - - - Other 185 - - 62
Total revenues 55,594 3,806 1,505 4,898
Expenditures:Current
General government 51,371 - - 4,464 Public safety - - - 5 Streets, street lighting, sanitation and code enforcement - - 3,326 80 Environmental and health services - - - - Public works and transportation - - - 568 Equipment and building services - - - 44 Culture and recreation - 1,580 - 424 Human services - - - -
Debt service:Interest and fiscal charges - - - -
Capital outlay 8,951 4,638 58,463 98,994 Total expenditures 60,322 6,218 61,789 104,579
Excess (deficiency) of revenues over (under) expenditures (4,728) (2,412) (60,284) (99,681)
Other financing sources (uses): Transfers in 930 5,180 - - Transfers out - (108) (5,470) (1,228) Premium on bonds issued - - - - General obligation bonds issued - - - - Proceeds from sale of fixed assets - - 1,978 - Capital lease - - - 9,772 Proceeds from notes issued 738 - 12,470 13,836
Total other financing sources (uses) 1,668 5,072 8,978 22,380
Net change in fund balance (3,060) 2,660 (51,306) (77,301)
Fund balances, beginning of year 23,924 10,583 142,906 131,346
Fund balances, end of year 20,864$ 13,243$ 91,600$ 54,045$
Capital Projects
(in thousands)
CITY OF DALLAS, TEXASCOMBINING STATEMENT OF REVENUES, EXPENDITURES, AND CHANGES IN FUND BALANCES
NONMAJOR GOVERNMENTAL FUNDS (continued)Year Ended September 30, 2014
106
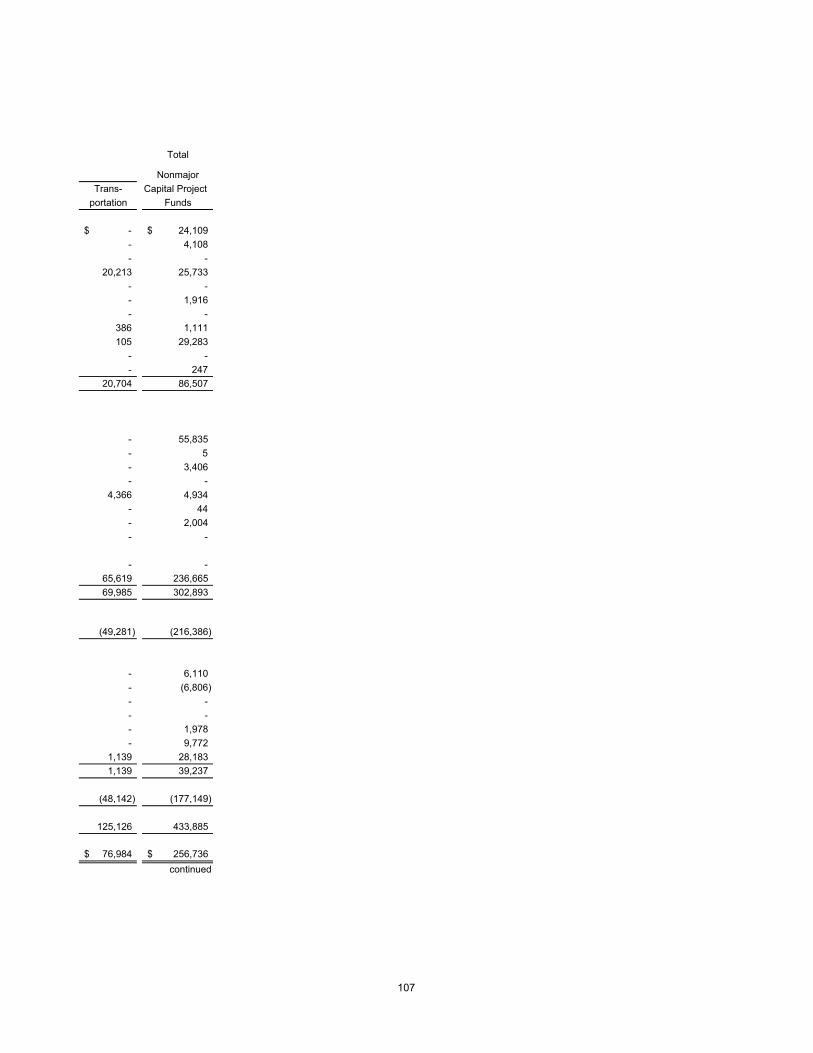
Total
NonmajorTrans- Capital Project
portation Funds
-$ 24,109$ - 4,108 - -
20,213 25,733 - - - 1,916 - -
386 1,111 105 29,283
- - - 247
20,704 86,507
- 55,835 - 5 - 3,406 - -
4,366 4,934 - 44 - 2,004 - -
- - 65,619 236,665 69,985 302,893
(49,281) (216,386)
- 6,110 - (6,806) - - - - - 1,978 - 9,772
1,139 28,183 1,139 39,237
(48,142) (177,149)
125,126 433,885
76,984$ 256,736$ continued
107

Samuell Grauwyler CraddockPark Memorial Park
Revenues:Ad valorem tax -$ -$ -$ Tax increment financing, intergovernmental - - - Intergovernmental - - - Service to others - - - Fines and forfeits - - - Investment income 530 6 55 Contributions and gifts - - - Confiscated money awards - - - Other - - -
Total revenues 530 6 55
Expenditures:Current
General government - - - Public safety - - - Streets, street lighting, sanitation, and code enforcement - - - Environment and health services - - - Public works and transportation - - - Equipment and building services - - - Culture and recreation - - - Human services - - -
Debt service: Interest and fiscal charges - - -
Capital outlay - - - Total expenditures - - -
Excess (deficiency) of revenues over (under) expenditures 530 6 55
Other financing sources (uses): Transfers in - - - Transfers out (355) (1) (7) General obligation bonds issued - - - Proceeds from sale of capital assets - - - Capital lease - - - Proceeds from notes issued - - -
Total other financing sources (uses) (355) (1) (7)
Net change in fund balances 175 5 48
Fund balances, beginning of year 8,051 93 855
Fund balances, end of year 8,226$ 98$ 903$
CITY OF DALLAS, TEXAS
Permanent Funds
COMBINING STATEMENT OF REVENUES, EXPENDITURES, AND CHANGES IN FUND BALANCESNONMAJOR GOVERNMENTAL FUNDS (continued)
Year Ended September 30, 2014(in thousands)
108

TotalMartin Total NonmajorWeiss Hale Permanent GovernmentalPark Davis Funds Funds
-$ -$ -$ 24,109$ - - - 4,108- - - 91,123 - - - 66,676 - - - 8,801 6 22 619 2,024 - - - 32,017 - - - 3,493 - - - 1,071 6 22 619 233,422
- - - 128,267 - - - 9,350 - - - 3,426 - - - 16,662 - - - 13,346 - - - 44 - - - 8,628 - - - 20,741
- - - 263 - - - 253,475 - - - 454,202
6 22 619 (220,780)
- - - 17,717 (1) (17) (381) (12,686)
- - - - - - - 1,978 - - - 9,772 - - - 28,183
(1) (17) (381) 44,964
5 5 238 (175,816)
82 405 9,486 568,369
87$ 410$ 9,724$ 392,553$
109

NONMAJOR ENTERPRISE FUNDS
To account for operations which are financed and operated in a manner similar to private business enterprise.
Municipal Radio – to account for City-owned radio broadcast services.
Building Inspection – to account for construction inspection services within the Dallas city limits.
110

Total
NonmajorMunicipal Building Enterprise
Radio Inspection FundsAssetsCurrent assets:
Pooled cash and cash equivalents 2,257$ 37,366$ 39,623$ Receivables:
Accounts 404 115 519 Accrued interest 2 39 41 Allowance for uncollectibles (2) - (2)
Total current assets 2,661 37,520 40,181
Capital assets:Land - 900 900 Artwork - - - Construction in progress - 302 302 Buildings 337 - 337 Improvements other than building 273 - 273 Equipment 2,005 1,803 3,808 Accumulated depreciation (2,105) (1,803) (3,908)
Total capital assets 510 1,202 1,712
Noncurrent assets:Net pension asset 1,685 12,272 13,957
Total assets 4,856 50,994 55,850
Deferred outflows of resources Deferred loss on refunding 6 42 48
Liabilities Current liabilities:
Accounts payable 26 298 324 Compensated absences 34 941 975 Pension obligation bonds - current 35 260 295 Other 129 865 994 Unearned revenue - 3,349 3,349 Accrued bond interest payable 5 36 41
Total current liabilities 229 5,749 5,978
Noncurrent liabilities:Accreted interest on pension obligation bonds 559 4,104 4,663 Pension obligation bonds 1,676 11,875 13,551
Total long-term debt 2,235 15,979 18,214
Other noncurrent liabilitiesCompensated absences 43 1,203 1,246 Other postemployment benefits 277 4,227 4,504 Total other noncurrent liabilities 320 5,430 5,750 Total long-term liabilities 2,555 21,409 23,964
Total liabilities 2,784 27,158 29,942
Net positionNet investment in capital assets 510 1,202 1,712 Unrestricted 1,568 22,676 24,244
Total net position 2,078$ 23,878$ 25,956$
(in thousands)
CITY OF DALLAS, TEXASCOMBINING STATEMENT OF NET POSITION
NONMAJOR ENTERPRISE FUNDSAs of September 30, 2014
111

TotalNonmajor
Municipal Building EnterpriseRadio Inspection Funds
Operating revenues:Customer charges 1,908$ 28,208$ 30,116$ Other 20 93 113 Total operating revenues 1,928 28,301 30,229
Operating expenses:
Personnel services 1,229 16,381 17,610 Supplies and materials 91 477 568 Contractual and other services 497 5,896 6,393 Depreciation 115 45 160
Total operating expenses 1,932 22,799 24,731
Operating income (loss) (4) 5,502 5,498
Nonoperating revenues (expenses):Investment income 8 105 113 Interest on bonds and notes (115) (848) (963)
Total nonoperating revenues (expenses) (107) (743) (850)
Income before contribution and transfers (111) 4,759 4,648
Transfers out (135) (109) (244)
Change in net position (246) 4,650 4,404
Net position, beginning of year 2,324 19,228 21,552
Net position, end of year 2,078$ 23,878$ 25,956$
(in thousands)
CITY OF DALLAS, TEXASCOMBINING STATEMENT OF REVENUES, EXPENSES, AND CHANGES IN FUND NET POSITION
NONMAJOR ENTERPRISE FUNDSYear Ended September 30, 2014
112
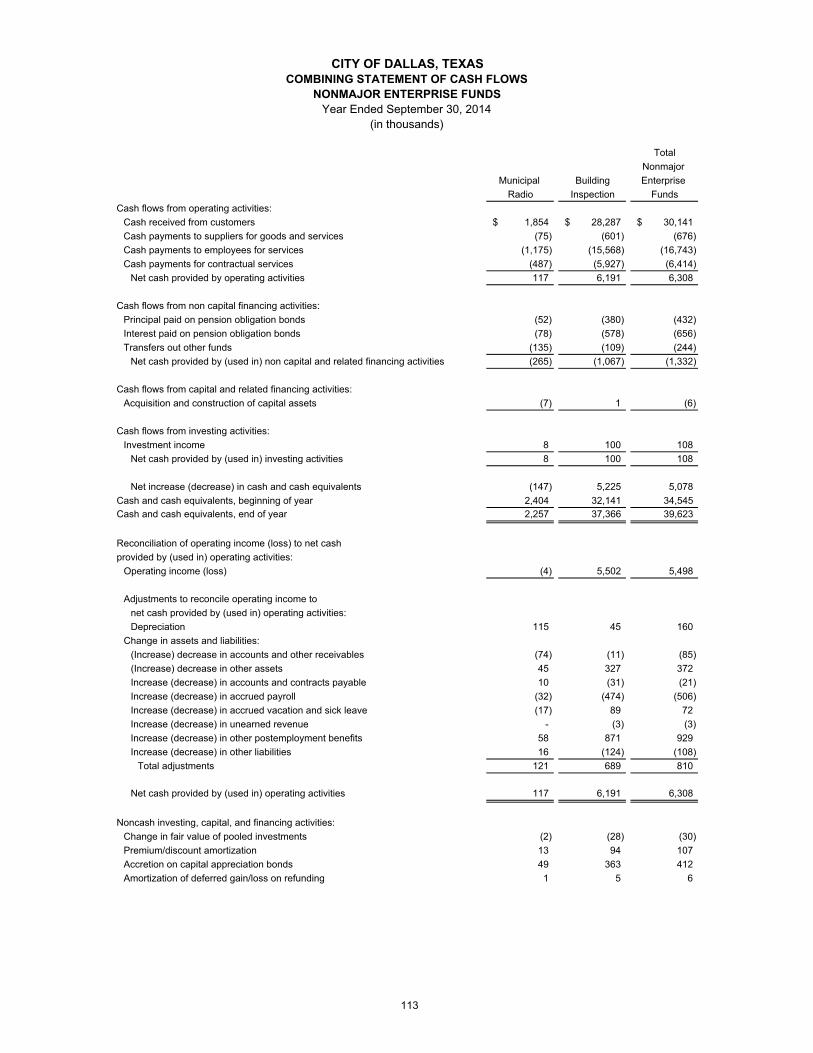
Total Nonmajor
Municipal Building Enterprise Radio Inspection Funds
Cash flows from operating activities:Cash received from customers 1,854$ 28,287$ 30,141$ Cash payments to suppliers for goods and services (75) (601) (676) Cash payments to employees for services (1,175) (15,568) (16,743) Cash payments for contractual services (487) (5,927) (6,414)
Net cash provided by operating activities 117 6,191 6,308
Cash flows from non capital financing activities:Principal paid on pension obligation bonds (52) (380) (432) Interest paid on pension obligation bonds (78) (578) (656) Transfers out other funds (135) (109) (244)
Net cash provided by (used in) non capital and related financing activities (265) (1,067) (1,332)
Cash flows from capital and related financing activities:Acquisition and construction of capital assets (7) 1 (6)
Cash flows from investing activities: Investment income 8 100 108
Net cash provided by (used in) investing activities 8 100 108
Net increase (decrease) in cash and cash equivalents (147) 5,225 5,078 Cash and cash equivalents, beginning of year 2,404 32,141 34,545 Cash and cash equivalents, end of year 2,257 37,366 39,623
Reconciliation of operating income (loss) to net cash provided by (used in) operating activities:
Operating income (loss) (4) 5,502 5,498
Adjustments to reconcile operating income to net cash provided by (used in) operating activities:Depreciation 115 45 160
Change in assets and liabilities:(Increase) decrease in accounts and other receivables (74) (11) (85) (Increase) decrease in other assets 45 327 372 Increase (decrease) in accounts and contracts payable 10 (31) (21) Increase (decrease) in accrued payroll (32) (474) (506) Increase (decrease) in accrued vacation and sick leave (17) 89 72 Increase (decrease) in unearned revenue - (3) (3) Increase (decrease) in other postemployment benefits 58 871 929 Increase (decrease) in other liabilities 16 (124) (108)
Total adjustments 121 689 810
Net cash provided by (used in) operating activities 117 6,191 6,308
Noncash investing, capital, and financing activities:Change in fair value of pooled investments (2) (28) (30) Premium/discount amortization 13 94 107 Accretion on capital appreciation bonds 49 363 412 Amortization of deferred gain/loss on refunding 1 5 6
(in thousands)
CITY OF DALLAS, TEXASCOMBINING STATEMENT OF CASH FLOWS
NONMAJOR ENTERPRISE FUNDSYear Ended September 30, 2014
113

INTERNAL SERVICE FUNDS
Equipment Services Fund – to account for the cost of providing vehicles, vehicle maintenance, and fuel and lubrication to other City departments.
Communication Equipment Services Fund – to account for the cost of providing communication services to other City Departments.
Office Systems Fund – to account for the cost of providing office supplies, printing, copying and mailing services to other City Departments.
Information Systems Fund – to account for the cost of providing data processing and programming services to other City departments.
Risk Funds – to account for the cost of providing risk financing and insurance-related activities to other City departments.
114
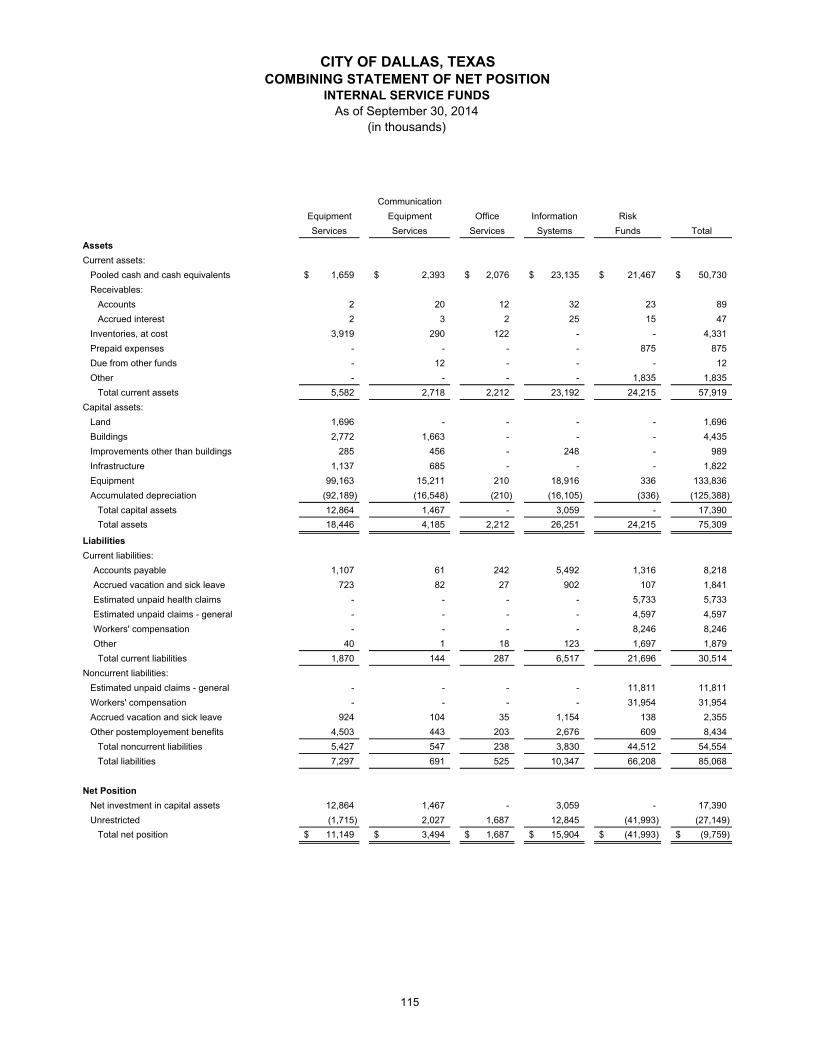
CommunicationEquipment Equipment Office Information RiskServices Services Services Systems Funds Total
AssetsCurrent assets:
Pooled cash and cash equivalents 1,659$ 2,393$ 2,076$ 23,135$ 21,467$ 50,730$ Receivables:
Accounts 2 20 12 32 23 89 Accrued interest 2 3 2 25 15 47
Inventories, at cost 3,919 290 122 - - 4,331 Prepaid expenses - - - - 875 875 Due from other funds - 12 - - - 12 Other - - - - 1,835 1,835
Total current assets 5,582 2,718 2,212 23,192 24,215 57,919 Capital assets:
Land 1,696 - - - - 1,696 Buildings 2,772 1,663 - - - 4,435 Improvements other than buildings 285 456 - 248 - 989 Infrastructure 1,137 685 - - - 1,822 Equipment 99,163 15,211 210 18,916 336 133,836 Accumulated depreciation (92,189) (16,548) (210) (16,105) (336) (125,388)
Total capital assets 12,864 1,467 - 3,059 - 17,390 Total assets 18,446 4,185 2,212 26,251 24,215 75,309
LiabilitiesCurrent liabilities:
Accounts payable 1,107 61 242 5,492 1,316 8,218 Accrued vacation and sick leave 723 82 27 902 107 1,841 Estimated unpaid health claims - - - - 5,733 5,733 Estimated unpaid claims - general - - - - 4,597 4,597 Workers' compensation - - - - 8,246 8,246 Other 40 1 18 123 1,697 1,879 Total current liabilities 1,870 144 287 6,517 21,696 30,514
Noncurrent liabilities:Estimated unpaid claims - general - - - - 11,811 11,811 Workers' compensation - - - - 31,954 31,954 Accrued vacation and sick leave 924 104 35 1,154 138 2,355 Other postemployement benefits 4,503 443 203 2,676 609 8,434
Total noncurrent liabilities 5,427 547 238 3,830 44,512 54,554 Total liabilities 7,297 691 525 10,347 66,208 85,068
Net PositionNet investment in capital assets 12,864 1,467 - 3,059 - 17,390 Unrestricted (1,715) 2,027 1,687 12,845 (41,993) (27,149)
Total net position 11,149$ 3,494$ 1,687$ 15,904$ (41,993)$ (9,759)$
(in thousands)
CITY OF DALLAS, TEXASCOMBINING STATEMENT OF NET POSITION
INTERNAL SERVICE FUNDSAs of September 30, 2014
115

CommunicationEquipment Equipment Office Information RiskServices Services Services Systems Funds Total
Operating revenuesCharges to other city departments 53,916$ 4,961$ 116$ 6,015$ 98,217$ 163,225$ Services to others - 245 3,363 46,166 49,180 98,954 Other 71 35 168 2 404 680
Total operating revenues 53,987 5,241 3,647 52,183 147,801 262,859
Operating expensesPersonnel services 15,120 2,066 610 13,847 9,849 41,492 Supplies and materials 30,089 858 1,255 686 71 32,959 Contractual and other services 4,939 1,317 1,593 31,867 127,555 167,271 Depreciation 4,055 150 - 286 - 4,491
Total operating expenses 54,203 4,391 3,458 46,686 137,475 246,213 Operating income (loss) (216) 850 189 5,497 10,326 16,646
Nonoperating revenues (expenses):Investment income 7 7 6 66 39 125 Gain (loss) on property disposals 538 - - - - 538
Total nonoperating revenues (expenses) 545 7 6 66 39 663
Income (loss) before transfers and contributions 329 857 195 5,563 10,365 17,309
Transfers out (3,607) (136) (38) (2,424) (162) (6,367)
Change in net position (3,278) 721 157 3,139 10,203 10,942
Net position (deficit), beginning of year 14,427 2,773 1,530 12,765 (52,196) (20,701)
Net position (deficit), end of year 11,149$ 3,494$ 1,687$ 15,904$ (41,993)$ (9,759)$
(in thousands)
CITY OF DALLAS, TEXASCOMBINING STATEMENT OF REVENUES, EXPENSES, AND CHANGES IN FUND NET POSITION
INTERNAL SERVICE FUNDSYear Ended September 30, 2014
116

CommunicationEquipment Equipment Office Information RiskServices Services Services Systems Funds Total
Cash flows from operating activities:Cash received from other funds for services 53,983$ 5,241$ 3,647$ 52,183$ 147,801$ 262,855$ Cash payments to suppliers for goods and services (31,423) (1,069) (1,259) (792) (1,202) (35,745) Cash payments to employees for services (15,183) (1,984) (567) (14,107) (9,987) (41,828) Cash payments for contractual services (4,939) (1,317) (1,593) (31,867) (130,984) (170,700)
Net cash provided by (used in) operating activities 2,438 871 228 5,417 5,628 14,582
Cash flows from noncapital financing activities:Transfers to other funds (3,607) (136) (38) (2,424) (162) (6,367)
Net cash provided by (used in) noncapital financing activities (3,607) (136) (38) (2,424) (162) (6,367)
Cash flows from capital and related financing activities:Acquisition and construction of capital assets 491 - - (174) - 317
Net cash provided by (used in) capital and related financing activities 491 - - (174) - 317
Cash flows from investing activities:Investment income 9 6 6 59 39 119
Net cash provided by investing activities 9 6 6 59 39 119
Net increase (decrease) in pooled cash and cash equivalents (669) 741 196 2,878 5,505 8,651 Cash and cash equivalents, beginning of year 2,328 1,652 1,880 20,257 15,962 42,079 Cash and cash equivalents, end of year 1,659 2,393 2,076 23,135 21,467 50,730
Reconciliation of operating income (loss) to net cashprovided by (used in) operating activities:
Operating income (loss) (216) 850 189 5,497 10,326 16,646
Adjustments to reconcile income (loss) from operations tonet cash provided by (used in) operating activities:Depreciation 4,055 150 - 286 - 4,491 Change in assets and liabilities:
(Increase) Decrease in accounts receivables (4) - - - - (4) (Increase) Decrease in inventories (331) (33) (92) - - (456) (Increase) Decrease in prepaid expenses - - - - (784) (784) (Increase) Decrease in due from other funds (458) (62) (18) (441) (75) (1,054) Increase (Decrease) in accounts and notes payable (1,007) (178) 88 (106) (1,576) (2,779) Increase (Decrease) in accrued vacation and sick leave (9) 5 10 69 20 95 Increase (Decrease) in other post employment benefits 404 139 51 112 (83) 623 Increase (Decrease) in other liabilities 4 - - - (2,200) (2,196)
Total adjustments 2,654 21 39 (80) (4,698) (2,064)
Net cash provided by (used in) operating activities 2,438 871 228 5,417 5,628 14,582
Noncash investing, capital, and financing activities:Change in fair value of pooled investments - (2) (1) (16) (12) (31)
(in thousands)
CITY OF DALLAS, TEXASCOMBINING STATEMENT OF CASH FLOWS
INTERNAL SERVICE FUNDSYear Ended September 30, 2014
117

FIDUCIARY FUNDS
Trust and Agency Funds – to account for assets held by the City in a trustee capacity or as an agent for individuals, private organizations, other governments, and/or other funds. The City’s Trust and Agency Funds include Pension Trust Funds and Agency Funds.
Pension Trust Funds are accounted for in essentially the same manner as proprietary funds, using the same measurement focus and basis of accounting. The Pension Trust Funds are used to account for the assets of the City’s Employees’ Retirement Fund; Dallas Police and Fire Pension System; and the Police and Fire Supplemental Pension Fund.
Agency Funds are purely custodial and do not involve measurement of results of operations.
Cash Escrow Deposit Fund – to account for cash escrow bonds collected by the municipal court.
Confiscated Money Fund – to account for property confiscated in drug violation arrests.
Disposal Deposit Fund – to account for deposits from sanitation landfill customers that have credit accounts with the City to guarantee payment of accounts.
Tax Distribution Fund – to account for the collection and distribution of ad valorem taxes for the City and the Dallas Independent School District. Employee War and Savings Bond Fund – to account for employee payroll deductions for the purchase of savings bonds. Deferred Compensation Fund – to account for the employees’ 401k, tax-deferred compensation deductions.
Employee Benefits Fund – to account for employees’ Dental, Vision, AD&D, and Dependent Life Insurance deductions and Health Maintenance Organization (HMO) employees’ and City deductions. The City collects and remits premiums on behalf of the participants.
Dallas Tourism Public Improvement District (PID) Deposit Fund – to account for the collection and distribution of Tourism Public Improvement District recovery assessment fees for the Tourism PID.
118

Employees' Dallas Police & Police & Fire Total Retirement Fire Pension Supplemental Pension
Fund System Pension Fund Trust FundsAssets Cash and cash equivalents 434,368$ -$ -$ 434,368$ Receivables:
Accounts 270,644 5,173 1 275,818 Accrued interest and dividends 15,596 - - 15,596
Domestic equities 1,023,549 - - 1,023,549 U.S. and foreign government securities 188,392 - - 188,392 Domestic corporate fixed income 692,360 - - 692,360 International equities and fixed income 929,064 - - 929,064 Commingled index funds 80,972 - - 80,972 Private equities and venture capital funds 93,939 - - 93,939 Plan interest in Group Master Trust 218,110 3,331,256 23,584 3,572,950
Total assets 3,946,994 3,336,429 23,585 7,307,008
Liabilities Accounts payable 4,783 1,170 8 5,961 Payable for securities purchased 15,402 - - 15,402 Securities lending collateral 336,590 - - 336,590 Other 257,859 - - 257,859
Total liabilities 614,634 1,170 8 615,812
Net Position Held in trust for pension benefits 3,332,360 3,335,259 23,577 6,691,196
Total net position 3,332,360$ 3,335,259$ 23,577$ 6,691,196$
(1) Although the City has a fiscal year-end of September 30, the pension trust funds have a calendar year-end; therefore, the information presented above is as of December 31, 2013.
CITY OF DALLAS, TEXASCOMBINING STATEMENT OF PLAN NET POSITION
PENSION TRUST FUNDSSeptember 30, 2014 (1)
(in thousands)
119

Employees' Dallas Police & Police & Fire Total Retirement Fire Pension Supplemental Pension
Fund System Pension Fund Trust Funds
Additions:Contributions
Employer 37,823$ 106,074$ 1,935$ 145,832$ Employee 41,730 26,238 34 68,002 Total contributions 79,553 132,312 1,969 213,834
Net investment income:Dividends 54,807 - - 54,807 Interest 48,103 - - 48,103 Net appreciation in fair value of investments 405,055 165,409 1,180 571,644 Securities lending income 1,819 - - 1,819 Less investment expenses:
Investment management fees (15,440) - - (15,440) Custody fees (150) - - (150) Consultant fees (332) - - (332) Securities lending management fees (364) - - (364)
Total investment expenses (16,286) - - (16,286)
Net investment income 493,498 165,409 1,180 660,087
Other income 626 - - 626
Total increases 573,677 297,721 3,149 874,547
Deductions:Benefit payments 216,988 217,982 2,207 437,177 Refund of contributions 4,405 900 - 5,305 Administrative expenses 3,595 8,511 61 12,167
Total deductions 224,988 227,393 2,268 454,649
Net increase in net position available for benefits 348,689 70,328 881 419,898
Net position, beginning of year 2,983,671 3,264,931 22,696 6,271,298
Net position, end of year 3,332,360$ 3,335,259$ 23,577$ 6,691,196$
(1) Although the City has a fiscal year-end of September 30, the pension trust funds have a calendar year-end; therefore, the information presented above is as of December 31, 2013.
CITY OF DALLAS, TEXASCOMBINING STATEMENT OF CHANGES IN PLAN NET POSITION
PENSION TRUST FUNDSYear Ended September 30, 2014 (1)
(in thousands)
120

Balance BalanceSeptember 30, September 30,
2013 Additions Deductions 2014CASH ESCROW DEPOSIT FUND
AssetsCash and other assets 249$ 475$ 447$ 277$
Liabilities Due to other governments and other liabilities 249 475 447 277
CONFISCATED MONEY FUNDAssetsCash and other assets 3,523 1,334 1,142 3,715
LiabilitiesOther liabilities 3,523 1,334 1,142 3,715
DISPOSAL DEPOSIT FUND
AssetsCash and other assets 557 109 2 664
LiabilitiesCustomer deposits 557 109 2 664
TAX DISTRIBUTION FUNDAssetsCash and other assets 106 - 21 85
LiabilitiesDue to other funds and other liabilities 106 - 21 85
EMPLOYEE WAR AND SAVINGS BOND FUNDAssetsCash and other assets 2 - - 2
LiabilitiesOther liabilities 2 - - 2
DEFERRED COMPENSATION FUNDAssetsInvestments and other assets 50 38,236 37,750 536
LiabilitiesDue to employees - deferred compensation
and other liabilities 50 38,236 37,750 536
EMPLOYEE BENEFITS FUNDAssetsCash 121 16,863 16,864 120
LiabilitiesOther liabilities 121 16,863 16,864 120
DALLAS TOURISM PID DEPOSIT FUNDAssetsCash 863 12,640 12,532 971
LiabilitiesOther liabilities 863 12,640 12,532 971
TOTALS - ALL AGENCY FUNDSAssetsCash and other assets 5,471 69,657 68,758 6,370
Liabilities Due to other funds and other liabilities 5,471$ 69,657$ 68,758$ 6,370$
CITY OF DALLAS, TEXASCOMBINING STATEMENT OF CHANGES IN ASSETS AND LIABILITIES
ALL AGENCY FUNDSYear Ended September 30, 2014
(in thousands)
121

DEBT SERVICE FUND
The City maintains one fund to account for payment of principal and interest on the following general obligation debt: bonds, certificates of obligation, and equipment acquisition notes.
122

Variance withActual Final Budget--
Budgeted Amounts Budget PositiveOriginal Final Basis (Negative)
Revenues:Ad valorem taxes 204,864$ 204,864$ 204,594$ (270)$ "Build America Bonds" Federal Subsidy 1,372 1,372 1,396 24 Investment income - - 54 54
Total revenues 206,236 206,236 206,044 (192)
Expenditures:Principal 143,957 143,957 143,957 - Interest and fiscal charges 83,223 83,223 82,650 573 Other 7,332 7,332 7,174 158
Total expenditures 234,512 234,512 233,781 731
Deficiency of revenues over expenditures (28,276) (28,276) (27,737) 539
Other financing sources:Transfers 26,298 26,298 25,504 (794) General obligation bonds and premium issued - - - - Refunding bonds - - - - Payment to refunded bond escrow agent - - - -
Total other financing sources 26,298 26,298 25,504 (794)
Deficiency of revenues and other financingsources over expenditures (1,978) (1,978) (2,233) (255)
Fund balance, beginning of year (28,777) (28,777) 5,905 34,682 Fund balance, end of year (30,755)$ (30,755)$ 3,672$ 34,427$
Adjustments necessary to convert the deficiency of revenues and other sources under expenditures and otheruses on the budget basis to a GAAP basis are provided below:
Deficiency of revenues and other financing sources over expenditures and other uses-budget basis (2,233)$
Change in fair market value of investments (267)
Deficiency of revenues and other financing sources over expenditures and other uses-GAAP basis (2,500)$
(in thousands)
CITY OF DALLAS, TEXASBUDGETARY COMPARISON SCHEDULE
DEBT SERVICE FUNDYear Ended September 30, 2014
�123

DISCRETELY PRESENTED COMPONENT UNITS
Housing Finance Corporation – organized to issue tax-exempt mortgage revenue bonds to encourage low to moderate income citizen opportunities for single family residential home ownership.
Housing Acquisition and Development Corporation – organized solely and exclusively for the public purpose of providing safe, affordable housing facilities which are incidental thereto for the benefit of low and moderate-income persons.
Dallas Development Fund – organized to assist in carrying out the economic development program and objectives of the City by generating private investment capital through the New Markets Tax Credit Program to be made available for investment in low-income communities.
Downtown Dallas Development Authority – to account for tax increment financing revenue bonds issued to finance major improvements by developers on behalf of the City.
North Oak Cliff Municipal Management District – organized to promote, develop, encourage, and maintain employment, commerce, transportation, housing, tourism, recreation, and the arts, entertainment, economic development, safety, the public welfare in the district, and educational scholarships for college-bound students residing in or out of the District.
Cypress Waters Municipal Management District – organized to promote, develop, encourage and maintain employment, commerce, transportation, housing, tourism, recreation, the arts, entertainment, economic development, safety and the public welfare in the District.
Dallas Convention Center Hotel Development Corporation – organized to promote the development of the geographic area of the City included at or in the vicinity of the Dallas Convention Center, in furtherance of the promotion, development, encouragement and maintenance of employment, commerce, convention and meeting activity, tourism, and economic development in the City, including specifically, without limitation, the development and financing of a convention center hotel to be located within 1,000 feet of the Dallas Convention Center.
124

Business-typeActivities
North Cypress DallasHousing Downtown Oak Cliff Waters Convention
Housing Acquisition and Dallas Dallas Municipal Municipal Center HotelFinance Development Development Development Management Management Total Development
Corporation * Corporation Fund Authority District District Governmental Corporation *
Assets:Current assets:
Cash and cash equivalents 132$ 93$ 1,410$ -$ 6$ -$ 1,641$ 31,792$ Investments, at fair value 2,954 - 8 - - - 2,962 - Receivables 706 71 111 - - - 888 6,097 Inventory - - - - - - - 451 Prepaid Expenses 12 - - - - - 12 779 Land held for resale - 639 - - - - 639 - Franchise Fee (net of accumulated amortization) - - - - - - - 39
Restricted assets: - Cash and cash equivalents - - - 51,859 - - 51,859 46,398 Investments, at fair value - - - - - - 37,052
Capital assets: - Building 1,958 - - - - - 1,958 304,265 Furniture, fixtures and equipment 98 - - - - - 98 40,619 Land 509 - - - - - 509 27,511 Construction in progress - - - - - - - 1,231 Less: Accumulated depreciation (121) (121) (28,388)
Total assets 6,248 803 1,529 51,859 6 - 60,445 467,846
Liabilities: Accrued payroll - - - - - - - 1,335 Accounts payable 84 - 150 - - - 234 1,075 Accrued expenses 7 - - 26,874 - - 26,881 2,282 Accrued taxes payable - 588 Developer advances - - - - - - - - Unearned revenue - 1 - - - - 1 - Accrued interest payable - - - 139 - - 139 15,718 Accounts payable Omni - 1,716 Other 2 - - - - 273 275 2,254 Long-term liabilities: -
Due within one year - - - 2,772 - - 2,772 - Due in more than one year - - - 95,023 - - 95,023 489,649
Total liabilities 93 1 150 124,808 - 273 125,325 514,617
Deferred inflows of resources - - - - - - - 24
Net position:Net investment in capital assets 2,444 - - - - - 2,444 (35,786) Restricted for debt service - 638 - 7,958 - - 8,596 - Unrestricted 3,711 164 1,379 (80,907) 6 (273) (75,920) (11,009)
Total net position 6,155$ 802$ 1,379$ (72,949)$ 6$ (273)$ (64,880)$ (46,795)$
* The information reported for the Housing Finance Corporation and the Dallas Convention Center Hotel Development Corporation is as of December 31, 2013.
(in thousands)
Governmental-type Activities Component Units
CITY OF DALLAS, TEXASCOMBINING STATEMENT OF NET POSITION
DISCRETELY PRESENTED COMPONENT UNITSAs of September 30, 2014
125

Business-typeActivities
North Cypress DallasHousing Downtown Oak Cliff Waters Convention
Housing Acquisition and Dallas Dallas Municipal Municipal Center HotelFinance Development Development Development Management Management Development
Corporation * Corporation Fund Authority District District Total Corporation *
Operating revenues:Charges for services 400$ -$ 1,010$ -$ -$ -$ 1,410$ 85,322$ Other - 595 - - - - 595 - Intergovernmental - - - 13,430 - - 13,430 -
Total operating revenues 400 595 1,010 13,430 - - 15,435 85,322 -
Operating expenses: - Personnel services 138 - - - - - 138 - Contractual and other services 139 617 376 26,878 - 144 28,154 57,947 Interest and service charges - - - 5,609 5,609 - Depreciation and amortization 80 - - - - - 80 13,147
Total operating expenses 357 617 376 32,487 - 144 33,981 71,094 -
Operating income 43 (22) 634 (19,057) - (144) (18,546) 14,228
Nonoperating revenues(expenses):Interest and dividends 1 - - 3 - - 4 1,103 Interest on bonds - - - - - - - (32,413) Contributions (107) (149) - - - - (256) - City tax revenue - - - - - - - 7,816 Other - - - - 5 - 5 8,866
Total nonoperating revenues(expenses) (106) (149) - 3 5 - (247) (14,628) -
Change in net position (63) (171) 634 (19,054) 5 (144) (18,793) (400) -
Net position, beginning of year 6,218 (1) 973 745 (53,895) 1 (129) (46,087) (46,395)
Net position, end of year 6,155$ 802$ 1,379$ (72,949)$ 6$ (273)$ (64,880)$ (46,795)$
* The information reported for the Housing Finance Corporation and the Dallas Convention Center Hotel Development Corporation is as of December 31, 2013
(1) Beginning net position has been restated - see note 20
(in thousands)
Governmental-type Activities Component Units
CITY OF DALLAS, TEXASCOMBINING STATEMENT OF REVENUES, EXPENSES, AND CHANGES IN NET POSITION
DISCRETELY PRESENTED COMPONENT UNITS Year Ended September 30, 2014
126

“Dallas, the City that works: diverse, vibrant and progressive.”
127
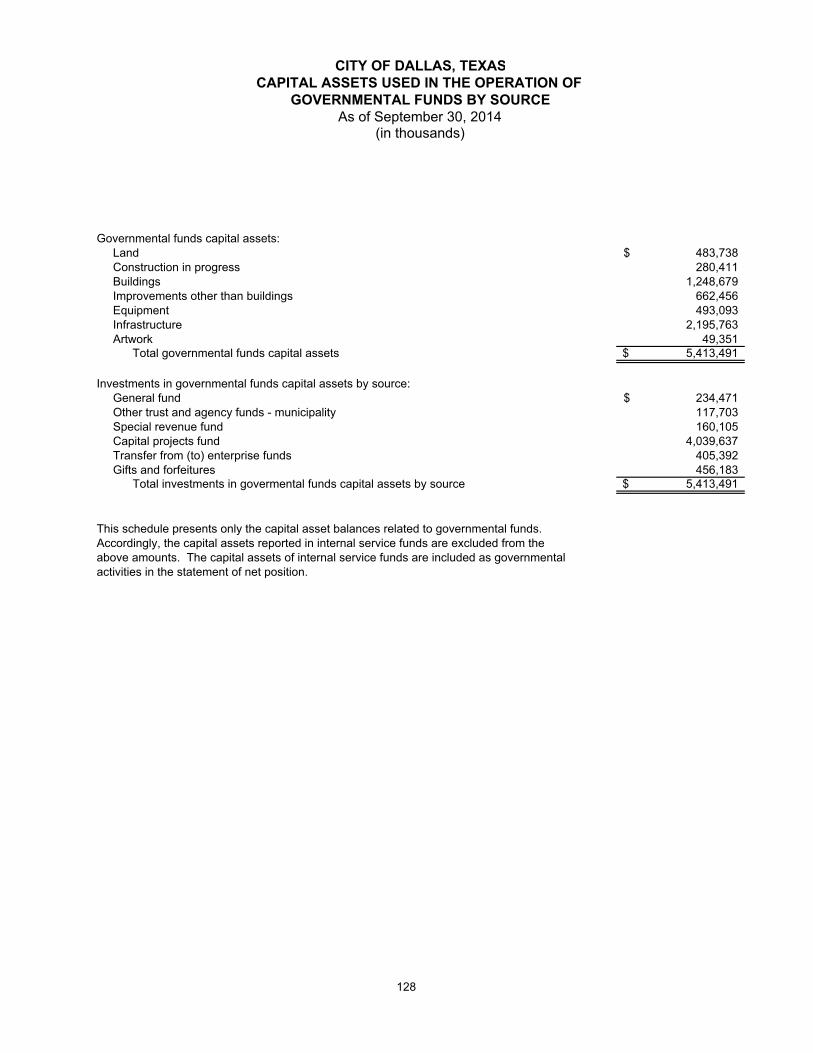
Governmental funds capital assets: Land 483,738$ Construction in progress 280,411 Buildings 1,248,679 Improvements other than buildings 662,456 Equipment 493,093 Infrastructure 2,195,763 Artwork 49,351 Total governmental funds capital assets 5,413,491$
Investments in governmental funds capital assets by source: General fund 234,471$ Other trust and agency funds - municipality 117,703 Special revenue fund 160,105 Capital projects fund 4,039,637 Transfer from (to) enterprise funds 405,392 Gifts and forfeitures 456,183 Total investments in govermental funds capital assets by source 5,413,491$
This schedule presents only the capital asset balances related to governmental funds.Accordingly, the capital assets reported in internal service funds are excluded from theabove amounts. The capital assets of internal service funds are included as governmentalactivities in the statement of net position.
(in thousands)
CITY OF DALLAS, TEXASCAPITAL ASSETS USED IN THE OPERATION OF
GOVERNMENTAL FUNDS BY SOURCEAs of September 30, 2014
128

ImprovementsConstruction Other than
Function and Activity Land in Progress Buildings Buildings Equipment Infrastructure Artwork Total
General government City attorney -$ -$ -$ 8$ 344$ -$ -$ 352$ City auditor - - - - 112 - - 112 Office of financial services (3,671) - 4 1,419 39,034 1,491 - 38,277 Municipal Court - - 522 - 3,426 30 - 3,978 City secretary - - - - 119 - - 119 Civil service - - - - 118 - - 118 Planning and Development 21,599 - 11,104 31,250 19,286 50,139 - 133,378 Employee retirement - - - - 13 - - 13 Equipment, communications and - - information services (5) - 20,557 2,587 80,804 12,259 - 116,202 Human resources - - - - 5,653 - - 5,653 International Affairs - - - - 28 - - 28 Mayor and council - - - - 212 - - 212 Police and fire pension - - - - 30 - - 30
Public safety Fire 3,493 - 26,939 52 95,465 21 - 125,970 Police 9,329 - 94,017 50 24,827 3,181 - 131,404 Public market 4,771 - 4,355 515 199 741 - 10,581
Street, sanitation, and code 53,356 - 10,796 16,207 50,300 366,546 - 497,205
Environmental and health services 3,738 - 7,234 866 905 478 - 13,221
Public works and transportation 204,618 - 550,687 71,420 38,140 1,628,107 372 2,493,344
Culture and recreation 149,331 - 409,622 536,825 18,608 29,383 48,979 1,192,748
Library 1,178 - 63,255 29 109,167 348 - 173,977
Housing 6,570 - 9,847 1,228 97 7,670 - 25,412
Unallocated - Primarily assets 29,431 - 39,740 - 6,206 95,369 - acquired prior to 1977 170,746
Construction in progress - 280,411 - - - - - 280,411
Total capital assets of governmental funds 483,738$ 280,411$ 1,248,679$ 662,456$ 493,093$ 2,195,763$ 49,351$ 5,413,491$
This schedule presents only the capital asset balances related to governmental funds.Accordingly, the capital assets reported in internal service funds are excluded from theabove amounts. The capital assets of internal service funds are included as governmentalactivities in the statement of net position.
CITY OF DALLAS, TEXASCAPITAL ASSETS USED IN THE OPERATION OF GOVERNMENTAL FUNDS
SCHEDULE BY FUNCTION AND ACTIVITYAs of September 30, 2014
(in thousands)
129

Governmental Funds Governmental FundsCapital Assets Capital Assets
Function and Activity October 1, 2013 Additions Dispositions September 30, 2014
General government City attorney 352$ -$ -$ 352$ City auditor 112 - - 112 Office of financial services 38,418 (42) 99 38,277 Muncipal court 2,384 1,594 - 3,978 City secretary 119 - - 119 Civil service 118 - - 118 Planning and development 125,865 11,446 - 137,311 Employee retirement 13 - - 13 Equipment, communications and - - - - information services 96,376 16,962 1,070 112,268 Human resources 5,653 - - 5,653 International affairs 28 - - 28 Mayor and council 212 - - 212 Police and fire pension 30 - - 30
Public safety Fire 110,622 17,873 2,525 125,970 Police 124,647 6,779 22 131,404 Public market 10,581 - - 10,581
Street, sanitation, and code enforcement 492,115 8,669 3,579 497,205
Environmental and health services 13,221 - - 13,221
Public works and transportation 2,291,208 202,463 324 2,493,347
Culture and recreation 1,114,337 78,409 - 1,192,746
Housing 19,914 5,499 - 25,413
Library 170,421 3,555 - 173,976
Unallocated - primarily assets acquired prior to 1977 170,746 - - 170,746
Construction in progress 340,489 201,086 261,164 280,411
Total capital asssets used in the operation of governmental funds 5,127,981$ 554,293$ 268,783$ 5,413,491$
This schedule presents only the capital asset balances related to governmental fundsAccordingly, the capital assets reported in internal service funds are excluded from theabove amounts. The capital assets of internal service funds are included asgovernmental activities in the statement of net position.
(in thousands)
CITY OF DALLAS, TEXASCAPITAL ASSETS USED IN THE OPERATION OF GOVERNMENTAL FUNDS
SCHEDULE OF CHANGES BY FUNCTION AND ACTIVITYAs of September 30, 2014
130

STATISTICAL SECTION

Tables
Financial Trends These schedules contain trend information to help the reader understand how 1-4the City's financial performance and well-being have changed over time.
Revenue Capacity These schedules present information to help the reader assess the City's most 5-9significant local revenue source, the property tax.
Debt Capacity These schedules present information to help the reader assess the affordability 10-14of the City's current levels of outstanding debt and the City's ability to issue additional debt in the future.
Demographic & Economic These schedules offer demographic and economic indicators to help the reader 15-16 Information understand the environment within which the City's financial activities take
place.
Operating information These schedules contain service and infrastructure data to help the reader 17-19understand how the information in the City's financial report relates to the services the City provides and the activities it performs.
Sources: Unless otherwise noted, the information in these tables is derived from the comprehensive annual financial reports for the relevant year.
health.
The City of Dallas comprehensive annual financial report presents detailed information as a context for understanding what the information in the financial statements, note disclosures, and required supplementary information says about the
STATISTICAL SECTION(Unaudited)
131

2005 2006 2007 2008
Governmental activitiesNet investment in capital assets 1,485,097$ 1,495,420$ 1,568,170$ 1,657,571$ Restricted 112,756 65,938 70,916 60,532 Unrestricted (151,991) (68,191) (113,329) (178,079)
Total Governmental activities net position 1,445,862 1,493,167 1,525,757 1,540,024
Business-type activitiesNet investment in capital assets 2,128,113 2,196,675 2,276,773 2,357,750 Restricted for debt service 154,584 168,535 181,481 194,824 Unrestricted 138,893 176,088 205,506 221,785
Total Business-type activities net position 2,421,590 2,541,298 2,663,760 2,774,359
Primary governmentNet investment in capital assets 3,613,210 3,692,095 3,844,943 4,015,321 Restricted 267,340 234,473 252,397 255,356 Unrestricted (13,098) 107,897 92,177 43,706
Total Primary government net position 3,867,452$ 4,034,465$ 4,189,517$ 4,314,383$
*Source: Comprehensive Annual Financial Report for the respective years unless restated, which is from the subsequent year's Comprehensive Annual Financial Report, Management Discussion and Analysis
CITY OF DALLAS, TEXASNET POSITION BY COMPONENT
Last Ten Fiscal Years (Unaudited)(accrual basis of accounting)
(in thousands)
132

Table 1
2009 2010 2011 2012 2013 2014
1,699,281$ 2,128,770$ 2,144,338$ 2,201,645$ 2,241,628$ 2,406,821$ 46,353 73,825 188,549 159,022 216,280 144,269
(207,135) (266,121) (270,121) (279,979) (294,490) (306,474)
1,538,499 1,936,474 2,062,766 2,080,688 2,163,418 2,244,616
2,452,779 2,533,106 2,586,775 2,648,976 2,738,208 2,770,931 205,547 184,874 172,515 214,249 212,472 223,230 185,917 195,273 273,611 290,977 292,801 362,862
2,844,243 2,913,253 3,032,901 3,154,202 3,243,481 3,357,023
4,152,060 4,661,876 4,731,113 4,850,621 4,979,836 5,177,752 251,900 258,699 361,064 373,271 428,752 367,499 (21,218) (70,848) 3,490 10,998 (1,689) 56,388
4,382,742$ 4,849,727$ 5,095,667$ 5,234,890$ 5,406,899$ 5,601,639$
133

Expenses 2005 2006 2007 2008Governmental Activities:
General government 153,096$ 186,202$ 164,498$ 188,879$ Public safety 515,936 522,796 612,318 659,915 Streets, lighting, sanitation, code enforcement 123,289 148,608 166,335 176,503 Environmental and health services 25,777 25,596 29,099 33,230 Public works and transportation 38,728 38,038 60,490 70,931 Equipment and building services 30,037 46,402 41,265 31,047 Cultural and recreational 114,398 120,041 127,043 146,418 Housing 1,398 1,308 936 1,706 Human services 27,536 58,810 26,785 25,547 Interest on long-term debt 44,854 75,002 87,320 89,525
Total governmental activities 1,075,049 1,222,803 1,316,089 1,423,701
Business-type activities:Dallas water utilities 309,957 345,217 360,886 396,771 Convention center 80,923 85,733 83,429 84,608 Airport revenues 42,249 40,383 44,702 43,144 Municipal radio 3,265 4,011 3,466 3,313 Building inspection 19,027 20,921 23,897 24,018
Total business-type activities 455,421 496,265 516,380 551,854 Total primary government expenses 1,530,470 1,719,068 1,832,469 1,975,555
Program revenues Governmental Activities:
Charges for servicesGeneral government 114,147 113,844 66,803 80,647 Public safety 17,762 26,813 32,451 52,475 Streets, lighting, sanitation, code 74,182 81,821 94,223 99,803 Environmental and health services 6,496 5,545 5,856 5,895 Public works and transportation 10,467 10,720 23,567 11,977 Equipment and building services 1,871 1,216 1,007 994 Cultural and recreational 14,440 14,820 29,894 15,499 Housing 157 452 807 40 Human Services 6,431 16,600 21,339 14
Operating grants and contributions 65,153 63,838 71,041 71,772 Capital grants and contributions 21,076 6,690 2,912 15,821
Total governmental activities 332,182 342,359 349,900 354,937
Business-type activities:Dallas water utilities 369,484 438,219 411,998 451,408 Convention center 15,443 22,867 22,473 20,392 Airport revenues 29,550 33,151 38,581 48,224 Municipal radio 3,160 3,488 3,675 3,227 Building inspection 21,231 23,437 23,261 21,819 Operating grants and contributions - - - - Capital grants and contributions 28,086 46,235 33,467 29,779
Total business-type activities 466,954 567,397 533,455 574,849 Total primary government program revenues 799,136 909,756 883,355 929,786
Net (Expense) Revenue Governmental Activities (742,867) (880,444) (966,189) (1,068,764) Business -type activities 11,533 71,132 17,075 22,995
Total primary government net expense (731,334) (809,312) (949,114) (1,045,769)
General Revenues: Taxes:
Ad valorem tax 476,389 510,065 553,033 623,625 Sales taxes 198,441 217,836 224,078 231,108 Franchise taxes 113,669 123,225 118,745 127,551
Tax increment financing, intergovernmental 4,261 4,159 6,090 8,857 Interest on investments 21,651 37,156 62,776 47,644 Miscellaneous 9,719 27,918 30,755 41,273 Loss on disposal of capital assets - - - - Transfer 3,696 7,390 3,302 2,973
Total general revenues 827,826 927,749 998,779 1,083,031
Business-type activities:Hotel occupancy tax 38,135 46,483 49,641 49,235 Motor vehicle tax 3,422 3,853 4,495 4,471 Alcohol beverage tax 6,537 7,091 7,569 7,856 Other taxes - - - - Investment Income 13,081 23,154 39,970 27,720 Miscellaneous 7,507 3,795 7,014 1,295 Transfer (3,696) (7,390) (3,302) (2,973) Special item - (28,410) - -
Total business-type activities 64,986 48,576 105,387 87,604
Change in Net PositionGovernmental Activities 84,959 47,305 32,590 14,267 Business -type activities 76,519 119,708 122,462 110,599
Total primary government 161,478$ 167,013$ 155,052$ 124,866$
*Source: Comprehensive Annual Financial Report for the respective years unless restated, which is from the subsequent year's Comprehensive Annual Financial Report, Management Discussion and Analysis
CITY OF DALLAS, TEXASCHANGE IN NET POSITION
Last Ten Fiscal Years (Unaudited)(accrual basis of accounting)
(in thousands)
134

Table 2
2009 2010 2011 2012 2013 2014
211,380$ 193,144$ 180,347$ 190,927$ 191,643$ 263,147$ 688,891 658,225 640,010 690,906 684,636 684,808 159,930 156,411 175,984 177,005 194,248 192,981 37,590 12,128 23,304 20,689 19,026 16,747 40,749 52,285 59,553 120,640 66,755 62,168 21,001 27,194 26,848 22,999 28,259 35,369
158,040 139,581 128,323 119,466 135,934 142,519 1,270 17,298 7,849 10,230 12,998 10,367
32,384 34,018 32,911 25,640 21,995 24,006 93,412 90,822 105,350 84,824 74,193 75,133
1,444,647 1,381,106 1,380,479 1,463,326 1,429,687 1,507,245
425,165 425,750 431,565 429,313 436,858 429,034 81,926 77,056 80,532 80,412 93,115 90,377 46,808 43,760 63,219 65,526 77,516 91,807 2,976 3,031 3,123 2,390 2,312 2,047
21,638 16,659 16,793 17,579 21,021 23,647 578,513 566,256 595,232 595,220 630,822 636,912
2,023,160 1,947,362 1,975,711 2,058,546 2,060,509 2,144,157
88,636 94,646 100,470 92,813 101,896 100,673 68,455 75,160 59,955 64,196 74,746 59,061 88,010 98,043 103,828 108,354 102,117 102,621 5,946 - 4 - - - 9,968 10,004 10,356 8,113 13,361 13,143 1,707 561 571 911 807 882
17,950 15,182 16,286 16,862 19,503 21,021 868 637 2,557 1,899 3,488 2,234 21 13,197 9,333 1,728 142 146
79,204 104,839 118,369 112,654 77,534 70,935 4,986 342,031 32,267 13,823 39,035 85,718
365,751 754,300 453,996 421,353 432,629 456,434
467,929 467,527 524,281 527,374 551,498 564,546 16,754 19,104 20,640 28,727 27,936 24,207 51,836 59,229 64,456 64,052 70,553 84,426 2,640 2,887 3,008 2,398 1,920 1,908
15,609 18,469 23,107 23,429 26,867 28,208 - - - 606 5,192 5,699
26,195 30,519 33,754 21,734 53,977 16,586 580,963 597,735 669,246 668,320 737,943 725,580 946,714 1,352,035 1,123,242 1,089,673 1,170,572 1,182,014
(1,078,896) (626,806) (926,483) (1,041,973) (997,058) (1,050,811)
2,450 31,479 74,014 73,100 107,121 88,668 (1,076,446) (595,327) (852,469) (968,873) (889,937) (962,143)
662,433 637,304 659,400 649,459 659,693 687,573 208,169 205,933 217,148 231,327 243,697 257,467 124,891 123,721 128,757 129,508 131,009 136,951 10,764 6,739 6,601 6,172 6,937 4,108 35,762 9,045 6,830 6,469 2,526 2,667 27,063 20,531 18,252 17,558 14,448 11,235
- - - - - - 8,289 21,508 15,787 19,402 21,478 32,008
1,077,371 1,024,781 1,052,775 1,059,895 1,079,788 1,132,009
41,969 42,114 44,969 40,047 45,182 50,374 4,171 4,373 3,470 - - - 7,533 7,398 7,656 6,728 7,648 10,256
- - - - - 20,909 4,097 4,439 3,626 1,964 2,416 1,141 1,057 887 866 908 208
(8,289) (21,508) (15,787) (19,402) (21,478) (32,008) - - - (13,664) (22,066) (6,372)
67,434 37,531 45,634 18,201 12,158 24,874
(1,525) 397,975 126,292 17,922 82,730 81,198 69,884 69,010 119,648 91,301 119,279 113,542 68,359$ 466,985$ 245,940$ 109,223$ 202,009$ 194,740$
135

2005 2006 2007 2008
General FundNonspendable 5,028$ 5,186$ 6,020$ 7,904$ Restricted 15,869 15,869 19,902 19,692 Committed 3,006 3,006 2,660 2,459 Assigned 17,778 30,870 42,262 25,036 Unassigned 59,336 78,470 62,858 63,247
Total general fund 101,017 133,401 133,702 118,338 All Other Governmental Funds
Nonspendable 15,602 15,768 15,477 12,504 Restricted 482,349 555,024 781,779 882,170 Committed 7,907 9,978 11,208 14,915
Total all other governmental funds 505,858 580,770 808,464 909,589
Total all governmental funds 606,875$ 714,171$ 942,166$ 1,027,927$
Source: Comprehensive Annual Financial Report for the respective years unless restated,which is from the subsequent years' Comprehensive Annual Financial Report,Notes to the financial statements
CITY OF DALLAS, TEXASFUND BALANCES, GOVERNMENTAL FUNDS
Last Ten Fiscal Years (Unaudited)(modified accrual basis of accounting)
(in thousands)
136

Table 3
2009 2010 2011 2012 2013 2014
9,612$ 9,034$ 8,515$ 9,289$ 9,324$ 10,044$ 4,253 2,599 7,431 11,431 8,506 11,236 2,233 1,988 1,740 1,490 1,250 1,250
18,111 19,201 20,446 25,621 17,086 28,905 69,789 59,150 83,289 101,205 120,839 129,239
103,998 91,972 121,421 149,036 157,005 180,674
12,054 12,538 11,974 13,116 13,647 13,885 893,870 793,287 668,328 521,775 546,308 367,619 15,544 13,994 10,748 11,540 14,406 14,541
921,468 819,819 691,050 546,431 574,361 396,045
1,025,466$ 911,791$ 812,471$ 695,467$ 731,366$ 576,719$
137

2005 2006 2007 2008REVENUES:
Ad valorem taxes 483,838$ 522,486$ 551,476$ 619,207$ Tax increment financing, intergovernmental 4,261 4,159 5,714 8,857 Sales taxes 198,441 217,836 224,078 231,108 Franchise fees 113,669 123,225 118,745 127,551 Licenses and permits 2,911 2,757 3,028 3,696 Intergovernmental 69,294 69,340 73,953 76,779 Service to others 156,437 198,806 213,951 196,787 Fines and forfeitures 31,535 36,445 51,378 37,876 Investment income 20,857 35,949 60,659 46,440 Contributions and gifts 3,237 8,654 3,610 13,526 Confiscated money awards 1,569 2,807 2,788 2,924 Other 55,068 24,904 17,970 17,596
Total revenues 1,141,117 1,247,368 1,327,350 1,382,347
EXPENDITURES:Current:
General government 142,182 159,627 159,819 158,125 Public safety 508,518 513,366 575,215 611,754 Streets, lighting, sanitation and code 120,467 143,183 152,178 158,997 Environmental and health services 25,467 25,277 27,938 34,057 Public works and transportation 14,600 13,047 21,928 18,766 Equipment and building services 28,628 29,506 34,352 23,331 Culture and recreation 102,529 104,884 109,995 124,750 Housing 1,348 1,260 834 1,487 Human services 27,068 58,380 25,797 24,593
Debt Service:Principal 106,130 122,570 123,179 141,780 Interest and fiscal charges 48,271 67,785 64,495 83,410 Payment to refunded bond escrow agent
Capital outlay 189,473 151,337 199,146 331,020 Administration:Disbursement to employee retirement fund 396,939 - - -
Total expenditures 1,711,620 1,390,222 1,494,876 1,712,070
Excess(deficiency) of revenuesover expenditures (570,503) (142,854) (167,526) (329,723)
OTHER FINANCING SOURCES(USES):Long-term debt issued 497,884 218,310 368,431 387,034 Capital Contribution - 9,514 - - Proceeds from sale of capital assets 9,041 4,188 9,509 9,240 Payment to refunded bond escrow (167,600) - - (74,151) Premium on bonds issued 126,572 7,389 13,690 17,496 Refunding bonds issued 156,850 - - 70,610 Transfers in 44,909 59,928 57,083 37,017 Transfers out (41,102) (49,179) (53,192) (31,762)
Total Other Financing Sources(Uses) 626,554 250,150 395,521 415,484 Net change in fund balance 56,051$ 107,296$ 227,995$ 85,761$
Debt service as a percentage of noncapital expenditures 10.10% 15.32% 14.53% 16.31%
(1) The capital expenditures can be obtained from the Reconciliation of Revenues, Expenditures, and Changein Fund Balances of Governmental Funds to the Statement of Activities. *Source: Comprehensive Annual Financial Report for the respective years unless restated, which is from thesubsequent years' Comprehensive Annual Financial Report, Notes to the financial statements.
(in thousands)
CITY OF DALLAS, TEXASCHANGES IN FUND BALANCES
GOVERNMENTAL FUNDSLast Ten Fiscal Years (Unaudited)
(modified accrual basis of accounting)
138

Table 4
2009 2010 2011 2012 2013 2014
658,195$ 643,517$ 659,793$ 650,701$ 660,496$ 687,891$ - 6,739 6,601 6,172 6,937 4,108
208,169 205,933 217,148 231,327 243,697 257,467 124,891 123,721 128,757 129,508 131,009 136,951
3,569 5,349 5,798 6,185 6,271 6,232 94,954 114,928 128,400 118,042 102,879 99,326
215,197 230,373 232,350 224,869 236,911 255,997 37,774 41,364 38,781 36,336 35,525 34,079 34,996 8,962 6,664 6,350 2,454 2,542
6,988 5,824 22,236 8,555 19,367 32,057 2,101 3,758 1,784 2,883 2,253 3,493 8,468 4,676 5,705 4,764 3,215 7,671
1,395,302 1,395,144 1,454,017 1,425,692 1,451,014 1,527,814
178,832 177,777 162,471 170,268 172,910 227,195 629,199 640,205 622,299 623,260 643,510 656,941 149,060 149,969 159,052 157,829 165,875 175,853
37,639 20,009 23,419 20,623 18,629 16,662 15,452 13,803 15,681 20,336 28,548 19,467 12,280 21,260 19,827 17,406 21,290 25,648
124,073 107,140 105,253 101,776 110,676 120,198 1,303 8,257 7,249 8,327 9,499 10,290
28,991 32,819 33,035 26,677 22,747 20,741
150,909 202,748 152,193 154,600 147,293 147,177 96,037 89,580 99,080 88,608 78,611 79,256
3,204 - 279,211 230,864 207,362 237,055 240,196 265,262
- - - - - - 1,702,986 1,694,431 1,606,921 1,626,765 1,662,988 1,764,690
(307,684) (299,287) (152,904) (201,073) (211,974) (236,876)
250,838 303,686 159,816 47,888 517,671 41,616 - - - - - -
33,762 5,943 10,662 8,157 17,427 2,238 - (182,181) (217,974) - (380,859) -
7,945 32,032 21,613 3,261 69,304 - - - 58,019 - - -
85,603 72,376 42,946 48,093 38,508 57,022 (72,925) (46,244) (21,498) (23,330) (14,178) (18,647) 305,223 185,612 53,584 84,069 247,873 82,229
(2,461)$ (113,675)$ (99,320)$ (117,004)$ 35,899$ (154,647)$
17.34% 19.97% 17.95% 17.50% 15.88% 15.10%
139

Table 5
Less Personal Tax-Exempt Total
Real Property Property Property Total DirectAssessed Assessed Assessed Taxable Tax
Fiscal Year Value (1) (2) Value (2) Value (2) Value (4) Rate (3)
2005 74,052,678$ 11,610,480$ (18,083,280)$ 67,579,878$ 0.7197
2006 78,365,314 11,589,415 (19,110,927) 70,843,802 0.7417
2007 84,505,792 11,694,227 (20,075,828) 76,124,191 0.7292
2008 91,914,767 14,177,424 (21,565,257) 84,526,934 0.7479
2009 100,983,132 14,859,528 (25,364,727) 90,477,933 0.7479
2010 97,533,425 15,055,400 (25,324,730) 87,264,095 0.7479
2011 94,008,753 13,706,221 (24,289,495) 83,425,479 0.7970
2012 92,312,007 13,741,870 (24,060,131) 81,993,746 0.7970
2013 94,522,089 14,203,657 (25,044,024) 83,681,722 0.7970
2014 98,764,424 14,903,530 (26,416,432) 87,251,522 0.7970
Notes:
(1) Assessed value is 100% of estimated market value for all years as determined by the Dallas, Collin, Denton, Rockwall Central Appraisal District. (2) Values for each fiscal year reflect the tax rolls of the previous year (i.e., 2005 fiscal year reflects 2004 tax roll). See Note 1 in the Notes to the Financial Statements for more information.
(3) Per $100 of valuation.
(4) Exemptions are granted by the City within the constraints of Texas Constitutional law SC 5.
Source: Dallas Central Appraisal District
(in thousands)
CITY OF DALLAS, TEXASASSESSED VALUE AND ESTIMATED ACTUAL VALUE
OF TAXABLE PROPERTYLast Ten Fiscal Years (Unaudited)
140

Table 6
2005 2006 2007 2008 2009 2010 2011 2012 2013 2014
General Fund 0.5483$ 0.5445$ 0.5448$ 0.5196$ 0.5230$ 0.4918$ 0.5324$ 0.5379$ 0.5439$ 0.5601$
Debt Service Fund 0.1714 0.1972 0.1844 0.2283 0.2249 0.2561 0.2646 0.2591 0.2531 0.2369
Total City Tax Rate 0.7197$ 0.7417$ 0.7292$ 0.7479$ 0.7479$ 0.7479$ 0.7970$ 0.7970$ 0.7970$ 0.7970$
Source: Dallas Central Appraisal District
(in thousands)
CITY OF DALLAS, TEXASCITY TAX RATE DISTRIBUTIONLast Ten Fiscal Years (Unaudited)
(Per $100 of Assessed Value)
141

Table 7
DallasGeneral County Dallas Dallas Dallas
Operating Obligation Community Independent County County TotalGeneral Debt Dallas College School School Hospital Ad valorem
Fiscal Year Rates Service County District District Equalization District Rate
2005 0.54830$ 0.17140$ 0.21390$ 0.08030$ 1.66940$ 0.00546$ 0.25400$ 2.93730$
2006 0.54450 0.19720 0.21390 0.08160 1.68836 0.00530 0.25400 2.97956
2007 0.54480 0.18440 0.21390 0.08100 1.50264 0.00503 0.25400 2.78074
2008 0.51960 0.22830 0.22810 0.08040 1.19964 0.00471 0.25400 2.51004
2009 0.52300 0.22490 0.22810 0.08940 1.18340 0.00493 0.25400 2.50280
2010 0.49180 0.25610 0.22810 0.09490 1.27134 0.00521 0.27400 2.61624
2011 0.53240 0.26460 0.24310 0.09923 1.23781 0.01000 0.27100 2.64814
2012 0.53790 0.25910 0.24310 0.09967 1.29035 0.01000 0.27100 2.70112
2013 0.54390 0.25310 0.24310 0.11938 1.29035 0.00994 0.27100 2.72083
2014 0.56010 0.23690 0.24310 0.12470 1.28209 0.01000 0.27600 2.72289
Source: Dallas Central Appraisal District
(1) Overlapping rates are those of local and county governments that apply to property owners within the City of Dallas.
(2) The City's basic property tax rate may be increased only by a majority vote of the City Council up to the limit of the Statelaw, after which the City's residents may petition for a vote. Rates for debt service are set based on each year's requirements.
CITY OF DALLAS, TEXAS
Overlapping Rates (1)
PROPERTY TAX RATES - ALL DIRECT AND OVERLAPPING TAX RATES(PER $100 OF ASSESSED VALUE)Last Ten Fiscal Years (Unaudited)
City Direct Rates (2)
142

Table 8
Collection Within the CollectionsActual Taxes Levied Fiscal Year of the Levy in
Fiscal Levy for the Current tax Percentage Subsequent Total Tax PercentageYear Year Fiscal Year collections of Levy Years Collections of Levy
2005 2004 486,372$ 471,205$ 96.88% 6,235$ 477,440$ 98.16%
2006 2005 525,448 511,018 97.25% 5,351 516,369 98.27%
2007 2006 555,098 539,974 97.28% 6,599 546,573 98.46%
2008 2007 632,177 606,659 95.96% 6,445 613,104 96.98%
2009 2008 676,684 647,697 95.72% 4,413 652,110 96.37%
2010 2009 652,648 631,848 96.81% 5,590 637,438 97.67%
2011 2010 664,901 647,605 97.40% 6,562 654,167 98.39%
2012 2011 653,490 638,999 97.78% 5,561 644,560 98.63%
2013 2012 666,943 650,496 97.53% 4,572 655,068 98.22%
2014 2013 695,395 678,179 97.52% 4,258 682,437 98.14%
Source: Dallas County Tax Assessor/Collector
Total Collections to Date
Last Ten Fiscal Years (Unaudited)PROPERTY TAX LEVIES AND COLLECTIONS
CITY OF DALLAS, TEXAS
(in thousands)
143

Table 9
Percent Percentof Total of Total
Taxable Taxable Taxable TaxableAssessed Assessed Assessed Assessed
Name of Taxpayer Nature of Property Valuation Rank Valuation Valuation Rank Valuation
Oncor Electric/Texas Utilities Electric Utility 743,428$ 1 0.85% 769,623$ 3 1.14%
Crescent Real Estate Real Estate/Developer 648,910 2 0.74% 610,798 4 0.90%
Texas Instruments Electronic Manufacturing 632,182 3 0.72% - - -
AT&T/TCI Cable Telephone Utility 612,339 4 0.70% - - -
Northpark Land Partners Developer 602,355 5 0.69% - - -
Southwest Airlines Air Transportation 591,365 6 0.68% 474,533 5 0.70%
Galleria Mall Investors LP Developer 344,402 7 0.39% 197,474 9 0.29%
PC Village Apartments Dallas LP Developer 338,092 8 0.39% 226,733 7 0.34%
Walmart Retailer 298,563 9 0.34% - - -
Post Properties, Inc. Real Estate/Developer 217,240 10 0.25% 201,207 8 0.30%
YPI Thanksgiving Tower/Central Expy Etal Real Estate/Developer - - - - - -
Metropolitan Life Insurance Company - - - - - -
Raytheon Electronics Manufacturer - - - 1,233,143 1 1.82%
SBC Communications, Inc. Telephone Utility - - - 1,015,224 2 1.50%
Trammell Crow Developer - - - 286,718 6 0.42%
Trizee Properties, Inc Developer - - - 187,318 10 0.28%
5,028,876$ 5.75% 5,202,771$ 7.69%
Source: Dallas County Tax Office
2014 2005
CITY OF DALLAS, TEXASPRINCIPAL PROPERTY TAXPAYERS
Current Year and Nine Years Ago (Unaudited)(in thousands)
144

Table 10
EstimatedEstimated Share of
Debt Percentage OverlappingGovernmental Unit Outstanding Applicable (1) Debt
Direct Debt:City of Dallas
Debt repaid with property taxesGeneral Obligation Bonds 1,318,947$ 1,318,947$ Certificates of Obligation 24,250 24,250 Equipment Acquisition Notes 4,685 4,685 Pension Obligation Bonds 404,248 404,248
Other DebtCapital Leases Payable 26,991 26,991 Long-term Notes Payable 32,402 32,402
Subtotal, direct debt 1,811,523 100.00 % 1,811,523
Overlapping Debt:Carrollton-Farmers Branch ISD 304,535 6.77 % 20,617 Collin County 391,410 4.97 % 19,453 Collin County Community College District 34,595 4.97 % 1,719 Coppell Independent School District 218,772 0.47 % 1,028 Dallas County 111,350 49.81 % 55,463 Dallas County Community College District 339,035 49.81 % 168,873 Dallas County Hospital District 736,235 49.81 % 366,719 Dallas Independent School District 2,557,940 88.16 % 2,255,080 Denton County 614,975 1.65 % 10,147 Duncanville Independent School District 144,385 43.48 % 62,779 Garland Independent School District 346,746 2.28 % 7,906 Grand Prairie Independent School District 462,964 3.99 % 18,472 Highland Park Independent School District 94,515 8.54 % 8,072 Irving Independent School District 516,551 2.45 % 12,656 Lancaster Independent School District 97,500 2.72 % 2,652 Mesquite Independent School District 365,116 1.26 % 4,601 Plano Independent School District 922,505 11.38 % 104,981 Richardson Independent School District 429,805 57.97 % 249,158
Subtotal, overlapping debt 8,688,934$ 3,370,376$
City Of Dallas (direct debt) 1,811,523 100.00 % 1,811,523
Total direct and overlapping debt 10,500,457$ 5,181,899$
Ratio of Direct and Estimated Share of Overlapping Tax Debt 6.19% to Taxable Assessed ValuationPer Capita Direct and Overlapping Tax Debt (not in thousands) 4,291
(1) Total general obligation (G.O.) bonded debt shown for the City of Dallas excludes self- supporting Water and Sewer G.O., and amount available for repayment in the Debt Service fund.
Note: Overlapping governments are those that coincide, at least in part, with the geographicboundaries of the City. This schedule estimates the portion of the outstanding debt of those overlapping governments that is borne by the residents and businesses of the City. This process recognizes that, when considering the City's ability to issue and repay long-term debt, the entire debt burden borne by the residents and businesses shouldbe taken into account.
(1)The percentage of overlapping debt applicable is estimated using taxable assessed property values. Applicable percentages were estimated by determining the portion of another governmental unit's taxable assessed value that is within the City's boundaries and dividing it by each unit's total taxable assessed value. Debt outstanding data was obtained from each governmental unit.
DIRECT AND OVERLAPPING GOVERNMENTAL ACTIVITIES DEBTYear Ended September 30, 2014 (Unaudited)
CITY OF DALLAS, TEXAS
(in thousands)
145
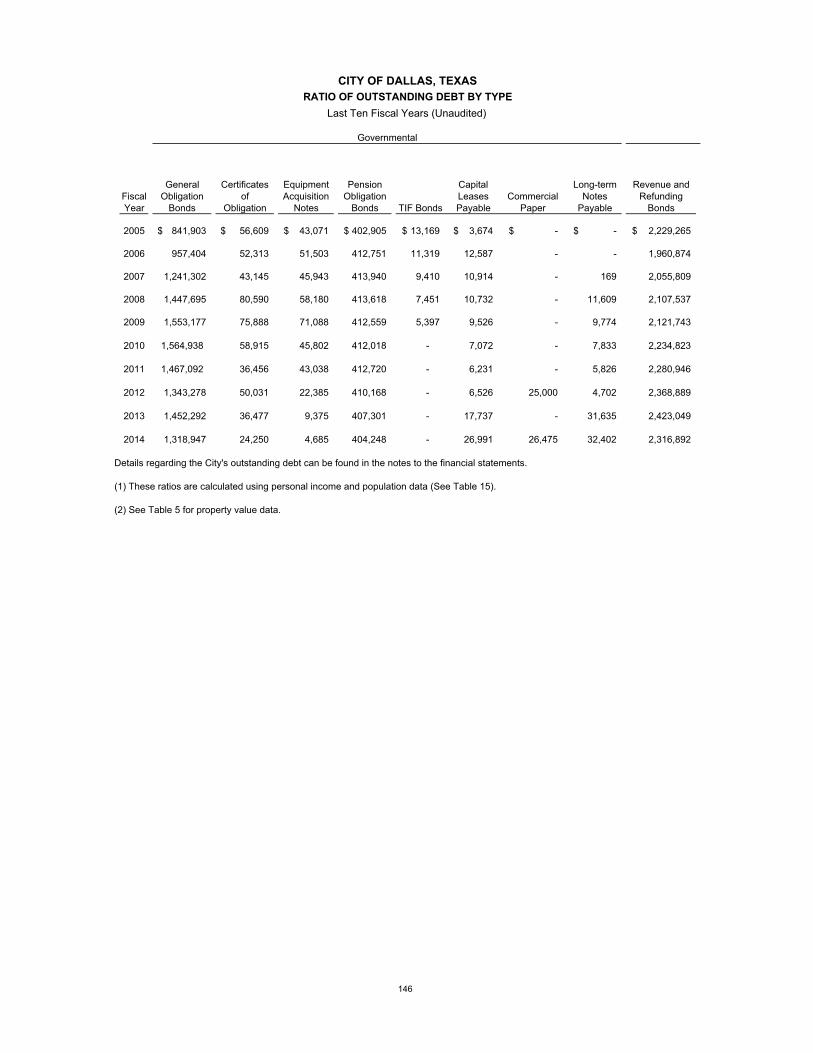
General Certificates Equipment Pension Capital Long-term Revenue andFiscal Obligation of Acquisition Obligation Leases Commercial Notes RefundingYear Bonds Obligation Notes Bonds TIF Bonds Payable Paper Payable Bonds
2005 841,903$ 56,609$ 43,071$ 402,905$ 13,169$ 3,674$ -$ -$ 2,229,265$
2006 957,404 52,313 51,503 412,751 11,319 12,587 - - 1,960,874
2007 1,241,302 43,145 45,943 413,940 9,410 10,914 - 169 2,055,809
2008 1,447,695 80,590 58,180 413,618 7,451 10,732 - 11,609 2,107,537
2009 1,553,177 75,888 71,088 412,559 5,397 9,526 - 9,774 2,121,743
2010 1,564,938 58,915 45,802 412,018 - 7,072 - 7,833 2,234,823
2011 1,467,092 36,456 43,038 412,720 - 6,231 - 5,826 2,280,946
2012 1,343,278 50,031 22,385 410,168 - 6,526 25,000 4,702 2,368,889
2013 1,452,292 36,477 9,375 407,301 - 17,737 - 31,635 2,423,049
2014 1,318,947 24,250 4,685 404,248 - 26,991 26,475 32,402 2,316,892
Details regarding the City's outstanding debt can be found in the notes to the financial statements.
(1) These ratios are calculated using personal income and population data (See Table 15).
(2) See Table 5 for property value data.
Last Ten Fiscal Years (Unaudited)
Governmental
CITY OF DALLAS, TEXASRATIO OF OUTSTANDING DEBT BY TYPE
146

Table 11
Percentage of Estimated
Pension Long-term Total Percentage Total ActualObligation Commercial Notes Primary of Personal Per Bonded Property Per
Bonds Paper Payable Government Income (1) Capita (1) Debt Value (2) Capita.
101,034$ 197,526$ -$ 3,691,630$ 0.01% 2,996$ 1,445,522$ 2.14% 1,173$
137,009 160,538 - 3,595,760 0.01% 2,854 1,610,980 2.27% 1,279
140,195 179,698 - 3,960,827 0.01% 3,094 1,884,525 2.48% 1,472
140,087 67,242 15,733 4,293,232 0.01% 3,357 2,140,170 2.53% 1,672
139,729 169,983 14,535 4,413,416 0.01% 3,379 2,252,441 2.49% 1,725
139,545 58,000 12,539 4,483,485 0.01% 3,407 2,221,218 2.55% 1,688
139,323 36,860 10,760 4,402,392 0.01% 3,669 2,098,629 2.52% 1,747
138,642 - 8,985 4,378,606 0.01% 3,628 1,964,504 2.40% 1,636
137,815 - 6,867 4,522,548 0.01% 3,670 2,043,260 2.44% 1,701
136,868 122,840 4,708 4,296,466 0.01% 3,560 1,888,998 2.17% 1,573
Business-Type
147

2005 2006 2007 2008
Total Assessed Valuation $67,579,878 $70,843,802 $76,124,191 $84,526,934
Overall debt limitation - 10% of assessed valuation 6,757,988 7,084,380 7,612,419 8,452,693
Net Debt Subject to Limitation 1,445,522 1,610,980 1,884,525 2,140,170
Legal debt margin within 10% limitation (1) $5,312,466 $5,473,400 $5,727,894 $6,312,523
Legal Debt Margin as a Percentage of the Debt Limit 78.6% 77.3% 75.2% 74.7%
Notes:
(1) Chapter XXI, Section 3 of the City of Dallas Charter states, "The maximum bonded indebtedness of the City outstanding at any one time, and payable from taxation, shall not exceed 10% of the total assessed valuation of property shown by the last assessment roll of the City."
CITY OF DALLAS, TEXASLEGAL DEBT MARGIN
Last Ten Fiscal Years (Unaudited)(in thousands)
148

Table 12
2009 2010 2011 2012 2013 2014
$90,477,933 $87,264,095 $83,425,479 $81,993,746 $83,681,722 $87,251,522
9,047,793 8,726,410 8,342,548 8,199,375 8,368,172 8,725,152
2,252,441 2,221,218 2,098,629 1,964,504 2,043,260 1,811,523
$6,795,352 $6,505,192 $6,243,919 $6,234,871 $6,324,912 $6,913,629
75.1% 74.5% 74.8% 76.0% 75.6% 79.2%
149

Table 13
RevenueFiscal Gross Net BondYear Revenue Expense (1) Revenue Principal Interest Total Coverage (3)
2005 373,213$ 193,218$ 179,995$ 71,200$ 59,235$ 130,435$ 1.38
2006 444,634 213,646 230,988 76,825 71,700 148,525 1.56
2007 427,887 204,221 223,666 83,265 76,550 159,815 1.40
2008 462,424 206,213 256,211 91,215 77,606 168,821 1.52
2009 490,729 245,846 244,883 95,330 75,940 171,270 1.43
2010 478,512 240,117 238,395 96,115 73,987 170,102 1.40
2011 508,040 228,844 279,196 96,115 80,444 176,559 1.58
2012 535,289 235,821 299,468 96,115 77,250 173,365 1.73
2013 554,686 233,177 321,509 89,510 84,269 173,779 1.85
2014 569,822 246,141 323,681 94,545 84,134 178,679 1.81
Notes:
(1) Operating expenses do not include depreciation or any PILOT payments or similar payments that are not considered expenses of the operation and maintenance of the Water and Wastewater System.
Operating expenses includes payments for the Water Transmission Facilities Financing Agreement in, as explained in note 10.R. Per Texas Government Code, Section 1502.056(c), "a contract between a municipalityand an issuer, as defined by Section 1201.002, under which the municipality obtains from the issuer the municipalitymay provide or the issuer provides part or all of the facilities or services of a utility system to that payments madeby the municipality from the revenue of the utility system are an operating expense of the municipality's utility system."
(2) Includes principal and interest of revenue bonds only. It does not include the general obligation bonds reported in the enterprise fund.
(3) Revenue bond coverage is equal to net revenue available for debt service divided by total principal and interest.
Net Revenue Available for Debt Service Debt Service Requirements (2)
CITY OF DALLAS, TEXASSCHEDULE OF REVENUE BOND COVERAGE
DALLAS WATER UTILITIESLast Ten Fiscal Years (Unaudited)
(in thousands)
150

Table 14
RevenueFiscal Gross Net BondYear Revenue Expenditures (1) Revenue Principal Interest Total Coverage (2)
2005 70,706$ 62,071$ 8,635$ 8,805$ 14,889$ 23,694$ 0.4
2006 84,945 62,081 22,864 10,685 14,361 25,046 0.9
2007 89,327 44,971 44,356 14,265 20,096 34,361 1.3
2008 87,068 40,212 46,856 15,820 18,543 34,363 1.4
2009 73,871 40,170 33,701 1,725 18,696 20,421 1.7
2010 73,783 38,196 35,587 1,730 17,791 19,521 1.8
2011 77,332 38,354 38,978 2,205 16,487 18,692 2.1
2012 75,947 44,975 30,972 2,775 16,421 19,196 1.6
2013 85,820 52,850 32,970 3,675 16,282 19,957 1.7
2014 90,356 54,606 35,750 4,640 16,098 20,738 1.7
(1) Convention Center Revenue bond covenants require only Convention Center expenses beconsidered when calculating bond coverage.
(2) Revenue bond coverage is equal to net revenue available for debt service divided by total principal and interest.
Net Revenue Available for Debt Service Debt Service Requirements
CITY OF DALLAS, TEXASSCHEDULE OF REVENUE BOND COVERAGE
CONVENTION CENTER FUNDLast Ten Fiscal Years (Unaudited)
(in thousands)
151

Table 15
Per Capita Median AssessedFiscal Personal Household Median Valuation Labor UnemploymentYear Population (1) Personal Income Income Income Age (in thousands) Force Unemployment (2) Rate (2)
2005 1,232,100 30,158,111,700 24,477 36,403 31.90 67,579,878 612,754 36,765 6.0 %
2006 1,260,950 29,173,772,850 23,136 37,264 31.25 70,843,802 624,861 33,742 5.4 %
2007 1,280,500 31,616,825,500 (3) 24,691 (3) 38,276 (3) 31.90 (3) 76,124,191 612,088 28,768 4.7 %
2008 1,279,910 33,154,788,640 25,904 42,670 32.10 84,526,934 606,506 29,719 4.9 %
2009 1,306,350 33,048,042,300 (4) 25,298 (4) 40,473 (4) 32.00 (4) 90,477,933 592,403 43,838 7.4 %
2010 1,316,350 34,473,231,975 (6) 26,189 (5) 39,813 (5) 31.75 (5) 87,264,095 605,307 52,662 8.7 %
2011 1,200,530 (7) 30,042,062,720 (8) 25,024 (8) 42,911 (8) 31.60 (8) 83,425,479 (9) 607,860 52,884 8.7 %
2012 1,207,420 (7) 30,842,940,190 (10) 25,545 (10) 43,804 (10) 31.65 (10) 81,993,746 (10) 580,975 44,955 7.7 %
2013 1,232,243 (7) 30,868,803,800 (12) 26,164 (11) 41,318 (11) 32.00 (11) 83,681,722 (9) 591,278 39,966 6.8 %
2014 1,281,047 (7) 33,615,083,720 (12) 26,240 (11) 41,666 (11) 32.25 (11) 87,251,522 (10) 596,473 34,977 5.9 %
(1) North Central Texas Council of Governments estimate
(2) U.S. Bureau of Labor Statistics
(3) The 2007 Personal Income, Per Capita Personal Income, Median Household Income, and Median Age is an average of 2005 and 2006 U.S Census Bureau.
(4) The 2009 Personal Income, Per Capita Personal Income, Median Household Income, and Median Age is an average of 2007 and 2008 U.S Census Bureau.
(5) The 2010 Personal Income, Per Capita Personal Income, Median Household Income, and Median Age is an average of 2008 and 2009 U.S Census Bureau, American Community Survey.
(6) The 2010 North Central Texas Council of Governments estimate difference from the 2010 Census value.
(7) The 2011 North Central Texas Council of Governments estimate in based on 2010 Census and is NOT a continuation of previous 2001-2009 estimates. 2014 data obtained from United States Census Bureau.
(8) The 2011 Personal Income, Per Capita Personal Income, Median Household Income, and Median Age is an average of 2009 and 2010 U.S Census Bureau, American Community Survey.
(9) Consolidated Appraisal Value from Budget Office
(10) The 2012 Personal Income, Per Capita Personal Income, and Median Age is an average of 2011 and 2010 U.S Census Bureau, American Community Survey.
(11) The 2013 Per Capita Personal Income, and Median Age is an average of 2011 and 2012 U.S Census Bureau, American Community Survey.
(12) Aggregate household income in the past 12 months (in 2012 inflation-adjusted dollars)Census Bureau, American Community Survey.
CITY OF DALLAS, TEXASDEMOGRAPHIC STATISTICS AND ECONOMIC STATISTICS
Last Ten Fiscal Years (Unaudited)
152

Table 16
Percentage Percentageof Total of Total
Name of Employers Employees Rank Employment Employees Rank Employment
Dallas Independent School District* 20,793 1 0.63% 19,813 1 2.60%
UT Southwestern Medical Center 13,800 2 0.42% 5,900 8 0.77%
City of Dallas 13,000 3 0.39% 12,146 3 1.59%
Texas Instruments 10,885 4 0.33% 10,300 4 1.35%
Baylor University Medical Center 9,610 5 0.29% 6,412 6 0.84%
AT&T 8,100 6 0.25% 14,000 2 1.83%
Presbyterian Hospital of Dallas 7,456 7 0.23% 3,459 14 0.45%
Dallas County* 6,500 8 0.20% 5,286 10 0.69%
ClubCorp USA Inc. 5,902 9 0.18% 2,323 27 0.30%
Wal-Mart Stores 4,600 10 0.14% - - 0.00%
Southwest Airlines 4,509 11 0.14% 5,675 9 0.74%
Children's Medical Center of Dallas 4,474 12 0.14% 3,537 13 0.46%
VA North Texas Health Care System 4,237 13 0.13% 2,700 21 0.35%
Dallas Area Rapid Transit* 3,600 14 0.11% 3,236 17 0.42%
Air Liquide Electronics US LP 3,476 15 0.11% - - 0.00%
Dallas County Community College District* 3,199 16 0.10% 2,695 22 0.35%
Army & Air Force Exchange Service 2,386 17 0.07% 2,400 26 0.31%
Methodist Dallas Medical Center 2,300 18 0.07% 3,239 16 0.42%
128,827 3.93% 103,121 13.47%
* Include employees in all of DFW - payroll employment
(1)Dallas Business Journal Book of Lists 2012, 2003. Estimates for total employment based on census data
(2) Greater Dallas Chamber, 2005 Dallas Economic Development Guide, 2005
2014 2005
CITY OF DALLAS, TEXASPRINCIPAL EMPLOYERS
Current Year and Nine Years Ago (Unaudited)
153

Function/Program 2005 2006 2007 2008
Public SafetyPolice Stations 6 6 7 8 Fire Stations 55 55 55 56
Public WorksStreets - Paved (miles) 3,525 3,519 3,511 3,519 Lane miles 11,604 11,595 11,580 11,607 Traffic signals 1,286 1,295 1,296 1,298 Street Lights 83,760 85,255 85,693 86,500
Parks and RecreationParks 379 374 374 376 Parks Acres 17,493 18,619 23,018 23,040 Miles of trails (jogging, hiking & biking) 91 86 90 99 Number of lakes 18 18 18 18 Swimming pools 27 27 27 22 Spraygrounds "Water-enhanced playground" N/A 7 7 8 Athletic fields (soccer, football, baseball & rugby) 260 279 277 277 Tennis centers 5 5 5 5 Number of tennis courts 87 81 81 81 Neighborhood Tennis Courts 171 177 177 177 Multi-use courts 153 154 154 154 Golf courses (18 holes) 6 6 6 6 Recreation centers (community) 47 47 47 47
WaterWater mains (miles) 4,739 4,781 4,840 4,862 Fire Hydrants 27,076 27,210 27,222 27,969 WastewaterMiles of sanitary sewers 4,130 4,178 4,831 4,831 Miles of storm sewers N/A 1,755 1,755 1,744
Source: City capital asset records
Note: N/A - Information not available
CITY OF DALLAS, TEXASCAPITAL ASSET STATISTICS BY FUNCTION/PROGRAM
Last ten fiscal years (Unaudited)
154

TABLE 17
2009 2010 2011 2012 2013 2014
8 8 8 8 8 8 56 56 56 56 57 57
3,585 3,541 4,020 4,028 4,031 4,033 11,633 11,672 11,804 11,676 11,701 11,771
1,315 1,329 1,328 1,333 1,342 1,348 86,902 86,514 86,321 86,406 87,263 87,355
376 368 371 378 374 381 23,042 23,080 23,080 23,164 23,331 22,842
99 107 107 125 130 130 18 18 18 18 18 13 22 22 22 22 20 18
8 8 8 8 10 10 277 278 278 278 272 272
5 5 5 5 5 5 81 81 81 81 81 81
177 171 171 171 177 177 154 154 154 154 156 156
6 6 6 6 6 6 43 43 43 43 43 43
4,980 5,024 5,166 4,915 4,922 4,922 28,373 27,800 27,800 29,028 29,243 29,626
4,267 4,293 4,364 4,020 4,017 4,017 1,749 1,768 1,788 1,790 1,791 1,791
155

Function/Program 2005 2006 2007 2008
Public SafetyPolice
Calls for Service 1,006,723 958,110 872,162 728,404
FireCalls for Service - Fire 114,341 120,680 116,813 120,203 Calls for Service - EMS 162,232 166,067 170,352 172,278
RecreationNumber of Users 5,624,941 6,069,690 7,759,756 6,688,450
Building PermitsPermits issued 35,289 32,323 30,563 31,160 Estimated Value 2,634,495,534$ 3,109,299,698$ 3,035,761,645$ 2,895,410,156$
AirportAirport Operations 234,615 248,805 242,914 231,656 (Takeoffs and Landings)
Utilities (millions of gallons)Water Usage - Peak 621 681 575 670 Water Usage - Average 417 467 388 416
Source: Department annual records
CITY OF DALLAS, TEXASOPERATING INDICATORS BY FUNCTION/PROGRAM
Last Ten Fiscal Years (Unaudited)
156

Table 18
2009 2010 2011 2012 2013 2014
690,768 596,742 632,365 589,865 591,997 590,443
117,721 115,462 145,298 59,784 46,127 42,346 163,100 166,585 173,666 172,032 193,820 195,802
5,585,730 5,987,922 5,678,882 5,394,938 350,091 n/a
28,408 26,997 34,786 43,064 38,478 36,044 1,841,471,331$ 1,843,819,294$ 3,083,719,959$ 2,310,325,994$ 2,652,432,543$ $3,305,921,947
176,977 168,373 178,054 177,067 178,232 176,889
626 638 683 649 583 535 406 388 428 395 391 369
157

Table 19
Function/Program 2005 2006 2007 2008 2009 2010 2011 2012 2013 2014General Government
City Manager's Office 28 50 49 45 39 45 30 20 14 15 City Attorney 141 146 156 170 156 120 116 122 144 144 City Auditor 29 34 36 36 36 31 28 20 19 22 City Controller's Office N/A N/A N/A N/A N/A 42 42 44 42 42 City Secretary 17 19 24 21 20 16 14 14 15 14 Code Compliance 333 334 345 361 410 461 408 401 388 397 Communication & Info. Svcs. 196 168 160 186 196 197 164 168 173 170 Economic Development 29 44 47 50 47 41 40 40 41 41 Environment & Health Service 435 435 432 435 438 - - - - Environmental Quality 11 11 19 21 22 - - - - Equipment & Bldg. Services 421 403 413 433 413 384 360 381 435 461 Financial Services 117 109 156 242 236 26 28 30 39 39 Human Resources 72 81 163 164 79 54 50 40 41 47 Housing 69 74 76 71 72 428 412 391 364 357 Cultural Affairs 86 85 98 98 65 46 47 56 64 61 Emergency Management 7 6 7 5 6 - - - - Municipal Court-Judiciary 51 48 51 43 31 40 37 32 34 33 Courts & Detention Services 181 180 185 182 175 170 155 161 151 145 Purchasing/Bus. Diversity 46 48 48 46 47 42 40 39 39 41 Library 478 485 488 511 487 360 278 259 264 266
Management Services - - - - - 145 137 164 160 164 Subtotal 2,747 2,760 2,953 3,120 2,975 2,648 2,386 2,382 2,427 2,459
Public SafetyPolice-Uniform 2,960 3,011 3,155 3,369 3,455 3,662 3,510 3,470 3,463 3,524
Police-Civilian 934 932 987 980 712 582 550 541 557 540 Fire-Uniform 1,653 1,687 1,648 1,693 1,768 1,776 1,738 1,874 1,870 1,867
Fire-Civilian 259 265 253 199 95 84 84 85 82 92 Subtotal 5,806 5,895 6,043 6,241 6,030 6,104 5,882 5,970 5,972 6,023
Development Services 258 271 279 294 292 198 197 224 237 264
Public Works Public Works & Transportation 367 391 428 469 448 305 272 140 143 144 Sanitation 475 470 493 517 503 456 451 458 460 472 Streets Services 532 520 583 522 514 371 400 496 485 491
Trinity Watershed Management - - - - - 141 147 172 170 193 Subtotal 1,374 1,381 1,504 1,508 1,465 1,273 1,270 1,266 1,258 1,300
Parks and Recreation 1,254 1,312 1,477 1,319 955 634 594 581 598 614
Water Utilities 1,438 1,416 1,403 1,455 1,459 1,425 1,369 1,406 1,440 1,432
Convention & Events Services 113 108 109 110 102 101 83 80 71 74
Aviation 151 146 154 165 174 180 170 178 196 187
OtherMayor & Council 30 30 30 36 35 36 35 37 37 36 Employee Retirement 15 18 20 19 19 20 20 21 22 19 Civil Services 22 21 21 23 21 14 13 15 18 20 Risk Management - - - - - - - 23 24 24 Police & Fire Pension 4 1 1 1 1 1 - - - -
Subtotal 71 70 72 79 76 71 68 96 101 99
Total 13,212 13,359 13,994 14,291 13,528 12,634 12,019 12,183 12,300 12,452
Source: City HR Records
CITY OF DALLAS, TEXASFULL-TIME EQUIVALENT CITY GOVERNMENT EMPLOYEES
BY FUNCTION/PROGRAMLast Ten Fiscal Years (Unaudited)
158

[THIS PAGE INTENTIONALLY LEFT BLANK]

APPENDIX D
SUMMARY OF CERTAIN PROVISIONS OF THE INDENTURE

[THIS PAGE INTENTIONALLY LEFT BLANK]

SUMMARY OF CERTAIN PROVISIONS OF THE INDENTURE
Definitions
Unless otherwise expressly provided or unless the context clearly requires otherwise, the following termsshall have the respective meanings specified below or in the Bond Resolutions for all purposes of the Indenture:
"Accounting Principles" shall mean the accounting principles described in the notes to the Audit as suchprinciples may be changed from time to time to comply with State laws or regulations.
"Act" shall mean Chapter 431, Texas Transportation Code, as amended.
"Additional Parity Bonds" shall mean the additional parity General Airport Revenue Bonds permitted to beissued by the Corporation pursuant to the Indenture.
"Airport Consultant" shall mean a nationally recognized independent firm, person or corporation having awidely known and favorable reputation for special skill, knowledge and experience in methods of developing,operating and financing airports of approximately the same size as the properties constituting Love Field.
"Airport System" shall mean all airport, heliport and aviation facilities, or any interest therein, now or fromtime to time hereafter owned, operated or controlled by the City. The Airport System currently includes Love Field,Dallas Executive Airport, and the City’s downtown heliport.
"Annual Debt Service" shall mean for any annual period (any Fiscal Year or any other twelve (12)consecutive calendar month period), while Bonds are Outstanding, an amount equal to the sum of (i) all interest onsuch Bonds which is due during such period, plus (ii) that portion of the Principal Installment or Installments of suchBonds which is due during such period, as limited and calculated in the following manner:
(a) Except as modified below, (i) for any twelve (12) consecutive calendar month period otherthan the calendar year, whether or not such period constitutes the Corporation's current Fiscal Year or anyfuture Corporation Fiscal Year, the aggregate amount of interest on and Principal Installment of the Bondswhich was paid or redeemed or is scheduled to accrue and be paid or redeemed during such twelve (12)consecutive month period; and (ii) for any Fiscal Year while the Corporation's Fiscal Year is the same asthe calendar year, the aggregate amount of interest on and Principal Installment of the Bonds which waspaid or redeemed or is scheduled to accrue and be paid or redeemed after a Principal Installment PaymentDate within such Fiscal Year and on or before the next following Principal Installment Payment Date; and
(b) As to any annual period prior to the date of any calculation, such requirements shall becalculated solely on the basis of Bonds which were Outstanding as of the first (1st) day of such period; andas to any future year such requirements shall be calculated solely on the basis of Bonds Outstanding as ofthe date of calculation; and
(c) Notwithstanding the foregoing, all amounts which are deposited to the credit of a debt servicereserve fund from original proceeds from the sale of any Bonds and amounts which have been or areexpected to be realized as interest and investment earnings on amounts on deposit in the Debt Service Fund(other than those amounts which are to be deposited into the Rebate Fund pursuant to the Indenture) andwhich are used or scheduled to be used to pay interest on or Principal Installments of Bonds during anyannual period, shall be deemed to reduce the Annual Debt Service for any such annual period to the extentof such deposits; and the amount of such deposits shall be excluded from and shall not constitute AnnualDebt Service for any such annual period.
"Authorized Representative" shall mean the President, the Vice President or the Treasurer of theCorporation, or any other person designated to perform a specified act, to sign a specified document or to actgenerally on behalf of the Corporation by a written instrument furnished to the Trustee.
"Average Annual Debt Service" shall mean the total Debt Service (as of the date of the calculation) divided
D-1

by the remaining number of years until the final maturity of the Bonds. The Average Annual Debt Servicecalculated under the Indenture shall remain in effect until the next date when such calculation is required under theIndenture. For the purposes of calculating the Average Annual Debt Service, any fractional year shall be included inthe calculation as a full year.
"Aviation Director" shall mean the Director of Aviation of the City, or any successor or person acting inthat capacity.
"Board" shall mean the Board of Directors of the Corporation.
"Bond Counsel" shall mean such nationally recognized firm or firms expert in matters relating to publicfinance law and the federal income tax laws relating to the issuance of municipal bonds engaged by the Corporation.
"Bond Resolutions" shall mean the resolutions from time to time adopted by the Corporation authorizingthe General Airport Revenue Bonds.
"Bonds" or "General Airport Revenue Bonds" shall mean one or more Series of bonds issued by theCorporation pursuant to the Indenture and the Bond Resolutions.
"Business Day" shall mean any day which is not a Saturday, Sunday, a day on which banking institutions inthe city where the Designated Trust Office (as defined in a Bond Resolution) of the Paying Agent/Registrar islocated are authorized by law or executive order to close, or a legal holiday.
"City" shall mean the City of Dallas, Texas.
"Code" shall mean the Internal Revenue Code of 1986, as may be amended from time to time, and theapplicable provisions of any future federal income tax laws.
"Corporation" shall mean the Love Field Airport Modernization Corporation, or its legal successors.
"Costs of Issuance" shall mean all charges, costs and expenses of the Corporation incurred in connectionwith the authorization, issuance, sale and delivery of General Airport Revenue Bonds including, but not limited to,legal fees, financial advisory fees, bond insurance premiums, fiscal or escrow agent fees, printing fees, accountingfees, consultant fees, verification fees, travel expenses, rating agency fees, fees of the Trustee and its counsel andAttorney General fees.
"Debt Service" shall mean the Principal Installments and interest on the Bonds.
"Debt Service Fund" shall mean the fund so designated and created pursuant to the Indenture.
"Eligible Investments" shall mean any investments which the City is permitted to make under the laws ofthe State of Texas, including the Public Funds Investment Act, Chapter 2256, Texas Government Code, as describedin the City's investment policy approved by the City Council.
"Event of Default" shall mean any Event of Default described in the Indenture.
"Exempt Securities" shall mean bonds or other evidences of obligations, the interest on which is exemptfrom federal income taxation under Section 103(a) of the Code.
"Fair Market Value" shall mean as of any particular date:
(a) as to Eligible Investments the bid and asked prices of which are published on a regular basis ina financial journal or publication of general circulation in the United States of America, the bid price forsuch Eligible Investments so published on, or most recently prior to, the date of valuation by the Trustee,or, in the alternative, the bid price for such Eligible Investments as provided by a pricing service selectedby the Trustee, or
D-2

(b) as to Eligible Investments the bid and asked prices of which are not published on a regularbasis in a financial journal or publication of general circulation in the United States of America, the averagebid price on such Eligible Investments at the date of valuation by the Trustee, as reported to the Trustee byany two nationally recognized dealers (in the opinion of the Trustee) in such Eligible Investments.
"Fiscal Year" shall mean the twelve (12) month period commencing on October1 of a calendar year andending September 30 of the next succeeding calendar year, or such other consecutive twelve (12) month period asdetermined by the City.
"Fund" shall mean any one or more, as the case may be, of the separate special Funds created andestablished or required to be maintained pursuant to the Indenture.
"Interest Payment Date", when used in connection with any Bond, shall mean May 1 and November 1, insuch years as shall be determined in accordance with the terms of the Bond Resolution governing the issuance of aSeries of Bonds.
"Love Field" shall mean the general aviation airport owned and operated by the City known as Dallas LoveField.
"Mandatory Redemption Installment" shall mean, as of any particular date of calculation and with respectto any Series of Bonds, the amount of money to be applied to the mandatory redemption (including any mandatoryredemption premium, if any) of Bonds in any Fiscal Year prior to maturity pursuant to the Indenture or any BondResolution, as such Mandatory Redemption Installment shall have been previously reduced by the principal amountof any Bonds of such Series of the maturity with respect to which such Mandatory Redemption Installment ispayable which are purchased or redeemed by the Trustee in accordance with the provisions of the Indenture or ofany Bond Resolution, other than a Mandatory Redemption Installment redemption or purchase.
"Maximum Annual Debt Service" shall mean the greatest amount of the Annual Debt Service calculated forany future Fiscal Year, taking into account any Mandatory Redemption Installments scheduled to be payable on anySeries of Bonds.
"Other Revenues" shall mean any monies, other than Net Revenues deposited to the credit of the PledgedRevenue Fund that are pledged as a Pledged Revenue, including, without limitation, monies received from the Cityto restore an deficiency in the Reserve Fund as provided in the Project Financing Agreement.
"Outstanding" when used with reference to Bonds, shall mean, as of a particular date, all Bonds theretoforeand thereupon delivered except: (a) any Bond cancelled by or on behalf of the Corporation or delivered to theRegistrar for cancellation at or before said date, (b) any Bond defeased or no longer considered Outstandingpursuant to the provisions of the Bond Resolution or otherwise defeased as permitted by applicable law, and (c) anysuch Bond in lieu of or in substitution for which another Bond shall have been delivered pursuant to the BondResolution.
"Owner" or "Registered Owner", when used with respect to any Bond shall mean the person or entity inwhose name such Bond is registered in the Register. Any reference to a particular percentage or proportion of theOwners shall mean the Owners at a particular time of the specified percentage or proportion in aggregate principalamount of all Bonds then Outstanding under the Bond Resolution.
"Parity Bonds" shall mean the Bonds and each Series of Additional Parity Bonds from time to timehereafter issued, but only to the extent such Parity Bonds remain Outstanding.
"Parking Garage" shall mean a parking garage containing approximately 5,000 spaces and relatedinfrastructure located at Love Field.
"Paying Agent/Registrar" shall mean the bank or trust company so designated in the Bond Resolutions.
D-3

"Pledged Revenue Fund" shall mean the fund so designated and created pursuant to the Indenture.
"Pledged Revenue Fund Balance" shall mean, as of any Transfer Date, $10,000,000.
"Pledged Revenues" shall mean
(a) All of the Corporation's right, title and interest under the Project Financing Agreement, includingthe right, title and interest of the Corporation to Net Revenues the Corporation is entitled to receivethereunder.
(b) Other Revenues.
(c) All moneys deposited or required to be deposited in the Pledged Revenue Fund, the Debt ServiceFund, the Reserve Fund and the Project Fund held by the Trustee pursuant to the provisions of thisIndenture and all interest earnings and investment income therefrom, other than any amount required to berebated to the United States under Section 148(f) of the Code and deposited to Rebate Fund.
(d) Any and all property of every kind and nature (including without limitation, cash, obligations orsecurities) which may from time to time hereafter be conveyed, assigned, hypothecated, endorsed, pledged,mortgaged, granted, or delivered to or deposited with, the Trustee as additional security hereunder by theCorporation, or anyone on behalf of the Corporation, or which pursuant to any of the provisions hereof maycome into the possession or control of the Trustee as security hereunder, or of a receiver lawfully appointedhereunder, all of which property the Trustee is authorized to receive, hold and apply according to the termshereof.
"Principal Installment" shall mean, as of any particular date of computation and Bonds of a particularSeries, an amount of money equal to the aggregate of (a) the principal amount of Outstanding Bonds of said Serieswhich mature on a single future date, reduced by the aggregate principal amount of such Outstanding Bonds of suchSeries which would at or before said future date be retired as a result of Mandatory Redemption Installments appliedin accordance with this Indenture plus (b) the amount of any Mandatory Redemption Installment payable on saidfuture date for the retirement of any Outstanding Bonds of said Series.
"Principal Installment Payment Date", when used in connection with any Bond, shall mean November 1 ineach year such Bonds are scheduled to mature, as determined in accordance with the terms of the Bond Resolutiongoverning the issuance of the Series of such Bonds.
"Project" shall mean improvements to Love Field that the City and the Corporation agree shall be (a)funded as general improvements to Love Field and (b) paid from Net Revenues, including specifically the ParkingGarage.
"Project Financing Agreement" shall mean the "Project Financing Agreement" between the City and theCorporation, dated as of July 1, 2015, as the same may be amended or supplemented from time to time.
"Project Fund" shall mean the fund so designated and created pursuant to the Indenture.
"Rebate Fund" shall mean the fund so designated and created pursuant the Indenture.
"Register" or "Bond Register" shall mean the books of registration kept by the Registrar in which aremaintained the names and addresses of, and the principal amounts of the Bonds registered to, each Owner.
"Regulations" or "Treasury Regulations" shall mean all applicable temporary, proposed and finalregulations and procedures promulgated pursuant to the Code or promulgated under the Internal Revenue Code of1954, to the extent applicable to the Code.
"Reserve Fund" shall mean the fund so designated and created pursuant to the Indenture.
D-4

"Reserve Requirement" shall be computed by the Corporation annually and after the issuance of any Seriesof Bonds and shall be the Maximum Annual Debt Service, provided that in any event the Reserve Requirement shallbe the least of Maximum Annual Debt Service, one hundred and twenty-five percent (125%) of Average AnnualDebt Service or ten percent (10%) of the stated principal amount of the Bonds or any Series of Bonds or ten percent(10%) of the issue price of the Bonds or any Series of Bonds if the Bonds or any Series of Bonds are issued withmore than a de minimis amount (as certified by the Corporation) of original issue discount.
"Series" shall mean all of the Bonds authenticated and delivered on issuance and pursuant to the Indentureor any Bond Resolution authorizing the issuance of such Bonds as a separate series of Bonds or any Bonds thereafterauthenticated and delivered in lieu of or in substitution for such Bonds.
"State" or "State of Texas" shall mean the State of Texas.
"Subordinate Lien Obligations" shall mean any bonds, notes or other obligations, including contractualobligations incurred by the Corporation, secured in whole or in part by liens on the Pledged Revenues that are juniorand subordinate to the lien on Pledged Revenues securing payment of the General Airport Revenue Bonds.
"Trustee" shall mean Wells Fargo Bank, National Association, and its successors in that capacity.
Trust Estate
In order to secure the payment of the principal of, redemption premium, if any, and interest on all GeneralAirport Revenue Bonds as the same are issued and become due and payable, whether at maturity or by priorredemption, and the performance and observance of all of the covenants and conditions herein contained, and inconsideration of the premises, the acceptance by the Trustee of the trusts hereby created, the purchase andacceptance of the General Airport Revenue Bonds by the Owners thereof, and other good and valuableconsideration, the receipt and sufficiency of which are hereby acknowledged, the Corporation does hereby grant,bargain, convey, assign and pledge to the Trustee and its successors in trust hereunder, subject to the provisions ofthe Indenture, all of the Corporation's right, title and interest in and to the Pledged Revenues.
Creation of Funds
The following Funds are created in the Indenture: Pledged Revenue Fund; Debt Service Fund; ReserveFund; Project Fund; Costs of Issuance Fund; and Rebate Fund. Each Fund shall be maintained by the Trusteeseparate and apart from all other funds of the Corporation. The Pledged Revenue Fund, the Debt Service Fund, theReserve Fund and the Project Fund shall constitute trust funds which shall be held in trust by the Trustee solely forthe benefit of the Owners of the General Airport Revenue Bonds. The Owners of General Airport Revenue Bondsshall have no rights to monies held in the Costs of Issuance Fund or the Rebate Fund. The Trustee, at its discretionor upon the written direction of the Corporation, may establish accounts within any Fund to enable the moreefficient management of the monies on deposit in any such Fund.
Pledged Revenue Fund; Flow of Funds
Immediately upon receipt thereof, the Corporation shall deposit into the Pledged Revenue Fund all PledgedRevenues. Money in the Pledged Revenue Fund shall be held in trust by the Trustee and applied on each TransferDate in the following manner and order of priority:
(A) First, to the Debt Service Fund amounts necessary to make the amounts on deposit therein equal tothe interest and Principal Installments, and premium, if any, due on the General Airport Revenue Bonds inthe then current Fiscal Year;
(B) Second, to the Reserve Fund amounts required to attain or maintain the Reserve Requirement;
(C) Third, to the payment of the fees and expenses of the Trustee and Paying Agent/Registrar due andowing, in the then current Fiscal Year;
D-5

(D) Fourth to any fund or account created for the benefit of any Subordinate Lien Obligations issuedor incurred by the Corporation; provided that immediately prior to any such transfers the deposits requiredby Sections 4.02(A) through (C) of the Indenture have been made or provided for; and
(E) Fifth, as directed by the Corporation, to the Project Fund to pay for any services, improvements orother costs of the Project as are agreed to by the City and the Corporation by an agreement duly authorizedby the governing bodies of both the City and the Corporation; provided that immediately prior to any suchtransfers the deposits required or payments made by Sections 4.02(A) through (D) of the Indenture havebeen made or provided for.
Debt Service Fund
Money in the Debt Service Fund shall be held in trust by the Trustee. The Corporation shall deposit orcause to be deposited into the Debt Service Fund accrued interest on the General Airport Revenue Bonds, moneysdesignated by the Corporation as capitalized interest on the General Airport Revenue Bonds, transfers from thePledged Revenue Fund as provided above, and, to the extent necessary, other Pledged Revenues in such amountsand at such times to provide the amounts necessary to pay all General Airport Revenue Obligations when due,including specifically to pay interest and Principal Installments due on the General Airport Revenue Bonds in thethen current Fiscal Year. The Trustee shall transfer on each Interest Payment Date and each Principal InstallmentPayment Date to the Paying Agent/Registrar such amounts in the Debt Service Fund to pay Principal Installmentsand interest on the General Airport Revenue Bonds as the same becomes due.
Reserve Fund
Money in the Reserve Fund shall be held in trust by the Trustee. The Reserve Fund shall initially befunded as provided in the Bond Resolutions.
If, on any Interest Payment Date or Principal Installment Payment Date, after transferring funds to the DebtService Fund as provided above under Pledged Revenue Fund; Flow of Funds, the Reserve Fund contains amountsless than the Reserve Requirement, the Trustee shall withdraw from the Pledged Revenue Fund and deposit into theReserve Fund the amount required to attain the Reserve Requirement. If there are not sufficient funds in thePledged Revenue Fund to fund the Reserve Requirement, the Trustee shall deposit into the Reserve Fund, asreceived, the following funds, until the Reserve Requirement is again attained:
(i) those portions of Net Revenues required to be deposited into the Reserve Fund pursuant to theBond Resolutions and this Indenture;
(ii) all interest and income earned from the investment of amounts credited to the Reserve Fund; and
(iii) all other Pledged Revenues not required to be deposited into the Debt Service Fund or paid as feesto the Trustee or Paying Agent/Registrar.
Amounts deposited into the Reserve Fund shall be (i) used to pay interest on or Principal Installments ofthe General Airport Revenue Bonds when insufficient funds are available for such purpose in the Debt Service Fundor (ii) applied toward the payment of interest on or Principal Installments of General Airport Revenue Bonds inconnection with the refunding or redemption of such General Airport Revenue Bonds. Should the Trustee determinethat on any Interest Payment Date or Principal Installment Payment Date there are not sufficient funds in the DebtService Fund available to pay interest on or principal of the Parity Bonds then due and owing, the Trustee shalltransfer funds from the Reserve Fund to the Debt Service Fund to the extent available to address such deficiency.
Project Fund
The Project Fund and any accounts or subaccounts thereof shall initially be funded as provided in the BondResolutions. The money and securities in the Project Fund shall be held in trust by the Trustee and applied asprovided herein, and until such application, the money and securities in such fund shall be subject to a lien andcharge in favor of the Owners of the Bonds.
D-6

The Trustee is hereby authorized and directed to make disbursements from the Project Fund and to issue itschecks therefor or otherwise pay upon receipt of a requisition in accordance with the next succeeding paragraph.The Trustee shall keep and maintain adequate records pertaining to the Project Fund and all disbursementstherefrom.
The Trustee shall use money in the Project Fund solely to pay or reimburse the Corporation for costs of theProject and the repayment of any advances, loans, notes or other obligations used to finance costs of the Project.Before any payment shall be made from the Project Fund, there shall be filed with the Trustee a completedrequisition, signed by an Authorized Representative of the Corporation, the City and the construction manager forthe Project. Upon receipt of such requisition, the Trustee shall make payment from the Project Fund in accordancewith such requisition.
Costs of Issuance Fund
The Trustee shall deposit to the credit of the Costs of Issuance Fund the amount set forth in the closinginstructions executed by or on behalf of the Corporation in connection with the delivery of a Series of GeneralAirport Revenue Bonds. The Trustee shall apply the monies in the Costs of Issuance Fund to the payment of Costsof Issuance, in accordance with the certificate to be delivered as provided in the Bond Resolutions in respect to theapplication of proceeds of General Airport Revenue Bonds. The Trustee will transfer any balance remaining in theCosts of Issuance Fund on the one hundred and eightieth (180th) day following the issuance of the Series of GeneralAirport Revenue Bonds to the Pledged Revenue Fund.
Additional Parity Bonds
The Corporation reserves the right to issue, for any lawful purpose (including the refunding of anypreviously issued or incurred General Airport Revenue Obligations), one or more series of Additional Parity Bondspayable from and secured by a first lien on the Pledged Revenues, on a parity with the Bonds, and any previouslyissued Additional Parity Bonds; provided, however, that no Additional Parity Bonds may be issued unless:
(a) The Additional Parity Bonds mature on, and interest is payable on, the Principal InstallmentPayment Dates and Interest Payment Dates, respectively;
(b) There shall be on deposit in the Reserve Fund, after the issuance of the Additional Parity Bonds,an amount equal to the Reserve Requirement on any Outstanding Bonds plus the Additional Parity Bonds;
(c) The Corporation is not in material default with the terms of the Indenture, any Bond Resolution,the Project Financing Agreement or any other agreement to which it is a party and has so certified; and
(d) The City delivers to the Corporation and the Trustee either (i) a written report from an AirportConsultant setting forth projections which indicate that the estimated Net Revenues of the Airport System for eachof three consecutive Fiscal Years beginning in the earlier of (A) the first Fiscal Year following the estimated date ofcompletion and initial use of all revenue producing facilities to be financed with Additional Parity Bonds, basedupon a written estimated completion date by the consulting engineer for the facility or facilities, or (B) the firstFiscal Year in which the Corporation will have scheduled payments of interest on or principal of the AdditionalParity Bonds to be issued for the payment of which provision has not been made as indicated in the report of theAirport Consultant from proceeds of the Additional Parity Bonds, investment income on the proceeds of suchAdditional Parity Bonds or from other appropriated sources (other than Net Revenues) are at least equal to 1.25times the Average Annual Debt Service on all Outstanding Parity Bonds scheduled to occur during each respectiveFiscal Year after taking into consideration the additional Debt Service requirements for the Additional Parity Bondsto be issued, or (ii) a certificate executed by the Aviation Director and countersigned by the Chief Financial Officerof the City showing that, for either the City's most recent complete Fiscal Year or for any consecutive twelve (12)out of the most recent eighteen (18) months, the Net Revenues of the Airport System were equal to at least 1.10times the Maximum Annual Debt Service requirements of all Parity Bonds scheduled to occur in the then current orany future Fiscal Year after taking into consideration the issuance of the Additional Parity Bonds proposed to beissued.
D-7

The foregoing notwithstanding, , the conditions set forth in paragraph (d) above shall not apply to (A) thefirst $250,000,000 in aggregate principal amount of General Airport Revenue Bonds issued by the Corporation tofund the costs of the design and construction of the Parking Garage, funding the Reserve Fund and other funds andaccounts established by this Indenture, and related Costs of Issuance, and (B) the issuance of any Series ofAdditional Parity Bonds for refunding purposes that will have the result of reducing the maximum debt servicerequirements on the General Airport Revenue Bonds so refunded.
Subordinate Lien Obligations
The Corporation reserves the right to issue, for any lawful purpose, Subordinate Lien Obligations securedin whole or in part by liens on the Pledged Revenues that are junior and subordinate to the lien on Pledged Revenuessecuring payment of the General Airport Revenue Obligations. Such Subordinate Lien Obligations may be furthersecured by any other source of payment lawfully available for such purposes.
Disposition of Moneys upon Completion of Project
Upon completion of the Project, and the payment of all costs of the Project, General Airport RevenueObligations and Subordinate Lien Obligations has been made in full, the Corporation shall deliver to the Trustee awritten letter of instructions so stating that the Project is completed and such payment in full has been made.Promptly after receipt of such letter of instructions from the Corporation, the Trustee shall cause any moneyremaining in the Pledged Revenue Fund or the Project Fund to be transferred to the City.
Investments
Monies deposited into the Pledged Revenue Fund, the Debt Service Fund, the Reserve Fund, the ProjectFund and the Costs of Issuance Fund shall be invested and reinvested in Eligible Investments as directed in writingto the Trustee by the Corporation; provided that all such Eligible Investments shall be directed by the Corporation insuch manner that the money required to be expended from any Fund will be available at the proper time or times.
General Covenants
The Corporation covenants to promptly pay or cause to be paid all General Airport Revenue Bonds whendue, including specifically to promptly pay or cause to be paid the principal of, redemption premium, if any, andinterest on the General Airport Revenue Bonds as the same become due and payable, whether at maturity or by priorredemption, in accordance with the terms of the General Airport Revenue Bonds and the Bond Resolutions; to paywhen due all fees, charges and other amounts due to the Trustee and the Paying Agent/Registrar for the discharge oftheir duties under the Indenture; and to faithfully keep and perform all of its covenants, undertakings and agreementscontained in the Indenture, the Project Financing Agreement, the Bond Resolutions and the General AirportRevenue Bonds.
The Corporation covenants that it has good and indefeasible title to the Net Revenues, subject to theassignments and pledges contained in the Indenture. So long as any General Airport Revenue Bonds remainOutstanding, except as permitted by the Indenture, the Corporation covenants not to sell, transfer, assign, pledge,encumber, mortgage or otherwise dispose of, directly or indirectly, by merger or otherwise, or cause or suffer same,or create or allow to accrue or exist any lien upon, all or any part of its interest in the Pledged Revenues or anyportion thereof, except for the lien of the Indenture.
The Pledged Revenues are not in any manner pledged to the payment of any debt or obligation of theCorporation other than the General Airport Revenue Bonds. The Corporation covenants that it will not in anymanner pledge or further encumber the Pledged Revenues unless such pledge or encumbrance is junior andsubordinate to the lien and pledge hereunder securing the General Airport Revenue Bonds.
The Corporation covenants not to cause any amendment of the Project Financing Agreement that will inany manner materially impair the rights of the Owners of the General Airport Revenue Bonds.
D-8

Events of Default
An Event of Default under the Indenture shall consist of any of the following acts or occurrences:
(A) failure to pay when due Principal Installments or interest on any General Airport Revenue Bond;or
(B) failure to deposit to the Debt Service Fund money sufficient for the payment of any PrincipalInstallments or interest payable on the General Airport Revenue Bonds by no later than the date when suchPrincipal Installment or interest becomes due and payable; or
(C) failure by the Corporation to observe or perform any other covenant, agreement or obligation onits part to be observed or performed contained in this Indenture or in the General Airport Revenue Bonds,which failure shall have continued for a period of thirty (30) days after written notice, either by registeredor certified mail, to the Corporation specifying the failure and requiring that it be remedied, which noticemay be given by the Trustee in its discretion and shall be given by the Trustee at the written request of theHolders of not less than 25 percent (25%) in aggregate principal amount of the General Airport RevenueBonds then outstanding.
Remedies
If an Event of Default shall occur and be continuing, then, in addition to all of the other rights and remediesgranted to the Trustee by the Indenture, the Trustee in its discretion, subject to the provisions of the Indenture, mayproceed to protect and enforce its rights and the rights of the Owners of General Airport Revenue Bonds by suit,action or proceeding in equity or at law or otherwise, whether for the specific performance of any covenant oragreement contained in the Indenture, the Bond Resolutions or the General Airport Revenue Bonds or in aid of theexecution of any power granted in this Indenture or for the enforcement of any other legal, equitable or otherremedy, as the Trustee, being advised by counsel, shall deem most effectual to protect and enforce any of the rightsof the Trustee or such Owners of the General Airport Revenue Bonds, including, without limitation, the right to seeka writ of mandamus issued by a court of competent jurisdiction compelling the members of the Board or otherofficers of the Corporation or the City to make payment of the Net Revenues (but only from and to the extent of thesources provided in the Indenture and the Project Financing Agreement) or to observe and perform such covenant,obligations or conditions of the Indenture or the Project Financing Agreement.
Appointment of Receivers
If an Event of Default shall occur and be continuing, and upon filing of a bill in equity or commencementof other judicial proceedings to enforce the rights of the Trustee and the Owners under the Indenture, the Trusteeshall be entitled as a matter of right, and to the extent permitted by law, to the appointment of a receiver or receiversof the Pledged Revenues and the income, rents, profits and use thereof pending such proceedings, with such powersas the court making such appointment shall confer.
D-9

[THIS PAGE INTENTIONALLY LEFT BLANK]

APPENDIX E
PROJECT FINANCING AGREEMENT

[THIS PAGE INTENTIONALLY LEFT BLANK]
AGREEMENT BETWEEN THE CITY AND THE LFAMC Page 1
STATE OF TEXAS §
COUNTY OF DALLAS §
PROJECT FINANCING AGREEMENT BY AND BETWEENTHE CITY OF DALLAS, TEXAS AND
THE LOVE FIELD AIRPORT MODERNIZATION CORPORATION
THIS PROJECT FINANCING AGREEMENT is made by and between the Cityof Dallas, Texas, a municipal corporation organized under the laws of the State of Texas(the “City”) and the Love Field Airport Modernization Corporation, a not-for-profit localgovernment corporation organized and existing under Chapter 431, Subchapter D of theTexas Transportation (the “LFAMC”).
W l T N E S S E T H:
WHEREAS, the City Council authorized the creation of the LFAMC as a localgovernment corporation for the public purpose of aiding, assisting, and acting on behalfof the City in the performance of its governmental functions to promote the City,including the development of the geographic areas of the City included at or in thevicinity of Love Field, a public airport owned and operated by the City (“Love Field”);and
WHEREAS, the LFAMC has heretofore issued bonds to finance components ofthe Love Field Modernization Program (the “LFMP”), the City’s program to redevelopthe terminal building area of Love Field, and the issuance of such bonds was approved bythe City Council; and
WHEREAS, the City and the LFAMC have determined that it will be advisable tohave the LFAMC assist the City in financing a public parking garage located at LoveField containing approximately 5,000 parking spaces, together with the associated airportimprovements, tasks and activities necessary for the design and construction of the publicparking garage, as more fully described in Exhibit A to this Agreement (the “Project”),and to provide other services as further described in this Agreement; and
WHEREAS, the Project is a component of the LFMP; and
WHEREAS, the City finds that the execution of this Agreement is necessary tothe execution of a power granted to the City and for a purpose provided for by Chapter22, Texas Transportation Code; and
AGREEMENT BETWEEN THE CITY AND THE LFAMC Page 2
WHEREAS, it is the intention of the parties to this Agreement that, subject to thelimitations prescribed in this Agreement and its Articles of Incorporation, the LFAMCshall have the authority to issue, sell or deliver its bonds, notes, or other obligations insuch amounts as may be necessary to provide for the design and construction of theProject and the funding of any necessary reserve fund or capitalized interest accounts andthe payment of the costs of issuance of such bonds, notes, or other obligations, andperform other activities as further described in this Agreement; and
WHEREAS, the City agrees to pay for the LFAMC’s activities performedpursuant to this Agreement, including specifically, but not by limitation, the issuance ofbonds, notes or other obligations to finance the Project, from Net Revenues as providedin this Agreement, Chapter 22, Texas Transportation Code, and Chapter 431, TexasTransportation Code (the “Act”); and
WHEREAS, the LFAMC was created in part to aid and assist the City in themanner set forth above, and the LFAMC is willing to enter into a contract with the Citysetting forth the duties and responsibilities of the LFAMC and the City in connectionwith financing the Project.
NOW, THEREFORE, for and in consideration of the premises and the mutualcovenants and agreements herein contained, it is agreed as follows:
I.DEFINITIONS
“Act” shall mean Chapter 431, Texas Transportation Code.
“Agreement” shall mean this Agreement between the City and the LFAMC.
“Airport Cost Centers” shall have the meaning given said term in the Lease.
“Airport System” shall mean all airport, heliport and aviation facilities, or anyinterest therein, now or from time to time hereafter owned, operated or controlled by theCity. The Airport System currently includes Love Field, Dallas Executive Airport, andthe City’s downtown heliport.
“Average Annual Debt Service” shall have the meaning given said term in theIndenture.
“Aviation Capital Fund” shall mean the fund by that name maintained by the Cityin accordance with the Lease.
“Aviation Revenue Fund” shall mean the fund by that name maintained by theCity in accordance with the Lease.

AGREEMENT BETWEEN THE CITY AND THE LFAMC Page 3
“Bond Documents” shall mean the resolution of the LFAMC authorizing theissuance of a series of Bonds and any trust indenture or supplement thereto executed bythe LFAMC in connection with the issuance of a series of Bonds, including specificallythe Indenture.
“Bond Proceeds” shall mean the net proceeds from the sale of the Bonds.
“Bonds” shall mean the bonds, notes or other obligations issued by the LFAMC tofinance improvements at Love Field, including specifically the Project.
“City” shall mean the City of Dallas, Texas.
“Fiscal Year” shall mean the twelve (12) month period commencing on October 1of a calendar year and ending September 30 of the next succeeding calendar year, or suchother consecutive twelve (12) month period as determined by the City.
“GARB Debt Service Fund” shall mean the fund maintained by the City inaccordance with the Lease to pay debt service on any Bonds payable from the revenuesgenerated by the Airport System that may be issued from time to time by the City or theLFAMC to finance improvements at Love Field, including, without limitation, theProject.
“GARB Debt Service Reserve Fund” shall mean the fund maintained by the Cityin accordance with the Lease to fund or restore any debt service reserve fund establishedin support of any bonds, notes or other obligations that may be issued from time to timeby the City or the LFAMC to finance improvements at Love Field that are payable fromthe revenues generated by the Airport System, including, without limitation, the Project.
“Generally Accepted Accounting Principles” shall mean such acceptedaccounting practice that conforms at the time to a body of generally accepted accountingprinciples as applied to Texas municipalities such as the City.
“Indenture” shall mean the Indenture of Trust by and between the LFMAC andWells Fargo Bank, National Association, dated as of July 1, 2015, executed and deliveredin connection with the issuance of time to time of Bonds.
“Lease” shall mean the Airport Use and Lease Agreement executed by the Cityand the commercial airline users operating at Love Field, in connection with the lease anduse of certain portions of Love Field by commercial aviation users of Love Field.
“LFAMC” shall mean the Love Field Airport Modernization Corporation.
“LFAMC Board” shall mean the Board of Directors of the LFAMC.

AGREEMENT BETWEEN THE CITY AND THE LFAMC Page 4
“LFMP” shall mean the Love Field Modernization Program.
“Love Field” shall mean the public airport owned and operated by the City knownas Dallas Love Field.
“Net Revenues” shall mean the revenues of the Airport System deposited to thecredit of the Aviation Revenue Fund in accordance with the terms of each Lease and thatare available after the funding of the O&M Account and the O&M Reserve Account(each as defined in the Lease) and deposited to the credit of the GARB Debt ServiceFund, all as provided in the Lease.
“Pledged Revenue Fund” shall mean the fund established by the LFAMC in theBond Documents and held and administered by the Trustee, into which Net Revenues areto be deposited.
“Project” shall mean the approximately 5,000 space public parking garage at LoveField as described in the preamble to this Agreement, together with the associated airportimprovements, tasks and activities necessary for the design and construction of the publicparking garage, as more fully described in Exhibit A to this Agreement.
“State” shall mean the State of Texas.
“Trustee” shall mean the financial institution so designated in the BondDocuments.
II.SCOPE OF SERVICES BY LFAMC
The LFAMC and the City shall cooperate and coordinate their activities withrespect to the commencement, financing, design and construction of improvements atLove Field, including specifically the Project, so that the commencement, financing,design and construction of any such improvements shall occur at such times as arenecessary or desirable to meet the construction time requirements of the City. To thatend, the LFAMC may directly transfer, or cause to be transferred, to the constructionmanager of the Project, or to the City for transfer to the construction manager of theProject, as designated by the City, such funds derived from Bond Proceeds to providefunding for the Project, in the manner as further provided for in the Bond Documents.
III.LFAMC OBLIGATIONS
A. General Statement. The parties have agreed that the LFAMC has theauthority to issue Bonds, in one or more series, the debt service on which shall be repaid
AGREEMENT BETWEEN THE CITY AND THE LFAMC Page 5
from moneys to be paid by the City, in furtherance of the implementation anddevelopment of the LFMP. The obligation of the City to make such payments shall bederived solely from Net Revenues, and the City shall not be obligated to make fundsavailable from moneys raised or to be raised from taxation.
B. Power to Issue Bonds. Subject to the provisions of this Article, theLFAMC shall have the power from time to time to issue Bonds upon such terms andconditions as the LFAMC and the City shall determine to be necessary or desirable tofinance the Project consistent with the LFMP.
C. Bonds.
1. To effect the financing of the Project, the LFAMC may issue itsBonds in an amount necessary to finance the design and construction of theProject and pay any costs associated therewith (including amounts necessary tofund reserve funds and capitalized interest accounts for the Bonds and to paycosts of issuance of the Bonds), which will be repaid by the LFAMC frompayments made by the City pursuant to this Agreement. The issuance of Bonds bythe LFAMC shall be subject to the approval of the City by a resolution dulyadopted by the City Council. The deposit and disbursement of Bond Proceedsshall be made in accordance with the Bond Documents.
2. The LFAMC agrees to commence the process to issue and sell theBonds from time to time, at such times and in such amounts as are required toproduce Bond Proceeds in an amount sufficient to accommodate the design andconstruction of the Project and to pay other costs associated therewith asnecessary. The LFAMC shall issue and sell the Bonds, from time to time, andshall hold and disburse the Bond Proceeds as provided in this Agreement and theBond Documents. The parties hereto acknowledge that it is the intention of theparties that the Project be financed in a manner that interest on Bonds isexcludable from taxation under the Internal Revenue Code of 1986, as amended(the "Code"), and regulations promulgated thereunder.
3. Bonds issued by the LFAMC shall be secured, in whole or in part,by funds received from the City, including, without limitation, the Net Revenues,and deposited, or cause to be deposited, by the LFAMC from time to time in thePledged Revenue Fund. The LFAMC agrees to provide to the City copies of anyproposed trust indenture or bond resolution in connection with any issuance ofBonds prior to their approval by the LFAMC Board. In addition, to the fullestextent permitted by law, the LFAMC agrees that it will not revoke or amend anyorders, resolutions or other actions relating to the issuance, sale or delivery ofBonds, except as provided in the resolutions, indentures or other instrumentsadopted or executed in connection with the sale of the Bonds. To the extent Bondsare issued as obligations, the interest on which is intended to be excludable fromthe income of the holders thereof for federal income tax purposes, the LFAMC

AGREEMENT BETWEEN THE CITY AND THE LFAMC Page 6
agrees that it will take all actions necessary to ensure that the interest payable onthe Bonds is and remains excludable from the income of the holders thereof underthe Code, and regulations promulgated thereunder.
4. All Bond Proceeds received from the issuance of Bonds shall bedeposited into such funds and accounts, and disbursed in such manner and at suchtimes, as shall be provided for in the Bond Documents. All Bond Proceeds shallbe held separate and apart from and shall not be commingled with any other fundsof the LFAMC. Bond Proceeds shall be expended only for costs of the Project asfurther described in Article III.C.1 of this Agreement.
5. To the extent necessary or desirable, the Bond Documents mayprovide that a reserve fund be established and funded as mutually agreeable to theLFAMC and the City to provide additional security for the holders of the Bondsin support of the payment of the principal and interest on the Bonds and/or toretire a portion of the Bonds.
D. Accounting. Complete books and records shall be maintained showingdeposits to and disbursements from the GARB Debt Service Fund and theGARB Debt Service Reserve Fund maintained by the City, and the Pledged RevenueFund or other funds of the LFAMC created in accordance with the Bond Documents,which books and records shall be deemed complete if kept in accordance with GenerallyAccepted Accounting Principles as applied to Texas municipalities. Such books andrecords shall be available for examination by the duly authorized officers or agents of theCity or LFAMC Board during normal business hours upon request made not less thanfive (5) business days prior to the date of such examination. The City and the LFAMCshall maintain such books and records throughout the term of this Agreement and forthree (3) years thereafter, all subject to any applicable requirements of the laws of theState.
E. Use of Net Revenues. The LFAMC will use the moneys in the PledgedRevenue Fund in the following priority:
1. First, to pay all principal of, interest on, premium (if any) and tofund any reserves necessary or desirable in connection with such Bonds, at therespective times and in the respective amounts as fixed and prescribed in theresolution or resolutions pursuant to which such Bonds are issued by the LFAMC;
2. Second, to make deposits to any debt service reserve fundestablished in accordance with the Bond Documents to attain or maintain therequired reserve amount as provided for in the Bond Documents;
3. Third, to the payment of the fees and expenses of the Trustee andPaying Agent/Registrar due and owing, for the next twelve (12) month period;and

AGREEMENT BETWEEN THE CITY AND THE LFAMC Page 7
4. Fourth, as directed by the LFAMC, to pay any costs the LFAMCmay incur in connection with the administration of the funds and accountsestablished under the Bond Documents in addition to those incurred to pay thefees and expenses of the Trustee and the Paying Agent/Registrar; provided thatimmediately prior to any such transfers the deposits required or payments madeby clauses First through Third above have been made or provided for.
The foregoing notwithstanding, any pledge or deposit of monies in the Pledged RevenueFund shall be made in accordance with the provisions of the Bond Documents.
F. Pledge of Pledged Revenue Fund. The LFAMC may pledge and assign allor a part of the Pledged Revenue Fund and the Net Revenues to be deposited to the creditof the Pledged Revenue Fund to the owners and holders of Bonds of the LFAMC or tothe Trustee acting on their behalf.
G. Depository. The Pledged Revenue Fund is the account into which the NetRevenues shall be deposited pursuant to this Agreement. Any moneys received frominvesting and reinvesting the moneys deposited to the credit of the Pledged RevenueFund shall remain in the Pledged Revenue Fund until used by the LFAMC for thepurposes permitted by this Agreement in accordance with Article III.G. Moneys in thePledged Revenue Fund may be invested and reinvested by the LFAMC only ininvestments which would be eligible for investment by the City pursuant to theprovisions of the Public Funds Investment Act (Chapter 2256, Texas Government Code),consistent with the City’s written investment policy. Moneys on deposit in the PledgedRevenue Fund will be secured in the same manner as City funds are required to besecured at the City's depository bank.
H. Bond Consultants. McCall, Parkhurst & Horton L.L.P., Dallas, Texas andEscamilla & Poneck LLP, San Antonio, Texas, shall act as co-bond counsel for Bondsissued by the LFAMC. Andrews Kurth LLP, Dallas, Texas and Gonzales Saggio &Harlan LLP, Atlanta, Georgia, shall act as co-disclosure counsel for Bonds issued by theLFAMC. .First Southwest Company, LLC, Dallas, Texas and Estrada Hinojosa &Company, Inc., Dallas, Texas, shall act as co-financial advisors to the LFAMC. SternBrothers & Co. shall act as the senior managing underwriters for the first series of Bondsissued by the LFAMC.
IV.DUTIES AND RESPONSIBILITIES OF THE CITY
A. Duties of City. Throughout the term of the Bonds, the City agrees to ownand operate the Airport System and to charge and collect rates, fees, and revenues for theuse and operation of Airport System, including, without limitation, terminal rentals,landing fees, fees charged to concessionaires and charges for use of parking facilities at

AGREEMENT BETWEEN THE CITY AND THE LFAMC Page 8
Love Field (including the Project), in amounts sufficient to generate revenues sufficientto maintain Love Field, including specifically the Project, at the standards required by theLease, including, without limitation, the standards in respect to the Airport Cost Centerseffected and managed in accordance with the provisions of the Lease, and to makedeposits to the GARB Debt Service Fund and the GARB Debt Service Reserve Fund inamounts sufficient to make the required deposits to the Pledged Revenue Fund and anyreserve fund established in respect to the Bonds, all as provided in this Agreement.
B. Funds. The City will establish separate funds as provided in the Lease,including specifically the Aviation Revenue Fund, the GARB Debt Service Fund and theGARB Debt Service Reserve Fund, for the benefit of the LFAMC, the trustee named inthe Bond Documents, and the owners of the Bonds. During the term of this Agreement,the City will pay the LFAMC, on a monthly basis on the first business day of eachmonth, all monies then available in the GARB Debt Service Fund and hereby pledgessuch monies to such payments. Upon receipt, the LFAMC shall deposit or cause to bedeposited such funds in the Pledged Revenue Fund and use them in accordance withArticle III.E. In addition, during the term of this Agreement, the City will pay to theLFAMC, upon its request delivered to the City in writing, from the GARB Debt ServiceReserve Fund amounts sufficient to restore any deficiency that may occur upon the use ofmoneys in any reserve fund established in accordance with the Bond Documents.
C. Limitation of Source of Payment. The City shall have no financialobligation to the LFAMC other than as provided in this Agreement or in otheragreements between the City and the LFAMC. The obligation of the City to the LFAMCunder this Agreement is limited to the Net Revenues, and shall not be payable frommoneys raised or to be raised by taxation. This Agreement shall create no obligation onthe City which is payable from taxes or other moneys of the City other than the NetRevenues. For so long as any Bonds of the LFAMC secured by Net Revenues areoutstanding and unpaid, the City covenants and agrees (a) to operate and maintain theAirport System in accordance with the provisions of the Lease, (b) to fix, establish,maintain and collect such rates, charges and fees for the use and availability of theAirport System at all times as are necessary to produce revenues sufficient, (1) to pay allcurrent operation and maintenance expenses and operation and maintenance reserverequirements of the Airport System, (2) to produce Net Revenues for each Fiscal Year atleast equal to 1.25 times the Average Annual Debt Service on all outstanding Bondsscheduled to occur during each respective Fiscal Year, and (3) to pay all other obligationsof the Airport System, and (c) to meet its obligations under this Agreement to collect NetRevenues sufficient to meet its payment obligations under this Agreement.
D. Allocated Funds: Limitation of Duties. The duty of the City to pay moneyto the LFAMC for any purpose under this Agreement is limited in its entirety by theprovisions of this Article. The payments herein provided for shall be the entire andcomplete compensation of the LFAMC for its services and expenses in connectionherewith.

AGREEMENT BETWEEN THE CITY AND THE LFAMC Page 9
E. Collection and Payment of Net Revenues by the City. In consideration ofthe issuance of the Bonds by the LFAMC to finance the Project, the City covenants andagrees that it will, as authorized under the Act and other applicable laws, continuouslycollect the Net Revenues during the term of this Agreement in the manner and to themaximum extent permitted by applicable law. The City further covenants and agrees thatit will not amend the Lease in any manner that adversely affects the rights of the holdersof the Bonds. In addition, the City covenants and agrees that it will not dissolve theLFAMC and that any repeal of the right and power to collect the Net Revenues will notbe effective until all Bonds have been paid in full or until they are legally defeased. TheCity further covenants and agrees that it will make all payments as set forth in ArticleIV.B. above, by a direct deposit into the Pledged Revenue Fund, without counterclaim oroffset, but minus any expenses incurred by the City in connection with the collection ofthe Net Revenues.
F. Transfers from GARB Debt Service Reserve Fund. If any debt servicereserve fund established in accordance with the Bond Documents is drawn upon to makeup any deficiency in any debt service fund established in accordance with the BondsDocuments to enable the timely payment of principal of or interest on the Bonds whendue, the City agrees to cause Net Revenues to be deposited in the GARB Debt ServiceReserve Fund and promptly transfer moneys deposited to the credit of the GARB DebtService Reserve Fund to the Trustee to restore the amounts on deposit in such debtservice reserve fund to the required reserve amount as provided for in the BondDocuments.
G. Obligations of City to be Absolute. The obligation of the City to make thepayments set forth in this Agreement from Net Revenues shall be absolute andunconditional, and until such time as this Agreement and all Bonds and issued pursuantto this Agreement have been fully paid or provision for payment thereof shall have beenmade in accordance with their terms, the City will not suspend or discontinue anypayments provided for in this Agreement and will not terminate this Agreement for anycause, including, without limiting the generality of the foregoing, the failure of theLFAMC to perform and observe any agreement, whether express or implied, or any duty,liability, or obligation arising out of or connected with this Agreement. Nothingcontained in this section shall be construed to release the LFAMC from performance ofany of the agreements on its part contained in this Agreement, and in the event theLFAMC shall fail to perform any such agreement on its part, the City may institute suchaction against the LFAMC as the City may deem necessary to compel performance solong as this action does not abrogate the obligations of the City to make the payments setforth in this Agreement to pay the Bonds of the LFAMC or to meet its obligations underthis Agreement.
H. Continuing Disclosure Obligation. The City acknowledges that forpurposes of Rule 15c2-12, promulgated by the United States Securities and ExchangeCommission, it shall be deemed to be an “obligated person” for purposes of said Rule,and that it will provide to the LFAMC the information described in the LFAMC’s

AGREEMENT BETWEEN THE CITY AND THE LFAMC Page 10
undertaking set forth in the Bond Documents to enable the LFAMC to timely meet itscontinuing disclosure undertaking set forth in the Bond Documents.
V.CONSTRUCTION OF THE PROJECT
A. Construction of the Project. The design and construction of the Projectshall commence and proceed in the manner directed by the City. The costs of the Projectare intended to be payable from Bond Proceeds; however, the City reserves the right tocause funds to be made available from other sources, including, without limitation, theAviation Capital Fund created and maintained in accordance with the Lease.
B. Disbursements of Bond Proceeds. The Bond Documents shall provide fora procedure by which Bond Proceeds may be disbursed for paying costs of design andconstruction of the Project. Any disbursement of Bond Proceeds for such purpose mustbe approved by the City, acting through the Director of Aviation, prior to thedisbursement of moneys to the construction manager for the Project or the vendors towhom payment has been approved. Each disbursement request from the fund or accountdesigned for such disbursement by the Bond Documents shall have attached for each itemfor which payment is sought, to the extent applicable, evidence of payment (e.g., paidinvoices or canceled checks) or evidence that payment is due, in a form reasonablysatisfactory to the City.
C. Completion Date. The expected date of completion of the Project shall beevidenced by a certificate signed by the City to the effect that: (i) that the design andcompletion of the Project has been completed and (ii) the City has made a reasonableinvestigation of such sources of information it deems necessary and is of the opinion thatthe Project has been fully paid for and that no claim or claims exist against the propertiesthat comprise the Project, out of which a lien based on furnishing labor or material for theProject might ripen. Such certificate shall be delivered within one hundred twenty (120)days of the first day on which the conditions set forth in both (i) and (ii) above have beensatisfied.
D. Remedies against Contractors, Subcontractors and Suppliers. In the eventof default or breach by any contractor, subcontractor, manufacturer or supplier under anycontract made in connection with the design and construction of the Project, the Citymay, in its discretion, either separately or in conjunction with the construction managerfor the Project, pursue the remedies of the LFAMC, the City and/or the constructionmanager against the contractor, subcontractor, manufacturer or supplier so in default andagainst any surety for the performance of that contractor, subcontractor, manufacturer orsupplier, or against a contractor, subcontractor, manufacturer or supplier for breach ofwarranty, in the manner consistent with the construction of the terminal project at LoveField, for which the LFAMC issued bonds for the financing thereof. Any amountrecovered by way of damages, refunds, adjustment or otherwise in connection with the
AGREEMENT BETWEEN THE CITY AND THE LFAMC Page 11
foregoing shall be disbursed in the manner agreed upon by the City and the constructionmanager for the Project.
E. Ownership of the Project. Upon the completion of the Project and itsacceptance by the City, title to the Project shall be vested in the City, and the LFAMCand the City shall execute and deliver such documents as shall be necessary to reflect titleto the Project is in the name of the City.
F. Transfer of Net Revenues Unconditional. Anything in this Article to thecontrary, the obligation of the City to transfer Net Revenues to the LFAMC inaccordance with the terms of the Bond Documents shall remain in effect until such timeas the Bonds are no longer outstanding under their terms and the terms of the BondDocuments.
VI.PERSONAL LIABILITY OF PUBLIC OFFICIALS
To the extent permitted by State law, no director of the LFAMC, nor anyemployee or agent of the LFAMC, and no employee of the City, nor any councilmemberor agent of the City, shall be personally responsible for any liability arising under orgrowing out of this Agreement, or operations of the LFAMC under the terms of thisAgreement.
VII.LAW TO BE OBSERVED
The LFAMC at all times shall observe and comply with all federal and State laws,local laws, ordinances, orders, and regulations of the federal, State, county, or citygovernments.
VIII.INFORMATION
The LFAMC shall, at such times and in such form as the City may require,furnish periodic information concerning the status of the LFAMC and the performance ofits obligations under this Agreement, and such other statements, certificates andapprovals relative to the LFAMC as may be requested in writing by the City. The Citycovenants and agrees that it shall provide the LFAMC with such information as may benecessary for the LFAMC to satisfy its continuing disclosure obligation as set forth in theBond Documents.

AGREEMENT BETWEEN THE CITY AND THE LFAMC Page 12
IX.COORDINATION WITH CITY OFFICIALS
The LFAMC will coordinate its activities with the City Manager or the CityManager's designee. Nothing in this Agreement is intended to confer upon the LFAMCthe right to use, improve, or service any City property without the approval of the City.
X.ADDRESS AND NOTICE
Any and all notices and communications under this Agreement shall be mailed byfirst-class mail, or delivered, to the LFAMC at the following address:
President, Board of DirectorsLove Field Airport Modernization CorporationCity of Dallas1500 Marilla, 7DNDallas, Texas 75201
Any and all notices and communications under this Agreement shall be mailed by first-class mail, or delivered, to the City at the following addresses:
City Manager City AttorneyCity of Dallas City of Dallas1500 Marilla, 4DN 1500 Marilla, 7DNDallas, Texas 75201 Dallas, Texas 75201
XI.APPLICABLE LAWS
THIS AGREEMENT IS MADE SUBJECT TO THE CONSTITUTION ANDLAWS OF THE STATE.
XII.CAPTIONS
The captions at the beginning of the Articles of this Agreement are guides andlabels to assist in locating and reading such Articles and, therefore, will be given noeffect in construing this Agreement and shall not be restrictive of the subject matter ofany article, section, or part of this Agreement.

AGREEMENT BETWEEN THE CITY AND THE LFAMC Page 13
XIII.SUCCESSORS AND ASSIGNS
This Agreement shall bind and benefit the respective parties and their legalsuccessors, and shall not be assignable, in whole or in part, by any party hereto withoutfirst obtaining the written consent of the other party, except that the LFAMC shall assignits rights hereunder to Wells Fargo Bank, National Association, as Trustee, under theIndenture, to secure the Bonds. Nothing herein shall be construed as creating anypersonal liability on the part of any officer or agency of the City or of the LFAMC.
XIV.TERM AND TERMINATION, DISSOLUTION OF LFAMC
A. In General. This Agreement shall become effective, and its initial termshall begin, on the date of execution by all parties, and shall end once all Bonds issued bythe LFAMC for the Project are no longer outstanding by their terms.
B. Termination for Cause. A party may terminate its performance under thisAgreement only upon default by another party. Default by a party shall occur if the partyfails to perform or observe any of the terms and conditions of this Agreement required tobe performed or observed by that party. Should such a default occur, the party againstwhom the default has occurred shall have the right to terminate all or part of its dutiesunder this Agreement as of the thirtieth (30th) day following the receipt by the defaultingparty of a notice describing such default and intended termination, provided, that suchtermination may be stayed, at the sole option of the party against whom the default hasoccurred, pending cure of the default. Notwithstanding the foregoing provisions of thisClause B, (a) this Agreement shall not be terminated while any Bond is outstanding inaccordance with its terms and (b) no termination of this Agreement will affect theobligation of the City to pay from Net Revenues an amount which will permit theLFAMC to pay in full all amounts due and to become due on the Bonds issued pursuantto this Agreement prior to termination.
C. Dissolution of LFAMC. The City agrees not to dissolve the LFAMCunless it makes satisfactory arrangements to provide for the payment in full of the Bondsissued prior to its dissolution.
XV.AMENDMENT OR MODIFICATIONS
Except as otherwise provided in this Agreement, this Agreement shall be subjectto change, amendment, or modification only by the mutual written consent of the partieshereto. The foregoing notwithstanding, no amendment shall become effective until theparties have received an opinion of nationally-recognized bond counsel selected by theLFAMC and approved by the City to the effect that such amendment will not adversely

AGREEMENT BETWEEN THE CITY AND THE LFAMC Page 14
impair the rights of the owners of any outstanding bonds, notes or other obligationsissued by the LFAMC.
XVI.COUNTERPARTS
This Agreement may be executed in any number of counterparts, each of whichshall be regarded as an original and all of which shall constitute one and the sameinstrument.
EXECUTED this ___ day of ________, 2015, by City, signing by and through itsCity Manager, duly authorized to execute same by Resolution No. 15-____, as approvedby the City Council on June 10, 2015, and by the LFAMC, acting through their dulyauthorized officials.
APPROVED AS TO FORM:WARREN M.S. ERNST, City Attorney
CITY OF DALLASA.C. GONZALEZ, City Manager
By: ___________________________Robert SimsAssistant City Attorney
By:____________________________Ryan EvansFirst Assistant City Manager
[CITY SEAL]
LOVE FIELD AIRPORT MODERNIZATION CORPORATION
By: _______________________________________President, Board of Directors
ATTEST:
By: _______________________________________ [SEAL]Secretary, Board of Directors

AGREEMENT BETWEEN THE CITY AND THE LFAMC A-1
EXHIBIT A
The Project consists of the following elements:
The design and construction of a new parking garage (Garage C) located adjacent to theticketing lobby at Love Field. Garage C is designed to contain nine levels, two levelsbelow grade and seven levels above grade. Garage C is expected to have approximately5,000 parking spaces.
The redevelopment of the cell phone lot, a surface parking lot to accommodate short-termparking for persons with vehicles waiting to pick up passengers, including modificationto curbs and site drainage structures, storm water piping, pole mounted lighting, surfacelot paving repairs, and modifications, pavement markings, way-finding signage, anoutdoor Flight Information Display System, and landscaping.
Demolition of the East Satellite Building.
Relocation of utility lines around the footprint of Garage C.
A Parking Revenue Control System to be installed in parking garages A, B and C.
A Parking Guidance System to be installed in parking garages A, B and C.
Development of offices for the Dallas Police Department and other law enforcementfunctions, the Program Management Team at Love Field, the Airport CommunicationsCenter, the Aviation Department’s Operations Division, the Aviation Department’sInformation Technology Division, the Love Field badging office, all being relocated as aresult of the construction of Garage C.

[THIS PAGE INTENTIONALLY LEFT BLANK]

APPENDIX F
BOND RESOLUTION

[THIS PAGE INTENTIONALLY LEFT BLANK]

RESOLUTION AUTHORIZING THE ISSUANCE OF LOVE FIELD AIRPORTMODERNIZATIONCORPORATIONGENERALAIRPORTREVENUEBONDS, SERIES2015, IN AN AGGREGATE PRINCIPAL AMOUNT NOT TO EXCEED $130,000,000;APPROVING A BOND PURCHASE CONTRACT AND OTHER CONTRACTDOCUMENTS RELATINGTO THE SERIES 2015 BONDS; ANDCONTAININGOTHERPROVISIONS RELATED THERETO
BE IT RESOLVEDBYTHEBOARDOFDIRECTORSOF THE LOVEFIELDAIRPORTMODERNIZATION CORPORATION:
ARTICLE I
RECITALS
WHEREAS, the CityCouncil of the City of Dallas (the “City”) authorized the creation of theLove Field Airport Modernization Corporation (the “Corporation”) as a local governmentcorporation for the public purpose of aiding, assisting, and acting on behalf of the City in theperformance of its governmental functions to promote the City, including the development of thegeographic areas of the City included at or in the vicinity of Love Field, a public airport owned andoperated by the City (“Love Field”); and
WHEREAS, the Corporation has heretofore issued bonds to finance components of the LoveField Modernization Project (the “ALFMP”), and the issuance of such bonds was approved by theCity Council; and
WHEREAS, the City and the Board of Directors of the Corporation have determined that itwill be advisable to have the Corporation assist the City in financing a parking garage containingapproximately 5,000 parking spaces and related infrastructure, together with the associated airportimprovements, tasks and activities necessary for the design and construction of the public parkinggarage located at Love Field, as more fully described in Exhibit A to the hereinafter describedProject Financing Agreement (the “Project”); and
WHEREAS, to that end, the City and the Corporation have negotiated and will authorize theexecution of a Project Financing Agreement, dated as of July 1, 2015 (the “Project FinancingAgreement”), to provide for the design, construction and financing of the Project; and
WHEREAS, the Project is a component of the LFMP; and
WHEREAS, as permitted by Chapter 431, Texas Transportation Code, as amended, theCorporation desires to issue bonds upon the terms and conditions and for the purposes hereinprovided.
F-1

ARTICLE II
DEFINITIONS AND INTERPRETATIONS
Section 2.1: Definitions. In this Resolution, the following terms shall have the followingmeanings, unless the context clearly indicates otherwise. Terms not defined herein shall have themeanings assigned to such terms in the Indenture:
The term "Audit" shall mean the comprehensive annual financial report of the City.
The term "Authorized Denominations" shall mean $5,000 or any integral multiple of $5,000.
The term "Authorized Representative" shall mean the President or the Vice President of theCorporation, or any other person designated by the Board of Directors of the Corporation to act insuch capacity. For purposes of executing the Purchase Contract, the term "AuthorizedRepresentative" includes the Chief Financial Officer of the City.
The term "Comptroller" shall mean the Comptroller of Public Accounts of the State of Texas.
The term "Dated Date" shall mean the date of the Series 2015 Bonds as established in thePurchase Contract.
The term "Defeasance Securities" shall mean (i) Federal Securities, (ii) noncallableobligations of an agency or instrumentality of the United States of America, including obligationsthat are unconditionally guaranteed or insured by the agency or instrumentality and that, on the datethe Corporation adopts or approves proceedings authorizing the issuance of refunding bonds or, ifsuch defeasance is not in connection with the issuance of refunding bonds, on the date theCorporation provides for the funding of an escrow to effect the defeasance of Parity Bonds, are ratedas to investment quality by a nationally-recognized investment rating firm not less than "AAA" or itsequivalent, (iii) noncallable obligations of a state or an agency or a county, municipality, or otherpolitical subdivision of a state that have been refunded and that, on the date the Corporation adoptsor approves proceedings authorizing the issuance of refunding bonds or, if such defeasance is not inconnection with the issuance of refunding bonds, on the date the Corporation provides for thefunding of an escrow to effect the defeasance of Parity Bonds, are rated as to investment quality by anationally-recognized investment rating firm not less than "AAA" or its equivalent, or (iv) any otherthen authorized securities or obligations that may be used to defease obligations such as the ParityBonds under the then applicable laws of the State of Texas.
The term "Designated Trust Office" shall mean the designated corporate trust office of theRegistrar, which, as of the date of adoption of this Resolution, is located in Dallas, Texas.
The term "EMMA" shall mean the Electronic Municipal Market Access system administered
F-2

by the MSRB.
The term "Federal Securities" shall mean direct, noncallable obligations of the United Statesof America, including obligations that are unconditionally guaranteed by the United States ofAmerica.
The term "Indenture" shall mean the Indenture of Trust dated as of July 1, 2015 between theCorporation and Wells Fargo Bank, National Association, as trustee, and its successors in thatcapacity, and all amendments and supplements thereto.
The term "Issuance Date" shall mean the date on which the Series 2015 Bonds areauthenticated by the Registrar and delivered to and paid for by the Underwriters.
The term "Lease" has the meaning given said term in the Project Financing Agreement.
The term "Love Field" has the meaning given said term in the recitals to this Resolution.
The term "MSRB" shall mean the Municipal Securities Rulemaking Board.
The terms "Paying Agent", "Paying Agent/Registrar" and "Registrar" shall mean Wells FargoBank, National Association, and its successors in that capacity.
The term "Project" shall mean the design and construction of a parking garage containingapproximately 5,000 spaces and related infrastructure and improvements, located at Love Field, asmore fully described in Exhibit A to the Project Financing Agreement, to be financed with theproceeds of bonds, including the Series 2015 Bonds.
The term "Project Financing Agreement" shall mean Project Financing Agreement, dated asof July 1, 2015, between the City and the Corporation, to provide for the design, construction andfinancing of the Project.
The term "Purchase Contract" shall mean the Bond Purchase Agreement between theCorporation and the Underwriters, executed in connection with the sale of the Series 2015 Bonds.
The term "Record Date" shall mean, for any Interest Payment Date, the last Business Day ofthe month next preceding each Interest Payment Date.
The term "Resolution" or "Bond Resolution" shall mean this resolution, and all amendmentshereof and supplements hereto.
The term "Rule" means SEC Rule 15c2-12, as amended from time to time.
The term "SEC" means the United States Securities and Exchange Commission.
F-3

The term "Series 2015 Bonds" or "Bonds" shall mean the Corporation's General AirportRevenue Bonds, Series 2015, authorized by this Resolution.
The term "Special Record Date" has the meaning given said term in the FORM OF BONDset forth in Exhibit A to this Resolution.
The term "Underwriters" shall mean Stern Brothers & Co., as senior managing underwriter,and such other investment banking firms named in the Purchase Contract.
Section 2.2: Interpretations. All terms defined herein and all pronouns used in thisResolution shall be deemed to apply equally to singular and plural and to all genders. The titles andheadings of the articles and sections of this Resolution have been inserted for convenience ofreference only and are not to be considered a part hereof and shall not in any way modify or restrictany of the terms or provisions hereof. References to any constitutional, statutory or regulatoryprovision means such provision as it exists on the date this Resolution is adopted by the Corporationand any future amendments thereto or successor provisions thereof. This Resolution and all theterms and provisions hereof shall be liberally construed to effectuate the purposes set forth hereinand to sustain the validity of the Parity Bonds and the validity of the lien on and pledge of thePledged Revenues to secure the payment of the Parity Bonds.
ARTICLE III
TERMS OF THE BONDS
Section 3.1: Maximum Amount, Purpose, Authorization. The Series 2015 Bonds shall beissued in fully registered form, without coupons, in an aggregate principal amount not to exceed$130,000,000 for the purpose of (1) paying the costs of the Project, (2) funding capitalized intereston the Series 2015 Bonds during construction and for up to one year after the construction period,(3) making an initial deposit to the Reserve Fund and (4) paying Costs of Issuance, all under andpursuant to the authority of the Act and all other applicable law.
Section 3.2: Sale of the Series 2015 Bonds. The sale of the Series 2015 Bonds to theUnderwriters, at the price, terms and conditions set forth in the Purchase Contract, is herebyapproved. The Authorized Representative is hereby authorized to act for and on behalf of theCorporation in connection with the issuance and sale of the Series 2015 Bonds and pursuant to suchauthority may execute and deliver the Purchase Contract, substantially in the form attached to thisResolution. The Authorized Representative's approval of the Purchase Contract shall beconclusively evidenced by the execution thereof. The execution of the Purchase Contract shall besubject to the terms of Section 7.1 hereof.
Section 3.3: Execution of Series 2015 Bonds. The Series 2015 Bonds shall be signed on
F-4

behalf of the Corporation by the President and countersigned by the Secretary by their manual,lithographed, or facsimile signatures. Such facsimile signatures on the Series 2015 Bonds shall havethe same effect as if each of the Series 2015 Bonds had been signed manually and in person by eachof said officers. If any officer of the Corporation whose manual or facsimile signature shall appearon the Series 2015 Bonds shall cease to be such officer before the authentication of such Series 2015Bonds or before the delivery of such Series 2015 Bonds, such manual or facsimile signature shallnevertheless be valid and sufficient for all purposes as if such officer had remained in such office.
Section 3.4: Approval by Attorney General; Registration by Comptroller. The Series 2015Bonds to be initially issued shall be delivered to the Attorney General of Texas for examination andapproval and shall be registered by the Comptroller. The manually executed registration certificateof the Comptroller substantially in the form provided in Exhibit A to this Resolution shall be affixedor attached to the Series 2015 Bonds to be initially issued and delivered to the Underwriters.
Section 3.5: Authentication. Except for the Series 2015 Bonds to be initially issued, whichneed not be authenticated by an authorized representative of the Registrar, only such Series 2015Bonds as shall bear thereon a certificate of authentication substantially in the form provided inExhibit A to this Resolution, manually executed by an authorized representative of the Registrar,shall be entitled to the benefits of this Resolution or shall be valid or obligatory for any purpose.Such duly executed certificate of authentication shall be conclusive evidence that the Series 2015Bond so authenticated was delivered by the Registrar hereunder.
The Registrar, when it authenticates a Series 2015 Bond, shall cause the Dated Date to bestamped, typed or imprinted on such Series 2015 Bond. Series 2015 Bonds issued on transfer of orin exchange for other Series 2015 Bonds shall bear the same Dated Date as the Series 2015 Bond orSeries 2015 Bonds presented for transfer or exchange.
Section 3.6. Payment of Principal and Interest. The Registrar is hereby appointed as theregistrar and paying agent for the Series 2015 Bonds. The principal of the Series 2015 Bonds shallbe payable, without exchange or collection charges, in any coin or currency of the United States ofAmerica which, on the date of payment, is legal tender for the payment of debts due the UnitedStates of America, upon their presentation and surrender as they respectively become due andpayable, whether at maturity or by prior redemption, at the Designated Trust Office. The interest oneach Series 2015 Bond shall be payable by check payable on the Interest Payment Date, mailed bythe Registrar on or before each Interest Payment Date to the Owner of record as of the Record Date,to the address of such Owner as shown on the Register, or by such other method, acceptable to theRegistrar, requested by and at the risk and expense of the Owner.
If the date for the payment of principal or interest on any Series 2015 Bond is not a BusinessDay, then the date for such payment shall be the next succeeding Business Day, and payment on suchdate shall have the same force and effect as if made on the original date such payment was due.
Section 3.7. Successor Registrars. The Corporation covenants that at all times while any
F-5

Series 2015 Bond is Outstanding it will provide a commercial bank or trust company organizedunder the laws of the State of Texas or other entity duly qualified and legally authorized to act asRegistrar for the Series 2015 Bonds. The Corporation reserves the right to change the Registrar forthe Series 2015 Bonds on not less than sixty (60) days written notice to the Registrar, so long as anysuch notice is effective not less than sixty (60) days prior to the next succeeding Principal InstallmentPayment Date or Interest Payment Date on the Series 2015 Bonds. Promptly upon the appointmentof any successor Registrar, the previous Registrar shall deliver the Register or a copy thereof to thenew Registrar, and the new Registrar shall notify each Owner, by United States mail, first classpostage prepaid, of such change and of the address of the new Registrar. Each Registrar hereunder,by acting in that capacity, shall be deemed to have agreed to the provisions of this Section.
Section 3.8. Special Record Date. If interest on any Series 2015 Bond is not paid on anyInterest Payment Date and continues unpaid for thirty (30) days thereafter, the Registrar shallestablish a new record date for the payment of such interest, to be known as a "Special Record Date".The Registrar shall establish a Special Record Date when funds to make such interest payment arereceived from or on behalf of the Corporation. Such Special Record Date shall be fifteen (15) daysprior to the date fixed for payment of such past due interest, and notice of the date of payment andthe Special Record Date shall be sent by United States mail, first class, postage prepaid, not laterthan five (5) days prior to the Special Record Date, to each Owner or record of an affected Series2015 Bond as of the close of business on the day prior to the mailing of such notice.
Section 3.9. Ownership; Unclaimed Principal and Interest. Subject to the further provisionsof this Section, the Corporation, the Registrar and any other person may treat the person in whosename any Series 2015 Bond is registered as the absolute Owner of such Series 2015 Bond for thepurpose of making and receiving payment of the principal of or interest on such Series 2015 Bond,and for all other purposes, whether such Series 2015 Bond is overdue, and neither the Corporationnor the Registrar shall be bound by any notice or knowledge to the contrary. All payments made tothe person deemed to be the Owner of any Series 2015 Bond in accordance with this Section 3.9shall be valid and effectual and shall discharge the liability of the Corporation and the Registrar uponsuch Series 2015 Bond to the extent of the sums paid.
Amounts held by the Registrar which represent principal of and interest on the Series 2015Bonds remaining unclaimed by the Owner after the expiration of three (3) years from the date suchamounts have become due and payable shall be reported and disposed of by the Registrar inaccordance with the applicable provisions of Texas law including, to the extent applicable, Title 6 ofthe Texas Property Code.
Section 3.10. Registration, Transfer, and Exchange. So long as any Series 2015 Bondremains Outstanding, the Registrar shall keep the Register at the Designated Trust Office and,subject to such reasonable regulations as it may prescribe, the Registrar shall provide for theregistration and transfer of Series 2015 Bonds in accordance with the terms of this Resolution.
Each Series 2015 Bond shall be transferable only upon the presentation and surrender thereofat the Designated Trust Office of the Registrar, duly endorsed for transfer, or accompanied by anassignment duly executed by the Registered Owner or his authorized representative in form
F-6

satisfactory to the Registrar. Upon due presentation of any Series 2015 Bond in proper form fortransfer, the Registrar shall authenticate and deliver in exchange therefor, within three (3) BusinessDays after such presentation, a new Series 2015 Bond or Series 2015 Bonds, registered in the nameof the transferee or transferees, in Authorized Denominations and of the same maturity, aggregateprincipal amount, and Dated Date, and bearing interest at the same rate as the Series 2015 Bond orSeries 2015 Bonds so presented.
All Series 2015 Bonds shall be exchangeable upon presentation and surrender thereof at theDesignated Trust Office of the Registrar for a Series 2015 Bond or Series 2015 Bonds of the samematurity, Dated Date, and interest rate and in any Authorized Denomination, in an aggregate amountequal to the unpaid principal amount of the Series 2015 Bond or Series 2015 Bonds presented forexchange. The Registrar shall be and is hereby authorized to authenticate and deliver exchangeSeries 2015 Bonds in accordance with the provisions of this Section 3.10. Each Series 2015 Bonddelivered in accordance with this Section 3.10 shall be entitled to the benefits and security of thisResolution to the same extent as the Series 2015 Bond or Series 2015 Bonds in lieu of which suchSeries 2015 Bond is delivered.
The Corporation or the Registrar may require the Owner of any Series 2015 Bond to pay asum sufficient to cover any tax or other governmental charge that may be imposed in connectionwith the transfer or exchange of such Series 2015 Bond. Any fee or charge of the Registrar for suchtransfer or exchange shall be paid by the Corporation.
The Registrar shall not be required to transfer or exchange any Series 2015 Bond during theperiod beginning on a Record Date or a Special Record Date and ending on the next succeedingInterest Payment Date or to transfer or exchange any Series 2015 Bond called for redemption duringthe period beginning thirty days prior to the date fixed for redemption and ending on the date fixedfor redemption; provided, however, that this limitation shall not apply to the exchange by the Ownerof the unredeemed portion of a Series 2015 Bond called for redemption in part.
Section 3.11. Cancellation of Series 2015 Bonds. All Series 2015 Bonds paid or redeemedin accordance with this Resolution, and all Series 2015 Bonds in lieu of which exchange Series 2015Bonds or replacement Series 2015 Bonds are authenticated and delivered in accordance herewith,shall be canceled and thereafter treated in accordance with the Registrar's document retentionpolicies.
Section 3.12. Mutilated, Lost, or Stolen Series 2015 Bonds. Upon the presentation andsurrender to the Registrar of a mutilated Series 2015 Bond, the Registrar shall authenticate anddeliver in exchange therefor a replacement Series 2015 Bond of like maturity, Dated Date, interestrate and principal amount, bearing a number not contemporaneously Outstanding. The Corporationor the Registrar may require the Owner of such Series 2015 Bond to pay a sum sufficient to coverany tax or other governmental charge that may be imposed in connection therewith and any otherexpenses connected therewith, including the fees and expenses of the Registrar.
If any Series 2015 Bond is lost, apparently destroyed, or wrongfully taken, the Corporation,pursuant to the applicable laws of the State of Texas and in the absence of notice or knowledge thatsuch Series 2015 Bond has been acquired by a bona fide purchaser, shall execute and the Registrar
F-7

shall authenticate and deliver a replacement Series 2015 Bond of like maturity, Dated Date, interestrate and principal amount, bearing a number not contemporaneously Outstanding, provided that theOwner thereof shall have:
(1) furnished to the Registrar satisfactory evidence of the ownership of and thecircumstances of the loss, destruction or theft of such Series 2015 Bond;
(2) furnished such security or indemnity as may be required by the Registrar tosave it and the Corporation harmless;
(3) paid all expenses and charges in connection therewith, including, but notlimited to, printing costs, legal fees, fees of the Registrar and any tax or othergovernmental charge that may be imposed; and
(4) met any other reasonable requirements of the Corporation and the Registrar.
If, after the delivery of such replacement Series 2015 Bond, a bona fide purchaser of the originalSeries 2015 Bond in lieu of which such replacement Series 2015 Bond was issued presents forpayment such original Series 2015 Bond, the Corporation and the Registrar shall be entitled torecover such replacement Series 2015 Bond from the person to whom it was delivered or any persontaking therefrom, except a bona fide purchaser, and shall be entitled to recover upon the security orindemnity provided therefor to the extent of any loss, damage, cost or expense incurred by theCorporation or the Registrar in connection therewith.
If any such mutilated, lost, apparently destroyed or wrongfully taken Series 2015 Bond hasbecome or is about to become due and payable, the Corporation in its discretion may, instead ofissuing a replacement Series 2015 Bond, authorize the Registrar to pay such Series 2015 Bond.
Each replacement Series 2015 Bond delivered in accordance with this Section 3.12 shall beentitled to the benefits and security of this Resolution to the same extent as the Series 2015 Bond orSeries 2015 Bonds in lieu of which such replacement Series 2015 Bond is delivered.
Section 3.13: Redemption. The Series 2015 Bonds are subject to redemption under theconditions, on the dates, and for the redemption prices set forth in the Purchase Contract. If less thanall of the Series 2015 Bonds are to be redeemed, the Corporation shall determine the particular Series2015 Bonds or portions thereof to be redeemed.
Principal amounts may be redeemed only in integral multiples of $5,000. Upon surrender ofany Series 2015 Bond for redemption in part, the Registrar, in accordance with Section 3.10 hereof,shall authenticate and deliver in exchange therefor a Series 2015 Bond or Series 2015 Bonds of likematurity, Dated Date, and interest rate in an aggregate principal amount equal to the unredeemedportion of the Series 2015 Bond so surrendered.
F-8

Unless waived by the Owner, notice of any redemption identifying the Series 2015 Bonds tobe redeemed in whole or in part shall be given by the Registrar at least thirty days prior to the datefixed for redemption by sending written notice by first class mail, postage prepaid, to the Owner ofeach Series 2015 Bond to be redeemed in whole or in part at the address shown on the Register.Such notices shall state the redemption date, the redemption price, the place at which Series 2015Bonds are to be surrendered for payment and, if less than all Series 2015 Bonds Outstanding of aparticular maturity are to be redeemed, the numbers of the Series 2015 Bonds or portions thereof ofsuch maturity to be redeemed. Any notice given as provided in this Section 3.13 shall beconclusively presumed to have been duly given, whether the Owner receives such notice. By thedate fixed for redemption, due provision shall be made with the Registrar for payment of theredemption price of the Series 2015 Bonds or portions thereof to be redeemed, plus accrued interestto the date fixed for redemption. When Series 2015 Bonds have been called for redemption in wholeor in part and due provision has been made to redeem the same as herein provided, the Series 2015Bonds or portions thereof so redeemed shall no longer be regarded as Outstanding except for thepurpose of receiving payment solely from the funds so provided for redemption, and the rights of theOwners to collect interest which would otherwise accrue after the redemption date on any Series2015 Bond or portion thereof called for redemption shall terminate on the date fixed for redemption.
The foregoing notwithstanding, any redemption of Series 2015 Bonds at the option of theCorporation may be made conditional, upon the occurrence of certain conditions as set forth in theForm of Bond as set forth in Exhibit A to this Resolution.
Should ownership of the Series 2015 Bonds be established in accordance with the book-entry-only system of The Depository Trust Company ("DTC"), the Paying Agent for the Series 2015Bonds shall notify DTC that in the exercise by DTC of the selection of Series 2015 Bonds forredemption, the Series 2015 Bonds shall be so selected by DTC in such a manner that no beneficialowner of Series 2015 Bonds shall own less than $100,000 in principal amount of any Series 2015Bonds of any one maturity.
Section 3.14: Limited Obligations. THE SERIES 2015 BONDS ARE A LIMITEDOBLIGATION OF THE CORPORATION, PAYABLE SOLELY OUT OF THE TRUST ESTATE,WHICH IS THE SOLE ASSET OF THE CORPORATION PLEDGED THEREFOR. THE SERIES2015 BONDS ARE OBLIGATIONS SOLELY OF THE CORPORATION AND DO NOTCONSTITUTE, WITHIN THE MEANING OF ANY STATUTORY OR CONSTITUTIONALPROVISION, AN INDEBTEDNESS, AN OBLIGATION OR A LOAN OF CREDIT OF THECITY, THE STATE OF TEXAS, OR ANY OTHER MUNICIPALITY, COUNTY, OR OTHERMUNICIPAL OR POLITICAL CORPORATION OR SUBDIVISION OF THE STATE OF TEXAS.THE CITY IS NOT OBLIGATED TO MAKE PAYMENTS IN SUPPORT OF THE DEBTSERVICE ON THE SERIES 2015 BONDS FROM ANY SOURCES, OTHER THAN THE NETREVENUES AS DESCRIBED IN THE INDENTURE.
F-9

ARTICLE IV
FORM OF SERIES 2015 BONDS AND CERTIFICATES
Section 4.1: Forms. The form of the Series 2015 Bonds, including the form of theRegistrar's authentication certificate, the form of assignment, and the form of the Comptroller'sRegistration Certificate for the Series 2015 Bonds to be initially issued, shall be in substantially theform as set forth in Exhibit A to this Resolution.
Section 4.2: Legal Opinion; Cusip Numbers; Bond Insurance. The approving opinion ofBond Counsel and CUSIP Numbers may be printed on the Series 2015 Bonds, but errors oromissions in the printing of such opinion or such numbers shall have no effect on the validity of theSeries 2015 Bonds. If bond insurance is obtained by the Underwriters, the Series 2015 Bonds maybear an appropriate legend as provided by the insurer.
ARTICLE V
ADDITIONAL BONDS
Section 5.1: Additional Parity Bonds. The Corporation reserves the right to issue, for anylawful purpose (including the refunding of any previously issued Parity Bonds), one or more series ofAdditional Parity Bonds payable from and secured by a first lien on the Pledged Revenues, on aparity with the Series 2015 Bonds, and any previously issued Additional Parity Bonds; provided,however, that Additional Parity Bonds may be issued only in accordance with the provisions ofArticle III of the Indenture.
Section 5.2: Subordinate Lien Obligations. The Corporation reserves the right to issue, forany lawful purpose, Subordinate Lien Obligations secured in whole or in part by liens on the PledgedRevenues that are junior and subordinate to the lien on Pledged Revenues securing payment of theParity Bonds. Such Subordinate Lien Obligations may be further secured by any other source ofpayment lawfully available for such purposes.
ARTICLE VI
GENERAL COVENANTS
Section 6.1: Punctual Payment of Parity Bonds. The Corporation will punctually pay orcause to be paid the interest on and principal of all Parity Bonds according to the terms thereof andwill faithfully do and perform, and at all times fully observe, any and all covenants, undertakings,stipulations and provisions contained in this Resolution and in any resolution authorizing theissuance of Additional Parity Bonds.
F-10

Section 6.2: Accounts, Records, and Audits. So long as any Parity Bond remainsOutstanding, the Corporation covenants and agrees that it will maintain a proper and completesystem of records and accounts pertaining to the Corporation in which full, true and proper entrieswill be made of all dealings, transactions, business and affairs which in any way affect or pertain tothe Corporation or the Pledged Revenues. The Audit shall be prepared by an independent certifiedpublic accountant or independent firm of certified public accountants after the close of each FiscalYear. Information relating to Love Field and the Net Revenues will be incorporated as part of theAudit. All expenses incurred in preparing Audits shall be payable by the City.
Section 6.3: Pledge and Encumbrance of Pledged Revenues. (a) The Corporation covenantsand represents that it has the lawful power to create a lien on and to pledge the Pledged Revenues tosecure the payment of the Parity Bonds and has lawfully exercised such power under the Constitutionand laws of the State of Texas. The Corporation further covenants and represents that, other than tothe payment of the Parity Bonds, the Pledged Revenues are not and will not be made subject to anyother lien pledge or encumbrance to secure the payment of any debt or obligation of the Corporation,unless such lien, pledge or encumbrance is junior and subordinate to the lien and pledge securingpayment of the Parity Bonds.
(b) Pursuant to the terms of the Project Financing Agreement, the City is obligated to makeavailable to the Corporation Net Revenues, on the dates and in the manner provided in the ProjectFinancing Agreement, in amounts sufficient to pay the principal of and interest on outstanding ParityBonds, to restore any deficiency in the Reserve Fund, and to pay the fees and expenses of the Trusteeand the Paying Agent/Registrar incurred in connection with the administration of the Trust Estateand the payment of debt service on the Parity Bonds. The Corporation has assigned to the Trustee itsrights, title and interests in the Net Revenues, and will cause the Trustee to deposit Net Revenues soreceived to the credit of the Pledged Revenue Fund and used in accordance with the terms of theIndenture.
(c) By approving this Resolution, the City agrees that for so long as any Parity Bond isOutstanding, commencing on the Issuance Date, the City will not amend the Lease or the ProjectFinancing Agreement in a manner that is materially adverse to the interests of the owners of theParity Bonds.
Section 6.4: Owners' Remedies. This Resolution shall constitute a contract between theCorporation and the Owners of the Parity Bonds from time to time Outstanding and this Resolutionshall be and remain irrepealable until the Parity Bonds and the interest thereon shall be fully paid ordischarged or provision therefor shall have been made as provided herein. In the event of a default inthe payment of the principal of or interest on any of the Parity Bonds or a default in the performanceof any duty or covenant provided by law or in this Resolution, the Owner or Owners of any of theParity Bonds may pursue all legal remedies afforded by the Constitution and laws of the State ofTexas to compel the Corporation to remedy such default and to prevent further default or defaults.Without in any way limiting the generality of the foregoing, it is expressly provided that any Ownerof any of the Parity Bonds may at law or in equity, by suit, action, mandamus, or other proceedings,
F-11
enforce and compel performance of all duties required to be performed by the Corporation under thisResolution, the deposit of the Pledged Revenues into the special funds herein provided and inaccordance with the terms of the Indenture, and the application of such Pledged Revenues in themanner required in this Resolution. The foregoing notwithstanding, acceleration of the Parity Bondsis not an available remedy. The sole source of the Corporation available for the payment of debtservice on the Parity Bonds is and shall be the Pledged Revenues.
Section 6.5: Discharge by Deposit. (a) That any Parity Bond and the interest thereon shallbe deemed to be paid, retired and no longer Outstanding (a "Defeased Obligation"), except to theextent hereinafter provided in this Section 6.5, when payment of the principal of such Parity Bond,plus interest thereon to the due date (whether such due date be by reason of maturity or otherwise)either (i) shall have been made or caused to be made in accordance with the terms thereof, or (ii)shall have been provided for on or before such due date by irrevocably depositing with or makingavailable to the Paying Agent/Registrar in accordance with an escrow agreement or other similarinstrument (the "Future Escrow Agreement") for such payment (1) lawful money of the United Statesof America sufficient to make such payment or (2) Defeasance Securities that mature as to principaland interest in such amounts and at such times as will insure the availability, without reinvestment,of sufficient money to provide for such payment, and when proper arrangements have been made bythe Board with the Trustee for the payment of its services until all Defeased Obligations shall havebecome due and payable. At such time as a Parity Bond shall be deemed to be a Defeased Obligationhereunder, as aforesaid, such Parity Bond and the interest thereon shall no longer be secured by,payable from, or entitled to the benefits of, the Debt Service Fund and the Reserve Fund, and suchprincipal and interest shall be payable solely from such money or Defeasance Securities.Notwithstanding any other provision of this Resolution to the contrary, it is hereby provided that anydetermination not to redeem Defeased Obligations that is made in conjunction with the paymentarrangements specified in clauses (i) or (ii) above shall not be irrevocable; provided, that in theproceedings providing for such payment arrangements, the Corporation (1) expressly reserves theright to call the Defeased Obligations for redemption; (2) gives notice of the reservation of that rightto the owners of the Defeased Obligations immediately following the making of the paymentarrangements; and (3) directs that notice of the reservation be included in any redemption notices thatit authorizes.
(b) Any moneys so deposited with the Trustee may be invested at the written direction ofthe Corporation in Defeasance Securities, maturing in the amounts and times as hereinbefore setforth, and all income from such Defeasance Securities received by the Trustee that is not required forthe payment of the Bonds and interest thereon, with respect to which such money has been sodeposited, shall be turned over to the Corporation, or deposited as directed in writing by theCorporation. Any Future Escrow Agreement pursuant to which the money and/or DefeasanceSecurities are held for the payment of Defeased Obligations may contain provisions permitting theinvestment or reinvestment of such moneys in Defeasance Securities or the substitution of otherDefeasance Securities upon the satisfaction of the requirements specified in clauses (i) or (ii) ofsubsection (a) of this Section. All income from such Defeasance Securities received by the Trusteewhich is not required for the payment of the Defeased Obligations, with respect to which such money
F-12

has been so deposited, shall be remitted to the Corporation or deposited as directed in writing by theCorporation.
(c) The Corporation covenants that no deposit will be made or accepted under clause (ii)of subsection (a) of this Section and no use will be made of any such deposit which would cause theBonds to be treated as "arbitrage bonds" within the meaning of section 148 of the Code.
(d) Notwithstanding any other provisions of this Resolution, all money or DefeasanceSecurities set aside and held in trust pursuant to the provisions of this Section for the payment of theBonds, the redemption premium, if any, and interest thereon, shall be applied to and used for thepayment of such Bonds, the redemption premium, if any, and interest thereon.
Section 6.6: Registrar and Trustee May Own Parity Bonds. The Registrar and Trustee for theParity Bonds, in their individual or any other capacity, may become holders or pledges of the ParityBonds with the same rights they would have if they were not the Registrar or Trustee.
Section 6.7: No Recourse against Corporation Officials. No recourse shall be had for thepayment of principal of or interest on any Parity Bonds or for any claim based thereon or on thisResolution against any official of the Corporation or any person executing any Parity Bonds. Nomember of the Board of Directors of the Corporation or any officer, agent, employee orrepresentative of the Corporation in his or her individual capacity, nor the officers, agents, employeesor representatives of the Corporation nor any person executing the Series 2015 Bonds shall bepersonally liable thereon or be subject to any personal liability or accountability by reason of theissuance thereof, whether by virtue of any constitution, statute or rule of law, or by the enforcementof any assessment or penalty, or otherwise, all such liability being expressly released and waived as acondition of and in consideration for the adoption of this Resolution and the issuance of the Series2015 Bonds.
ARTICLE VII
PROVISIONS CONCERNING SALE ANDAPPLICATION OF PROCEEDS OF SERIES 2015 BONDS
Section 7.1: Execution of Documents to Effect Sale of Series 2015 Bonds. An AuthorizedRepresentative and other appropriate officers, agents and representatives of the Corporation arehereby authorized to do any and all things necessary or desirable to provide for the issuance anddelivery of the Series 2015 Bonds. In respect thereto, the Authorized Representative may executethe Purchase Contract with the Underwriters to effect the sale of the Series 2015 Bonds. In thePurchase Contract, the Authorized Representative shall determine, based upon advice provided bythe Corporation's financial advisors, that acceptance of the purchase price for the Series 2015 Bondsis in the best interests of the Corporation. The Authorized Representative is authorized to determineand fix the date of the Series 2015 Bonds, any additional or different designation or title by which theSeries 2015 Bonds shall be known, the aggregate principal amount of the Series 2015 Bonds, the
F-13

date of delivery of the Series 2015 Bonds, the price at which the Series 2015 Bonds will be sold, theyears in which the Series 2015 Bonds will mature, the principal amount of Series 2015 Bonds tomature in each of such years, the rate or rates of interest to be borne by or accrue on each suchmaturity, the interest payment periods, the dates, price, and terms upon and at which the Bonds shallbe subject to redemption prior to maturity at the option of the Corporation, as well as any mandatorysinking fund redemption provisions, and all other matters relating to the issuance, sale, and deliveryof the Series 2015 Bonds; provided, however, the Authorized Representative shall not execute thePurchase Contract if (a) the aggregate principal amount of the Series 2015 Bonds exceeds$130,000,000, (b) the price to be paid for the Series 2015 Bonds is less than 95% of the aggregateoriginal principal amount thereof, plus accrued interest, if any, thereon from the date of theirdelivery, (c) any of the Series 2015 Bonds shall bear interest at a rate greater than 8.00% per annum,and (d) the Series 2015 Bonds shall not have been assigned a rating of at least A- or its equivalent bya nationally recognized rating agency. The authority of the Authorized Representative to execute aPurchase Contract to effect the sale of the Series 2015 Bonds shall expire at 5:00 p.m. on Thursday,December 31, 2015.
Section 7.2: Application of Proceeds. Proceeds from the sale of the Series 2015 Bonds shall,promptly upon receipt by the Trustee, be applied in the manner provided for in a certificate executedby an Authorized Representative or the Corporation's financial advisor, acting on behalf of theCorporation.
ARTICLE VIII
TAX EXEMPTION
Section 8.1: General Tax Covenants. The Corporation covenants to take any action toassure, or refrain from any action which would adversely affect, the treatment of the Series 2015Bonds as obligations described in section 103 of the Code, the interest on which is not includable inthe "gross income" of the holder for purposes of federal income taxation. The Corporation covenantsas follows:
(a) to take such action or refrain from such action which would result in theSeries 2015 Bonds not being "exempt facility bonds", as defined in section 142(a) of theCode, at least 95 percent of the proceeds of which are used to provide airport facilities(within the meaning of section 142(a) of the Code);
(b) to take such action to assure at all times while the Series 2015 Bonds remainoutstanding, the facilities, directly or indirectly, financed with the proceeds thereof will beowned by a governmental unit;
(c) that no part of the facilities, directly or indirectly, financed with the proceedsof the Series 2015 Bonds will constitute: (A) any lodging facility; (B) any retail facility(including food or beverage facilities) in excess of a size necessary to serve passengers andemployees at the exempt facility; (C) any retail facility (other than parking) for passengers or
F-14

the general public located outside the exempt facility terminal; (D) any office building forindividuals who are not employees of a governmental unit or of the operating authority forthe exempt facility; (E) any industrial park or manufacturing facility; or (F) any residentialreal property for family units;
(d) that the maturity of the Series 2015 Bonds does not exceed 120 percent of theeconomic life of the facilities, directly or indirectly, financed with the proceeds of the Bonds,as more specifically set forth in section 147(b) of the Code;
(e) that fewer than 25 percent of the proceeds of the Series 2015 Bonds will beused for the acquisition of land or an interest in such land, unless such land is acquired fornoise abatement or wetland preservation or the future use of Love Field, and there is no othersignificant use of such land;
(f) to refrain from using any portion of the proceeds of the Series 2015 Bonds,directly or indirectly, to acquire or to replace funds which were used, directly or indirectly, toacquire investment property (as defined in section 148(b)(2) of the Code) which produces amaterially higher yield over the term of the Series 2015 Bonds, other than investmentproperty acquired with:
(1) proceeds of the Series 2015 Bonds invested for a reasonabletemporary period until the proceeds are needed for the purpose for which the Series2015 Bonds are issued;
(2) amounts invested in a bona fide debt service fund, within the meaningof section 1.148-1(b) of the Treasury Regulations; and
(3) amounts deposited in any reasonably required reserve or replacementfund to the extent such amounts do not exceed 10 percent of the proceeds of theSeries 2015 Bonds;
(g) that any property acquired, directly or indirectly, with the proceeds of theSeries 2015 Bonds was not placed-in-service prior to its acquisition unless the provisions ofsection 147(d) of the Code, relating to rehabilitation, are satisfied;
(h) that the costs of issuance to be financed with the proceeds of the Series 2015Bonds do not exceed two percent of the proceeds of the Series 2015 Bonds;
(i) to refrain from taking any action that would result in the Series 2015 Bondsbeing "federally guaranteed" within the meaning of section 149(b) of the Code;
(j) to otherwise restrict the use of the proceeds of the Bonds or amounts treatedas proceeds of the Series 2015 Bonds, as may be necessary, to satisfy the requirements of
F-15

section 148 of the Code (relating to arbitrage);
(k) to create and maintain a Rebate Fund, as required below, to pay to the UnitedStates of America at least once during each five-year period (beginning on the date ofdelivery of the Series 2015 Bonds) an amount that is at least equal to 90 percent of the"Excess Earnings", within the meaning of section 148(f) of the Code, and to pay to theUnited States of America, not later than 60 days after the Series 2015 Bonds have been paidin full, 100 percent of the amount then required to be paid as a result of Excess Earningsunder section 148(f) of the Code; and
(l) to maintain records that will enable the Corporation to fulfill itsresponsibilities under this Section and section 148 of the Code and to retain the records for atleast six years following the final payment of principal and interest on the Series 2015 Bonds.
The Corporation understands that the term "proceeds" includes "disposition proceeds" asdefined in the Treasury Regulations and, in the case of refunding bonds, transferred proceeds (if any)and proceeds of the refunded bonds expended prior to the date of the issuance of the Series 2015Bonds. It is the understanding of the Corporation that the covenants contained in this Resolution areintended to assure compliance with the Code, the Treasury Regulations and any rulings promulgatedby the U.S. Department of the Treasury pursuant to the Code. In the event that regulations or rulingsare hereafter promulgated which modify or expand provisions of the Code, as applicable to the Series2015 Bonds, the Corporation will not be required to comply with any covenant contained herein tothe extent that such failure to comply, in the opinion of nationally-recognized bond counsel, will notadversely affect the exemption from federal income taxation of interest on the Series 2015 Bondsunder section 103 of the Code. In the event that regulations or rulings are hereafter promulgatedwhich impose additional requirements which are applicable to the Series 2015 Bonds, theCorporation agrees to comply with the additional requirements to the extent necessary, in the opinionof nationally-recognized bond counsel, to preserve the exemption from federal income taxation ofinterest on the Series 2015 Bonds under section 103 of the Code. In furtherance of the foregoing, theAuthorized Representative may execute any documents, certificates or other reports required by theCode and to make such elections, on behalf of the Corporation, which may be permitted by the Codeas are consistent with the purpose for the issuance of the Series 2015 Bonds.
In order to facilitate compliance with clause (h) above, a "Rebate Fund" is established andheld by the Corporation for the sole benefit of the United States of America, and such Rebate Fundshall not be subject to the claim of any other person, including without limitation the RegisteredOwners of the Series 2015 Bonds. The Rebate Fund is established for the additional purpose ofcompliance with section 148 of the Code.
Section 8.2: Allocation of, and Limitation on, Expenditures for the Project. The Corporationcovenants to account for on its books and records the expenditure of proceeds from the sale of theSeries 2015 Bonds and any investment earnings thereon to be used for the payment of costs of theProject by allocating proceeds to expenditures within eighteen (18) months of the later of the datethat (a) the expenditure on the Project is made or (b) the Project is completed. The foregoing
F-16

notwithstanding, the Corporation shall not expend such proceeds or investment earnings more thansixty (60) days after the later of (a) the fifth anniversary of the date of delivery of the Series 2015Bonds or (b) the date the Series 2015 Bonds are retired, unless the Corporation obtains an opinion ofnationally-recognized bond counsel substantially to the effect that such expenditure will notadversely affect the tax-exempt status of the Series 2015 Bonds. For purposes of this Section, theCorporation shall not be obligated to comply with this covenant if it obtains an opinion of nationally-recognized bond counsel to the effect that such failure to comply will not adversely affect theexcludability for federal income tax purposes from gross income of the interest.
Section 8.3: Disposition of Project. The Corporation covenants that the property constitutingthe Project will not be sold or otherwise disposed in a transaction resulting in the receipt by theCorporation of cash or other compensation, unless the Corporation obtains an opinion of nationally-recognized bond counsel substantially to the effect that such sale or other disposition will notadversely affect the tax-exempt status of the Series 2015 Bonds. For purposes of this Section, theportion of the property comprising personal property and disposed of in the ordinary course ofbusiness shall not be treated as a transaction resulting in the receipt of cash or other compensation.For purposes of this Section 8.3, the Corporation shall not be obligated to comply with this covenantif it obtains an opinion of nationally-recognized bond counsel to the effect that such failure tocomply will not adversely affect the excludability for federal income tax purposes from gross incomeof the interest on the Series 2015 Bonds.
Section 8.4: Written Procedures. Unless superseded by another action of the City or theCorporation, to ensure compliance with the covenants contained in this Resolution regarding privatebusiness use, remedial action, arbitrage and rebate, the written procedures in Ordinance 28710adopted by the City on August 8, 2012, authorizing the issuance of the City's Waterworks and SewerSystem Revenue Refunding Bonds, Series 2012A, shall apply to the Series 2015 Bonds.
ARTICLE IXCONTINUING DISCLOSURE UNDERTAKING
Section 9.1: Annual Reports. (a) The Corporation shall provide annually to the MSRB,within six months after the end of each Fiscal Year of the City ending in or after 2015, financialinformation and operating data with respect to the City of the general type set forth in Exhibit B tothis Resolution (provided that such information and data is customarily prepared by the City), beingthe information described in Exhibit B (as such information may be amended or supplemented by anAuthorized Representative to conform Exhibit B to the final official statement prepared inconnection with the sale of the Series 2015 Bonds). Any financial statements so to be provided shallbe (1) prepared in accordance with the accounting principles described in Exhibit B hereto, or suchother accounting principles as the City may be required to employ from time to time pursuant to statelaw or regulation, and (2) audited, if the City commissions an Audit and the Audit is completedwithin the period during which they must be provided. If the Audit is not complete within suchperiod, then the Corporation shall provide notice that the Audit is not available and provideunaudited financial information of the type described in the numbered tables referenced in Exhibit Bby the required time, and will provide the Audit for the applicable Fiscal Year of the City to the
F-17
MSRB, when and if the audit report on such statements becomes available. Such information shallbe transmitted electronically to the MSRB, in such format as prescribed by the MSRB.
(b) If the City changes its Fiscal Year, the Corporation will notify the MSRB of the change(and of the date of the new Fiscal Year end) prior to the next date by which the Corporationotherwise would be required to provide financial information and operating data pursuant to thisSection. The financial information and operating data to be provided pursuant to this Section may beset forth in full in one or more documents or may be included by specific reference to any document(including an official statement or other offering document, if it is available from the MSRB) thattheretofore has been provided to the MSRB or filed with the SEC.
Section 9.2: Disclosure Event Notices. The Corporation shall notify the MSRB, of any of thefollowing events with respect to the Series 2015 Bonds, in a timely manner not in excess of tenBusiness Days after the occurrence of the event:
1. Principal and interest payment delinquencies;2. Non-payment related defaults, if material;3. Unscheduled draws on debt service reserves reflecting financial difficulties;4. Unscheduled draws on credit enhancements reflecting financial difficulties;5. Substitution of credit or liquidity providers, or their failure to perform;6. Adverse tax opinions, the issuance by the Internal Revenue Service of proposed or
final determinations of taxability, Notices of Proposed Issue (IRS Form 5701- TEB)or other material notices or determinations with respect to the tax status of the Series2015 Bonds, or other material events affecting the tax status of the Series 2015Bonds;
7. Modifications to rights of holders of the Series 2015 Bonds, if material;8. Series 2015 Bond calls, if material, and tender offers;9. Defeasances;10. Release, substitution, or sale of property securing repayment of the Series 2015
Bonds, if material;11. Rating changes;12. Bankruptcy, insolvency, receivership or similar event of the Corporation or the City;13. The consummation of a merger, consolidation, or acquisition involving the
Corporation or the City or the sale of all or substantially all of the assets of theCorporation or the City, other than in the ordinary course of business, the entry into adefinitive agreement to undertake such an action or the termination of a definitiveagreement relating to any such actions, other than pursuant to its terms, if material;and
14. Appointment of a successor Trustee or Paying Agent/Registrar or change in the nameof the Trustee or the Paying Agent/Registrar, if material.
As used in clause 12 above, the phrase "bankruptcy, insolvency, receivership or similar event" meansthe appointment of a receiver, fiscal agent or similar officer for the Corporation or the City in aproceeding under the U.S. Bankruptcy Code or in any other proceeding under state or federal law in
F-18

which a court or governmental authority has assumed jurisdiction over substantially all of the assetsof the Corporation or the City, as applicable, or if jurisdiction has been assumed by leaving the Boardof Directors of the Corporation and officials or officers of the Corporation, or the City Council of theCity and officials or officers of the City, as applicable, in possession but subject to the supervisionand orders of a court or governmental authority, or the entry of an order confirming a plan ofreorganization, arrangement or liquidation by a court or governmental authority having supervisionor jurisdiction over substantially all of the assets or business of the Corporation or the City, asapplicable. The Corporation shall notify the MSRB, in a timely manner, of any failure by theCorporation to provide financial information or operating data in accordance with subsection (a) ofthis Section by the time required by such subsection.
Section 9.3: Limitations, Disclaimers, and Amendments. (a) The Corporation shall beobligated to observe and perform the covenants specified in this Article for so long as, but only forso long as, the City remains an "obligated person" with respect to the Series 2015 Bonds within themeaning of the Rule, except that the Corporation in any event will give notice of any deposit made inaccordance with this Resolution or applicable law that causes Series 2015 Bonds no longer to beOutstanding.
(b) The provisions of this Article are for the sole benefit of the holders and beneficial ownersof the Series 2015 Bonds, and nothing in this Article, express or implied, shall give any benefit orany legal or equitable right, remedy, or claim hereunder to any other person. The Corporationundertakes to provide only the financial information, operating data, financial statements, and noticeswhich it has expressly agreed to provide pursuant to this Article and does not hereby undertake toprovide any other information that may be relevant or material to a complete presentation of theCity's financial results, condition, or prospects or hereby undertake to update any informationprovided in accordance with this Article or otherwise, except as expressly provided herein. TheCorporation does not make any representation or warranty concerning such information or itsusefulness to a decision to invest in or sell Series 2015 Bonds at any future date.
(c) UNDER NO CIRCUMSTANCES SHALL THE CORPORATION BE LIABLE TO THEHOLDER OR BENEFICIAL OWNER OF ANY SERIES 2015 BOND OR ANY OTHER PERSON,IN CONTRACT OR TORT, FOR DAMAGES RESULTING IN WHOLE OR IN PART FROMANY BREACH BY THE CORPORATION, WHETHER NEGLIGENT OR WITHOUT FAULTON ITS PART, OF ANY COVENANT SPECIFIED IN THIS ARTICLE, BUT EVERY RIGHTAND REMEDY OF ANY SUCH PERSON, IN CONTRACT OR TORT, FOR OR ON ACCOUNTOF ANY SUCH BREACH SHALL BE LIMITED TO AN ACTION FOR MANDAMUS ORSPECIFIC PERFORMANCE.
(d) No default by the Corporation in observing or performing its obligations under thisArticle shall comprise a breach of or default under this Resolution for purposes of any otherprovision of this Resolution. Nothing in this Article is intended or shall act to disclaim, waive, orotherwise limit the duties of the Corporation under federal and state securities laws.
F-19

(e) Should the Rule be amended to obligate the Corporation to make filings with or providenotices to entities other than the MSRB, the Corporation agrees to undertake such obligation inaccordance with the Rule as amended.
(f) The provisions of this Article may be amended by the Corporation from time to time toadapt to changed circumstances that arise from a change in legal requirements, a change in law, or achange in the identity, nature, status, or type of operations of the Corporation or the City, but only if(1) the provisions of this Article, as so amended, would have permitted an underwriter to purchase orsell Series 2015 Bonds in the primary offering of the Series 2015 Bonds in compliance with the Rule,taking into account any amendments or interpretations of the Rule since such offering as well as suchchanged circumstances and (2) either (A) the holders of a majority in aggregate principal amount (orany greater amount required by any other provision of this Resolution that authorizes such anamendment) of the outstanding Series 2015 Bonds consent to such amendment or (B) a person that isunaffiliated with the Corporation and the City (such as nationally recognized bond counsel)determines that such amendment will not materially impair the interest of the holders and beneficialowners of the Bonds. If the Corporation so amends the provisions of this Article, it shall include withany amended financial information or operating data next provided in accordance with Section 9.1 anexplanation, in narrative form, of the reason for the amendment and of the impact of any change inthe type of financial information or operating data so provided. The Corporation may also amend orrepeal the provisions of this continuing disclosure agreement if the SEC amends or repeals theapplicable provision of the Rule or a court of final jurisdiction enters judgment that such provisionsof the Rule are invalid, but only if and to the extent that the provisions of this sentence would notprevent an underwriter from lawfully purchasing or selling Series 2015 Bonds in the primary offeringof the Series 2015 Bonds.
Section 9.4: Continuing Disclosure Obligation of the City. The City has agreed in the ProjectFinancing Agreement to provide the Corporation with information to enable the Corporation tosatisfy its obligations under this Article IX. The Corporation agrees to take such actions that may benecessary or desirable to cause the City to comply with its covenant in the Project FinancingAgreement to provide such information to the Corporation in a timely manner.
ARTICLE X
AUTHORIZATION OF AGREEMENTS
The Board hereby approves issuance of the Series 2015 Bonds and all agreements determinedby the Board to be necessary in connection with the issuance of the Series 2015 Bonds, includingwithout limitation the following: the Indenture of Trust by and between the Corporation and WellsFargo Bank, National Association, as Trustee, in substantially the form attached hereto as Exhibit C;the Paying Agent/Registrar Agreement by and between the Corporation and Wells Fargo Bank,National Association, in substantially the form attached hereto as Exhibit D; the Purchase Contract,in substantially the form attached hereto as Exhibit E; the Project Financing Agreement, insubstantially the form attached hereto as Exhibit F; and any and all other documents and agreementsreasonable and necessary to issue the Bonds (collectively, the "Agreements"). The Board, by amajority vote of its members, at a regular meeting, hereby approves the form, terms, and provisions
F-20

of the Agreements and authorizes the execution and delivery of the Agreements.
ARTICLE XI
MISCELLANEOUS
Section 11.1: Further Proceedings. The President, the Vice President, the Secretary, theTreasurer and other appropriate officials of the Corporation are hereby authorized and directed to doany and all things necessary and/or convenient to carry out the intent, purposes and terms of thisResolution, including the execution and delivery of such certificates, documents or papers necessaryand advisable.
Section 11.2: Severability. If any Section, paragraph, clause or provision of this Resolutionshall for any reason be held to be invalid or unenforceable, the invalidity or unenforceability of suchSection, paragraph, clause or provision shall not affect any of the remaining provisions of thisResolution.
Section 11.3: Open Meeting. It is hereby officially found and determined that the meeting atwhich this Resolution was adopted was open to the public, and that public notice of the time, placeand purpose of said meeting was given, all as required by the Texas Open Meetings Act, Chapter551, Texas Government Code.
Section 11.4: Parties Interested. Nothing in this Resolution expressed or implied is intendedor shall be construed to confer upon, or to give to, any person or entity, other than the Corporation,the Registrar, and the Owners of the Series 2015 Bonds, any right, remedy or claim under or byreason of this Resolution or any covenant, condition or stipulation hereof, and all covenants,stipulations, promises and agreements in this Resolution shall be for the sole and exclusive benefit ofthe Corporation, the Registrar, and the Owners of the Series 2015 Bonds.
Section 11.5: Repealer. All orders, resolutions and ordinances, or parts thereof, inconsistentherewith are hereby repealed to the extent of such inconsistency.
Section 11.6: Form of Bond. The FORM OF BOND set forth in Exhibit A to this Resolutionshall be revised and completed to reflect the terms of the sale of the Series 2015 Bonds, consistentwith the provisions of the Purchase Contract.
Section 11.7: Effective Date. This Resolution shall become effective immediately uponpassage by this Corporation and signature of the President of the Corporation.
F-21

PASSED AND APPROVED this 9th day of June, 2015.
By:Name:Title: President, Board of Directors
ATTEST:
By:Name:Title: Secretary, Board of Directors (SEAL)
F-22

EXHIBIT A:
FORM OF BOND
United States of AmericaState of Texas
_________ ___________Registered Registered
LOVE FIELD AIRPORT MODERNIZATION CORPORATIONGENERAL AIRPORT REVENUE BOND
SERIES 2015
INTEREST RATE: MATURITY DATE: DELIVERY DATE: CUSIP:
REGISTERED OWNER:
PRINCIPAL AMOUNT: DOLLARS
THE LOVE FIELD AIRPORT MODERNIZATION CORPORATION (the "Issuer"), a not-for-profit local government corporation created under authority of Chapter 431, Subchapter D, TexasTransportation Code (the "Act") by the City of Dallas, Texas (the "City"), for value received,promises to pay, but solely from certain Pledged Revenues as hereinafter provided, to the RegisteredOwner identified above or registered assigns, on the Maturity Date specified above, uponpresentation and surrender of this Bond at the designated corporate trust office in Dallas, Texas (the"Designated Trust Office") of Wells Fargo Bank, National Association, as registrar (the "Registrar"),the principal amount identified above, in any coin or currency of the United States of America whichon the date of payment of such principal is legal tender for the payment of debts due the UnitedStates of America, and to pay, solely from such Pledged Revenues, interest thereon at the rate shownabove, calculated on the basis of a 360-day year of twelve 30-day months, from the later of theDelivery Date of the Bonds specified above, or the most recent interest payment date to whichinterest has been paid or duly provided for. Interest on this Bond is payable by check on _________15 and ________ 15, beginning on __________ 15, 201_, mailed to the Registered Owner as shownon the books of registration kept by the Registrar as of the last Business Day of the month nextpreceding each interest payment date (the "Record Date"), or by such other method, acceptable to theRegistrar, requested by and at the risk and expense of the Registered Owner. If interest on this Bondis not paid on any interest payment date specified above, and continues unpaid for thirty (30) daysthereafter, the Registrar shall establish a new Record Date for the payment of such interest (a"Special Record Date"). Such Special Record Date shall be established in accordance with the termsof the hereinafter defined Resolution.
F-23

IF THE DATE for the payment of the principal of or interest on this Bond shall be aSaturday, Sunday, a legal holiday, or a day on which banking institutions in the city where theDesignated Trust Office of the Paying Agent/Registrar is located are authorized by law or executiveorder to close, then the date for such payment shall be the next succeeding day which is not such aSaturday, Sunday, legal holiday, or day on which banking institutions are authorized to close; andpayment on such date shall have the same force and effect as if made on the original date paymentwas due.
THIS BOND IS ONE OF A DULY AUTHORIZED SERIES OF BONDS dated as of______________, 2015, aggregating $____________, issued for the purpose of (1) paying the costsof the Project, (2) funding capitalized interest on the Series 2015 Bonds during construction and forup to one year after the construction period, (3) making an initial deposit to the Reserve Fund, and(4) paying Costs of Issuance, all under and pursuant to the authority of the Act and all otherapplicable laws, an Indenture of Trust dated as of July 1, 2015 (the "Indenture"), between the Issuerand Wells Fargo Bank, National Association, as trustee (the "Trustee"), and a resolution adopted bythe Issuer on June 9, 2015 (the "Resolution"). All defined terms not herein defined shall have themeaning attributed thereto in accordance with the terms of the Resolution.
THIS BOND AND THE SERIES OF WHICH IT IS A PART are limited obligations of theIssuer that are payable from, and are equally and ratably secured by a first lien on the "PledgedRevenues", as defined and provided in the Indenture, which Pledged Revenues are required to be setaside and pledged to the payment of the Bonds and all additional bonds and parity contractualobligations issued or entered into on a parity therewith, in the Debt Service Fund and the ReserveFund maintained for the payment of all such Bonds, all as more fully described and provided for inthe Resolution. This Bond and the series of which it is a part, together with the interest thereon, arepayable solely from such Pledged Revenues.
THE BONDS may be redeemed only in principal amounts of $5,000 or any integral multiplethereof (an "Authorized Denomination"), at the option of the Issuer, on ___________, ____, or onany date thereafter, at the redemption price indicated below (expressed as a percentage of par value)plus accrued interest to the date fixed for redemption, to-wit:
Redemption Dates (dates inclusive) Redemption Price (%)
If less than all of the Bonds are to be redeemed by the Issuer, the Issuer shall determine the maturityor maturities and the amounts therewith to be redeemed and shall direct the Registrar to call by lotBonds, or portions thereof, within such maturity or maturities and in such principal amounts, forredemption; provided, that during any period in which ownership of the Bonds is determined only bya book entry at a securities depository for the Bonds, if fewer than all of the Bonds of the samematurity and bearing the same interest rate are to be redeemed, the particular Bonds of such maturityand bearing such interest rate shall be selected in accordance with the arrangements between theIssuer and the securities depository.
F-24
THE BONDS are also subject to mandatory redemption in part by lot on ___________ in thefollowing years and in the following amounts, at a price equal to the principal amount thereof andaccrued and unpaid interest to the date of redemption, without premium:
Year Principal Amount Year Principal Amount$ $
_________* Final Maturity
THE BONDS to be redeemed in any year by mandatory sinking fund redemption shall beselected by lot from the Bonds then subject to redemption; provided, that if any Bond is selected forredemption in part it shall not be redeemed in an amount that would, upon exchange, result in a Bondin a denomination less than $5,000.
THE PRINCIPAL AMOUNT OF BONDS required to be redeemed on each such redemptiondate pursuant to the foregoing operation of the mandatory sinking fund redemption shall be reduced,at the option of the Issuer, by the principal amount of the Bonds which, at least 45 days prior to themandatory sinking fund redemption date, (1) shall have been acquired by the Issuer and delivered tothe Registrar for cancellation or (2) shall have been acquired and canceled by the Registrar at thedirection of the Issuer, in either case of (1) and (2) at a price not exceeding the par or principalamount of such Bonds, or (3) shall have been redeemed pursuant to the optional redemptionprovisions described above and not theretofore credited against a mandatory sinking fundredemption. During any period in which ownership of the Bonds is determined by a book entry at asecurities depository for the Bonds, if fewer than all of the bonds of the same maturity and bearingthe same interest rate are to be redeemed, the particular Bonds of such maturity to be redeemed shallbe selected in accordance with the arrangements between the Issuer and the securities depository;provided, that if any Bond is selected for redemption in part it shall not be redeemed in an amountthat would result, upon exchange, in a Bond in a denomination less than $5,000.
AT LEAST THIRTY DAYS prior to any date fixed for redemption, notice of any redemptionshall be given (i) by the Registrar to the Registered Owner of each Bond or a portion thereof beingcalled for redemption by depositing such notice in the United States mail, first-class, postage pre-paid, addressed to each such registered owner at his address shown on the Registration Books of thePaying Agent/Registrar and (ii) by the Corporation by causing a notice of such redemption to bepublished one (1) time in a financial journal or publication of general circulation in the United Statesof America or the State of Texas carrying as a regular feature notices of municipal bonds called forredemption; provided, however, that the failure to send, mail or receive such notice described in (i)above, or any defect therein or in the sending or mailing thereof, shall not affect the validity oreffectiveness of the proceedings for the redemption of any Bond, and the publication of notice asdescribed in (ii) above shall be the only notice actually required in connection with or as a prerequi-
F-25

site to the redemption of any Bonds. When Bonds or portions thereof have been called forredemption, and due provision has been made to redeem the same, the principal amounts soredeemed shall be payable solely from the funds provided for redemption, and interest which wouldotherwise accrue on the amounts called for redemption shall terminate on the date fixed forredemption.
WITH RESPECT TO any optional redemption of this Bond, unless the PayingAgent/Registrar has received funds sufficient to pay the principal and premium, if any, and intereston this Bond to be redeemed before giving of a notice of redemption, the notice of redemption maystate the Issuer may condition redemption on the receipt by the Paying Agent/Registrar of such fundson or before the date fixed for the redemption, or on the satisfaction of any other prerequisites setforth in the notice of redemption. If a conditional notice of redemption is given and suchprerequisites to the redemption and sufficient funds are not received, the notice shall be of no forceand effect, the Issuer shall not redeem this Bond and the Paying Agent/Registrar shall give notice, inthe manner in which the notice of redemption was given, that this Bond has not been redeemed.
THIS BOND IS TRANSFERABLE only upon presentation and surrender at the DesignatedTrust Office of the Registrar, duly endorsed for transfer or accompanied by an assignment dulyexecuted by the Registered Owner or his authorized representative, subject to the terms andconditions of the Resolution.
THIS BOND IS EXCHANGEABLE at the Designated Trust Office of the Registrar forBonds in principal amounts only in Authorized Denominations, subject to the terms and conditionsof the Resolution.
NEITHER THE ISSUER NOR THE REGISTRAR shall be required (i) to make any transferor exchange of any Bond during the period beginning at the opening of business 15 days before theday of the first mailing of a notice of redemption of Bonds and ending at the close of business on theday of such mailing, or (ii) to transfer or exchange any Bonds so selected for redemption when suchredemption is scheduled to occur within 30 calendar days; provided, however, such limitation shallnot be applicable to an exchange by the registered owner of the uncalled principal balance of a Bond.
DURING ANY PERIOD in which ownership of the Bonds is determined only by a bookentry at a securities depository for the Bonds, if fewer than all of the Bonds of the same maturity andbearing the same interest rate are to be redeemed, the particular Bonds of such maturity and bearingsuch interest rate shall be selected in accordance with the arrangements between the Issuer and thesecurities depository; provided, however, that no Bonds shall be redeemed in a manner where thebeneficial owner thereof shall own Bonds in any Authorized Denomination.
THIS BOND shall not be valid or obligatory for any purpose or be entitled to any benefitunder the Resolution unless this Bond is either (i) registered by the Comptroller of Public Accountsof the State of Texas by registration certificate attached or affixed hereto or (ii) authenticated by theRegistrar by due execution of the authentication certificate endorsed hereon.
THE ISSUER HAS RESERVED THE RIGHT to issue additional parity General Airport
F-26

Revenue Bonds, subject to the restrictions contained in the Indenture and the Resolution, which maybe equally and ratably payable from, and secured by a first lien on and pledge of, the PledgedRevenues in the same manner and to the same extent as this Bond and the series of which it is a part.
THE BONDS ARE A LIMITED OBLIGATION OF THE CORPORATION, PAYABLESOLELY OUT OF THE TRUST ESTATE HELD BY THE TRUSTEE UNDER THE TERMS OFTHE INDENTURE, WHICH IS THE SOLE ASSET OF THE CORPORATION PLEDGEDTHEREFOR. THE BONDS ARE OBLIGATIONS SOLELY OF THE CORPORATION AND DONOT CONSTITUTE, WITHIN THE MEANING OF ANY STATUTORY OR CONSTITUTIONALPROVISION, AN INDEBTEDNESS, AN OBLIGATION OR A LOAN OF CREDIT OF THECITY, THE STATE OF TEXAS, OR ANY OTHER MUNICIPALITY, COUNTY, OR OTHERMUNICIPAL OR POLITICAL CORPORATION OR SUBDIVISION OF THE STATE OF TEXAS.THE CITY IS NOT OBLIGATED TO MAKE PAYMENTS IN SUPPORT OF THE DEBTSERVICE ON THE BONDS FROM ANY SOURCES, OTHER THAN THE NET REVENUES ASDESCRIBED IN THE INDENTURE.
IT IS HEREBY DECLARED AND REPRESENTED that this Bond has been duly andvalidly issued and delivered; that all acts, conditions, and things required or proper to be performed,exist, and be done precedent to or in the issuance and delivery of this Bond have been performed,existed, and been done in accordance with law; that the Bonds do not exceed any statutory limitation;and that provision has been made for the payment of the principal of and interest on this Bond and allof the Bonds by the creation of the aforesaid lien on and pledge of the Pledged Revenues, as furtherprovided for in the Indenture.
IN WITNESS WHEREOF, the Issuer has caused this Bond to be executed by the manual orfacsimile signatures of the President and the Secretary.
LOVE FIELD AIRPORT MODERNIZATIONCORPORATION
_______________________________President, Board of Directors
(SEAL)_______________________________Secretary, Board of Directors
F-27

FORM OF REGISTRATION CERTIFICATE
COMPTROLLER'S REGISTRATION CERTIFICATE: REGISTER NO. ______
I hereby certify that this Bond has been examined, certified as to validity, and approved bythe Attorney General of the State of Texas, and that this Bond has been registered by the Comptrollerof Public Accounts of the State of Texas.
WITNESS MY SIGNATURE AND SEAL this _________________________.
Comptroller of Public Accountsof the State of Texas
(SEAL)
F-28

FORM OF REGISTRAR'S AUTHENTICATION CERTIFICATE
AUTHENTICATION CERTIFICATE
It is hereby certified that this Bond has been delivered pursuant to the Bond Resolutiondescribed in the text of this Bond; and that this Bond is one of a series of Bonds approved by theAttorney General of the State of Texas and registered by the Comptroller of Public Accounts of theState of Texas.
___________________, as Registrar
By: __________________________________Authorized Signature
Date of Authentication: ________________
F-29

FORM OF ASSIGNMENT
ASSIGNMENT
For value received, the undersigned hereby sells, assigns, and transfers unto
(Please print or type name, address, and zip code of Transferee)
(Please insert Social Security or Taxpayer Identification Number of Transferee)the within Bond and all rights thereunder, and hereby irrevocably constitutes and appoints
attorney to transfer said Bond on the books kept for registration thereof, with full power ofsubstitution in the premises.
DATED: __________________
Signature Guaranteed: ____________________Registered Owner
_________________________________________NOTICE: Signature must be guaranteed by aninstitution which is a participant in the SecuritiesTransfer Agent Medallion Program (“STAMP”) orsimilar program.
_________________________________________NOTICE: The signature above must correspond tothe name of the Registered Owner as shown on theface of this Bond in every particular, without anyalteration, enlargement or change whatsoever.
F-30

Exhibit Bto
Resolution
DESCRIPTION OF ANNUAL FINANCIAL INFORMATION
The following information is referred to in Section 9.1 of this Resolution.
Annual Financial Statements and Operating Data
The financial information and operating data with respect to the City to be provided annuallyin accordance with such Section are as specified (and included in the Appendix or under the headingsof the Official Statement referred to) below:
1. The information of the general type included in Tables 1 through __ of the OfficialStatement.
2. "Financial Statements of the City of Dallas, Texas".
Accounting Principles
The accounting principles referred to in such Section are the accounting principles describedin the notes to the financial statements referred to in paragraph 2 above.
F-31

[THIS PAGE INTENTIONALLY LEFT BLANK]

APPENDIX G
FORM OF CO-BOND COUNSEL'S OPINION

[THIS PAGE INTENTIONALLY LEFT BLANK]

An opinion in substantially the following form will be delivered byMcCall, Parkhurst & Horton L.L.P. and Escamilla & Poneck, LLP, co-Bond Counsel,
upon the delivery of the Bonds, assuming no material changes in facts or law.
LOVE FIELD AIRPORT MODERNIZATION CORPORATIONGENERAL AIRPORT REVENUE BONDS, SERIES 2015
AS CO-BOND COUNSEL for the Love Field Airport Modernization Corporation (the"Corporation"), the issuer of the bonds described above (the "Bonds"), we have examined intothe legality and validity of the Bonds, which Bonds are issued in the aggregate principal amountof $109,235,000. The Bonds bear interest from their date of delivery and mature on the datesspecified on the face of the Bonds, and are subject to redemption prior to maturity on the datesand in the manner specified in the Bonds, all in accordance with the bond resolution of theCorporation authorizing the issuance of the Bonds (the "Bond Resolution") and an Indenture ofTrust between the Corporation and Wells Fargo Bank, National Association, as trustee (the“Trustee”), dated as of July 1, 2015 (the “Indenture”). Terms used herein and not otherwisedefined shall have the meaning given in the Indenture.
WE HAVE EXAMINED the Constitution and Statutes of the State of Texas, certified��������� ��������� ������� ��������������� ���������������� �������������� ������������authorizing and relating to the issuance of the Bonds, including one of the executed Bonds (BondNumber R-1); we do not, however, express any opinion with regard to any statement ofinsurance printed on the Bonds.
IN OUR OPINION, the Corporation is a local development corporation duly andvalidly incorporated, existing, and functioning under and pursuant to Subchapter D, Chapter 431,Texas Transportation Code; that the Bond Resolution authorizing the execution of the Indentureand the issuance of the Bonds has been duly and lawfully adopted and constitutes a valid andbinding obligation of the Corporation; and that the Bonds have been authorized and issued inaccordance with law, and that the Bonds constitute valid, legally binding, and enforceable specialrevenue obligations of the Corporation, in accordance with their terms, with the principal of,redemption premium, if any, and interest on the Bonds, and other payments with respect to theBonds, being payable from the payments to be made or paid, or caused to be made or paid, to theTrustee pursuant to the Indenture and together with bonds of the Corporation that may behereafter issued in accordance with the terms of the Indenture, are payable from, and secured bya first lien on and pledge of, the Pledged Revenues. All such bonds are secured ratably by suchpledge of the Pledged Revenues in such manner that no one Bond shall have priority of lien overany other Bond so secured. The Bonds are not a general obligation of the Corporation or theCity, and the issuance of the Bonds does not give rise to a charge against the general credit ortaxing powers of the City, and the holder or holders of the Bonds shall never have the right todemand payment out of money raised or to be raised by taxation, other than from the PledgedRevenues.
THE BONDS are further secured by the Indenture, whereunder the Trustee is custodianof the Pledged Revenue Fund, the Debt Service Fund, the Reserve Fund and the Project Fund
G-1

created in the Indenture, and is obligated to enforce the rights of the Corporation and the ownersof the Bonds, and to perform other duties, in the manner and under the conditions stated in theIndenture; and it is our further opinion that the Indenture has been duly and lawfully authorized,executed, and delivered by the Corporation, and that it is a valid and binding agreement of theCorporation enforceable in accordance with its terms and conditions. We are relying upon theopinion of the counsel to the Trustee, to the effect that the Indenture has been duly and lawfullyauthorized, executed, and delivered by the Trustee, and that the Indenture is valid and bindingupon the Trustee in accordance with its terms and conditions.
THE CORPORATION reserves the right, subject to the restrictions stated, and adoptedby reference, in the Indenture, to issue additional parity bonds payable from and equally securedby a lien on and pledge of the Pledged Revenues in all things on a parity with the Bonds.
THE OPINIONS HEREINBEFORE EXPRESSED are qualified to the extent that theobligations of the Corporation and the Trustee, and the enforceability thereof, with respect to theBonds and the Indenture, are subject to applicable bankruptcy, insolvency, reorganization,moratorium or similar laws relating to or affecting creditors' rights generally and to the exerciseof judicial discretion in accordance with general principles of equity.
IT IS FURTHER OUR OPINION, except as discussed below, that the interest on theBonds is excludable from the gross income of the owners for federal income tax purposes underthe statutes, regulations, published rulings, and court decisions existing on the date of thisopinion. The exceptions are as follows:
(1) interest on the Bonds will be includable in the gross income of the holder during anyperiod that such Bonds are held by either a "substantial user" of the facilities financed orrefinanced with the proceeds of the Bonds or a "related person" of such user, as providedin section 147(a) of the Internal Revenue Code of 1986 (the "Code"); and
(2) interest on the Bonds will be treated as a "preference item" in calculating thealternative minimum tax imposed on individuals and corporations under section 57(a)(5)of the Code.
In expressing the aforementioned opinions, we have relied on certain representations, includingparticularly written representations with respect to material facts which are solely within theknowledge of the Corporation and the City, the accuracy of which we have not independentlyverified, and assume compliance with certain covenants, regarding the use and investment of theproceeds of the Bonds and the construction, use and management of the property financedtherewith. We call your attention to the fact that if the representations are determined to beinaccurate or if the either the Corporation or the City fails to comply with such covenants,interest on the Bonds may become includable in gross income retroactively to the date ofissuance of the Bonds.
EXCEPT AS STATED ABOVE, we express no opinion as to any other federal, state,or local tax consequences of acquiring, carrying, owning, or disposing of the Bonds. Inparticular, but not by way of limitation, we express no opinion with respect to federal, state orlocal tax consequences arising from the enactment of any pending or future legislation. Theforegoing opinions represent our legal judgment based upon a review of existing legal authoritiesthat we deem relevant to render such opinions and are not a guarantee of a result.
WE EXPRESS NO OPINION as to any insurance policies issued with respect to the
G-2

payments due for the principal of and interest on the Bonds, nor as to any such insurance policiesissued in the future.
OUR SOLE ENGAGEMENT in connection with the issuance of the Bonds is as co-Bond Counsel for the Corporation, and, in that capacity, we have been engaged by theCorporation for the sole purpose of rendering an opinion with respect to the legality and validityof the Bonds under the Constitution and laws of the State of Texas, and with respect to theexclusion from gross income of the interest on the Bonds for federal income tax purposes, andfor no other reason or purpose. The foregoing opinions represent our legal judgment based upona review of existing legal authorities that we deem relevant to render such opinions and are not aguarantee of a result. We have not been requested to investigate or verify, and have notindependently investigated or verified any records, data, or other material relating to the financialcondition or capabilities of the Corporation or the City, or the disclosure thereof in connectionwith the sale of the Bonds, and have not assumed any responsibility with respect thereto. Weexpress no opinion and make no comment with respect to the marketability of the Bonds andhave relied solely on certificates executed by officials of the Corporation and the City as to theavailability and sufficiency of the Pledged Revenues. Our role in connection with theCorporation's Official Statement prepared for use in connection with the sale of the Bonds hasbeen limited as described therein.
OUR OPINIONS ARE BASED ON EXISTING LAW, which is subject to change.Such opinions are further based on our knowledge of facts as of the date hereof. We assume noduty to update or supplement our opinions to reflect any facts or circumstances that maythereafter come to our attention or to reflect any changes in any law that may thereafter occur orbecome effective. Moreover, our opinions are not a guarantee of result and are not binding onthe Internal Revenue Service (the "Service"); rather, such opinions represent our legal judgmentbased upon our review of existing law and in reliance upon the representations and covenantsreferenced above that we deem relevant to such opinions. The Service has an ongoing auditprogram to determine compliance with rules that relate to whether interest on state or localobligations is includable in gross income for federal income tax purposes. No assurance can begiven whether the Service will commence an audit of the Bonds. If an audit is commenced, inaccordance with its current published procedures the Service is likely to treat the Corporation asthe taxpayer. We observe that the Corporation has covenanted not to take any action, or omit totake any action within its control, that if taken or omitted, respectively, may result in thetreatment of interest on the Bonds as includable in gross income for federal income tax purposes.
Respectfully,
G-3

[THIS PAGE INTENTIONALLY LEFT BLANK]

[THIS PAGE INTENTIONALLY LEFT BLANK]

[THIS PAGE INTENTIONALLY LEFT BLANK]


LO
VE
FIE
LD
AIR
PO
RT
MO
DE
RN
IZA
TIO
N C
OR
PO
RA
TIO
N (A
NO
T-FO
R-PR
OF
IT LO
CA
L gO
VE
RN
ME
NT C
OR
PO
RA
TIO
N AC
TIN
g ON b
Eh
AL
F OF T
hE C
ITy O
F DA
LL
As, T
Ex
As) • g
EN
ER
AL A
IRP
OR
T RE
VE
Nu
E bO
ND
s, sE
RIE
s 2015