low carbon development for colombia
DESCRIPTION
Presentation made in a World Bank Brown bag seminar in Washington DC, April 19th 2012.TRANSCRIPT

From Cows to Coffee: evaluating low-carbon options in Colombia’s agricultural sector
Andy Jarvis, Jeimar Tapasco, Myles Fisher, Emmanuel Zapata
International Centre for Tropical Agriculture (CIAT)

CCAFS: the partnership! The largest global
coalition of scientists working on
developing-country agriculture and climate
change

1. Identify and develop pro-poor
adaptation and mitigation practices,
technologies and policies for
agriculture and food systems.
2. Support the inclusion of agricultural
issues in climate change policies, and
of climate issues in agricultural
policies, at all levels.
CCAFS objectives

The CCAFS Framework
Adapting Agriculture to
Climate Variability and Change
Technologies, practices, partnerships and
policies for:
1. Adaptation to Progressive Climate
Change
2. Adaptation through Managing
Climate Risk
3. Pro-poor Climate Change Mitigation
Improved
Environmental
HealthImproved
Rural
Livelihoods
Improved
Food
Security
Enhanced adaptive capacity
in agricultural, natural
resource management, and
food systems
4. Integration for Decision Making
• Linking Knowledge with Action
• Assembling Data and Tools for Analysis
and Planning
• Refining Frameworks for Policy Analysis
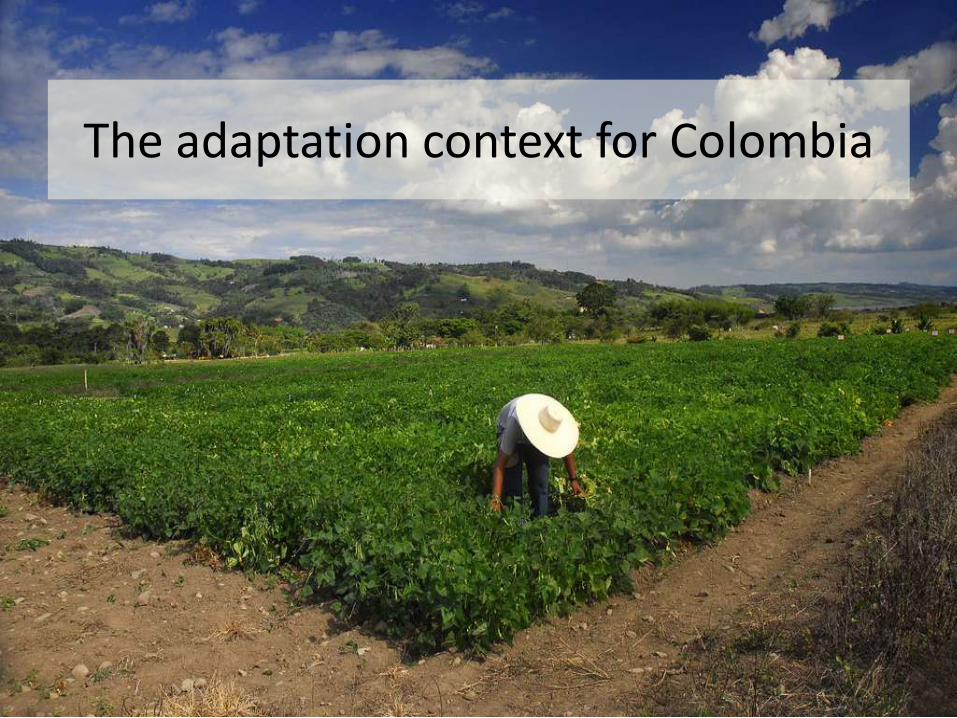
The adaptation context for Colombia

Heavy reliance of agricultural GDP on perennial crops and livestock
0
500,000
1,000,000
1,500,000
2,000,000
2,500,000
3,000,000
3,500,000Distribucion de cultivo Área (ha)
Distribucion de cultivo Pdn (Ton)

Government policies increasing agriculturalland-area especially in perennials

…and increasing livestock production, buton less land

Region DepartamentoCambio en
Precipitacion
Cambio en
Temperatura
media
Cambio en
estacionalidad de
precipitacion
Cambio en
meses
consecutivos
secos
Incertidumbre
entre modelos
(StDev prec)
Amazonas Amazonas 12 2.9 1.4 0 135
Amazonas Caqueta 138 2.7 -1.3 0 193
Amazonas Guania 55 2.9 -3.2 0 271
Amazonas Guaviare 72 2.8 -2.9 -1 209
Amazonas Putumayo 117 2.6 0.6 0 170
Andina Antioquia 18 2.1 1.3 0 129
Andina Boyaca 50 2.7 -3.9 -1 144
Andina Cundinamarca 152 2.6 -2.6 0 170
Andina Huila 51 2.4 1.0 0 144
Andina Norte de santander 73 2.8 -0.4 0 216
Andina Santander 51 2.7 -2.4 0 158
Andina Tolima 86 2.4 -3.1 0 148
Caribe Atlantico -74 2.2 -2.9 2 135
Caribe Bolivar 90 2.5 -1.8 0 242
Caribe Cesar -119 2.6 -1.3 0 160
Caribe Cordoba -11 2.3 -3.8 0 160
Caribe Guajira -69 2.2 -1.8 0 86
Caribe Magdalena -158 2.4 -1.8 0 153
Caribe Sucre 10 2.4 -4.1 -1 207
Eje Cafetero Caldas 252 2.4 -4.2 -1 174
Eje Cafetero Quindio 153 2.3 -4.1 -1 145
Eje Cafetero Risaralda 158 2.4 -3.5 -1 141
Llanos Arauca -13 2.9 -6.4 -1 188
Llanos Casanare 163 2.8 -5.7 -1 229
Llanos Meta 10 2.7 -5.4 -1 180
Llanos Vaupes 46 2.8 -1.4 0 192
Llanos Vichada 59 2.6 -2.6 0 152
Pacifico Choco -157 2.2 -1.2 0 148
Sur Occidente Cauca 172 2.3 -1.6 0 168
Sur Occidente Narino 155 2.2 -1.4 0 126
Sur Occidente Valle del Cauca 275 2.3 -5.1 -1 166

A future coffee crisis?

Mountains as climate changegradients….
Rango
Altitudinal
Tmedia
anual
actual
Tmedia
anual
futuro
Tmedia
anual
cambio
(ºC)
Ppt total
anual
actual
Ppt total
anual
futuro
Cambio
ppt total
(%)
190-500 25.54 27.70 2.16 5891 6002 1.88
501-1000 23.47 25.66 2.19 3490 3597 3.04
1000-1500 21.29 23.50 2.21 2537 2641 4.10
1500-2000 18.36 20.58 2.22 2519 2622 4.08
2000-2500 15.60 17.82 2.22 2555 2657 4.00
2500-3000 13.33 15.54 2.21 2471 2575 4.20
Temperatura media reduce por 0.51oC por cada 100m en la zona cafetero. Un cambio de 2.2oC equivale a una diferencia de 440m.
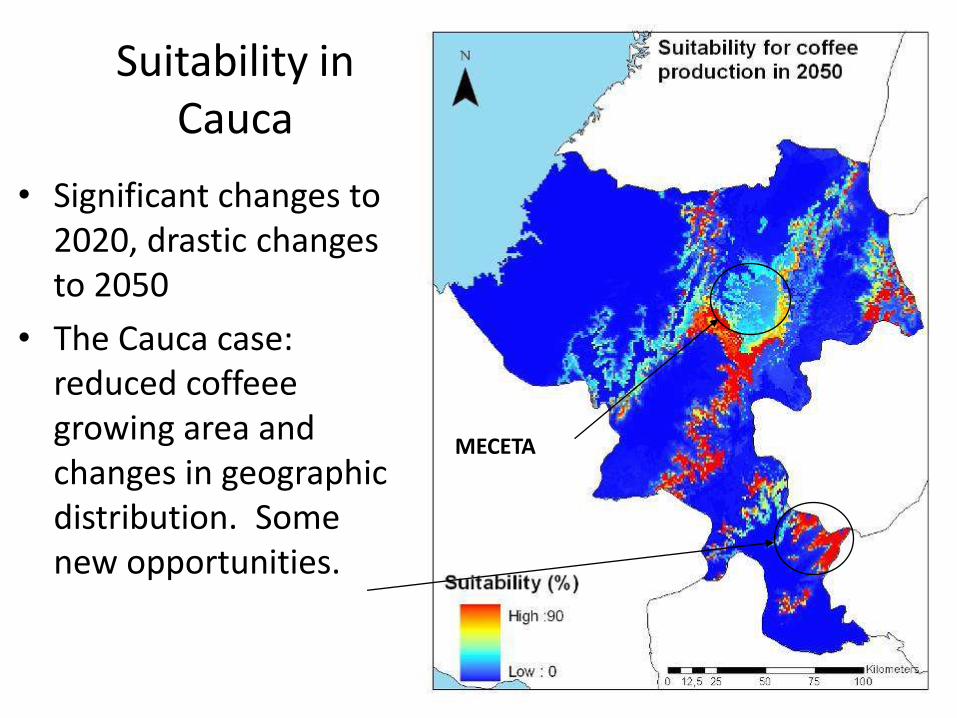
Suitability in Cauca
• Significant changes to 2020, drastic changes to 2050
• The Cauca case: reduced coffeee growing area and changes in geographic distribution. Some new opportunities.
MECETA

Impactos en Colombia: cambio (%) en productividad a nivel Nacional
-18
-16
-14
-12
-10
-8
-6
-4
-2
0
2
4
Cambio adaptabilidad (%) 2050-A2
Cambio adaptabilidad (%) 2050-A2

Cambios promedios por departamento
-15
-10
-5
0
5
10
15
Cambio promedio en adaptabilidad
Cambio promedio en adaptabilidad

Dos casos diferentes: Bolivar vs. Cauca
-60.00
-50.00
-40.00
-30.00
-20.00
-10.00
0.00
10.00
20.00
30.00
Bolivar
Cauca

Crops threatening high mountain ecosystems, and water resources…

And a poverty/food security angle

The adaptation outlook
• Perennial crops (66.4% ag GDP in 2007) seriously affected
• Long lead times for adaptation – a coffee crop is a 20 year investment, palm, fruits and rubber is more
• Likely exacerbation of equity as staple crops more sensitive than many annual cash crops
• Clear geographic priorities in the Caribbean region

Evaluation of mitigationoptions in the Colombianagricultural sector

A stakeholder- and science- driven approach
• Stakeholder workshop to identify medium-long list of mitigation measures– Industry, government, civil society participation
• Quantification of costs and benefits of each measure– Modelling– Empirical evidence– Tools e.g. Cool Farm Tool
• Prioritisation of measures based on a range of cost/benefit criteria
• Stakeholder driven selection of mitigation portfolio for sector or sub-sector

An inevitable need to use models
• Desire is to have a data-driven approach, but alone is simply not possible
• Major data constraints – poor or non-existent empirical data
• An approach of fitting the model to the problem (not the other way around)
• Different models used to arrive at individual numbers on costs or benefits of each mitigation measure

Summary of interventions studies
Intervention Hectares
Potential
abatement
(KTonCO2/ year)
$US/TonCO2
Min Max
Increased efficiency of
nitrogen fertilizer in rice
sector
169,200 38 -267 145
Conversion of degraded
pastures to fruit orchards395,320 1,938 -188 -25
Establishment of
silvopastoral systems521,839 11,538 -49 0.6
Pasture intensification 51,487 54 -103 -62

1. Uso eficiente de fertilizantes (Arroz)
• Medidas para uso eficiente de la fertilización en arroz
– Micronivelación del terreno (Jamundí y Cúcuta)
– Asistencia técnica especializada
(Espinal, Guaranda, Nunchía, Valledupar, Villavicencio y Yopal).
– Intervención: 169.200 ha
Un uso más eficiente de fertilizantes permite llevar a cabo un mejor aprovechamiento del suelo y reducir las emisiones de GEI generadas por los fertilizantes nitrogenados
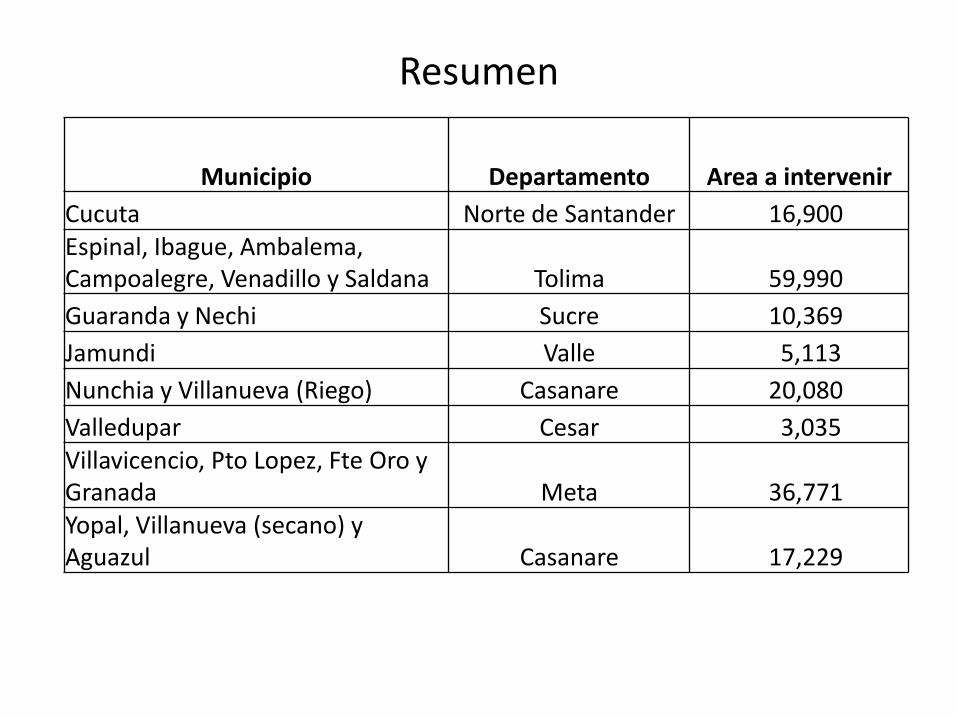
Municipio Departamento Area a intervenir
Cucuta Norte de Santander 16,900 Espinal, Ibague, Ambalema, Campoalegre, Venadillo y Saldana Tolima 59,990
Guaranda y Nechi Sucre 10,369
Jamundi Valle 5,113
Nunchia y Villanueva (Riego) Casanare 20,080
Valledupar Cesar 3,035 Villavicencio, Pto Lopez, Fte Oro y Granada Meta 36,771 Yopal, Villanueva (secano) y Aguazul Casanare 17,229
Resumen

Sub-optimal nitrogen applications

IMPACTO EN EMISIONES

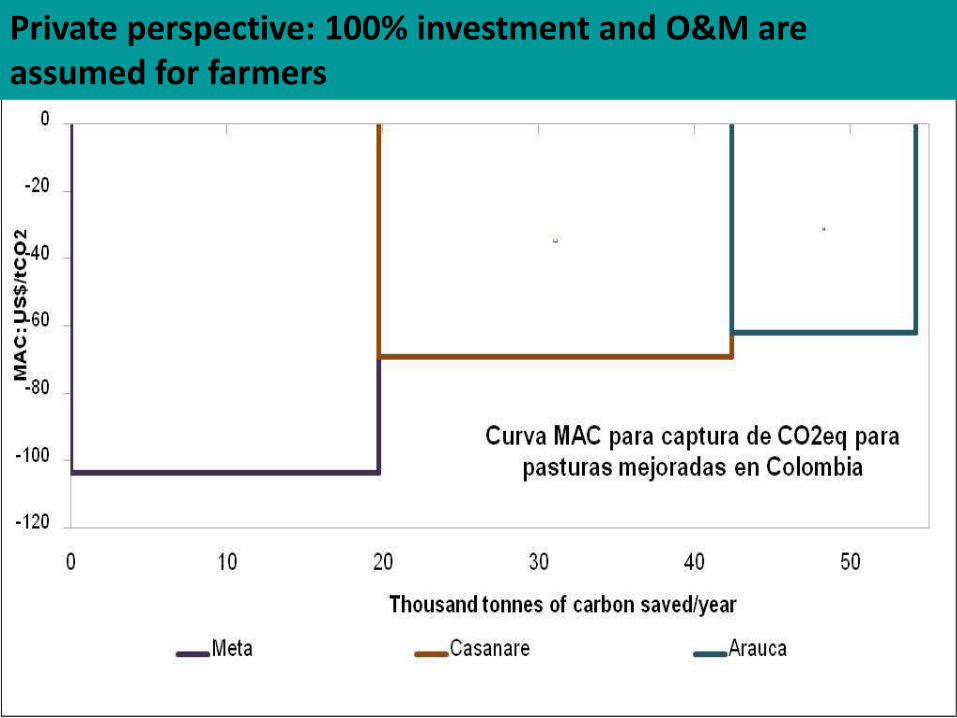
Private perspective: 100% investment and O&M are assumed for farmers

2. Reconversion of pasturelands to fruit orchards
• Se analizan tres especies de frutales
– Aguacate (165.682 has)
– Mango (193.638 has)
– Cítricos*
• Se buscan los nichos para estas especies con el fin de determinar el área potencial.
• Intervención: 395.320 ha
La sustitución de pasturas degradadas por plantaciones de árboles frutales representa no solo una oportunidad económica para desarrollar nuevos mercados, sino además un potencial de mitigación de GEI

Cultivo: AguacateSuperficie potencial (ha)
Nivel de productividad respecto al promedio de la zona
Departamento 85% 79% 75.5% 72% 70% Total
ANTIOQUIA 3,355 3,183 11,269 11,269 23,055 52,131
CALDAS - 1,548 7,828 10,925 2,839 23,140
HUILA - 86 86 516 602 1,290
QUINDIO 172 4,043 7,140 5,850 3,183 20,388
RISARALDA 344 1,634 1,721 2,065 5,764
TOLIMA 774 4,989 24,775 21,764 10,667 62,969
Total 4,301 14,193 52,732 52,045 42,411 165,682

Private perspective: 100% investment and O&M are assumed for farmers

3. Improved pastures
• Mejoramiento de pasturas en los departamentos:
– Arauca (11.228 has)
– Casanare (21.521 has)
– Meta (18.738 has)
• Intervención:51.487 hectáreas
La actividad ganadera en pasturas degradadas resulta una reducción en la eficiencia de producción, pérdida de biodiversidad y aumento en la emisión de GEI. El mejoramiento de pasturas presenta una opción atractiva a nivel económico y ambiental.
Private perspective: 100% investment and O&M are assumed for farmers

4. Silvopastoral systems (SSPi)
• Se plantea la reconversión a sistemas silvopastoriles en los departamentos:
– Atlántico
– Córdoba
– Sucre
– Antioquia: Bajo cauca, Nordeste, Urabá, Oriente
• Intervención: 521.839 hectáreas
Los sistemas silvopastoriles constituyen una opción atractiva para la reconversión de modelos de ganadería extensiva al aumentar la carga animal por hectárea, capturar carbono por medio de la plantación de árboles y un mejoramiento de la alimentación de animal reduciendo la emisión de metano.

Recuperación de corredores ribereños
Piedemonte llanero
Estado inicial: Julio 17, 2007
Agosto 15, 2008
13 meses
Octubre 22, 2008
15 meses

From a private perspective: 100% investment and O&M are assumed for farmers
Aggregated Priorities using MAC
curves

MAC curve for capture/reduction of CO2e emissions in some lines (fruit trees, rice and livestock) of the livestock sector in Colombia
Private perspective: 100% investment and O&M are assumed for farmers

Some challenges in the analysis

Mitigation of the sector, or per unit product?
-
10,000
20,000
30,000
40,000
50,000
60,000
20
09
20
10
20
11
20
12
20
13
20
14
20
15
20
16
20
17
20
18
20
19
20
20
20
21
20
22
20
23
20
24
20
25
20
26
20
27
20
28
20
29
20
30
20
31
GgC
O2
eq
Año
Emisiones CO2 proyectadas ganadería bovina
Cardenas, 2011

MAC curve focuses on EFFICIENCY (US$/Ton CO2e)
I – C___________________________
CO2e capture
Between two options with the same benefits, the option with less carbon is better
BUT CAUTION ABOUT INTERPRETATION

Private perspective
Public perspective

Methodological considerations
• Range of approaches for quantifying mitigation costs and benefits available
• Estimations should be stakeholder driven, and not ignore social/cultural/economic barriers
• Priorities based on efficiency of measures depend on the perspective of who is asking (e.g. government versus private)

Conclusions
• Apparent large opportunities for win-win measures, but care needed about analysingbarriers (e.g. cultural)
• Co-benefit of adaptation not quantified, but significant and should be included (also to avoid mal-adaptation through mitigation incentives)
• Entry point mitigation, or adaptation?

Email: [email protected]: http://dapa.ciat.cgiar.org