lower boise river subbasin assessment and total … boise river subbasin assessment and total...
TRANSCRIPT
Lower Boise River Subbasin Assessment and Total Maximum
Daily Load
2014 Total Phosphorus TMDL Addendum for the Lower Boise River, Mason Creek, and Sand Hollow Creek
Hydrologic Unit Code 17050114
Draft
State of Idaho Department of Environmental Quality
November 2014
Printed on recycled paper, DEQ November 2014, PID Enter PID #, CA code Enter CA Code #. Costs associated with this publication are available from the State of Idaho Department of Environmental Quality in accordance with Section 60-202, Idaho Code.
Cover Photo: Anglers in the lower Boise River near Star, Idaho (October 30, 2013).
Lower Boise River Subbasin Assessment and Total Maximum
Daily Load
2014 Total Phosphorus Addendum to Lower Boise River, Mason Creek, and Sand Hollow Creek TMDLs
November 2014
Prepared by Troy Smith
The Idaho Department of Environmental Quality Boise Regional Office 1445 N. Orchard Street
Boise, Idaho 83706
In Consultation with the Lower Boise Watershed Council
Acknowledgments
Lower Boise Watershed Council
Technical Advisory Committee (TAC) participants
Modeling, Technical, and Policy Workgroup participants
319 TAC participants
Bill Stewart, Ben Cope, and others at EPA
Alex Etheridge, Dorene Macoy, Chris Mebane, and others at USGS
Dick Park (Eco Modeling) and Jonathan Clough (Warren Pinnacle Consulting, Inc.)
Numerous personnel at DEQ, but particularly Darcy Sharp in the Technical Services
Division role as lead AQUATOX modeler on the project
DRAFT November 2014 Lower Boise River SBA and TMDL Addendum – Total Phosphorus DRAFT
iii DRAFT November 2014
Table of Contents
List of Tables .................................................................................................................................. v
List of Figures .............................................................................................................................. viii
Abbreviations, Acronyms, and Symbols ...................................................................................... xii
Executive Summary ..................................................................................................................... xiv
Subbasin at a Glance ................................................................................................................. xv
Key Findings ........................................................................................................................... xvii
TMDL Targets .......................................................................................................................... xix
May 1 – September 30 TMDL Allocations ............................................................................... xx
October 1 – April 30 TMDL Allocations .............................................................................. xxvii
Instream Periphyton and TP Reductions ............................................................................... xxxii
Public Participation .................................................................................................................... xl
Introduction ..................................................................................................................................... 1
Regulatory Requirements ............................................................................................................ 1
1 Subbasin Assessment—Subbasin Characterization ..................................................................... 2
1.2 Subwatershed Characteristics ................................................................................................ 2
2 Subbasin Assessment—Water Quality Concerns and Status..................................................... 12
2.1 Water Quality Limited Assessment Units Occurring in the Subbasin ................................ 12
2.1.1 Assessment Units .......................................................................................................... 12
2.2 Applicable Water Quality Standards and Beneficial Uses .................................................. 13
2.2.1 Existing Uses ................................................................................................................ 13
2.2.2 Designated Uses ............................................................................................................ 14
2.2.3 Undesignated Surface Waters and Presumed Use Protection....................................... 14
2.2.4 Man-made Waterways and Private Waters ................................................................... 14
2.2.5 Attainment of Beneficial Uses in the Subbasin ............................................................ 14
2.2.6 Criteria to Support Beneficial Uses .............................................................................. 16
2.3 Summary and Analysis of Existing Water Quality Data .................................................... 18
2.3.1 Data Gaps ...................................................................................................................... 32
2.3.2 Status of Beneficial Uses .............................................................................................. 33
3 Subbasin Assessment—Pollutant Source Inventory .................................................................. 33
3.1 Point Sources ....................................................................................................................... 34
3.2 Nonpoint Sources ................................................................................................................ 47
3.2.1 Agricultural Discharges ................................................................................................ 47
3.2.2 Background ................................................................................................................... 48
3.2.3 Ground Water and Unmeasured Sources ...................................................................... 49
3.3 Pollutant Transport .............................................................................................................. 50
DRAFT November 2014 Lower Boise River SBA and TMDL Addendum – Total Phosphorus DRAFT
iv DRAFT November 2014
4 Subbasin Assessment—Summary of Past and Present Pollution Control Efforts ..................... 50
4.1 Water Quality Monitoring ................................................................................................... 59
5 Total Maximum Daily Load(s) .................................................................................................. 60
5.1 Instream Water Quality Targets .......................................................................................... 61
5.1.1 Projected Conditions ..................................................................................................... 62
5.1.2 Target Selection (Lower Boise River) .......................................................................... 63
5.1.3 Target Selection (Mason Creek) ................................................................................... 66
5.1.4 Target Selection (Sand Hollow Creek) ......................................................................... 66
5.1.5 Water Quality Monitoring Points ................................................................................. 66
5.2 Load Capacity ..................................................................................................................... 67
5.2.1 TP Load Capacity to Meet SR-HC TMDL Target of < 0.07 mg/L May 1 –
September 30 ............................................................................................................. 67
5.2.2 TP Load Capacity to Meet Mean Monthly Benthic Chlorophyll-a Target of < 150
mg/m2 ........................................................................................................................ 74
5.3 Estimates of Existing Pollutant Loads ................................................................................ 76
5.3.1 Boise River and Mason Creek TP Loads (May 1 – September 30) .............................. 76
5.3.2 Boise River and Mason Creek TP Loads (October 1 – April 30) ................................. 85
5.3.3 Sand Hollow TP Loads (May 1 – September 30) ......................................................... 91
5.3.4 Sand Hollow TP Loads (October 1 – April 30) ............................................................ 93
5.4 Load and Wasteload Allocations ......................................................................................... 95
5.4.1 Boise River and Mason Creek TP Allocations to Meet the SR-HC TMDL Target of
< 0.07 mg/L May 1 – September 30 .......................................................................... 95
5.4.2 Boise River and Mason Creek TP Allocations to Meet the Mean Benthic
Chlorophyll-a Target ............................................................................................... 110
5.4.3 Sand Hollow TP Allocations to Meet the SR-HC TMDL Target of < 0.07 mg/L
May 1 – September 30 ............................................................................................. 132
5.4.4 Sand Hollow TP Allocations October 1 – April 30 .................................................... 133
5.4.5 Margin of Safety ......................................................................................................... 134
5.4.6 Seasonal Variation ...................................................................................................... 135
5.4.7 Reasonable Assurance ................................................................................................ 135
5.4.8 Reserve for Growth ..................................................................................................... 137
5.5 Implementation Strategies ................................................................................................. 138
5.5.1 Time Frame ................................................................................................................. 139
5.5.2 Approach ..................................................................................................................... 139
5.5.3 Responsible Parties ..................................................................................................... 139
5.5.4 Implementation Monitoring Strategy ......................................................................... 141
5.5.5 Water Quality Trading ................................................................................................ 142
6 Conclusions .............................................................................................................................. 143
References Cited ......................................................................................................................... 145
DRAFT November 2014 Lower Boise River SBA and TMDL Addendum – Total Phosphorus DRAFT
v DRAFT November 2014
GIS Coverages ......................................................................................................................... 150
Glossary ...................................................................................................................................... 151
Appendix A. Site-Specific Water Quality Standards and Criteria .............................................. 155
Appendix B. Data Sources .......................................................................................................... 158
Appendix C. Public Participation and Public Comments ........................................................... 161
Appendix D. Distribution List .................................................................................................... 165
List of Tables
Table 1.Summary of 303(d)-listed assessment units and outcomes in this TMDL. ................... xvii
Table 2. Gross load and wasteload allocations by sector for the lower Boise River, May 1 –
September 30, presented as daily averages. The green highlight represents data
derived from the USGS August 2012 mass balance model for the lower Boise River
(Etheridge 2013). .......................................................................................................... xxii
Table 3. Gross load and wasteload allocations by sector for the lower Boise River, May 1 –
September 30, expressed per day as monthly averages. .............................................. xxiii
Table 4. Point source wasteload and nonpoint source load allocations, May 1 – September 30,
for Sand Hollow, a Snake River tributary. Load and wasteload allocations are
expressed per day as monthly averages1. ..................................................................... xxv
Table 5. TP loads and water quality targets for October 1 – April 30, expressed per day as
monthly averages. These are calculated for: 1) the Boise River near Parma; 2) Mason
Creek, a lower Boise River tributary, and: 3) Sand Hollow, a Snake River tributary.xxvii
Table 6. Gross load and wasteload allocations by sector for the lower Boise River, October 1
– April 30, expressed per day as monthly averages. ................................................. xxviii
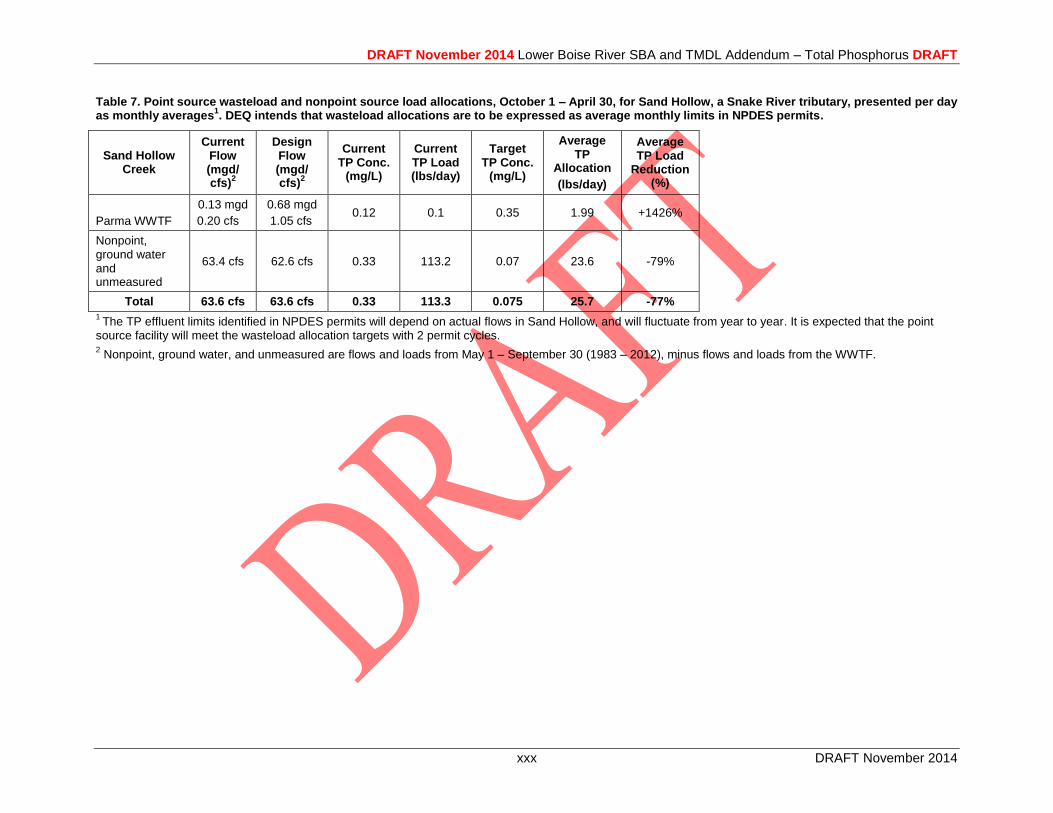
Table 7. Point source wasteload and nonpoint source load allocations, October 1 – April 30,
for Sand Hollow, a Snake River tributary. Load and wasteload allocations are
expressed per day as monthly averages1. ..................................................................... xxx
Table 8. Lower Boise River subbasin §303(d)-listed assessment unit and pollutant
combinations that are addressed in this TMDL. ............................................................. 13
Table 9. Lower Boise River subbasin beneficial uses of §303(d)-listed streams addressed in
this TMDL. ..................................................................................................................... 15
Table 10. Numeric criteria supportive of designated beneficial uses in Idaho water quality
standards. ........................................................................................................................ 16
Table 11. Results of USGS synoptic sampling on the lower Boise River in 2012 and 20131. ..... 28
Table 12. Results of USGS synoptic sampling on Mason Creek in 2012 and 20131. .................. 31
Table 13. Results of USGS synoptic sampling on Sand Hollow Creek in 2012 and 20131. ........ 32
Table 14. Data gaps identified during the development of the lower Boise River TMDL
addendum. ...................................................................................................................... 32
Table 15. Current annual point source discharge to the lower Boise River and the Snake
River. .............................................................................................................................. 34
DRAFT November 2014 Lower Boise River SBA and TMDL Addendum – Total Phosphorus DRAFT
vi DRAFT November 2014
Table 16. Annual stormwater (MS4) TP discharge to the lower Boise River (directly and
indirectly). ...................................................................................................................... 37
Table 17. 2010 Census Boise Urbanized Area and other areas (prepared by ACHD). ................ 38
Table 18. Impervious areas for Phase I, Phase II, and other areas in the lower Boise River
subbasin (prepared by ACHD). ...................................................................................... 39
Table 19. Active MSGP facilities permitted by the EPA in Ada and Canyon counties (August
2014). .............................................................................................................................. 43
Table 20. Annual tributary discharge to the lower Boise River and Snake River. ....................... 48
Table 21. Background concentrations for the lower Boise River near Parma. ............................. 49
Table 22. 319 project grants in the lower Boise River subbasin. ................................................. 52
Table 23. Best Management Practices (BMPs) installed in the lower Boise River Subbasin
between October 2008 and December 2013). ................................................................ 53
Table 24. TP loads and capacities for May 1 – September 30 presented as daily averages.
They are calculated for: 1) the Boise River near Parma; 2) Mason Creek, a Boise
River tributary, and: 3) Sand Hollow Creek, a Snake River tributary. .......................... 70
Table 25. Current permitted May 1 – September 30 point source TP discharge to the lower
Boise River and its tributaries. ....................................................................................... 78
Table 26. Current May 1 – September 30 stormwater (MS4) TP discharge to the lower Boise
River1. ............................................................................................................................. 80
Table 27. Current May 1 – September 30 tributary TP discharge to the Lower Boise River. ...... 82
Table 28. Current May 1 – September 30 ground water/unmeasured and background TP
discharge to the Lower Boise River. .............................................................................. 82
Table 29. Current sector TP loads for the lower Boise River, May 1 – September 30,
presented as daily averages. The green highlight represents data derived from the
USGS August 2012 mass balance model for the lower Boise River (Etheridge 2013). 83
Table 30. Current permitted October 1 – April 30 point source TP discharge to the lower
Boise River. .................................................................................................................... 86
Table 31. Current October 1 – April 30 stormwater (MS4) TP discharge to the lower Boise
River1. ............................................................................................................................. 88
Table 32. Current October 1 – April 30 tributary TP discharge to the Lower Boise River. ......... 89
Table 33. Current October 1 – April 30 ground water/unmeasured and background TP
discharge to the lower Boise River. ................................................................................ 89
Table 34. Current permitted May 1 – September 30 point source TP discharge to Sand Hollow
(a tributary to the Snake River). ..................................................................................... 91
Table 35. Current May 1 – September 30 nonpoint source TP discharge to Sand Hollow (a
tributary to the Snake River). ......................................................................................... 91
Table 36. Permitted October 1 – April 30 point source TP discharge to Sand Hollow (a
tributary to the Snake River). ......................................................................................... 93
Table 37. October 1 – April 30 nonpoint source TP discharge to Sand Hollow (a tributary to
the Snake River). ............................................................................................................ 93
DRAFT November 2014 Lower Boise River SBA and TMDL Addendum – Total Phosphorus DRAFT
vii DRAFT November 2014
Table 38. TP loads, capacities, and water quality targets for May 1 – September 30, presented
as daily averages. These are calculated for: 1) the Boise River near Parma; 2) Mason
Creek, a lower Boise River tributary, and: 3) Sand Hollow, a Snake River tributary. .. 99
Table 39. Gross load and wasteload allocations by sector for the lower Boise River, May 1 –
September 30, presented as daily averages. The green highlight represents data
derived from the USGS August 2012 mass balance model for the lower Boise River
(Etheridge 2013). .......................................................................................................... 100
Table 40. Gross load and wasteload allocations by sector for the lower Boise River, May 1 –
September 30, presented as daily averages. ................................................................. 103
Table 41. Point source wasteload allocations for the lower Boise River, May 1 – September
30. Wasteload allocations at TP concentrations of 0.1 mg/L are expressed per day as
monthly averages1,2, 3
.................................................................................................... 105
Table 42. Point source stormwater TP allocations for MS4-permitted and non-permitted areas
of the lower Boise River, May 1 – September 30. Wasteload and load allocations are
expressed per day as monthly averages1. ..................................................................... 107
Table 43. Agricultural nonpoint source tributary load allocations for the lower Boise River,
May 1 – September 30. Load allocations are expressed per day as monthly averages. 109
Table 44. Agricultural nonpoint source ground water, unmeasured, and background load
allocations for the lower Boise River, May 1 – September 30. Load allocations are
expressed per day as monthly averages1. ..................................................................... 110
Agricultural nonpoint source tributaries, ground water, and unmeasured (and dry weather
stormwater) loads were set at the concentration equivalent of 0.07 mg/L TP year-
round. However, agricultural tributaries and ground water/unmeasured segment
loads were adjusted > 0.07 mg/L, as appropriate, to account for TP contributions
from NPDES-permitted facilities or stormwater wet weather loads (Table 53 and
Table 54). ...................................................................................................................... 112
Table 45. Summary of AQUATOX model inputs for the final TMDL allocation scenario. ...... 114
Table 46. Summary of final TMDL scenario results for TP targets in model segment 13 (near
Parma). .......................................................................................................................... 115
Table 47. Summary of TMDL scenario results for mean monthly periphyton chlorophyll a
targets. .......................................................................................................................... 115
Table 48. Summary of TMDL scenario results for mean monthly TP concentrations. .............. 116
Table 49. Gross load and wasteload allocations by sector for the lower Boise River, October 1
– April 30, presented as daily averages. ....................................................................... 125
Table 50. Current projected TP loads for the lower Boise River from October 1 – April 30. ... 126
Table 51. Point source TP wasteload allocations for the lower Boise River subbasin.
Wasteload allocations are expressed per day as monthly averages1,2,3
. See Table 41 in
Section 5.4.1 for detailed description of the May – September TP allocations and
load reductions. ............................................................................................................. 127
Table 52. Point source stormwater (MS4) October – April TP wasteload allocations for the
lower Boise River subbasin. Wasteload allocations are expressed per day as monthly
averages1. See Table 42 in Section 5.4.1 for complete description of the May –
September TP allocations and load reductions. ............................................................ 129
DRAFT November 2014 Lower Boise River SBA and TMDL Addendum – Total Phosphorus DRAFT
viii DRAFT November 2014
Table 53. Agricultural nonpoint source tributary TP load allocations for the lower Boise River
subbasin. Load allocations are expressed per day as monthly averages. See Table 43
in Section 5.4.1 for complete description of the May – September TP allocations and
load reductions. ............................................................................................................. 130
Table B1. Data sources for lower Boise River subbasin assessment. ......................................... 158
List of Figures
Figure 1. The lower Boise River subbasin. The impaired AUs that are specifically addressed
in this TMDL addendum are identified by their AU number on the map (impaired
AUs in this TMDL addendum begin with 17050114). .................................................. xvi
Figure 2. TP loads, capacities, and water quality targets for May 1 – September 30, presented
as daily averages. These are calculated for: 1) the Boise River near Parma; 2) Mason
Creek, a lower Boise River tributary, and: 3) Sand Hollow, a Snake River tributary. . xxi
Figure 3. Current vs. projected TP loads for the lower Boise River from May 1 – September
30. ................................................................................................................................ xxiv
Figure 4. Current vs. projected TP loads for Sand Hollow Creek from May 1 – September 30.xxvi
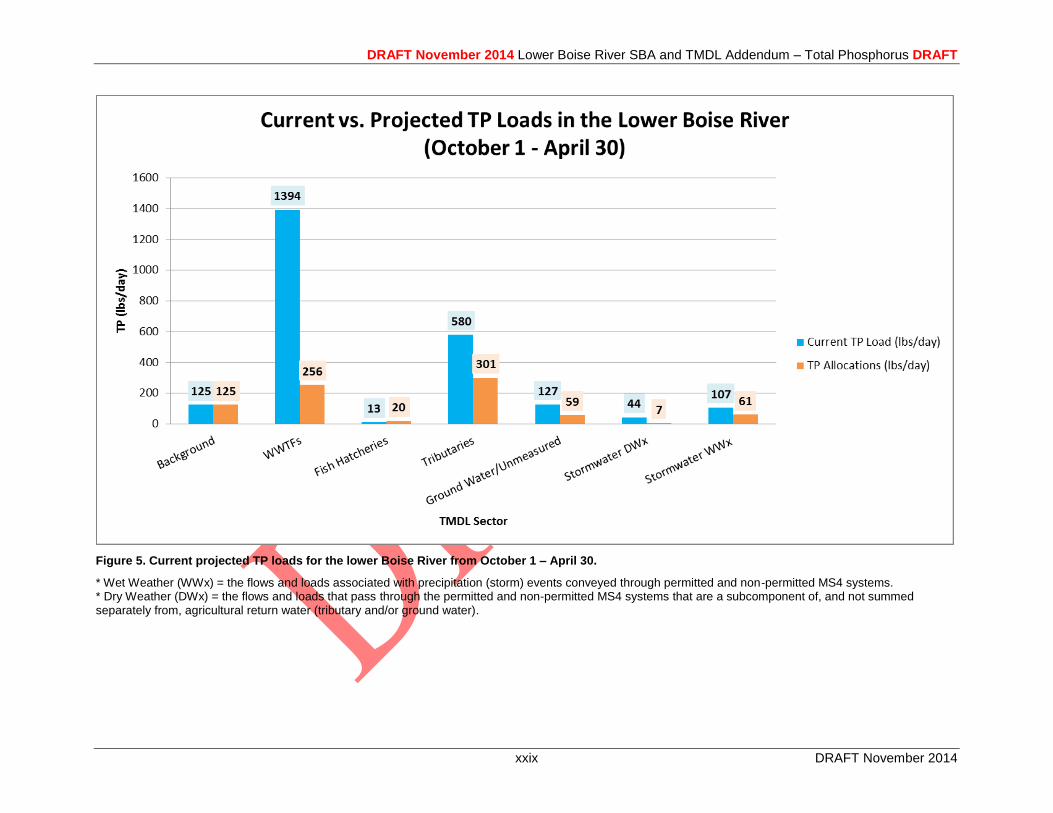
Figure 5. Current projected TP loads for the lower Boise River from October 1 – April 30. ... xxix
Figure 6. Current vs. projected TP loads for Sand Hollow Creek from October 1 – April 30. . xxxi
Figure 7. Current modeled mean monthly periphyton from January 1, 2012 through April 22,
2013. Model segments 9-13 correspond with the TP-impaired AUs of the lower
Boise River from Middleton to the mouth, near Parma. The red line indicates the
mean monthly periphyton target of 150 mg/m2. ........................................................ xxxiii
Figure 8. Predicted mean monthly periphyton from January 1, 2012 through April 22, 2013
under the final TMDL scenario (Scenario 3) and TP allocation structure. Model
segments 9-13 correspond with the TP-impaired AUs of the lower Boise River from
Middleton to the mouth, near Parma. The red line indicates the mean monthly
periphyton target of 150 mg/m2. ................................................................................ xxxiv
Figure 9. Current modeled mean monthly periphyton from January 1, 2012 through April 22,
2013 in the TP-impaired AUs of the lower Boise River. The red line indicates the
mean monthly periphyton target of 150 mg/m2. ......................................................... xxxv
Figure 10. Predicted mean monthly periphyton from January 1, 2012 through April 22, 2013
under the final TMDL scenario (Scenario 3) and TP allocation structure in the TP-
impaired AUs of the lower Boise River. The red line indicates the mean monthly
periphyton target of 150 mg/m2. ................................................................................ xxxvi
Figure 11. Current modeled monthly TP concentration from January 1, 2012 through April
22, 2013 in the TP-impaired AUs of the lower Boise River. The red line indicates the
EPA Gold Book recommended value of 0.1 mg/L. .................................................. xxxvii
Figure 12. Predicted modeled monthly TP concentration from January 1, 2012 through April
22, 2013 under the final TMDL scenario (Scenario 3) and TP allocation structure in
DRAFT November 2014 Lower Boise River SBA and TMDL Addendum – Total Phosphorus DRAFT
ix DRAFT November 2014
the TP-impaired AUs of the lower Boise River. The red line indicates the EPA Gold
Book recommended value of 0.1 mg/L. .................................................................. xxxviii
Figure 13. Annual average periphyton in model segments 9-13 (the impaired AUs of the
lower Boise River) under seven model scenarios. Further descriptions of each model
scenario are available in the preceding paragraphs and Section 5 of this TMDL. .... xxxix
Figure 14. The lower Boise River subbasin and delineation of subwatersheds (DEQ 2009). ........ 5
Figure 15. Land use in the lower Boise River Subbasin. ................................................................ 6
Figure 16. Lower Boise River dams and diversions (canals) permitted through the Idaho
Department of Water Resources (IDWR) (DEQ 2009). .................................................. 7
Figure 17. Diversions, drains, and tributaries along the lower Boise River, southwestern Idaho
(copied from Etheridge 2013). ......................................................................................... 8
Figure 18. Daily mean flows (cfs) in the lower Boise River at Diversion Dam (USBR), near
Middleton (Idaho Power Company), and near Parma (USGS). ....................................... 9
Figure 19. The lower Boise River subbasin. The impaired AUs specifically addressed in this
TMDL addendum are identified by their AU number on the map (impaired AUs in
this TMDL addendum begin with 17050114). ............................................................... 11
Figure 20. Determination steps and criteria for determining support status of beneficial uses in
wadeable streams (Grafe et al. 2002). ............................................................................ 18
Figure 21. DEQ BURP sites in the lower Boise River Subbasin.................................................. 22
Figure 22. TP data collected by USGS on the lower Boise River. The green boxes, indicate
the 25th
and 75th
data percentiles and are parted by the line representing the median
value. Measured values below the detection limit at Diversion were given the
detection limit as a conservative value. The error bars indicate maximum and
minimum observed values. Note, although not fully shown on the figure (for
readability), the Parma maximum TP value reaches 3.9 mg/L. ..................................... 23
Figure 23. Suspended sediment concentration (SSC) data collected by USGS on the lower
Boise River. The green boxes, indicate the 25th
and 75th
data percentiles, and are
parted by the line representing the median value. The error bars indicate maximum
and minimum observed values. Note, although not fully shown on the figure (for
readability), the Parma maximum SSC value reaches 664 mg/L. .................................. 24
Figure 24. Periphyton chlorophyll a data collected by USGS on the lower Boise River. The
green boxes, indicate the 25th
and 75th
data percentiles, and are parted by the line
representing the median value. The error bars indicate maximum and minimum
observed values. Note, although not fully shown on the figure (for readability), the
Caldwell maximum chlorophyll a value reaches 933 mg/m2. ........................................ 25
Figure 25. Summary of periphytic algal community compositions on the lower Boise River
(Rushforth 2007, as displayed in DEQ 2014). ............................................................... 26
Figure 26. DEQ depiction (DEQ 2014c) of algal community composition in sampled
segments, based on previous analyses in the lower Boise River (Rushforth 2007b).
Segment 1 = Eckert Road; Segment 2 = Veteran’s Parkway; Segment 3 = Glenwood
Bridge; Segment 8 = Middleton; Segment 9 = Caldwell; Segment 13 = Parma. ........... 27
Figure 27. Orthophosphorus to TP ratios relative to instantaneous river discharge as measured
by the USGS on the lower Boise River near Parma. The OP:TP ratios are presented
DRAFT November 2014 Lower Boise River SBA and TMDL Addendum – Total Phosphorus DRAFT
x DRAFT November 2014
relative to the instantaneous measure discharge of the Boise River measured
concurrently. Note: DEQ excluded two potential outlier data points due to
disproportionate influence on the analysis: 1) OP:TP ratio of 0.053 in August 2009,
and 2) OP:TP ratio of 0.125 in September 1988. ........................................................... 29
Figure 28. Orthophosphorus to TP ratios from USGS data on the lower Boise River near
Parma. The green boxes, indicate the 25th
and 75th
data percentiles, and are parted by
the line representing the median value. The error bars indicate the maximum and
minimum observed values. Note: DEQ excluded two potential outlier data points due
to disproportionate influence on the analysis: 1) a low OP:TP ratio of 0.053 in
August 2009, and 2) a low OP:TP ratio of 0.125 in September 1988. ........................... 30
Figure 29. Map of Ada County stormwater management areas (prepared by ACHD). ............... 40
Figure 30. Map of Canyon County stormwater management areas (prepared by ACHD)........... 41
Figure 31. Table 4.0.9. and associated text from the 2004 SR-HC TMDL (DEQ and ODEQ
2004). The TP load allocation of 242 kg/day converts to approximately 533.5
lbs/day. ............................................................................................................................ 64
Figure 32. Flow duration curve for the lower Boise River near Parma from May 1 –
September 30, 1987-2012. .............................................................................................. 71
Figure 33. Long-term TP concentrations for the lower Boise River in relation to the
concentration target of < 0.07 mg/L May 1 – September 30. Note: DEQ excluded a
potential outlier data point from the figure and analyses due to disproportionate
influence: a TP concentration of 2 mg/L associated with an 80th
percentile flow on
September 21, 1988. ....................................................................................................... 72
Figure 34. Long-term TP loads for the lower Boise River in relation to the TP load equivalent
target of < 0.07 mg/L May 1 – September 30. Note: DEQ excluded a potential outlier
data point from the figure and analyses due to disproportionate influence: a TP load
of 5544 lbs/day associated with an 80.5th
percentile flow on September 21, 1988. ....... 73
Figure 35. USGS benthic chlorophyll a samples in the lower Boise River between 1995 and
2013. Note, some value differences may reflect different sampling methodologies. .... 75
Figure 36. Current stormwater wet weather TP concentrations. .................................................. 81
Figure 37. Current TP loads in the lower Boise River from May 1 – September 30, based on
average daily total TP inputs of approximately 3121 lbs/day for the 90th
, 60th
, and
40th
percentile flow conditions (the 10th
flow conditions were omitted due to negative
ground water flow and loading estimates). ..................................................................... 84
Figure 38. Current TP loads in the lower Boise River from October 1 – April 30, based on
average daily total TP inputs of approximately 2302 lbs/day. ....................................... 90
Figure 39. Current TP loads in Sand Hollow Creek May 1 – September 30, based on average
daily total TP inputs of approximately 301 lbs/day. ....................................................... 92
Figure 40. Current TP loads in Sand Hollow Creek from October 1 – April 30, based on
average daily total TP inputs of approximately 113 lbs/day. ......................................... 94
Figure 41. TP allocation targets (orange markers and labels) for the lower Boise River near
Parma, relative to current TP loads (blue markers and labels) and the TP target load
equivalent of < 0.07 mg/L (red line). The green markers and labels represent the
DRAFT November 2014 Lower Boise River SBA and TMDL Addendum – Total Phosphorus DRAFT
xi DRAFT November 2014
loads derived from the USGS August 2012 synoptic sampling event (Etheridge
2013). ............................................................................................................................ 101
Figure 42. TP concentration targets (orange markers and labels) for the lower Boise River
near Parma, relative to Current TP concentrations (blue markers and labels) and TP
target concentration of < 0.07 mg/L (red line). The green markers and labels
represent the current load derived from the USGS August 2012 synoptic sampling
event (Etheridge 2013). ................................................................................................ 102
Figure 43. Current vs. projected TP loads for the lower Boise River from May 1 – September
30. ................................................................................................................................. 104
Figure 44. Current vs. projected stormwater wet weather TP concentrations (year-round). ...... 108
Figure 45. Annual average periphyton in model segments 9-13 (the impaired AUs of the
lower Boise River) under seven model scenarios. Further descriptions of each model
scenario are available in the preceding paragraphs. ..................................................... 117
Figure 46. Scenario 1 – Existing Conditions. Current modeled mean monthly periphyton from
January 1, 2012 through April 22, 2013. Model segments 9-13 correspond with the
TP-impaired AUs of the lower Boise River from Middleton to the mouth, near
Parma. The red line indicates the mean monthly periphyton target of 150 mg/m2. ..... 118
Figure 47. Scenario 3 – Predicted mean monthly periphyton from January 1, 2012 through
April 22, 2013 under the final TMDL scenario and TP allocation structure. Model
segments 9-13 correspond with the TP-impaired AUs of the lower Boise River from
Middleton to the mouth, near Parma. The red line indicates the mean monthly
periphyton target of 150 mg/m2. ................................................................................... 119
Figure 48. Current modeled mean monthly periphyton from January 1, 2012 through April 22,
2013 in the TP-impaired AUs of the lower Boise River. The red line indicates the
mean monthly periphyton target of 150 mg/m2. ........................................................... 121
Figure 49. Predicted mean monthly periphyton from January 1, 2012 through April 22, 2013
under the final TMDL scenario (Scenario 3) and TP allocation structure in the TP-
impaired AUs of the lower Boise River. The red line indicates the mean monthly
periphyton target of 150 mg/m2. ................................................................................... 122
Figure 50. Current modeled monthly TP concentration from January 1, 2012 through April
22, 2013 in the TP-impaired AUs of the lower Boise River. The red line indicates the
EPA Gold Book recommended value of 0.1 mg/L. ...................................................... 123
Figure 51. Predicted modeled monthly TP concentration from January 1, 2012 through April
22, 2013 under the final TMDL scenario (Scenario 3) and TP allocation structure in
the TP-impaired AUs of the lower Boise River. The red line indicates the EPA Gold
Book recommended value of 0.1 mg/L. ....................................................................... 124
Figure 52. Current vs. projected TP loads for Sand Hollow Creek from May 1 – September
30. ................................................................................................................................. 132
Figure 53. Current vs. projected TP loads for Sand Hollow Creek from October 1 – April 30. 134
DRAFT November 2014 Lower Boise River SBA and TMDL Addendum – Total Phosphorus DRAFT
xii DRAFT November 2014
Abbreviations, Acronyms, and Symbols
§303(d) refers to section 303
subsection (d) of the Clean
Water Act, or a list of
impaired water bodies
required by this section
μ micro, one-one thousandth
§ section (usually a section of
federal or state rules or
statutes)
AU assessment unit
AWS agricultural water supply
BAG basin advisory group
BMP best management practice
BOR United States Bureau of
Reclamation
BURP Beneficial Use
Reconnaissance Program
CFR Code of Federal Regulations
(refers to citations in the
federal administrative rules)
cfs cubic feet per second
CWAL cold water aquatic life
DEQ Idaho Department of
Environmental Quality
DMA Designated Management
Agency
DO dissolved oxygen
DWS domestic water supply
EPA United States Environmental
Protection Agency
GIS geographic information
system
HUC hydrologic unit code
IDAPA Refers to citations of Idaho
administrative rules
IDFG Idaho Department of Fish and
Game
IDL Idaho Department of Lands
IDWR Idaho Department of Water
Resources
LA load allocation
LBWC Lower Boise Watershed
Council
LC load capacity
m meter
mgd million gallons per day
mg/L milligrams per liter
mL milliliter
MOS margin of safety
MS4 municipal separate storm
sewer system
n/a not applicable
NA not assessed
NB natural background
NFS not fully supporting
NPDES National Pollutant Discharge
Elimination System
NRCS Natural Resources
Conservation Service
DRAFT November 2014 Lower Boise River SBA and TMDL Addendum – Total Phosphorus DRAFT
xiii DRAFT November 2014
NTU nephelometric turbidity unit
PCR primary contact recreation
QA quality assurance
RM river mile
SBA subbasin assessment
SCR secondary contact recreation
SS salmonid spawning
SSC suspended sediment
concentration
TAC technical advisory committee
TMDL total maximum daily load
TN total nitrogen
TP total phosphorus
TSS total suspended sediment
US United States
USC United States Code
USDA United States Department of
Agriculture
USFS United States Forest Service
USGS United States Geological
Survey
WAG watershed advisory group
WBAG Water Body Assessment
Guidance
WBID water body identification
number
WLA wasteload allocation
WWTF wastewater treatment facility
DRAFT November 2014 Lower Boise River SBA and TMDL Addendum – Total Phosphorus DRAFT
xiv DRAFT November 2014
Executive Summary
The federal Clean Water Act requires that states and tribes restore and maintain the chemical,
physical, and biological integrity of the nation’s waters. States and tribes, pursuant to
Section 303 of the Clean Water Act, are to adopt water quality standards necessary to protect
fish, shellfish, and wildlife while providing for recreation in and on the nation’s waters. Section
303(d) of the Clean Water Act establishes requirements for states and tribes to identify and
prioritize water bodies that are water quality limited (i.e., water bodies that do not meet water
quality standards).
States and tribes must periodically publish a priority list (a “§303(d) list”) of impaired waters.
Currently, this list is published every 2 years as the list of Category 5 water bodies in Idaho’s
Integrated Report. For waters identified on this list, states and tribes must develop a total
maximum daily load (TMDL) for the pollutants, set at a level to achieve water quality standards.
This document addresses 3 water bodies (5 assessment units) in the lower Boise River subbasin
that have been placed in Category 5 of Idaho’s most recent federally approved 2012 Integrated
Report (DEQ 2014c).
This addendum describes the key physical and biological characteristics of the subbasin; water
quality concerns and status; pollutant sources; and recent pollution control actions in the lower
Boise River subbasin, located in southwest Idaho. For more detailed information about the
subbasin and previous TMDLs, see the lower Boise River Subbasin Assessment, TMDLs,
Addendums, and Five-Year Review (DEQ 1999, 2008, 2009, 2010b).
The TMDL analysis establishes water quality targets and load capacities, estimates existing
pollutant loads, and allocates responsibility for load reductions needed to return listed waters to a
condition meeting water quality standards. It also identifies implementation strategies—
including reasonable time frames, approach, responsible parties, and monitoring strategies—
necessary to achieve load reductions and meet water quality standards.
This addendum addresses total phosphorus (TP) in the lower Boise River and Mason Creek
between Diversion Dam and Parma, along with Sand Hollow Creek, a tributary to the Snake
River. Nuisance levels of aquatic growth associated with TP in the lower Boise River (also
referred to as the “LBR”) from Middleton to the mouth were associated with impaired cold water
aquatic life and contact recreation in the 2012 Integrated Report. Within the physically-complex
network of the lower Boise River watershed, tributaries, irrigation conveyances, ground water,
unmeasured flows, and other nonpoint sources, along with Wastewater Treatment Facilities
(WWTF), Municipal Separate Storm Sewer Systems (MS4), industrial wastewater and
stormwater sources, and other point sources affect TP levels and nuisance algae in the subbasin.
This total maximum daily load (TMDL) addendum quantifies TP pollutant sources and allocates
responsibility for load and wasteload allocations needed for the lower Boise River, Mason Creek,
and Sand Hollow Creek, to meet water quality objectives. For more detailed information about
the subbasin and previous TMDLs and Implementation Plans, see:
Sediment and Bacteria Allocations Addendum to the Lower Boise River TMDL (DEQ
2008a)
Lower Boise River TMDL Five-Year Review (DEQ 2009)
DRAFT November 2014 Lower Boise River SBA and TMDL Addendum – Total Phosphorus DRAFT
xv DRAFT November 2014
Lower Boise River Implementation Plan Total Phosphorus (DEQ 2008)
Snake River – Hells Canyon Total Maximum Daily Load (TMDL; DEQ and ODEQ
2004).
Implementation Plan for the Lower Boise River Total Maximum Daily Load (DEQ
2003)
Lower Boise River TMDL Subbasin Assessment Total Maximum Daily Loads (DEQ
1999),
Lower Boise River Nutrient and Tributary Subbasin Assessments (DEQ 2001a)
Lake Lowell TMDL: Addendum to the Lower Boise River Subbasin Assessment and
Total Maximum Daily Loads (DEQ 2010b)
Mason Creek Subbasin Assessment (2001c)
Sand Hollow Creek Subbasin Assessment (2001d) (tributary to the Snake River)
Subbasin at a Glance
The lower Boise River Subbasin is identified in the Idaho water quality standards as water body
ID17050114, with 36 AUs and several site-specific standards described under Section 140.12
(IDAPA 58.01.02). As described in the Lower Boise River TMDL (DEQ, 1999), the subbasin
drains approximately 1,290 square miles of rangeland, forests, agricultural lands and urban areas
into the Snake River at the confluence between the cities of Adrian and Nyssa, Oregon. The
lower Boise River is a 64-mile long 7th-order stream, which flows northwest from the Lucky
Peak Dam outfall east of Boise, through Ada and Canyon counties, to its mouth on the Snake
River near Parma, Idaho. The subbasin also drains portions of Elmore, Gem, Payette, and Boise
counties. There are at least seven 3rd order, one 4th order, and one 6th order tributaries to the
lower Boise River (Figure 1).
Another 6th order stream, Sand Hollow Creek, is included in the subbasin but drains to the Snake
River approximately one mile north of the mouth of the lower Boise River (Figure 1).
This addendum specifically addresses the following five impaired AUs:
Boise River–Middleton to Indian Creek (ID17050114SW005_06b)
Boise River–Indian Creek to Mouth (ID17050114SW001_06)
Mason Creek–Entire Watershed (ID17050114SW006_02)
Sand Hollow Creek–C Line Canal to I-84 (ID17050114SW016_03)
Sand Hollow Creek–Sharp Road to Snake River (ID17050114SW017_06)
Tributary and upstream AUs that are not listed as impaired are addressed as pollutant sources to
the downstream impaired AUs, listed above.
The impaired beneficial uses in the subbasin are cold water aquatic life, contact recreation, and
salmonid spawning (SS). TP pollutant sources include upstream contributions (background),
WWTFs, stormwater, industrial discharges, agricultural and irrigation returns, ground water and
unmeasured sources (e.g. drains and septic systems).
DRAFT November 2014 Lower Boise River SBA and TMDL Addendum – Total Phosphorus DRAFT
xvi DRAFT November 2014
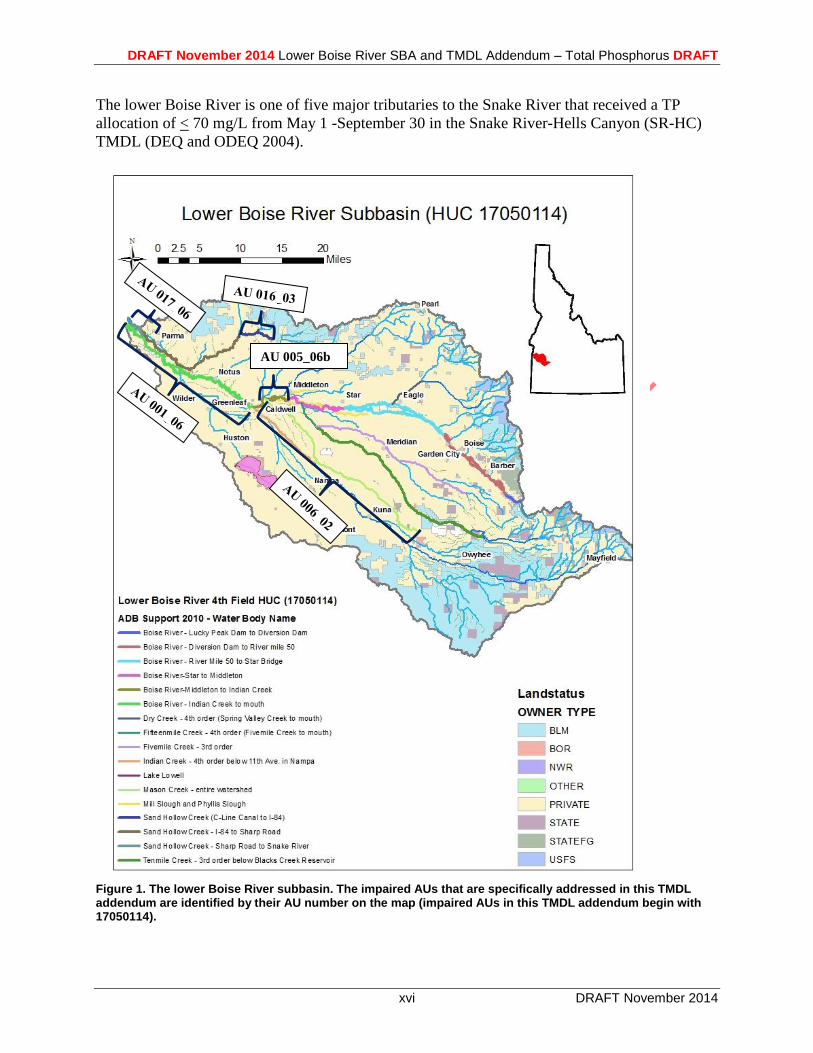
The lower Boise River is one of five major tributaries to the Snake River that received a TP
allocation of < 70 mg/L from May 1 -September 30 in the Snake River-Hells Canyon (SR-HC)
TMDL (DEQ and ODEQ 2004).
Figure 1. The lower Boise River subbasin. The impaired AUs that are specifically addressed in this TMDL addendum are identified by their AU number on the map (impaired AUs in this TMDL addendum begin with 17050114).
AU 005_06b
DRAFT November 2014 Lower Boise River SBA and TMDL Addendum – Total Phosphorus DRAFT
xvii DRAFT November 2014
Key Findings
Data analysis for a 5-year review of the Lower Boise River TP TMDL was completed in 2009
(DEQ 2009). This document is available at: http://www.deq.idaho.gov/water-quality/surface-
water/tmdls/table-of-sbas-tmdls/boise-river-lower-subbasin.aspx.
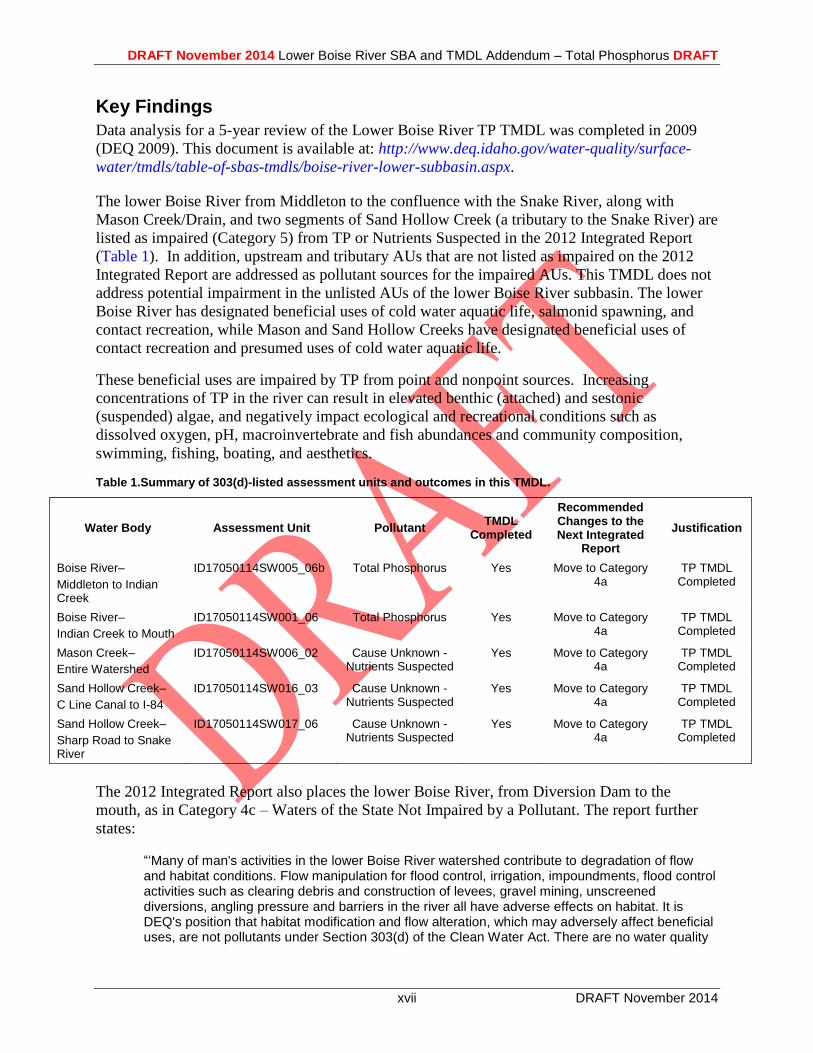
The lower Boise River from Middleton to the confluence with the Snake River, along with
Mason Creek/Drain, and two segments of Sand Hollow Creek (a tributary to the Snake River) are
listed as impaired (Category 5) from TP or Nutrients Suspected in the 2012 Integrated Report
(Table 1). In addition, upstream and tributary AUs that are not listed as impaired on the 2012
Integrated Report are addressed as pollutant sources for the impaired AUs. This TMDL does not
address potential impairment in the unlisted AUs of the lower Boise River subbasin. The lower
Boise River has designated beneficial uses of cold water aquatic life, salmonid spawning, and
contact recreation, while Mason and Sand Hollow Creeks have designated beneficial uses of
contact recreation and presumed uses of cold water aquatic life.
These beneficial uses are impaired by TP from point and nonpoint sources. Increasing
concentrations of TP in the river can result in elevated benthic (attached) and sestonic
(suspended) algae, and negatively impact ecological and recreational conditions such as
dissolved oxygen, pH, macroinvertebrate and fish abundances and community composition,
swimming, fishing, boating, and aesthetics.
Table 1.Summary of 303(d)-listed assessment units and outcomes in this TMDL.
Water Body Assessment Unit Pollutant TMDL
Completed
Recommended Changes to the Next Integrated
Report
Justification
Boise River–
Middleton to Indian Creek
ID17050114SW005_06b Total Phosphorus Yes Move to Category 4a
TP TMDL Completed
Boise River–
Indian Creek to Mouth
ID17050114SW001_06 Total Phosphorus Yes Move to Category 4a
TP TMDL Completed
Mason Creek–
Entire Watershed
ID17050114SW006_02 Cause Unknown - Nutrients Suspected
Yes Move to Category 4a
TP TMDL Completed
Sand Hollow Creek–
C Line Canal to I-84
ID17050114SW016_03 Cause Unknown - Nutrients Suspected
Yes Move to Category 4a
TP TMDL Completed
Sand Hollow Creek–
Sharp Road to Snake River
ID17050114SW017_06 Cause Unknown - Nutrients Suspected
Yes Move to Category 4a
TP TMDL Completed
The 2012 Integrated Report also places the lower Boise River, from Diversion Dam to the
mouth, as in Category 4c – Waters of the State Not Impaired by a Pollutant. The report further
states:
“‘Many of man's activities in the lower Boise River watershed contribute to degradation of flow and habitat conditions. Flow manipulation for flood control, irrigation, impoundments, flood control activities such as clearing debris and construction of levees, gravel mining, unscreened diversions, angling pressure and barriers in the river all have adverse effects on habitat. It is DEQ's position that habitat modification and flow alteration, which may adversely affect beneficial uses, are not pollutants under Section 303(d) of the Clean Water Act. There are no water quality
DRAFT November 2014 Lower Boise River SBA and TMDL Addendum – Total Phosphorus DRAFT
xviii DRAFT November 2014
standards for habitat or flow, nor are they suitable for estimation of load capacity or load allocations. Because of these practical limitations, TMDLs will not be developed to address habitat modification or flow alteration.’ (p.48, LBR TMDL, IDEQ, 2000).”
The lower Boise River TP TMDL addendum relies on a staged implementation strategy as
referenced in EPA’s Phased TMDL Clarification memo (EPA 2006). The staged implementation
strategy for the lower Boise River acknowledges that NPDES-permitted point sources will strive
to meet the TMDL target as soon as possible, but can be given up to two permit cycles (10 years
from the approval of the TMDL) to achieve their wasteload allocations.
The lower Boise River TP TMDL addendum, however, does not define an implementation time
frame for agricultural nonpoint sources; rather, implementation would begin as soon as possible
and continue until the load allocation targets are met. This acknowledges that successfully
achieving the TMDL targets and nonpoint source allocations will depend on voluntary measures,
including but not limited to, available funding, cost-sharing, willing partners, and opportunities
for water quality trading.
DEQ, through the lower Boise River TP TMDL addendum, encourages water quality trading to
the extent possible and practicable. Water quality trading implementation and details specific to
the lower Boise River subbasin will be subsequently developed in an updated water quality
trading framework upon completion of the TMDL addendum (see Water Quality Trading,
section 5.5.5), which will update the existing water quality trading guidance (DEQ 2012).
Additionally, an updated implementation plan will be developed by designated management
agencies, including the Idaho Soil and Water Conservation Commission (SWCC), to address
load reductions.
Idaho code 39-3611 provides for the review of TMDLs, their allocations, and their assumptions
every 5 years. Accordingly, the lower Boise River TP TMDL addendum should include
compliance monitoring to assess the 5-year benchmarks, and new data obtained during
implementation will help measure the success of reaching water quality goals for both the SR-
HC target attainment and beneficial use attainment in the lower Boise River subbasin. During the
post-TMDL implementation, monitoring and analyses should be conducted under DEQ, USGS,
EPA, or other scientifically-defensible and approved protocols.
Recognizing the many uncertainties in achieving the agricultural nonpoint source load
allocations over the long-term, an adaptive management-type approach for implementation
should address:
• Available funding, cost-sharing, willing partners to help manage agricultural nonpoint
source TP contributions,
• Effectiveness of agricultural BMPs,
• Ability of ground water phosphorus levels to recover in land conversion and nutrient
reduction areas,
• Future drainage and water management policies,
• Rate of land use conversion, and
• Effects of land use conversion on runoff and infiltration,
DRAFT November 2014 Lower Boise River SBA and TMDL Addendum – Total Phosphorus DRAFT
xix DRAFT November 2014
TMDL Targets This TMDL addendum focuses on two primary targets:
1. May 1 – September 30: TP concentrations (and TP load equivalents1) < 0.07 mg/L in the
lower Boise River near Parma and in Sand Hollow Creek to meet the 2004 Snake River-
Hells Canyon TMDL TP target; and
2. Mean Monthly Benthic Chlorophyll a: TP concentrations (and TP load equivalent)
correlated with a mean monthly benthic chlorophyll-a (periphyton) < 150 mg/m2:
a. Within the two §303(d)-listed (impaired) AUs on the main stem lower Boise
River
1 ID17050114SW005_06b (Middleton to Indian Creek)
2 ID17050114SW001_06 (Indian Creek to the mouth)
b. With different TP allocations to meet the monthly periphyton target for the
seasons
1 May 1 – September 30
2 October 1 – April 30
Achieve the SR-HC TMDL Target of TP < 0.07 from May 1 – September 30
The final Snake River-Hells Canyon (SR-HC) TMDL was approved by EPA in September 2004
(DEQ and ODEQ 2004). The TMDL addressed point and nonpoint sources within the 2,500
square miles that discharge or drain directly to the Snake River from where it intersects the
Oregon/Idaho border near Adrian, Oregon (Snake River Mile 409) to immediately upstream of
the inflow of the Salmon River (River Mile 188). Five major tributaries received gross
phosphorus allocations at their mouths, including the lower Boise River. The SR-HC TMDL was
developed with the assumption that the three major Idaho and two major Oregon tributaries
would develop individual nutrient TMDLs or plans for implementation that satisfy final SR-HC
nutrient TMDL requirements. Load allocations were developed to achieve target TP
concentrations of < 0.07 mg/L in the Snake River and Brownlee Reservoir, particularly during
periods when dissolved oxygen levels are low. Compliance with the SR-HC TMDL was
determined by applying a TP target of < 0.07 mg/L at the mouth of the lower Boise River (near
Parma) from May 1 – September 30.
The lower Boise River TMDL utilizes a flow duration curve with water quality targets to
develop a tiered load reduction approach needed to meet the May 1 – September 30 TP target <
0.07 mg/L identified in the SR-HC TMDL. This analysis utilized the USGS August 2012 mass
balance model (Etheridge 2013), along with long-term flow and TP concentration data from the
lower Boise River. The final TP allocations were developed to also meet a mean monthly
periphyton target of < 150 mg/m2 in the lower Boise River. As a result, the TP allocations in this
TMDL represent the TP loadings that are assured to meet both the SR-HC TMDL and lower
1 TP load equivalent, for purposes of this TMDL, is defined as the mass of TP (e.g. lbs/day, kg/day) that corresponds
with an identified TP concentration (mg/L).
DRAFT November 2014 Lower Boise River SBA and TMDL Addendum – Total Phosphorus DRAFT
xx DRAFT November 2014
Boise River monthly periphyton target from May – September, and not the maximum potential
TP loadings into the lower Boise River that would solely meet the SR-HC TMDL target.
Achieve the Mean Monthly Benthic Chlorophyll a Target
The TMDL also utilizes the AQUATOX model, USGS 2012 and 2013 synoptic sampling data,
historical data, and other available information to develop TP allocations needed to achieve mean
monthly benthic (periphyton) chlorophyll a of < 150 mg/m2 within the two impaired AUs of the
lower Boise River. If it appears that full support of beneficial uses in the lower Boise River are
not being attained during the 5-year review or subsequent post-TMDL implementation other
habitat measures will be considered to further reduce periphyton growth.
TMDL Allocation Scenario
The final model scenario (Scenario 3) and TMDL allocation structure that meets the May 1 –
September 30 TP target of 0.07 mg/L near Parma, as well as achieves the 150 mg/m2 mean
monthly periphyton target is as follows:
Scenario 3 – Final Model Scenario and TMDL Allocation Structure
o Point sources at 0.1 mg/L TP May – September
o Point Sources 0.35 mg/L TP October – April (except IDFG Eagle and Nampa
Facilities set at 0.1 year-round)
o Agricultural tributaries and ground water at 0.07 mg/L TP year-round
o Stormwater wet weather TP loads reduced by 42%
May 1 – September 30 TMDL Allocations
The following TP sector allocations represent the gross load and load reductions necessary to
achieve:
The SR-HC TMDL target of < 0.07 mg/L at the mouth of the lower Boise River and
Sand Hollow Creek, and
The mean monthly periphyton target of < 150 mg/m2 within the impaired AUs of the
lower Boise River
DRAFT November 2014 Lower Boise River SBA and TMDL Addendum – Total Phosphorus DRAFT
xxi DRAFT November 2014
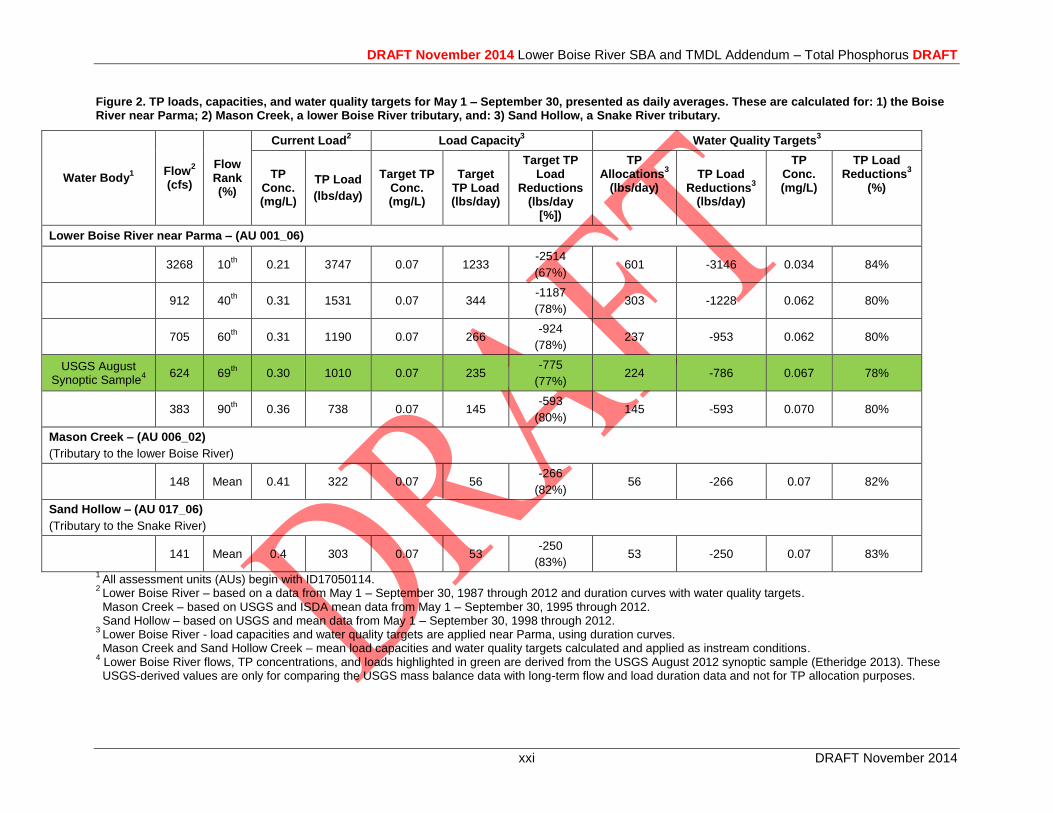
Figure 2. TP loads, capacities, and water quality targets for May 1 – September 30, presented as daily averages. These are calculated for: 1) the Boise River near Parma; 2) Mason Creek, a lower Boise River tributary, and: 3) Sand Hollow, a Snake River tributary.
Water Body1
Flow2
(cfs)
Flow Rank (%)
Current Load2
Load Capacity3
Water Quality Targets3
TP Conc. (mg/L)
TP Load
(lbs/day)
Target TP Conc. (mg/L)
Target TP Load (lbs/day)
Target TP Load
Reductions (lbs/day
[%])
TP Allocations
3
(lbs/day) TP Load
Reductions3
(lbs/day)
TP Conc. (mg/L)
TP Load Reductions
3
(%)
Lower Boise River near Parma – (AU 001_06)
3268 10th 0.21 3747 0.07 1233
-2514
(67%) 601 -3146 0.034 84%
912 40th 0.31 1531 0.07 344
-1187
(78%) 303 -1228 0.062 80%
705 60th 0.31 1190 0.07 266
-924
(78%) 237 -953 0.062 80%
USGS August Synoptic Sample
4 624 69th
0.30 1010 0.07 235 -775
(77%) 224 -786 0.067 78%
383 90
th 0.36 738 0.07 145
-593
(80%) 145 -593 0.070 80%
Mason Creek – (AU 006_02)
(Tributary to the lower Boise River)
148 Mean 0.41 322 0.07 56 -266
(82%) 56 -266 0.07 82%
Sand Hollow – (AU 017_06)
(Tributary to the Snake River)
141 Mean 0.4 303 0.07 53 -250
(83%) 53 -250 0.07 83%
1 All assessment units (AUs) begin with ID17050114.
2 Lower Boise River – based on a data from May 1 – September 30, 1987 through 2012 and duration curves with water quality targets.
Mason Creek – based on USGS and ISDA mean data from May 1 – September 30, 1995 through 2012. Sand Hollow – based on USGS and mean data from May 1 – September 30, 1998 through 2012. 3
Lower Boise River - load capacities and water quality targets are applied near Parma, using duration curves. Mason Creek and Sand Hollow Creek – mean load capacities and water quality targets calculated and applied as instream conditions. 4 Lower Boise River flows, TP concentrations, and loads highlighted in green are derived from the USGS August 2012 synoptic sample (Etheridge 2013). These
USGS-derived values are only for comparing the USGS mass balance data with long-term flow and load duration data and not for TP allocation purposes.

DRAFT November 2014 Lower Boise River SBA and TMDL Addendum – Total Phosphorus DRAFT
xxii DRAFT November 2014
Table 2. Gross load and wasteload allocations by sector for the lower Boise River, May 1 – September 30, presented as daily averages. The green highlight represents data derived from the USGS August 2012 mass balance model for the lower Boise River (Etheridge 2013). See Section 5.4.1 for further description of the TP allocation development.
1 Background TP concentration of 0.018 mg/L was utilized based on 2005 – 2013 USGS Diversion Dam data, with detection levels of 0.01 mg/L (see Section
3.2.2). Long-term median data and the USGS 2012-2013 synoptic data (Etheridge 2013) indicate background concentrations of 0.02 and 0.015 mg/L. 2 WWTF and industrial discharge data are based on facility design flows, represented in Table 25. The USGS August 2012 synoptic sample data represent only
WWTF contributions from Lander, West Boise, Meridian, Middleton, Nampa, and Caldwell facilities (Etheridge 2013). 3
Fish Hatchery data represent the Idaho Fish and Game Eagle and Nampa facilities identified in Table 25.
4 Tributary data were calculated by removing all WWTF, industrial, and aquaculture design flows, concentrations, and loads that discharge into tributaries. The
USGS August 2012 synoptic sample calculated tributaries by removing the contributions from only the Meridian and Nampa facilities (Etheridge 2013). 5 The USGS August 2012 mass balance model was used to adjust ground water flows, including ground water loss (-1315) under various river flow scenarios (Alex
Etheridge, pers. comm. 2014). The USGS August 2012 synoptic identified ground water flows as 485 cfs with 0.21 mg/L concentration (Etheridge 2013). 6 Stormwater Dry Weather allocations were derived from data provided by the LBWC stormwater workgroup (Appendix E). These flows and loads represent pass
through ground water and agriculture returns that largely return to the tributaries and/or ground water. They are a subcomponent of, and not summed separately from, tributary and ground water load allocations. 7 Stormwater Wet Weather allocations were derived from data provided by the LBWC stormwater workgroup (Appendix E), and represent a 42% TP load reduction
from current conditions. These flows and loads represent specific precipitation (storm) events and were not captured as part of the USGS August 2012 synoptic sample (Etheridge 2013).
* Note: The USGS-derived values are only for comparing the USGS mass balance data with long-term flow and load duration data and not for TP allocation purposes.
Parma
Flow
TP Input
Allocations
TP
Inputs
Reaching
Parma
Parma TP
Load w/
Allocations
Parma TP
Load
Reduction
(cfs) (mg/L) (lbs/day) (cfs) (mg/L) (lbs/day) (cfs) (mg/L) (lbs/day) (cfs) (mg/L) (lbs/day) (cfs) (mg/L) (lbs/day) (cfs) (mg/L) (lbs/day) (cfs) (mg/L) (lbs/day) (lbs/day) (%) (lbs/day) (%)
3268 0.018 317 135.6 0.10 73 37 0.10 20 822 0.07 310 -1390 0.07 -524 168 0.07 63 30 n/a 41 236 254% 601 84%
912 0.018 88 135.6 0.10 73 37 0.10 20 822 0.07 310 164 0.07 62 168 0.07 63 30 n/a 41 594 51% 303 80%
705 0.018 68 135.6 0.10 73 37 0.10 20 822 0.07 310 300 0.07 113 168 0.07 63 30 n/a 41 625 38% 237 80%
624 0.015 50 120.0 0.10 65 34 0.10 18 888 0.07 335 485 0.07 183 168 0.07 63 No Storm Event 651 34% 224 78%
383 0.018 37 135.6 0.10 73 37 0.10 20 822 0.07 310 398 0.07 150 168 0.07 63 30 n/a 41 631 23% 145 80%
Wet Weather
Stormwater TP
Allocations7
NPDES WWTF and Industry
TP Allocations2
Background TP
Allocations1
Tributary TP
Allocations w/o NPDES
Flows and TP Loads4
Ground Water TP
Allocations5
Fish Hatchery TP
Allocations3
Dry Weather
Stormwater TP
Allocations
(Tribs/Ground Water)6
DRAFT November 2014 Lower Boise River SBA and TMDL Addendum – Total Phosphorus DRAFT
xxiii DRAFT November 2014
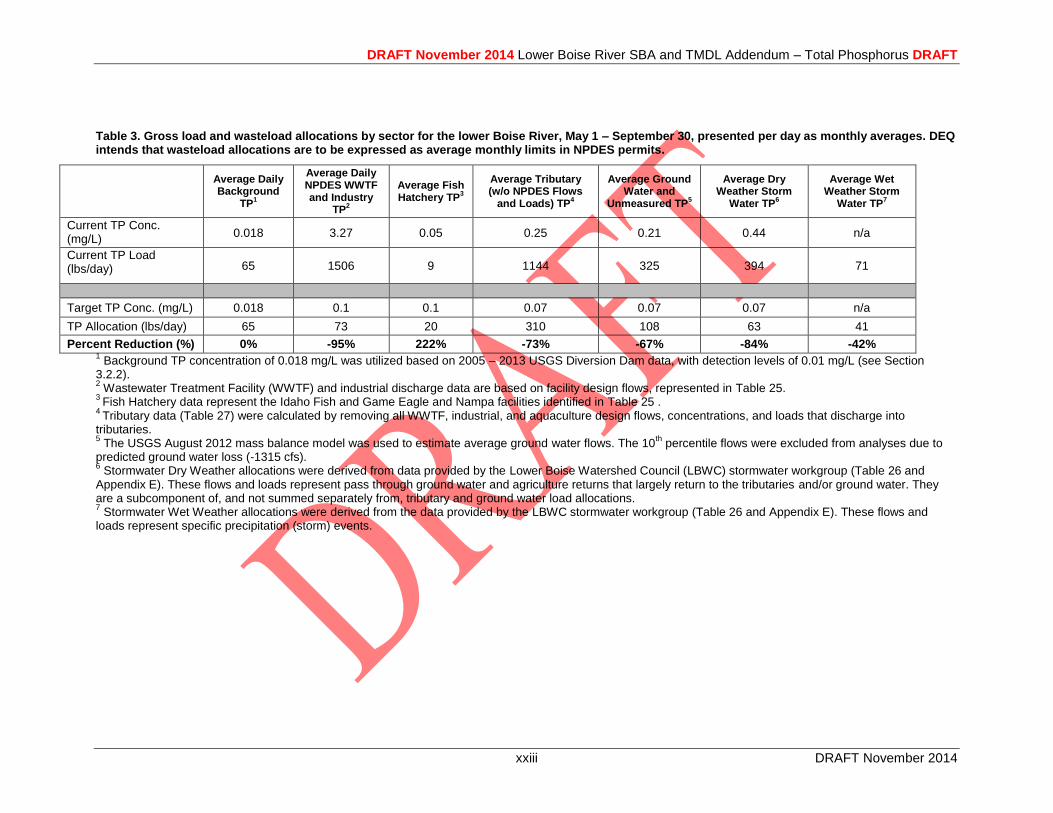
Table 3. Gross load and wasteload allocations by sector for the lower Boise River, May 1 – September 30, presented per day as monthly averages. DEQ intends that wasteload allocations are to be expressed as average monthly limits in NPDES permits.
Average Daily Background
TP1
Average Daily NPDES WWTF and Industry
TP2
Average Fish Hatchery TP
3
Average Tributary (w/o NPDES Flows
and Loads) TP4
Average Ground Water and
Unmeasured TP5
Average Dry Weather Storm
Water TP6
Average Wet Weather Storm
Water TP7
Current TP Conc. (mg/L)
0.018 3.27 0.05 0.25 0.21 0.44 n/a
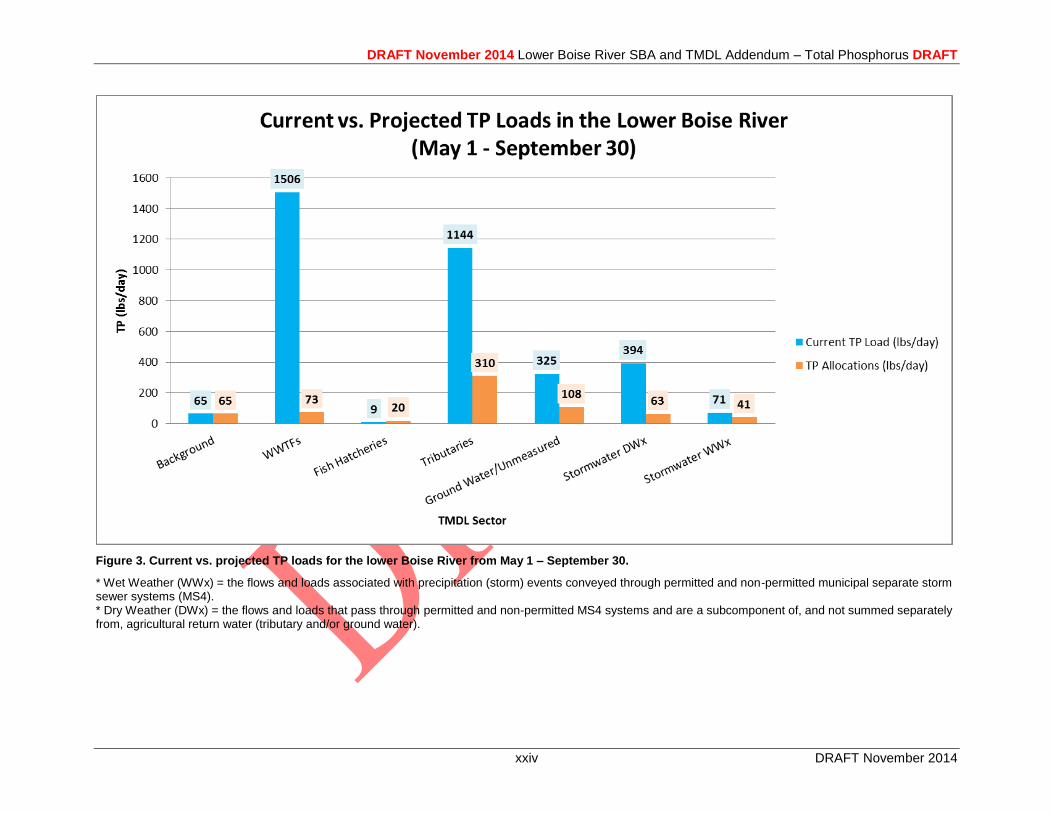
Current TP Load (lbs/day) 65 1506 9 1144 325 394 71
Target TP Conc. (mg/L) 0.018 0.1 0.1 0.07 0.07 0.07 n/a
TP Allocation (lbs/day) 65 73 20 310 108 63 41
Percent Reduction (%) 0% -95% 222% -73% -67% -84% -42% 1 Background TP concentration of 0.018 mg/L was utilized based on 2005 – 2013 USGS Diversion Dam data, with detection levels of 0.01 mg/L (see Section
3.2.2). 2 Wastewater Treatment Facility (WWTF) and industrial discharge data are based on facility design flows, represented in Table 25.
3 Fish Hatchery data represent the Idaho Fish and Game Eagle and Nampa facilities identified in Table 25 .
4 Tributary data (Table 27) were calculated by removing all WWTF, industrial, and aquaculture design flows, concentrations, and loads that discharge into
tributaries. 5 The USGS August 2012 mass balance model was used to estimate average ground water flows. The 10
th percentile flows were excluded from analyses due to
predicted ground water loss (-1315 cfs). 6 Stormwater Dry Weather allocations were derived from data provided by the Lower Boise Watershed Council (LBWC) stormwater workgroup (Table 26 and
Appendix E). These flows and loads represent pass through ground water and agriculture returns that largely return to the tributaries and/or ground water. They are a subcomponent of, and not summed separately from, tributary and ground water load allocations. 7 Stormwater Wet Weather allocations were derived from the data provided by the LBWC stormwater workgroup (Table 26 and Appendix E). These flows and
loads represent specific precipitation (storm) events.
DRAFT November 2014 Lower Boise River SBA and TMDL Addendum – Total Phosphorus DRAFT
xxiv DRAFT November 2014
Figure 3. Current vs. projected TP loads for the lower Boise River from May 1 – September 30.
* Wet Weather (WWx) = the flows and loads associated with precipitation (storm) events conveyed through permitted and non-permitted municipal separate storm sewer systems (MS4). * Dry Weather (DWx) = the flows and loads that pass through permitted and non-permitted MS4 systems and are a subcomponent of, and not summed separately from, agricultural return water (tributary and/or ground water).

DRAFT November 2014 Lower Boise River SBA and TMDL Addendum – Total Phosphorus DRAFT
xxv DRAFT November 2014
Table 4. Point source wasteload and nonpoint source load allocations, May 1 – September 30, for Sand Hollow, a Snake River tributary, presented per day as monthly averages
1. DEQ intends that wasteload allocations are to be expressed as average monthly limits in NPDES permits.
Sand Hollow Creek
Current Flow (mgd/ cfs)
2
Design Flow (mgd/ cfs)
2
Current TP Conc.
(mg/L)
Current TP Load (lbs/day)
Target TP Conc.
(mg/L)
Average TP
Allocation
(lbs/day)
Average TP Load
Reduction (%)
Parma WWTF
0.09 mgd
0.14 cfs
0.68 mgd
1.05 cfs 0.21 0.15 0.07 0.4 +157%
Nonpoint, ground water and unmeasured
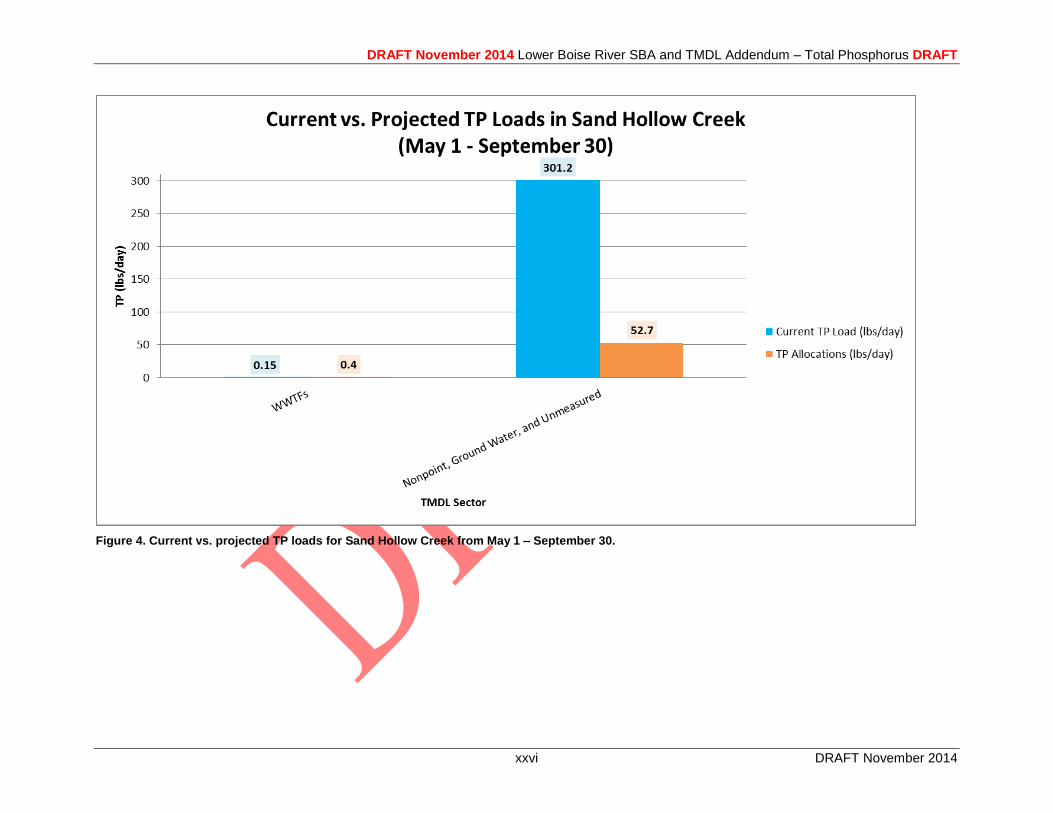
140.7 cfs 139.7 cfs 0.40 301.2 0.07 52.7 -82%
Total 140.8 cfs 140.8 cfs 0.399 301.4 0.07 53.1 -83%
1 The TP effluent limits identified in NPDES permits will depend on actual flows in Sand Hollow Creek, and will fluctuate from year to year. It is expected that the
point source facility will meet the wasteload allocation targets with 2 permit cycles. 2 Nonpoint, ground water, and unmeasured are flows and loads from May 1 – September 30 (1983 – 2012), minus flows and loads from the WWTF.
DRAFT November 2014 Lower Boise River SBA and TMDL Addendum – Total Phosphorus DRAFT
xxvi DRAFT November 2014
Figure 4. Current vs. projected TP loads for Sand Hollow Creek from May 1 – September 30.
DRAFT November 2014 Lower Boise River SBA and TMDL Addendum – Total Phosphorus DRAFT
xxvii DRAFT November 2014
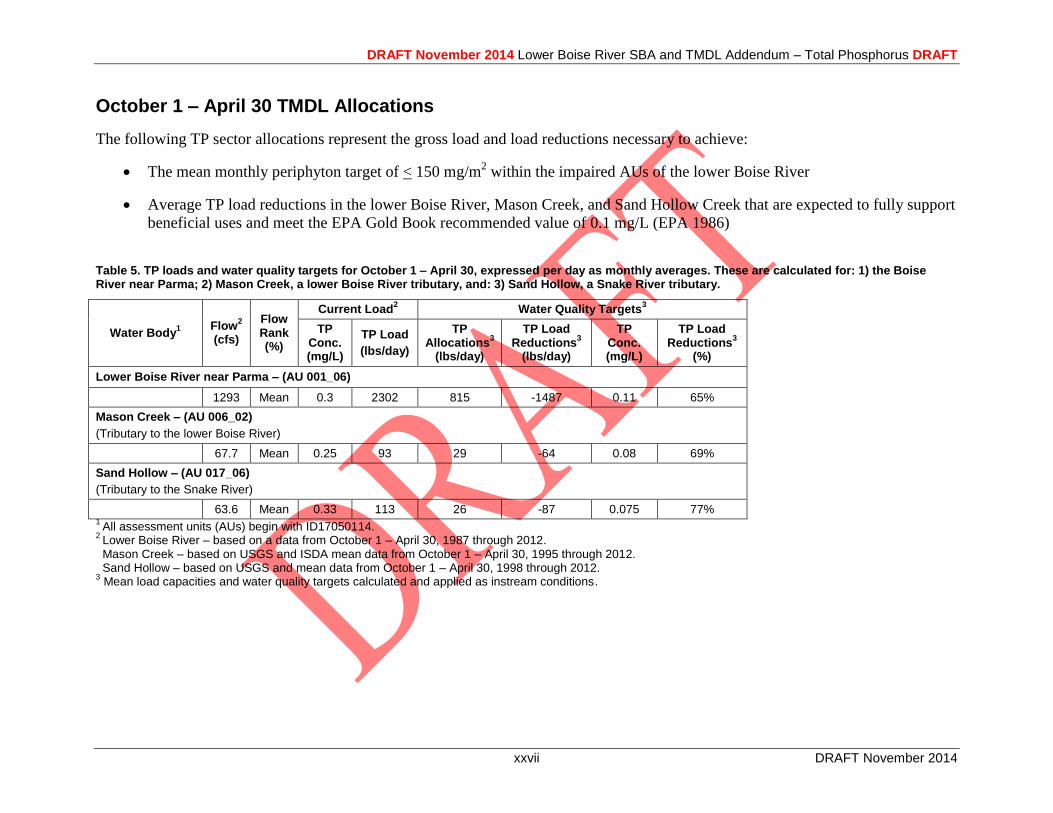
October 1 – April 30 TMDL Allocations
The following TP sector allocations represent the gross load and load reductions necessary to achieve:
The mean monthly periphyton target of < 150 mg/m2 within the impaired AUs of the lower Boise River
Average TP load reductions in the lower Boise River, Mason Creek, and Sand Hollow Creek that are expected to fully support
beneficial uses and meet the EPA Gold Book recommended value of 0.1 mg/L (EPA 1986)
Table 5. TP loads and water quality targets for October 1 – April 30, expressed per day as monthly averages. These are calculated for: 1) the Boise River near Parma; 2) Mason Creek, a lower Boise River tributary, and: 3) Sand Hollow, a Snake River tributary.
Water Body1
Flow2
(cfs)
Flow Rank (%)
Current Load2
Water Quality Targets3
TP Conc. (mg/L)
TP Load
(lbs/day)
TP Allocations
3
(lbs/day)
TP Load Reductions
3
(lbs/day)
TP Conc. (mg/L)
TP Load Reductions
3
(%)
Lower Boise River near Parma – (AU 001_06)
1293 Mean 0.3 2302 815 -1487 0.11 65%
Mason Creek – (AU 006_02)
(Tributary to the lower Boise River)
67.7 Mean 0.25 93 29 -64 0.08 69%
Sand Hollow – (AU 017_06)
(Tributary to the Snake River)
63.6 Mean 0.33 113 26 -87 0.075 77% 1
All assessment units (AUs) begin with ID17050114. 2
Lower Boise River – based on a data from October 1 – April 30, 1987 through 2012. Mason Creek – based on USGS and ISDA mean data from October 1 – April 30, 1995 through 2012. Sand Hollow – based on USGS and mean data from October 1 – April 30, 1998 through 2012. 3 Mean load capacities and water quality targets calculated and applied as instream conditions.
DRAFT November 2014 Lower Boise River SBA and TMDL Addendum – Total Phosphorus DRAFT
xxviii DRAFT November 2014
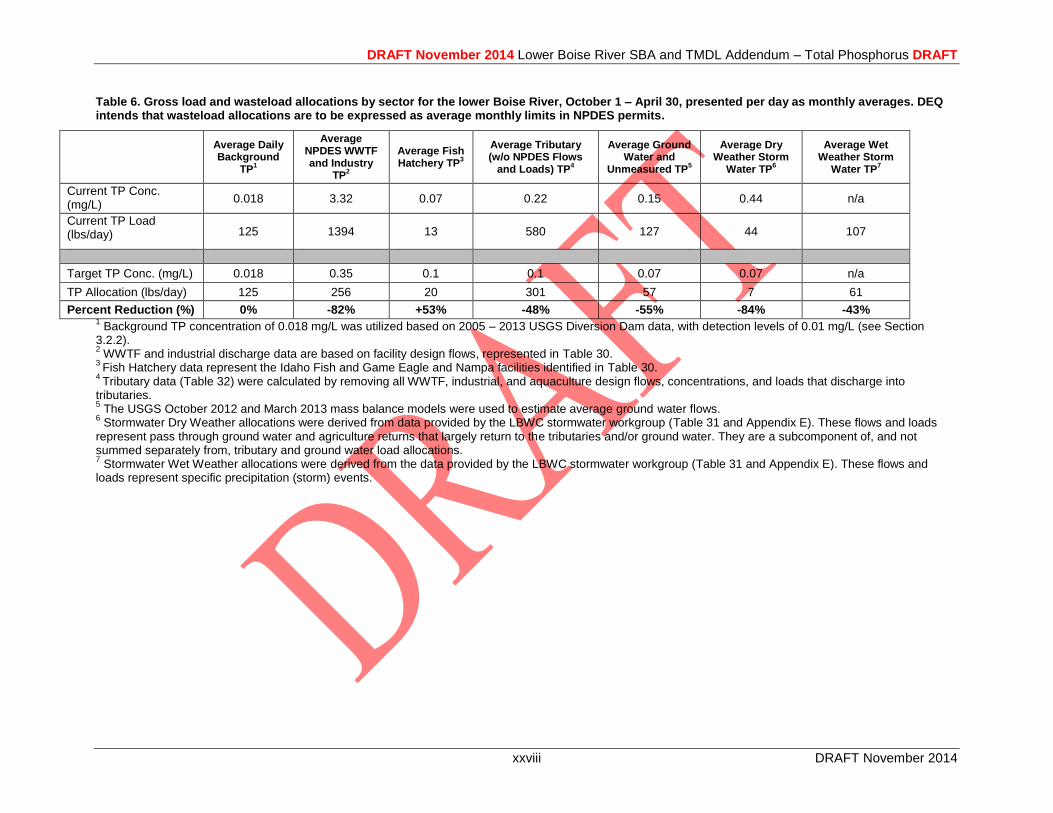
Table 6. Gross load and wasteload allocations by sector for the lower Boise River, October 1 – April 30, presented per day as monthly averages. DEQ intends that wasteload allocations are to be expressed as average monthly limits in NPDES permits.
Average Daily Background
TP1
Average NPDES WWTF and Industry
TP2
Average Fish Hatchery TP
3
Average Tributary (w/o NPDES Flows
and Loads) TP4
Average Ground Water and
Unmeasured TP5
Average Dry Weather Storm
Water TP6
Average Wet Weather Storm
Water TP7
Current TP Conc. (mg/L)
0.018 3.32 0.07 0.22 0.15 0.44 n/a
Current TP Load (lbs/day) 125 1394 13 580 127 44 107
Target TP Conc. (mg/L) 0.018 0.35 0.1 0.1 0.07 0.07 n/a
TP Allocation (lbs/day) 125 256 20 301 57 7 61
Percent Reduction (%) 0% -82% +53% -48% -55% -84% -43% 1 Background TP concentration of 0.018 mg/L was utilized based on 2005 – 2013 USGS Diversion Dam data, with detection levels of 0.01 mg/L (see Section
3.2.2). 2 WWTF and industrial discharge data are based on facility design flows, represented in Table 30.
3 Fish Hatchery data represent the Idaho Fish and Game Eagle and Nampa facilities identified in Table 30.
4 Tributary data (Table 32) were calculated by removing all WWTF, industrial, and aquaculture design flows, concentrations, and loads that discharge into
tributaries. 5 The USGS October 2012 and March 2013 mass balance models were used to estimate average ground water flows.
6 Stormwater Dry Weather allocations were derived from data provided by the LBWC stormwater workgroup (Table 31 and Appendix E). These flows and loads
represent pass through ground water and agriculture returns that largely return to the tributaries and/or ground water. They are a subcomponent of, and not summed separately from, tributary and ground water load allocations. 7 Stormwater Wet Weather allocations were derived from the data provided by the LBWC stormwater workgroup (Table 31 and Appendix E). These flows and
loads represent specific precipitation (storm) events.
DRAFT November 2014 Lower Boise River SBA and TMDL Addendum – Total Phosphorus DRAFT
xxix DRAFT November 2014
Figure 5. Current projected TP loads for the lower Boise River from October 1 – April 30.
* Wet Weather (WWx) = the flows and loads associated with precipitation (storm) events conveyed through permitted and non-permitted MS4 systems. * Dry Weather (DWx) = the flows and loads that pass through the permitted and non-permitted MS4 systems that are a subcomponent of, and not summed separately from, agricultural return water (tributary and/or ground water).
DRAFT November 2014 Lower Boise River SBA and TMDL Addendum – Total Phosphorus DRAFT
xxx DRAFT November 2014
Table 7. Point source wasteload and nonpoint source load allocations, October 1 – April 30, for Sand Hollow, a Snake River tributary, presented per day as monthly averages
1. DEQ intends that wasteload allocations are to be expressed as average monthly limits in NPDES permits.
Sand Hollow Creek
Current Flow (mgd/ cfs)
2
Design Flow (mgd/ cfs)
2
Current TP Conc.
(mg/L)
Current TP Load (lbs/day)
Target TP Conc.
(mg/L)
Average TP
Allocation
(lbs/day)
Average TP Load
Reduction (%)
Parma WWTF
0.13 mgd
0.20 cfs
0.68 mgd
1.05 cfs 0.12 0.1 0.35 1.99 +1426%
Nonpoint, ground water and unmeasured
63.4 cfs 62.6 cfs 0.33 113.2 0.07 23.6 -79%
Total 63.6 cfs 63.6 cfs 0.33 113.3 0.075 25.7 -77%
1 The TP effluent limits identified in NPDES permits will depend on actual flows in Sand Hollow, and will fluctuate from year to year. It is expected that the point
source facility will meet the wasteload allocation targets with 2 permit cycles. 2 Nonpoint, ground water, and unmeasured are flows and loads from May 1 – September 30 (1983 – 2012), minus flows and loads from the WWTF.
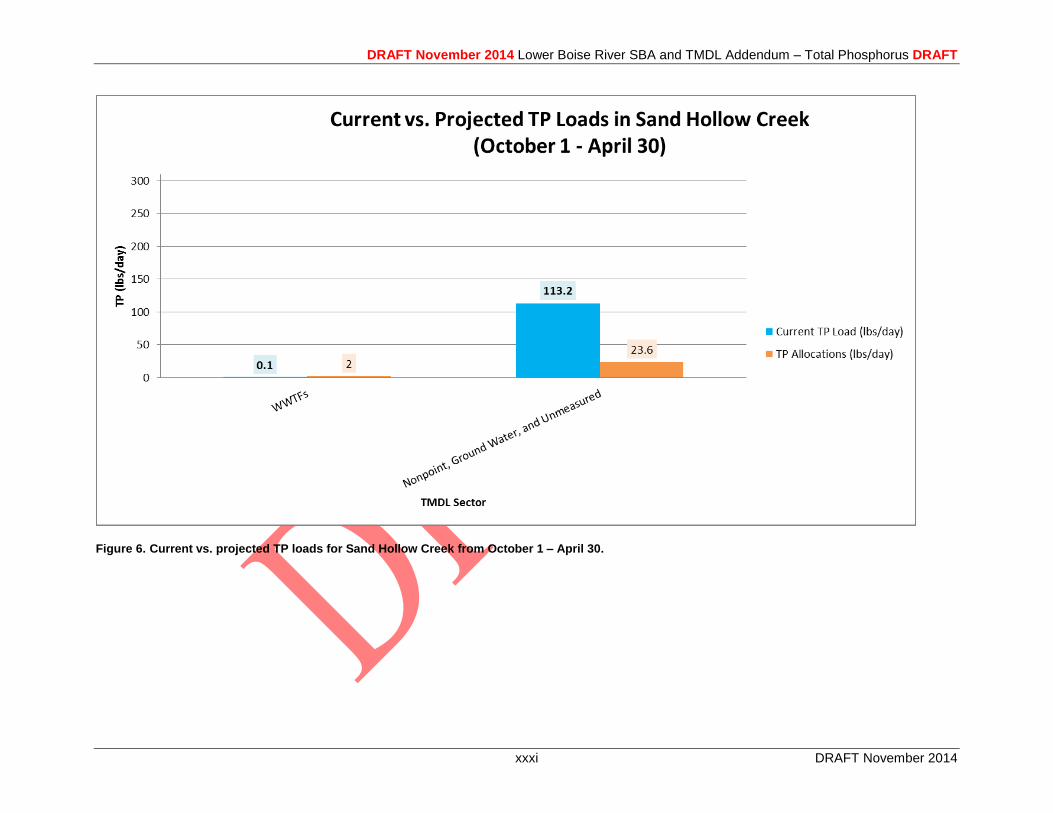
DRAFT November 2014 Lower Boise River SBA and TMDL Addendum – Total Phosphorus DRAFT
xxxi DRAFT November 2014
Figure 6. Current vs. projected TP loads for Sand Hollow Creek from October 1 – April 30.
DRAFT November 2014 Lower Boise River SBA and TMDL Addendum – Total Phosphorus DRAFT
xxxii DRAFT November 2014
Instream Periphyton and TP Reductions
The final TMDL model scenario (Scenario 3) and TMDL allocation described above reduces the
predicted year-round periphyton growth, and TP concentrations and loads in the lower Boise
River. Specifically, the final TMDL model scenario (Scenario 3) and TP allocation structure:
Achieves a May 1 – September 30 mean monthly benthic chlorophyll a target of < 150
mg/m2 in the impaired AUs of the lower Boise River. A potential exception is during a
single month within model segments 10 and 11. However, multiple lines of evidence
suggest the phosphorus reductions are sufficient achieve the mean monthly periphyton
target on a per-AU basis, as well as achieve TP concentrations near or below the EPA
Gold Book recommended value of 0.1 mg/L (EPA 1986). These rationales are further
discussed in subsequent sections of the TMDL and in the Model Report (DEQ 2014a).
Includes the TP allocations necessary to meet the May 1 – September 30 target of < 0.07
mg/L TP in the lower Boise River near Parma based on long-term load duration data.
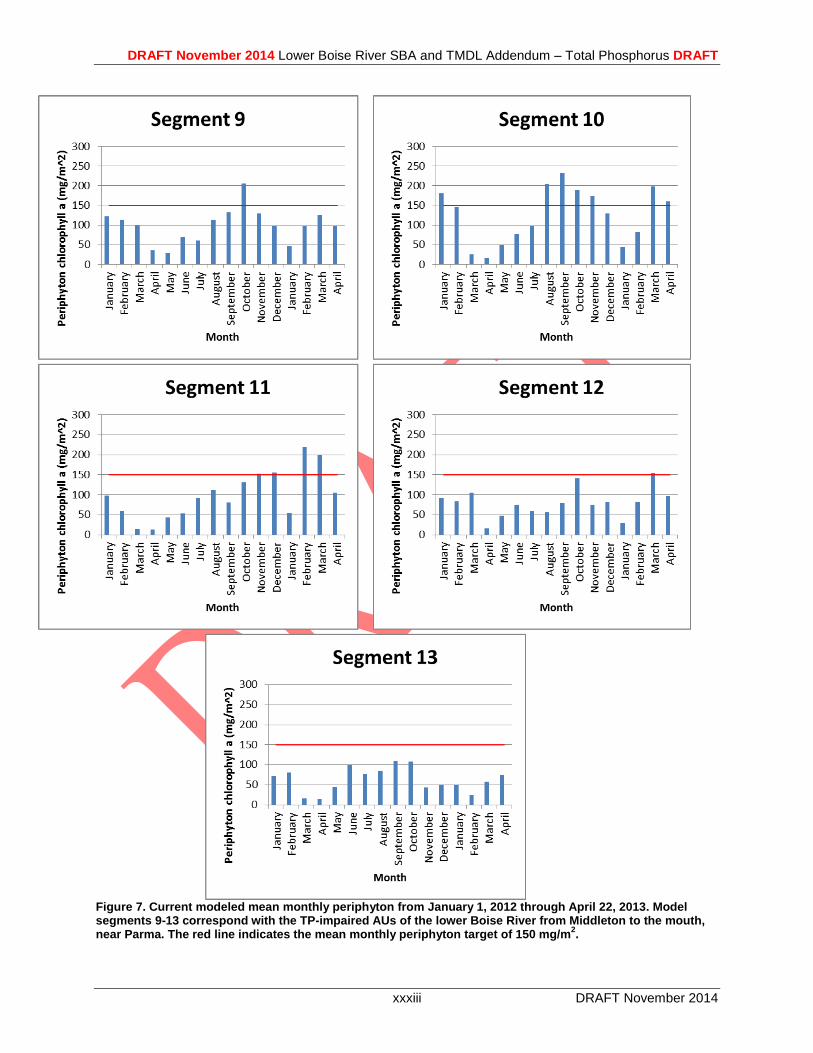
DRAFT November 2014 Lower Boise River SBA and TMDL Addendum – Total Phosphorus DRAFT
xxxiii DRAFT November 2014
Figure 7. Current modeled mean monthly periphyton from January 1, 2012 through April 22, 2013. Model segments 9-13 correspond with the TP-impaired AUs of the lower Boise River from Middleton to the mouth, near Parma. The red line indicates the mean monthly periphyton target of 150 mg/m
2.
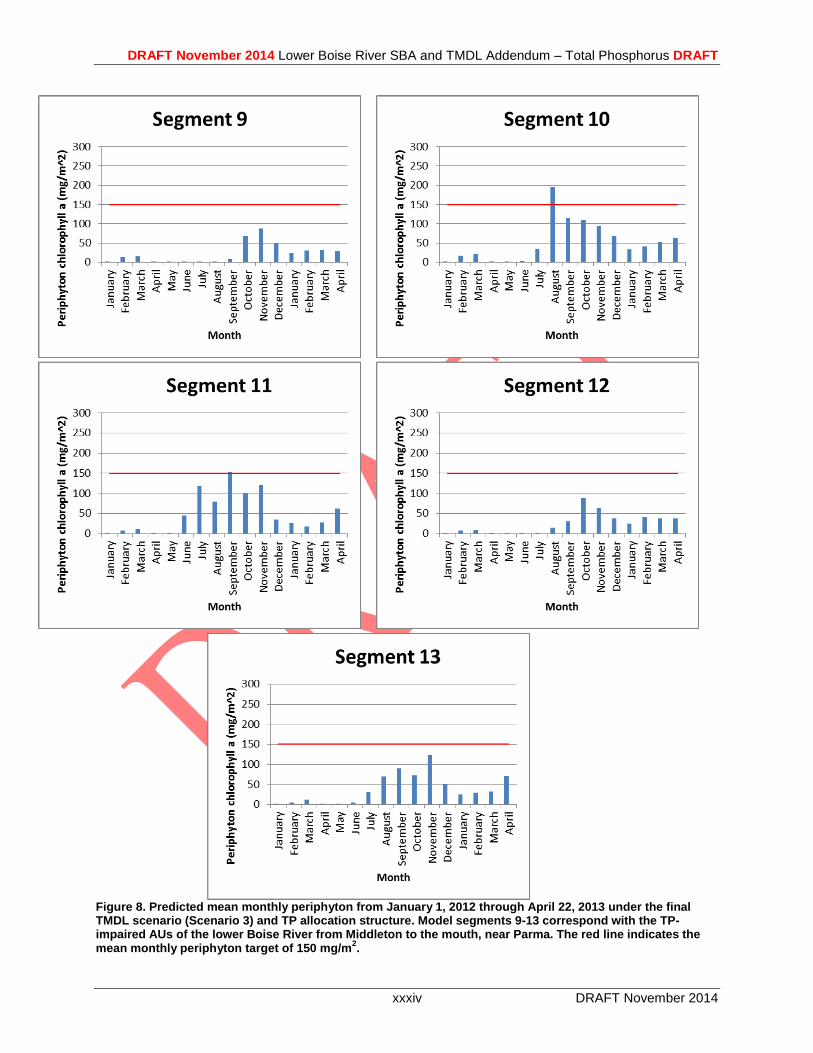
DRAFT November 2014 Lower Boise River SBA and TMDL Addendum – Total Phosphorus DRAFT
xxxiv DRAFT November 2014
Figure 8. Predicted mean monthly periphyton from January 1, 2012 through April 22, 2013 under the final TMDL scenario (Scenario 3) and TP allocation structure. Model segments 9-13 correspond with the TP-impaired AUs of the lower Boise River from Middleton to the mouth, near Parma. The red line indicates the mean monthly periphyton target of 150 mg/m
2.
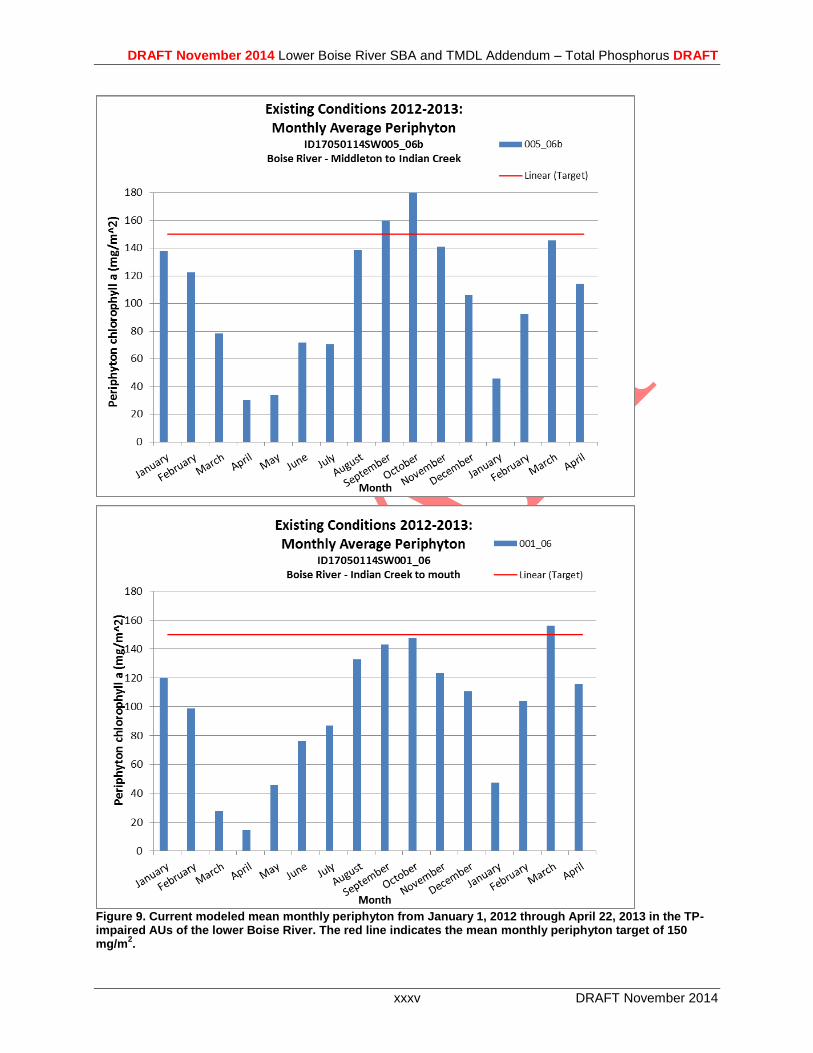
DRAFT November 2014 Lower Boise River SBA and TMDL Addendum – Total Phosphorus DRAFT
xxxv DRAFT November 2014
Figure 9. Current modeled mean monthly periphyton from January 1, 2012 through April 22, 2013 in the TP-impaired AUs of the lower Boise River. The red line indicates the mean monthly periphyton target of 150 mg/m
2.
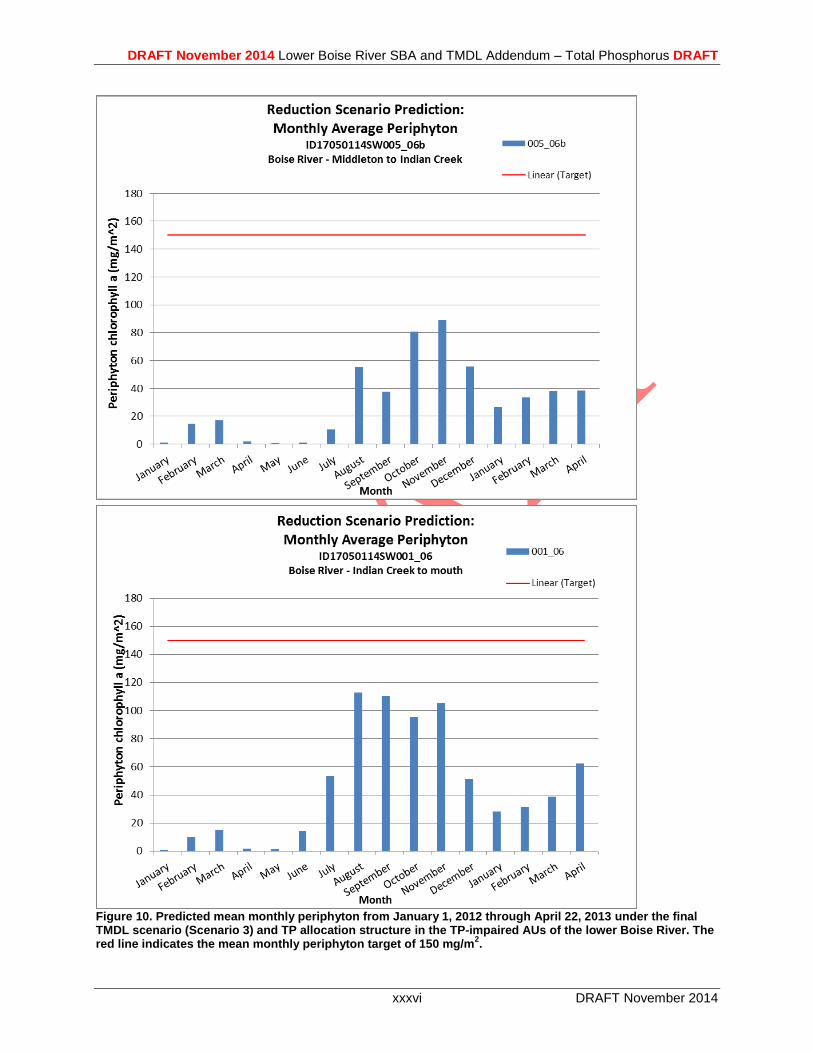
DRAFT November 2014 Lower Boise River SBA and TMDL Addendum – Total Phosphorus DRAFT
xxxvi DRAFT November 2014
Figure 10. Predicted mean monthly periphyton from January 1, 2012 through April 22, 2013 under the final TMDL scenario (Scenario 3) and TP allocation structure in the TP-impaired AUs of the lower Boise River. The red line indicates the mean monthly periphyton target of 150 mg/m
2.

DRAFT November 2014 Lower Boise River SBA and TMDL Addendum – Total Phosphorus DRAFT
xxxvii DRAFT November 2014
Figure 11. Current modeled monthly TP concentration from January 1, 2012 through April 22, 2013 in the TP-impaired AUs of the lower Boise River. The red line indicates the EPA Gold Book recommended value of 0.1 mg/L.

DRAFT November 2014 Lower Boise River SBA and TMDL Addendum – Total Phosphorus DRAFT
xxxviii DRAFT November 2014
Figure 12. Predicted modeled monthly TP concentration from January 1, 2012 through April 22, 2013 under the final TMDL scenario (Scenario 3) and TP allocation structure in the TP-impaired AUs of the lower Boise River. The red line indicates the EPA Gold Book recommended value of 0.1 mg/L.
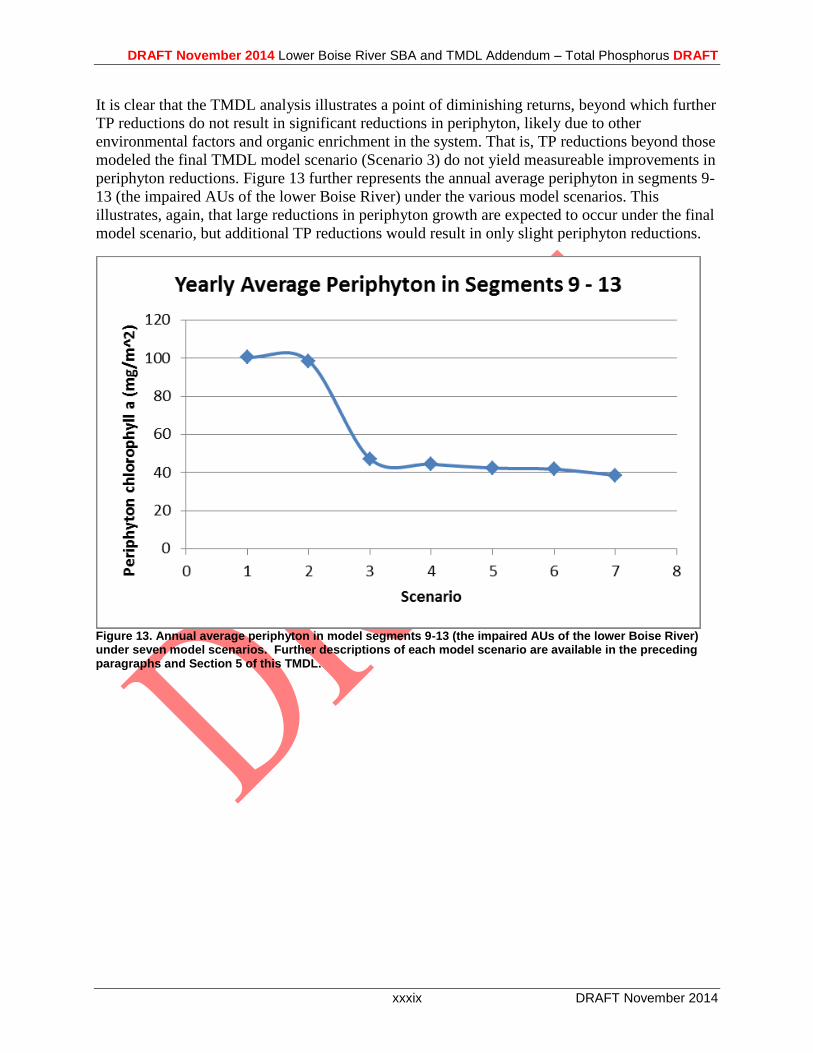
DRAFT November 2014 Lower Boise River SBA and TMDL Addendum – Total Phosphorus DRAFT
xxxix DRAFT November 2014
It is clear that the TMDL analysis illustrates a point of diminishing returns, beyond which further
TP reductions do not result in significant reductions in periphyton, likely due to other
environmental factors and organic enrichment in the system. That is, TP reductions beyond those
modeled the final TMDL model scenario (Scenario 3) do not yield measureable improvements in
periphyton reductions. Figure 13 further represents the annual average periphyton in segments 9-
13 (the impaired AUs of the lower Boise River) under the various model scenarios. This
illustrates, again, that large reductions in periphyton growth are expected to occur under the final
model scenario, but additional TP reductions would result in only slight periphyton reductions.
Figure 13. Annual average periphyton in model segments 9-13 (the impaired AUs of the lower Boise River) under seven model scenarios. Further descriptions of each model scenario are available in the preceding paragraphs and Section 5 of this TMDL.
DRAFT November 2014 Lower Boise River SBA and TMDL Addendum – Total Phosphorus DRAFT
xl DRAFT November 2014
Public Participation
Throughout the TMDL development process, DEQ frequently consulted, coordinated, and met
with the southwest Basin Advisory Group (BAG), Lower Boise Watershed Council (LBWC),
Technical Advisory Committee (TAC) and other workgroups, EPA, USGS, and other interested
stakeholders. Since revitalizing this specific TMDL effort in March 2012, DEQ has consulted
with these interested stakeholders in more than 100 meetings, of which, nearly all were open and
announced to the public. This continual stakeholder participation was, and will be, critical
before, during, and after the public comment period in Month 2014, and in the subsequent
TMDL implementation. A distribution list and detailed identification of LBWC and public
participation through the TMDL development are available in Appendix C. In addition to these
meetings, DEQ also kept the public apprised of progress by posting specific TMDL-related
information on the DEQ Lower Boise River Watershed Advisory Group webpage:
http://www.deq.idaho.gov/regional-offices-issues/boise/basin-watershed-advisory-groups/lower-
boise-river-wag.aspx.Posted information includes this draft of the TMDL, the items listed below,
and much more:
November 2013 – Draft Lower Boise River Subbasin Total Phosphorus TMDL
Addendum (v1)
February 2014 – Draft Lower Boise River Subbasin Total Phosphorus TMDL Addendum
(v2)
February 2014 – Draft Lower Boise River Phosphorus: AQUATOX Model Report (v1)
February 2014 – Draft Lower Boise River Phosphorus: AQUATOX Model Report (v2)
April 2014 – Calibrated AQUATOX model, import files, and data
February 2014 – Lower Boise River AQUATOX Model Calibration Comments
November 2014 – Draft Lower Boise River Subbasin Total Phosphorus TMDL
Addendum (v3)
November 2014 – Draft Lower Boise River Phosphorus: AQUATOX Model Report (v3)
November 2014 – AQUATOX model TMDL scenario files, import files, and data
DRAFT November 2014 Lower Boise River SBA and TMDL Addendum – Total Phosphorus DRAFT
1 DRAFT November 2014
Introduction
This document addresses 5 assessment units in the lower Boise River subbasin (two main stem
AUs, two Sand Hollow Creek AUs, and one Mason Creek AU) that have been placed in
Category 5 of Idaho’s most recent federally approved 2012 Integrated Report (DEQ 2014c). The
purpose of this total maximum daily load (TMDL) addendum is to characterize and document
pollutant loads within the lower Boise River subbasin. The first portion of this document
presents key characteristics or updated information for the subbasin assessment, which is divided
into four major sections: subbasin characterization (section 1), water quality concerns and status
(section 2), pollutant source inventory (section 3), and a summary of past and present pollution
control efforts (section 4). While the subbasin assessment is not a requirement of the TMDL,
DEQ performs the assessment to ensure impairment listings are up-to-date and accurate.
The subbasin assessment is used to develop a TMDL for each pollutant of concern for the lower
Boise River subbasin. The TMDL (section 5) is a plan to improve water quality by limiting
pollutant loads. Specifically, a TMDL is an estimation of the maximum pollutant amount that
can be present in a water body and still allow that water body to meet water quality standards
(40 CFR Part 130). Consequently, a TMDL is water body- and pollutant-specific. The TMDL
also allocates allowable discharges of individual pollutants among the various sources
discharging the pollutant.
Regulatory Requirements
This document was prepared in compliance with both federal and state regulatory requirements.
The federal government, through the United States Environmental Protection Agency (EPA),
assumed the dominant role in defining and directing water pollution control programs across the
country. The Idaho Department of Environmental Quality (DEQ) implements the Clean Water
Act in Idaho, while EPA oversees Idaho and certifies the fulfillment of Clean Water Act
requirements and responsibilities.
Congress passed the Federal Water Pollution Control Act, more commonly called the Clean
Water Act, in 1972. The goal of this act was to “restore and maintain the chemical, physical, and
biological integrity of the nation’s waters” (33 USC §1251). The act and the programs it has
generated have changed over the years as experience and perceptions of water quality have
changed. The Clean Water Act has been amended 15 times, most significantly in 1977, 1981,
and 1987. One of the goals of the 1977 amendment was protecting and managing waters to
ensure “swimmable and fishable” conditions. These goals relate water quality to more than just
chemistry.
The Clean Water Act requires that states and tribes restore and maintain the chemical, physical,
and biological integrity of the nation’s waters. States and tribes, pursuant to Section 303 of the
Clean Water Act, are to adopt water quality standards necessary to protect fish, shellfish, and
wildlife while providing for recreation in and on the nation’s waters whenever possible. DEQ
must review those standards every 3 years, and EPA must approve Idaho’s water quality
standards. Idaho adopts water quality standards to protect public health and welfare, enhance
water quality, and protect biological integrity. A water quality standard defines the goals of a
DRAFT November 2014 Lower Boise River SBA and TMDL Addendum – Total Phosphorus DRAFT
2 DRAFT November 2014
water body by designating the use or uses for the water, setting criteria necessary to protect those
uses, and preventing degradation of water quality through antidegradation provisions.
Section 303(d) of the Clean Water Act establishes requirements for states and tribes to identify
and prioritize water bodies that are water quality limited (i.e., water bodies that do not meet
water quality standards). States and tribes must periodically publish a priority list (a Ҥ303(d)
list”) of impaired waters. Currently, this list is published every 2 years as the list of Category 5
waters in Idaho’s Integrated Report. For waters identified on this list, states and tribes must
develop a TMDL for the pollutants, set at a level to achieve water quality standards.
DEQ monitors and assess waters, and for those not meeting water quality standards, DEQ must
establish a TMDL for each pollutant impairing the waters. However, some conditions that impair
water quality do not require TMDLs. EPA considers certain unnatural conditions—such as flow
alteration, human-caused lack of flow, or habitat alteration—that are not the result of discharging
a specific pollutant as “pollution.” TMDLs are not required for water bodies impaired by
pollution, rather than a specific pollutant. A TMDL is only required when a pollutant can be
identified and in some way quantified.
1 Subbasin Assessment—Subbasin Characterization This document presents an addendum to previously completed lower Boise River subbasin
assessments, TMDLs and addendums (DEQ 1999, 2003, 2008, 2009, 2010b, 2012). Addendums
address waters within a hydrologic unit code (HUC) that did not previously receive a TMDL for
a specific pollutant, or they update the TMDL for a specific pollutant with an existing EPA
approved TMDL. This TMDL addendum addresses water bodies in the subbasin that are on
Idaho’s current §303(d) list for Total Phosphorus (TP) and Cause Unknown – Nutrients
Suspected.
1.1 Physical, Biological, and Cultural Characteristics
A thorough discussion of the physical, biological, and cultural characteristics of the lower Boise
River subbasin are provided in the Lower Boise River TMDL Subbasin Assessment TMDL
(DEQ 1999), the Lower Boise River Implementation Plan Total Phosphorus (DEQ 2008), and
the Lower Boise River Total Phosphorus Five-Year Review (2009).
1.2 Subwatershed Characteristics
The lower Boise River watershed is one of the more complex watersheds in Idaho (Figure 14;
DEQ 2009). Sources of phosphorus are diverse due to the land ownership and management in the
watershed (Figure 15) and include: wastewater treatment discharges, stormwater, agriculture,
background (from Lucky Peak Reservoir releases), and ground water return flows. Phosphorus
from these sources is routed through a physically-complex network of river, tributaries, and
irrigation conveyances. Figure 16 shows the subwatershed delineations that are operated, in part,
based on this conveyance network (DEQ 2009). Figure 17 provides a simplified schematic of the
diversions, drains, and tributaries along the lower Boise River (Etheridge 2013), while Figure 18
displays the daily mean flows at the upper end of the lower Boise River at Diversion Dam, near
Middleton, and near the mouth at Parma.
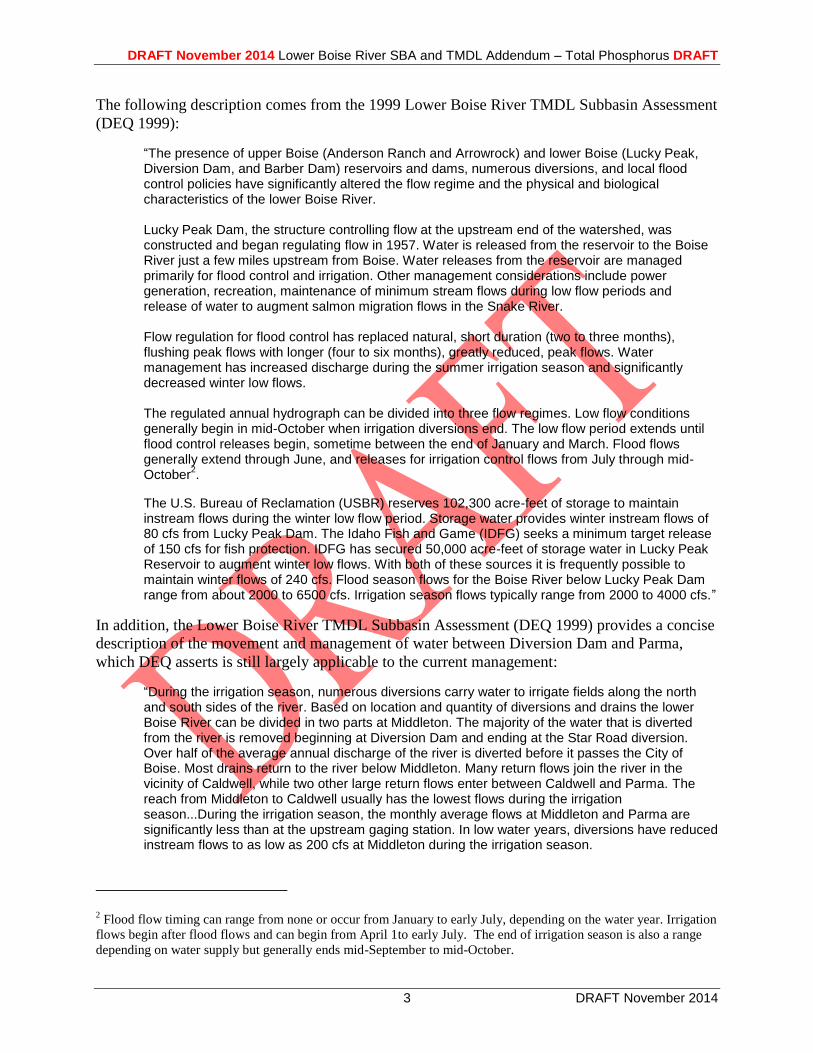
DRAFT November 2014 Lower Boise River SBA and TMDL Addendum – Total Phosphorus DRAFT
3 DRAFT November 2014
The following description comes from the 1999 Lower Boise River TMDL Subbasin Assessment
(DEQ 1999):
“The presence of upper Boise (Anderson Ranch and Arrowrock) and lower Boise (Lucky Peak, Diversion Dam, and Barber Dam) reservoirs and dams, numerous diversions, and local flood control policies have significantly altered the flow regime and the physical and biological characteristics of the lower Boise River. Lucky Peak Dam, the structure controlling flow at the upstream end of the watershed, was constructed and began regulating flow in 1957. Water is released from the reservoir to the Boise River just a few miles upstream from Boise. Water releases from the reservoir are managed primarily for flood control and irrigation. Other management considerations include power generation, recreation, maintenance of minimum stream flows during low flow periods and release of water to augment salmon migration flows in the Snake River. Flow regulation for flood control has replaced natural, short duration (two to three months), flushing peak flows with longer (four to six months), greatly reduced, peak flows. Water management has increased discharge during the summer irrigation season and significantly decreased winter low flows. The regulated annual hydrograph can be divided into three flow regimes. Low flow conditions generally begin in mid-October when irrigation diversions end. The low flow period extends until flood control releases begin, sometime between the end of January and March. Flood flows generally extend through June, and releases for irrigation control flows from July through mid-October
2.
The U.S. Bureau of Reclamation (USBR) reserves 102,300 acre-feet of storage to maintain instream flows during the winter low flow period. Storage water provides winter instream flows of 80 cfs from Lucky Peak Dam. The Idaho Fish and Game (IDFG) seeks a minimum target release of 150 cfs for fish protection. IDFG has secured 50,000 acre-feet of storage water in Lucky Peak Reservoir to augment winter low flows. With both of these sources it is frequently possible to maintain winter flows of 240 cfs. Flood season flows for the Boise River below Lucky Peak Dam range from about 2000 to 6500 cfs. Irrigation season flows typically range from 2000 to 4000 cfs.”
In addition, the Lower Boise River TMDL Subbasin Assessment (DEQ 1999) provides a concise
description of the movement and management of water between Diversion Dam and Parma,
which DEQ asserts is still largely applicable to the current management:
“During the irrigation season, numerous diversions carry water to irrigate fields along the north and south sides of the river. Based on location and quantity of diversions and drains the lower Boise River can be divided in two parts at Middleton. The majority of the water that is diverted from the river is removed beginning at Diversion Dam and ending at the Star Road diversion. Over half of the average annual discharge of the river is diverted before it passes the City of Boise. Most drains return to the river below Middleton. Many return flows join the river in the vicinity of Caldwell, while two other large return flows enter between Caldwell and Parma. The reach from Middleton to Caldwell usually has the lowest flows during the irrigation season...During the irrigation season, the monthly average flows at Middleton and Parma are significantly less than at the upstream gaging station. In low water years, diversions have reduced instream flows to as low as 200 cfs at Middleton during the irrigation season.
2 Flood flow timing can range from none or occur from January to early July, depending on the water year. Irrigation
flows begin after flood flows and can begin from April 1to early July. The end of irrigation season is also a range
depending on water supply but generally ends mid-September to mid-October.
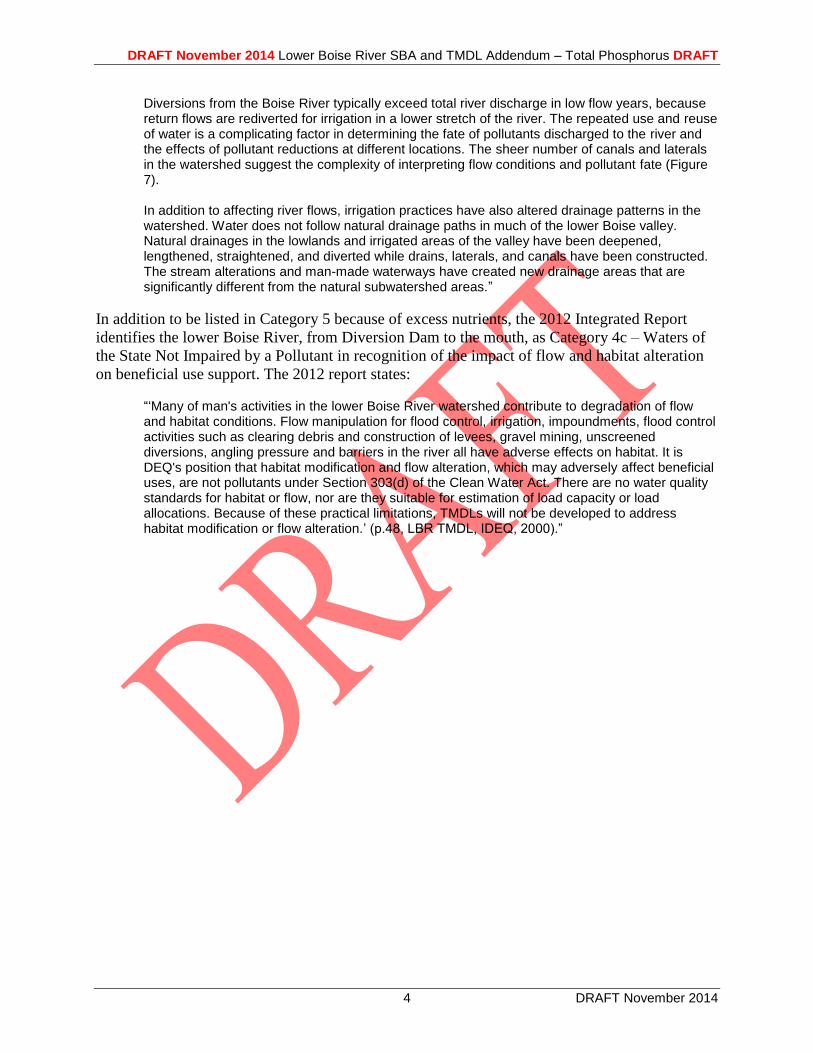
DRAFT November 2014 Lower Boise River SBA and TMDL Addendum – Total Phosphorus DRAFT
4 DRAFT November 2014
Diversions from the Boise River typically exceed total river discharge in low flow years, because return flows are rediverted for irrigation in a lower stretch of the river. The repeated use and reuse of water is a complicating factor in determining the fate of pollutants discharged to the river and the effects of pollutant reductions at different locations. The sheer number of canals and laterals in the watershed suggest the complexity of interpreting flow conditions and pollutant fate (Figure 7). In addition to affecting river flows, irrigation practices have also altered drainage patterns in the watershed. Water does not follow natural drainage paths in much of the lower Boise valley. Natural drainages in the lowlands and irrigated areas of the valley have been deepened, lengthened, straightened, and diverted while drains, laterals, and canals have been constructed. The stream alterations and man-made waterways have created new drainage areas that are significantly different from the natural subwatershed areas.”
In addition to be listed in Category 5 because of excess nutrients, the 2012 Integrated Report
identifies the lower Boise River, from Diversion Dam to the mouth, as Category 4c – Waters of
the State Not Impaired by a Pollutant in recognition of the impact of flow and habitat alteration
on beneficial use support. The 2012 report states:
“‘Many of man's activities in the lower Boise River watershed contribute to degradation of flow and habitat conditions. Flow manipulation for flood control, irrigation, impoundments, flood control activities such as clearing debris and construction of levees, gravel mining, unscreened diversions, angling pressure and barriers in the river all have adverse effects on habitat. It is DEQ's position that habitat modification and flow alteration, which may adversely affect beneficial uses, are not pollutants under Section 303(d) of the Clean Water Act. There are no water quality standards for habitat or flow, nor are they suitable for estimation of load capacity or load allocations. Because of these practical limitations, TMDLs will not be developed to address habitat modification or flow alteration.’ (p.48, LBR TMDL, IDEQ, 2000).”
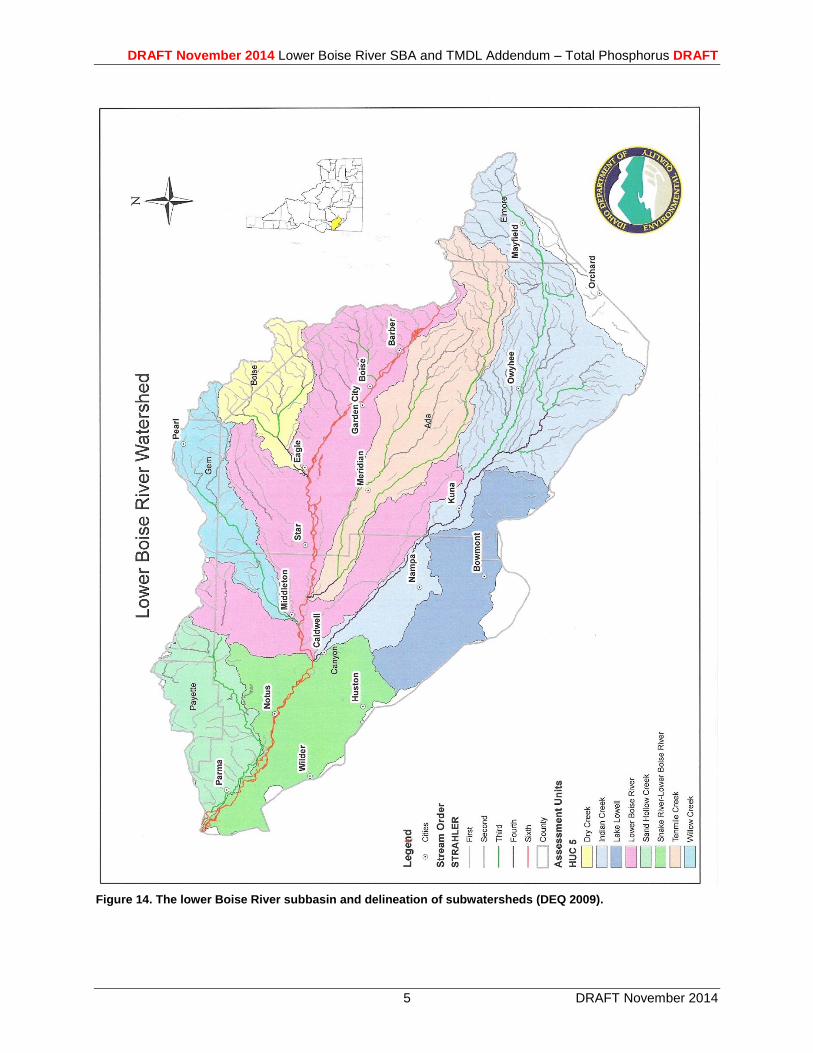
DRAFT November 2014 Lower Boise River SBA and TMDL Addendum – Total Phosphorus DRAFT
5 DRAFT November 2014
Figure 14. The lower Boise River subbasin and delineation of subwatersheds (DEQ 2009).
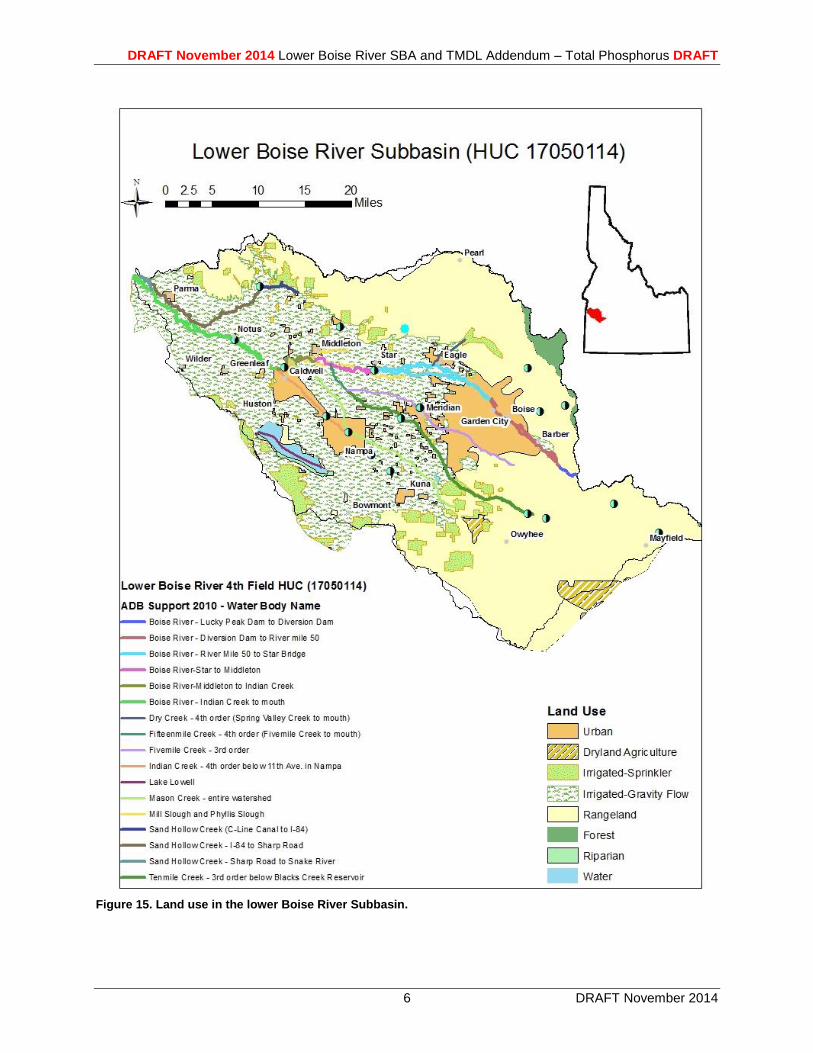
DRAFT November 2014 Lower Boise River SBA and TMDL Addendum – Total Phosphorus DRAFT
6 DRAFT November 2014
Figure 15. Land use in the lower Boise River Subbasin.
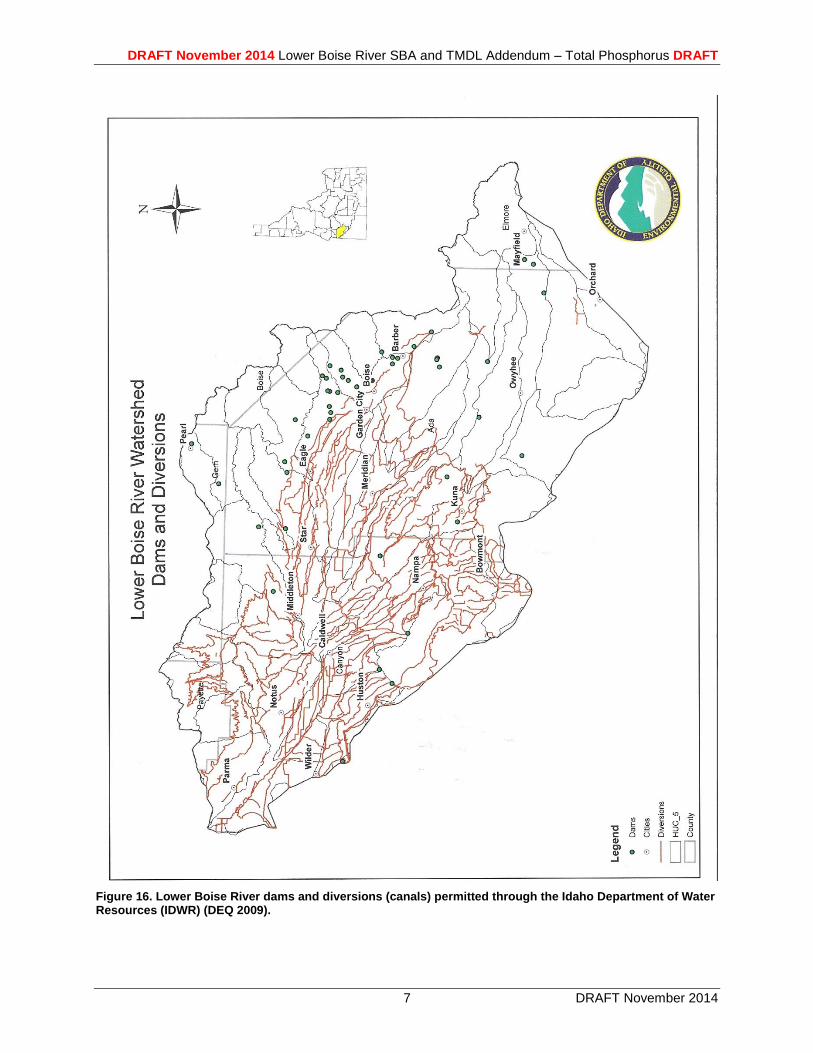
DRAFT November 2014 Lower Boise River SBA and TMDL Addendum – Total Phosphorus DRAFT
7 DRAFT November 2014
Figure 16. Lower Boise River dams and diversions (canals) permitted through the Idaho Department of Water Resources (IDWR) (DEQ 2009).
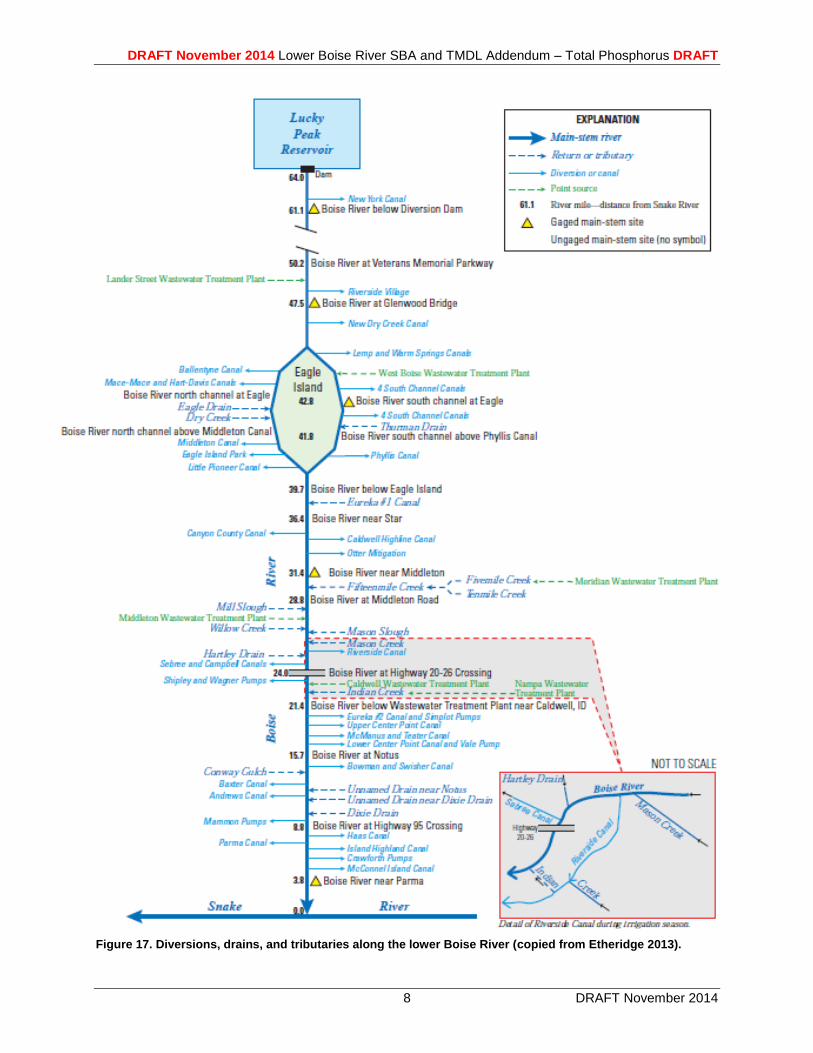
DRAFT November 2014 Lower Boise River SBA and TMDL Addendum – Total Phosphorus DRAFT
8 DRAFT November 2014
Figure 17. Diversions, drains, and tributaries along the lower Boise River (copied from Etheridge 2013).
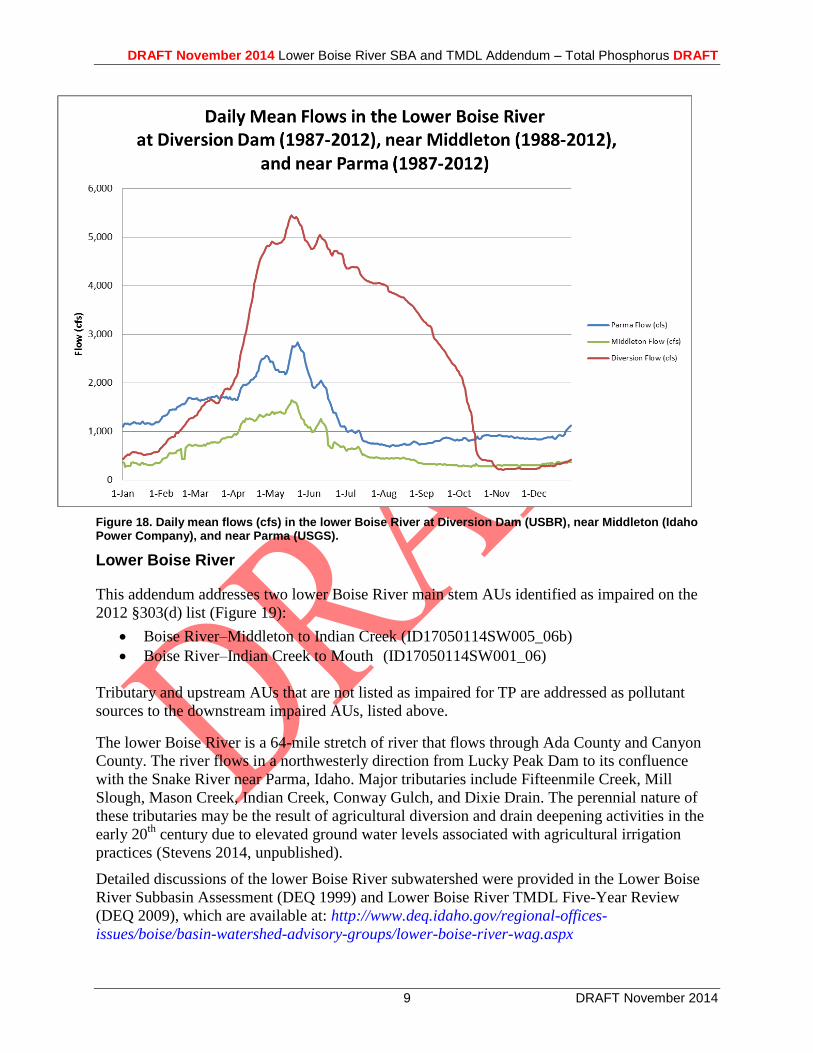
DRAFT November 2014 Lower Boise River SBA and TMDL Addendum – Total Phosphorus DRAFT
9 DRAFT November 2014
Figure 18. Daily mean flows (cfs) in the lower Boise River at Diversion Dam (USBR), near Middleton (Idaho Power Company), and near Parma (USGS).
Lower Boise River
This addendum addresses two lower Boise River main stem AUs identified as impaired on the
2012 §303(d) list (Figure 19):
Boise River–Middleton to Indian Creek (ID17050114SW005_06b)
Boise River–Indian Creek to Mouth (ID17050114SW001_06)
Tributary and upstream AUs that are not listed as impaired for TP are addressed as pollutant
sources to the downstream impaired AUs, listed above.
The lower Boise River is a 64-mile stretch of river that flows through Ada County and Canyon
County. The river flows in a northwesterly direction from Lucky Peak Dam to its confluence
with the Snake River near Parma, Idaho. Major tributaries include Fifteenmile Creek, Mill
Slough, Mason Creek, Indian Creek, Conway Gulch, and Dixie Drain. The perennial nature of
these tributaries may be the result of agricultural diversion and drain deepening activities in the
early 20th
century due to elevated ground water levels associated with agricultural irrigation
practices (Stevens 2014, unpublished).
Detailed discussions of the lower Boise River subwatershed were provided in the Lower Boise
River Subbasin Assessment (DEQ 1999) and Lower Boise River TMDL Five-Year Review
(DEQ 2009), which are available at: http://www.deq.idaho.gov/regional-offices-
issues/boise/basin-watershed-advisory-groups/lower-boise-river-wag.aspx
DRAFT November 2014 Lower Boise River SBA and TMDL Addendum – Total Phosphorus DRAFT
10 DRAFT November 2014
Mason Creek
This addendum addresses one Mason Creek AU identified as impaired on the 2012 §303(d) list
(Figure 19):
Mason Creek–Entire Watershed (ID17050114SW006_02)
The Mason Creek subwatershed drains 62 square miles of rangeland, agricultural land and urban
areas. Mason Creek is located in the southern portion of the lower Boise River watershed and
flows through Canyon County, but the headwaters are located in Ada County. The stream flows
in a northwesterly direction from its origin at the New York Canal to its confluence with the
lower Boise River in the city of Caldwell.
Detailed discussions of the Mason Creek subwatershed were provided in the Mason Creek
Subbasin Assessment (DEQ 2001c), which is available at: http://www.deq.idaho.gov/water-
quality/surface-water/tmdls/table-of-sbas-tmdls/boise-river-lower-nutrient-tributary-
subbasin.aspx
Sand Hollow
The addendum addresses two Sand Hollow Creek AUs identified as impaired on the 2012
§303(d) list (Figure 19):
Sand Hollow Creek–C Line Canal to I-84 (ID17050114SW016_03)
Sand Hollow Creek–Sharp Road to Snake River (ID17050114SW017_06)
The Sand Hollow Creek subwatershed drains 93 square miles of rangeland, agricultural land and
mixed rural farmstead. Sand Hollow Creek is located in the northwest portion of the lower Boise
River watershed, although it ultimately drains to the Snake River. Sand Hollow Creek largely
flows through Canyon County. However, the headwaters are located in Gem and Payette
Counties, north of the town of Notus along the topography separating the lower Boise River and
lower Payette River subbasins. The stream flows in a southwesterly direction from its origin to
Interstate 84, then in a northwesterly direction from the interstate to its confluence with the
Snake River approximately one mile north of the mouth of the Boise River.
Detailed discussions of the Sand Hollow Creek subwatershed were provided in the Sand Hollow
Creek Subbasin Assessment (DEQ 2001c), which is available at:
http://www.deq.idaho.gov/water-quality/surface-water/tmdls/table-of-sbas-tmdls/boise-river-
lower-nutrient-tributary-subbasin.aspx
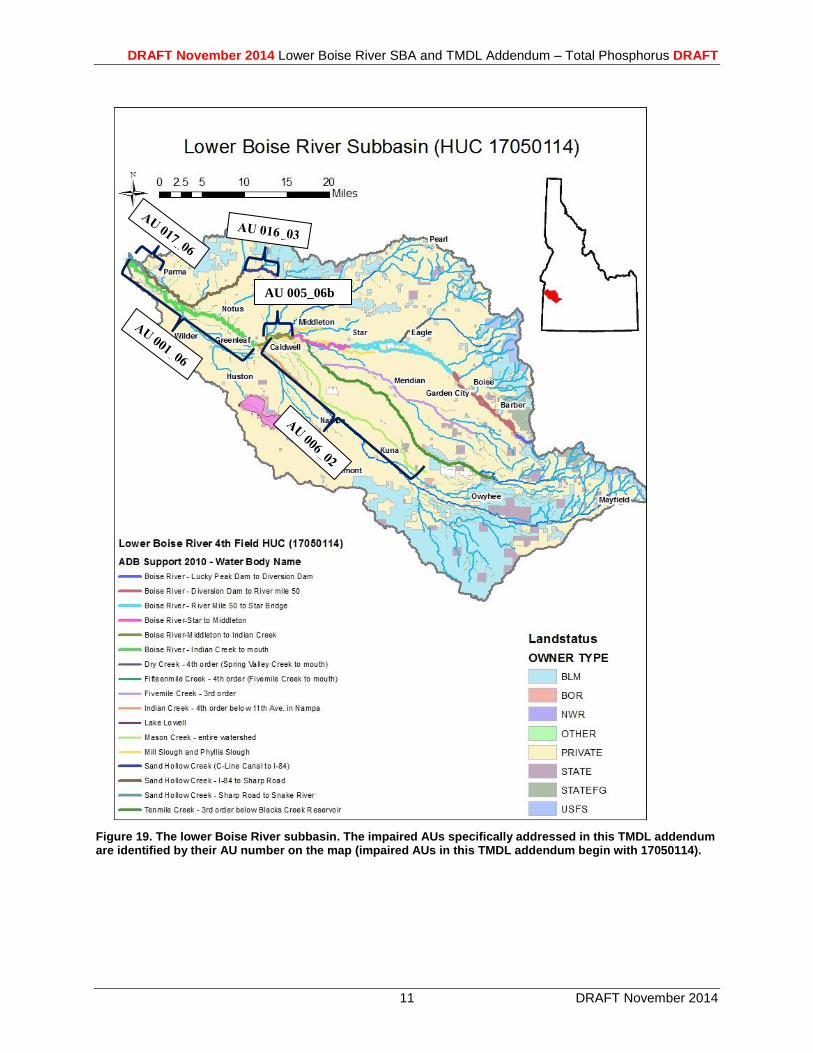
DRAFT November 2014 Lower Boise River SBA and TMDL Addendum – Total Phosphorus DRAFT
11 DRAFT November 2014
Figure 19. The lower Boise River subbasin. The impaired AUs specifically addressed in this TMDL addendum are identified by their AU number on the map (impaired AUs in this TMDL addendum begin with 17050114).
AU 005_06b
DRAFT November 2014 Lower Boise River SBA and TMDL Addendum – Total Phosphorus DRAFT
12 DRAFT November 2014
2 Subbasin Assessment—Water Quality Concerns and Status
A subbasin assessment includes a description of water quality concerns and the status and
attainability of designated uses and water quality criteria for the water bodies in the watershed.
This section identifies §303(d)-listed waters that are addressed in the TMDL, listing history, and
the rationales for listing, the listed pollutants, a description of the designated uses and whether
the uses are attainable, the criteria to protect the designated uses and a summary and analyses of
existing water quality data in the subbasin.
2.1 Water Quality Limited Assessment Units Occurring in the Subbasin
Section 303(d) of the Clean Water Act states that waters that are unable to support their
beneficial uses and do not meet water quality standards must be listed as water quality limited.
Subsequently, these waters are required to have TMDLs developed to bring them into
compliance with water quality standards.
2.1.1 Assessment Units
Assessment units (AUs) are groups of similar streams that have similar land use practices,
ownership, or land management. However, stream order is the main basis for determining AUs—
even if ownership and land use change significantly, the AU usually remains the same for the
same stream order.
Using AUs to describe water bodies offers many benefits, primarily that all waters of the state
are defined consistently. AUs are a subset of water body identification numbers, which allows
them to relate directly to the water quality standards.
Table 8 shows the pollutants listed and the basis for listing for each §303(d)-listed AU and
pollutant combination in the lower Boise River subbasin that is addressed in this TMDL. It also
shows three AUs that are not on the §303(d) list but are intimately tied to the water quality of the
listed AUs.
Two AUs on the main stem lower Boise River are listed as impaired for TP, in part, due to EPA's
Partial Approval/Partial Disapproval of Idaho's Final 2008 303(d) list letter dated February 4,
2009, in which EPA disapproved delisting of the lower Boise River for nutrients (total
phosphorus) because DEQ did not demonstrate good cause to delist, and that DEQ provided
insufficient rationale to justify the exclusion of existing and readily available data. EPA
subsequently took public comment on this reversal that ended May 15, 2009. EPA concluded in
their final decision letter dated October 13, 2009 that the lower Boise River is water quality-
limited and EPA returned the lower Boise River to Idaho’s 303(d) list. EPA's final determination
on the lower Boise River (EPA 2009a) is available at http://www.deq.idaho.gov/media/773615-
2008-ir-epa-response-lower-boise-river-hemcreek-101309.pdf
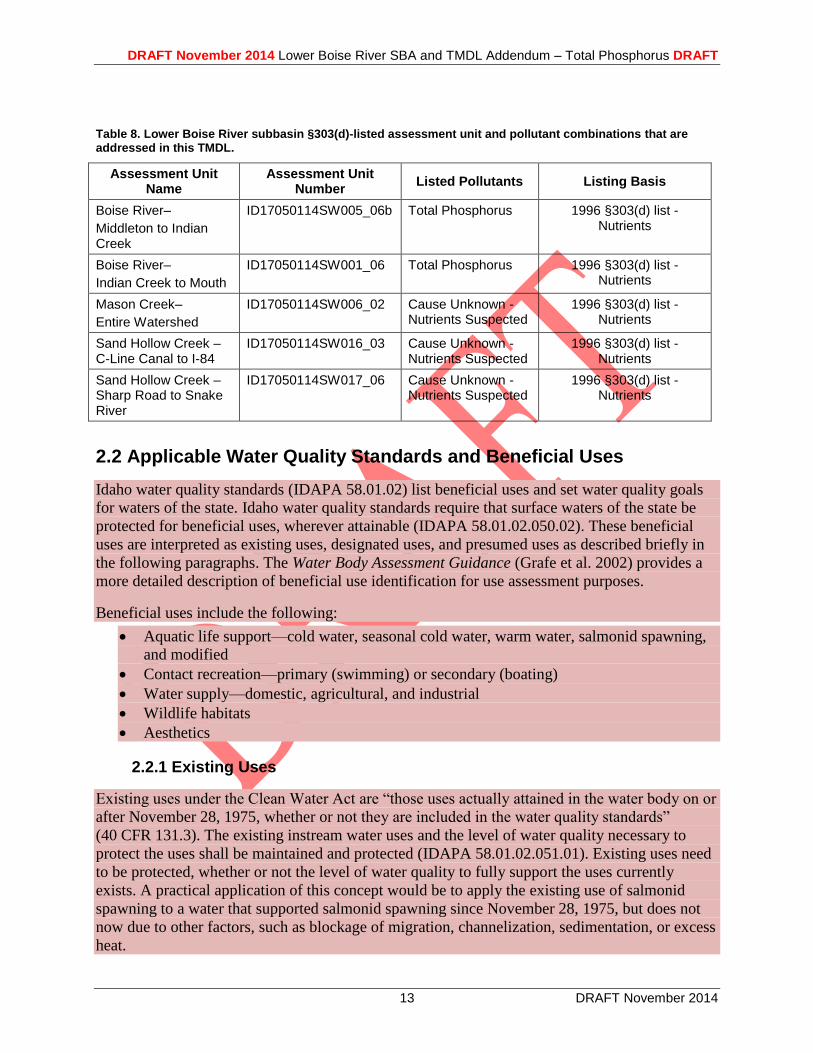
DRAFT November 2014 Lower Boise River SBA and TMDL Addendum – Total Phosphorus DRAFT
13 DRAFT November 2014
Table 8. Lower Boise River subbasin §303(d)-listed assessment unit and pollutant combinations that are addressed in this TMDL.
Assessment Unit Name
Assessment Unit Number
Listed Pollutants Listing Basis
Boise River–
Middleton to Indian Creek
ID17050114SW005_06b Total Phosphorus 1996 §303(d) list - Nutrients
Boise River–
Indian Creek to Mouth
ID17050114SW001_06 Total Phosphorus 1996 §303(d) list - Nutrients
Mason Creek–
Entire Watershed
ID17050114SW006_02 Cause Unknown - Nutrients Suspected
1996 §303(d) list - Nutrients
Sand Hollow Creek – C-Line Canal to I-84
ID17050114SW016_03 Cause Unknown - Nutrients Suspected
1996 §303(d) list - Nutrients
Sand Hollow Creek – Sharp Road to Snake River
ID17050114SW017_06 Cause Unknown - Nutrients Suspected
1996 §303(d) list - Nutrients
2.2 Applicable Water Quality Standards and Beneficial Uses
Idaho water quality standards (IDAPA 58.01.02) list beneficial uses and set water quality goals
for waters of the state. Idaho water quality standards require that surface waters of the state be
protected for beneficial uses, wherever attainable (IDAPA 58.01.02.050.02). These beneficial
uses are interpreted as existing uses, designated uses, and presumed uses as described briefly in
the following paragraphs. The Water Body Assessment Guidance (Grafe et al. 2002) provides a
more detailed description of beneficial use identification for use assessment purposes.
Beneficial uses include the following:
Aquatic life support—cold water, seasonal cold water, warm water, salmonid spawning,
and modified
Contact recreation—primary (swimming) or secondary (boating)
Water supply—domestic, agricultural, and industrial
Wildlife habitats
Aesthetics
2.2.1 Existing Uses
Existing uses under the Clean Water Act are “those uses actually attained in the water body on or
after November 28, 1975, whether or not they are included in the water quality standards”
(40 CFR 131.3). The existing instream water uses and the level of water quality necessary to
protect the uses shall be maintained and protected (IDAPA 58.01.02.051.01). Existing uses need
to be protected, whether or not the level of water quality to fully support the uses currently
exists. A practical application of this concept would be to apply the existing use of salmonid
spawning to a water that supported salmonid spawning since November 28, 1975, but does not
now due to other factors, such as blockage of migration, channelization, sedimentation, or excess
heat.
DRAFT November 2014 Lower Boise River SBA and TMDL Addendum – Total Phosphorus DRAFT
14 DRAFT November 2014
2.2.2 Designated Uses
Designated uses under the Clean Water Act are “those uses specified in water quality standards
for each water body or segment, whether or not they are being attained” (40 CFR 131.3).
Designated uses are simply uses officially recognized by the state. In Idaho, these include uses
such as aquatic life support, recreation in and on the water, domestic water supply, and
agricultural uses. Multiple uses often apply to the same water; in this case, water quality must be
sufficiently maintained to meet the most sensitive use (designated or existing). Designated uses
may be added or removed using specific procedures provided for in state law, but the effect must
not be to preclude protection of an existing higher quality use such as cold water aquatic life or
salmonid spawning. Designated uses are described in the Idaho water quality standards (IDAPA
58.01.02.100) and specifically listed by water body in sections 110–160.
2.2.3 Undesignated Surface Waters and Presumed Use Protection
In Idaho, due to a change in scale of cataloging waters in 2000, most water bodies listed in the
tables of designated uses in the water quality standards do not yet have specific use designations
(IDAPA 58.01.02 §110-160). The WQS have three sections that address nondesignated
waters. Section 101.02 and 101.03 specifically address nondesignated man-made waterways and
private waters. All other undesignated waters are addressed by section 101.01. Under this
section, absent information on existing uses, DEQ presumes that most of Idaho waters will
support cold water aquatic life and either primary or secondary contact recreation (IDAPA
58.01.02.101.01). To protect these so-called presumed uses, DEQ applies the numeric cold water
and recreation criteria to undesignated waters. If in addition to presumed uses, an additional
existing use (e.g., salmonid spawning) exists, then the additional numeric criteria for salmonid
spawning would also apply (e.g., intergravel dissolved oxygen, temperature) because of the
requirement to protect water quality for that existing use. However, if some other use that
requires less stringent criteria for protection (such as seasonal cold aquatic life) is found to be an
existing use, then a use designation (rulemaking) is needed before that use can be applied in lieu
of cold water criteria (IDAPA 58.01.02.101.01).
2.2.4 Man-made Waterways and Private Waters
Man-made waterways and private waters have no presumed use protections. Manmade waters
are protected for the use for which they were constructed unless otherwise designated in the
water quality standards. Private waters are not protected for any beneficial uses unless
specifically designated in the water quality standards.
2.2.5 Attainment of Beneficial Uses in the Subbasin
Designated uses must reflect existing uses, but also may include uses that do not currently exist
if the uses can be attained in the future. (Idaho Code § 39-3604). The Boise River AUs are
designated for cold water aquatic life and recreational uses. Mason Creek and Sand Hollow are
designated for recreational uses, but are undesignated for aquatic life. Under section 101.01
(discussed above) Mason Creek and Sand Hollow are presumed to support cold water aquatic
life, and so are protected for this use through the application of the applicable cold water aquatic
life criteria. Part of the purpose of a Subbasin Assessment is to review whether the uses that are
designated are attainable uses. For the Lower Boise Subbasin, this mean looking at whether cold
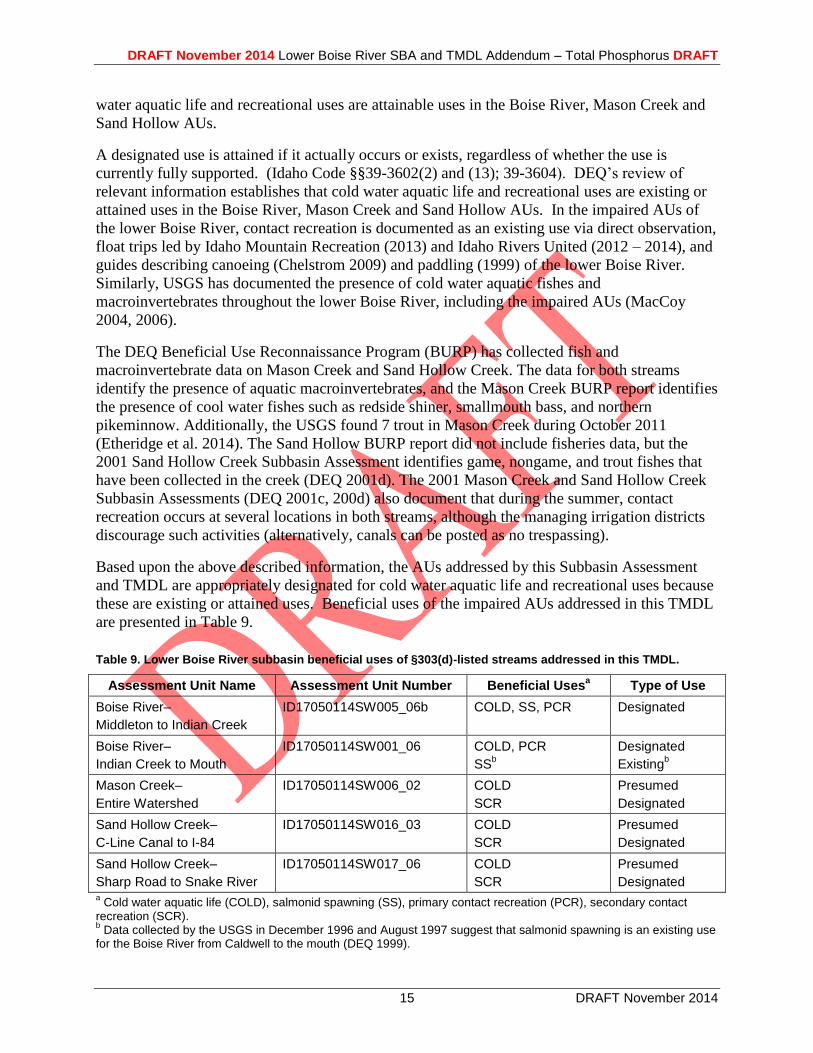
DRAFT November 2014 Lower Boise River SBA and TMDL Addendum – Total Phosphorus DRAFT
15 DRAFT November 2014
water aquatic life and recreational uses are attainable uses in the Boise River, Mason Creek and
Sand Hollow AUs.
A designated use is attained if it actually occurs or exists, regardless of whether the use is
currently fully supported. (Idaho Code §§39-3602(2) and (13); 39-3604). DEQ’s review of
relevant information establishes that cold water aquatic life and recreational uses are existing or
attained uses in the Boise River, Mason Creek and Sand Hollow AUs. In the impaired AUs of
the lower Boise River, contact recreation is documented as an existing use via direct observation,
float trips led by Idaho Mountain Recreation (2013) and Idaho Rivers United (2012 – 2014), and
guides describing canoeing (Chelstrom 2009) and paddling (1999) of the lower Boise River.
Similarly, USGS has documented the presence of cold water aquatic fishes and
macroinvertebrates throughout the lower Boise River, including the impaired AUs (MacCoy
2004, 2006).
The DEQ Beneficial Use Reconnaissance Program (BURP) has collected fish and
macroinvertebrate data on Mason Creek and Sand Hollow Creek. The data for both streams
identify the presence of aquatic macroinvertebrates, and the Mason Creek BURP report identifies
the presence of cool water fishes such as redside shiner, smallmouth bass, and northern
pikeminnow. Additionally, the USGS found 7 trout in Mason Creek during October 2011
(Etheridge et al. 2014). The Sand Hollow BURP report did not include fisheries data, but the
2001 Sand Hollow Creek Subbasin Assessment identifies game, nongame, and trout fishes that
have been collected in the creek (DEQ 2001d). The 2001 Mason Creek and Sand Hollow Creek
Subbasin Assessments (DEQ 2001c, 200d) also document that during the summer, contact
recreation occurs at several locations in both streams, although the managing irrigation districts
discourage such activities (alternatively, canals can be posted as no trespassing).
Based upon the above described information, the AUs addressed by this Subbasin Assessment
and TMDL are appropriately designated for cold water aquatic life and recreational uses because
these are existing or attained uses. Beneficial uses of the impaired AUs addressed in this TMDL
are presented in Table 9.
Table 9. Lower Boise River subbasin beneficial uses of §303(d)-listed streams addressed in this TMDL.
Assessment Unit Name Assessment Unit Number Beneficial Usesa Type of Use
Boise River–
Middleton to Indian Creek
ID17050114SW005_06b COLD, SS, PCR Designated
Boise River–
Indian Creek to Mouth
ID17050114SW001_06 COLD, PCR
SSb
Designated
Existingb
Mason Creek–
Entire Watershed
ID17050114SW006_02 COLD
SCR
Presumed
Designated
Sand Hollow Creek–
C-Line Canal to I-84
ID17050114SW016_03 COLD
SCR
Presumed
Designated
Sand Hollow Creek–
Sharp Road to Snake River
ID17050114SW017_06 COLD
SCR
Presumed
Designated a Cold water aquatic life (COLD), salmonid spawning (SS), primary contact recreation (PCR), secondary contact
recreation (SCR). b Data collected by the USGS in December 1996 and August 1997 suggest that salmonid spawning is an existing use
for the Boise River from Caldwell to the mouth (DEQ 1999).
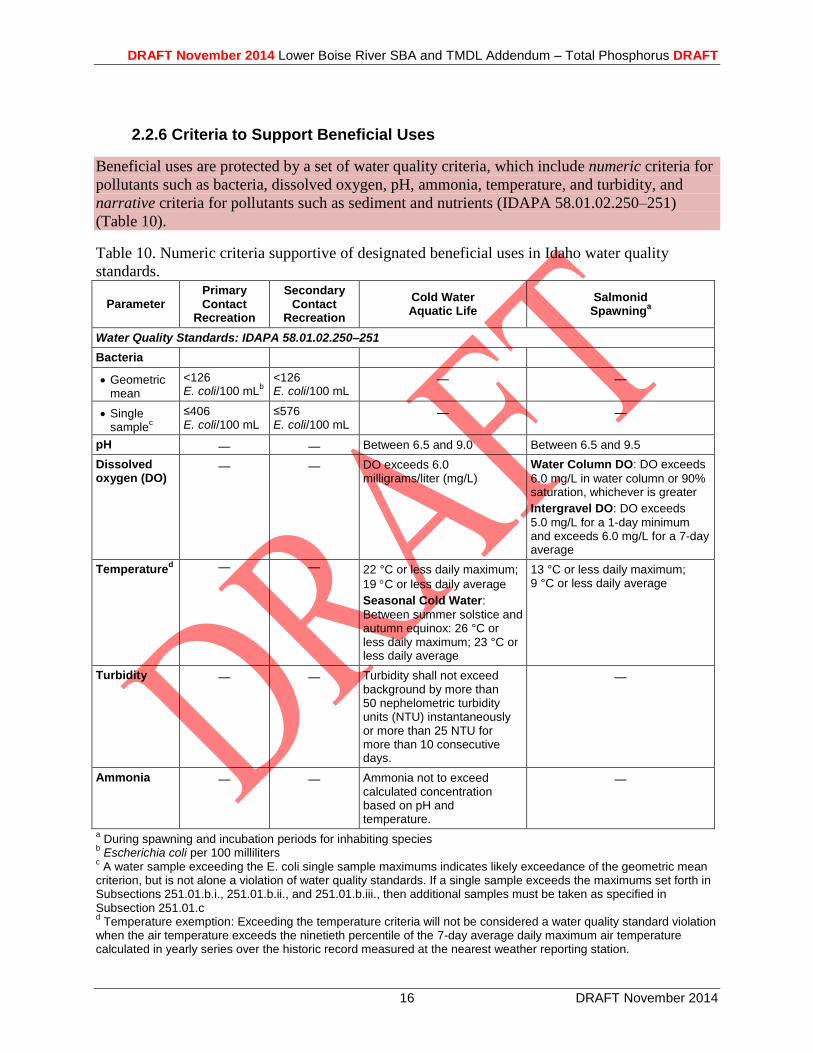
DRAFT November 2014 Lower Boise River SBA and TMDL Addendum – Total Phosphorus DRAFT
16 DRAFT November 2014
2.2.6 Criteria to Support Beneficial Uses
Beneficial uses are protected by a set of water quality criteria, which include numeric criteria for
pollutants such as bacteria, dissolved oxygen, pH, ammonia, temperature, and turbidity, and
narrative criteria for pollutants such as sediment and nutrients (IDAPA 58.01.02.250–251)
(Table 10).
Table 10. Numeric criteria supportive of designated beneficial uses in Idaho water quality
standards.
Parameter Primary Contact
Recreation
Secondary Contact
Recreation
Cold Water Aquatic Life
Salmonid Spawning
a
Water Quality Standards: IDAPA 58.01.02.250–251
Bacteria
Geometric mean
<126 E. coli/100 mL
b
<126 E. coli/100 mL
— —
Single sample
c
≤406 E. coli/100 mL
≤576 E. coli/100 mL
— —
pH — — Between 6.5 and 9.0 Between 6.5 and 9.5
Dissolved oxygen (DO)
— — DO exceeds 6.0 milligrams/liter (mg/L)
Water Column DO: DO exceeds
6.0 mg/L in water column or 90% saturation, whichever is greater
Intergravel DO: DO exceeds
5.0 mg/L for a 1-day minimum and exceeds 6.0 mg/L for a 7-day average
Temperatured — — 22 °C or less daily maximum;
19 C or less daily average
Seasonal Cold Water:
Between summer solstice and autumn equinox: 26 °C or less daily maximum; 23 °C or less daily average
13 °C or less daily maximum; 9 °C or less daily average
Turbidity — — Turbidity shall not exceed background by more than 50 nephelometric turbidity units (NTU) instantaneously or more than 25 NTU for more than 10 consecutive days.
—
Ammonia — — Ammonia not to exceed calculated concentration based on pH and temperature.
—
a During spawning and incubation periods for inhabiting species
b Escherichia coli per 100 milliliters
c A water sample exceeding the E. coli single sample maximums indicates likely exceedance of the geometric mean
criterion, but is not alone a violation of water quality standards. If a single sample exceeds the maximums set forth in Subsections 251.01.b.i., 251.01.b.ii., and 251.01.b.iii., then additional samples must be taken as specified in Subsection 251.01.c d Temperature exemption: Exceeding the temperature criteria will not be considered a water quality standard violation
when the air temperature exceeds the ninetieth percentile of the 7-day average daily maximum air temperature calculated in yearly series over the historic record measured at the nearest weather reporting station.
DRAFT November 2014 Lower Boise River SBA and TMDL Addendum – Total Phosphorus DRAFT
17 DRAFT November 2014
Narrative criteria for excess nutrients are described in the water quality standards:
Surface waters of the state shall be free from excess nutrients that can cause visible slime growths or other nuisance aquatic growths impairing designated beneficial uses. (IDAPA 58.01.02.200.06)
In consultation with the LBWC, DEQ has identified and refined a numeric target to describe
nuisance aquatic growth that may impair AUs of the lower Boise River: mean monthly benthic
(periphyton) chlorophyll a < 150 mg/m2. The target was based largely on work conducted in
Montana, in which 70% of the public identified periphyton of < 150 mg/m2
as acceptable for
recreation during the growing season from July 1 – September 30 (Suplee et al. 2008, 2009). In
contrast, less than 30% of the public identified periphyton of > 200 mg/m2
as acceptable for
recreation. The target is similar to other locations, including Montana, Minnesota, Colorado, and
the Clark Fork River, for which the maximum summer periphyton target is 150 mg/m2 (TSIC
1998, MDEQ 2008, CDPHE 2013, MPAC 2013).
Additional scientific findings support the use of a benthic chlorophyll a target of <150 mg/m2 as
appropriate for recreation and cold water aquatic life beneficial uses. For example, literature
suggests nuisance aquatic algae become apparent between 100 and 200 mg/m2 and enriched
waters often have benthic chlorophyll a concentrations > 150 mg/m2 (Welch et al. 1988, Dodds
and Welch 2000). Biggs (2000) asserted that chlorophyll-a levels > 150-200 mg/m2 are very
conspicuous in streams, are probably unnaturally high, and can compromise the use of rivers for
contact recreation and productive sports fisheries (Welch et al. 1988, Dodds et al. 1998). Some
of the management problems caused by enrichment, and associated benthic algal proliferations,
include aesthetic degradation, alteration of fish and invertebrate communities nutrient
enrichment and algae proliferation, and degradation of water quality (particularly dissolved
oxygen and pH) (e.g.Miltner and Rankin 1998, Welch et al. 1988, Biggs 2000, Miltner 2010).
Filamentous green algae can have a less desirable appearance than brown-colored diatoms, and
can be more problematic for recreation and aquatic life, even when their biomasses are similar
(Dodds and Welch 2000). Nevertheless, increased nutrient concentration leads to some
detectable changes in higher trophic levels of rivers and streams, especially for grazing
invertebrates, in communities dominated by periphytic diatoms (Miltner and Rankin 1998).
Above 100 mg/m2 chlorophyll a, Welch et al. (1988) observed that filamentous species tended to
dominate the periphytic composition.
Further, research indicates that total nutrients can provide better overall correlation to
eutrophication in streams than do soluble nutrients and that total nitrogen (TN) and TP may be
minimum acceptable nutrient criteria in addition to other environmental drivers such light
limitation and water velocities (Dodds et al. 1997, Hilton et al. 2006). However, Biggs (2000)
identifies advantages and disadvantages of using different nutrient forms in benthic algal
biomass-nutrient regression models in streams and rivers.
DEQ’s procedure to determine whether a water body fully supports designated and existing
beneficial uses is outlined in IDAPA 58.01.02.050.02. The procedure relies heavily upon
biological parameters and is presented in detail in the Water Body Assessment Guidance (Grafe
et al. 2002). This guidance requires DEQ to use the most complete data available to make
beneficial use support status determinations (Figure 20).
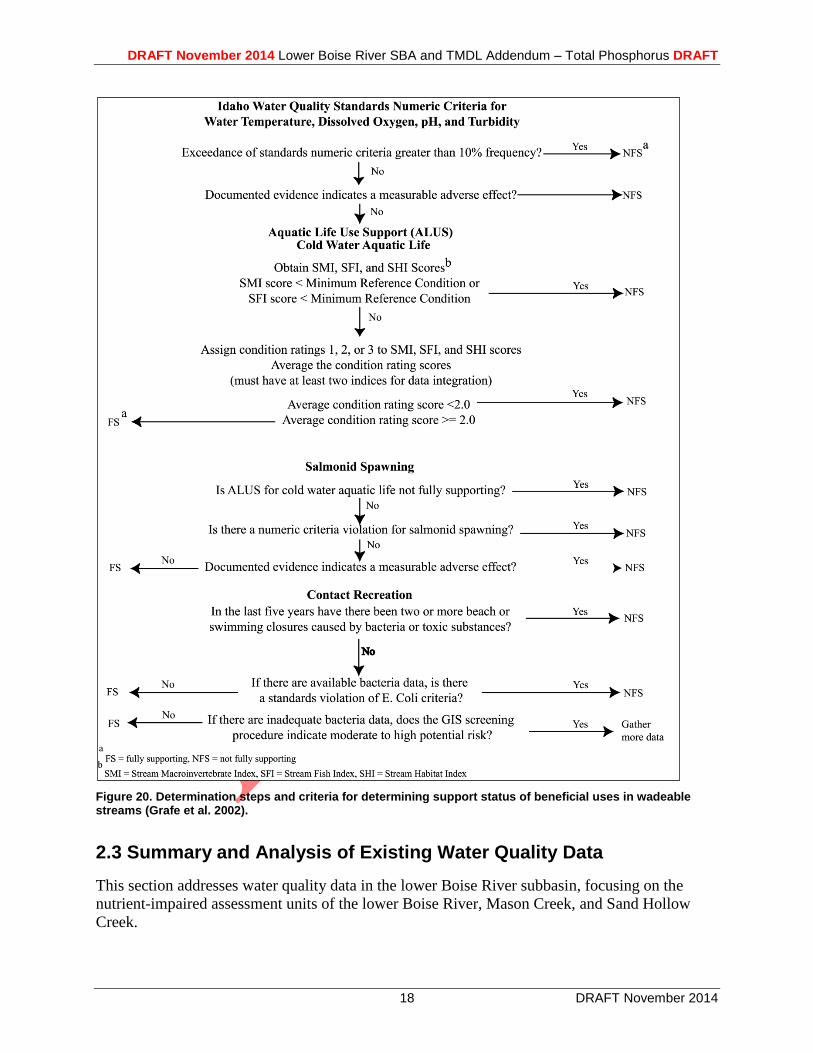
DRAFT November 2014 Lower Boise River SBA and TMDL Addendum – Total Phosphorus DRAFT
18 DRAFT November 2014
Figure 20. Determination steps and criteria for determining support status of beneficial uses in wadeable streams (Grafe et al. 2002).
2.3 Summary and Analysis of Existing Water Quality Data
This section addresses water quality data in the lower Boise River subbasin, focusing on the
nutrient-impaired assessment units of the lower Boise River, Mason Creek, and Sand Hollow
Creek.
DRAFT November 2014 Lower Boise River SBA and TMDL Addendum – Total Phosphorus DRAFT
19 DRAFT November 2014
Since the Lower Boise River TMDL Subbasin Assessment TMDL (DEQ 1999) was approved,
DEQ has collected data, requested data from other agencies and organizations, searched external
databases, and reviewed university publications and municipal or regional resource management
plans for additional and recent water quality data. The results of that effort were compiled in the
Lower Boise River Total Phosphorus Five-Year Review (DEQ 2009), available at
http://www.deq.idaho.gov/water-quality/surface-water/tmdls/table-of-sbas-tmdls/boise-river-
lower-subbasin.aspx.
Similarly, DEQ completed the Mason Creek Subbasin Assessment (2001c) and the Sand Hollow
Creek Subbasin Assessment (2001d), which identify data collected in the respective
subwatersheds. Both of these reports are available at http://www.deq.idaho.gov/water-
quality/surface-water/tmdls/table-of-sbas-tmdls/boise-river-lower-nutrient-tributary-
subbasin.aspx,
and
http://www.deq.idaho.gov/water-quality/surface-water/tmdls/table-of-sbas-tmdls/boise-river-
lower-nutrient-tributary-subbasin.aspx.
Since then, water quality and quantity data have continued to be collected in the lower Boise
River subbasin by DEQ, LBWC, USGS, ISDA, municipalities, and other agencies and
organizations (see Appendix B – Data Sources).
The DEQ BURP has monitored several sites on the lower Boise River and within the subbasin
(Figure 21). BURP protocol focuses on biological indicators and typically doesn’t capture
nutrient impacts. However, the data can identify and measure conditions involving dissolved
oxygen, channel substrates, sediment, habitat, and fish and macroinvertebrate populations.
Data Quality and Acceptance
Various current and historical data are analyzed and presented in this TMDL addendum to
quantify phosphorus and other environmental conditions in the lower Boise River. These data
were collected and provided by various agencies and organizations (See Appendix B. Data
Sources) and followed standard and accepted collection and analysis methods as deemed to be of
adequate quality for inclusion in the agency water quality programs. Data used to help calibrate
the AQUATOX model are documented in DEQ’s AQUATOX Model Report (DEQ 2014a) and
DEQ’s AQUATOX Quality Assurance Project Plan (DEQ 2014b).
USGS data, available through the National Water Information System (NWIS) web interface,
along with data from the USGS synoptic sampling and mass balance models (Etheridge 2013)
were used to develop the May 1 – September 30 flow and phosphorus load duration analyses in
the lower Boise River. Samples collected by the USGS were typically analyzed for
orthophosphate as phosphorus following the ammonium molybdate method procedures (Fishman
1993). USGS collected depth- and width-integrated isokinetic samples at locations where
streamflow gages are located and/or other common water quality monitoring locations.
Municipalities with wastewater discharge typically follow Standards Methods 4500 for the
orthophosphate analysis of their wastewater effluent; in this analysis ammonium molybdate and
potassium antimonyl tartrate react in acid medium with orthophosphate to form a heteropoly
phosphomolybdic acid, which is reduced to intensely colored molybdenum blue by ascorbic acid.
DRAFT November 2014 Lower Boise River SBA and TMDL Addendum – Total Phosphorus DRAFT
20 DRAFT November 2014
These methods are typically applicable for orthophosphate concentrations in the range of 0.01 to
6 mg/L.
This methodology assumes the orthophosphorus is at a moderate concentration and is completely
bioavailable for algal and plant uptake and growth. As orthophosphorus is reduced throughout
the watershed, lower level detection methods will be necessary. Additional research shows that
the assumption that all orthophosphorus may not be equally bioavailable for algal and plant
uptake and growth. There are different rates for labile and refractory decay of the constituents
binding phosphorus that influence the bioavailability of the orthophosphorus. More data and
analysis would be necessary to further categorize the orthophosphorus sources throughout the
watershed. For this TMDL addendum, DEQ maintains the assumption that orthophosphorus
from all sources is completely bioavailable and will be analyzed and modeled as such for a
conservative approach. However, DEQ recognizes the potential implications of differing
orthophosphorus bioavailability. Therefore, for the long term success of the TMDL addendum
and implementation of source reductions, DEQ will consider bioavailability data from the
sources as new information becomes available now and during the five-year assessments of the
TMDL addendum. It is important to note that using this conservative approach provides
reasonable assurance that this TMDL will meet water quality standards to support beneficial
uses.
Magnitude, Duration, and Frequency
Analyzing existing water quality data includes spatially and temporally examining data using
statistical methods to understand and identify water quality conditions in the river relative to
water quality standards. Recognized components of these analyses include magnitude, duration,
and frequency. Analyzing the water quality data by magnitude, frequency, and duration is
important because a similar analysis is used to determine the actual impairment of designated
uses and development of the TMDL. The acceptable conditions for these factors are often based
on ecological studies of pollutant effects and recovery periods.
The first component is magnitude, which refers to water quality and pollutant concentrations that
are characteristic or representative of conditions. Magnitude of the water quality dataset is often
summarized using statistics such as the minimum, median, average and maximum.
The second component is the duration, or the period of time over which concentrations can be
averaged and beneficial uses (e.g. aquatic life and contact recreation) can be exposed to elevated
levels of pollutants without harm. Since collected data are often from single instantaneous
observations, assumptions are made to estimate the day, week, month, or season that such
conditions typically occur. The duration is particularly important for certain pollutants whose
effects are long term, such as sediment, nutrients and algal biomass. These parameters are
frequently addressed in TMDLs as seasonal or annual loads. The analysis of existing water
quality data described below included a review by duration based on periods used in previous
studies. These periods include: flow conditions, May 1 – September 30 as used in the SR-HC
TMDL, and during irrigation season (August 2012), shortly after irrigation ended (October
2012), and shortly before irrigation resumed (March 2013) as used by the USGS (Etheridge
2013).
DRAFT November 2014 Lower Boise River SBA and TMDL Addendum – Total Phosphorus DRAFT
21 DRAFT November 2014
The third component is the frequency, or how often characteristic water quality conditions may
occur in the river without impairing the beneficial uses. While the robustness of the dataset is
important for evaluating the frequency, an estimation of the level of various magnitudes of
conditions occur once in three seasons and once in ten seasons is described below.
Lower Boise River
Due to higher flows in the lower Boise River than are typically feasible for completing BURP
activities, BURP protocol could not be completed at these main stem sites, yielding limited data
collection and analyses (specifically stated in the 1995SBOIC029 site data, and presumed for the
remaining two main stem sites). The BURP data and summary reports can be obtained through
DEQ’s 305(b) Integrated Report webpage at http://mapcase.deq.idaho.gov/wq2010/.
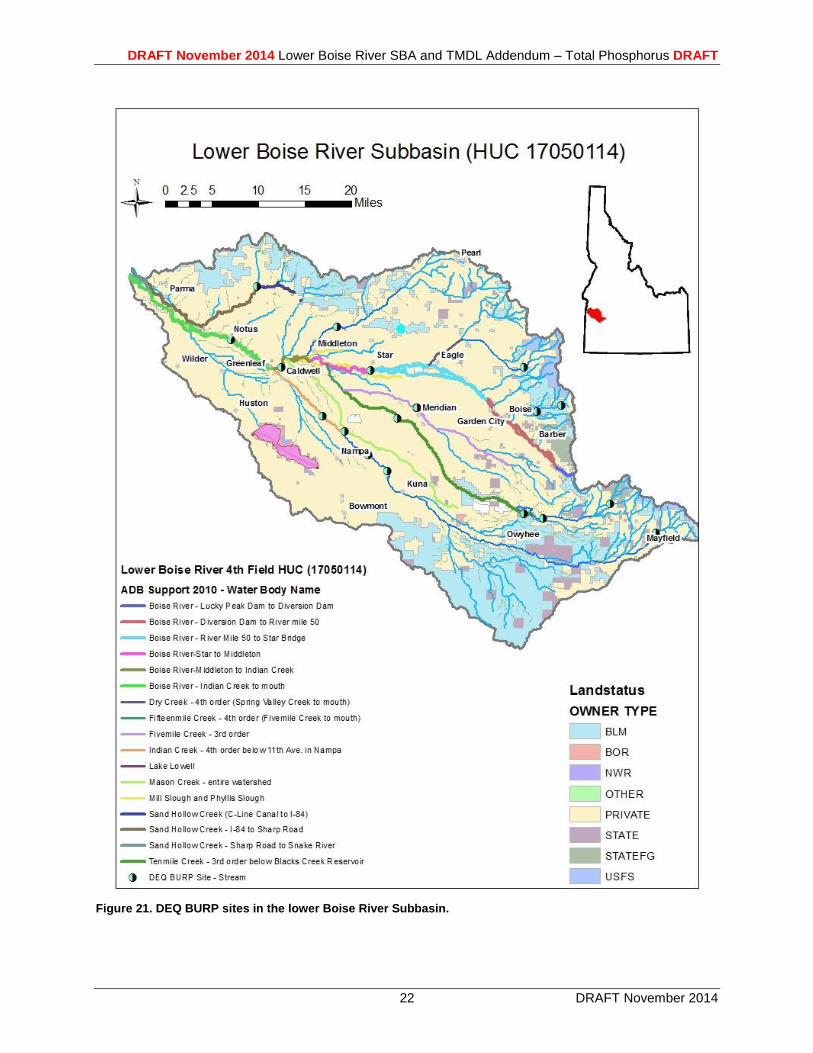
DRAFT November 2014 Lower Boise River SBA and TMDL Addendum – Total Phosphorus DRAFT
22 DRAFT November 2014
Figure 21. DEQ BURP sites in the lower Boise River Subbasin.
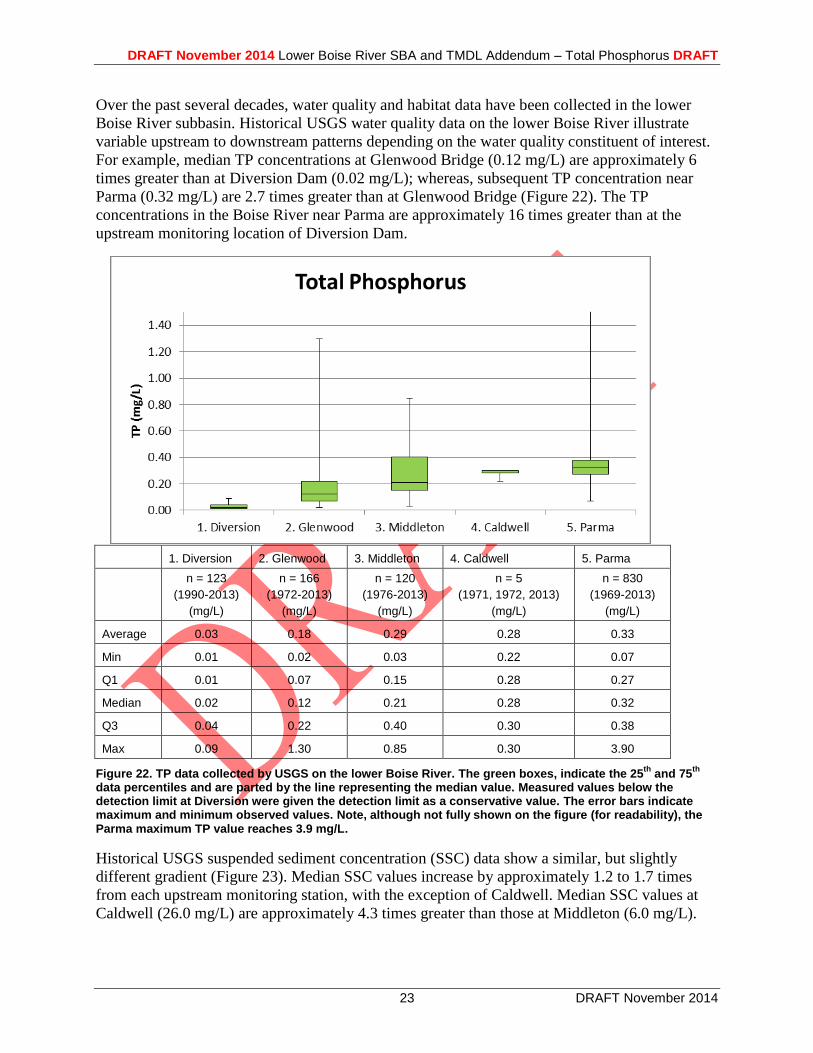
DRAFT November 2014 Lower Boise River SBA and TMDL Addendum – Total Phosphorus DRAFT
23 DRAFT November 2014
Over the past several decades, water quality and habitat data have been collected in the lower
Boise River subbasin. Historical USGS water quality data on the lower Boise River illustrate
variable upstream to downstream patterns depending on the water quality constituent of interest.
For example, median TP concentrations at Glenwood Bridge (0.12 mg/L) are approximately 6
times greater than at Diversion Dam (0.02 mg/L); whereas, subsequent TP concentration near
Parma (0.32 mg/L) are 2.7 times greater than at Glenwood Bridge (Figure 22). The TP
concentrations in the Boise River near Parma are approximately 16 times greater than at the
upstream monitoring location of Diversion Dam.
1. Diversion 2. Glenwood 3. Middleton 4. Caldwell 5. Parma
n = 123
(1990-2013)
(mg/L)
n = 166
(1972-2013)
(mg/L)
n = 120
(1976-2013)
(mg/L)
n = 5
(1971, 1972, 2013)
(mg/L)
n = 830
(1969-2013)
(mg/L)
Average 0.03 0.18 0.29 0.28 0.33
Min 0.01 0.02 0.03 0.22 0.07
Q1 0.01 0.07 0.15 0.28 0.27
Median 0.02 0.12 0.21 0.28 0.32
Q3 0.04 0.22 0.40 0.30 0.38
Max 0.09 1.30 0.85 0.30 3.90
Figure 22. TP data collected by USGS on the lower Boise River. The green boxes, indicate the 25th
and 75th
data percentiles and are parted by the line representing the median value. Measured values below the detection limit at Diversion were given the detection limit as a conservative value. The error bars indicate maximum and minimum observed values. Note, although not fully shown on the figure (for readability), the Parma maximum TP value reaches 3.9 mg/L.
Historical USGS suspended sediment concentration (SSC) data show a similar, but slightly
different gradient (Figure 23). Median SSC values increase by approximately 1.2 to 1.7 times
from each upstream monitoring station, with the exception of Caldwell. Median SSC values at
Caldwell (26.0 mg/L) are approximately 4.3 times greater than those at Middleton (6.0 mg/L).
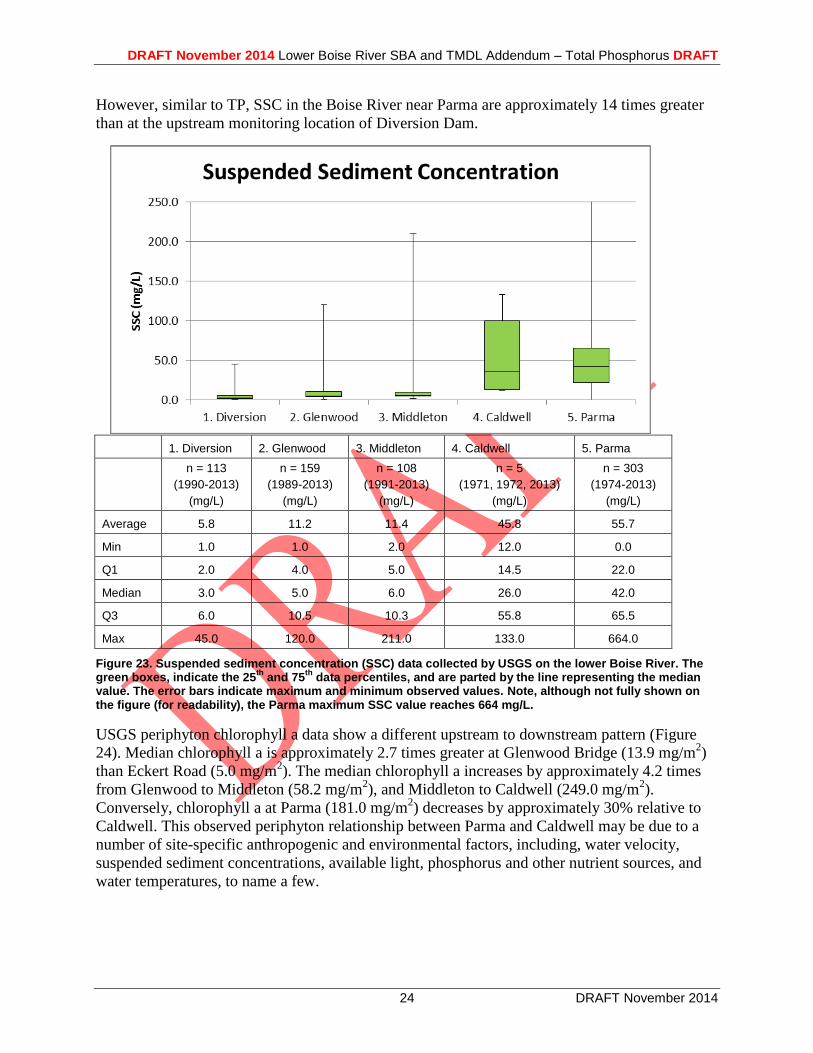
DRAFT November 2014 Lower Boise River SBA and TMDL Addendum – Total Phosphorus DRAFT
24 DRAFT November 2014
However, similar to TP, SSC in the Boise River near Parma are approximately 14 times greater
than at the upstream monitoring location of Diversion Dam.
1. Diversion 2. Glenwood 3. Middleton 4. Caldwell 5. Parma
n = 113
(1990-2013)
(mg/L)
n = 159
(1989-2013)
(mg/L)
n = 108
(1991-2013)
(mg/L)
n = 5
(1971, 1972, 2013)
(mg/L)
n = 303
(1974-2013)
(mg/L)
Average 5.8 11.2 11.4 45.8 55.7
Min 1.0 1.0 2.0 12.0 0.0
Q1 2.0 4.0 5.0 14.5 22.0
Median 3.0 5.0 6.0 26.0 42.0
Q3 6.0 10.5 10.3 55.8 65.5
Max 45.0 120.0 211.0 133.0 664.0
Figure 23. Suspended sediment concentration (SSC) data collected by USGS on the lower Boise River. The green boxes, indicate the 25
th and 75
th data percentiles, and are parted by the line representing the median
value. The error bars indicate maximum and minimum observed values. Note, although not fully shown on the figure (for readability), the Parma maximum SSC value reaches 664 mg/L.
USGS periphyton chlorophyll a data show a different upstream to downstream pattern (Figure
24). Median chlorophyll a is approximately 2.7 times greater at Glenwood Bridge (13.9 mg/m2)
than Eckert Road (5.0 mg/m2). The median chlorophyll a increases by approximately 4.2 times
from Glenwood to Middleton (58.2 mg/m2), and Middleton to Caldwell (249.0 mg/m
2).
Conversely, chlorophyll a at Parma (181.0 mg/m2) decreases by approximately 30% relative to
Caldwell. This observed periphyton relationship between Parma and Caldwell may be due to a
number of site-specific anthropogenic and environmental factors, including, water velocity,
suspended sediment concentrations, available light, phosphorus and other nutrient sources, and
water temperatures, to name a few.
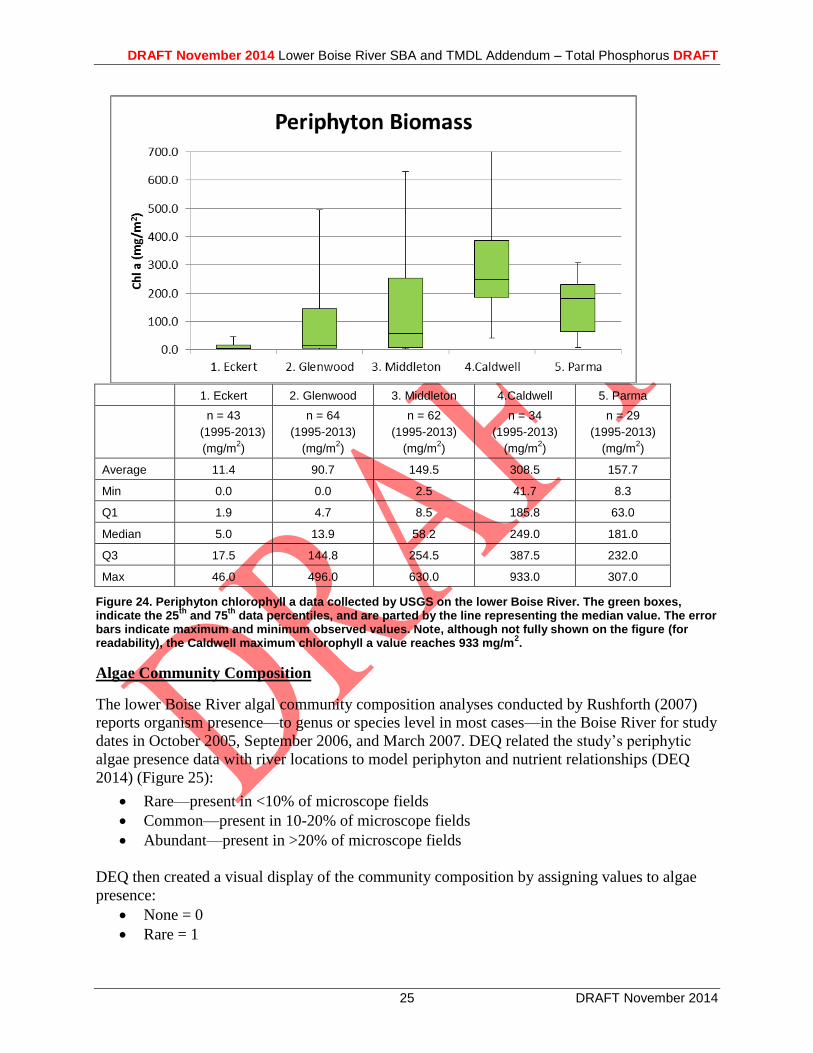
DRAFT November 2014 Lower Boise River SBA and TMDL Addendum – Total Phosphorus DRAFT
25 DRAFT November 2014
1. Eckert 2. Glenwood 3. Middleton 4.Caldwell 5. Parma
n = 43
(1995-2013)
(mg/m2)
n = 64
(1995-2013)
(mg/m2)
n = 62
(1995-2013)
(mg/m2)
n = 34
(1995-2013)
(mg/m2)
n = 29
(1995-2013)
(mg/m2)
Average 11.4 90.7 149.5 308.5 157.7
Min 0.0 0.0 2.5 41.7 8.3
Q1 1.9 4.7 8.5 185.8 63.0
Median 5.0 13.9 58.2 249.0 181.0
Q3 17.5 144.8 254.5 387.5 232.0
Max 46.0 496.0 630.0 933.0 307.0
Figure 24. Periphyton chlorophyll a data collected by USGS on the lower Boise River. The green boxes, indicate the 25
th and 75
th data percentiles, and are parted by the line representing the median value. The error
bars indicate maximum and minimum observed values. Note, although not fully shown on the figure (for readability), the Caldwell maximum chlorophyll a value reaches 933 mg/m
2.
Algae Community Composition
The lower Boise River algal community composition analyses conducted by Rushforth (2007)
reports organism presence—to genus or species level in most cases—in the Boise River for study
dates in October 2005, September 2006, and March 2007. DEQ related the study’s periphytic
algae presence data with river locations to model periphyton and nutrient relationships (DEQ
2014) (Figure 25):
Rare—present in <10% of microscope fields
Common—present in 10-20% of microscope fields
Abundant—present in >20% of microscope fields
DEQ then created a visual display of the community composition by assigning values to algae
presence:
None = 0
Rare = 1
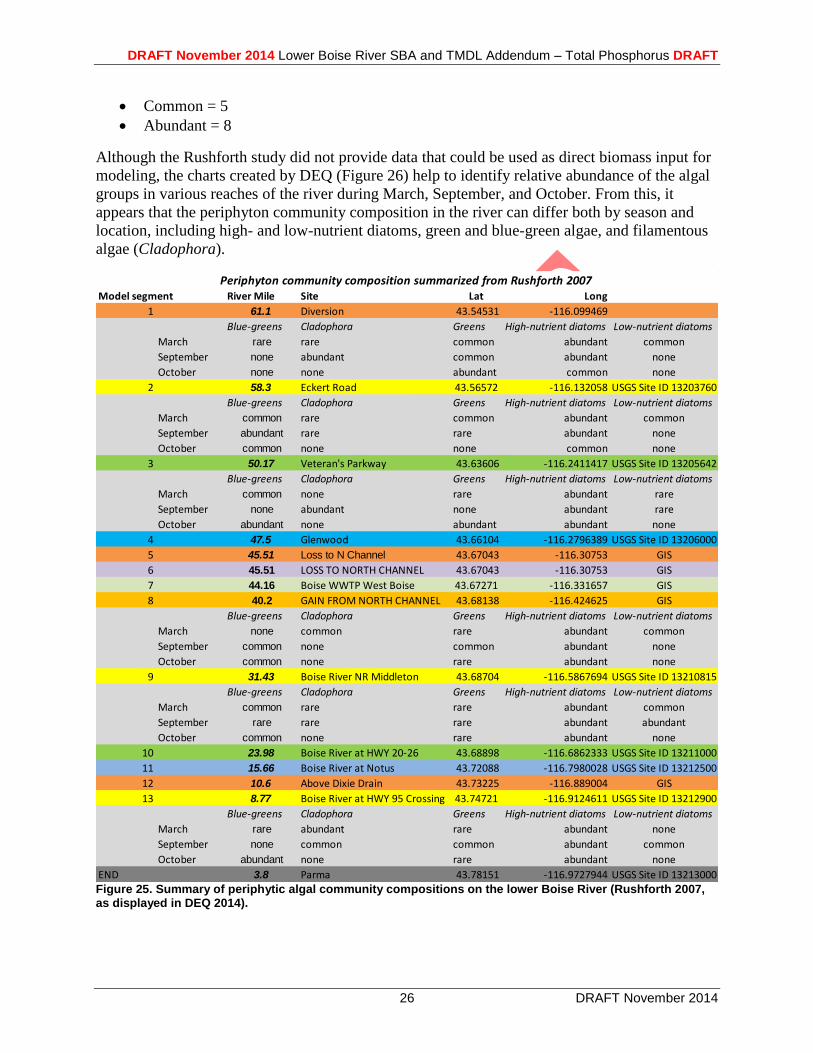
DRAFT November 2014 Lower Boise River SBA and TMDL Addendum – Total Phosphorus DRAFT
26 DRAFT November 2014
Common = 5
Abundant = 8
Although the Rushforth study did not provide data that could be used as direct biomass input for
modeling, the charts created by DEQ (Figure 26) help to identify relative abundance of the algal
groups in various reaches of the river during March, September, and October. From this, it
appears that the periphyton community composition in the river can differ both by season and
location, including high- and low-nutrient diatoms, green and blue-green algae, and filamentous
algae (Cladophora).
Figure 25. Summary of periphytic algal community compositions on the lower Boise River (Rushforth 2007, as displayed in DEQ 2014).
Model segment River Mile Site Lat Long
1 61.1 Diversion 43.54531 -116.099469
Blue-greens Cladophora Greens High-nutrient diatoms Low-nutrient diatoms
March rare rare common abundant common
September none abundant common abundant none
October none none abundant common none
2 58.3 Eckert Road 43.56572 -116.132058 USGS Site ID 13203760
Blue-greens Cladophora Greens High-nutrient diatoms Low-nutrient diatoms
March common rare common abundant common
September abundant rare rare abundant none
October common none none common none
3 50.17 Veteran's Parkway 43.63606 -116.2411417 USGS Site ID 13205642
Blue-greens Cladophora Greens High-nutrient diatoms Low-nutrient diatoms
March common none rare abundant rare
September none abundant none abundant rare
October abundant none abundant abundant none
4 47.5 Glenwood 43.66104 -116.2796389 USGS Site ID 13206000
5 45.51 Loss to N Channel 43.67043 -116.30753 GIS
6 45.51 LOSS TO NORTH CHANNEL 43.67043 -116.30753 GIS
7 44.16 Boise WWTP West Boise 43.67271 -116.331657 GIS
8 40.2 GAIN FROM NORTH CHANNEL 43.68138 -116.424625 GIS
Blue-greens Cladophora Greens High-nutrient diatoms Low-nutrient diatoms
March none common rare abundant common
September common none common abundant none
October common none rare abundant none
9 31.43 Boise River NR Middleton 43.68704 -116.5867694 USGS Site ID 13210815
Blue-greens Cladophora Greens High-nutrient diatoms Low-nutrient diatoms
March common rare rare abundant common
September rare rare rare abundant abundant
October common none rare abundant none
10 23.98 Boise River at HWY 20-26 43.68898 -116.6862333 USGS Site ID 13211000
11 15.66 Boise River at Notus 43.72088 -116.7980028 USGS Site ID 13212500
12 10.6 Above Dixie Drain 43.73225 -116.889004 GIS
13 8.77 Boise River at HWY 95 Crossing 43.74721 -116.9124611 USGS Site ID 13212900
Blue-greens Cladophora Greens High-nutrient diatoms Low-nutrient diatoms
March rare abundant rare abundant none
September none common common abundant common
October abundant none rare abundant none
END 3.8 Parma 43.78151 -116.9727944 USGS Site ID 13213000
Periphyton community composition summarized from Rushforth 2007
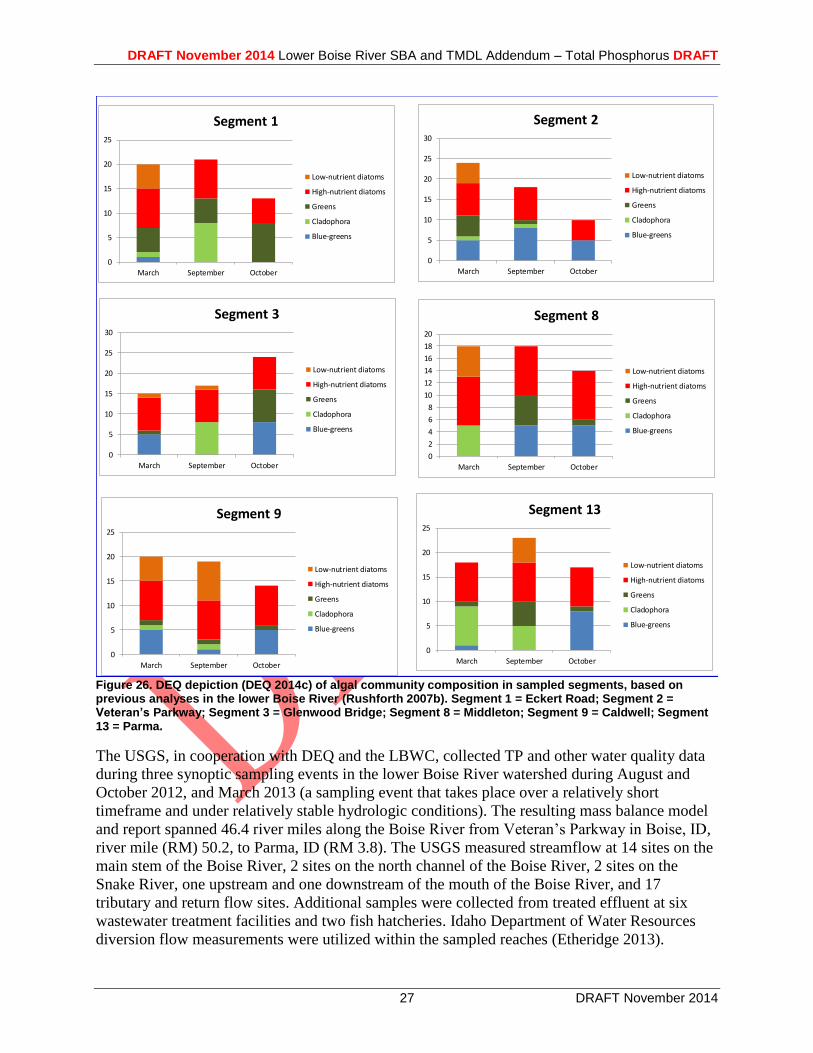
DRAFT November 2014 Lower Boise River SBA and TMDL Addendum – Total Phosphorus DRAFT
27 DRAFT November 2014
Figure 26. DEQ depiction (DEQ 2014c) of algal community composition in sampled segments, based on previous analyses in the lower Boise River (Rushforth 2007b). Segment 1 = Eckert Road; Segment 2 = Veteran’s Parkway; Segment 3 = Glenwood Bridge; Segment 8 = Middleton; Segment 9 = Caldwell; Segment 13 = Parma.
The USGS, in cooperation with DEQ and the LBWC, collected TP and other water quality data
during three synoptic sampling events in the lower Boise River watershed during August and
October 2012, and March 2013 (a sampling event that takes place over a relatively short
timeframe and under relatively stable hydrologic conditions). The resulting mass balance model
and report spanned 46.4 river miles along the Boise River from Veteran’s Parkway in Boise, ID,
river mile (RM) 50.2, to Parma, ID (RM 3.8). The USGS measured streamflow at 14 sites on the
main stem of the Boise River, 2 sites on the north channel of the Boise River, 2 sites on the
Snake River, one upstream and one downstream of the mouth of the Boise River, and 17
tributary and return flow sites. Additional samples were collected from treated effluent at six
wastewater treatment facilities and two fish hatcheries. Idaho Department of Water Resources
diversion flow measurements were utilized within the sampled reaches (Etheridge 2013).
0
5
10
15
20
25
March September October
Segment 13
Low-nutrient diatoms
High-nutrient diatoms
Greens
Cladophora
Blue-greens
0
5
10
15
20
25
March September October
Segment 9
Low-nutrient diatoms
High-nutrient diatoms
Greens
Cladophora
Blue-greens
0
2
4
6
8
10
12
14
16
18
20
March September October
Segment 8
Low-nutrient diatoms
High-nutrient diatoms
Greens
Cladophora
Blue-greens
0
5
10
15
20
25
30
March September October
Segment 3
Low-nutrient diatoms
High-nutrient diatoms
Greens
Cladophora
Blue-greens
0
5
10
15
20
25
30
March September October
Segment 2
Low-nutrient diatoms
High-nutrient diatoms
Greens
Cladophora
Blue-greens
0
5
10
15
20
25
March September October
Segment 1
Low-nutrient diatoms
High-nutrient diatoms
Greens
Cladophora
Blue-greens
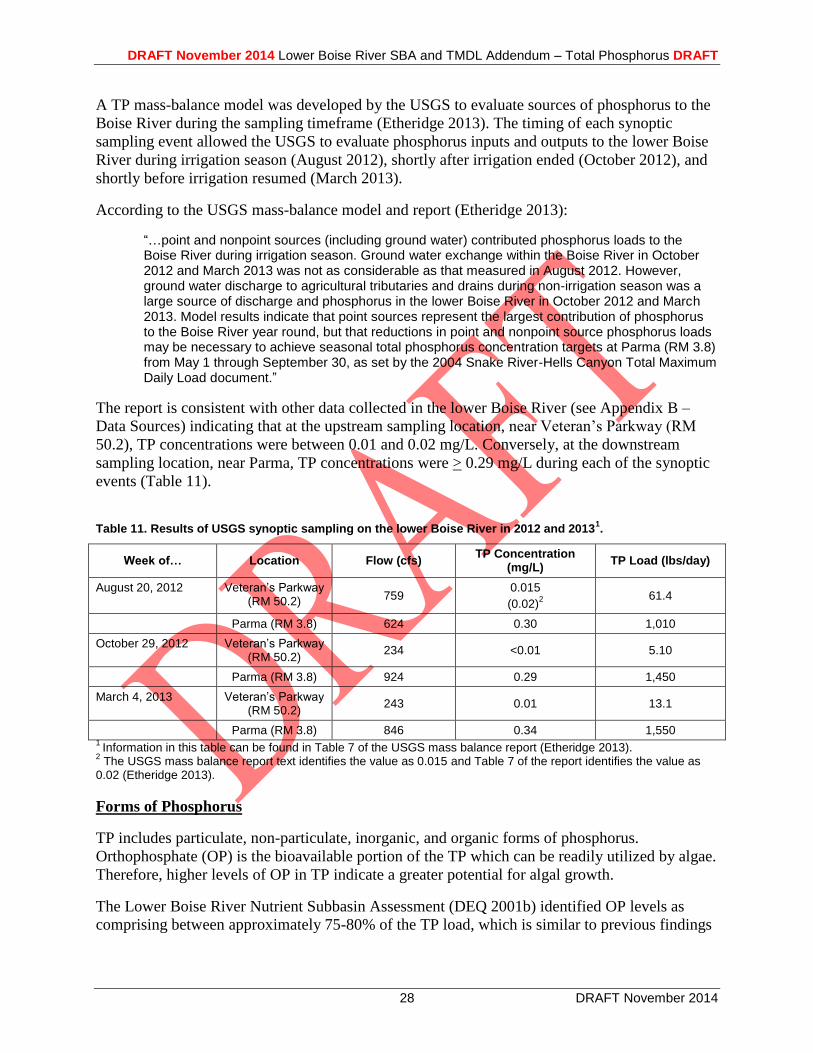
DRAFT November 2014 Lower Boise River SBA and TMDL Addendum – Total Phosphorus DRAFT
28 DRAFT November 2014
A TP mass-balance model was developed by the USGS to evaluate sources of phosphorus to the
Boise River during the sampling timeframe (Etheridge 2013). The timing of each synoptic
sampling event allowed the USGS to evaluate phosphorus inputs and outputs to the lower Boise
River during irrigation season (August 2012), shortly after irrigation ended (October 2012), and
shortly before irrigation resumed (March 2013).
According to the USGS mass-balance model and report (Etheridge 2013):
“…point and nonpoint sources (including ground water) contributed phosphorus loads to the Boise River during irrigation season. Ground water exchange within the Boise River in October 2012 and March 2013 was not as considerable as that measured in August 2012. However, ground water discharge to agricultural tributaries and drains during non-irrigation season was a large source of discharge and phosphorus in the lower Boise River in October 2012 and March 2013. Model results indicate that point sources represent the largest contribution of phosphorus to the Boise River year round, but that reductions in point and nonpoint source phosphorus loads may be necessary to achieve seasonal total phosphorus concentration targets at Parma (RM 3.8) from May 1 through September 30, as set by the 2004 Snake River-Hells Canyon Total Maximum Daily Load document.”
The report is consistent with other data collected in the lower Boise River (see Appendix B –
Data Sources) indicating that at the upstream sampling location, near Veteran’s Parkway (RM
50.2), TP concentrations were between 0.01 and 0.02 mg/L. Conversely, at the downstream
sampling location, near Parma, TP concentrations were > 0.29 mg/L during each of the synoptic
events (Table 11).
Table 11. Results of USGS synoptic sampling on the lower Boise River in 2012 and 2013
1.
Week of… Location Flow (cfs) TP Concentration
(mg/L) TP Load (lbs/day)
August 20, 2012 Veteran’s Parkway (RM 50.2) 759
0.015
(0.02)2 61.4
Parma (RM 3.8) 624 0.30 1,010
October 29, 2012 Veteran’s Parkway (RM 50.2)
234 <0.01 5.10
Parma (RM 3.8) 924 0.29 1,450
March 4, 2013 Veteran’s Parkway (RM 50.2)
243 0.01 13.1
Parma (RM 3.8) 846 0.34 1,550 1
Information in this table can be found in Table 7 of the USGS mass balance report (Etheridge 2013). 2 The USGS mass balance report text identifies the value as 0.015 and Table 7 of the report identifies the value as
0.02 (Etheridge 2013).
Forms of Phosphorus
TP includes particulate, non-particulate, inorganic, and organic forms of phosphorus.
Orthophosphate (OP) is the bioavailable portion of the TP which can be readily utilized by algae.
Therefore, higher levels of OP in TP indicate a greater potential for algal growth.
The Lower Boise River Nutrient Subbasin Assessment (DEQ 2001b) identified OP levels as
comprising between approximately 75-80% of the TP load, which is similar to previous findings
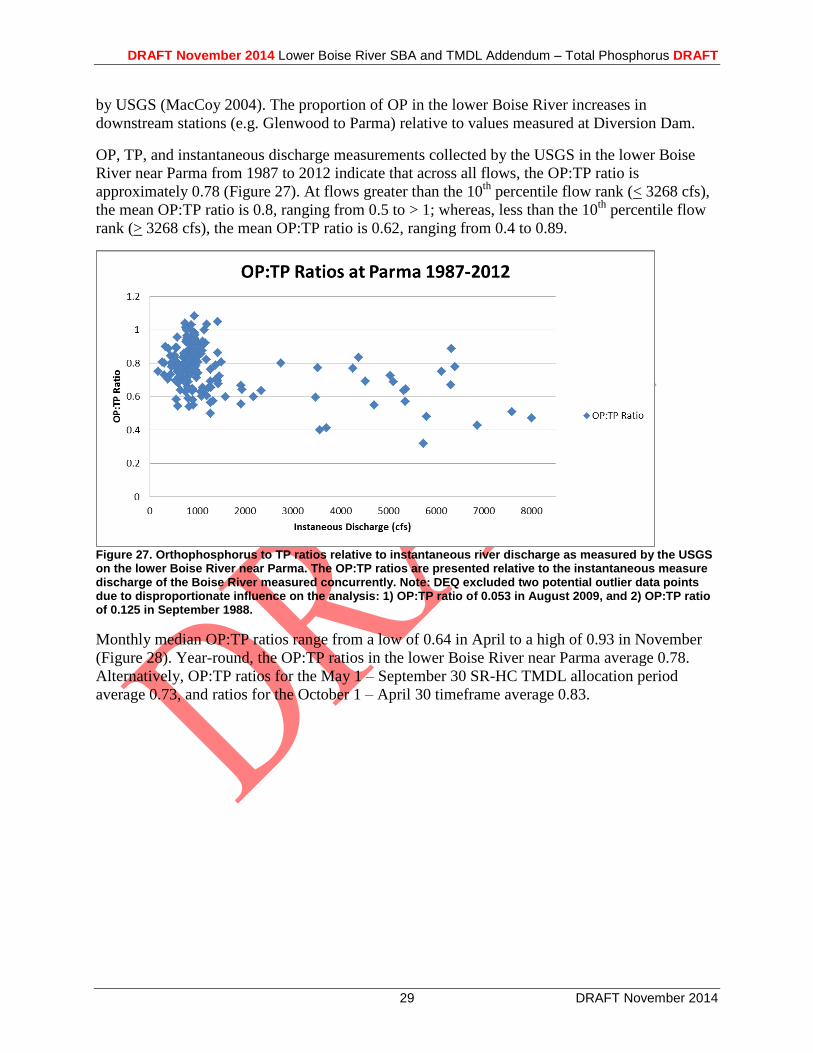
DRAFT November 2014 Lower Boise River SBA and TMDL Addendum – Total Phosphorus DRAFT
29 DRAFT November 2014
by USGS (MacCoy 2004). The proportion of OP in the lower Boise River increases in
downstream stations (e.g. Glenwood to Parma) relative to values measured at Diversion Dam.
OP, TP, and instantaneous discharge measurements collected by the USGS in the lower Boise
River near Parma from 1987 to 2012 indicate that across all flows, the OP:TP ratio is
approximately 0.78 (Figure 27). At flows greater than the 10th
percentile flow rank (< 3268 cfs),
the mean OP:TP ratio is 0.8, ranging from 0.5 to > 1; whereas, less than the 10th
percentile flow
rank (> 3268 cfs), the mean OP:TP ratio is 0.62, ranging from 0.4 to 0.89.
Figure 27. Orthophosphorus to TP ratios relative to instantaneous river discharge as measured by the USGS on the lower Boise River near Parma. The OP:TP ratios are presented relative to the instantaneous measure discharge of the Boise River measured concurrently. Note: DEQ excluded two potential outlier data points due to disproportionate influence on the analysis: 1) OP:TP ratio of 0.053 in August 2009, and 2) OP:TP ratio of 0.125 in September 1988.
Monthly median OP:TP ratios range from a low of 0.64 in April to a high of 0.93 in November
(Figure 28). Year-round, the OP:TP ratios in the lower Boise River near Parma average 0.78.
Alternatively, OP:TP ratios for the May 1 – September 30 SR-HC TMDL allocation period
average 0.73, and ratios for the October 1 – April 30 timeframe average 0.83.
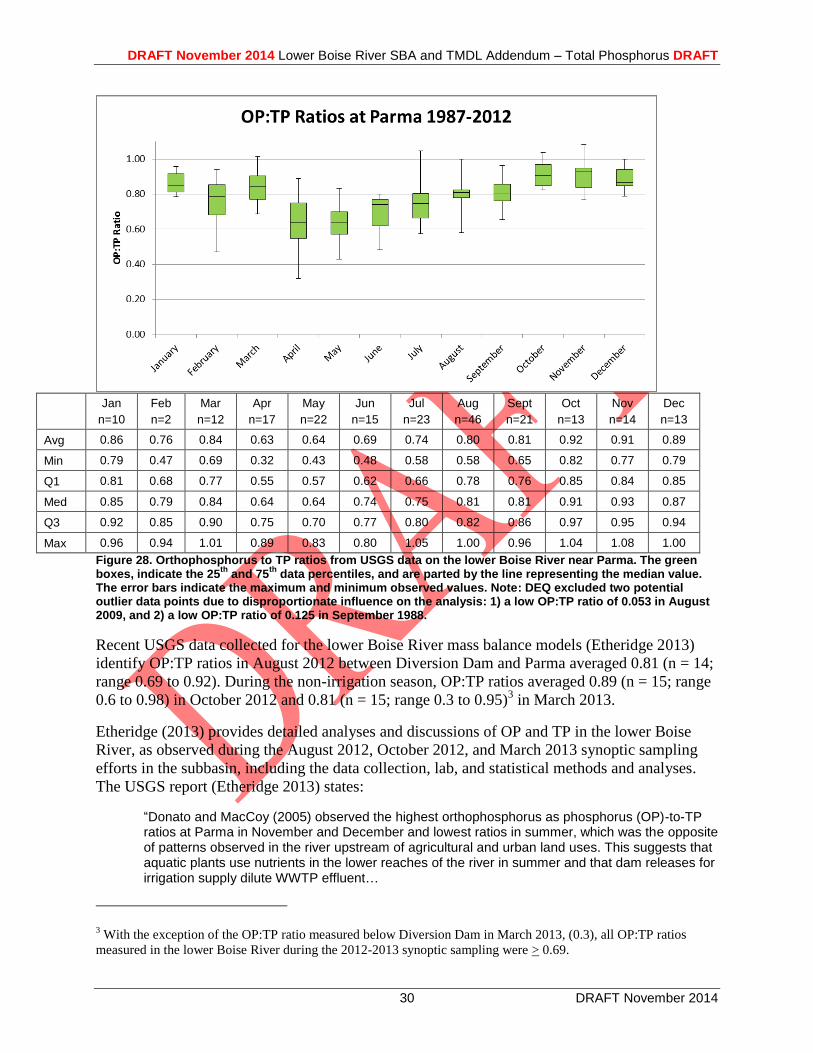
DRAFT November 2014 Lower Boise River SBA and TMDL Addendum – Total Phosphorus DRAFT
30 DRAFT November 2014
Jan
n=10
Feb
n=2
Mar
n=12
Apr
n=17
May
n=22
Jun
n=15
Jul
n=23
Aug
n=46
Sept
n=21
Oct
n=13
Nov
n=14
Dec
n=13
Avg 0.86 0.76 0.84 0.63 0.64 0.69 0.74 0.80 0.81 0.92 0.91 0.89
Min 0.79 0.47 0.69 0.32 0.43 0.48 0.58 0.58 0.65 0.82 0.77 0.79
Q1 0.81 0.68 0.77 0.55 0.57 0.62 0.66 0.78 0.76 0.85 0.84 0.85
Med 0.85 0.79 0.84 0.64 0.64 0.74 0.75 0.81 0.81 0.91 0.93 0.87
Q3 0.92 0.85 0.90 0.75 0.70 0.77 0.80 0.82 0.86 0.97 0.95 0.94
Max 0.96 0.94 1.01 0.89 0.83 0.80 1.05 1.00 0.96 1.04 1.08 1.00
Figure 28. Orthophosphorus to TP ratios from USGS data on the lower Boise River near Parma. The green boxes, indicate the 25
th and 75
th data percentiles, and are parted by the line representing the median value.
The error bars indicate the maximum and minimum observed values. Note: DEQ excluded two potential outlier data points due to disproportionate influence on the analysis: 1) a low OP:TP ratio of 0.053 in August 2009, and 2) a low OP:TP ratio of 0.125 in September 1988.
Recent USGS data collected for the lower Boise River mass balance models (Etheridge 2013)
identify OP:TP ratios in August 2012 between Diversion Dam and Parma averaged 0.81 (n = 14;
range 0.69 to 0.92). During the non-irrigation season, OP:TP ratios averaged 0.89 (n = 15; range
0.6 to 0.98) in October 2012 and 0.81 (n = 15; range 0.3 to 0.95)3 in March 2013.
Etheridge (2013) provides detailed analyses and discussions of OP and TP in the lower Boise
River, as observed during the August 2012, October 2012, and March 2013 synoptic sampling
efforts in the subbasin, including the data collection, lab, and statistical methods and analyses.
The USGS report (Etheridge 2013) states:
“Donato and MacCoy (2005) observed the highest orthophosphorus as phosphorus (OP)-to-TP ratios at Parma in November and December and lowest ratios in summer, which was the opposite of patterns observed in the river upstream of agricultural and urban land uses. This suggests that aquatic plants use nutrients in the lower reaches of the river in summer and that dam releases for irrigation supply dilute WWTP effluent…
3 With the exception of the OP:TP ratio measured below Diversion Dam in March 2013, (0.3), all OP:TP ratios
measured in the lower Boise River during the 2012-2013 synoptic sampling were > 0.69.
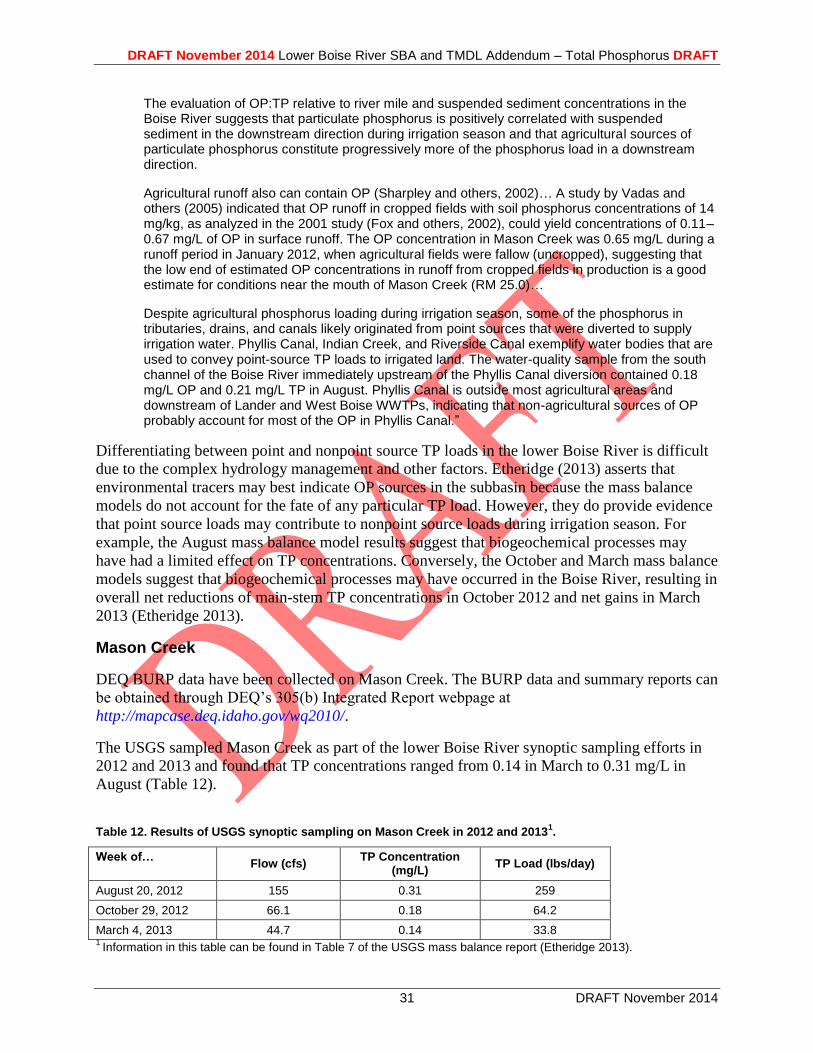
DRAFT November 2014 Lower Boise River SBA and TMDL Addendum – Total Phosphorus DRAFT
31 DRAFT November 2014
The evaluation of OP:TP relative to river mile and suspended sediment concentrations in the Boise River suggests that particulate phosphorus is positively correlated with suspended sediment in the downstream direction during irrigation season and that agricultural sources of particulate phosphorus constitute progressively more of the phosphorus load in a downstream direction.
Agricultural runoff also can contain OP (Sharpley and others, 2002)… A study by Vadas and others (2005) indicated that OP runoff in cropped fields with soil phosphorus concentrations of 14 mg/kg, as analyzed in the 2001 study (Fox and others, 2002), could yield concentrations of 0.11–0.67 mg/L of OP in surface runoff. The OP concentration in Mason Creek was 0.65 mg/L during a runoff period in January 2012, when agricultural fields were fallow (uncropped), suggesting that the low end of estimated OP concentrations in runoff from cropped fields in production is a good estimate for conditions near the mouth of Mason Creek (RM 25.0)…
Despite agricultural phosphorus loading during irrigation season, some of the phosphorus in tributaries, drains, and canals likely originated from point sources that were diverted to supply irrigation water. Phyllis Canal, Indian Creek, and Riverside Canal exemplify water bodies that are used to convey point-source TP loads to irrigated land. The water-quality sample from the south channel of the Boise River immediately upstream of the Phyllis Canal diversion contained 0.18 mg/L OP and 0.21 mg/L TP in August. Phyllis Canal is outside most agricultural areas and downstream of Lander and West Boise WWTPs, indicating that non-agricultural sources of OP probably account for most of the OP in Phyllis Canal.”
Differentiating between point and nonpoint source TP loads in the lower Boise River is difficult
due to the complex hydrology management and other factors. Etheridge (2013) asserts that
environmental tracers may best indicate OP sources in the subbasin because the mass balance
models do not account for the fate of any particular TP load. However, they do provide evidence
that point source loads may contribute to nonpoint source loads during irrigation season. For
example, the August mass balance model results suggest that biogeochemical processes may
have had a limited effect on TP concentrations. Conversely, the October and March mass balance
models suggest that biogeochemical processes may have occurred in the Boise River, resulting in
overall net reductions of main-stem TP concentrations in October 2012 and net gains in March
2013 (Etheridge 2013).
Mason Creek
DEQ BURP data have been collected on Mason Creek. The BURP data and summary reports can
be obtained through DEQ’s 305(b) Integrated Report webpage at
http://mapcase.deq.idaho.gov/wq2010/.
The USGS sampled Mason Creek as part of the lower Boise River synoptic sampling efforts in
2012 and 2013 and found that TP concentrations ranged from 0.14 in March to 0.31 mg/L in
August (Table 12).
Table 12. Results of USGS synoptic sampling on Mason Creek in 2012 and 2013
1.
Week of… Flow (cfs)
TP Concentration (mg/L)
TP Load (lbs/day)
August 20, 2012 155 0.31 259
October 29, 2012 66.1 0.18 64.2
March 4, 2013 44.7 0.14 33.8 1
Information in this table can be found in Table 7 of the USGS mass balance report (Etheridge 2013).
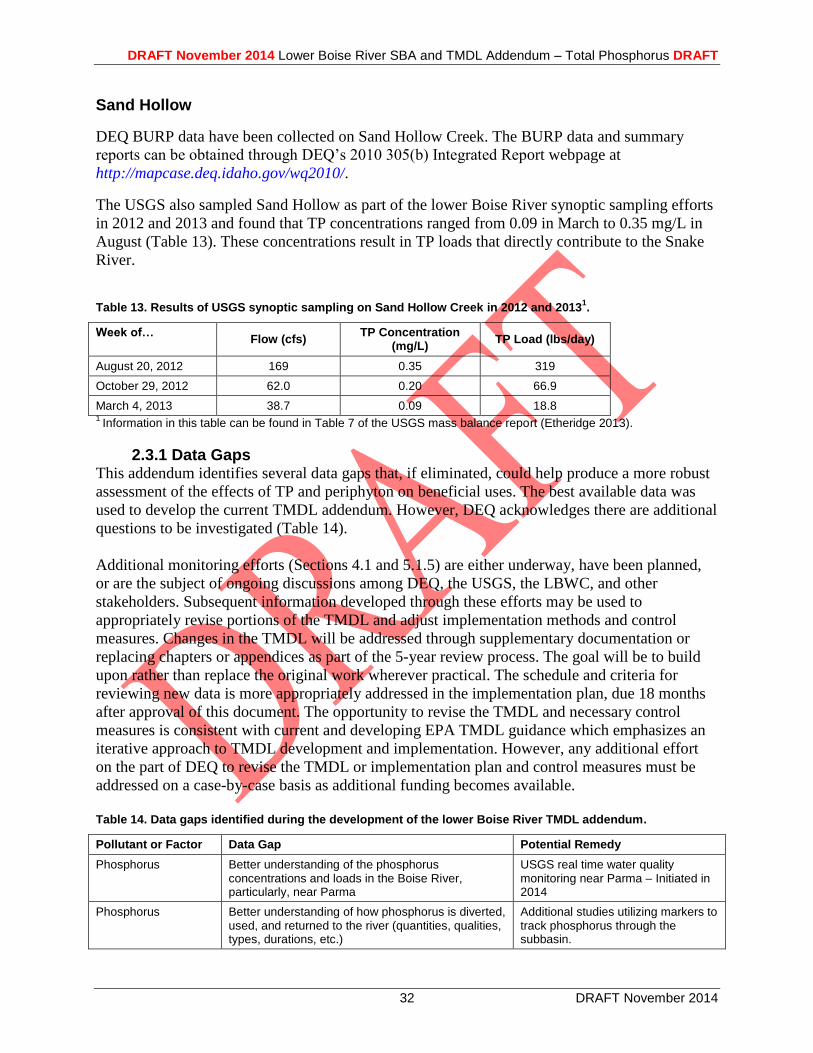
DRAFT November 2014 Lower Boise River SBA and TMDL Addendum – Total Phosphorus DRAFT
32 DRAFT November 2014
Sand Hollow
DEQ BURP data have been collected on Sand Hollow Creek. The BURP data and summary
reports can be obtained through DEQ’s 2010 305(b) Integrated Report webpage at
http://mapcase.deq.idaho.gov/wq2010/.
The USGS also sampled Sand Hollow as part of the lower Boise River synoptic sampling efforts
in 2012 and 2013 and found that TP concentrations ranged from 0.09 in March to 0.35 mg/L in
August (Table 13). These concentrations result in TP loads that directly contribute to the Snake
River.
Table 13. Results of USGS synoptic sampling on Sand Hollow Creek in 2012 and 2013
1.
Week of… Flow (cfs)
TP Concentration (mg/L)
TP Load (lbs/day)
August 20, 2012 169 0.35 319
October 29, 2012 62.0 0.20 66.9
March 4, 2013 38.7 0.09 18.8 1
Information in this table can be found in Table 7 of the USGS mass balance report (Etheridge 2013).
2.3.1 Data Gaps This addendum identifies several data gaps that, if eliminated, could help produce a more robust
assessment of the effects of TP and periphyton on beneficial uses. The best available data was
used to develop the current TMDL addendum. However, DEQ acknowledges there are additional
questions to be investigated (Table 14).
Additional monitoring efforts (Sections 4.1 and 5.1.5) are either underway, have been planned,
or are the subject of ongoing discussions among DEQ, the USGS, the LBWC, and other
stakeholders. Subsequent information developed through these efforts may be used to
appropriately revise portions of the TMDL and adjust implementation methods and control
measures. Changes in the TMDL will be addressed through supplementary documentation or
replacing chapters or appendices as part of the 5-year review process. The goal will be to build
upon rather than replace the original work wherever practical. The schedule and criteria for
reviewing new data is more appropriately addressed in the implementation plan, due 18 months
after approval of this document. The opportunity to revise the TMDL and necessary control
measures is consistent with current and developing EPA TMDL guidance which emphasizes an
iterative approach to TMDL development and implementation. However, any additional effort
on the part of DEQ to revise the TMDL or implementation plan and control measures must be
addressed on a case-by-case basis as additional funding becomes available.
Table 14. Data gaps identified during the development of the lower Boise River TMDL addendum.
Pollutant or Factor Data Gap Potential Remedy
Phosphorus Better understanding of the phosphorus concentrations and loads in the Boise River, particularly, near Parma
USGS real time water quality monitoring near Parma – Initiated in 2014
Phosphorus Better understanding of how phosphorus is diverted, used, and returned to the river (quantities, qualities, types, durations, etc.)
Additional studies utilizing markers to track phosphorus through the subbasin.
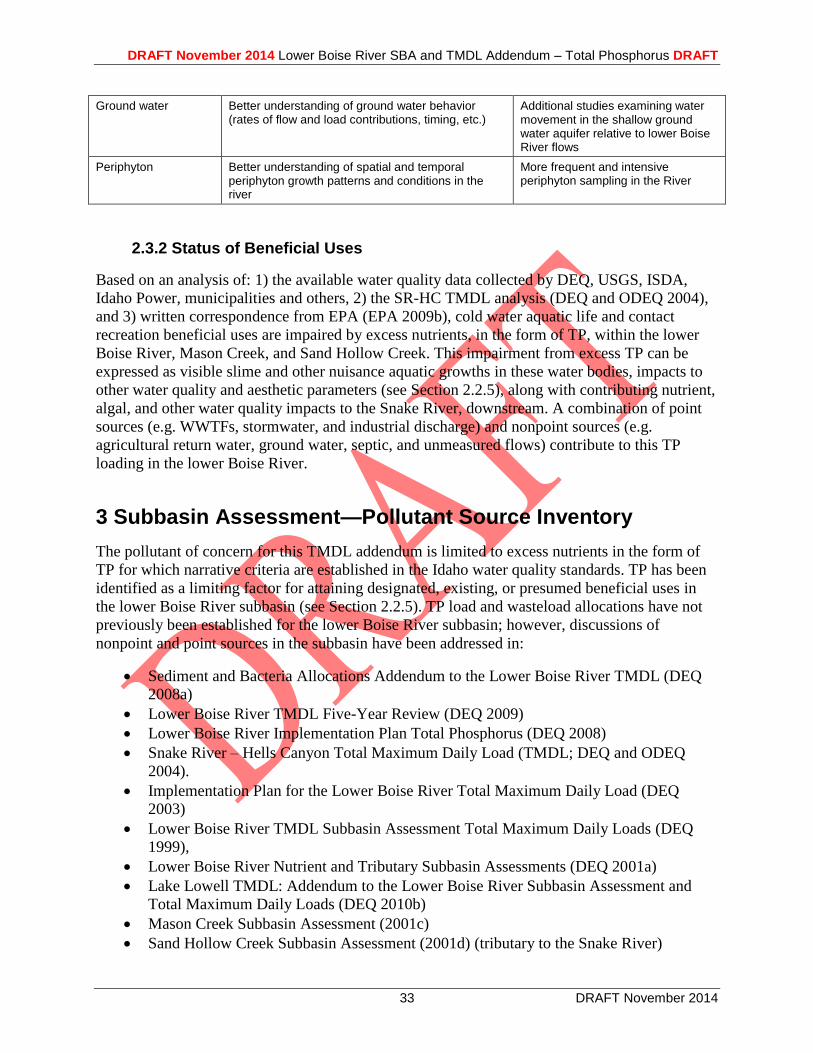
DRAFT November 2014 Lower Boise River SBA and TMDL Addendum – Total Phosphorus DRAFT
33 DRAFT November 2014
Ground water Better understanding of ground water behavior (rates of flow and load contributions, timing, etc.)
Additional studies examining water movement in the shallow ground water aquifer relative to lower Boise River flows
Periphyton Better understanding of spatial and temporal periphyton growth patterns and conditions in the river
More frequent and intensive periphyton sampling in the River
2.3.2 Status of Beneficial Uses
Based on an analysis of: 1) the available water quality data collected by DEQ, USGS, ISDA,
Idaho Power, municipalities and others, 2) the SR-HC TMDL analysis (DEQ and ODEQ 2004),
and 3) written correspondence from EPA (EPA 2009b), cold water aquatic life and contact
recreation beneficial uses are impaired by excess nutrients, in the form of TP, within the lower
Boise River, Mason Creek, and Sand Hollow Creek. This impairment from excess TP can be
expressed as visible slime and other nuisance aquatic growths in these water bodies, impacts to
other water quality and aesthetic parameters (see Section 2.2.5), along with contributing nutrient,
algal, and other water quality impacts to the Snake River, downstream. A combination of point
sources (e.g. WWTFs, stormwater, and industrial discharge) and nonpoint sources (e.g.
agricultural return water, ground water, septic, and unmeasured flows) contribute to this TP
loading in the lower Boise River.
3 Subbasin Assessment—Pollutant Source Inventory
The pollutant of concern for this TMDL addendum is limited to excess nutrients in the form of
TP for which narrative criteria are established in the Idaho water quality standards. TP has been
identified as a limiting factor for attaining designated, existing, or presumed beneficial uses in
the lower Boise River subbasin (see Section 2.2.5). TP load and wasteload allocations have not
previously been established for the lower Boise River subbasin; however, discussions of
nonpoint and point sources in the subbasin have been addressed in:
Sediment and Bacteria Allocations Addendum to the Lower Boise River TMDL (DEQ
2008a)
Lower Boise River TMDL Five-Year Review (DEQ 2009)
Lower Boise River Implementation Plan Total Phosphorus (DEQ 2008)
Snake River – Hells Canyon Total Maximum Daily Load (TMDL; DEQ and ODEQ
2004).
Implementation Plan for the Lower Boise River Total Maximum Daily Load (DEQ
2003)
Lower Boise River TMDL Subbasin Assessment Total Maximum Daily Loads (DEQ
1999),
Lower Boise River Nutrient and Tributary Subbasin Assessments (DEQ 2001a)
Lake Lowell TMDL: Addendum to the Lower Boise River Subbasin Assessment and
Total Maximum Daily Loads (DEQ 2010b)
Mason Creek Subbasin Assessment (2001c)
Sand Hollow Creek Subbasin Assessment (2001d) (tributary to the Snake River)
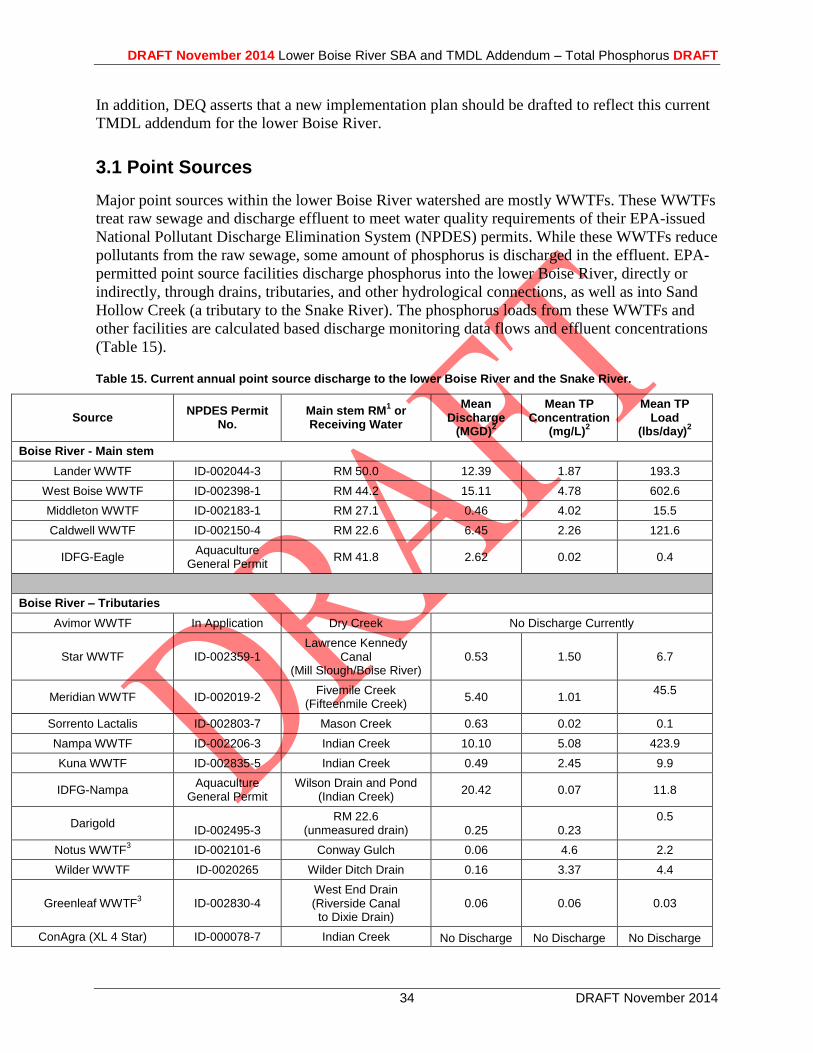
DRAFT November 2014 Lower Boise River SBA and TMDL Addendum – Total Phosphorus DRAFT
34 DRAFT November 2014
In addition, DEQ asserts that a new implementation plan should be drafted to reflect this current
TMDL addendum for the lower Boise River.
3.1 Point Sources
Major point sources within the lower Boise River watershed are mostly WWTFs. These WWTFs
treat raw sewage and discharge effluent to meet water quality requirements of their EPA-issued
National Pollutant Discharge Elimination System (NPDES) permits. While these WWTFs reduce
pollutants from the raw sewage, some amount of phosphorus is discharged in the effluent. EPA-
permitted point source facilities discharge phosphorus into the lower Boise River, directly or
indirectly, through drains, tributaries, and other hydrological connections, as well as into Sand
Hollow Creek (a tributary to the Snake River). The phosphorus loads from these WWTFs and
other facilities are calculated based discharge monitoring data flows and effluent concentrations
(Table 15).
Table 15. Current annual point source discharge to the lower Boise River and the Snake River.
Source NPDES Permit
No. Main stem RM
1 or
Receiving Water
Mean Discharge
(MGD)2
Mean TP Concentration
(mg/L)2
Mean TP Load
(lbs/day)2
Boise River - Main stem
Lander WWTF ID-002044-3 RM 50.0 12.39 1.87 193.3
West Boise WWTF ID-002398-1 RM 44.2 15.11 4.78 602.6
Middleton WWTF ID-002183-1 RM 27.1 0.46 4.02 15.5
Caldwell WWTF ID-002150-4 RM 22.6 6.45 2.26 121.6
IDFG-Eagle Aquaculture
General Permit RM 41.8 2.62 0.02 0.4
Boise River – Tributaries
Avimor WWTF In Application Dry Creek No Discharge Currently
Star WWTF ID-002359-1 Lawrence Kennedy
Canal (Mill Slough/Boise River)
0.53 1.50 6.7
Meridian WWTF ID-002019-2 Fivemile Creek
(Fifteenmile Creek) 5.40 1.01
45.5
Sorrento Lactalis ID-002803-7 Mason Creek 0.63 0.02 0.1
Nampa WWTF ID-002206-3 Indian Creek 10.10 5.08 423.9
Kuna WWTF ID-002835-5 Indian Creek 0.49 2.45 9.9
IDFG-Nampa Aquaculture
General Permit Wilson Drain and Pond
(Indian Creek) 20.42 0.07 11.8
Darigold ID-002495-3
RM 22.6 (unmeasured drain) 0.25 0.23
0.5
Notus WWTF3
ID-002101-6 Conway Gulch 0.06 4.6 2.2
Wilder WWTF ID-0020265 Wilder Ditch Drain 0.16 3.37 4.4
Greenleaf WWTF3
ID-002830-4 West End Drain (Riverside Canal to Dixie Drain)
0.06 0.06 0.03
ConAgra (XL 4 Star)
ID-000078-7 Indian Creek No Discharge No Discharge No Discharge
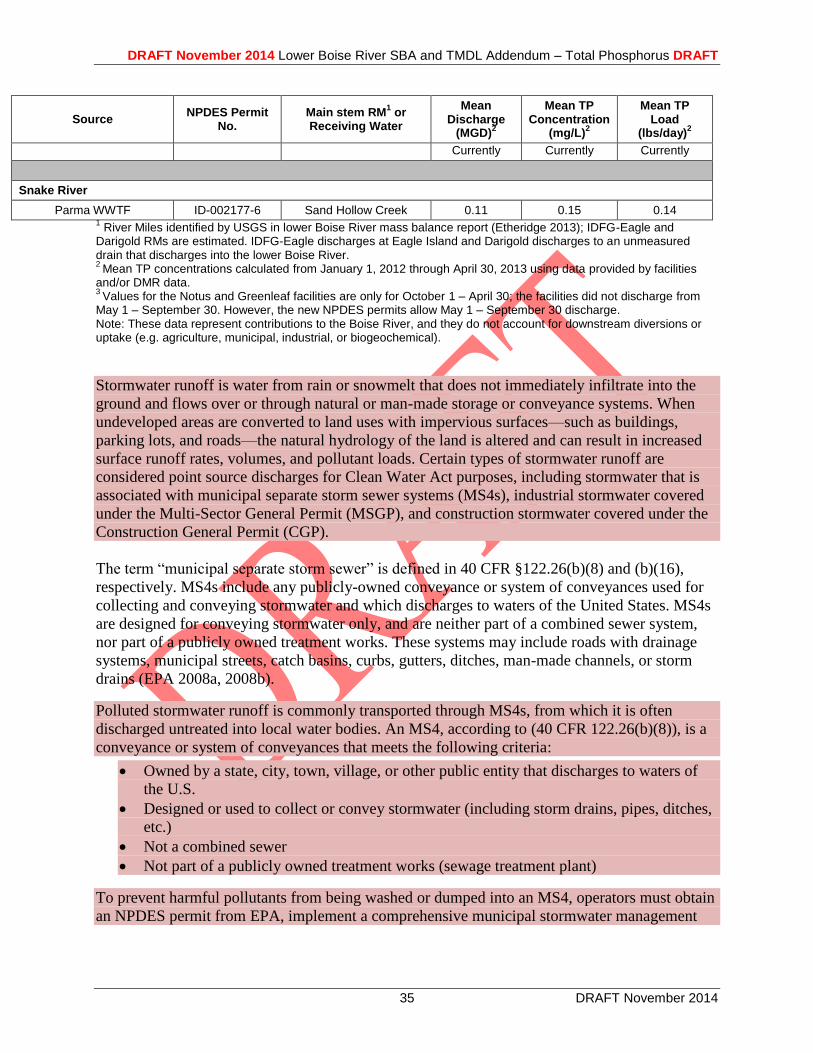
DRAFT November 2014 Lower Boise River SBA and TMDL Addendum – Total Phosphorus DRAFT
35 DRAFT November 2014
Source NPDES Permit
No. Main stem RM
1 or
Receiving Water
Mean Discharge
(MGD)2
Mean TP Concentration
(mg/L)2
Mean TP Load
(lbs/day)2
Currently Currently Currently
Snake River
Parma WWTF ID-002177-6 Sand Hollow Creek 0.11 0.15 0.14 1 River Miles identified by USGS in lower Boise River mass balance report (Etheridge 2013); IDFG-Eagle and
Darigold RMs are estimated. IDFG-Eagle discharges at Eagle Island and Darigold discharges to an unmeasured drain that discharges into the lower Boise River. 2
Mean TP concentrations calculated from January 1, 2012 through April 30, 2013 using data provided by facilities and/or DMR data. 3
Values for the Notus and Greenleaf facilities are only for October 1 – April 30; the facilities did not discharge from May 1 – September 30. However, the new NPDES permits allow May 1 – September 30 discharge. Note: These data represent contributions to the Boise River, and they do not account for downstream diversions or uptake (e.g. agriculture, municipal, industrial, or biogeochemical).
Stormwater runoff is water from rain or snowmelt that does not immediately infiltrate into the
ground and flows over or through natural or man-made storage or conveyance systems. When
undeveloped areas are converted to land uses with impervious surfaces—such as buildings,
parking lots, and roads—the natural hydrology of the land is altered and can result in increased
surface runoff rates, volumes, and pollutant loads. Certain types of stormwater runoff are
considered point source discharges for Clean Water Act purposes, including stormwater that is
associated with municipal separate storm sewer systems (MS4s), industrial stormwater covered
under the Multi-Sector General Permit (MSGP), and construction stormwater covered under the
Construction General Permit (CGP).
The term “municipal separate storm sewer” is defined in 40 CFR §122.26(b)(8) and (b)(16),
respectively. MS4s include any publicly-owned conveyance or system of conveyances used for
collecting and conveying stormwater and which discharges to waters of the United States. MS4s
are designed for conveying stormwater only, and are neither part of a combined sewer system,
nor part of a publicly owned treatment works. These systems may include roads with drainage
systems, municipal streets, catch basins, curbs, gutters, ditches, man-made channels, or storm
drains (EPA 2008a, 2008b).
Polluted stormwater runoff is commonly transported through MS4s, from which it is often
discharged untreated into local water bodies. An MS4, according to (40 CFR 122.26(b)(8)), is a
conveyance or system of conveyances that meets the following criteria:
Owned by a state, city, town, village, or other public entity that discharges to waters of
the U.S.
Designed or used to collect or convey stormwater (including storm drains, pipes, ditches,
etc.)
Not a combined sewer
Not part of a publicly owned treatment works (sewage treatment plant)
To prevent harmful pollutants from being washed or dumped into an MS4, operators must obtain
an NPDES permit from EPA, implement a comprehensive municipal stormwater management
DRAFT November 2014 Lower Boise River SBA and TMDL Addendum – Total Phosphorus DRAFT
36 DRAFT November 2014
program (SWMP), and use best management practices (BMPs) to control pollutants in
stormwater discharges to the maximum extent practicable.
There are several EPA stormwater permittees that discharge phosphorus into the lower Boise
River, directly or indirectly, through drains, tributaries, and other hydrological connections
(Table 16). Several agencies and organizations share responsibilities for the NPDES MS4
permits. Information and reporting include a five-year report which is available from the
partnership internet site: http://www.partnersforcleanwater.org/default.asp.
An annual report is published and made available through ACHD’s web site:
http://www.achd.ada.id.us/Departments/TechServices/Drainage.aspx.
Other agencies and stakeholders in the subbasin are in the process of applying for stormwater
NPDES permits and have yet to develop or implement the voluntary stormwater activities.
Stormwater within the lower Boise River watershed is regulated under either a Phase I or a Phase
II NPDES Permit issued by EPA. Permitted stormwater entities are considered point sources and
will be assigned “wasteload allocations”.
Stormwater management areas for lower Boise River watershed area have been updated based on
2010 census (US Census Bureau) and current GIS mapping information. The MS4s addressed in
this TMDL addendum are located within 2010 urbanized areas and city boundaries (incorporated
areas) of Ada and Canyon County based on available GIS information (Figure 29 and Figure 30).
Cities in urbanized areas include Boise, Eagle, Meridian, Middleton, Nampa, and Caldwell.
Within the urbanized areas are also unincorporated areas of Ada County and Canyon County.
Additionally, there are areas in each county that are incorporated, but not included in the
permitted urbanized areas. These areas included the Ada County cities of Kuna and Star, and
Canyon County cities of Greenleaf, Notus, Parma,and Wilder.
Table 17 includes a breakdown of permitted and non-permitted areas based on:
City limits data from 7/29/14 (Ada County Assessor) and 5/28/14 (Canyon County
Assessor);
Urbanized Area based on 2010 Census;
Area data from NPDES Permit Factsheets (2000 Census);
Impervious areas for each of the cities are located in Table 18. The impervious data includes
roads, buildings, and parking lots and was developed as part of the Treasure Valley Urban Tree
Canopy project funded by a grant from the U.S Forest Service (2011 NAIP-UTC Canopy
Assessment-PlanItGeo).
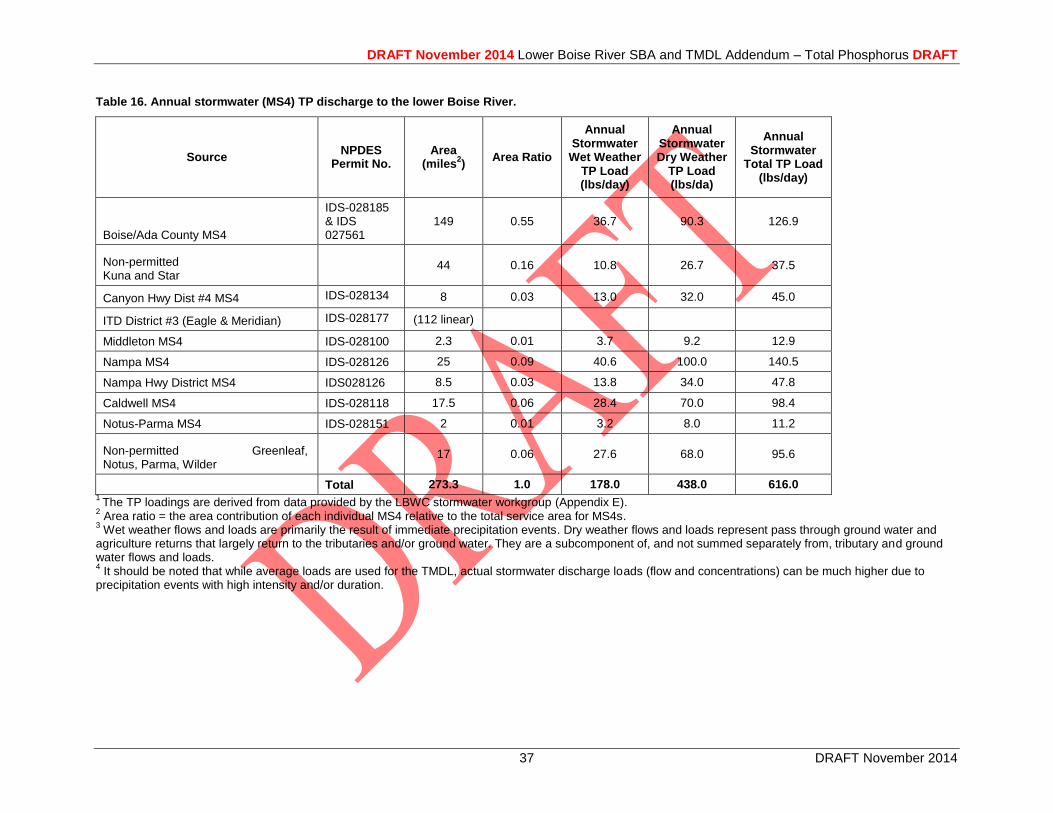
DRAFT November 2014 Lower Boise River SBA and TMDL Addendum – Total Phosphorus DRAFT
37 DRAFT November 2014
Table 16. Annual stormwater (MS4) TP discharge to the lower Boise River.
Source NPDES
Permit No. Area
(miles2)
Area Ratio
Annual Stormwater
Wet Weather TP Load (lbs/day)
Annual Stormwater Dry Weather
TP Load (lbs/da)
Annual Stormwater
Total TP Load (lbs/day)
Boise/Ada County MS4
IDS-028185 & IDS 027561
149 0.55 36.7 90.3 126.9
Non-permitted Kuna and Star
44 0.16 10.8 26.7 37.5
Canyon Hwy Dist #4 MS4 IDS-028134 8 0.03 13.0 32.0 45.0
ITD District #3 (Eagle & Meridian) IDS-028177 (112 linear)
Middleton MS4 IDS-028100 2.3 0.01 3.7 9.2 12.9
Nampa MS4 IDS-028126 25 0.09 40.6 100.0 140.5
Nampa Hwy District MS4 IDS028126 8.5 0.03 13.8 34.0 47.8
Caldwell MS4 IDS-028118 17.5 0.06 28.4 70.0 98.4
Notus-Parma MS4 IDS-028151 2 0.01 3.2 8.0 11.2
Non-permitted Greenleaf, Notus, Parma, Wilder
17 0.06 27.6 68.0 95.6
Total 273.3 1.0 178.0 438.0 616.0 1
The TP loadings are derived from data provided by the LBWC stormwater workgroup (Appendix E). 2 Area ratio = the area contribution of each individual MS4 relative to the total service area for MS4s.
3 Wet weather flows and loads are primarily the result of immediate precipitation events. Dry weather flows and loads represent pass through ground water and
agriculture returns that largely return to the tributaries and/or ground water. They are a subcomponent of, and not summed separately from, tributary and ground water flows and loads. 4 It should be noted that while average loads are used for the TMDL, actual stormwater discharge loads (flow and concentrations) can be much higher due to
precipitation events with high intensity and/or duration.
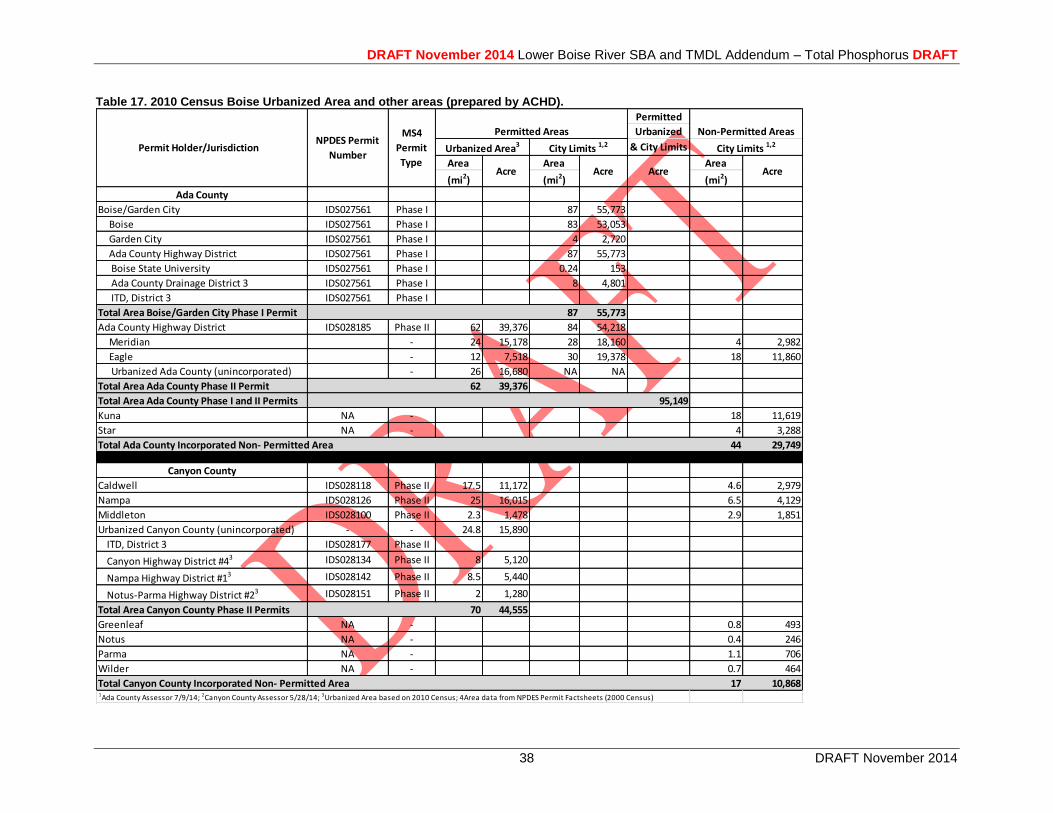
DRAFT November 2014 Lower Boise River SBA and TMDL Addendum – Total Phosphorus DRAFT
38 DRAFT November 2014
Table 17. 2010 Census Boise Urbanized Area and other areas (prepared by ACHD).
Permitted
Urbanized
& City Limits
Area Area Area
(mi2) (mi2) (mi2)
Ada County
Boise/Garden City IDS027561 Phase I 87 55,773
Boise IDS027561 Phase I 83 53,053
Garden City IDS027561 Phase I 4 2,720
Ada County Highway District IDS027561 Phase I 87 55,773
Boise State University IDS027561 Phase I 0.24 153
Ada County Drainage District 3 IDS027561 Phase I 8 4,801
ITD, District 3 IDS027561 Phase I
Total Area Boise/Garden City Phase I Permit 87 55,773
Ada County Highway District IDS028185 Phase II 62 39,376 84 54,218
Meridian - 24 15,178 28 18,160 4 2,982
Eagle - 12 7,518 30 19,378 18 11,860
Urbanized Ada County (unincorporated) - 26 16,680 NA NA
Total Area Ada County Phase II Permit 62 39,376
Total Area Ada County Phase I and II Permits 95,149
Kuna NA - 18 11,619
Star NA - 4 3,288
44 29,749
Canyon County
Caldwell IDS028118 Phase II 17.5 11,172 4.6 2,979
Nampa IDS028126 Phase II 25 16,015 6.5 4,129
Middleton IDS028100 Phase II 2.3 1,478 2.9 1,851
Urbanized Canyon County (unincorporated) - - 24.8 15,890
ITD, District 3 IDS028177 Phase II
Canyon Highway District #43 IDS028134 Phase II 8 5,120
Nampa Highway District #13 IDS028142 Phase II 8.5 5,440
Notus-Parma Highway District #23 IDS028151 Phase II 2 1,280
Total Area Canyon County Phase II Permits 70 44,555
Greenleaf NA - 0.8 493
Notus NA - 0.4 246
Parma NA - 1.1 706
Wilder NA - 0.7 464
17 10,868 1Ada County Assessor 7/9/14; 2Canyon County Assessor 5/28/14; 3Urbanized Area based on 2010 Census; 4Area data from NPDES Permit Factsheets (2000 Census)
MS4
Permit
Type
Permitted Areas Non-Permitted Areas
Acre
City Limits 1,2
Acre
Total Canyon County Incorporated Non- Permitted Area
Total Ada County Incorporated Non- Permitted Area
Urbanized Area3 City Limits 1,2
Acre Acre
Permit Holder/Jurisdiction NPDES Permit
Number
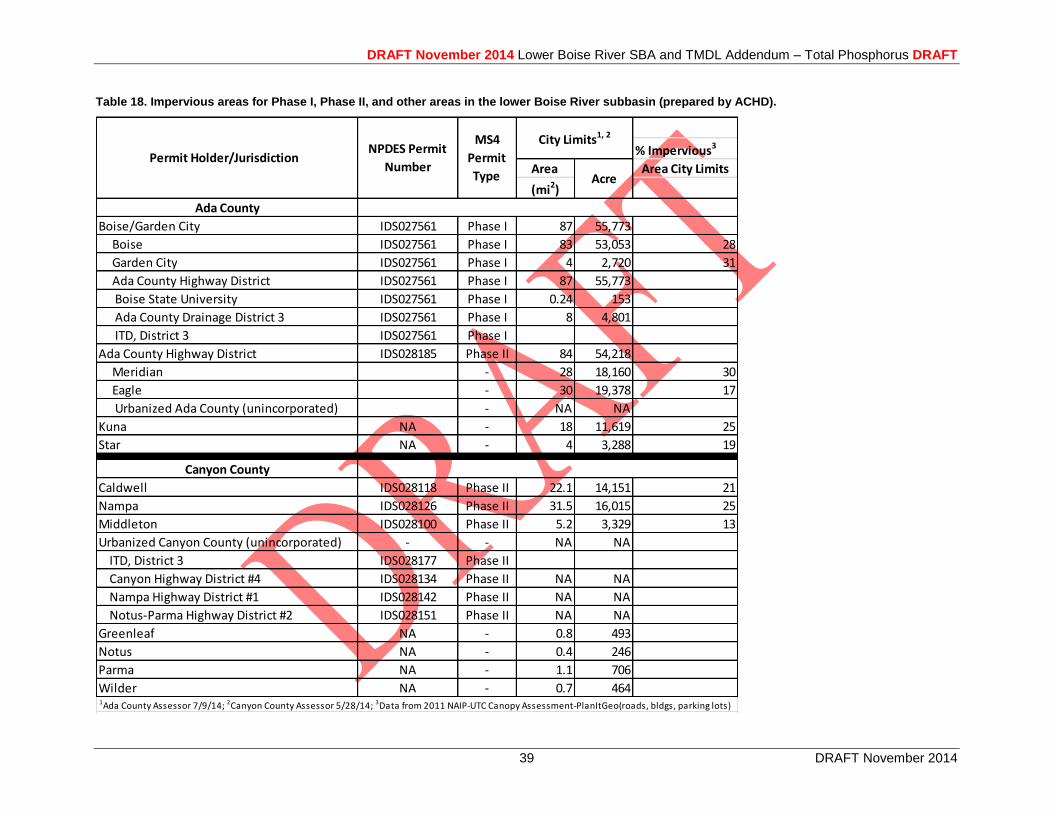
DRAFT November 2014 Lower Boise River SBA and TMDL Addendum – Total Phosphorus DRAFT
39 DRAFT November 2014
Table 18. Impervious areas for Phase I, Phase II, and other areas in the lower Boise River subbasin (prepared by ACHD).
% Impervious3
Area Area City Limits
(mi2)
Ada County
Boise/Garden City IDS027561 Phase I 87 55,773
Boise IDS027561 Phase I 83 53,053 28
Garden City IDS027561 Phase I 4 2,720 31
Ada County Highway District IDS027561 Phase I 87 55,773
Boise State University IDS027561 Phase I 0.24 153
Ada County Drainage District 3 IDS027561 Phase I 8 4,801
ITD, District 3 IDS027561 Phase I
Ada County Highway District IDS028185 Phase II 84 54,218
Meridian - 28 18,160 30
Eagle - 30 19,378 17
Urbanized Ada County (unincorporated) - NA NA
Kuna NA - 18 11,619 25
Star NA - 4 3,288 19
Canyon County
Caldwell IDS028118 Phase II 22.1 14,151 21
Nampa IDS028126 Phase II 31.5 16,015 25
Middleton IDS028100 Phase II 5.2 3,329 13
Urbanized Canyon County (unincorporated) - - NA NA
ITD, District 3 IDS028177 Phase II
Canyon Highway District #4 IDS028134 Phase II NA NA
Nampa Highway District #1 IDS028142 Phase II NA NA
Notus-Parma Highway District #2 IDS028151 Phase II NA NA
Greenleaf NA - 0.8 493
Notus NA - 0.4 246
Parma NA - 1.1 706
Wilder NA - 0.7 464 1Ada County Assessor 7/9/14; 2Canyon County Assessor 5/28/14; 3Data from 2011 NAIP-UTC Canopy Assessment-PlanItGeo(roads, bldgs, parking lots)
City Limits1, 2
Acre
Permit Holder/Jurisdiction NPDES Permit
Number
MS4
Permit
Type

DRAFT November 2014 Lower Boise River SBA and TMDL Addendum – Total Phosphorus DRAFT
40 DRAFT November 2014
Figure 29. Map of Ada County stormwater management areas (prepared by ACHD).
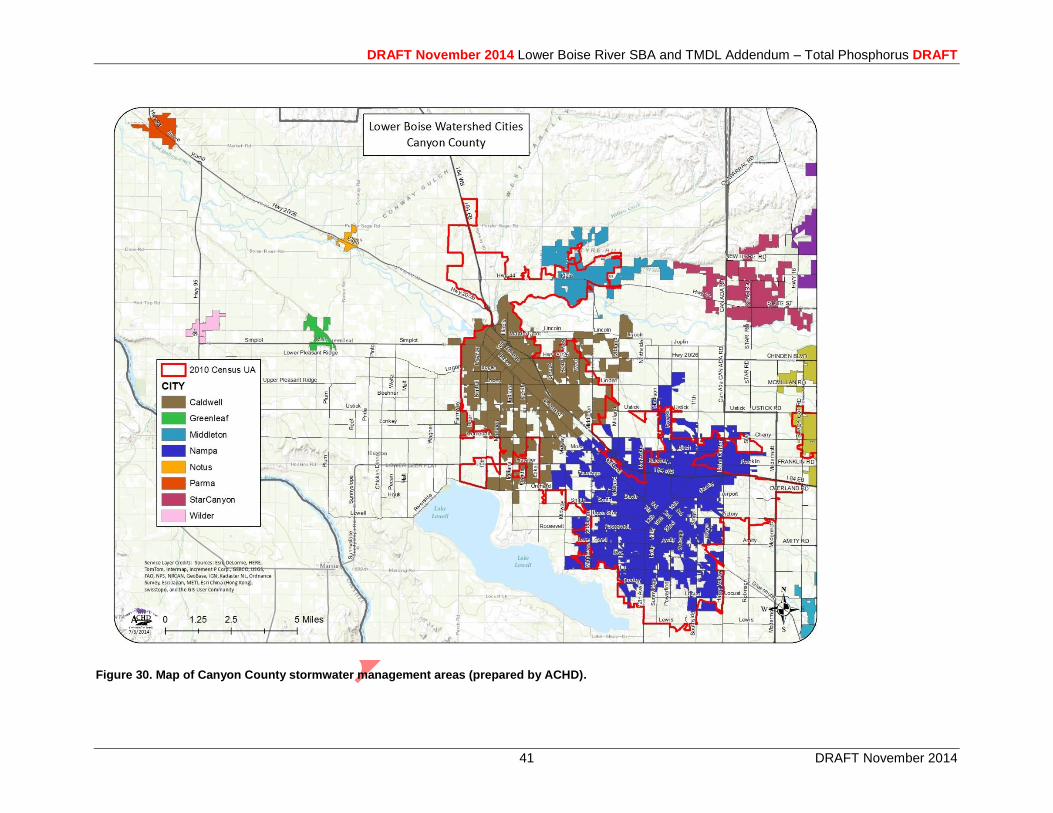
DRAFT November 2014 Lower Boise River SBA and TMDL Addendum – Total Phosphorus DRAFT
41 DRAFT November 2014
Figure 30. Map of Canyon County stormwater management areas (prepared by ACHD).
DRAFT November 2014 Lower Boise River SBA and TMDL Addendum – Total Phosphorus DRAFT
42 DRAFT November 2014
Industrial Stormwater Requirements
Stormwater runoff picks up industrial pollutants and typically discharges them into nearby water
bodies directly or indirectly via storm sewer systems. When facility practices allow exposure of
industrial materials to stormwater, runoff from industrial areas can contain toxic pollutants
(e.g., heavy metals and organic chemicals) and other pollutants such as trash, debris, and oil and
grease. This increased flow and pollutant load can impair water bodies, degrade biological
habitats, pollute drinking water sources, and cause flooding and hydrologic changes, such as
channel erosion, to the receiving water body.
Multi-Sector General Permit and Stormwater Pollution Prevention Plans
In Idaho, if an industrial facility discharges industrial stormwater into waters of the U.S., the
facility must be permitted under EPA’s most recent MSGP. To obtain an MSGP, the facility
must prepare a stormwater pollution prevention plan (SWPPP) before submitting a notice of
intent for permit coverage. The SWPPP must document the site description, design, and
installation of control measures; describe monitoring procedures; and summarize potential
pollutant sources. A copy of the SWPPP must be kept on site in a format that is accessible to
workers and inspectors and be updated to reflect changes in site conditions, personnel, and
stormwater infrastructure.
Industrial Facilities Discharging to Impaired Water Bodies
Any facility that discharges to an impaired water body must monitor all pollutants for which the
water body is impaired and for which a standard analytical method exists (see 40 CFR Part 136).
Also, because different industrial activities have sector-specific types of material that may be
exposed to stormwater, EPA grouped the different regulated industries into 29 sectors, based on
their typical activities. Part 8 of EPA’s MSGP details the stormwater management practices and
monitoring that are required for the different industrial sectors. DEQ anticipates including
specific requirements for impaired waters as a condition of the 401 certification. The new MSGP
will detail the specific monitoring requirements.
TMDL Industrial Stormwater Requirements
When a stream is on Idaho’s §303(d) list and has a TMDL developed, DEQ may incorporate a
wasteload allocation for industrial stormwater activities under the MSGP. However, most load
analyses developed in the past have not identified sector-specific numeric wasteload allocations
for industrial stormwater activities. Industrial stormwater activities are considered in compliance
with provisions of the TMDL if operators obtain an MSGP under the NPDES program and
implement the appropriate BMPs. Typically, operators must also follow specific requirements to
be consistent with any local pollutant allocations. The next MSGP will have specific monitoring
requirements that must be followed.
DEQ expects permittees to conduct any required monitoring under the permit and that BMPs
appropriate to the site are applied and maintained to prevent water quality impairment. Table 19
identifies the list active MSGP permits.
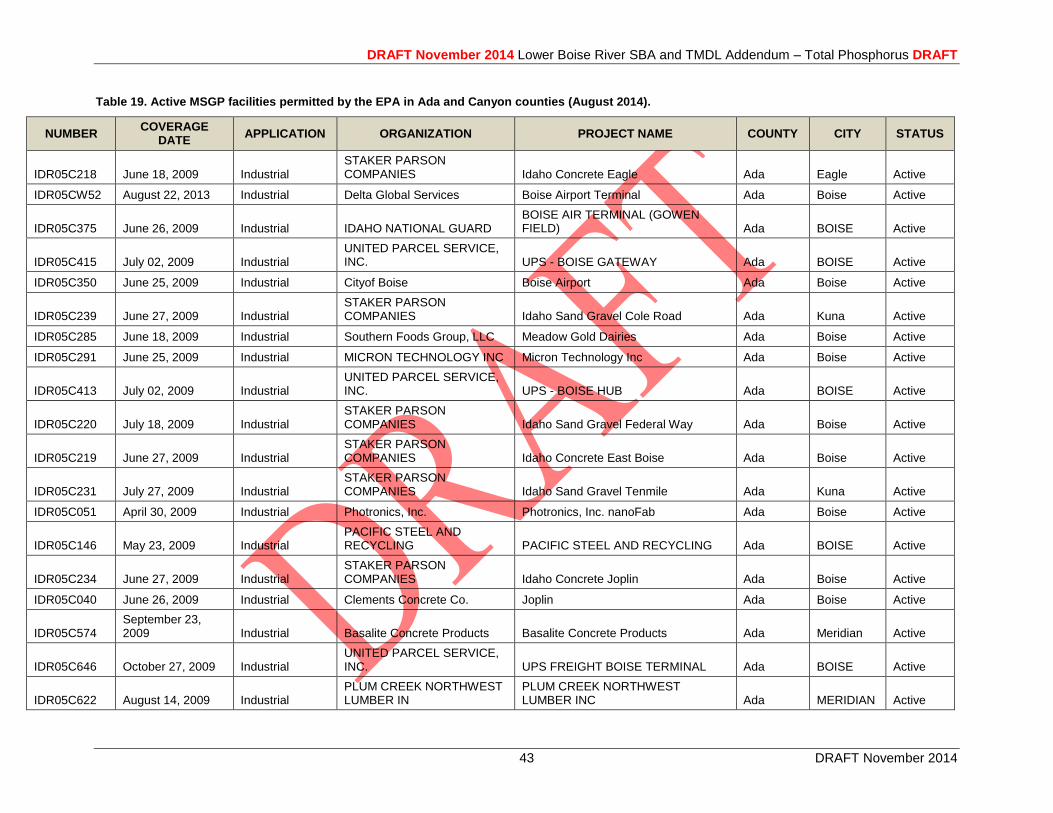
DRAFT November 2014 Lower Boise River SBA and TMDL Addendum – Total Phosphorus DRAFT
43 DRAFT November 2014
Table 19. Active MSGP facilities permitted by the EPA in Ada and Canyon counties (August 2014).
NUMBER COVERAGE
DATE APPLICATION ORGANIZATION PROJECT NAME COUNTY CITY STATUS
IDR05C218 June 18, 2009 Industrial STAKER PARSON COMPANIES Idaho Concrete Eagle Ada Eagle Active
IDR05CW52 August 22, 2013 Industrial Delta Global Services Boise Airport Terminal Ada Boise Active
IDR05C375 June 26, 2009 Industrial IDAHO NATIONAL GUARD BOISE AIR TERMINAL (GOWEN FIELD) Ada BOISE Active
IDR05C415 July 02, 2009 Industrial UNITED PARCEL SERVICE, INC. UPS - BOISE GATEWAY Ada BOISE Active
IDR05C350 June 25, 2009 Industrial Cityof Boise Boise Airport Ada Boise Active
IDR05C239 June 27, 2009 Industrial STAKER PARSON COMPANIES Idaho Sand Gravel Cole Road Ada Kuna Active
IDR05C285 June 18, 2009 Industrial Southern Foods Group, LLC Meadow Gold Dairies Ada Boise Active
IDR05C291 June 25, 2009 Industrial MICRON TECHNOLOGY INC Micron Technology Inc Ada Boise Active
IDR05C413 July 02, 2009 Industrial UNITED PARCEL SERVICE, INC. UPS - BOISE HUB Ada BOISE Active
IDR05C220 July 18, 2009 Industrial STAKER PARSON COMPANIES Idaho Sand Gravel Federal Way Ada Boise Active
IDR05C219 June 27, 2009 Industrial STAKER PARSON COMPANIES Idaho Concrete East Boise Ada Boise Active
IDR05C231 July 27, 2009 Industrial STAKER PARSON COMPANIES Idaho Sand Gravel Tenmile Ada Kuna Active
IDR05C051 April 30, 2009 Industrial Photronics, Inc. Photronics, Inc. nanoFab Ada Boise Active
IDR05C146 May 23, 2009 Industrial PACIFIC STEEL AND RECYCLING PACIFIC STEEL AND RECYCLING Ada BOISE Active
IDR05C234 June 27, 2009 Industrial STAKER PARSON COMPANIES Idaho Concrete Joplin Ada Boise Active
IDR05C040 June 26, 2009 Industrial Clements Concrete Co. Joplin Ada Boise Active
IDR05C574 September 23, 2009 Industrial Basalite Concrete Products Basalite Concrete Products Ada Meridian Active
IDR05C646 October 27, 2009 Industrial UNITED PARCEL SERVICE, INC. UPS FREIGHT BOISE TERMINAL Ada BOISE Active
IDR05C622 August 14, 2009 Industrial PLUM CREEK NORTHWEST LUMBER IN
PLUM CREEK NORTHWEST LUMBER INC Ada MERIDIAN Active
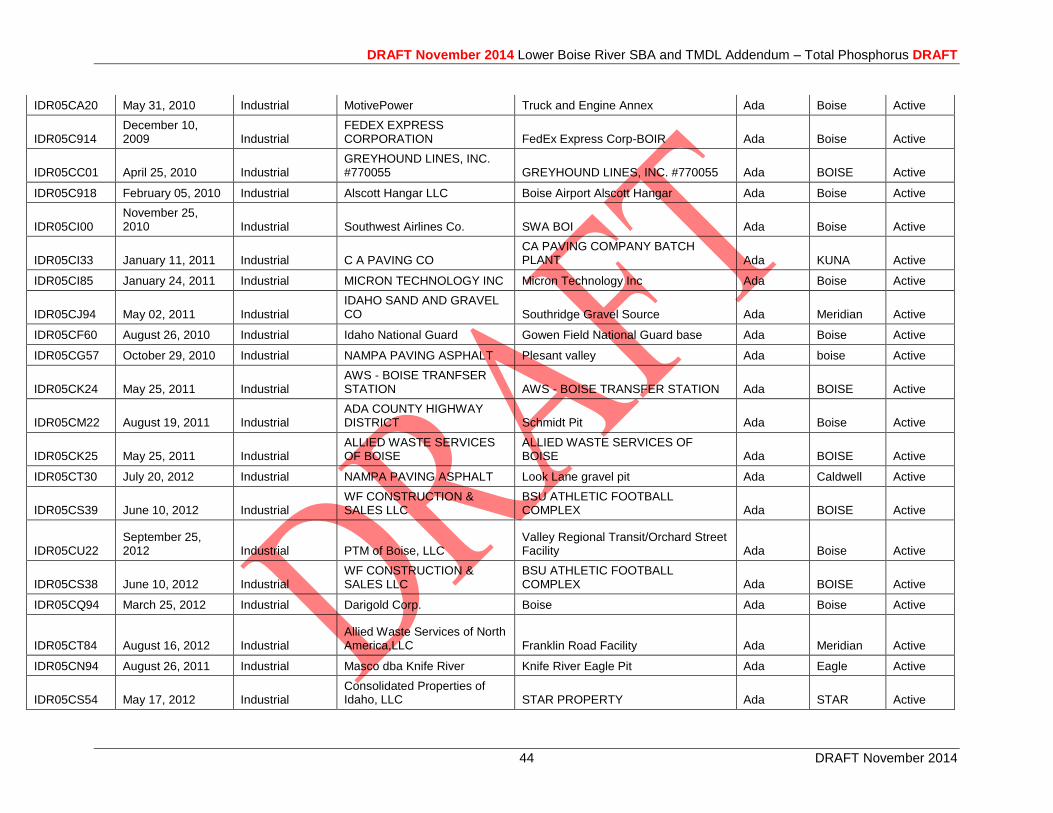
DRAFT November 2014 Lower Boise River SBA and TMDL Addendum – Total Phosphorus DRAFT
44 DRAFT November 2014
IDR05CA20 May 31, 2010 Industrial MotivePower Truck and Engine Annex Ada Boise Active
IDR05C914 December 10, 2009 Industrial
FEDEX EXPRESS CORPORATION FedEx Express Corp-BOIR Ada Boise Active
IDR05CC01 April 25, 2010 Industrial GREYHOUND LINES, INC. #770055 GREYHOUND LINES, INC. #770055 Ada BOISE Active
IDR05C918 February 05, 2010 Industrial Alscott Hangar LLC Boise Airport Alscott Hangar Ada Boise Active
IDR05CI00 November 25, 2010 Industrial Southwest Airlines Co. SWA BOI Ada Boise Active
IDR05CI33 January 11, 2011 Industrial C A PAVING CO CA PAVING COMPANY BATCH PLANT Ada KUNA Active
IDR05CI85 January 24, 2011 Industrial MICRON TECHNOLOGY INC Micron Technology Inc Ada Boise Active
IDR05CJ94 May 02, 2011 Industrial IDAHO SAND AND GRAVEL CO Southridge Gravel Source Ada Meridian Active
IDR05CF60 August 26, 2010 Industrial Idaho National Guard Gowen Field National Guard base Ada Boise Active
IDR05CG57 October 29, 2010 Industrial NAMPA PAVING ASPHALT Plesant valley Ada boise Active
IDR05CK24 May 25, 2011 Industrial AWS - BOISE TRANFSER STATION AWS - BOISE TRANSFER STATION Ada BOISE Active
IDR05CM22 August 19, 2011 Industrial ADA COUNTY HIGHWAY DISTRICT Schmidt Pit Ada Boise Active
IDR05CK25 May 25, 2011 Industrial ALLIED WASTE SERVICES OF BOISE
ALLIED WASTE SERVICES OF BOISE Ada BOISE Active
IDR05CT30 July 20, 2012 Industrial NAMPA PAVING ASPHALT Look Lane gravel pit Ada Caldwell Active
IDR05CS39 June 10, 2012 Industrial WF CONSTRUCTION & SALES LLC
BSU ATHLETIC FOOTBALL COMPLEX Ada BOISE Active
IDR05CU22 September 25, 2012 Industrial PTM of Boise, LLC
Valley Regional Transit/Orchard Street Facility Ada Boise Active
IDR05CS38 June 10, 2012 Industrial WF CONSTRUCTION & SALES LLC
BSU ATHLETIC FOOTBALL COMPLEX Ada BOISE Active
IDR05CQ94 March 25, 2012 Industrial Darigold Corp. Boise Ada Boise Active
IDR05CT84 August 16, 2012 Industrial Allied Waste Services of North America,LLC Franklin Road Facility Ada Meridian Active
IDR05CN94 August 26, 2011 Industrial Masco dba Knife River Knife River Eagle Pit Ada Eagle Active
IDR05CS54 May 17, 2012 Industrial Consolidated Properties of Idaho, LLC STAR PROPERTY Ada STAR Active
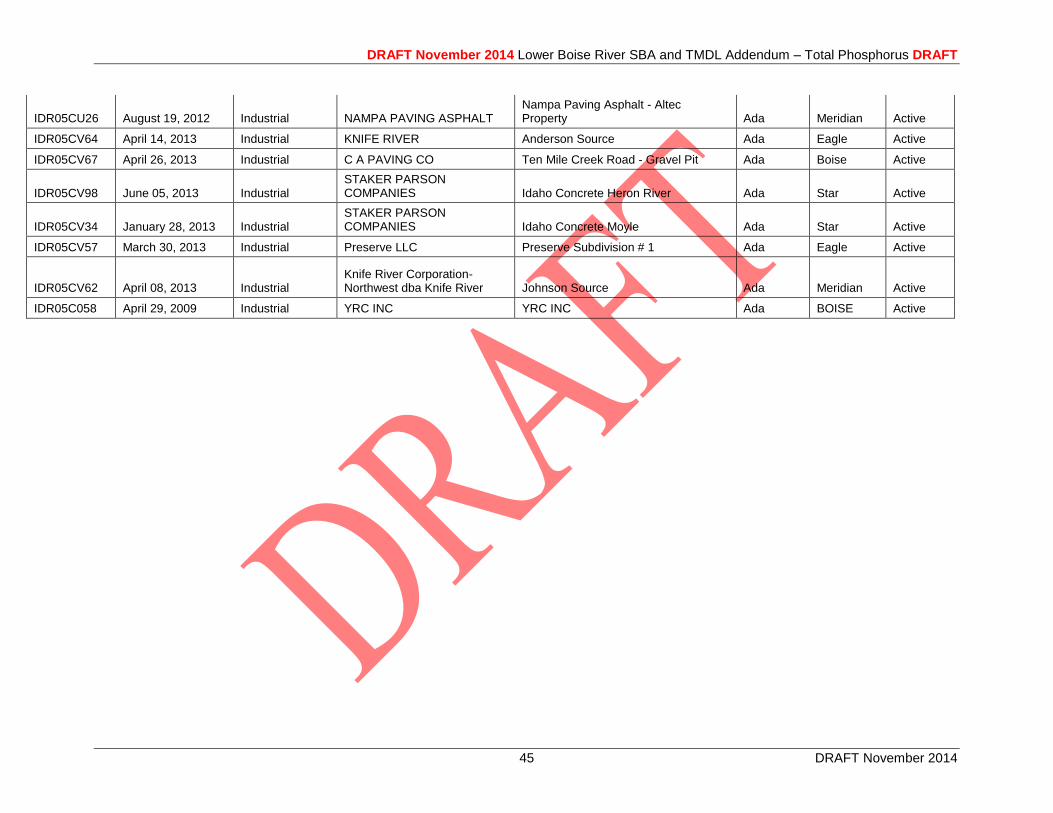
DRAFT November 2014 Lower Boise River SBA and TMDL Addendum – Total Phosphorus DRAFT
45 DRAFT November 2014
IDR05CU26 August 19, 2012 Industrial NAMPA PAVING ASPHALT Nampa Paving Asphalt - Altec Property Ada Meridian Active
IDR05CV64 April 14, 2013 Industrial KNIFE RIVER Anderson Source Ada Eagle Active
IDR05CV67 April 26, 2013 Industrial C A PAVING CO Ten Mile Creek Road - Gravel Pit Ada Boise Active
IDR05CV98 June 05, 2013 Industrial STAKER PARSON COMPANIES Idaho Concrete Heron River Ada Star Active
IDR05CV34 January 28, 2013 Industrial STAKER PARSON COMPANIES Idaho Concrete Moyle Ada Star Active
IDR05CV57 March 30, 2013 Industrial Preserve LLC Preserve Subdivision # 1 Ada Eagle Active
IDR05CV62 April 08, 2013 Industrial Knife River Corporation-Northwest dba Knife River Johnson Source Ada Meridian Active
IDR05C058 April 29, 2009 Industrial YRC INC YRC INC Ada BOISE Active
DRAFT November 2014 Lower Boise River SBA and TMDL Addendum – Total Phosphorus DRAFT
46 DRAFT November 2014
Construction Stormwater
The CWA requires operators of construction sites to obtain permit coverage to discharge
stormwater to a water body or municipal storm sewer. In Idaho, EPA has issued a general permit
for stormwater discharges from construction sites.
Construction General Permit and Stormwater Pollution Prevention Plans
If a construction project disturbs more than 1 acre of land (or is part of a larger common
development that will disturb more than 1 acre), the operator is required to apply for a CGP from
EPA after developing a site-specific SWPPP. The SWPPP must provide for the erosion,
sediment, and pollution controls they intend to use; inspection of the controls periodically; and
maintenance of BMPs throughout the life of the project. Operators are required to keep a current
copy of their SWPPP on site or at an easily accessible location.
TMDL Construction Stormwater Requirements
When a stream is on Idaho’s §303(d) list and has a TMDL developed, DEQ may incorporate a
gross wasteload allocation for anticipated construction stormwater activities. Most loads
developed in the past did not have a numeric wasteload allocation for construction stormwater
activities. Construction stormwater activities are considered in compliance with provisions of the
TMDL if operators obtain a CGP under the NPDES program and implement the appropriate
BMPs. Typically, operators must also follow specific requirements to be consistent with any
local pollutant allocations. The CGP has monitoring requirements that must be followed.
Post-construction Stormwater Management
Many communities throughout Idaho are currently developing rules for post-construction
stormwater management. Sediment is usually the main pollutant of concern in construction site
stormwater. DEQ’s Catalog of Stormwater Best Management Practices for Idaho Cities and
Counties (DEQ 2005) should be used to select the proper suite of BMPs for the specific site,
soils, climate, and project phasing in order to sufficiently meet the standards and requirements of
the CGP to protect water quality. Where local ordinances have more stringent and site-specific
standards, those are applicable.
DRAFT November 2014 Lower Boise River SBA and TMDL Addendum – Total Phosphorus DRAFT
47 DRAFT November 2014
3.2 Nonpoint Sources
Although the locations of agricultural diversions, dams, drains, and return flows can sometimes
be identified as specific points on the landscape, the Clean Water Act designates these as
nonpoint sources due to the impact that widespread land use activities have on the water
channeled through agricultural irrigation systems. Septic systems, paved and unpaved road
surfaces, and other unquantified sources contribute TP, directly and indirectly, to surface water
in the lower Boise River, Mason Creek, and Sand Hollow Creek. Contributions from these
nonpoint sources are acknowledged data gaps, and implementation plans could include details
regarding future data collection from these sources.
3.2.1 Agricultural Discharges
Of the approximately 475,000 acres that drain to the lower Boise River below Diversion Dam,
approximately 162,000 of those acres are irrigated cropland (as defined by ISDA as
encompassing agricultural parcels greater than 20 acres). These acres are located along the water
conveyance system and contribute nonpoint loading of phosphorus. Within the watershed, TP is
delivered from irrigated cropland and animal-related phosphorus sources (grazing and
dairies/feedlots). For example, tributaries, including agricultural drains, and predictive ground
water contributed approximately 880 lbs/day and 562 lbs/day of TP, respectively, relative to
approximately 1,440 lbs/day attributed to point sources during the USGS August 2012 synoptic
sampling (Etheridge 2013). Although less in October 2012, TP contributions from tributaries and
ground water were approximately 483 lbs/day relative to point source contributions of
approximately 1,050 lbs/day. This was similar to March 2013, when TP contributions from
tributaries and ground water were approximately 378 lbs/day relative to point source
contributions of approximately 1,220 lbs/day. Table 20 provides estimated annual discharges and
loads to the lower Boise River from major tributaries and drains based on long-term USGS and
ISDA data.
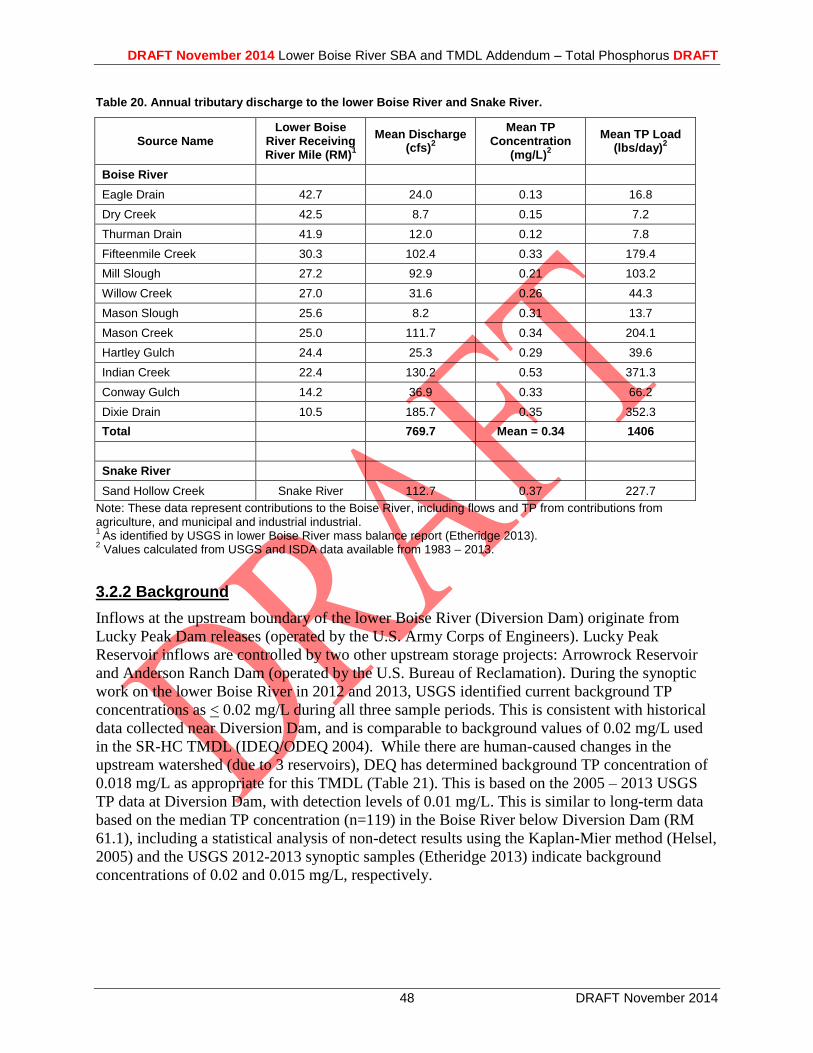
DRAFT November 2014 Lower Boise River SBA and TMDL Addendum – Total Phosphorus DRAFT
48 DRAFT November 2014
Table 20. Annual tributary discharge to the lower Boise River and Snake River.
Source Name Lower Boise
River Receiving River Mile (RM)
1
Mean Discharge (cfs)
2
Mean TP Concentration
(mg/L)2
Mean TP Load (lbs/day)
2
Boise River
Eagle Drain 42.7 24.0 0.13 16.8
Dry Creek 42.5 8.7 0.15 7.2
Thurman Drain 41.9 12.0 0.12 7.8
Fifteenmile Creek 30.3 102.4 0.33 179.4
Mill Slough 27.2 92.9 0.21 103.2
Willow Creek 27.0 31.6 0.26 44.3
Mason Slough 25.6 8.2 0.31 13.7
Mason Creek 25.0 111.7 0.34 204.1
Hartley Gulch 24.4 25.3 0.29 39.6
Indian Creek 22.4 130.2 0.53 371.3
Conway Gulch 14.2 36.9 0.33 66.2
Dixie Drain 10.5 185.7 0.35 352.3
Total 769.7 Mean = 0.34 1406
Snake River
Sand Hollow Creek Snake River 112.7 0.37 227.7
Note: These data represent contributions to the Boise River, including flows and TP from contributions from agriculture, and municipal and industrial industrial. 1
As identified by USGS in lower Boise River mass balance report (Etheridge 2013). 2 Values calculated from USGS and ISDA data available from 1983 – 2013.
3.2.2 Background
Inflows at the upstream boundary of the lower Boise River (Diversion Dam) originate from
Lucky Peak Dam releases (operated by the U.S. Army Corps of Engineers). Lucky Peak
Reservoir inflows are controlled by two other upstream storage projects: Arrowrock Reservoir
and Anderson Ranch Dam (operated by the U.S. Bureau of Reclamation). During the synoptic
work on the lower Boise River in 2012 and 2013, USGS identified current background TP
concentrations as < 0.02 mg/L during all three sample periods. This is consistent with historical
data collected near Diversion Dam, and is comparable to background values of 0.02 mg/L used
in the SR-HC TMDL (IDEQ/ODEQ 2004). While there are human-caused changes in the
upstream watershed (due to 3 reservoirs), DEQ has determined background TP concentration of
0.018 mg/L as appropriate for this TMDL (Table 21). This is based on the 2005 – 2013 USGS
TP data at Diversion Dam, with detection levels of 0.01 mg/L. This is similar to long-term data
based on the median TP concentration (n=119) in the Boise River below Diversion Dam (RM
61.1), including a statistical analysis of non-detect results using the Kaplan-Mier method (Helsel,
2005) and the USGS 2012-2013 synoptic samples (Etheridge 2013) indicate background
concentrations of 0.02 and 0.015 mg/L, respectively.
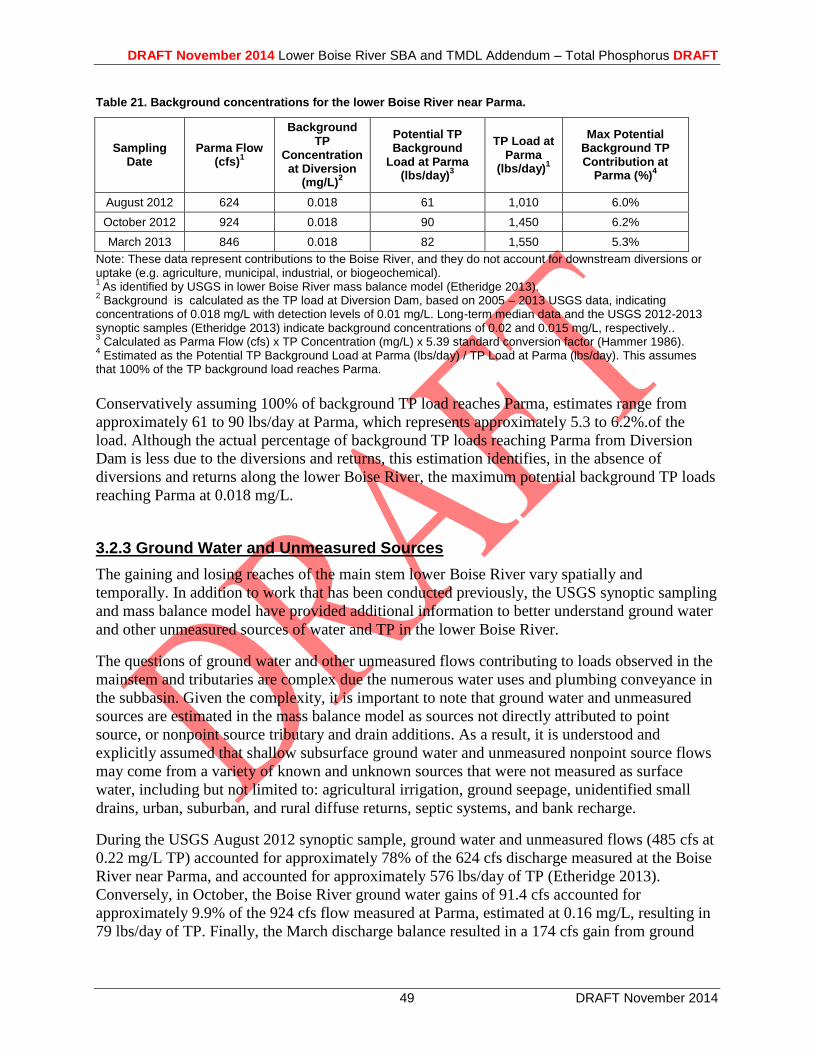
DRAFT November 2014 Lower Boise River SBA and TMDL Addendum – Total Phosphorus DRAFT
49 DRAFT November 2014
Table 21. Background concentrations for the lower Boise River near Parma.
Sampling Date
Parma Flow (cfs)
1
Background TP
Concentration at Diversion
(mg/L)2
Potential TP Background
Load at Parma (lbs/day)
3
TP Load at Parma
(lbs/day)1
Max Potential Background TP Contribution at
Parma (%)4
August 2012 624 0.018 61 1,010 6.0%
October 2012 924 0.018 90 1,450 6.2%
March 2013 846 0.018 82 1,550 5.3%
Note: These data represent contributions to the Boise River, and they do not account for downstream diversions or uptake (e.g. agriculture, municipal, industrial, or biogeochemical). 1
As identified by USGS in lower Boise River mass balance model (Etheridge 2013). 2 Background is calculated as the TP load at Diversion Dam, based on 2005 – 2013 USGS data, indicating
concentrations of 0.018 mg/L with detection levels of 0.01 mg/L. Long-term median data and the USGS 2012-2013 synoptic samples (Etheridge 2013) indicate background concentrations of 0.02 and 0.015 mg/L, respectively.. 3 Calculated as Parma Flow (cfs) x TP Concentration (mg/L) x 5.39 standard conversion factor (Hammer 1986).
4 Estimated as the Potential TP Background Load at Parma (lbs/day) / TP Load at Parma (lbs/day). This assumes
that 100% of the TP background load reaches Parma.
Conservatively assuming 100% of background TP load reaches Parma, estimates range from
approximately 61 to 90 lbs/day at Parma, which represents approximately 5.3 to 6.2%.of the
load. Although the actual percentage of background TP loads reaching Parma from Diversion
Dam is less due to the diversions and returns, this estimation identifies, in the absence of
diversions and returns along the lower Boise River, the maximum potential background TP loads
reaching Parma at 0.018 mg/L.
3.2.3 Ground Water and Unmeasured Sources
The gaining and losing reaches of the main stem lower Boise River vary spatially and
temporally. In addition to work that has been conducted previously, the USGS synoptic sampling
and mass balance model have provided additional information to better understand ground water
and other unmeasured sources of water and TP in the lower Boise River.
The questions of ground water and other unmeasured flows contributing to loads observed in the
mainstem and tributaries are complex due the numerous water uses and plumbing conveyance in
the subbasin. Given the complexity, it is important to note that ground water and unmeasured
sources are estimated in the mass balance model as sources not directly attributed to point
source, or nonpoint source tributary and drain additions. As a result, it is understood and
explicitly assumed that shallow subsurface ground water and unmeasured nonpoint source flows
may come from a variety of known and unknown sources that were not measured as surface
water, including but not limited to: agricultural irrigation, ground seepage, unidentified small
drains, urban, suburban, and rural diffuse returns, septic systems, and bank recharge.
During the USGS August 2012 synoptic sample, ground water and unmeasured flows (485 cfs at
0.22 mg/L TP) accounted for approximately 78% of the 624 cfs discharge measured at the Boise
River near Parma, and accounted for approximately 576 lbs/day of TP (Etheridge 2013).
Conversely, in October, the Boise River ground water gains of 91.4 cfs accounted for
approximately 9.9% of the 924 cfs flow measured at Parma, estimated at 0.16 mg/L, resulting in
79 lbs/day of TP. Finally, the March discharge balance resulted in a 174 cfs gain from ground
DRAFT November 2014 Lower Boise River SBA and TMDL Addendum – Total Phosphorus DRAFT
50 DRAFT November 2014
water, or 21 percent of the 846 cfs discharge observed at the Boise River near Parma,
corresponding with TP concentrations of approximately 0.12 mg/L and loads of 113 lbs/day
(Etheridge 2013, and Alex Etheridge, pers. comm. 2014).
3.3 Pollutant Transport Phosphorus is discharged into the river from both point and nonpoint sources. It is difficult to
determine pollutant delivery potential in such a complex watershed with modified surface
hydrology system because water is diverted and often reused downstream from its original
source. In the lower Boise River watershed, wastewater and agricultural return flow is often
subsequently diverted and utilized again for irrigation, industrial, or municipal purposes. Further,
even through complex modeling efforts, the accuracy in determining exactly where particular
pollutants originate, decreases as distance from original diversion/return increases.
In this TMDL addemdum, the potential relative contribution of each source sector is discussed
throughout Section 5. In which, the relative contribution from each source sector is calculated as
the ratio of total measured TP inputs from the various sources relative to the measured TP loads
at Parma. A major assumption in these calculations is that TP from each source sector has a
similar potential to reach Parma. A strength of this simplified assumption facilitates using
straightforward calculations to quantify potential loading relationships without requiring
additional complex assumptions about TP use and reuse throughout the watershed. Conversely, a
limitation of this assumption is that the lower Boise River watershed is much more dynamic than
potentially represented by simplified ratios. However, trying to further refine calculations to
estimate individual TP sources relative to loads measured at Parma would add additional layers
of complexity, assumptions, and speculation about how TP moves and is reused through the
system. And although measured data are readily available regarding the TP inputs from various
point-and nonpoint sources throughout the watershed, as well as the TP loads measured at
Parma, the movement of TP through, and the interrelationships among the complex plumbing,
water re-use, agricultural drains and tributaries, ground water, and other biogeochemical process
are not well-understood.
Additional discussions of pollutant transport in the subbasin are provided in the Lower Boise
River Nutrient Subbasin Assessment (DEQ 2001b) and Lower Boise River Implementation Plan:
Total Phosphorus (DEQ 2008).
4 Subbasin Assessment—Summary of Past and Present Pollution Control Efforts
Information concerning pollution control efforts for WWTFs, urban and suburban storm
drainage, agricultural and other nonpoint sources (including rural roads, septic systems, leaky
and sewer lines) can be found in the Implementation Plan for the Lower Boise River TMDL
(DEQ 2003). While the 2003 plan was developed for the sediment and bacteria TMDLs, many of
the BMP practices used by nonpoint sources would be similar for TP. Additional information
pertaining to point sources is also available in the Lower Boise River Implementation Plan Total
Phosphorus (DEQ 2008).
DRAFT November 2014 Lower Boise River SBA and TMDL Addendum – Total Phosphorus DRAFT
51 DRAFT November 2014
In 2013 and 2014, DEQ solicited information from the LBWC, TAC, and other stakeholders to
help describe past and present pollution control efforts in the subbasin. The following
descriptions in this section represent the information provided to DEQ.
319 Grants and Projects
In 1987, Congress established the Nonpoint Source Management Program under section 319 of
the Clean Water Act to help states address nonpoint source pollution by identifying waters
affected by such pollution and adopting and implementing management programs to control this
pollution. In the 319 grant selection process, proposals are required to link project benefits to
pollutant load reductions identified in an approved TMDL. Preference is given to projects where
priority has been identified in a water quality improvement plan. To keep the focus on improving
water quality, load reduction estimates must be calculated for each pollutant being addressed by
the non-point source project.
These 319 programs recommend where and how to use BMPs to prevent runoff from becoming
polluted, and where it is polluted, to reduce the amount that reaches surface waters. For example,
Ferguson (1999) estimates that an average range of 40 to 60% of irrigation water applied to
cropland in the south-central and south-west areas of Idaho flows off of surface irrigated fields.
And Carter (2002) and Ferguson (1999) also identify BMPs that can be implemented to reduce
subsequent pollutant delivery from fields.
Since 1997, DEQ has allocated approximately 1.4 million dollars toward 319 grants in the lower
Boise River subbasin for the implementation of BMPs to reduce and prevent pollutant runoff
(e.g. sediment and nutrients) from reaching surface waters (Table 22). Currently, contract S443
is being implemented by the Lower Boise Watershed Council, which includes the
implementation of projects using sprinkler and drip irrigations systems to reduce water use and
pollutant delivery relative to traditional surface irrigation practices.
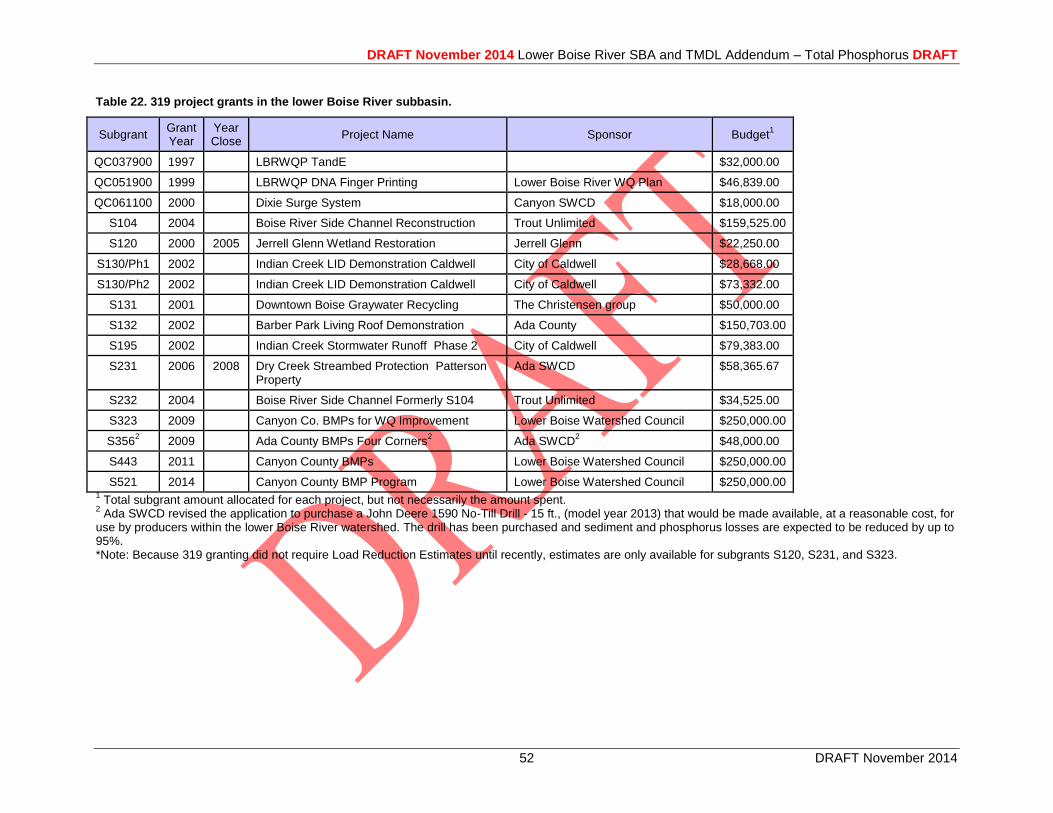
DRAFT November 2014 Lower Boise River SBA and TMDL Addendum – Total Phosphorus DRAFT
52 DRAFT November 2014
Table 22. 319 project grants in the lower Boise River subbasin.
Subgrant Grant Year
Year Close
Project Name Sponsor Budget1
QC037900 1997 LBRWQP TandE $32,000.00
QC051900 1999 LBRWQP DNA Finger Printing Lower Boise River WQ Plan $46,839.00
QC061100 2000 Dixie Surge System Canyon SWCD $18,000.00
S104 2004 Boise River Side Channel Reconstruction Trout Unlimited $159,525.00
S120 2000 2005 Jerrell Glenn Wetland Restoration Jerrell Glenn $22,250.00
S130/Ph1 2002 Indian Creek LID Demonstration Caldwell City of Caldwell $28,668.00
S130/Ph2 2002 Indian Creek LID Demonstration Caldwell City of Caldwell $73,332.00
S131 2001 Downtown Boise Graywater Recycling The Christensen group $50,000.00
S132 2002 Barber Park Living Roof Demonstration Ada County $150,703.00
S195 2002 Indian Creek Stormwater Runoff Phase 2 City of Caldwell $79,383.00
S231 2006 2008 Dry Creek Streambed Protection Patterson Property
Ada SWCD $58,365.67
S232 2004 Boise River Side Channel Formerly S104 Trout Unlimited $34,525.00
S323 2009 Canyon Co. BMPs for WQ Improvement Lower Boise Watershed Council $250,000.00
S3562
2009 Ada County BMPs Four Corners2
Ada SWCD2
$48,000.00
S443 2011 Canyon County BMPs Lower Boise Watershed Council $250,000.00
S521 2014 Canyon County BMP Program Lower Boise Watershed Council $250,000.00 1 Total subgrant amount allocated for each project, but not necessarily the amount spent.
2 Ada SWCD revised the application to purchase a John Deere 1590 No-Till Drill - 15 ft., (model year 2013) that would be made available, at a reasonable cost, for
use by producers within the lower Boise River watershed. The drill has been purchased and sediment and phosphorus losses are expected to be reduced by up to 95%. *Note: Because 319 granting did not require Load Reduction Estimates until recently, estimates are only available for subgrants S120, S231, and S323.
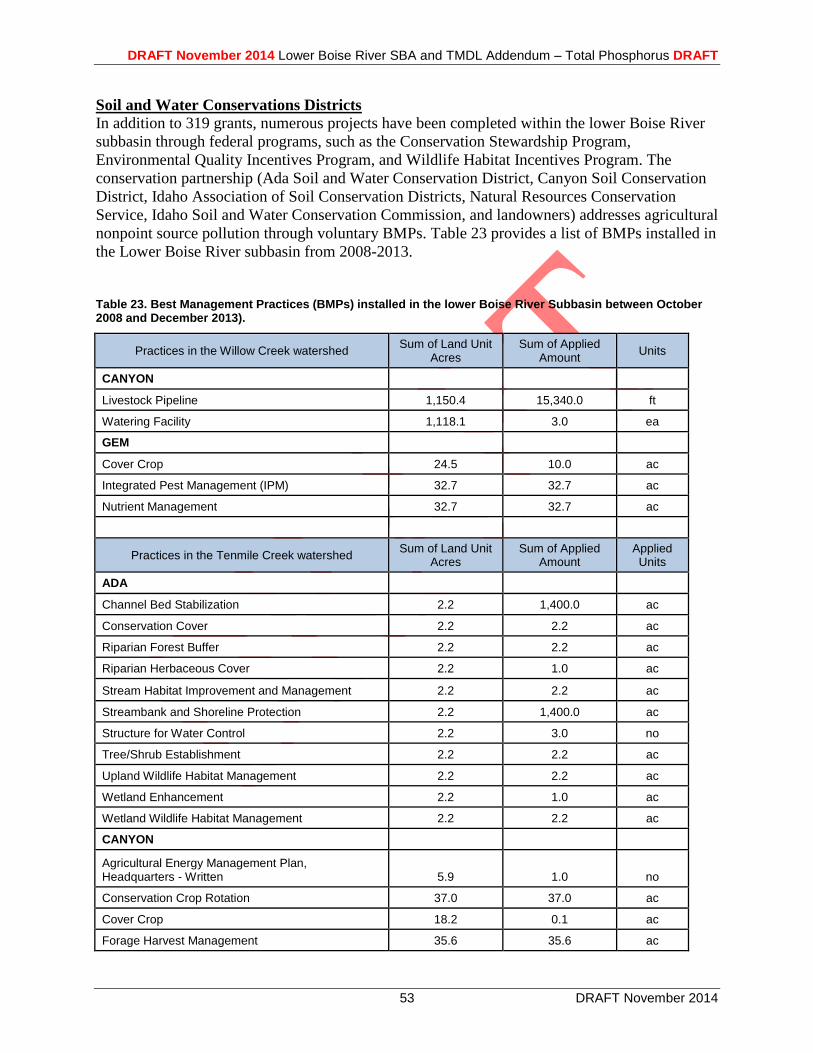
DRAFT November 2014 Lower Boise River SBA and TMDL Addendum – Total Phosphorus DRAFT
53 DRAFT November 2014
Soil and Water Conservations Districts
In addition to 319 grants, numerous projects have been completed within the lower Boise River
subbasin through federal programs, such as the Conservation Stewardship Program,
Environmental Quality Incentives Program, and Wildlife Habitat Incentives Program. The
conservation partnership (Ada Soil and Water Conservation District, Canyon Soil Conservation
District, Idaho Association of Soil Conservation Districts, Natural Resources Conservation
Service, Idaho Soil and Water Conservation Commission, and landowners) addresses agricultural
nonpoint source pollution through voluntary BMPs. Table 23 provides a list of BMPs installed in
the Lower Boise River subbasin from 2008-2013.
Table 23. Best Management Practices (BMPs) installed in the lower Boise River Subbasin between October 2008 and December 2013).
Practices in the Willow Creek watershed Sum of Land Unit
Acres Sum of Applied
Amount Units
CANYON
Livestock Pipeline 1,150.4 15,340.0 ft
Watering Facility 1,118.1 3.0 ea
GEM
Cover Crop 24.5 10.0 ac
Integrated Pest Management (IPM) 32.7 32.7 ac
Nutrient Management 32.7 32.7 ac
Practices in the Tenmile Creek watershed Sum of Land Unit
Acres Sum of Applied
Amount Applied Units
ADA
Channel Bed Stabilization 2.2 1,400.0 ac
Conservation Cover 2.2 2.2 ac
Riparian Forest Buffer 2.2 2.2 ac
Riparian Herbaceous Cover 2.2 1.0 ac
Stream Habitat Improvement and Management 2.2 2.2 ac
Streambank and Shoreline Protection 2.2 1,400.0 ac
Structure for Water Control 2.2 3.0 no
Tree/Shrub Establishment 2.2 2.2 ac
Upland Wildlife Habitat Management 2.2 2.2 ac
Wetland Enhancement 2.2 1.0 ac
Wetland Wildlife Habitat Management 2.2 2.2 ac
CANYON
Agricultural Energy Management Plan, Headquarters - Written 5.9 1.0 no
Conservation Crop Rotation 37.0 37.0 ac
Cover Crop 18.2 0.1 ac
Forage Harvest Management 35.6 35.6 ac
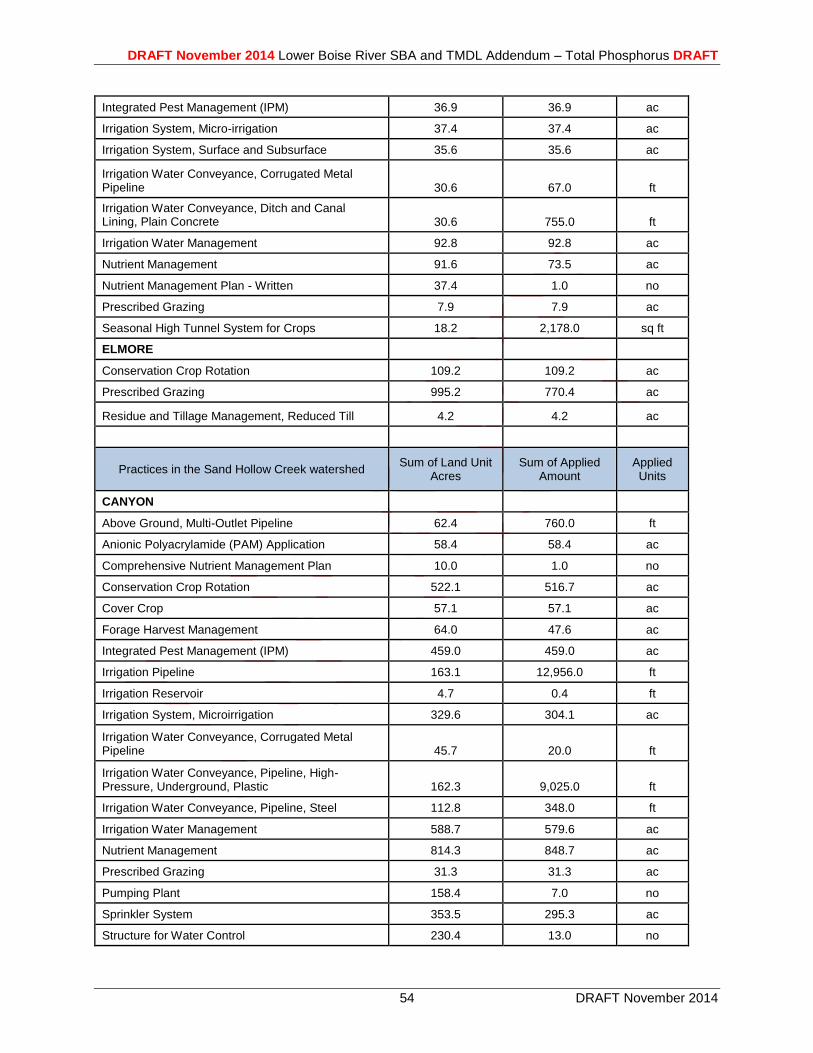
DRAFT November 2014 Lower Boise River SBA and TMDL Addendum – Total Phosphorus DRAFT
54 DRAFT November 2014
Integrated Pest Management (IPM) 36.9 36.9 ac
Irrigation System, Micro-irrigation 37.4 37.4 ac
Irrigation System, Surface and Subsurface 35.6 35.6 ac
Irrigation Water Conveyance, Corrugated Metal Pipeline 30.6 67.0 ft
Irrigation Water Conveyance, Ditch and Canal Lining, Plain Concrete 30.6 755.0 ft
Irrigation Water Management 92.8 92.8 ac
Nutrient Management 91.6 73.5 ac
Nutrient Management Plan - Written 37.4 1.0 no
Prescribed Grazing 7.9 7.9 ac
Seasonal High Tunnel System for Crops 18.2 2,178.0 sq ft
ELMORE
Conservation Crop Rotation 109.2 109.2 ac
Prescribed Grazing 995.2 770.4 ac
Residue and Tillage Management, Reduced Till 4.2 4.2 ac
Practices in the Sand Hollow Creek watershed Sum of Land Unit
Acres Sum of Applied
Amount Applied Units
CANYON
Above Ground, Multi-Outlet Pipeline 62.4 760.0 ft
Anionic Polyacrylamide (PAM) Application 58.4 58.4 ac
Comprehensive Nutrient Management Plan 10.0 1.0 no
Conservation Crop Rotation 522.1 516.7 ac
Cover Crop 57.1 57.1 ac
Forage Harvest Management 64.0 47.6 ac
Integrated Pest Management (IPM) 459.0 459.0 ac
Irrigation Pipeline 163.1 12,956.0 ft
Irrigation Reservoir 4.7 0.4 ft
Irrigation System, Microirrigation 329.6 304.1 ac
Irrigation Water Conveyance, Corrugated Metal Pipeline 45.7 20.0 ft
Irrigation Water Conveyance, Pipeline, High-Pressure, Underground, Plastic 162.3 9,025.0 ft
Irrigation Water Conveyance, Pipeline, Steel 112.8 348.0 ft
Irrigation Water Management 588.7 579.6 ac
Nutrient Management 814.3 848.7 ac
Prescribed Grazing 31.3 31.3 ac
Pumping Plant 158.4 7.0 no
Sprinkler System 353.5 295.3 ac
Structure for Water Control 230.4 13.0 no
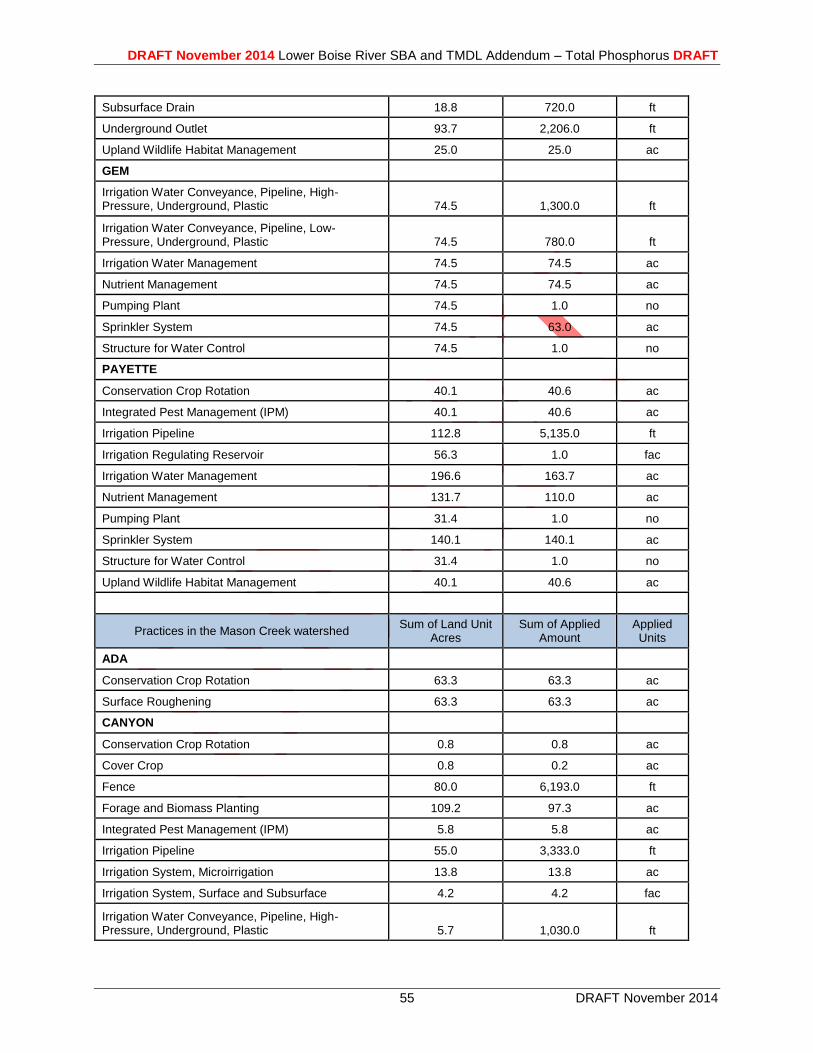
DRAFT November 2014 Lower Boise River SBA and TMDL Addendum – Total Phosphorus DRAFT
55 DRAFT November 2014
Subsurface Drain 18.8 720.0 ft
Underground Outlet 93.7 2,206.0 ft
Upland Wildlife Habitat Management 25.0 25.0 ac
GEM
Irrigation Water Conveyance, Pipeline, High-Pressure, Underground, Plastic 74.5 1,300.0 ft
Irrigation Water Conveyance, Pipeline, Low-Pressure, Underground, Plastic 74.5 780.0 ft
Irrigation Water Management 74.5 74.5 ac
Nutrient Management 74.5 74.5 ac
Pumping Plant 74.5 1.0 no
Sprinkler System 74.5 63.0 ac
Structure for Water Control 74.5 1.0 no
PAYETTE
Conservation Crop Rotation 40.1 40.6 ac
Integrated Pest Management (IPM) 40.1 40.6 ac
Irrigation Pipeline 112.8 5,135.0 ft
Irrigation Regulating Reservoir 56.3 1.0 fac
Irrigation Water Management 196.6 163.7 ac
Nutrient Management 131.7 110.0 ac
Pumping Plant 31.4 1.0 no
Sprinkler System 140.1 140.1 ac
Structure for Water Control 31.4 1.0 no
Upland Wildlife Habitat Management 40.1 40.6 ac
Practices in the Mason Creek watershed Sum of Land Unit
Acres Sum of Applied
Amount Applied Units
ADA
Conservation Crop Rotation 63.3 63.3 ac
Surface Roughening 63.3 63.3 ac
CANYON
Conservation Crop Rotation 0.8 0.8 ac
Cover Crop 0.8 0.2 ac
Fence 80.0 6,193.0 ft
Forage and Biomass Planting 109.2 97.3 ac
Integrated Pest Management (IPM) 5.8 5.8 ac
Irrigation Pipeline 55.0 3,333.0 ft
Irrigation System, Microirrigation 13.8 13.8 ac
Irrigation System, Surface and Subsurface 4.2 4.2 fac
Irrigation Water Conveyance, Pipeline, High-Pressure, Underground, Plastic 5.7 1,030.0 ft
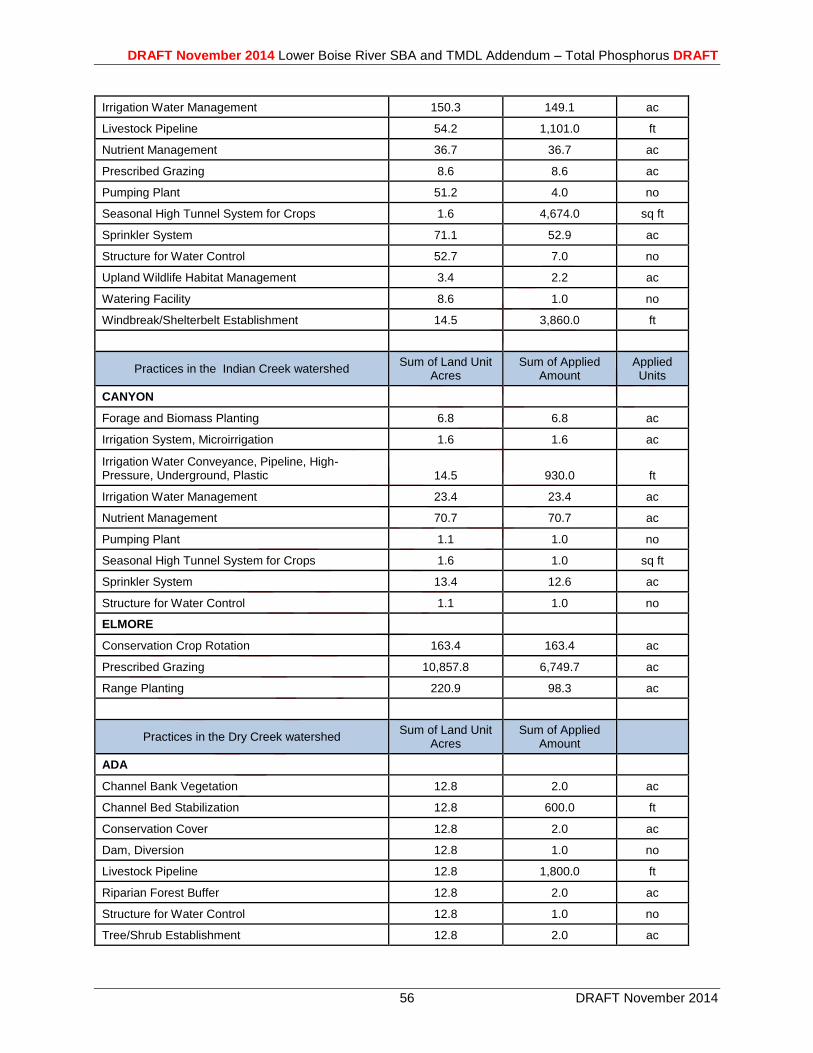
DRAFT November 2014 Lower Boise River SBA and TMDL Addendum – Total Phosphorus DRAFT
56 DRAFT November 2014
Irrigation Water Management 150.3 149.1 ac
Livestock Pipeline 54.2 1,101.0 ft
Nutrient Management 36.7 36.7 ac
Prescribed Grazing 8.6 8.6 ac
Pumping Plant 51.2 4.0 no
Seasonal High Tunnel System for Crops 1.6 4,674.0 sq ft
Sprinkler System 71.1 52.9 ac
Structure for Water Control 52.7 7.0 no
Upland Wildlife Habitat Management 3.4 2.2 ac
Watering Facility 8.6 1.0 no
Windbreak/Shelterbelt Establishment 14.5 3,860.0 ft
Practices in the Indian Creek watershed Sum of Land Unit
Acres Sum of Applied
Amount Applied Units
CANYON
Forage and Biomass Planting 6.8 6.8 ac
Irrigation System, Microirrigation 1.6 1.6 ac
Irrigation Water Conveyance, Pipeline, High-Pressure, Underground, Plastic 14.5 930.0 ft
Irrigation Water Management 23.4 23.4 ac
Nutrient Management 70.7 70.7 ac
Pumping Plant 1.1 1.0 no
Seasonal High Tunnel System for Crops 1.6 1.0 sq ft
Sprinkler System 13.4 12.6 ac
Structure for Water Control 1.1 1.0 no
ELMORE
Conservation Crop Rotation 163.4 163.4 ac
Prescribed Grazing 10,857.8 6,749.7 ac
Range Planting 220.9 98.3 ac
Practices in the Dry Creek watershed Sum of Land Unit
Acres Sum of Applied
Amount
ADA
Channel Bank Vegetation 12.8 2.0 ac
Channel Bed Stabilization 12.8 600.0 ft
Conservation Cover 12.8 2.0 ac
Dam, Diversion 12.8 1.0 no
Livestock Pipeline 12.8 1,800.0 ft
Riparian Forest Buffer 12.8 2.0 ac
Structure for Water Control 12.8 1.0 no
Tree/Shrub Establishment 12.8 2.0 ac
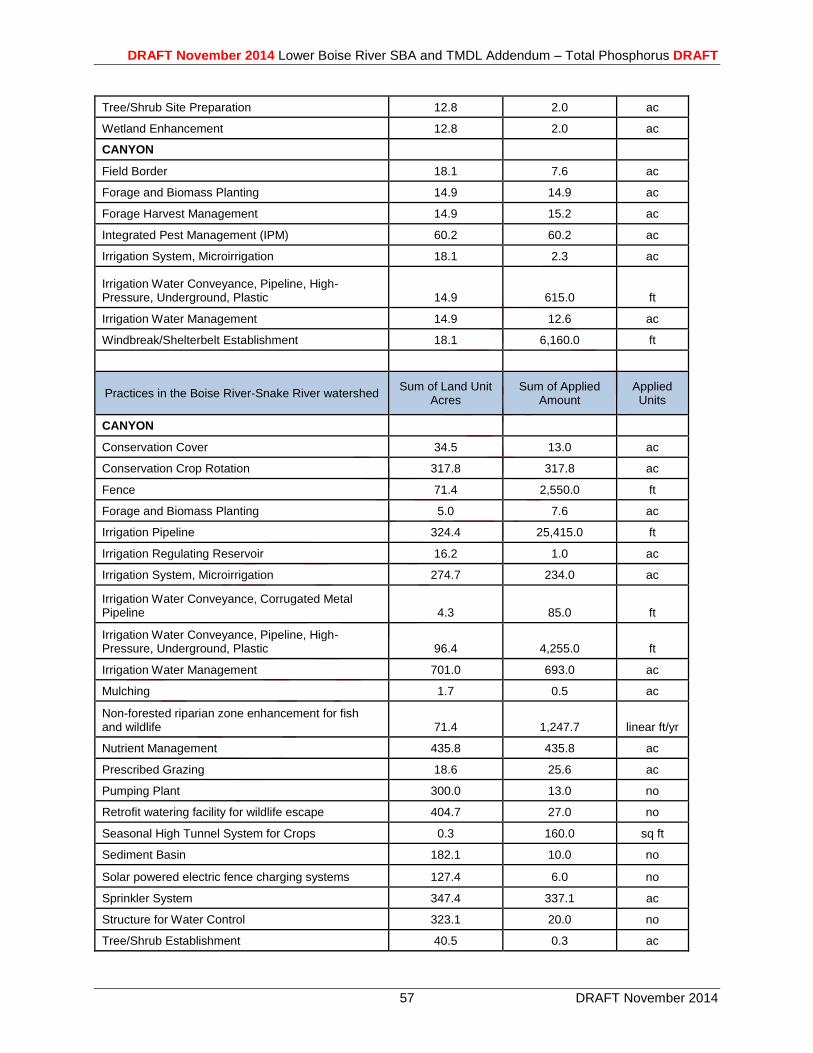
DRAFT November 2014 Lower Boise River SBA and TMDL Addendum – Total Phosphorus DRAFT
57 DRAFT November 2014
Tree/Shrub Site Preparation 12.8 2.0 ac
Wetland Enhancement 12.8 2.0 ac
CANYON
Field Border 18.1 7.6 ac
Forage and Biomass Planting 14.9 14.9 ac
Forage Harvest Management 14.9 15.2 ac
Integrated Pest Management (IPM) 60.2 60.2 ac
Irrigation System, Microirrigation 18.1 2.3 ac
Irrigation Water Conveyance, Pipeline, High-Pressure, Underground, Plastic 14.9 615.0 ft
Irrigation Water Management 14.9 12.6 ac
Windbreak/Shelterbelt Establishment 18.1 6,160.0 ft
Practices in the Boise River-Snake River watershed Sum of Land Unit
Acres Sum of Applied
Amount Applied Units
CANYON
Conservation Cover 34.5 13.0 ac
Conservation Crop Rotation 317.8 317.8 ac
Fence 71.4 2,550.0 ft
Forage and Biomass Planting 5.0 7.6 ac
Irrigation Pipeline 324.4 25,415.0 ft
Irrigation Regulating Reservoir 16.2 1.0 ac
Irrigation System, Microirrigation 274.7 234.0 ac
Irrigation Water Conveyance, Corrugated Metal Pipeline 4.3 85.0 ft
Irrigation Water Conveyance, Pipeline, High-Pressure, Underground, Plastic 96.4 4,255.0 ft
Irrigation Water Management 701.0 693.0 ac
Mulching 1.7 0.5 ac
Non-forested riparian zone enhancement for fish and wildlife 71.4 1,247.7 linear ft/yr
Nutrient Management 435.8 435.8 ac
Prescribed Grazing 18.6 25.6 ac
Pumping Plant 300.0 13.0 no
Retrofit watering facility for wildlife escape 404.7 27.0 no
Seasonal High Tunnel System for Crops 0.3 160.0 sq ft
Sediment Basin 182.1 10.0 no
Solar powered electric fence charging systems 127.4 6.0 no
Sprinkler System 347.4 337.1 ac
Structure for Water Control 323.1 20.0 no
Tree/Shrub Establishment 40.5 0.3 ac
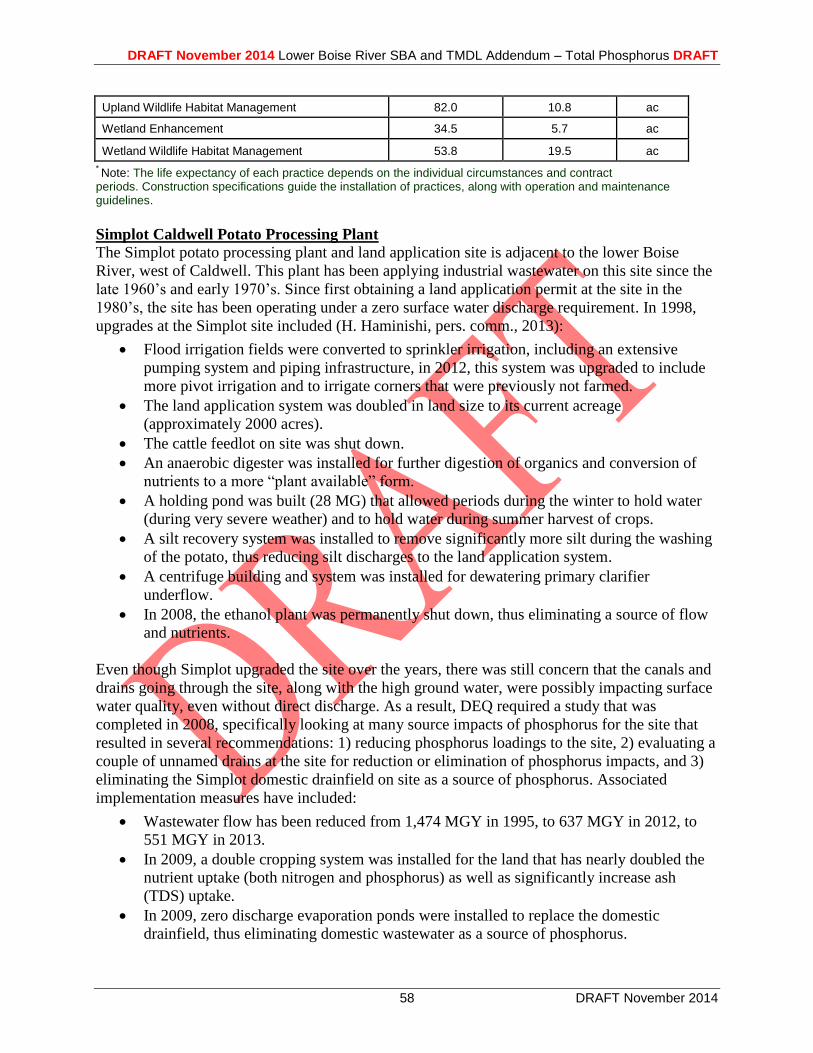
DRAFT November 2014 Lower Boise River SBA and TMDL Addendum – Total Phosphorus DRAFT
58 DRAFT November 2014
Upland Wildlife Habitat Management 82.0 10.8 ac
Wetland Enhancement 34.5 5.7 ac
Wetland Wildlife Habitat Management 53.8 19.5 ac
* Note: The life expectancy of each practice depends on the individual circumstances and contract
periods. Construction specifications guide the installation of practices, along with operation and maintenance guidelines.
Simplot Caldwell Potato Processing Plant
The Simplot potato processing plant and land application site is adjacent to the lower Boise
River, west of Caldwell. This plant has been applying industrial wastewater on this site since the
late 1960’s and early 1970’s. Since first obtaining a land application permit at the site in the
1980’s, the site has been operating under a zero surface water discharge requirement. In 1998,
upgrades at the Simplot site included (H. Haminishi, pers. comm., 2013):
Flood irrigation fields were converted to sprinkler irrigation, including an extensive
pumping system and piping infrastructure, in 2012, this system was upgraded to include
more pivot irrigation and to irrigate corners that were previously not farmed.
The land application system was doubled in land size to its current acreage
(approximately 2000 acres).
The cattle feedlot on site was shut down.
An anaerobic digester was installed for further digestion of organics and conversion of
nutrients to a more “plant available” form.
A holding pond was built (28 MG) that allowed periods during the winter to hold water
(during very severe weather) and to hold water during summer harvest of crops.
A silt recovery system was installed to remove significantly more silt during the washing
of the potato, thus reducing silt discharges to the land application system.
A centrifuge building and system was installed for dewatering primary clarifier
underflow.
In 2008, the ethanol plant was permanently shut down, thus eliminating a source of flow
and nutrients.
Even though Simplot upgraded the site over the years, there was still concern that the canals and
drains going through the site, along with the high ground water, were possibly impacting surface
water quality, even without direct discharge. As a result, DEQ required a study that was
completed in 2008, specifically looking at many source impacts of phosphorus for the site that
resulted in several recommendations: 1) reducing phosphorus loadings to the site, 2) evaluating a
couple of unnamed drains at the site for reduction or elimination of phosphorus impacts, and 3)
eliminating the Simplot domestic drainfield on site as a source of phosphorus. Associated
implementation measures have included:
Wastewater flow has been reduced from 1,474 MGY in 1995, to 637 MGY in 2012, to
551 MGY in 2013.
In 2009, a double cropping system was installed for the land that has nearly doubled the
nutrient uptake (both nitrogen and phosphorus) as well as significantly increase ash
(TDS) uptake.
In 2009, zero discharge evaporation ponds were installed to replace the domestic
drainfield, thus eliminating domestic wastewater as a source of phosphorus.
DRAFT November 2014 Lower Boise River SBA and TMDL Addendum – Total Phosphorus DRAFT
59 DRAFT November 2014
In addition, Simplot is currently completing construction and startup of a new treatment system
that will support the new potato processing plant at this site. This treatment system will:
Reduce overall hydraulic flow to the land application site
Reduce nitrogen loading to less than half of the current loading rates and reduce
phosphorus loading rates by 90-95%
Return more than half of the treated process water to the new process plant for reuse in
the industrial process
Use mechanical reverse osmosis to evaporate the concentrate from the treatment plant
The plant currently has one MSGP and two CGPs open, with a third requested. With the new
potato plant on line and the old plant now shut down, Simplot will be updating the SWPPP for
the MSGP, but does not plan to request a new MSGP.
City of Meridian
Meridian operates a WWTF that was constructed in 1978. There have been numerous capacity
upgrades and treatment improvements since the original construction. Flow through the plant has
increased from about 3.2 to 5.6 mgd (annual averages from 2001 and 2013, respectively),
representing nearly a 5-percent annual increase in response to population growth within the city.
Discharge is permitted to two outfalls, Fivemile Creek and the Boise River. Upgrades and
improvements have included:
Biological treatment process improvements to provide both biological phosphorus
removal and nitrification and denitrification for ammonia and total nitrogen reduction.
Tertiary filtration.
Return activated sludge denitrification.
Primary sludge fermentation is under construction.
Investment in Class A recycled water program
Additional Water Quality Information
Additional information regarding past, present, and future management actions affecting water
quality in the lower Boise River were previously identified and are available in the 2008 Lower
Boise River Implementation Plan Total Phosphorus (DEQ 2008), including submissions by:
City of Boise
City of Caldwell
City of Nampa
City of Star
City of Wilder
Darigold
4.1 Water Quality Monitoring
A combination of one time, ongoing, regularly-scheduled, and event-specific water quality
monitoring occurs in the lower Boise River (see Appendix B – Data Sources). These monitoring
efforts include, but are not limited to DEQ BURP sampling, synoptic sampling events of 2012
and 2013 (Etheridge 2013), other long-term USGS data collection, ongoing City of Boise data
DRAFT November 2014 Lower Boise River SBA and TMDL Addendum – Total Phosphorus DRAFT
60 DRAFT November 2014
collection throughout the river (unpublished data), Discharge Monitoring Reports (DMRs) and
other data collected by municipal, stormwater, and industrial dischargers, 319 grant and other
nonpoint source monitoring efforts.
Since 1994 the USGS has monitored water quality and biological communities in the Boise
River in cooperation with DEQ and the LBWC. Early efforts were designed to assess ongoing
status and trends in water quality and biological communities on the Boise River, and synoptic
studies to identify the tributaries contributing the most significant loads of selected constituents
to the river. The program evolved over the years to accommodate data needs to formulate
TMDLs in the lower Boise River subbasin. Included were several short-term studies to evaluate
continuous water temperatures; ground water nutrient loads, nutrient and sediment loads
discharged to the Snake River, resident fish communities, cost-effective methods to more-
frequently monitor nutrients and sediment, and potential applications of isotopic tracers for
understanding nutrient sources and cycling (USGS 2012, 2013a, 2013b).
Additionally, the USGS, in cooperation with the DEQ and the LBWC, has collected and
published other biological data throughout the lower Boise River subbasin, including aquatic
growth (periphyton and phytoplankton). Some of their published monitoring results are
available in the subsequent documents:
Evaluation of Total Phosphorus Mass Balance in the Lower Boise River, Southwestern
Idaho (Etheridge 2013)
Water-quality Conditions near the Confluence of the Snake and Boise Rivers, Canyon
County, Idaho (Wood and Etheridge 2011)
Water-Quality and Biological Conditions in the Lower Boise River, Ada and Canyon
Counties, Idaho, 1994–2002 (MacCoy 2004)
Water-quality Conditions of the Lower Boise River, Ada and Canyon Counties, Idaho,
May 1994 through February 1997 (Mullins 1998)
Biological Assessment of the Lower Boise River, October 1995 through January 1998,
Ada and Canyon Counties, Idaho (Mullins 1999)
5 Total Maximum Daily Load(s)
A TMDL prescribes an upper limit (i.e., load capacity) on discharge of a pollutant from all
sources to ensure water quality standards are met. It further allocates this load capacity among
the various sources of the pollutant. Pollutant sources fall into two broad classes: point sources,
each of which receives a wasteload allocation, and nonpoint sources, each of which receives a
load allocation. Natural background contributions, when present, are considered part of the load
allocation but are often treated separately because they represent a part of the load not subject to
control. Because of uncertainties about quantifying loads and the relation of specific loads to
attaining water quality standards, the rules regarding TMDLs (40 CFR Part 130) require a
margin of safety be included in the TMDL. Practically, the margin of safety and natural
background are both reductions in the load capacity available for allocation to pollutant sources.
Load capacity can be summarized by the following equation:
LC = MOS + NB + LA + WLA = TMDL
DRAFT November 2014 Lower Boise River SBA and TMDL Addendum – Total Phosphorus DRAFT
61 DRAFT November 2014
Where:
LC = load capacity
MOS = margin of safety
NB = natural background
LA = load allocation
WLA = wasteload allocation
The equation is written in this order because it represents the logical order in which a load
analysis is conducted. First, the load capacity is determined. Then the load capacity is broken
down into its components. After the necessary margin of safety and natural background, if
relevant, are quantified, the remainder is allocated among pollutant sources (i.e., the load
allocation and wasteload allocation). When the breakdown and allocation are complete, the result
is a TMDL, which must equal the load capacity.
The load capacity must be based on critical conditions—the conditions when water quality
standards are most likely to be violated. If protective under critical conditions, a TMDL will be
more than protective under other conditions. Because both load capacity and pollutant source
loads vary, and not necessarily in concert, determining critical conditions can be more
complicated than it may initially appear.
Another step in a load analysis is quantifying current pollutant loads by source. This step allows
for the specification of load reductions as percentages from current conditions, considers equities
in load reduction responsibility, and is necessary for water quality trading to occur. A load is
fundamentally a quantity of pollutant discharged over some period of time and is the product of
concentration and flow. Due to the diverse nature of various pollutants, and the difficulty of
strictly dealing with loads, the federal rules allow for “other appropriate measures” to be used
when necessary (40 CFR 130.2). These other measures must still be quantifiable and relate to
water quality standards, but they allow flexibility to deal with pollutant loading in more practical
and tangible ways. The rules also recognize the particular difficulty of quantifying nonpoint
loads and allow “gross allotment” as a load allocation where available data or appropriate
predictive techniques limit more accurate estimates. For certain pollutants whose effects are long
term, such as sediment and nutrients, EPA allows for seasonal or annual loads; however, under a
federal court decision, daily loads must also be expressed.
5.1 Instream Water Quality Targets
Instream water quality targets are selected for the purpose of restoring “full support of designated
beneficial uses” (Idaho Code 39-3611, 39-3615). The state’s water quality standards for nutrients
and nuisance aquatic growth are narrative rather than numerical. DEQ selected two targets for
the lower Boise River in this TMDL addendum: 1) a target to specifically meet the SR-HC
TMDL allocation target for the lower Boise River and 2) a nuisance aquatic growth target
specific to the lower Boise River.
The Mason Creek TP allocations were developed to help meet the lower Boise River targets,
which DEQ believes are sufficiently stringent to result in full beneficial use support in the creek.
DRAFT November 2014 Lower Boise River SBA and TMDL Addendum – Total Phosphorus DRAFT
62 DRAFT November 2014
The Sand Hollow Creek TP allocations were developed to help meet the SR-HC target, and to be
commensurate with other lower Boise River tributaries, which DEQ believes are sufficiently
stringent result in full beneficial support in the creek.
5.1.1 Projected Conditions
The TMDL targets are designed to achieve full support of designated or existing beneficial uses
in the lower Boise River, Mason Creek, and Sand Hollow Creek. Because identifying the
impairment or support of beneficial uses is based on multiple lines of evidence, it is difficult to
directly measure or compare to the narrative water quality standards. Water quality targets were
selected based on scientific literature for river conditions representing a variety of water quality
systems, including levels of phosphorus and benthic chlorophyll a representative of unimpaired
and impaired streams and rivers. This information was then used to help determine load capacity,
existing pollutant loads, wasteload allocations, and load allocations.
The projected conditions are anticipated to improve water quality by reducing periphyton
growth, phytoplankton and sestonic algae delivery, and other potential impacts such as low
dissolved oxygen, in order to support beneficial uses of contact recreation and aesthetics, aquatic
life, and wildlife habitats. At the same the time targets are structured to support existing
beneficial uses of domestic, agricultural, and industrial water supply, which are significant
economic and sociopolitical drivers in the watershed.
The water quality targets are structured to recognize multiple factors within the watershed:
1. The lower Boise River, Mason Creek, and Sand Hollow Creek have some finite ability to
process and transport TP at concentrations greater than background values without impairing
beneficial uses, but will respond positively to TP target concentrations.
2. Watershed hydrologic dynamics are not simple (e.g., upstream reservoirs, irrigation
diversions, return flows and drains).
a. Flow is highly managed throughout the watershed.
b. Water quality conditions vary seasonally.
c. Water quality conditions vary with spatial extent (e.g., location in the watershed).
3. Phosphorus sources have different locational impacts.
4. Phosphorus is moving through the watershed; it may take years before nonpoint source
phosphorus load reductions are observed downstream.
5. Phosphorus and benthic algae are not toxics and should not be managed as such.
6. Limited exceedances (depending on magnitude, duration, and frequency) may be acceptable
so long as they do not impair beneficial uses.
7. TP has multiple components, including labile and refractory, and may not be equally
bioavailable for algal growth.
8. Algal biomass may be influenced by human and environmental factors other than TP, alone
(e.g., flow, water temperature, other nutrients).
9. Algal species composition is variable.
10. Supporting reuse, offsets, trading, and other innovative approaches may further improve
water quality over meeting the targets, alone.
11. A balanced approach is necessary. Using simple assumptions about the fate and transport of
TP through watershed may be too conservative; whereas, developing a detailed approach to
DRAFT November 2014 Lower Boise River SBA and TMDL Addendum – Total Phosphorus DRAFT
63 DRAFT November 2014
track phosphorus as it moves through the intricate maze of channels for irrigation may be
currently unattainable.
12. The concepts of seasonal conditions and limited exceedances are supported by a number of
references including EPA guidance, use in other TMDLs including the SR-HC TMDL, the
fact that the phosphorus and periphyton are not toxic, and responses vary with conditions and
time.
5.1.2 Target Selection (Lower Boise River)
These targets are intended to protect beneficial uses and are translated into other forms for
setting allocations and limits in permits. The TMDL strives to be clear in how allocations were
developed and in how NPDES permits should interpret the allocations. However, it is important
to be clear that the target selection informs analyses but is a site-specific interpretation of a
narrative standard and is not a standard itself that is necessarily applicable to any other
watershed.
Snake River-Hells Canyon TMDL Target Compliance
May 1 – September 30: TP concentrations (or TP load equivalent) < 0.07 mg/L in the lower
Boise River near Parma to comply with the 2004 Snake River-Hells Canyon TMDL
The final SR-HC TMDL was approved by EPA in September 2004 (DEQ 2004). The TMDL
addressed point and nonpoint sources that discharge or drain directly to that reach of the Snake
River. Five major tributaries received gross phosphorus allocations at their mouths, including the
lower Boise River. Load allocations in the SR-HC TMDL were developed to achieve TP
concentrations of < 0.07 mg/L in the Snake River and Brownlee Reservoir from May 1 –
September 30 (IDEQ and ODEQ 2004; p. ii):
“Site-specific chlorophyll a and total phosphorus targets (less than 14 ug/L and less than or equal to 0.07 mg/L respectively) were identified by the TMDL. These targets are seasonal in nature and apply from May through September. … Inflowing tributaries have been assigned load allocations to meet the 0.07 mg/L total phosphorus target at their inflow to the Snake River.”
Therefore, compliance with the SR-HC TMDL requires achieving the seasonal 0.07 mg/L TP
target at the mouths of the lower Boise River and Sand Hollow Creek near Parma (although not
explicitly stated; Figure 31).
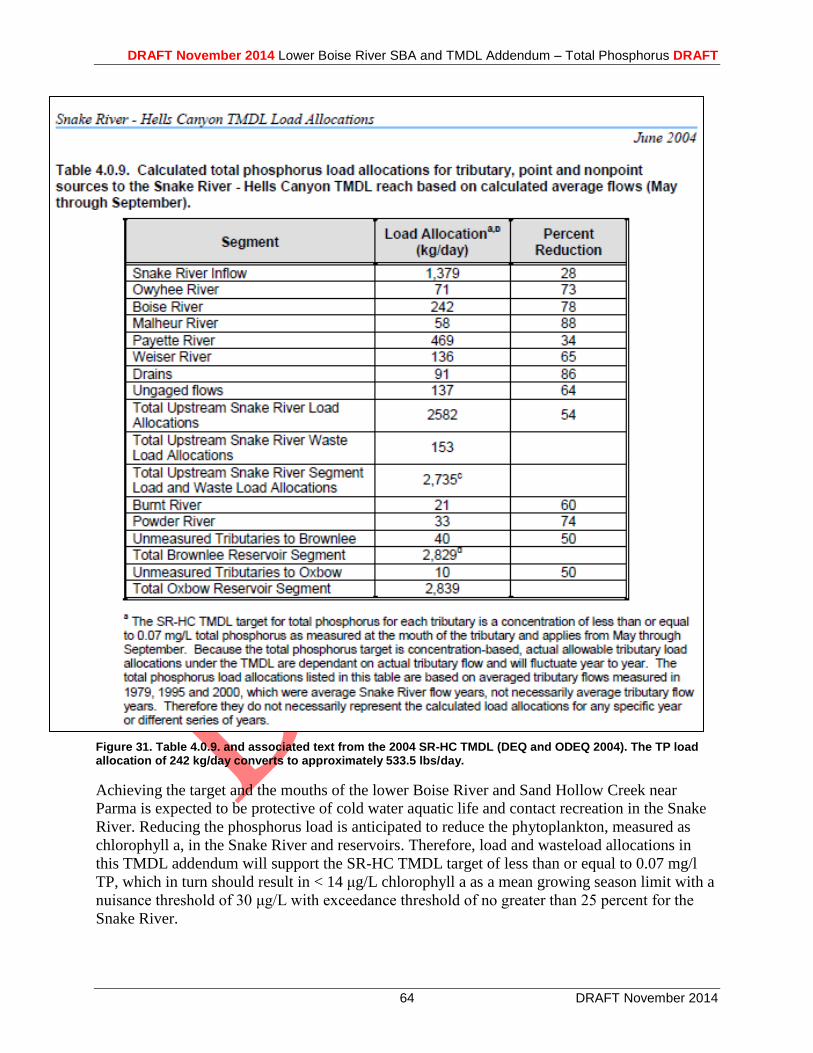
DRAFT November 2014 Lower Boise River SBA and TMDL Addendum – Total Phosphorus DRAFT
64 DRAFT November 2014
Figure 31. Table 4.0.9. and associated text from the 2004 SR-HC TMDL (DEQ and ODEQ 2004). The TP load allocation of 242 kg/day converts to approximately 533.5 lbs/day.
Achieving the target and the mouths of the lower Boise River and Sand Hollow Creek near
Parma is expected to be protective of cold water aquatic life and contact recreation in the Snake
River. Reducing the phosphorus load is anticipated to reduce the phytoplankton, measured as
chlorophyll a, in the Snake River and reservoirs. Therefore, load and wasteload allocations in
this TMDL addendum will support the SR-HC TMDL target of less than or equal to 0.07 mg/l
TP, which in turn should result in < 14 μg/L chlorophyll a as a mean growing season limit with a
nuisance threshold of 30 μg/L with exceedance threshold of no greater than 25 percent for the
Snake River.
DRAFT November 2014 Lower Boise River SBA and TMDL Addendum – Total Phosphorus DRAFT
65 DRAFT November 2014
Also, the loading analysis for this TP TMDL addendum, results in TP concentrations and loading
that meet the mean monthly periphyton (nuisance algae) target in the lower Boise River. The
May 1 – September 30 TP concentration and load equivalent targets correspond to the 90th
percentile low flows in the lower Boise River near Parma. Achieving the TP target near Parma
will help reduce the frequency, magnitude, and duration of algal blooms and their associated
aesthetic, ecological, and physical impacts on contact recreation and cold water aquatic life, in
the Snake River, the lower Boise River, Sand Mason Creek, and Sand Hollow Creek.
Nuisance Algae Target
Through the TMDL process, DEQ, in consultation with the LBWC, identified a set of metrics
that relate nuisance algae growth with the impairment of beneficial uses in the lower Boise River
(see Section 2.2.5). The following metrics and rationale were selected as appropriate TP
allocation periods for the lower Boise River:
Mean Monthly Benthic Chlorophyll a Target
o Magnitude - Mean monthly benthic chlorophyll a of < 150 mg/m2.
o Location – Within impaired AUs of the main stem lower Boise River.
o Duration
May 1 – September 30
May 1 – September 30 aligns with the SR-HC TMDL target dates
and is a primary growing season for benthic algae within the river
given favorable conditions such as light, temperature, and
hydrology.
October 1 – April 30
October 1 – April 30 incorporates the early fall period that
historically appears to coincide with elevated periphyton, but also
when a majority of the historical periphyton data has been
collected in the lower Boise River. It also incorporates the winter
and spring conditions during which very little historical periphyton
data have been collected in the lower Boise River. Nonetheless, the
limited data illustrate that periphyton has exceeded 200 mg/m2
during this time period at multiple sampling locations.
o Frequency – For TMDL implementation, DEQ recommends that an allowable
exceedance frequency of 1 in 10 years is sufficient to maintain full support of
beneficial uses.
The allowable exceedance frequency is set at once in 10 years based on
mean monthly values observed over a rolling 10-year period.
These target criteria are similar to those developed and implemented for waters in Montana
(MDEQ 2008), Minnesota (MPCA 2013) and Colorado (CDPHE 2013), and corresponds with
DRAFT November 2014 Lower Boise River SBA and TMDL Addendum – Total Phosphorus DRAFT
66 DRAFT November 2014
scientific literature values that support contact recreation and cold water aquatic life (see Section
2.2.5).
5.1.3 Target Selection (Mason Creek)
The target selection for Mason Creek is developed in the same manner as load allocations for the
other major tributaries to the lower Boise River. These load allocations will help the lower Boise
River achieve the May 1 – September 30 SR-HC TMDL TP target, while also meeting the
nuisance aquatic growth targets (translated into a TP target) in the lower Boise River. These
allocations are further expected to fully support beneficial uses in Mason Creek through TP load
reductions that are consistent with those of Sand Hollow Creek, the lower Boise River, EPA
Gold Book recommended TP value of 0.1 mg/L (EPA 1986), and should translate in nuisance
aquatic growth reductions sufficient to fully support beneficial uses. In addition, subsequent
monitoring of Mason Creek, along with DEQ’s ongoing statewide effort to identify nutrient and
nuisance aquatic growth relationships in wadeable streams, should provide further insight into
achieving full beneficial use in Mason Creek and other lower Boise River tributaries. An
adaptive management approach, as part of the 5-year review, will help to determine if subsequent
changes to load allocations will be necessary to fully support beneficial uses in Mason Creek.
5.1.4 Target Selection (Sand Hollow Creek)
The target selection for Sand Hollow Creek, a tributary to the Snake River, is developed to help
achieve the May 1 – September 30 target in the Snake River as identified in the SR-HC TMDL
(DEQ and ODEQ 2004). These allocations are further expected to fully support beneficial uses
in Sand Hollow Creek through TP load reductions that are consistent with those of the Mason
Creek, the lower Boise River, EPA Gold Book recommended TP value of 0.1 mg/L (EPA 1986),
and should translate in nuisance aquatic growth reductions sufficient to fully support beneficial
uses. In addition, subsequent monitoring of Sand Hollow Creek, along with DEQ’s ongoing
statewide effort to identify nutrient and nuisance aquatic growth relationships in wadeable
streams, should provide further insight into achieving full beneficial use in Sand Hollow Creek.
An adaptive management approach, as part of the 5-year review, will help to determine if
subsequent changes to load allocations will be necessary to fully support beneficial uses in Sand
Hollow Creek.
5.1.5 Water Quality Monitoring Points
USGS efforts are now underway to track trends in water quality that might result from
management of water resources. These efforts require an emphasis on gathering information
within tributary basins in addition to continued monitoring on the Boise River for ongoing trend
detection. This includes maintaining and evaluating the long-term water-quality dataset on the
lower Boise River near Parma. Monitoring results from the lower Boise River near Parma
incorporate contributions and impacts from basin activities and represent the quality of Boise
River water discharging to the Snake River. The USGS measures continuous streamflow near
Parma as funded by the USGS National Streamflow Information Program (NSIP).
Additionally, monitoring activities beginning in fiscal year 2014 include sample collection and
continuous monitoring of water-quality parameters at the gage near Parma. In addition to
collecting at least 8 water quality samples during the fiscal year, a continuous water-quality

DRAFT November 2014 Lower Boise River SBA and TMDL Addendum – Total Phosphorus DRAFT
67 DRAFT November 2014
monitor will be installed and operated at the Parma stream gage. The continuous monitor will
collect temperature, specific conductance, dissolved oxygen, and turbidity every 15 minutes and
will be updated in real time on the stream gage web page (USGS 2013b).
A previously-published statistical regression model provides the ability to estimate TP and
suspended sediment in real time at Parma given continuously monitored turbidity and specific
conductance (Wood and Etheridge 2011). Event-based sample collection efforts will be used to
verify and/or calibrate model estimates of the TP and suspended sediment. Real-time estimates
of TP and suspended sediment will be provided on line and can be used to evaluate TP and
suspended sediment loading and concentrations on time scales consistent with storm events,
diurnal variation, and anomalous fluctuations in stream pollutants (USGS 2013b). The statistical
regression model will provide useful information for scheduling event-based samples, but only
event-based samples will be used for water quality evaluations and compliance purposes.
Through development of the subsequent Implementation Plan, DEQ, LBWC, USGS, and other
stakeholders will continue to develop and refine the water quality monitoring points and
strategies in the lower Boise River subbasin. This effort will help to ascertain the effectiveness
and impacts of TP load reductions on both meeting the May – September 0.07 mg/L TP target
near Parma, as well as meeting the 150 mg/m2 mean monthly benthic chlorophyll a target in the
impaired AUs.
5.2 Load Capacity
Load capacity is the calculated TP load in the lower Boise River at Parma that complies with the
SR-HC TMDL and fully supports beneficial uses in the lower Boise River, Mason Creek, and
Sand Hollow Creek. In other words, it is the amount of TP these waterbodies can receive and
still meet water quality standards. The amount of this pollutant must achieve a sufficient level to
meet “...water quality standards with seasonal variations and a margin of safety which takes into
account any lack of knowledge...” (Clean Water Act § 303(d)(C)). The margin of safety accounts
for uncertainty about assimilative capacity, the relationship between the selected target and
support of beneficial uses, and includes variability in target measurement.
The TP load capacity values for the lower Boise River, Mason Creek, and Sand Hollow Creek
§303(d)-listed AUs are based on the following assumptions: DEQ expects the TP allocations in
this TMDL addendum will support beneficial uses, while acknowledging that adaptive
management adjustments may be necessary as additional information is obtained through
monitoring. TP concentrations that support beneficial uses in western watersheds and values
identified in scientific literature are assumed to be useful reference points. However, TP
concentrations that fully support cold water aquatic life and recreation beneficial uses in the
lower Boise River and its tributaries have not been previously established.
5.2.1 TP Load Capacity to Meet SR-HC TMDL Target of < 0.07 mg/L May 1 – September 30
The TP load capacities developed for the lower Boise River near Parma, Mason Creek, and Sand
Hollow Creek are based on the instream loads:
DRAFT November 2014 Lower Boise River SBA and TMDL Addendum – Total Phosphorus DRAFT
68 DRAFT November 2014
TP concentration and TP load equivalent of < 0.07 mg/L are maintained at the mouth of
the lower Boise River and Sand Hollow Creek throughout the critical season (May 1–
September 30), and
That support beneficial uses in the lower Boise River, Mason Creek, and Sand Hollow
Creek.
The TP loading scenario that meets both conditions in the lower Boise River corresponds to the
90th
percentile low flow conditions (Table 24, Figures 31-33) and maintains the same TP
concentrations and loads under higher flows for all point and nonpoint sources, except natural
background, which adjusts with river flow. These load capacities comply with the target TP
allocations identified in the SR-HC TMDL and with the lower Boise River mean monthly
periphyton target (Section 5.1.2).
The allocations for the lower Boise River from May 1 – September 30 are designed to meet the
SR-HC TMDL 0.07 mg/L TP target, by utilizing a combination of the USGS mass balance
models and duration curves. The USGS mass balance model and report (Etheridge 2013) are
available online: http://pubs.usgs.gov/sir/2013/5220/. The duration curves are developed in
reference to An Approach for Using Load Duration Curves in the Development of the TMDLs
(EPA 2007), which is available online:
http://water.epa.gov/lawsregs/lawsguidance/cwa/tmdl/upload/2007_08_23_tmdl_duration_curve
_guide_aug2007.pdf. According to the duration curve reference document:
“The duration curve approach is particularly applicable because stream flow is an important factor in the determination of loading capacities…An underlying premise of the duration curve approach is correlation of water quality impairments to flow conditions. The duration curve alone does not consider specific fate and transport mechanisms, which may vary depending on watershed or pollutant characteristics…Practitioners, should consider using a separate analytical tool to develop a TMDL when factors other than flow significantly affect a water body’s loading capacity.”
The load duration curve approach recognizes that the assimilative capacity of the lower Boise
River and the maximum allowable loading varies with flow conditions. Therefore, existing
loading, and load reductions required to meet the SR-HC TMDL TP water quality target, are
calculated under different flow conditions. The difference between existing loading and the TP
target of 0.07 mg/L is used to calculate the loading reductions required.
Based on the following reasons, DEQ has determined that utilizing the duration approach, along
with the USGS mass balance models and other information is appropriate for this TMDL:
1. The May 1 – September 30 SR-HC TMDL TP allocation identified for the lower Boise River
is concentration-based. Therefore, flow is directly related to the water quality target and load
capacity.
2. The May 1 – September 30 R2 correlation values between TP loads and concentrations,
relative to flows at Parma, were 0.84 and 0.57.
3. The USGS mass balance model results suggest that biogeochemical processes, including
uptake by plants, may have had a limited effect on main-stem TP concentrations in August
2012 (Etheridge 2013).
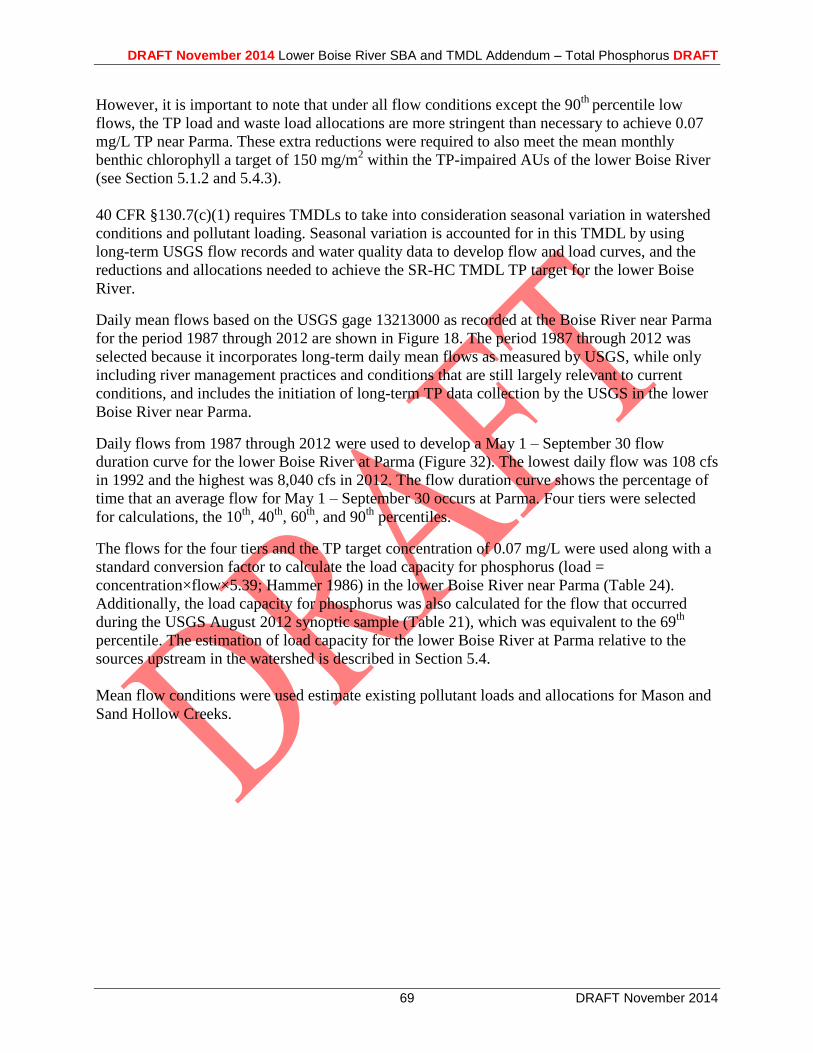
DRAFT November 2014 Lower Boise River SBA and TMDL Addendum – Total Phosphorus DRAFT
69 DRAFT November 2014
However, it is important to note that under all flow conditions except the 90th
percentile low
flows, the TP load and waste load allocations are more stringent than necessary to achieve 0.07
mg/L TP near Parma. These extra reductions were required to also meet the mean monthly
benthic chlorophyll a target of 150 mg/m2 within the TP-impaired AUs of the lower Boise River
(see Section 5.1.2 and 5.4.3).
40 CFR §130.7(c)(1) requires TMDLs to take into consideration seasonal variation in watershed
conditions and pollutant loading. Seasonal variation is accounted for in this TMDL by using
long-term USGS flow records and water quality data to develop flow and load curves, and the
reductions and allocations needed to achieve the SR-HC TMDL TP target for the lower Boise
River.
Daily mean flows based on the USGS gage 13213000 as recorded at the Boise River near Parma
for the period 1987 through 2012 are shown in Figure 18. The period 1987 through 2012 was
selected because it incorporates long-term daily mean flows as measured by USGS, while only
including river management practices and conditions that are still largely relevant to current
conditions, and includes the initiation of long-term TP data collection by the USGS in the lower
Boise River near Parma.
Daily flows from 1987 through 2012 were used to develop a May 1 – September 30 flow
duration curve for the lower Boise River at Parma (Figure 32). The lowest daily flow was 108 cfs
in 1992 and the highest was 8,040 cfs in 2012. The flow duration curve shows the percentage of
time that an average flow for May 1 – September 30 occurs at Parma. Four tiers were selected
for calculations, the 10th
, 40th
, 60th
, and 90th
percentiles.
The flows for the four tiers and the TP target concentration of 0.07 mg/L were used along with a
standard conversion factor to calculate the load capacity for phosphorus (load =
concentration×flow×5.39; Hammer 1986) in the lower Boise River near Parma (Table 24).
Additionally, the load capacity for phosphorus was also calculated for the flow that occurred
during the USGS August 2012 synoptic sample (Table 21), which was equivalent to the 69th
percentile. The estimation of load capacity for the lower Boise River at Parma relative to the
sources upstream in the watershed is described in Section 5.4.
Mean flow conditions were used estimate existing pollutant loads and allocations for Mason and
Sand Hollow Creeks.
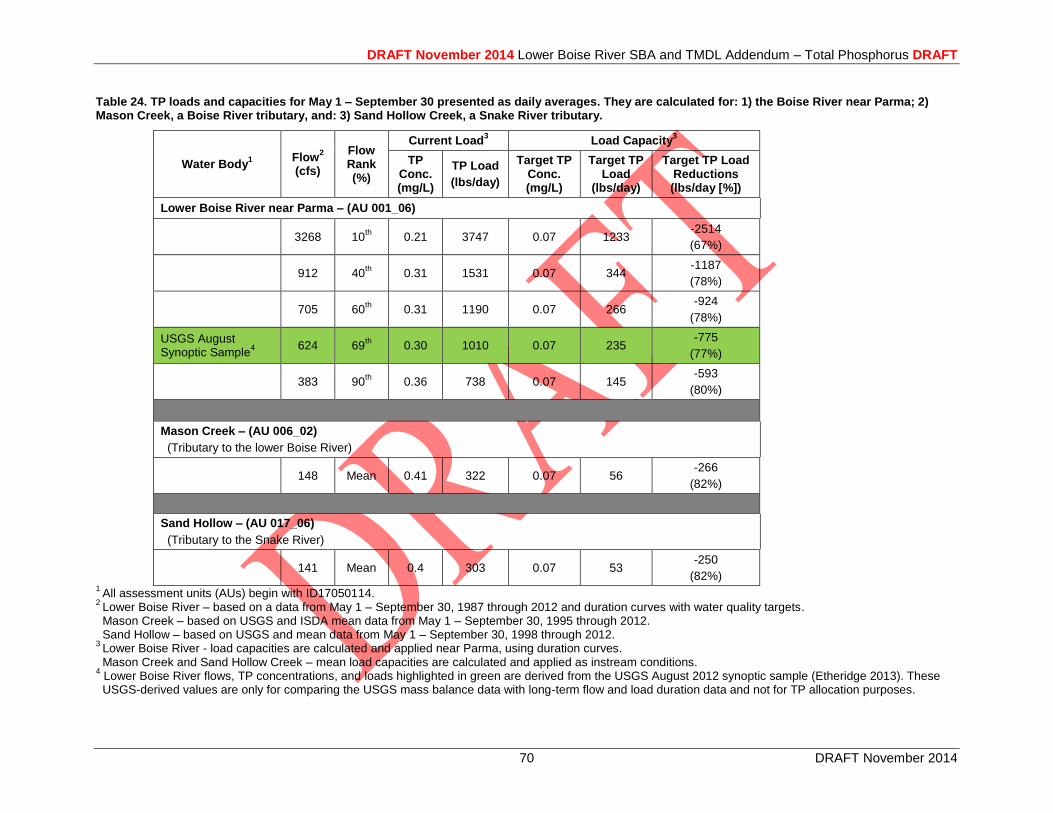
DRAFT November 2014 Lower Boise River SBA and TMDL Addendum – Total Phosphorus DRAFT
70 DRAFT November 2014
Table 24. TP loads and capacities for May 1 – September 30 presented as daily averages. They are calculated for: 1) the Boise River near Parma; 2) Mason Creek, a Boise River tributary, and: 3) Sand Hollow Creek, a Snake River tributary.
Water Body1
Flow2
(cfs)
Flow Rank (%)
Current Load3
Load Capacity3
TP Conc. (mg/L)
TP Load
(lbs/day)
Target TP Conc. (mg/L)
Target TP Load
(lbs/day)
Target TP Load Reductions (lbs/day [%])
Lower Boise River near Parma – (AU 001_06)
3268 10th 0.21 3747 0.07 1233
-2514
(67%)
912 40th 0.31 1531 0.07 344
-1187
(78%)
705 60th 0.31 1190 0.07 266
-924
(78%)
USGS August Synoptic Sample
4 624 69th
0.30 1010 0.07 235 -775
(77%)
383 90
th 0.36 738 0.07 145
-593
(80%)
Mason Creek – (AU 006_02)
(Tributary to the lower Boise River)
148 Mean 0.41 322 0.07 56
-266
(82%)
Sand Hollow – (AU 017_06)
(Tributary to the Snake River)
141 Mean 0.4 303 0.07 53
-250
(82%) 1
All assessment units (AUs) begin with ID17050114. 2
Lower Boise River – based on a data from May 1 – September 30, 1987 through 2012 and duration curves with water quality targets. Mason Creek – based on USGS and ISDA mean data from May 1 – September 30, 1995 through 2012. Sand Hollow – based on USGS and mean data from May 1 – September 30, 1998 through 2012. 3
Lower Boise River - load capacities are calculated and applied near Parma, using duration curves. Mason Creek and Sand Hollow Creek – mean load capacities are calculated and applied as instream conditions. 4 Lower Boise River flows, TP concentrations, and loads highlighted in green are derived from the USGS August 2012 synoptic sample (Etheridge 2013). These
USGS-derived values are only for comparing the USGS mass balance data with long-term flow and load duration data and not for TP allocation purposes.
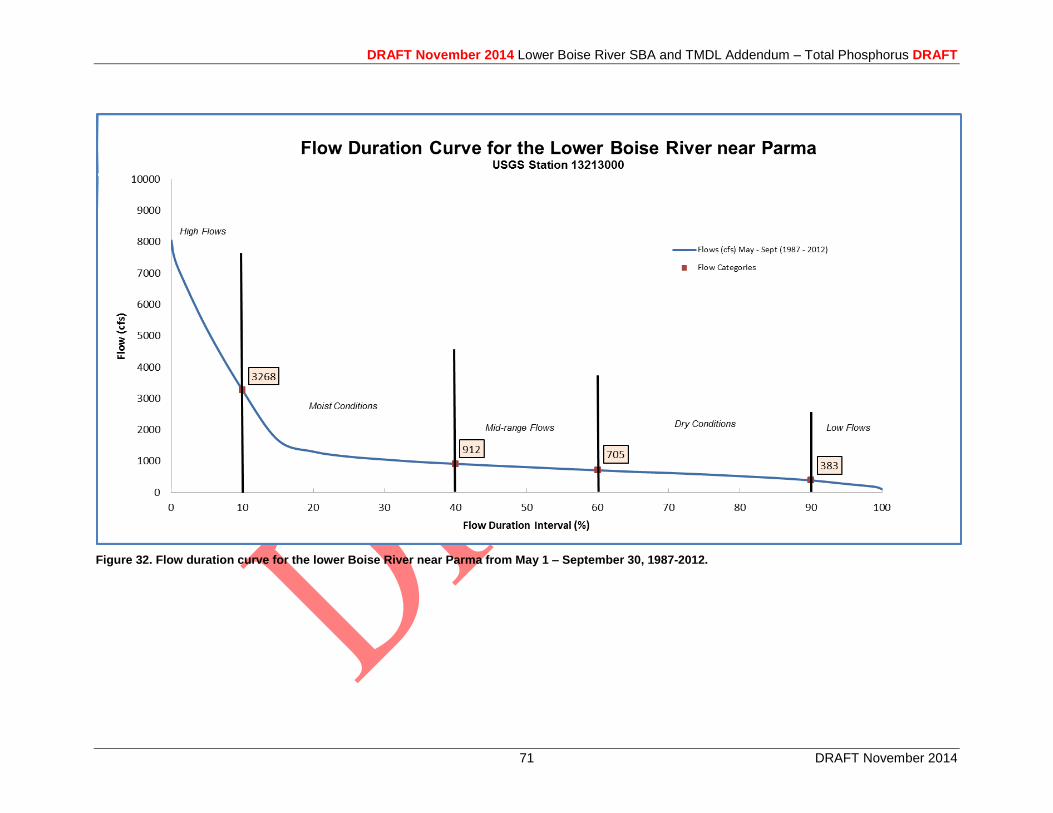
DRAFT November 2014 Lower Boise River SBA and TMDL Addendum – Total Phosphorus DRAFT
71 DRAFT November 2014
Figure 32. Flow duration curve for the lower Boise River near Parma from May 1 – September 30, 1987-2012.

DRAFT November 2014 Lower Boise River SBA and TMDL Addendum – Total Phosphorus DRAFT
72 DRAFT November 2014
Figure 33. Long-term TP concentrations for the lower Boise River in relation to the concentration target of < 0.07 mg/L May 1 – September 30. Note: DEQ excluded a potential outlier data point from the figure and analyses due to disproportionate influence: a TP concentration of 2 mg/L associated with an 80
th percentile flow on September 21, 1988.
DRAFT November 2014 Lower Boise River SBA and TMDL Addendum – Total Phosphorus DRAFT
73 DRAFT November 2014
Figure 34. Long-term TP loads for the lower Boise River in relation to the TP load equivalent target of < 0.07 mg/L May 1 – September 30. Note: DEQ excluded a potential outlier data point from the figure and analyses due to disproportionate influence: a TP load of 5544 lbs/day associated with an 80.5
th percentile flow on September 21, 1988.
DRAFT November 2014 Lower Boise River SBA and TMDL Addendum – Total Phosphorus DRAFT
74 DRAFT November 2014
5.2.2 TP Load Capacity to Meet Mean Monthly Benthic Chlorophyll-a Target of < 150 mg/m2
The AQUATOX model was used to assess the load capacity for TP and benthic algae for the
lower Boise River, as a function of multiple parameters included within the model. Further
analyses are described in the Lower Boise River Total Phosphorus AQUATOX Model Report
(DEQ 2014a).
The load capacity is the summation of TP inputs to the AQUATOX model under which
simulation results achieve the mean monthly periphyton target. There are multiple combinations
of TP inputs from sources that may mathematically achieve the selected target. The division of
the load capacity to the sources upstream in the watershed is described in Section 5.4. The
particular combination of pollutants chosen for the TMDL is based on a number of factors
including the characteristics of the watershed, the results of the USGS August 2012, October
2012, and March 2013 mass balance models (Etheridge 2013), and previous studies of the
watershed.
Figure 35 shows the results of USGS benthic chlorophyll a sampling between 1995 and 2013.
These results reflect a range of elevated periphyton at several locations between October-
November and January-March. However, these results also demonstrate that the majority of data
have historically been collected during October and November, with relatively fewer data being
observed the remainder of the year.
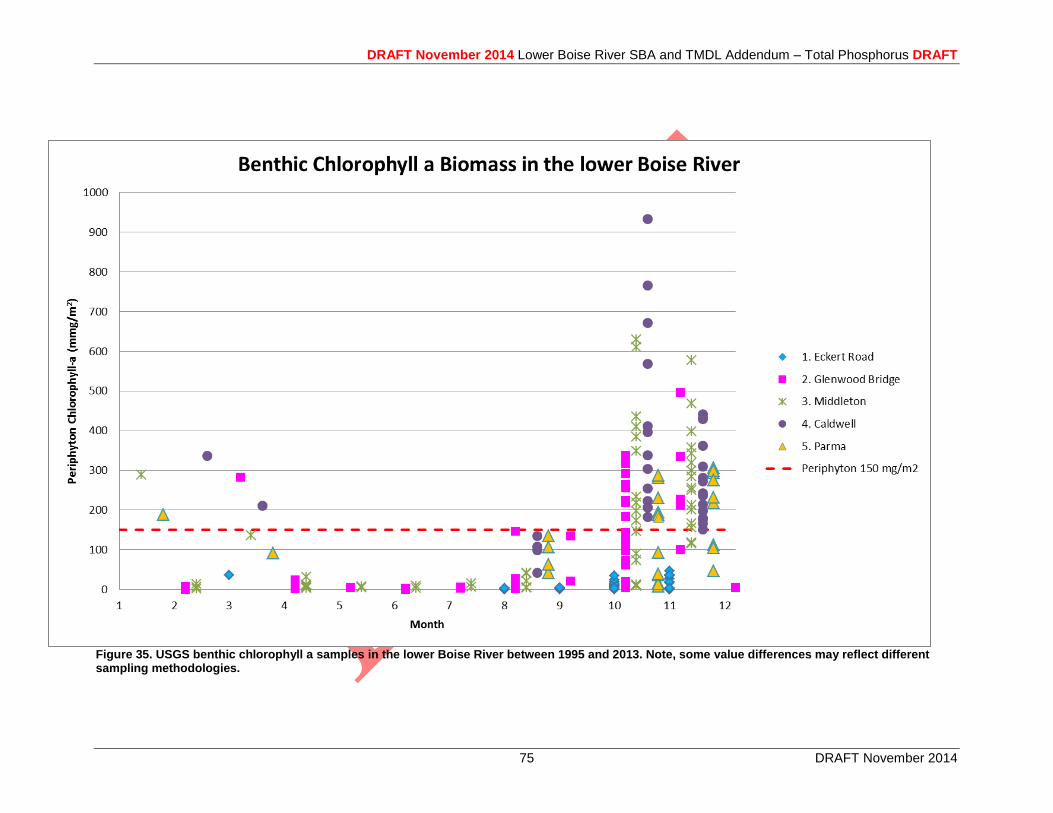
DRAFT November 2014 Lower Boise River SBA and TMDL Addendum – Total Phosphorus DRAFT
75 DRAFT November 2014
Figure 35. USGS benthic chlorophyll a samples in the lower Boise River between 1995 and 2013. Note, some value differences may reflect different sampling methodologies.
DRAFT November 2014 Lower Boise River SBA and TMDL Addendum – Total Phosphorus DRAFT
76 DRAFT November 2014
5.3 Estimates of Existing Pollutant Loads
Regulations allow that loadings “...may range from reasonably accurate estimates to gross
allotments, depending on the availability of data and appropriate techniques for predicting the
loading” (40 CFR 130.2(g)). An estimate must be made for each point source. Nonpoint sources
are typically estimated based on the type of source or land area. To the extent possible,
background loads should be distinguished from human-caused increases in nonpoint loads.
5.3.1 Boise River and Mason Creek TP Loads (May 1 – September 30)
Background
A background TP concentration of 0.018 mg/L is based on the 2005 – 2013 USGS TP data at
Diversion Dam with detection levels of 0.01 mg/L (see Section 3.2.2).
NPDES-Permitted Point Sources
Point source contributions were calculated from facility-supplied data and/or discharge
monitoring reports (DMR) from May 1 – September 30, 2012, as available (Table 25). This time
period was chosen to utilize the most recent data available and accurately capture the current
conditions. It is assumed that point source loadings remain relatively independent of various
Boise River flow scenarios, and in turn are more dependent on factors such as population,
service area, etc.
Stormwater
Existing stormwater TP contributions were derived from data provided by the LBWC stormwater
workgroup (Appendix E) through several workgroup meetings and correspondence (Table 26).
These data were developed for May 1 – September 30 for MS4-permitted and non-permitted
areas. The stormwater dry weather data primarily represent “pass through” flows and loads that
are attributed to and measured as ground water and agricultural returns in tributaries and drains.
Stormwater wet weather flows represent specific precipitation (storm) events that are not
represented as part of the USGS August 2012 synoptic sample, and may be underrepresented in
other long-term river monitoring data not specifically focusing on these flows and loads. Finally,
it is assumed that stormwater loadings remain relatively independent of various Boise River flow
conditions, and in turn are more dependent on factors such as population, service area, specific
storm events, etc.
Nonpoint Source Tributary, Ground Water, and Unmeasured
Agricultural nonpoint source tributary contributions were calculated from available USGS and
ISDA data for May 1 – September 30 from 1983 through 2013, as available (Table 27). This
long-term data was selected due to temporal and spatial paucity of data and in order to moderate
the intra- and inter-annual variation that can result from varying precipitation, runoff,
temperature, and water use regimes. Flow, TP concentrations, and loads are also presented by
removing the flows and TP loads attributed to NPDES-permitted facilities.
DRAFT November 2014 Lower Boise River SBA and TMDL Addendum – Total Phosphorus DRAFT
77 DRAFT November 2014
Ground water and unmeasured contributions were calculated from the August 2012 synoptic
sampling effort in the lower Boise River subbasin (Etheridge 2013) and further derived from
professional judgment to adjust ground water interactions under various flow scenarios (Alex
Etheridge, pers. comm. 2014). This data represents the best and most current ground water and
unmeasured flow data for the lower Boise River.
Additional Assumptions
Lower Boise River TP inputs do not translate directly into TP loads at Parma. Instead, TP inputs
relative to TP loadings at Parma were calculated over various flow scenarios to develop delivery
ratios. An assumption of this approach is that TP from each source has similar potential to reach
Parma. This simplified assumption facilitates the use of calculations to quantify potential loading
without requiring complex assumptions about TP use and reuse throughout the watershed.
Conversely, a limitation of this assumption is that the lower Boise River watershed is much more
dynamic than potentially represented by simple ratios. However, trying to further refine
calculations to estimate individual TP sources relative to loads measured at Parma would add
additional layers of complexity, assumptions, and speculation about how TP moves through the
system. And although measured data are readily available regarding the TP inputs from various
point-and nonpoint sources throughout the watershed, as well as the TP loads measured at
Parma, the movement of TP through, and the interrelationships among the complex plumbing,
water re-use, agricultural drains and tributaries, ground water, and other biogeochemical
processes are not well-understood.
The USGS August 2012 mass balance model (Etheridge 2013) was used to identify contributing
source flows and loads for the time period measured (e.g. August 2012 with Boise River flows
near Parma at 624 cfs) and to help derive approximate ground water flows associated with the
various flow scenarios in the lower Boise River near Parma. However, upon recommendation
from the USGS model developer (Alex Etheridge, pers. comm. 2014), the mass balance model
was not utilized to estimate lower Boise River TP concentrations or loads near Parma under
adjusted flows scenarios. This is because altering river flows in the mass balance model also
requires altering ground water, tributary, background, and WWTF flows throughout the system
to maintain the balance. The complex relationships among the various sources under changing
flow conditions are not well understood and would require utilizing additional speculation.
Further, although the mass balance model clearly illustrates the flow and TP relationships
throughout the river during one week in August 2012 when flows near Parma were 624 cfs, it
does not account for varying flow and TP relationships in the subbasin.
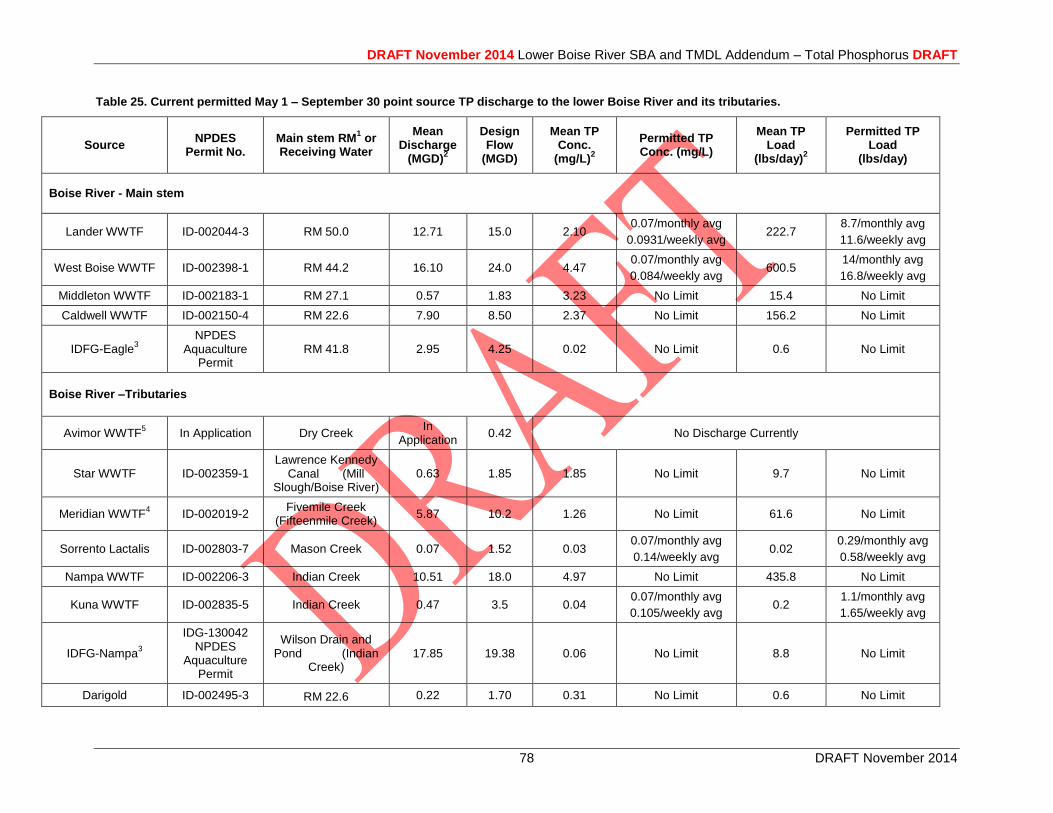
DRAFT November 2014 Lower Boise River SBA and TMDL Addendum – Total Phosphorus DRAFT
78 DRAFT November 2014
Table 25. Current permitted May 1 – September 30 point source TP discharge to the lower Boise River and its tributaries.
Source NPDES
Permit No. Main stem RM
1 or
Receiving Water
Mean Discharge
(MGD)2
Design Flow
(MGD)
Mean TP Conc.
(mg/L)2
Permitted TP Conc. (mg/L)
Mean TP Load
(lbs/day)2
Permitted TP Load
(lbs/day)
Boise River - Main stem
Lander WWTF ID-002044-3 RM 50.0 12.71 15.0 2.10 0.07/monthly avg
0.0931/weekly avg 222.7
8.7/monthly avg
11.6/weekly avg
West Boise WWTF ID-002398-1 RM 44.2 16.10 24.0 4.47 0.07/monthly avg
0.084/weekly avg 600.5
14/monthly avg
16.8/weekly avg
Middleton WWTF ID-002183-1 RM 27.1 0.57 1.83 3.23 No Limit 15.4 No Limit
Caldwell WWTF ID-002150-4 RM 22.6 7.90 8.50 2.37 No Limit 156.2 No Limit
IDFG-Eagle3
NPDES Aquaculture
Permit RM 41.8 2.95 4.25 0.02 No Limit 0.6 No Limit
Boise River –Tributaries
Avimor WWTF5 In Application Dry Creek
In Application
0.42 No Discharge Currently
Star WWTF ID-002359-1 Lawrence Kennedy
Canal (Mill Slough/Boise River)
0.63 1.85 1.85 No Limit 9.7 No Limit
Meridian WWTF4
ID-002019-2 Fivemile Creek
(Fifteenmile Creek) 5.87 10.2 1.26 No Limit 61.6 No Limit
Sorrento Lactalis ID-002803-7 Mason Creek 0.07 1.52 0.03 0.07/monthly avg
0.14/weekly avg 0.02
0.29/monthly avg
0.58/weekly avg
Nampa WWTF ID-002206-3 Indian Creek 10.51 18.0 4.97 No Limit 435.8 No Limit
Kuna WWTF ID-002835-5 Indian Creek 0.47 3.5 0.04 0.07/monthly avg
0.105/weekly avg 0.2
1.1/monthly avg
1.65/weekly avg
IDFG-Nampa3
IDG-130042 NPDES
Aquaculture Permit
Wilson Drain and Pond (Indian
Creek) 17.85 19.38 0.06 No Limit 8.8 No Limit
Darigold ID-002495-3 RM 22.6 0.22 1.70 0.31 No Limit 0.6 No Limit
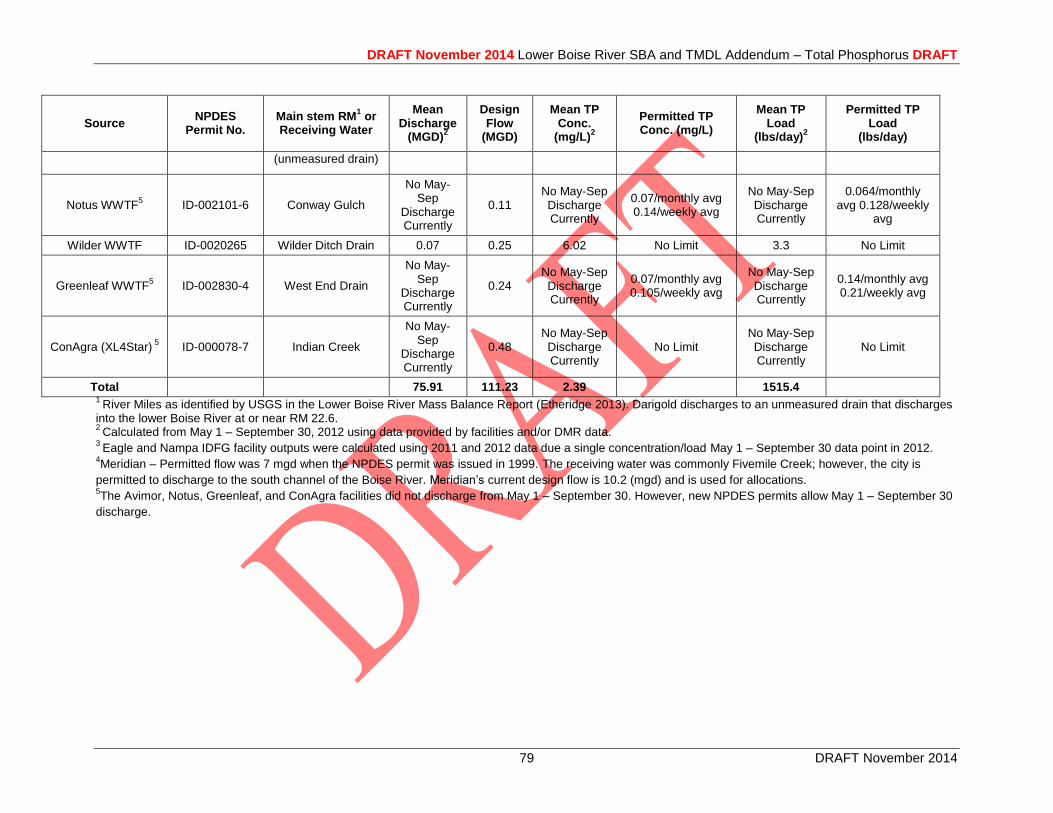
DRAFT November 2014 Lower Boise River SBA and TMDL Addendum – Total Phosphorus DRAFT
79 DRAFT November 2014
Source NPDES
Permit No. Main stem RM
1 or
Receiving Water
Mean Discharge
(MGD)2
Design Flow
(MGD)
Mean TP Conc.
(mg/L)2
Permitted TP Conc. (mg/L)
Mean TP Load
(lbs/day)2
Permitted TP Load
(lbs/day)
(unmeasured drain)
Notus WWTF5 ID-002101-6 Conway Gulch
No May-Sep
Discharge Currently
0.11 No May-Sep Discharge Currently
0.07/monthly avg 0.14/weekly avg
No May-Sep Discharge Currently
0.064/monthly avg 0.128/weekly
avg
Wilder WWTF ID-0020265 Wilder Ditch Drain 0.07 0.25 6.02 No Limit 3.3 No Limit
Greenleaf WWTF5
ID-002830-4 West End Drain
No May-Sep
Discharge Currently
0.24 No May-Sep Discharge Currently
0.07/monthly avg 0.105/weekly avg
No May-Sep Discharge Currently
0.14/monthly avg 0.21/weekly avg
ConAgra (XL4Star) 5 ID-000078-7 Indian Creek
No May-Sep
Discharge Currently
0.48 No May-Sep Discharge Currently
No Limit No May-Sep Discharge Currently
No Limit
Total 75.91 111.23 2.39 1515.4 1
River Miles as identified by USGS in the Lower Boise River Mass Balance Report (Etheridge 2013). Darigold discharges to an unmeasured drain that discharges into the lower Boise River at or near RM 22.6. 2
Calculated from May 1 – September 30, 2012 using data provided by facilities and/or DMR data. 3
Eagle and Nampa IDFG facility outputs were calculated using 2011 and 2012 data due a single concentration/load May 1 – September 30 data point in 2012. 4Meridian – Permitted flow was 7 mgd when the NPDES permit was issued in 1999. The receiving water was commonly Fivemile Creek; however, the city is
permitted to discharge to the south channel of the Boise River. Meridian’s current design flow is 10.2 (mgd) and is used for allocations. 5The Avimor, Notus, Greenleaf, and ConAgra facilities did not discharge from May 1 – September 30. However, new NPDES permits allow May 1 – September 30
discharge.
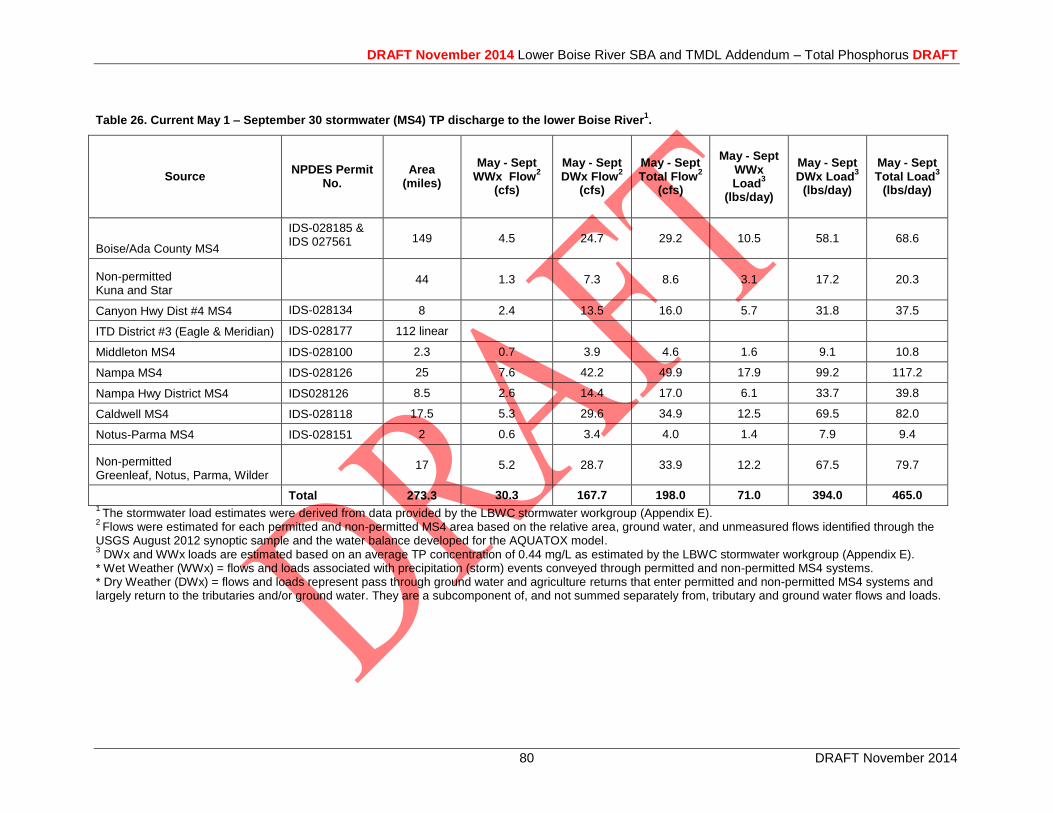
DRAFT November 2014 Lower Boise River SBA and TMDL Addendum – Total Phosphorus DRAFT
80 DRAFT November 2014
Table 26. Current May 1 – September 30 stormwater (MS4) TP discharge to the lower Boise River
1.
Source NPDES Permit
No. Area
(miles)
May - Sept WWx Flow
2
(cfs)
May - Sept DWx Flow
2
(cfs)
May - Sept Total Flow
2
(cfs)
May - Sept WWx Load
3
(lbs/day)
May - Sept DWx Load
3
(lbs/day)
May - Sept Total Load
3
(lbs/day)
Boise/Ada County MS4
IDS-028185 & IDS 027561 149 4.5 24.7 29.2 10.5 58.1 68.6
Non-permitted Kuna and Star
44 1.3 7.3 8.6 3.1 17.2 20.3
Canyon Hwy Dist #4 MS4 IDS-028134 8 2.4 13.5 16.0 5.7 31.8 37.5
ITD District #3 (Eagle & Meridian) IDS-028177 112 linear
Middleton MS4 IDS-028100 2.3 0.7 3.9 4.6 1.6 9.1 10.8
Nampa MS4 IDS-028126 25 7.6 42.2 49.9 17.9 99.2 117.2
Nampa Hwy District MS4 IDS028126 8.5 2.6 14.4 17.0 6.1 33.7 39.8
Caldwell MS4 IDS-028118 17.5 5.3 29.6 34.9 12.5 69.5 82.0
Notus-Parma MS4 IDS-028151 2 0.6 3.4 4.0 1.4 7.9 9.4
Non-permitted Greenleaf, Notus, Parma, Wilder
17 5.2 28.7 33.9 12.2 67.5 79.7
Total 273.3 30.3 167.7 198.0 71.0 394.0 465.0 1
The stormwater load estimates were derived from data provided by the LBWC stormwater workgroup (Appendix E). 2
Flows were estimated for each permitted and non-permitted MS4 area based on the relative area, ground water, and unmeasured flows identified through the USGS August 2012 synoptic sample and the water balance developed for the AQUATOX model. 3 DWx and WWx loads are estimated based on an average TP concentration of 0.44 mg/L as estimated by the LBWC stormwater workgroup (Appendix E).
* Wet Weather (WWx) = flows and loads associated with precipitation (storm) events conveyed through permitted and non-permitted MS4 systems. * Dry Weather (DWx) = flows and loads represent pass through ground water and agriculture returns that enter permitted and non-permitted MS4 systems and largely return to the tributaries and/or ground water. They are a subcomponent of, and not summed separately from, tributary and ground water flows and loads.
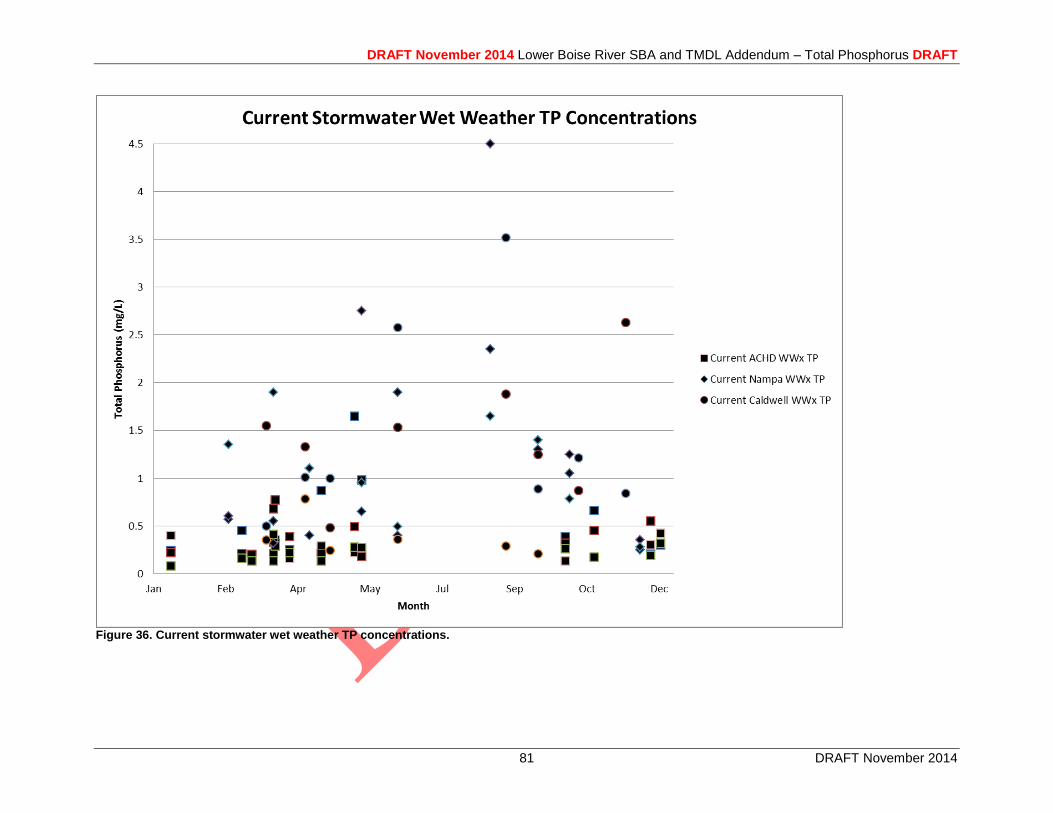
DRAFT November 2014 Lower Boise River SBA and TMDL Addendum – Total Phosphorus DRAFT
81 DRAFT November 2014
Figure 36. Current stormwater wet weather TP concentrations.

DRAFT November 2014 Lower Boise River SBA and TMDL Addendum – Total Phosphorus DRAFT
82 DRAFT November 2014
Table 27. Current May 1 – September 30 tributary TP discharge to the Lower Boise River.
Source Name Lower Boise
River Receiving River Mile (RM)
1
Mean Discharge (cfs)
2
Mean TP Concentration
(mg/L)2
Mean TP Load (lbs/day)
2
Boise River Eagle Drain 42.7 36.3 0.11 22.3 Dry Creek 42.5 6.5 0.16 5.6
Thurman Drain 41.9 15.0 0.11 8.6 Fifteenmile Creek 30.3 131.7 0.31 222.2
Mill Slough 27.2 104.9 0.21 118.2 Willow Creek 27.0 36.1 0.23 44.0
Mason Slough 25.6 13.0 0.22 15.4 Mason Creek 25.0 147.6 0.41 322.1 Hartley Gulch 24.4 39.2 0.27 57.4 Indian Creek 22.4 100.6 0.50 271.6
Conway Gulch 14.2 44.8 0.41 99.7 Dixie Drain 10.5 232.6 0.38 477.2
Total 908.4 Mean = 0.34 1664.4
Tributary Loads excluding WWTF TP Loads
3 May 1 – Sept 30 853.5 Mean = 0.25 1144.3
1 River Miles as identified by USGS in the lower Boise River Mass Balance Report (Etheridge 2013).
2 Values calculated from USGS and ISDA data available from 1983 – 2013.
3 Tributary flows and loads calculated by subtracting WWTF flows and loads.
Table 28. Current May 1 – September 30 ground water/unmeasured and background TP discharge to the Lower Boise River.
Mean Flow
(cfs)2 Mean TP
Conc. (mg/L) Mean TP Load
(lbs/day)
Ground water & unmeasured1 -1390 to 485 0.21 -1573 to 562
Background
2 37 to 317 0.018 68 to 317 1 Ground water and unmeasured flows are estimated from the August 2012 USGS synoptic sampling and mass
balance and professional judgment (Alex Etheridge, pers. comm. 2014). These flows and loads are estimated as negative under 10
th percentile high flow conditions, as the flows and loads are absorbed into near-river terrestrial
zones. 2 Background TP concentration of 0.018 mg/L was utilized based on 2005 – 2013 USGS Diversion Dam data (see
Section 3.2.2).
Based on available information for each source, current loads by sector are presented in Table 29
and Figure 37.
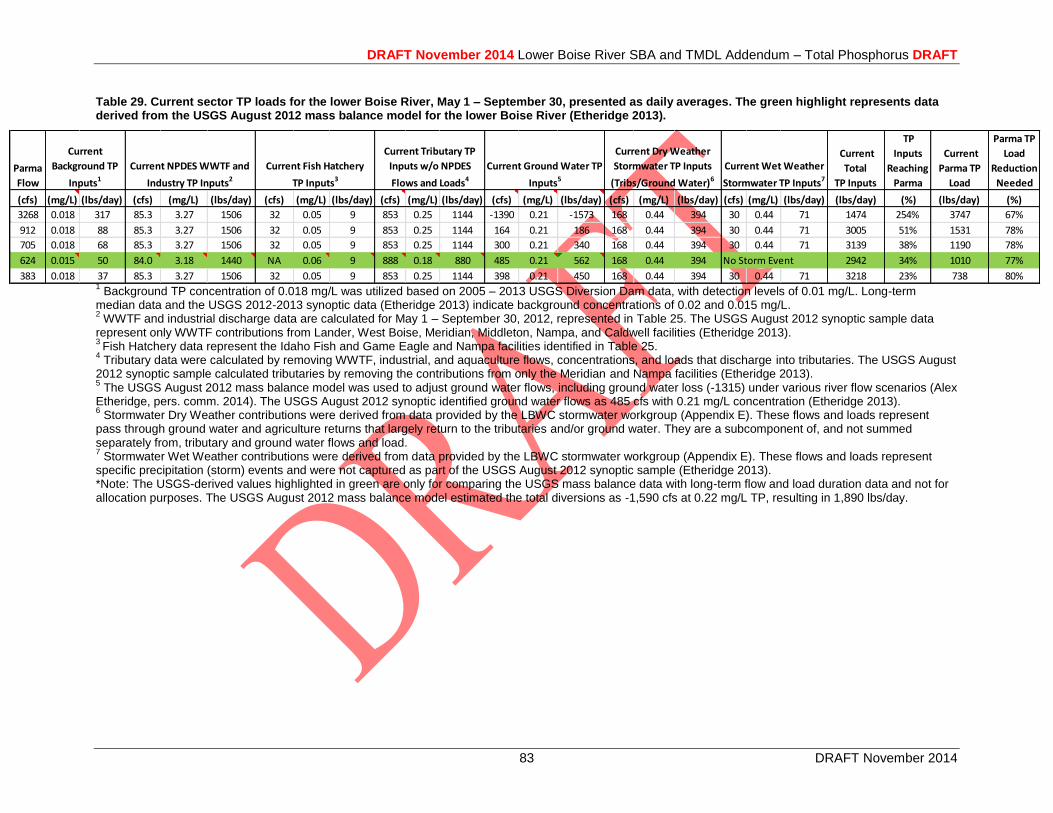
DRAFT November 2014 Lower Boise River SBA and TMDL Addendum – Total Phosphorus DRAFT
83 DRAFT November 2014
Table 29. Current sector TP loads for the lower Boise River, May 1 – September 30, presented as daily averages. The green highlight represents data derived from the USGS August 2012 mass balance model for the lower Boise River (Etheridge 2013).
1 Background TP concentration of 0.018 mg/L was utilized based on 2005 – 2013 USGS Diversion Dam data, with detection levels of 0.01 mg/L. Long-term
median data and the USGS 2012-2013 synoptic data (Etheridge 2013) indicate background concentrations of 0.02 and 0.015 mg/L. 2 WWTF and industrial discharge data are calculated for May 1 – September 30, 2012, represented in Table 25. The USGS August 2012 synoptic sample data
represent only WWTF contributions from Lander, West Boise, Meridian, Middleton, Nampa, and Caldwell facilities (Etheridge 2013). 3
Fish Hatchery data represent the Idaho Fish and Game Eagle and Nampa facilities identified in Table 25. 4 Tributary data were calculated by removing WWTF, industrial, and aquaculture flows, concentrations, and loads that discharge into tributaries. The USGS August
2012 synoptic sample calculated tributaries by removing the contributions from only the Meridian and Nampa facilities (Etheridge 2013). 5 The USGS August 2012 mass balance model was used to adjust ground water flows, including ground water loss (-1315) under various river flow scenarios (Alex
Etheridge, pers. comm. 2014). The USGS August 2012 synoptic identified ground water flows as 485 cfs with 0.21 mg/L concentration (Etheridge 2013). 6 Stormwater Dry Weather contributions were derived from data provided by the LBWC stormwater workgroup (Appendix E). These flows and loads represent
pass through ground water and agriculture returns that largely return to the tributaries and/or ground water. They are a subcomponent of, and not summed separately from, tributary and ground water flows and load. 7 Stormwater Wet Weather contributions were derived from data provided by the LBWC stormwater workgroup (Appendix E). These flows and loads represent
specific precipitation (storm) events and were not captured as part of the USGS August 2012 synoptic sample (Etheridge 2013). *Note: The USGS-derived values highlighted in green are only for comparing the USGS mass balance data with long-term flow and load duration data and not for allocation purposes. The USGS August 2012 mass balance model estimated the total diversions as -1,590 cfs at 0.22 mg/L TP, resulting in 1,890 lbs/day.
Parma
Flow
Current
Total
TP Inputs
TP
Inputs
Reaching
Parma
Current
Parma TP
Load
Parma TP
Load
Reduction
Needed
(cfs) (mg/L) (lbs/day) (cfs) (mg/L) (lbs/day) (cfs) (mg/L) (lbs/day) (cfs) (mg/L) (lbs/day) (cfs) (mg/L) (lbs/day) (cfs) (mg/L) (lbs/day) (cfs) (mg/L) (lbs/day) (lbs/day) (%) (lbs/day) (%)
3268 0.018 317 85.3 3.27 1506 32 0.05 9 853 0.25 1144 -1390 0.21 -1573 168 0.44 394 30 0.44 71 1474 254% 3747 67%
912 0.018 88 85.3 3.27 1506 32 0.05 9 853 0.25 1144 164 0.21 186 168 0.44 394 30 0.44 71 3005 51% 1531 78%
705 0.018 68 85.3 3.27 1506 32 0.05 9 853 0.25 1144 300 0.21 340 168 0.44 394 30 0.44 71 3139 38% 1190 78%
624 0.015 50 84.0 3.18 1440 NA 0.06 9 888 0.18 880 485 0.21 562 168 0.44 394 No Storm Event 2942 34% 1010 77%
383 0.018 37 85.3 3.27 1506 32 0.05 9 853 0.25 1144 398 0.21 450 168 0.44 394 30 0.44 71 3218 23% 738 80%
Current
Background TP
Inputs1
Current Ground Water TP
Inputs5
Current NPDES WWTF and
Industry TP Inputs2
Current Tributary TP
Inputs w/o NPDES
Flows and Loads4
Current Fish Hatchery
TP Inputs3
Current Wet Weather
Stormwater TP Inputs7
Current Dry Weather
Stormwater TP Inputs
(Tribs/Ground Water)6

DRAFT November 2014 Lower Boise River SBA and TMDL Addendum – Total Phosphorus DRAFT
84 DRAFT November 2014
Figure 37. Current TP loads in the lower Boise River from May 1 – September 30, based on average daily total TP inputs of approximately 3121 lbs/day for the 90
th, 60
th, and 40
th percentile flow conditions (the 10
th flow conditions were omitted due to negative ground water flow and loading estimates).
* Wet Weather (WWx) = the flows and loads associated with precipitation (storm) events conveyed through permitted and non-permitted MS4 systems. * Dry Weather (DWx) = the flows and loads that pass through permitted and non-permitted MS4 systems and are a subcomponent of, and not summed separately from, agricultural return water (tributary and/or ground water).
DRAFT November 2014 Lower Boise River SBA and TMDL Addendum – Total Phosphorus DRAFT
85 DRAFT November 2014
5.3.2 Boise River and Mason Creek TP Loads (October 1 – April 30)
Background
A background TP concentration of 0.018 mg/L is based on the 2005 – 2013 USGS TP data (see
Section 3.2.2).
NPDES-Permitted Point Sources
Point source contributions were calculated from facility-supplied data and/or DMRs from
October 1 –April 30, 2012-2013 (Table 30). This time period was chosen to utilize the most
recent data available and accurately capture the current conditions. It is assumed that point
source loadings remain relatively independent of various Boise River flow scenarios, and in turn
are more dependent on factors such as population, service area, etc.
Stormwater
Stormwater contributions were derived from data provided by the LBWC stormwater workgroup
(Appendix E) through several workgroup meetings and correspondence (Table 31). These data
were developed for October 1 – April 30 for MS4-permitted and non-permitted areas. The
stormwater dry weather data primarily represent “pass through” flows and loads that are
attributed to and measured as ground water and agricultural returns in tributaries and drains.
Stormwater wet weather flows represent specific precipitation (storm) events that are not
represented as part of the USGS October 2012 or March 2013 synoptic samples, and may be
underrepresented in other long-term river monitoring data not specifically focusing on these
flows and loads. Finally, it is assumed that stormwater loadings remain relatively independent of
various Boise River flow conditions, and in turn are more dependent on factors such as
population, service area, specific storm events, etc.
Nonpoint Source Tributary, Ground Water, and Unmeasured
Agricultural nonpoint source tributary contributions were calculated from available USGS and
ISDA data for October 1 – April 30 from 1983 through 2013 (Table 32). This long-term data was
selected due to temporal and spatial paucity of data and in order to moderate the intra- and inter-
annual variation that can result from varying precipitation, runoff, temperature, and water use
regimes. Flow, TP concentrations, and loads are also presented by removing the flows and TP
loads attributed to NPDES-permitted facilities.
Ground water, unmeasured, and background contributions were calculated using data from the
October 2012 and March 2013 synoptic sampling effort in the lower Boise River subbasin
(Etheridge 2013) and professional judgment using the October 2012 and March 2013 lower
Boise River mass balance model to adjust ground water interactions in the lower Boise River
under various flow scenarios (Alex Etheridge, pers. comm. 2014). This data represents the best
and most current ground water and unmeasured flow data for the lower Boise River.
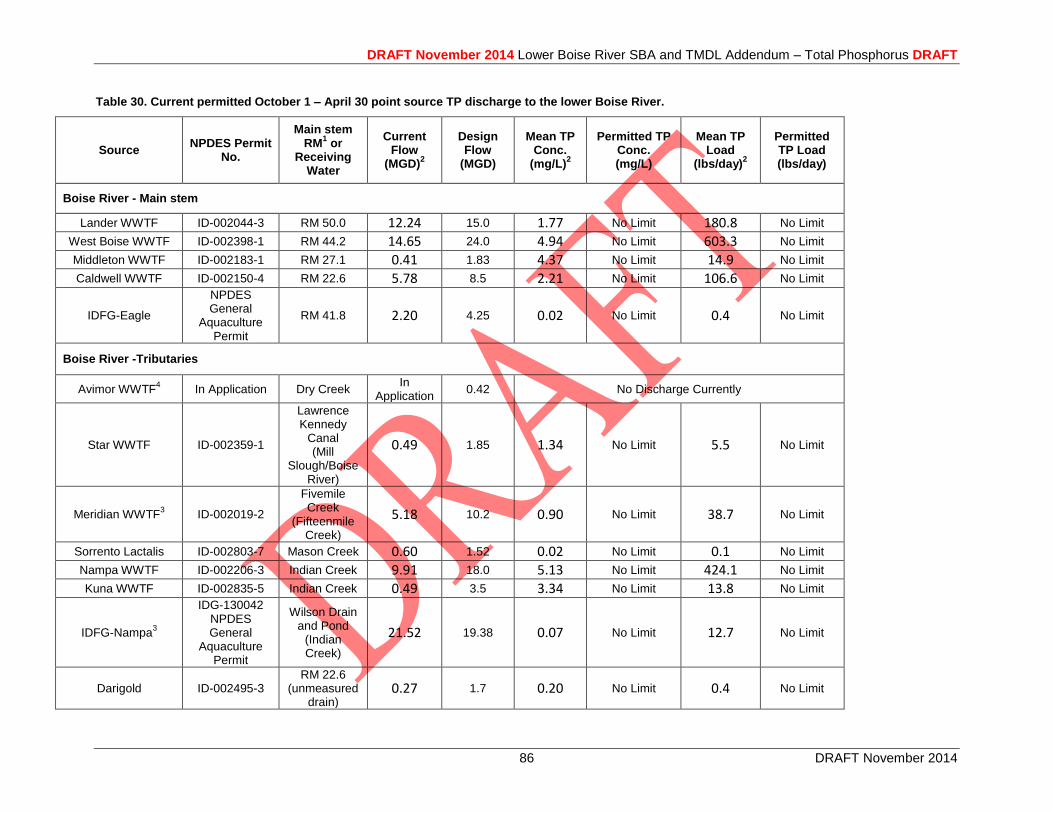
DRAFT November 2014 Lower Boise River SBA and TMDL Addendum – Total Phosphorus DRAFT
86 DRAFT November 2014
Table 30. Current permitted October 1 – April 30 point source TP discharge to the lower Boise River.
Source NPDES Permit
No.
Main stem RM
1 or
Receiving Water
Current Flow
(MGD)2
Design Flow
(MGD)
Mean TP Conc.
(mg/L)2
Permitted TP Conc. (mg/L)
Mean TP Load
(lbs/day)2
Permitted TP Load (lbs/day)
Boise River - Main stem
Lander WWTF ID-002044-3 RM 50.0 12.24 15.0 1.77 No Limit 180.8 No Limit
West Boise WWTF ID-002398-1 RM 44.2 14.65 24.0 4.94 No Limit 603.3 No Limit
Middleton WWTF ID-002183-1 RM 27.1 0.41 1.83 4.37 No Limit 14.9 No Limit
Caldwell WWTF ID-002150-4 RM 22.6 5.78 8.5 2.21 No Limit 106.6 No Limit
IDFG-Eagle
NPDES General
Aquaculture Permit
RM 41.8 2.20 4.25 0.02 No Limit 0.4 No Limit
Boise River -Tributaries
Avimor WWTF4
In Application Dry Creek In
Application 0.42 No Discharge Currently
Star WWTF ID-002359-1
Lawrence Kennedy
Canal (Mill
Slough/Boise River)
0.49 1.85 1.34 No Limit 5.5 No Limit
Meridian WWTF3
ID-002019-2
Fivemile Creek
(Fifteenmile Creek)
5.18 10.2 0.90 No Limit 38.7 No Limit
Sorrento Lactalis ID-002803-7 Mason Creek 0.60 1.52 0.02 No Limit 0.1 No Limit
Nampa WWTF ID-002206-3 Indian Creek 9.91 18.0 5.13 No Limit 424.1 No Limit
Kuna WWTF ID-002835-5 Indian Creek 0.49 3.5 3.34 No Limit 13.8 No Limit
IDFG-Nampa3
IDG-130042 NPDES General
Aquaculture Permit
Wilson Drain and Pond
(Indian Creek)
21.52 19.38 0.07 No Limit 12.7 No Limit
Darigold ID-002495-3 RM 22.6
(unmeasured drain)
0.27 1.7 0.20 No Limit 0.4 No Limit
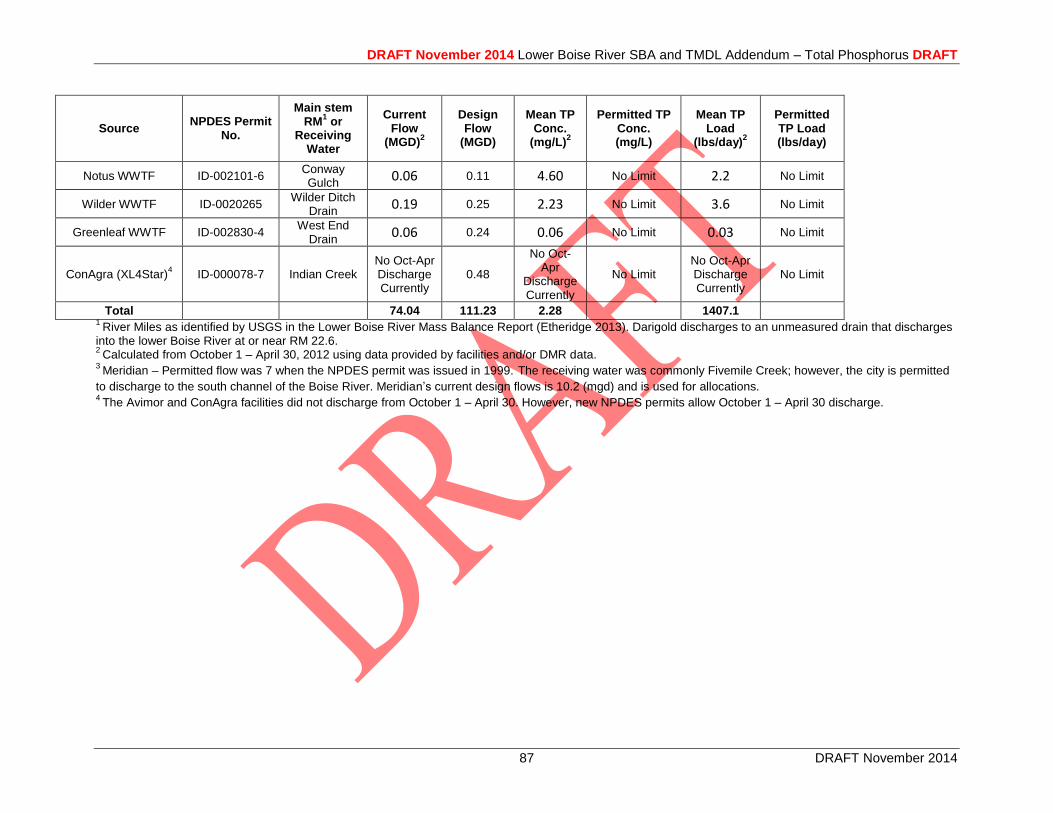
DRAFT November 2014 Lower Boise River SBA and TMDL Addendum – Total Phosphorus DRAFT
87 DRAFT November 2014
Source NPDES Permit
No.
Main stem RM
1 or
Receiving Water
Current Flow
(MGD)2
Design Flow
(MGD)
Mean TP Conc.
(mg/L)2
Permitted TP Conc. (mg/L)
Mean TP Load
(lbs/day)2
Permitted TP Load (lbs/day)
Notus WWTF ID-002101-6 Conway Gulch
0.06 0.11 4.60 No Limit 2.2 No Limit
Wilder WWTF ID-0020265 Wilder Ditch
Drain 0.19 0.25 2.23 No Limit 3.6 No Limit
Greenleaf WWTF
ID-002830-4 West End
Drain 0.06 0.24 0.06 No Limit 0.03 No Limit
ConAgra (XL4Star)4
ID-000078-7 Indian Creek No Oct-Apr Discharge Currently
0.48
No Oct-Apr
Discharge Currently
No Limit No Oct-Apr Discharge Currently
No Limit
Total 74.04 111.23 2.28 1407.1 1
River Miles as identified by USGS in the Lower Boise River Mass Balance Report (Etheridge 2013). Darigold discharges to an unmeasured drain that discharges into the lower Boise River at or near RM 22.6. 2
Calculated from October 1 – April 30, 2012 using data provided by facilities and/or DMR data. 3
Meridian – Permitted flow was 7 when the NPDES permit was issued in 1999. The receiving water was commonly Fivemile Creek; however, the city is permitted
to discharge to the south channel of the Boise River. Meridian’s current design flows is 10.2 (mgd) and is used for allocations. 4
The Avimor and ConAgra facilities did not discharge from October 1 – April 30. However, new NPDES permits allow October 1 – April 30 discharge.
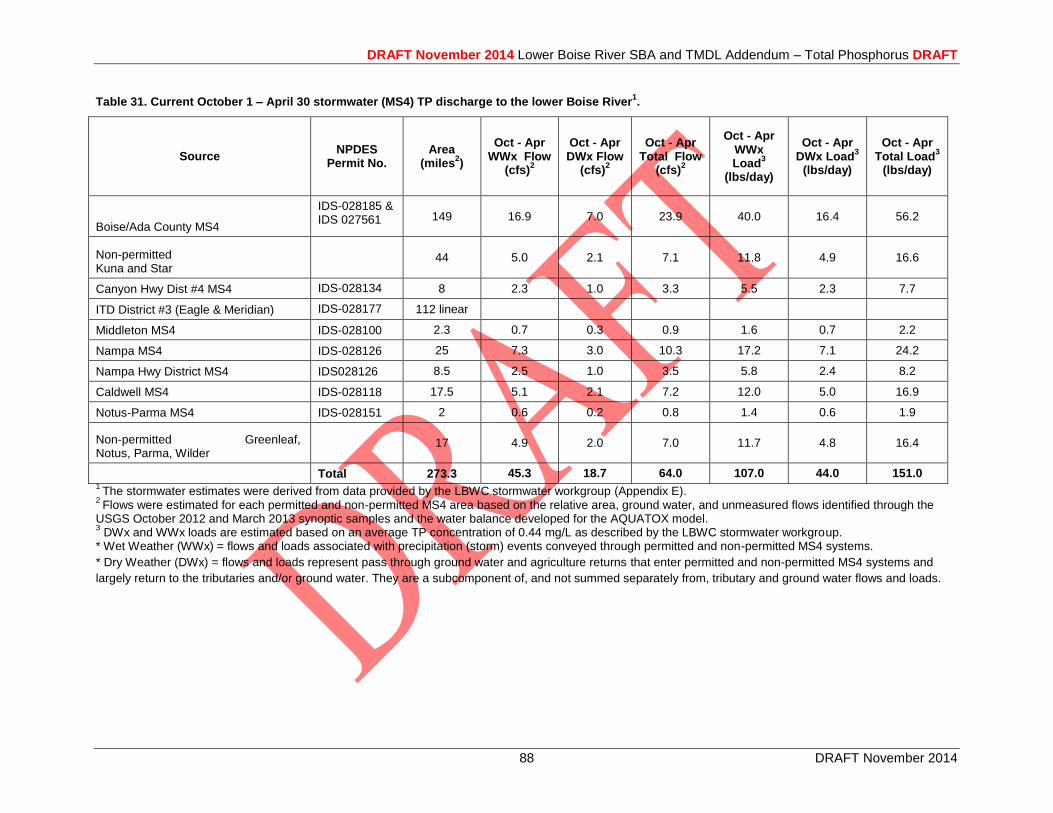
DRAFT November 2014 Lower Boise River SBA and TMDL Addendum – Total Phosphorus DRAFT
88 DRAFT November 2014
Table 31. Current October 1 – April 30 stormwater (MS4) TP discharge to the lower Boise River1.
Source NPDES
Permit No. Area
(miles2)
Oct - Apr WWx Flow
(cfs)2
Oct - Apr DWx Flow
(cfs)2
Oct - Apr Total Flow
(cfs)2
Oct - Apr WWx Load
3
(lbs/day)
Oct - Apr DWx Load
3
(lbs/day)
Oct - Apr Total Load
3
(lbs/day)
Boise/Ada County MS4
IDS-028185 & IDS 027561 149 16.9 7.0 23.9 40.0 16.4 56.2
Non-permitted Kuna and Star
44 5.0 2.1 7.1 11.8 4.9 16.6
Canyon Hwy Dist #4 MS4 IDS-028134 8 2.3 1.0 3.3 5.5 2.3 7.7
ITD District #3 (Eagle & Meridian) IDS-028177 112 linear
Middleton MS4 IDS-028100 2.3 0.7 0.3 0.9 1.6 0.7 2.2
Nampa MS4 IDS-028126 25 7.3 3.0 10.3 17.2 7.1 24.2
Nampa Hwy District MS4 IDS028126 8.5 2.5 1.0 3.5 5.8 2.4 8.2
Caldwell MS4 IDS-028118 17.5 5.1 2.1 7.2 12.0 5.0 16.9
Notus-Parma MS4 IDS-028151 2 0.6 0.2 0.8 1.4 0.6 1.9
Non-permitted Greenleaf, Notus, Parma, Wilder
17 4.9 2.0 7.0 11.7 4.8 16.4
Total 273.3 45.3 18.7 64.0 107.0 44.0 151.0 1
The stormwater estimates were derived from data provided by the LBWC stormwater workgroup (Appendix E). 2
Flows were estimated for each permitted and non-permitted MS4 area based on the relative area, ground water, and unmeasured flows identified through the USGS October 2012 and March 2013 synoptic samples and the water balance developed for the AQUATOX model. 3 DWx and WWx loads are estimated based on an average TP concentration of 0.44 mg/L as described by the LBWC stormwater workgroup.
* Wet Weather (WWx) = flows and loads associated with precipitation (storm) events conveyed through permitted and non-permitted MS4 systems.
* Dry Weather (DWx) = flows and loads represent pass through ground water and agriculture returns that enter permitted and non-permitted MS4 systems and
largely return to the tributaries and/or ground water. They are a subcomponent of, and not summed separately from, tributary and ground water flows and loads.
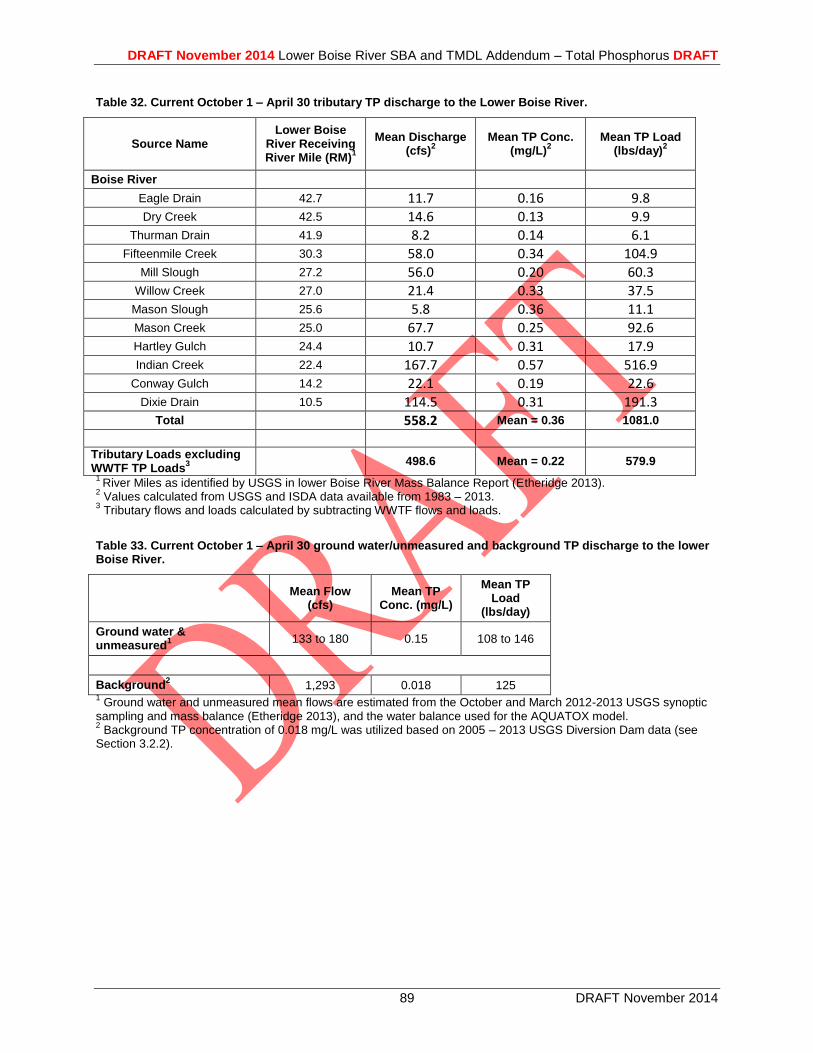
DRAFT November 2014 Lower Boise River SBA and TMDL Addendum – Total Phosphorus DRAFT
89 DRAFT November 2014
Table 32. Current October 1 – April 30 tributary TP discharge to the Lower Boise River.
Source Name Lower Boise
River Receiving River Mile (RM)
1
Mean Discharge (cfs)
2 Mean TP Conc.
(mg/L)2
Mean TP Load (lbs/day)
2
Boise River Eagle Drain 42.7 11.7 0.16 9.8 Dry Creek 42.5 14.6 0.13 9.9
Thurman Drain 41.9 8.2 0.14 6.1 Fifteenmile Creek 30.3 58.0 0.34 104.9
Mill Slough 27.2 56.0 0.20 60.3 Willow Creek 27.0 21.4 0.33 37.5
Mason Slough 25.6 5.8 0.36 11.1 Mason Creek 25.0 67.7 0.25 92.6 Hartley Gulch 24.4 10.7 0.31 17.9 Indian Creek 22.4 167.7 0.57 516.9
Conway Gulch 14.2 22.1 0.19 22.6 Dixie Drain 10.5 114.5 0.31 191.3
Total 558.2 Mean = 0.36 1081.0
Tributary Loads excluding WWTF TP Loads
3 498.6 Mean = 0.22 579.9
1 River Miles as identified by USGS in lower Boise River Mass Balance Report (Etheridge 2013).
2 Values calculated from USGS and ISDA data available from 1983 – 2013.
3 Tributary flows and loads calculated by subtracting WWTF flows and loads.
Table 33. Current October 1 – April 30 ground water/unmeasured and background TP discharge to the lower Boise River.
Mean Flow (cfs)
Mean TP Conc. (mg/L)
Mean TP Load
(lbs/day)
Ground water & unmeasured
1 133 to 180 0.15 108 to 146
Background2
1,293 0.018 125 1 Ground water and unmeasured mean flows are estimated from the October and March 2012-2013 USGS synoptic
sampling and mass balance (Etheridge 2013), and the water balance used for the AQUATOX model. 2 Background TP concentration of 0.018 mg/L was utilized based on 2005 – 2013 USGS Diversion Dam data (see
Section 3.2.2).
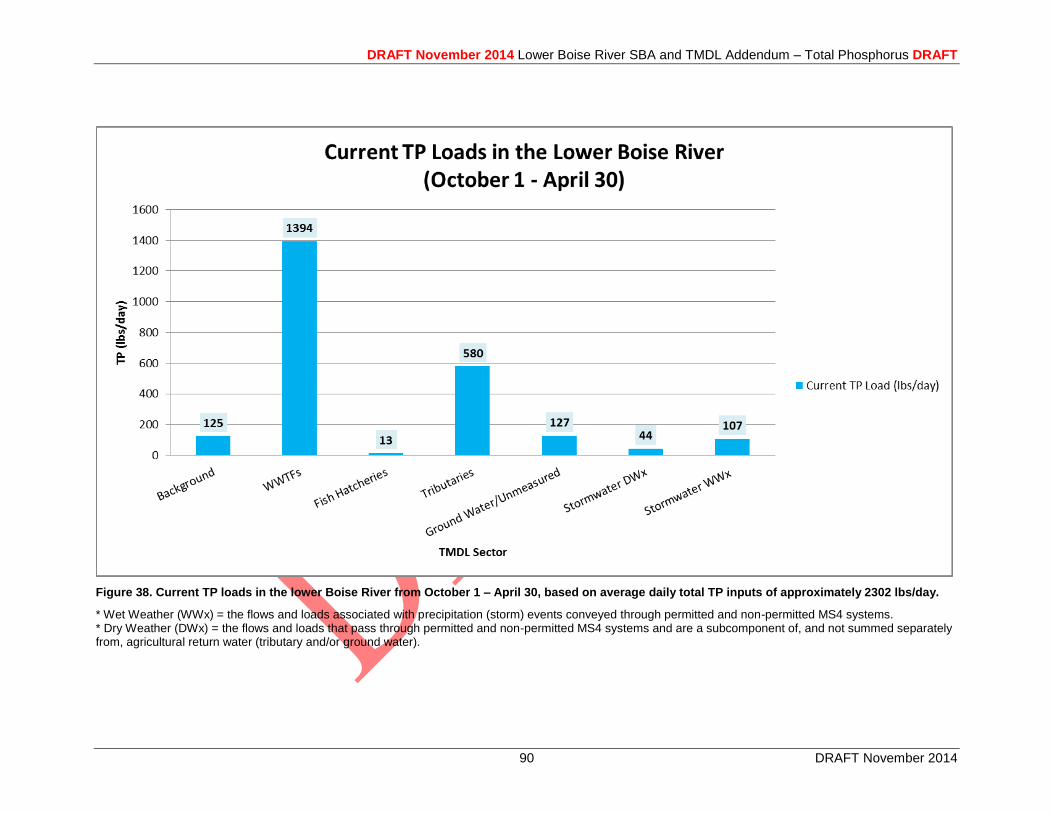
DRAFT November 2014 Lower Boise River SBA and TMDL Addendum – Total Phosphorus DRAFT
90 DRAFT November 2014
Figure 38. Current TP loads in the lower Boise River from October 1 – April 30, based on average daily total TP inputs of approximately 2302 lbs/day.
* Wet Weather (WWx) = the flows and loads associated with precipitation (storm) events conveyed through permitted and non-permitted MS4 systems. * Dry Weather (DWx) = the flows and loads that pass through permitted and non-permitted MS4 systems and are a subcomponent of, and not summed separately from, agricultural return water (tributary and/or ground water).
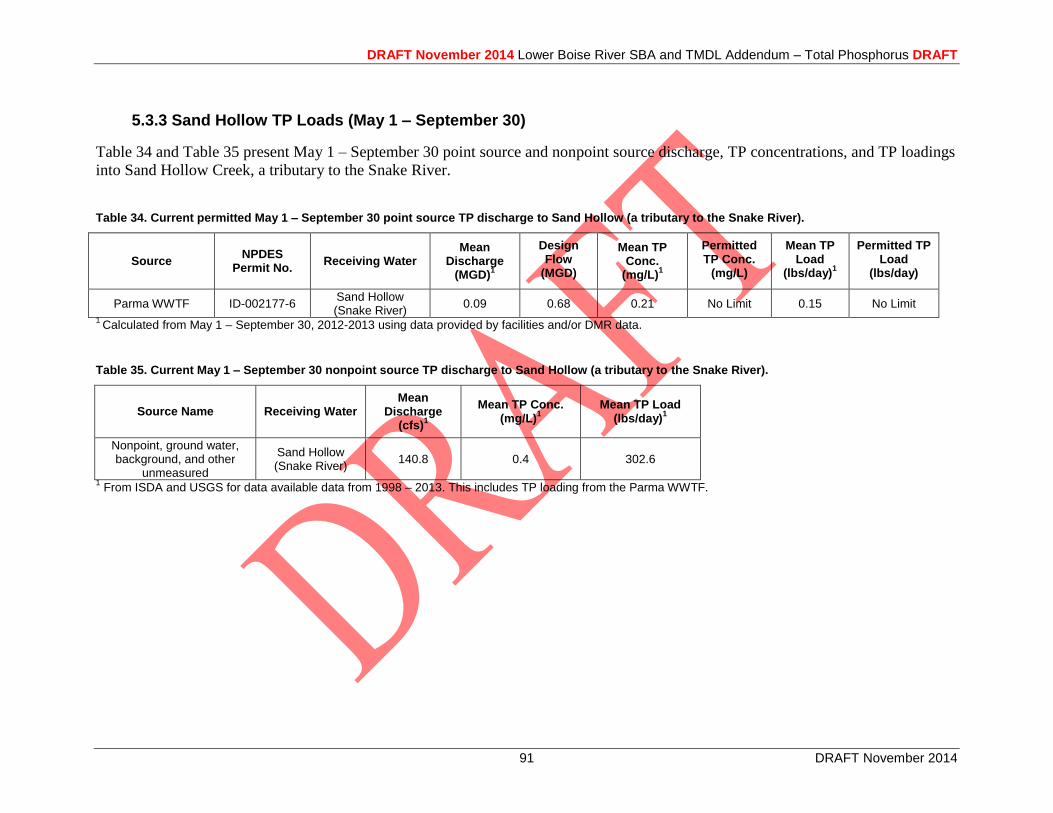
DRAFT November 2014 Lower Boise River SBA and TMDL Addendum – Total Phosphorus DRAFT
91 DRAFT November 2014
5.3.3 Sand Hollow TP Loads (May 1 – September 30)
Table 34 and Table 35 present May 1 – September 30 point source and nonpoint source discharge, TP concentrations, and TP loadings
into Sand Hollow Creek, a tributary to the Snake River.
Table 34. Current permitted May 1 – September 30 point source TP discharge to Sand Hollow (a tributary to the Snake River).
Source NPDES
Permit No. Receiving Water
Mean Discharge
(MGD)1
Design Flow
(MGD)
Mean TP Conc.
(mg/L)1
Permitted TP Conc.
(mg/L)
Mean TP Load
(lbs/day)1
Permitted TP Load
(lbs/day)
Parma WWTF ID-002177-6 Sand Hollow (Snake River)
0.09 0.68 0.21 No Limit 0.15 No Limit
1 Calculated from May 1 – September 30, 2012-2013 using data provided by facilities and/or DMR data.
Table 35. Current May 1 – September 30 nonpoint source TP discharge to Sand Hollow (a tributary to the Snake River).
Source Name Receiving Water
Mean Discharge
(cfs)1
Mean TP Conc. (mg/L)
1 Mean TP Load
(lbs/day)1
Nonpoint, ground water, background, and other
unmeasured
Sand Hollow (Snake River)
140.8 0.4 302.6
1 From ISDA and USGS for data available data from 1998 – 2013. This includes TP loading from the Parma WWTF.
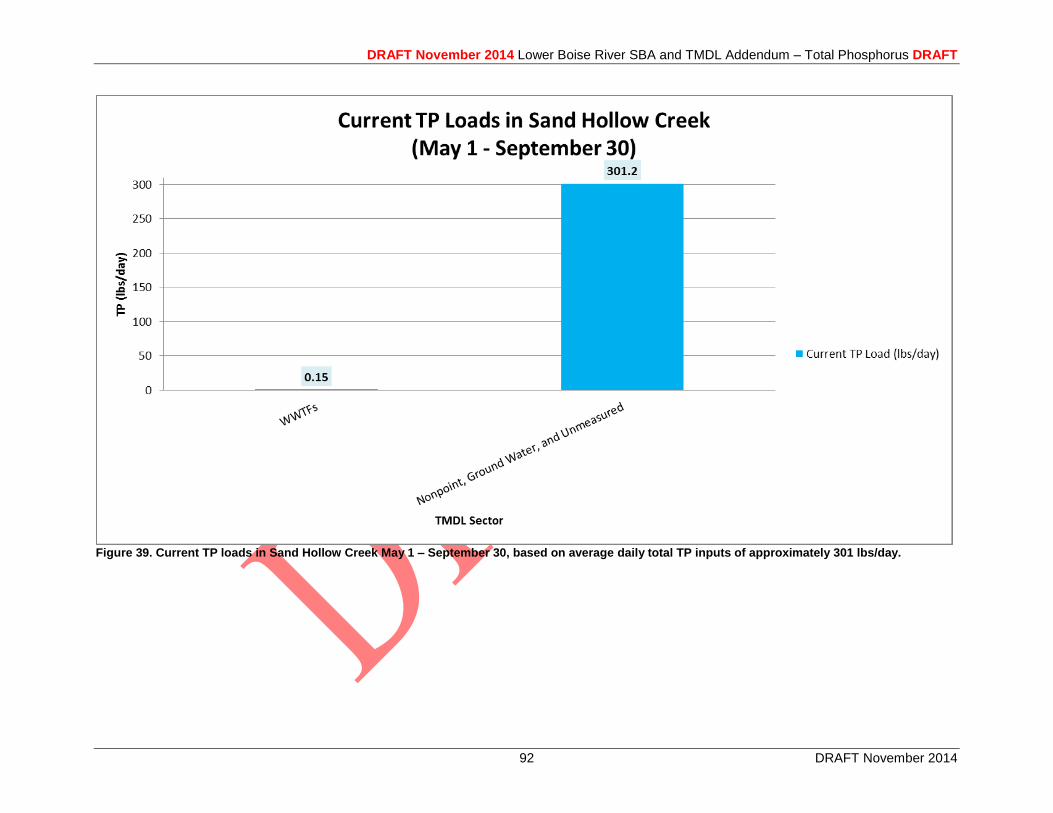
DRAFT November 2014 Lower Boise River SBA and TMDL Addendum – Total Phosphorus DRAFT
92 DRAFT November 2014
Figure 39. Current TP loads in Sand Hollow Creek May 1 – September 30, based on average daily total TP inputs of approximately 301 lbs/day.
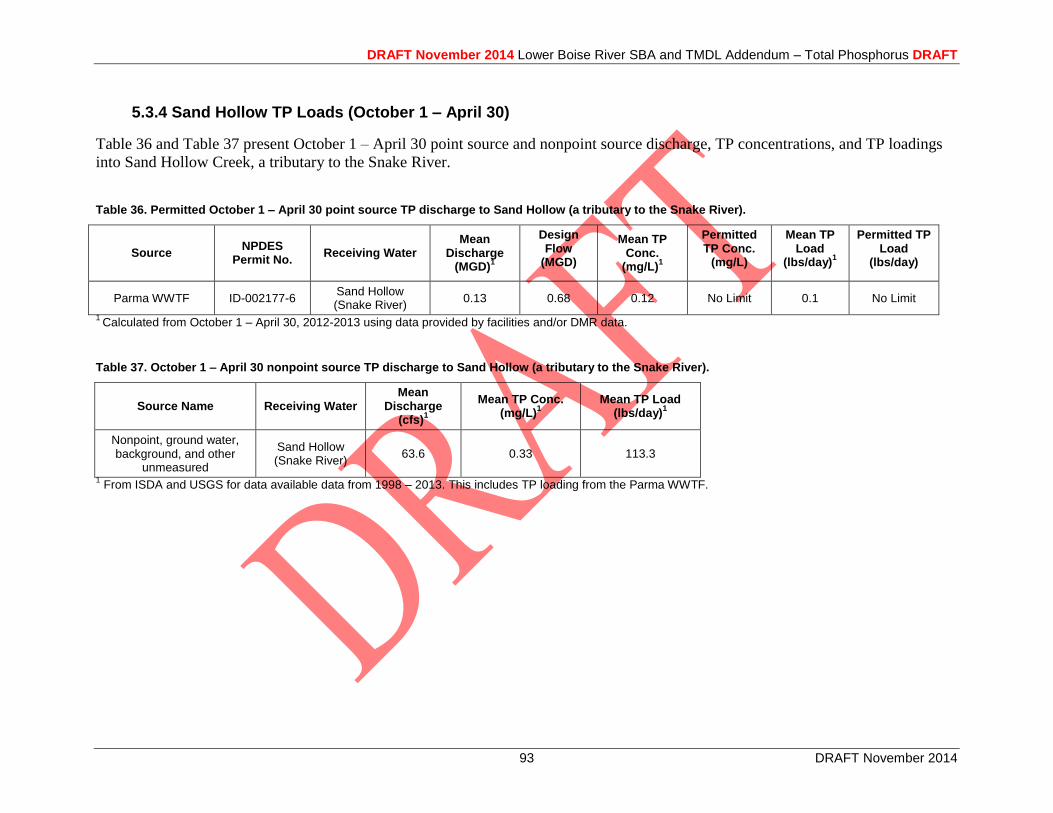
DRAFT November 2014 Lower Boise River SBA and TMDL Addendum – Total Phosphorus DRAFT
93 DRAFT November 2014
5.3.4 Sand Hollow TP Loads (October 1 – April 30)
Table 36 and Table 37 present October 1 – April 30 point source and nonpoint source discharge, TP concentrations, and TP loadings
into Sand Hollow Creek, a tributary to the Snake River.
Table 36. Permitted October 1 – April 30 point source TP discharge to Sand Hollow (a tributary to the Snake River).
Source NPDES
Permit No. Receiving Water
Mean Discharge
(MGD)1
Design Flow
(MGD)
Mean TP Conc.
(mg/L)1
Permitted TP Conc.
(mg/L)
Mean TP Load
(lbs/day)1
Permitted TP Load
(lbs/day)
Parma WWTF ID-002177-6 Sand Hollow (Snake River)
0.13 0.68 0.12 No Limit 0.1 No Limit
1 Calculated from October 1 – April 30, 2012-2013 using data provided by facilities and/or DMR data.
Table 37. October 1 – April 30 nonpoint source TP discharge to Sand Hollow (a tributary to the Snake River).
Source Name Receiving Water
Mean Discharge
(cfs)1
Mean TP Conc. (mg/L)
1 Mean TP Load
(lbs/day)1
Nonpoint, ground water, background, and other
unmeasured
Sand Hollow (Snake River)
63.6 0.33 113.3
1 From ISDA and USGS for data available data from 1998 – 2013. This includes TP loading from the Parma WWTF.
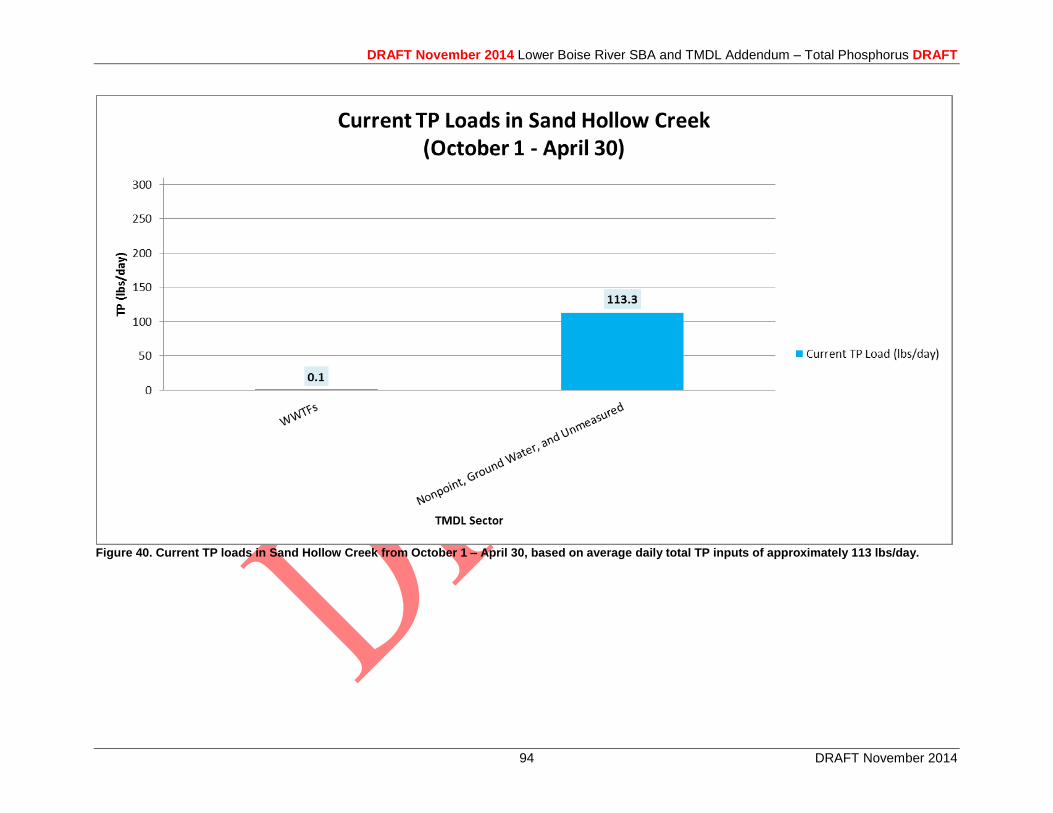
DRAFT November 2014 Lower Boise River SBA and TMDL Addendum – Total Phosphorus DRAFT
94 DRAFT November 2014
Figure 40. Current TP loads in Sand Hollow Creek from October 1 – April 30, based on average daily total TP inputs of approximately 113 lbs/day.
DRAFT November 2014 Lower Boise River SBA and TMDL Addendum – Total Phosphorus DRAFT
95 DRAFT November 2014
5.4 Load and Wasteload Allocations
The load and wasteload allocations include a margin of safety to take into account seasonal
variability and uncertainty. Uncertainty arises in selection of water quality targets, load capacity,
and estimates of existing loads, and may be attributed to incomplete knowledge or understanding
of the lower Boise River managed system, such as assimilation, data gaps, or variability.
A detailed approach was used for the analysis and selection of the allocations, which include
implicit and explicit margins of safety and take into account seasonal variability and uncertainty
with the conservative assumptions built into the methodology (Section 5.4.4).4 Considerations
included equitable cost, cost effectiveness, and credit for prior efforts, but all within the ceiling
of remaining available load to fully support existing beneficial uses. Each point source receives a
wasteload allocation, whereas nonpoint source load allocation responsibilities are often varied
(e.g. tributaries vs. ground water and unmeasured). The projected implementation timeframes are
identified in section 5.5.1, and will be further evaluated in the subsequent implementation plan.
5.4.1 Boise River and Mason Creek TP Allocations to Meet the SR-HC TMDL Target of < 0.07 mg/L May 1 – September 30
May 1 – September 30: TP concentrations and TP load equivalent < 0.07 mg/L in the lower
Boise River near Parma to comply with the 2004 Snake River-Hells Canyon TMDL (and
meet the mean monthly periphyton target in the lower Boise River).
The following analysis and allocations indicate that lower Boise River TP loadings near Parma
must be reduced between approximately 81% to 83% from May 1 – September 30 in order to
meet the TP load equivalent target of < 0.07 mg/L and comply with the mean monthly benthic
chlorophyll a (periphyton) target of < 150 mg/m2 in the impaired AUs lower Boise River. Tables
38-44, Figure 41, and Figure 42 outline sector-wide and specific allocations that meet both
targets.
As with the current loading estimates, several assumptions identified in the load and wasteload
analyses to help meet the May 1 – September TP and periphyton targets:
Background
Background TP concentration of 0.018 mg/L is based on the 2005 – 2013 USGS TP data at
Diversion Dam, with detection levels of 0.01 mg/L (see Section 3.2.2).
To meet the May 1 – September 30, 0.07 mg/L TP target near Parma and the 150 mg/m2 mean
monthly periphyton target, this sector received load allocations of 37 to 317 lbs/day (0.018
mg/L) TP for various flow conditions (0% reduction).
4 Note: Given the complexity of the LBR managed watershed, through the implementation process and the TMDL
5-year review, WLAs and LAs established in this TMDL may be reevaluated as additional data become available.
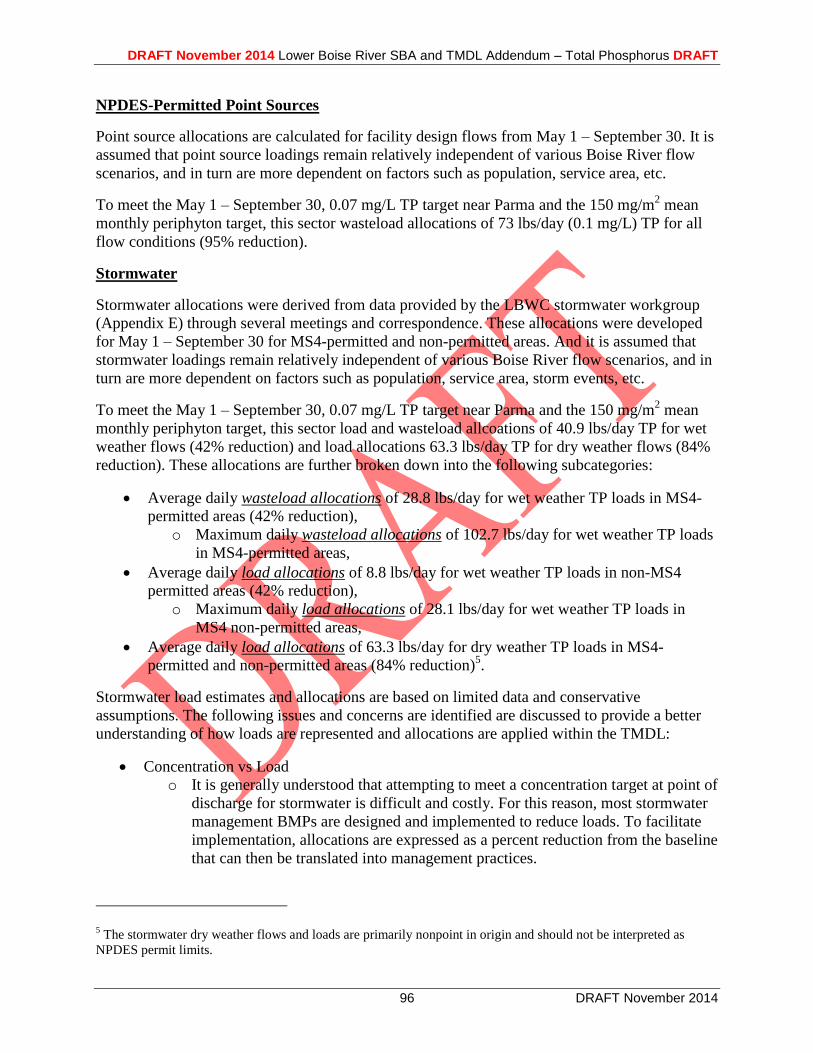
DRAFT November 2014 Lower Boise River SBA and TMDL Addendum – Total Phosphorus DRAFT
96 DRAFT November 2014
NPDES-Permitted Point Sources
Point source allocations are calculated for facility design flows from May 1 – September 30. It is
assumed that point source loadings remain relatively independent of various Boise River flow
scenarios, and in turn are more dependent on factors such as population, service area, etc.
To meet the May 1 – September 30, 0.07 mg/L TP target near Parma and the 150 mg/m2 mean
monthly periphyton target, this sector wasteload allocations of 73 lbs/day (0.1 mg/L) TP for all
flow conditions (95% reduction).
Stormwater
Stormwater allocations were derived from data provided by the LBWC stormwater workgroup
(Appendix E) through several meetings and correspondence. These allocations were developed
for May 1 – September 30 for MS4-permitted and non-permitted areas. And it is assumed that
stormwater loadings remain relatively independent of various Boise River flow scenarios, and in
turn are more dependent on factors such as population, service area, storm events, etc.
To meet the May 1 – September 30, 0.07 mg/L TP target near Parma and the 150 mg/m2 mean
monthly periphyton target, this sector load and wasteload allcoations of 40.9 lbs/day TP for wet
weather flows (42% reduction) and load allocations 63.3 lbs/day TP for dry weather flows (84%
reduction). These allocations are further broken down into the following subcategories:
Average daily wasteload allocations of 28.8 lbs/day for wet weather TP loads in MS4-
permitted areas (42% reduction),
o Maximum daily wasteload allocations of 102.7 lbs/day for wet weather TP loads
in MS4-permitted areas,
Average daily load allocations of 8.8 lbs/day for wet weather TP loads in non-MS4
permitted areas (42% reduction),
o Maximum daily load allocations of 28.1 lbs/day for wet weather TP loads in
MS4 non-permitted areas,
Average daily load allocations of 63.3 lbs/day for dry weather TP loads in MS4-
permitted and non-permitted areas (84% reduction)5.
Stormwater load estimates and allocations are based on limited data and conservative
assumptions. The following issues and concerns are identified are discussed to provide a better
understanding of how loads are represented and allocations are applied within the TMDL:
Concentration vs Load
o It is generally understood that attempting to meet a concentration target at point of
discharge for stormwater is difficult and costly. For this reason, most stormwater
management BMPs are designed and implemented to reduce loads. To facilitate
implementation, allocations are expressed as a percent reduction from the baseline
that can then be translated into management practices.
5 The stormwater dry weather flows and loads are primarily nonpoint in origin and should not be interpreted as
NPDES permit limits.
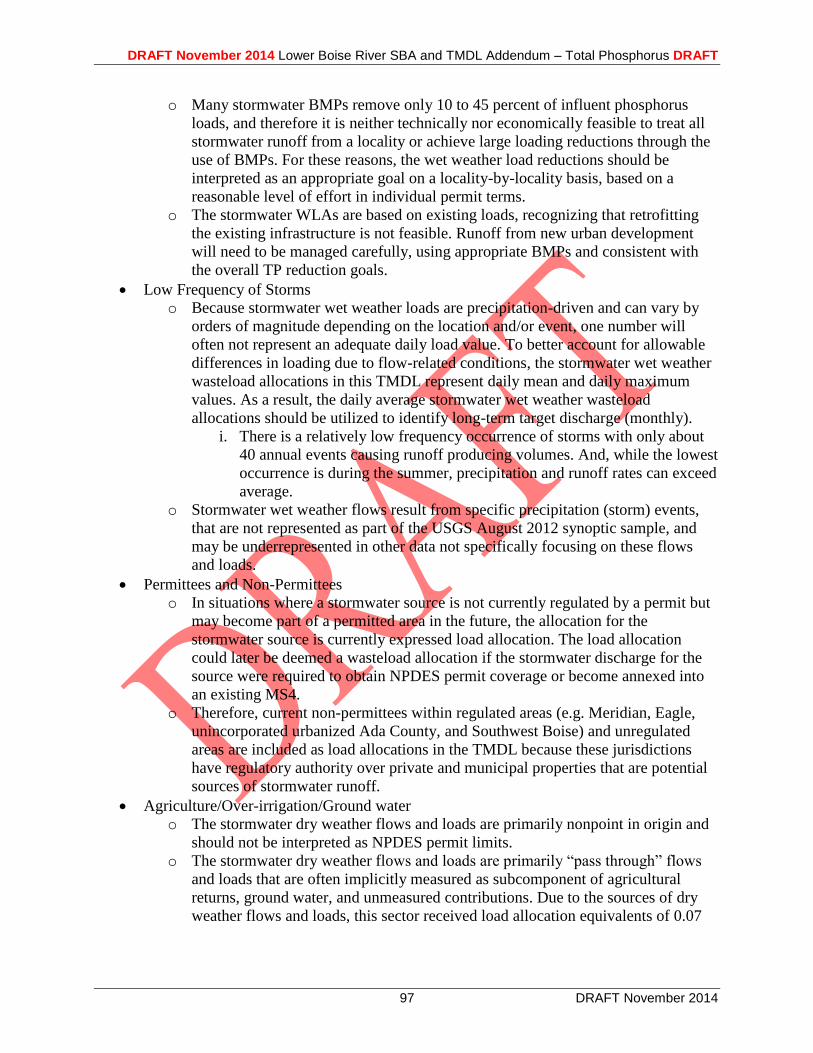
DRAFT November 2014 Lower Boise River SBA and TMDL Addendum – Total Phosphorus DRAFT
97 DRAFT November 2014
o Many stormwater BMPs remove only 10 to 45 percent of influent phosphorus
loads, and therefore it is neither technically nor economically feasible to treat all
stormwater runoff from a locality or achieve large loading reductions through the
use of BMPs. For these reasons, the wet weather load reductions should be
interpreted as an appropriate goal on a locality-by-locality basis, based on a
reasonable level of effort in individual permit terms.
o The stormwater WLAs are based on existing loads, recognizing that retrofitting
the existing infrastructure is not feasible. Runoff from new urban development
will need to be managed carefully, using appropriate BMPs and consistent with
the overall TP reduction goals.
Low Frequency of Storms
o Because stormwater wet weather loads are precipitation-driven and can vary by
orders of magnitude depending on the location and/or event, one number will
often not represent an adequate daily load value. To better account for allowable
differences in loading due to flow-related conditions, the stormwater wet weather
wasteload allocations in this TMDL represent daily mean and daily maximum
values. As a result, the daily average stormwater wet weather wasteload
allocations should be utilized to identify long-term target discharge (monthly).
i. There is a relatively low frequency occurrence of storms with only about
40 annual events causing runoff producing volumes. And, while the lowest
occurrence is during the summer, precipitation and runoff rates can exceed
average.
o Stormwater wet weather flows result from specific precipitation (storm) events,
that are not represented as part of the USGS August 2012 synoptic sample, and
may be underrepresented in other data not specifically focusing on these flows
and loads.
Permittees and Non-Permittees
o In situations where a stormwater source is not currently regulated by a permit but
may become part of a permitted area in the future, the allocation for the
stormwater source is currently expressed load allocation. The load allocation
could later be deemed a wasteload allocation if the stormwater discharge for the
source were required to obtain NPDES permit coverage or become annexed into
an existing MS4.
o Therefore, current non-permittees within regulated areas (e.g. Meridian, Eagle,
unincorporated urbanized Ada County, and Southwest Boise) and unregulated
areas are included as load allocations in the TMDL because these jurisdictions
have regulatory authority over private and municipal properties that are potential
sources of stormwater runoff.
Agriculture/Over-irrigation/Ground water
o The stormwater dry weather flows and loads are primarily nonpoint in origin and
should not be interpreted as NPDES permit limits.
o The stormwater dry weather flows and loads are primarily “pass through” flows
and loads that are often implicitly measured as subcomponent of agricultural
returns, ground water, and unmeasured contributions. Due to the sources of dry
weather flows and loads, this sector received load allocation equivalents of 0.07
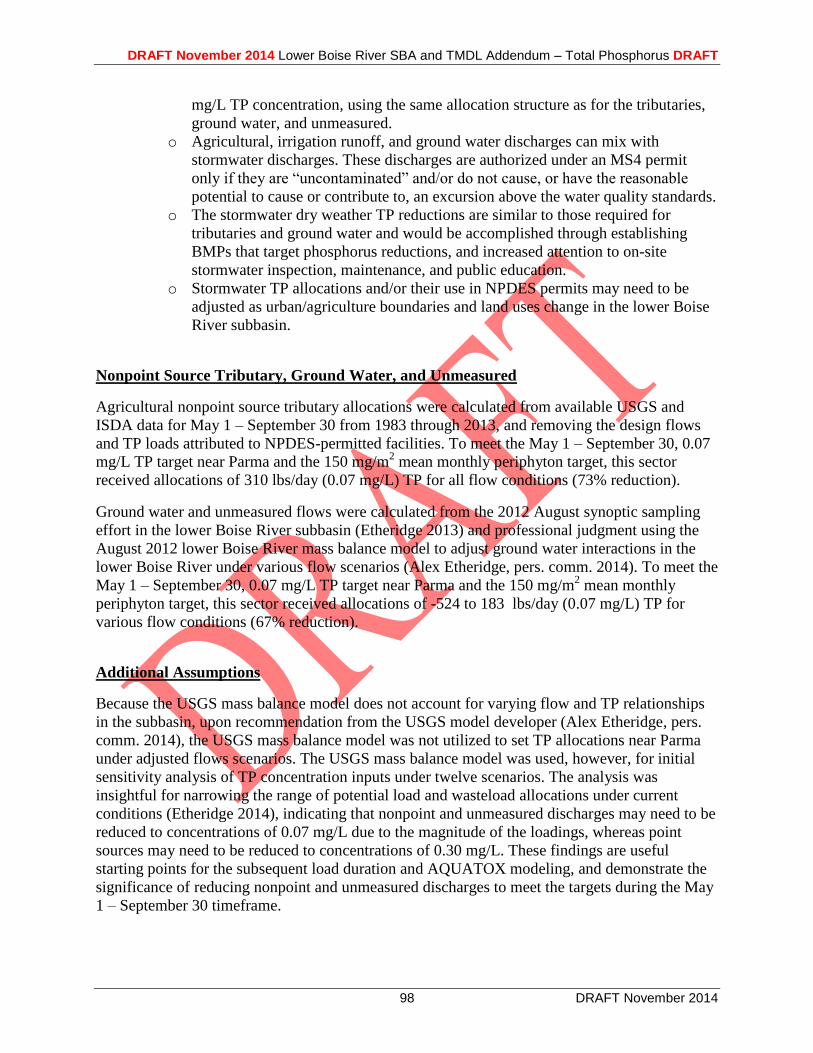
DRAFT November 2014 Lower Boise River SBA and TMDL Addendum – Total Phosphorus DRAFT
98 DRAFT November 2014
mg/L TP concentration, using the same allocation structure as for the tributaries,
ground water, and unmeasured.
o Agricultural, irrigation runoff, and ground water discharges can mix with
stormwater discharges. These discharges are authorized under an MS4 permit
only if they are “uncontaminated” and/or do not cause, or have the reasonable
potential to cause or contribute to, an excursion above the water quality standards.
o The stormwater dry weather TP reductions are similar to those required for
tributaries and ground water and would be accomplished through establishing
BMPs that target phosphorus reductions, and increased attention to on-site
stormwater inspection, maintenance, and public education.
o Stormwater TP allocations and/or their use in NPDES permits may need to be
adjusted as urban/agriculture boundaries and land uses change in the lower Boise
River subbasin.
Nonpoint Source Tributary, Ground Water, and Unmeasured
Agricultural nonpoint source tributary allocations were calculated from available USGS and
ISDA data for May 1 – September 30 from 1983 through 2013, and removing the design flows
and TP loads attributed to NPDES-permitted facilities. To meet the May 1 – September 30, 0.07
mg/L TP target near Parma and the 150 mg/m2 mean monthly periphyton target, this sector
received allocations of 310 lbs/day (0.07 mg/L) TP for all flow conditions (73% reduction).
Ground water and unmeasured flows were calculated from the 2012 August synoptic sampling
effort in the lower Boise River subbasin (Etheridge 2013) and professional judgment using the
August 2012 lower Boise River mass balance model to adjust ground water interactions in the
lower Boise River under various flow scenarios (Alex Etheridge, pers. comm. 2014). To meet the
May 1 – September 30, 0.07 mg/L TP target near Parma and the 150 mg/m2 mean monthly
periphyton target, this sector received allocations of -524 to 183 lbs/day (0.07 mg/L) TP for
various flow conditions (67% reduction).
Additional Assumptions
Because the USGS mass balance model does not account for varying flow and TP relationships
in the subbasin, upon recommendation from the USGS model developer (Alex Etheridge, pers.
comm. 2014), the USGS mass balance model was not utilized to set TP allocations near Parma
under adjusted flows scenarios. The USGS mass balance model was used, however, for initial
sensitivity analysis of TP concentration inputs under twelve scenarios. The analysis was
insightful for narrowing the range of potential load and wasteload allocations under current
conditions (Etheridge 2014), indicating that nonpoint and unmeasured discharges may need to be
reduced to concentrations of 0.07 mg/L due to the magnitude of the loadings, whereas point
sources may need to be reduced to concentrations of 0.30 mg/L. These findings are useful
starting points for the subsequent load duration and AQUATOX modeling, and demonstrate the
significance of reducing nonpoint and unmeasured discharges to meet the targets during the May
1 – September 30 timeframe.

DRAFT November 2014 Lower Boise River SBA and TMDL Addendum – Total Phosphorus DRAFT
99 DRAFT November 2014
Table 38. TP loads, capacities, and water quality targets for May 1 – September 30, presented as daily averages. These are calculated for: 1) the Boise River near Parma; 2) Mason Creek, a lower Boise River tributary, and: 3) Sand Hollow, a Snake River tributary.
Water Body1
Flow2
(cfs)
Flow Rank (%)
Current Load2
Load Capacity3
Water Quality Targets3
TP Conc. (mg/L)
TP Load
(lbs/day)
Target TP Conc. (mg/L)
Target TP Load (lbs/day)
Target TP Load
Reductions (lbs/day
[%])
TP Allocations
3
(lbs/day) TP Load
Reductions3
(lbs/day)
TP Conc. (mg/L)
TP Load Reductions
3
(%)
Lower Boise River near Parma – (AU 001_06)
3268 10th 0.21 3747 0.07 1233
-2514
(67%) 601 -3146 0.034 84%
912 40th 0.31 1531 0.07 344
-1187
(78%) 303 -1228 0.062 80%
705 60th 0.31 1190 0.07 266
-924
(78%) 237 -953 0.062 80%
USGS August Synoptic Sample
4 624 69th
0.30 1010 0.07 235 -775
(77%) 224 -786 0.067 78%
383 90
th 0.36 738 0.07 145
-593
(80%) 145 -593 0.070 80%
Mason Creek – (AU 006_02)
(Tributary to the lower Boise River)
148 Mean 0.41 322 0.07 56 -266
(82%) 56 -266 0.07 82%
Sand Hollow – (AU 017_06)
(Tributary to the Snake River)
141 Mean 0.4 303 0.07 53 -250
(83%) 53 -250 0.07 83%
1 All assessment units (AUs) begin with ID17050114.
2 Lower Boise River – based on a data from May 1 – September 30, 1987 through 2012 and duration curves with water quality targets.
Mason Creek – based on USGS and ISDA mean data from May 1 – September 30, 1995 through 2012. Sand Hollow – based on USGS and mean data from May 1 – September 30, 1998 through 2012. 3
Lower Boise River - load capacities and water quality targets are applied near Parma, using duration curves. Mason Creek and Sand Hollow Creek – mean load capacities and water quality targets calculated and applied as instream conditions. 4 Lower Boise River flows, TP concentrations, and loads highlighted in green are derived from the USGS August 2012 synoptic sample (Etheridge 2013). These
USGS-derived values are only for comparing the USGS mass balance data with long-term flow and load duration data and not for TP allocation purposes.
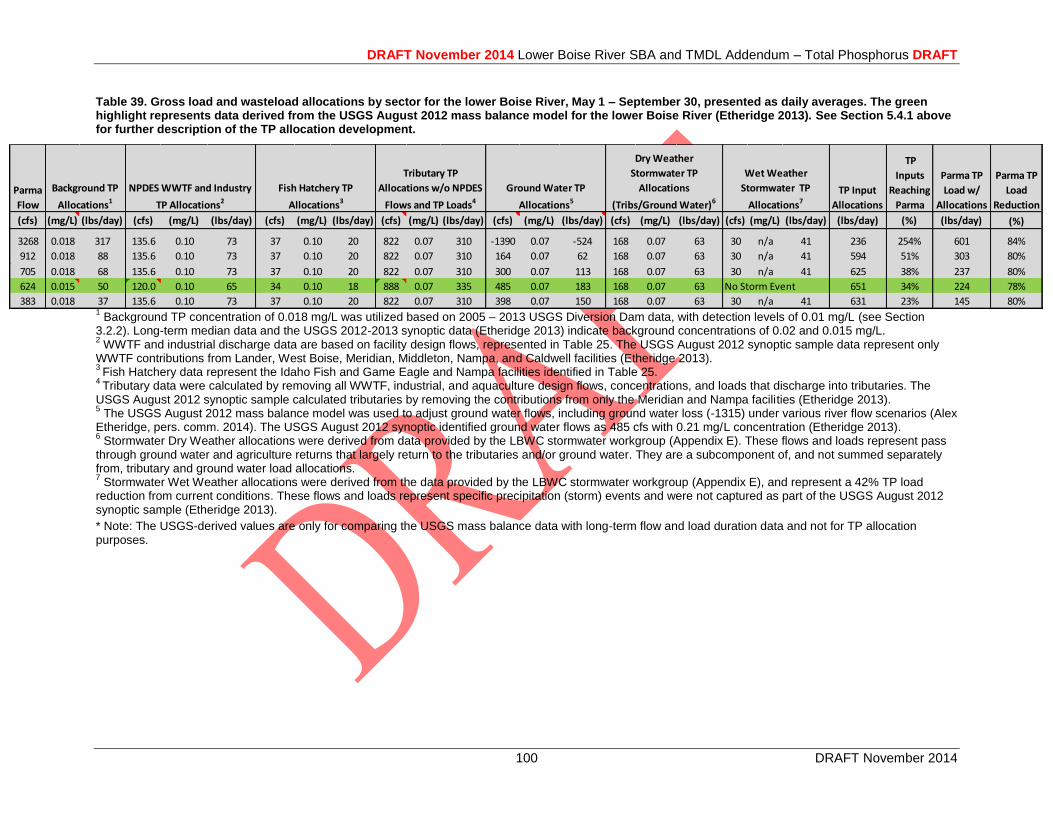
DRAFT November 2014 Lower Boise River SBA and TMDL Addendum – Total Phosphorus DRAFT
100 DRAFT November 2014
Table 39. Gross load and wasteload allocations by sector for the lower Boise River, May 1 – September 30, presented as daily averages. The green highlight represents data derived from the USGS August 2012 mass balance model for the lower Boise River (Etheridge 2013). See Section 5.4.1 above for further description of the TP allocation development.
1 Background TP concentration of 0.018 mg/L was utilized based on 2005 – 2013 USGS Diversion Dam data, with detection levels of 0.01 mg/L (see Section
3.2.2). Long-term median data and the USGS 2012-2013 synoptic data (Etheridge 2013) indicate background concentrations of 0.02 and 0.015 mg/L. 2 WWTF and industrial discharge data are based on facility design flows, represented in Table 25. The USGS August 2012 synoptic sample data represent only
WWTF contributions from Lander, West Boise, Meridian, Middleton, Nampa, and Caldwell facilities (Etheridge 2013). 3
Fish Hatchery data represent the Idaho Fish and Game Eagle and Nampa facilities identified in Table 25.
4 Tributary data were calculated by removing all WWTF, industrial, and aquaculture design flows, concentrations, and loads that discharge into tributaries. The
USGS August 2012 synoptic sample calculated tributaries by removing the contributions from only the Meridian and Nampa facilities (Etheridge 2013). 5 The USGS August 2012 mass balance model was used to adjust ground water flows, including ground water loss (-1315) under various river flow scenarios (Alex
Etheridge, pers. comm. 2014). The USGS August 2012 synoptic identified ground water flows as 485 cfs with 0.21 mg/L concentration (Etheridge 2013). 6 Stormwater Dry Weather allocations were derived from data provided by the LBWC stormwater workgroup (Appendix E). These flows and loads represent pass
through ground water and agriculture returns that largely return to the tributaries and/or ground water. They are a subcomponent of, and not summed separately from, tributary and ground water load allocations. 7 Stormwater Wet Weather allocations were derived from the data provided by the LBWC stormwater workgroup (Appendix E), and represent a 42% TP load
reduction from current conditions. These flows and loads represent specific precipitation (storm) events and were not captured as part of the USGS August 2012 synoptic sample (Etheridge 2013).
* Note: The USGS-derived values are only for comparing the USGS mass balance data with long-term flow and load duration data and not for TP allocation purposes.
Parma
Flow
TP Input
Allocations
TP
Inputs
Reaching
Parma
Parma TP
Load w/
Allocations
Parma TP
Load
Reduction
(cfs) (mg/L) (lbs/day) (cfs) (mg/L) (lbs/day) (cfs) (mg/L) (lbs/day) (cfs) (mg/L) (lbs/day) (cfs) (mg/L) (lbs/day) (cfs) (mg/L) (lbs/day) (cfs) (mg/L) (lbs/day) (lbs/day) (%) (lbs/day) (%)
3268 0.018 317 135.6 0.10 73 37 0.10 20 822 0.07 310 -1390 0.07 -524 168 0.07 63 30 n/a 41 236 254% 601 84%
912 0.018 88 135.6 0.10 73 37 0.10 20 822 0.07 310 164 0.07 62 168 0.07 63 30 n/a 41 594 51% 303 80%
705 0.018 68 135.6 0.10 73 37 0.10 20 822 0.07 310 300 0.07 113 168 0.07 63 30 n/a 41 625 38% 237 80%
624 0.015 50 120.0 0.10 65 34 0.10 18 888 0.07 335 485 0.07 183 168 0.07 63 No Storm Event 651 34% 224 78%
383 0.018 37 135.6 0.10 73 37 0.10 20 822 0.07 310 398 0.07 150 168 0.07 63 30 n/a 41 631 23% 145 80%
Wet Weather
Stormwater TP
Allocations7
NPDES WWTF and Industry
TP Allocations2
Background TP
Allocations1
Tributary TP
Allocations w/o NPDES
Flows and TP Loads4
Ground Water TP
Allocations5
Fish Hatchery TP
Allocations3
Dry Weather
Stormwater TP
Allocations
(Tribs/Ground Water)6
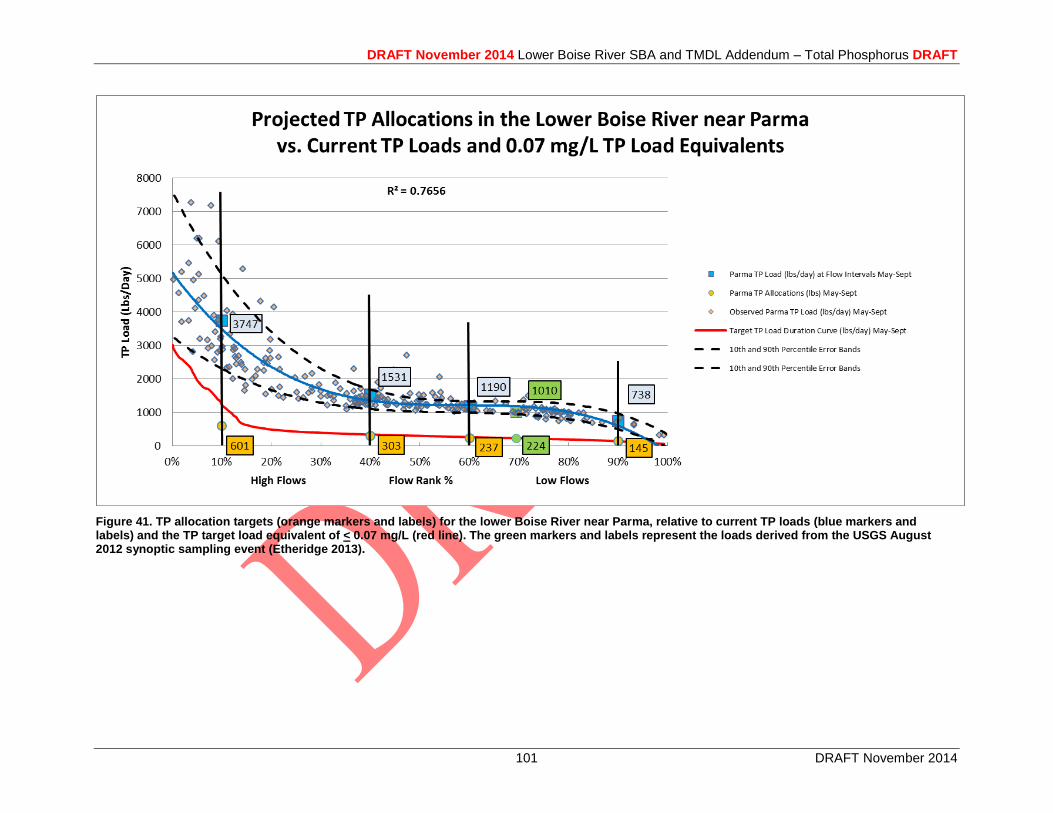
DRAFT November 2014 Lower Boise River SBA and TMDL Addendum – Total Phosphorus DRAFT
101 DRAFT November 2014
Figure 41. TP allocation targets (orange markers and labels) for the lower Boise River near Parma, relative to current TP loads (blue markers and labels) and the TP target load equivalent of < 0.07 mg/L (red line). The green markers and labels represent the loads derived from the USGS August 2012 synoptic sampling event (Etheridge 2013).
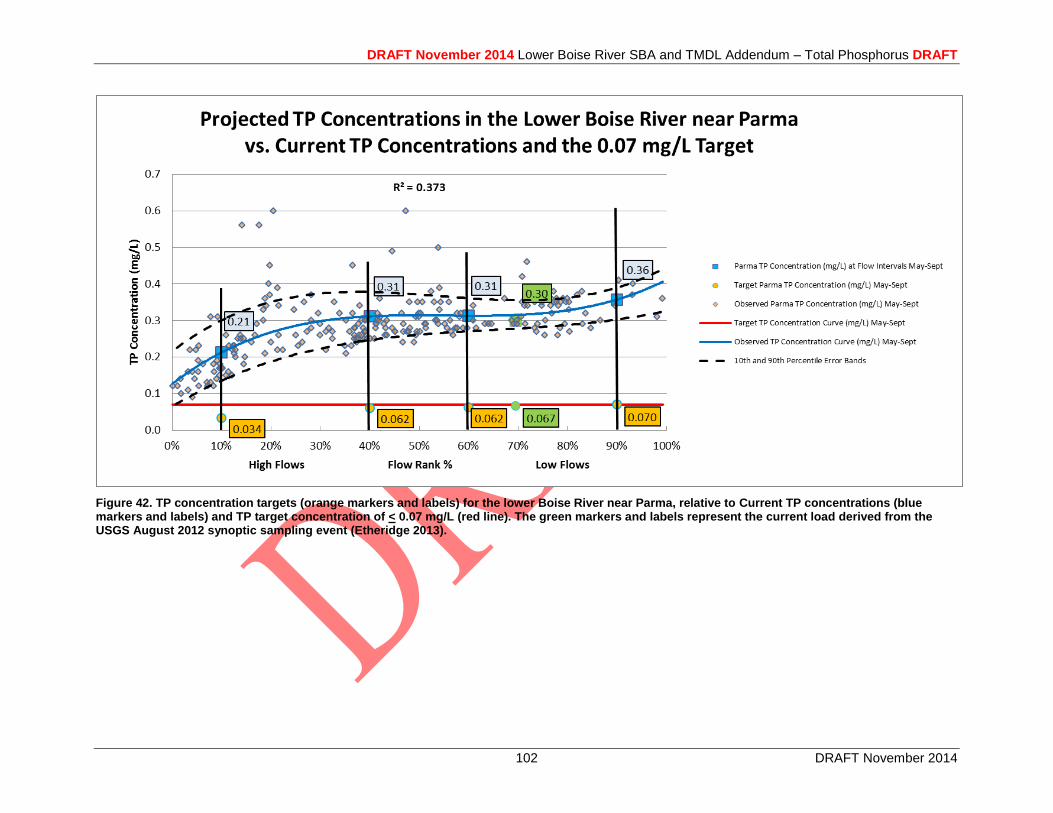
DRAFT November 2014 Lower Boise River SBA and TMDL Addendum – Total Phosphorus DRAFT
102 DRAFT November 2014
Figure 42. TP concentration targets (orange markers and labels) for the lower Boise River near Parma, relative to Current TP concentrations (blue markers and labels) and TP target concentration of < 0.07 mg/L (red line). The green markers and labels represent the current load derived from the USGS August 2012 synoptic sampling event (Etheridge 2013).
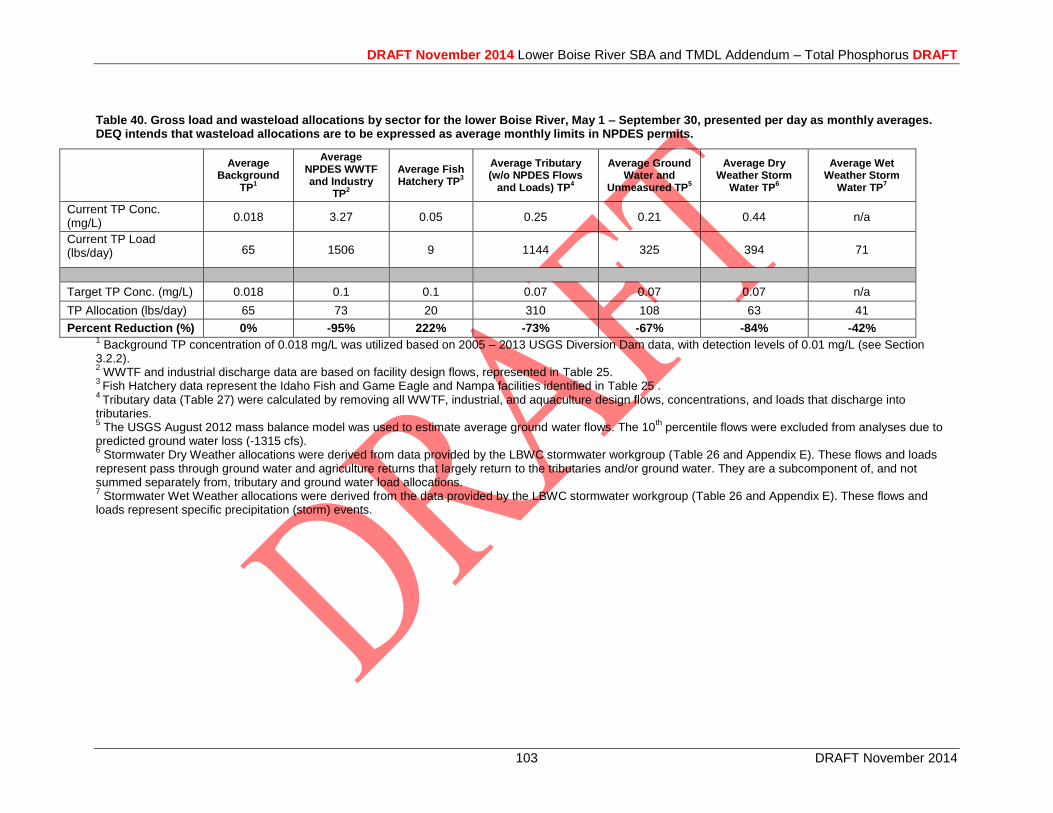
DRAFT November 2014 Lower Boise River SBA and TMDL Addendum – Total Phosphorus DRAFT
103 DRAFT November 2014
Table 40. Gross load and wasteload allocations by sector for the lower Boise River, May 1 – September 30, presented per day as monthly averages. DEQ intends that wasteload allocations are to be expressed as average monthly limits in NPDES permits.
Average Background
TP1
Average NPDES WWTF and Industry
TP2
Average Fish Hatchery TP
3
Average Tributary (w/o NPDES Flows
and Loads) TP4
Average Ground Water and
Unmeasured TP5
Average Dry Weather Storm
Water TP6
Average Wet Weather Storm
Water TP7
Current TP Conc. (mg/L)
0.018 3.27 0.05 0.25 0.21 0.44 n/a
Current TP Load (lbs/day) 65 1506 9 1144 325 394 71
Target TP Conc. (mg/L) 0.018 0.1 0.1 0.07 0.07 0.07 n/a
TP Allocation (lbs/day) 65 73 20 310 108 63 41
Percent Reduction (%) 0% -95% 222% -73% -67% -84% -42% 1 Background TP concentration of 0.018 mg/L was utilized based on 2005 – 2013 USGS Diversion Dam data, with detection levels of 0.01 mg/L (see Section
3.2.2). 2 WWTF and industrial discharge data are based on facility design flows, represented in Table 25.
3 Fish Hatchery data represent the Idaho Fish and Game Eagle and Nampa facilities identified in Table 25 .
4 Tributary data (Table 27) were calculated by removing all WWTF, industrial, and aquaculture design flows, concentrations, and loads that discharge into
tributaries. 5 The USGS August 2012 mass balance model was used to estimate average ground water flows. The 10
th percentile flows were excluded from analyses due to
predicted ground water loss (-1315 cfs). 6 Stormwater Dry Weather allocations were derived from data provided by the LBWC stormwater workgroup (Table 26 and Appendix E). These flows and loads
represent pass through ground water and agriculture returns that largely return to the tributaries and/or ground water. They are a subcomponent of, and not summed separately from, tributary and ground water load allocations. 7 Stormwater Wet Weather allocations were derived from the data provided by the LBWC stormwater workgroup (Table 26 and Appendix E). These flows and
loads represent specific precipitation (storm) events.
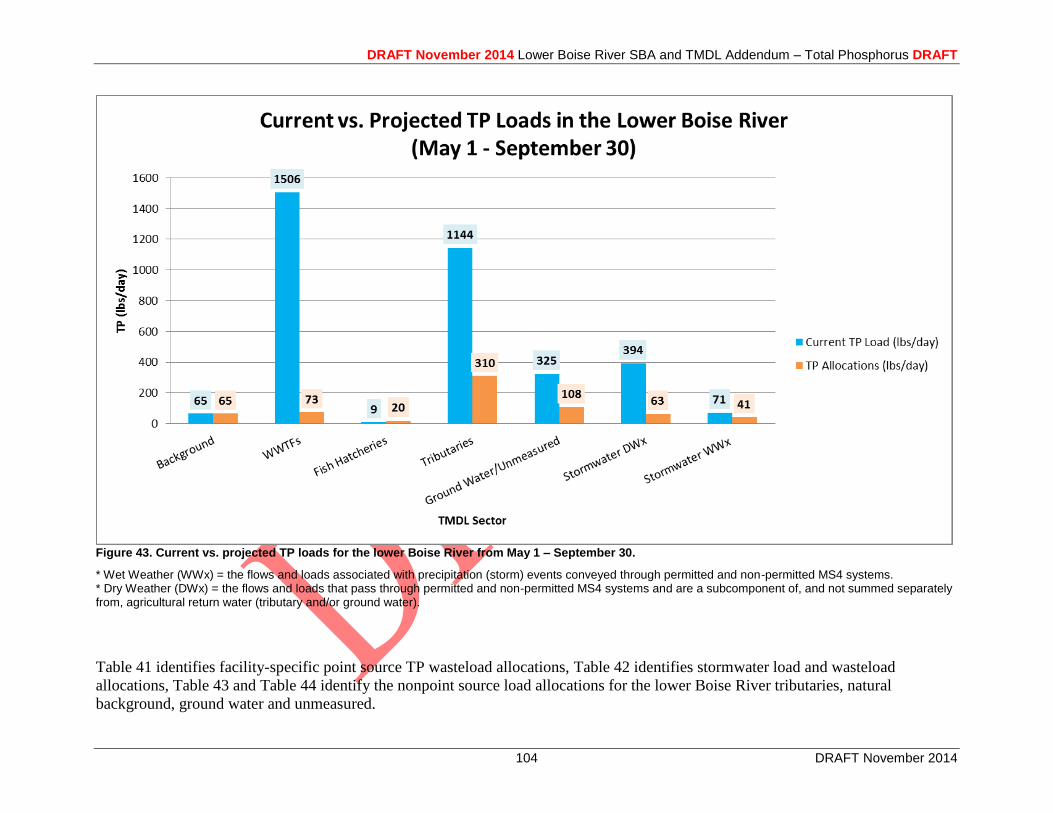
DRAFT November 2014 Lower Boise River SBA and TMDL Addendum – Total Phosphorus DRAFT
104 DRAFT November 2014
Figure 43. Current vs. projected TP loads for the lower Boise River from May 1 – September 30.
* Wet Weather (WWx) = the flows and loads associated with precipitation (storm) events conveyed through permitted and non-permitted MS4 systems. * Dry Weather (DWx) = the flows and loads that pass through permitted and non-permitted MS4 systems and are a subcomponent of, and not summed separately from, agricultural return water (tributary and/or ground water).
Table 41 identifies facility-specific point source TP wasteload allocations, Table 42 identifies stormwater load and wasteload
allocations, Table 43 and Table 44 identify the nonpoint source load allocations for the lower Boise River tributaries, natural
background, ground water and unmeasured.
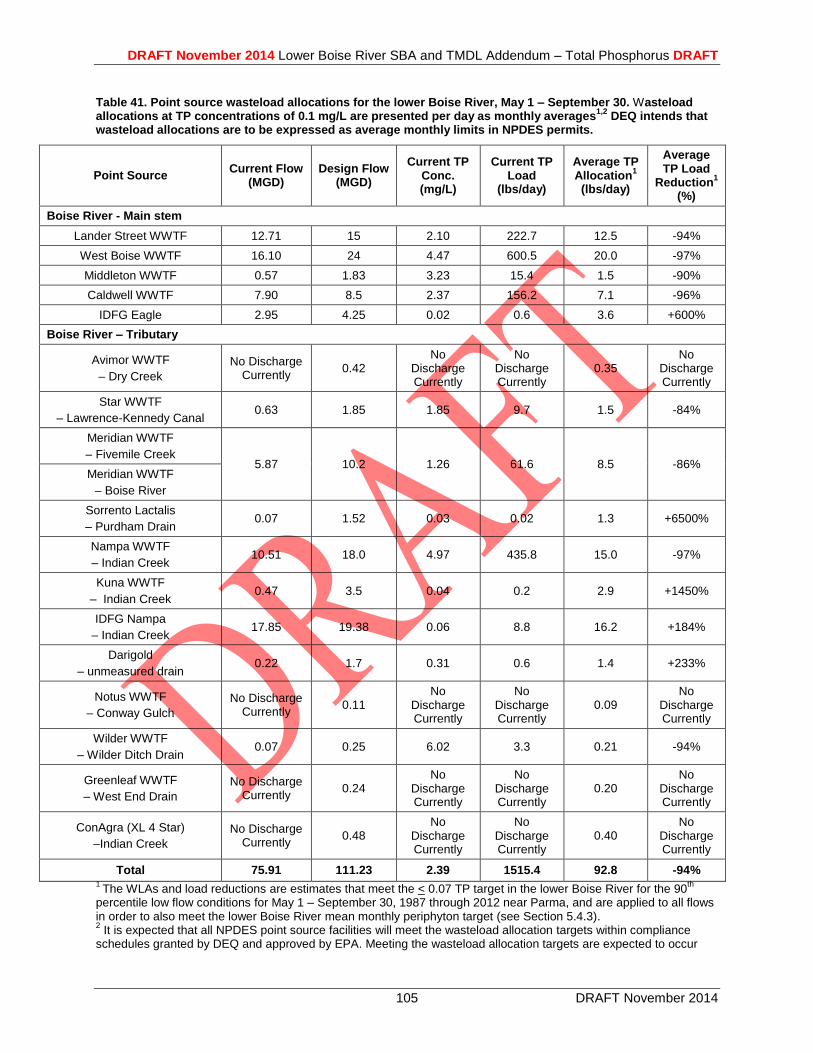
DRAFT November 2014 Lower Boise River SBA and TMDL Addendum – Total Phosphorus DRAFT
105 DRAFT November 2014
Table 41. Point source wasteload allocations for the lower Boise River, May 1 – September 30. Wasteload allocations at TP concentrations of 0.1 mg/L are presented per day as monthly averages
1,2 DEQ intends that
wasteload allocations are to be expressed as average monthly limits in NPDES permits.
Point Source Current Flow
(MGD) Design Flow
(MGD)
Current TP Conc. (mg/L)
Current TP Load
(lbs/day)
Average TP Allocation
1
(lbs/day)
Average TP Load
Reduction1
(%)
Boise River - Main stem
Lander Street WWTF 12.71 15 2.10 222.7 12.5 -94%
West Boise WWTF 16.10 24 4.47 600.5 20.0 -97%
Middleton WWTF 0.57 1.83 3.23 15.4 1.5 -90%
Caldwell WWTF 7.90 8.5 2.37 156.2 7.1 -96%
IDFG Eagle
2.95 4.25 0.02 0.6 3.6 +600%
Boise River – Tributary
Avimor WWTF
– Dry Creek
No Discharge Currently
0.42 No
Discharge Currently
No Discharge Currently
0.35 No
Discharge Currently
Star WWTF
– Lawrence-Kennedy Canal 0.63 1.85 1.85 9.7 1.5 -84%
Meridian WWTF
– Fivemile Creek 5.87 10.2 1.26 61.6 8.5 -86%
Meridian WWTF
– Boise River
Sorrento Lactalis
– Purdham Drain 0.07 1.52 0.03 0.02 1.3 +6500%
Nampa WWTF
– Indian Creek 10.51 18.0 4.97 435.8 15.0 -97%
Kuna WWTF
– Indian Creek 0.47 3.5 0.04 0.2 2.9 +1450%
IDFG Nampa
– Indian Creek 17.85 19.38 0.06 8.8 16.2 +184%
Darigold
– unmeasured drain 0.22 1.7 0.31 0.6 1.4 +233%
Notus WWTF
– Conway Gulch
No Discharge Currently
0.11 No
Discharge Currently
No Discharge Currently
0.09 No
Discharge Currently
Wilder WWTF
– Wilder Ditch Drain 0.07 0.25 6.02 3.3 0.21 -94%
Greenleaf WWTF
– West End Drain
No Discharge Currently
0.24 No
Discharge Currently
No Discharge Currently
0.20 No
Discharge Currently
ConAgra (XL 4 Star)
–Indian Creek
No Discharge Currently
0.48 No
Discharge Currently
No Discharge Currently
0.40 No
Discharge Currently
Total 75.91 111.23 2.39 1515.4 92.8 -94% 1
The WLAs and load reductions are estimates that meet the < 0.07 TP target in the lower Boise River for the 90th
percentile low flow conditions for May 1 – September 30, 1987 through 2012 near Parma, and are applied to all flows in order to also meet the lower Boise River mean monthly periphyton target (see Section 5.4.3). 2 It is expected that all NPDES point source facilities will meet the wasteload allocation targets within compliance
schedules granted by DEQ and approved by EPA. Meeting the wasteload allocation targets are expected to occur
DRAFT November 2014 Lower Boise River SBA and TMDL Addendum – Total Phosphorus DRAFT
106 DRAFT November 2014
through enhanced technology and/or water quality trading. This TMDL addendum provides opportunity for potentially re-opening NPDES permits, by providing new water quality information.
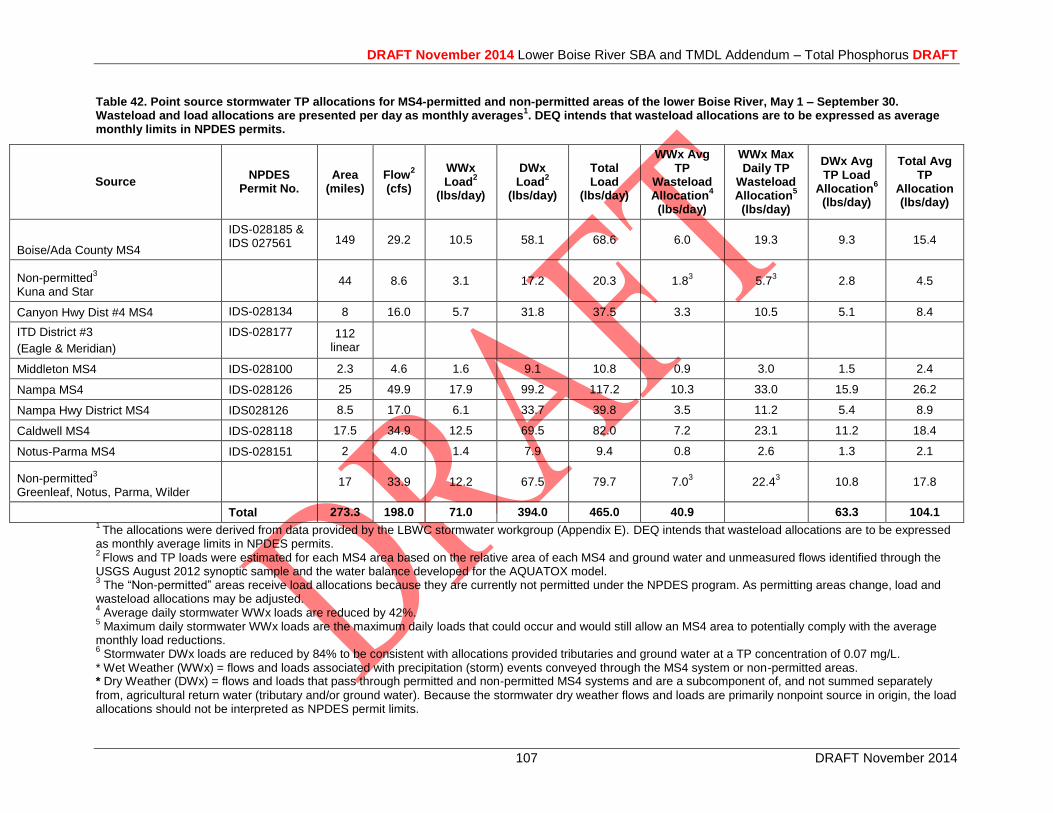
DRAFT November 2014 Lower Boise River SBA and TMDL Addendum – Total Phosphorus DRAFT
107 DRAFT November 2014
Table 42. Point source stormwater TP allocations for MS4-permitted and non-permitted areas of the lower Boise River, May 1 – September 30. Wasteload and load allocations are presented per day as monthly averages
1. DEQ intends that wasteload allocations are to be expressed as average
monthly limits in NPDES permits.
Source NPDES
Permit No. Area
(miles) Flow
2
(cfs)
WWx Load
2
(lbs/day)
DWx Load
2
(lbs/day)
Total Load
(lbs/day)
WWx Avg TP
Wasteload Allocation
4
(lbs/day)
WWx Max Daily TP
Wasteload Allocation
5
(lbs/day)
DWx Avg TP Load
Allocation6
(lbs/day)
Total Avg TP
Allocation (lbs/day)
Boise/Ada County MS4
IDS-028185 & IDS 027561 149 29.2 10.5 58.1 68.6 6.0 19.3 9.3 15.4
Non-permitted3
Kuna and Star
44 8.6 3.1 17.2 20.3 1.8
3 5.7
3 2.8 4.5
Canyon Hwy Dist #4 MS4 IDS-028134 8 16.0 5.7 31.8 37.5 3.3 10.5 5.1 8.4
ITD District #3
(Eagle & Meridian)
IDS-028177 112 linear
Middleton MS4 IDS-028100 2.3 4.6 1.6 9.1 10.8 0.9 3.0 1.5 2.4
Nampa MS4 IDS-028126 25 49.9 17.9 99.2 117.2 10.3 33.0 15.9 26.2
Nampa Hwy District MS4 IDS028126 8.5 17.0 6.1 33.7 39.8 3.5 11.2 5.4 8.9
Caldwell MS4 IDS-028118 17.5 34.9 12.5 69.5 82.0 7.2 23.1 11.2 18.4
Notus-Parma MS4 IDS-028151 2 4.0 1.4 7.9 9.4 0.8 2.6 1.3 2.1
Non-permitted3
Greenleaf, Notus, Parma, Wilder
17 33.9 12.2 67.5 79.7 7.03
22.43
10.8 17.8
Total 273.3 198.0 71.0 394.0 465.0 40.9 63.3 104.1 1
The allocations were derived from data provided by the LBWC stormwater workgroup (Appendix E). DEQ intends that wasteload allocations are to be expressed as monthly average limits in NPDES permits. 2
Flows and TP loads were estimated for each MS4 area based on the relative area of each MS4 and ground water and unmeasured flows identified through the USGS August 2012 synoptic sample and the water balance developed for the AQUATOX model. 3 The “Non-permitted” areas receive load allocations because they are currently not permitted under the NPDES program. As permitting areas change, load and
wasteload allocations may be adjusted. 4 Average daily stormwater WWx loads are reduced by 42%.
5 Maximum daily stormwater WWx loads are the maximum daily loads that could occur and would still allow an MS4 area to potentially comply with the average
monthly load reductions. 6 Stormwater DWx loads are reduced by 84% to be consistent with allocations provided tributaries and ground water at a TP concentration of 0.07 mg/L.
* Wet Weather (WWx) = flows and loads associated with precipitation (storm) events conveyed through the MS4 system or non-permitted areas. * Dry Weather (DWx) = flows and loads that pass through permitted and non-permitted MS4 systems and are a subcomponent of, and not summed separately
from, agricultural return water (tributary and/or ground water). Because the stormwater dry weather flows and loads are primarily nonpoint source in origin, the load allocations should not be interpreted as NPDES permit limits.
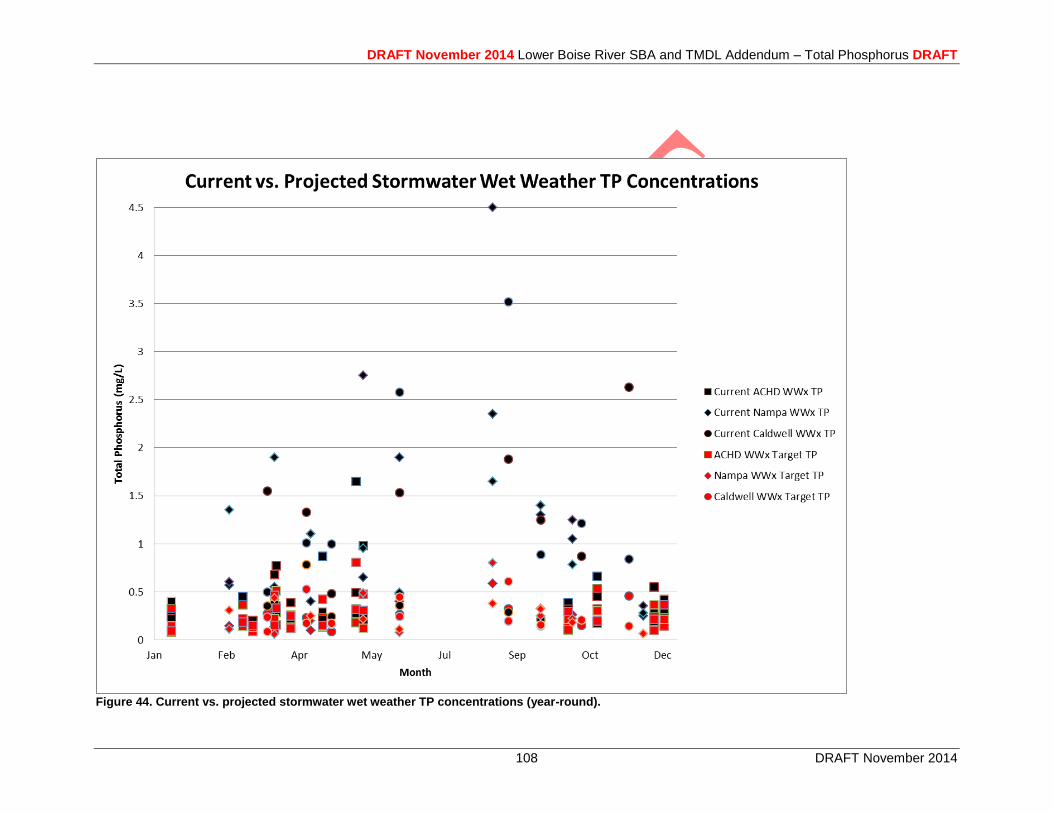
DRAFT November 2014 Lower Boise River SBA and TMDL Addendum – Total Phosphorus DRAFT
108 DRAFT November 2014
Figure 44. Current vs. projected stormwater wet weather TP concentrations (year-round).
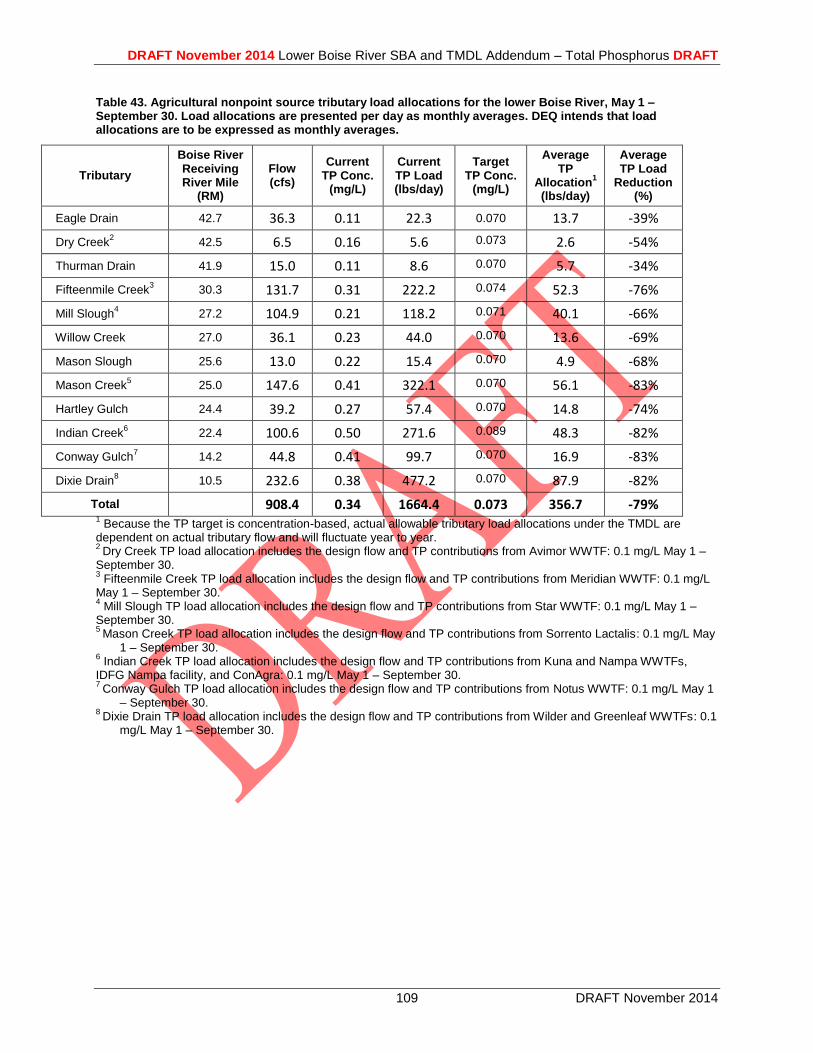
DRAFT November 2014 Lower Boise River SBA and TMDL Addendum – Total Phosphorus DRAFT
109 DRAFT November 2014
Table 43. Agricultural nonpoint source tributary load allocations for the lower Boise River, May 1 – September 30. Load allocations are presented per day as monthly averages. DEQ intends that load allocations are to be expressed as monthly averages.
Tributary
Boise River Receiving River Mile
(RM)
Flow (cfs)
Current TP Conc.
(mg/L)
Current TP Load (lbs/day)
Target TP Conc.
(mg/L)
Average TP
Allocation1
(lbs/day)
Average TP Load
Reduction (%)
Eagle Drain 42.7 36.3 0.11 22.3 0.070 13.7 -39%
Dry Creek2
42.5 6.5 0.16 5.6 0.073 2.6 -54%
Thurman Drain 41.9 15.0 0.11 8.6 0.070 5.7 -34%
Fifteenmile Creek3
30.3 131.7 0.31 222.2 0.074 52.3 -76%
Mill Slough4
27.2 104.9 0.21 118.2 0.071 40.1 -66%
Willow Creek 27.0 36.1 0.23 44.0 0.070 13.6 -69%
Mason Slough 25.6 13.0 0.22 15.4 0.070 4.9 -68%
Mason Creek5
25.0 147.6 0.41 322.1 0.070 56.1 -83%
Hartley Gulch 24.4 39.2 0.27 57.4 0.070 14.8 -74%
Indian Creek6
22.4 100.6 0.50 271.6 0.089 48.3 -82%
Conway Gulch7
14.2 44.8 0.41 99.7 0.070 16.9 -83%
Dixie Drain8
10.5 232.6 0.38 477.2 0.070 87.9 -82%
Total 908.4 0.34 1664.4 0.073 356.7 -79%
1 Because the TP target is concentration-based, actual allowable tributary load allocations under the TMDL are
dependent on actual tributary flow and will fluctuate year to year. 2
Dry Creek TP load allocation includes the design flow and TP contributions from Avimor WWTF: 0.1 mg/L May 1 – September 30. 3 Fifteenmile Creek TP load allocation includes the design flow and TP contributions from Meridian WWTF: 0.1 mg/L
May 1 – September 30. 4 Mill Slough TP load allocation includes the design flow and TP contributions from Star WWTF: 0.1 mg/L May 1 –
September 30. 5
Mason Creek TP load allocation includes the design flow and TP contributions from Sorrento Lactalis: 0.1 mg/L May 1 – September 30.
6 Indian Creek TP load allocation includes the design flow and TP contributions from Kuna and Nampa WWTFs,
IDFG Nampa facility, and ConAgra: 0.1 mg/L May 1 – September 30. 7
Conway Gulch TP load allocation includes the design flow and TP contributions from Notus WWTF: 0.1 mg/L May 1 – September 30.
8 Dixie Drain TP load allocation includes the design flow and TP contributions from Wilder and Greenleaf WWTFs: 0.1
mg/L May 1 – September 30.
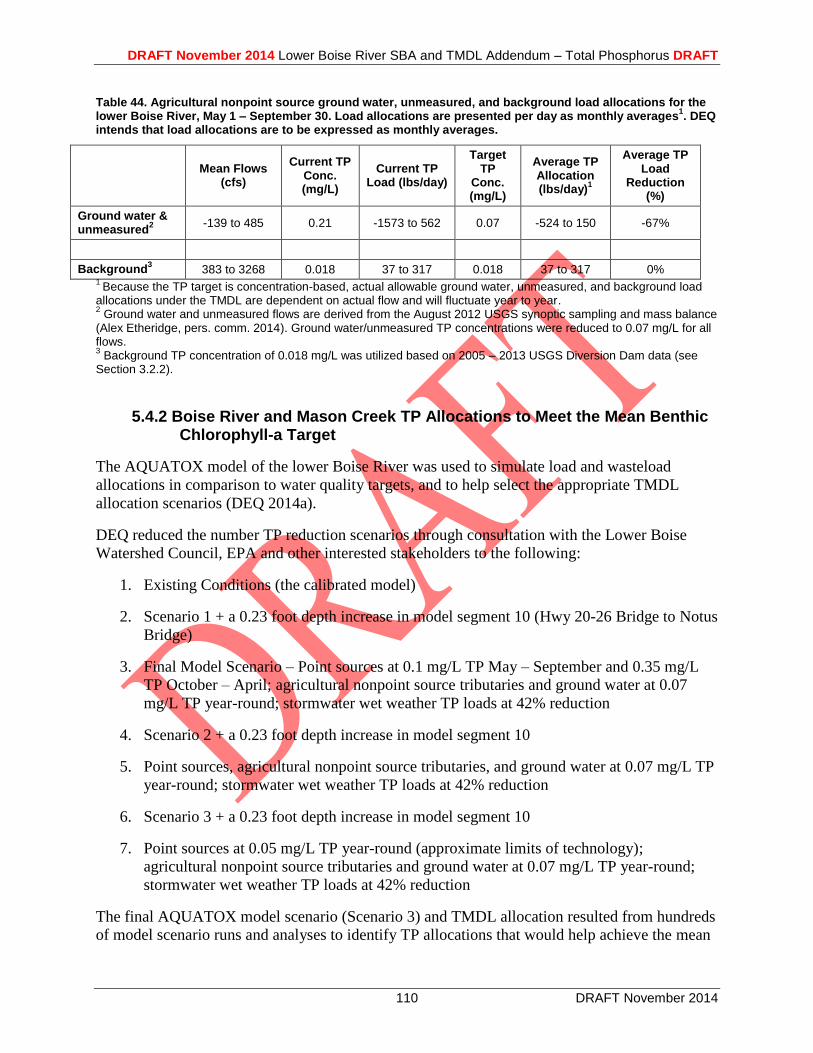
DRAFT November 2014 Lower Boise River SBA and TMDL Addendum – Total Phosphorus DRAFT
110 DRAFT November 2014
Table 44. Agricultural nonpoint source ground water, unmeasured, and background load allocations for the lower Boise River, May 1 – September 30. Load allocations are presented per day as monthly averages
1. DEQ
intends that load allocations are to be expressed as monthly averages.
Mean Flows (cfs)
Current TP Conc. (mg/L)
Current TP Load (lbs/day)
Target TP
Conc. (mg/L)
Average TP Allocation (lbs/day)
1
Average TP Load
Reduction (%)
Ground water & unmeasured
2 -139 to 485 0.21 -1573 to 562 0.07 -524 to 150 -67%
Background3
383 to 3268 0.018 37 to 317 0.018 37 to 317 0% 1
Because the TP target is concentration-based, actual allowable ground water, unmeasured, and background load allocations under the TMDL are dependent on actual flow and will fluctuate year to year. 2 Ground water and unmeasured flows are derived from the August 2012 USGS synoptic sampling and mass balance
(Alex Etheridge, pers. comm. 2014). Ground water/unmeasured TP concentrations were reduced to 0.07 mg/L for all flows. 3 Background TP concentration of 0.018 mg/L was utilized based on 2005 – 2013 USGS Diversion Dam data (see
Section 3.2.2).
5.4.2 Boise River and Mason Creek TP Allocations to Meet the Mean Benthic Chlorophyll-a Target
The AQUATOX model of the lower Boise River was used to simulate load and wasteload
allocations in comparison to water quality targets, and to help select the appropriate TMDL
allocation scenarios (DEQ 2014a).
DEQ reduced the number TP reduction scenarios through consultation with the Lower Boise
Watershed Council, EPA and other interested stakeholders to the following:
1. Existing Conditions (the calibrated model)
2. Scenario 1 + a 0.23 foot depth increase in model segment 10 (Hwy 20-26 Bridge to Notus
Bridge)
3. Final Model Scenario – Point sources at 0.1 mg/L TP May – September and 0.35 mg/L
TP October – April; agricultural nonpoint source tributaries and ground water at 0.07
mg/L TP year-round; stormwater wet weather TP loads at 42% reduction
4. Scenario 2 + a 0.23 foot depth increase in model segment 10
5. Point sources, agricultural nonpoint source tributaries, and ground water at 0.07 mg/L TP
year-round; stormwater wet weather TP loads at 42% reduction
6. Scenario 3 + a 0.23 foot depth increase in model segment 10
7. Point sources at 0.05 mg/L TP year-round (approximate limits of technology);
agricultural nonpoint source tributaries and ground water at 0.07 mg/L TP year-round;
stormwater wet weather TP loads at 42% reduction
The final AQUATOX model scenario (Scenario 3) and TMDL allocation resulted from hundreds
of model scenario runs and analyses to identify TP allocations that would help achieve the mean
DRAFT November 2014 Lower Boise River SBA and TMDL Addendum – Total Phosphorus DRAFT
111 DRAFT November 2014
monthly periphyton target and support beneficial uses, while also being technically, socially, and
economically viable options.
The final AQUATOX model scenario (Scenario 3) and TMDL allocation is described below
with additional TP descriptions outlined in Table 45, while Table 46, Table 47, and Table 48
summarize the model results for the final TMDL allocation scenario:
Achieves a May 1 – September 30 mean benthic chlorophyll a target of < 150 mg/m2 in
the impaired AUs of the lower Boise River. A potential exception is during a single
month within model segments 10 and 11. However, multiple lines of evidence suggest
the phosphorus reductions are sufficient achieve the mean monthly periphyton target on a
per-AU basis, as well as achieve TP concentrations near or below the EPA Gold Book
recommended value of 0.1 mg/L (EPA 1986). These rationales are further discussed in
subsequent sections of the TMDL and in the Model Report (DEQ 2014a).
Includes the TP allocations necessary to meet the May 1 – September 30 target of < 0.07
mg/L TP in the lower Boise River near Parma based on long-term load duration data (see
Section 5.4.1).
Final AQUATOX Model Scenario and TMDL Allocation Structure
Point Source NPDES TP Targets
0.1 mg/L TP from May 1 – September 30
0.35 mg/L TP from October 1 – April 30
IDFG Eagle and Nampa fish hatchery facilities: 0.1 mg/L TP year-round
All of the point source targets were modeled to address facility design flows and loads. The
IDFG Eagle fish hatchery facility, along with Lander, West, Middleton, and Caldwell WWTFs
were direct inputs in the AQUATOX model. Therefore, their design capacity loads were
simulated in the final TMDL scenario. The remaining NPDES-permitted facilities in Table 51
were included in the model simulation by externally calculating the additional TP loading
contributions to the tributaries or ground water/unmeasured segments to which they discharge
under design flow conditions.
Point Source Stormwater (MS4) TP Targets
Stormwater Wet Weather = 42% TP reduction year-round
All NPDES-permitted MS4s and non-permitted areas identified in Table 52 were included in the
model simulation by externally calculating the wet weather TP loading to ground
water/unmeasured segments to which they discharge. Wet weather TP concentrations and loads
are elevated for short periods and then, due to short residence time, rapidly decrease to dry
weather conditions between events. Using average wet weather TP concentrations in the model
would result in higher non-storm event TP concentrations and loads than would actually be seen
in the river. Therefore, a 0.5 correction was modeled to more-accurately represent the effect of
short-term wet weather TP spikes on monthly periphyton growth.
DRAFT November 2014 Lower Boise River SBA and TMDL Addendum – Total Phosphorus DRAFT
112 DRAFT November 2014
Dry weather TP loading was assumed at 0.07 mg/L because these are considered “pass through”
loads that come from and return to tributaries and/or ground water.
Nonpoint Source Tributary, Ground Water, and Unmeasured TP Targets
0.07 mg/L TP year-round
Agricultural nonpoint source tributaries, ground water, and unmeasured (and dry weather
stormwater) loads were set at the concentration equivalent of 0.07 mg/L TP year-round.
However, agricultural tributaries and ground water/unmeasured segment loads were adjusted >
0.07 mg/L, as appropriate, to account for TP contributions from NPDES-permitted facilities or
stormwater wet weather loads (Table 53 and Table 54).
Total Suspended Sediment
As described in more detail in the Model Report (DEQ 2014a) the total suspended sediment
(TSS) data was represented as a 37% reduction. This reduction was used to approximate water
quality conditions that could result from phosphorus-targeted BMPs, it was identified in the LBR
sediment TMDL (DEQ 1999), and DEQ is currently developing a subsequent sediment TMDL
for lower Boise River tributaries. Clearing suspended sediment out of the water column
increases periphyton growth. Model results show that periphyton growth is limited by light
availability and clearer water increases light available to substrate.
Other Forms of Organic Enrichment
As described in more detail in the Model Report (DEQ 2014a) the phosphorus reduction
scenarios for the river segments, tributaries, and ground water, applied the same ratio of TP
reduction required to achieve the TP target to any existing ammonia, nitrogen, biochemical
oxygen demand, or chlorophyll data. That is because, in order to more-accurately model
phosphorus reduction scenarios, reductions in nitrogen and carbon must also be simulated. This
is reasonable because watershed improvement projects that reduce phosphorus also control
nitrogen and other forms of organic enrichment. The steps to build the import spreadsheet for
simulating this reduction scenario included:
Using the monthly average of historic water quality data at the same precision as historic
data. This was necessary because of the uneven temporal scale of available water quality
data. This allows more general application of the results. Non-detects in the historic data
were treated as equal to the detection limit, which is a conservative assumption.
Replaced any total soluble phosphorus data with total phosphorus. This allows the model
to calculate stoichiometry on existing data rather than using literature values.
Reduced monthly averages of ammonia, nitrogen, biochemical oxygen demand, and
chlorophyll data according to the same ratio as required by bringing historic monthly
average TP data to the TP target.
Mean Dynamic Depth (Water)
Although not included as part of the final TMDL model scenario and allocations, the Model
Report (DEQ 2014a) discusses the potential impacts on periphyton growth and accrual that could
result from adjustments to the width:depth ratio in segments of the lower Boise River. The
potential adjustments were identified through the modeling process, when it was discovered that
DRAFT November 2014 Lower Boise River SBA and TMDL Addendum – Total Phosphorus DRAFT
113 DRAFT November 2014
channel depth is an important limiting factor for algal growth. As such, a modeled increase
channel depth, along with the significant TP reductions described above, illustrate a potential
approach to further reduce periphyton growth and accrual. This approach could be further
investigated if it appears that full support of beneficial uses in the lower Boise River are not
being attained during the 5-year review or subsequent post-TMDL implementation monitoring
under the significant year-round TP load reductions identified above.
This corresponds to knowledge that artificially a high width-to-depth ratio for freshwater streams
is a known sign of impairment (Rosgen and Silvey 1996). Common habitat improvement
designs for restoring impaired streams include adding habitat complexity and decreasing the
width-to-depth ratio of stream channels.
Model Limitations
The AQUATOX is a robust EPA-supported water quality model that was used to help develop
TP load and wasteload allocations to meet the mean monthly benthic chlorophyll a targets of <
150 mg/m2. Even so, it is important to recognize that all models are mathematical
approximations of the true system, with some uncertainty being an inherent component of model
results. Through the TMDL implementation and continued monitoring, DEQ, the LBWC, and
other stakeholders will continue to improve our knowledge and understanding of the phosphorus
and benthic algae relationships in the lower Boise River.
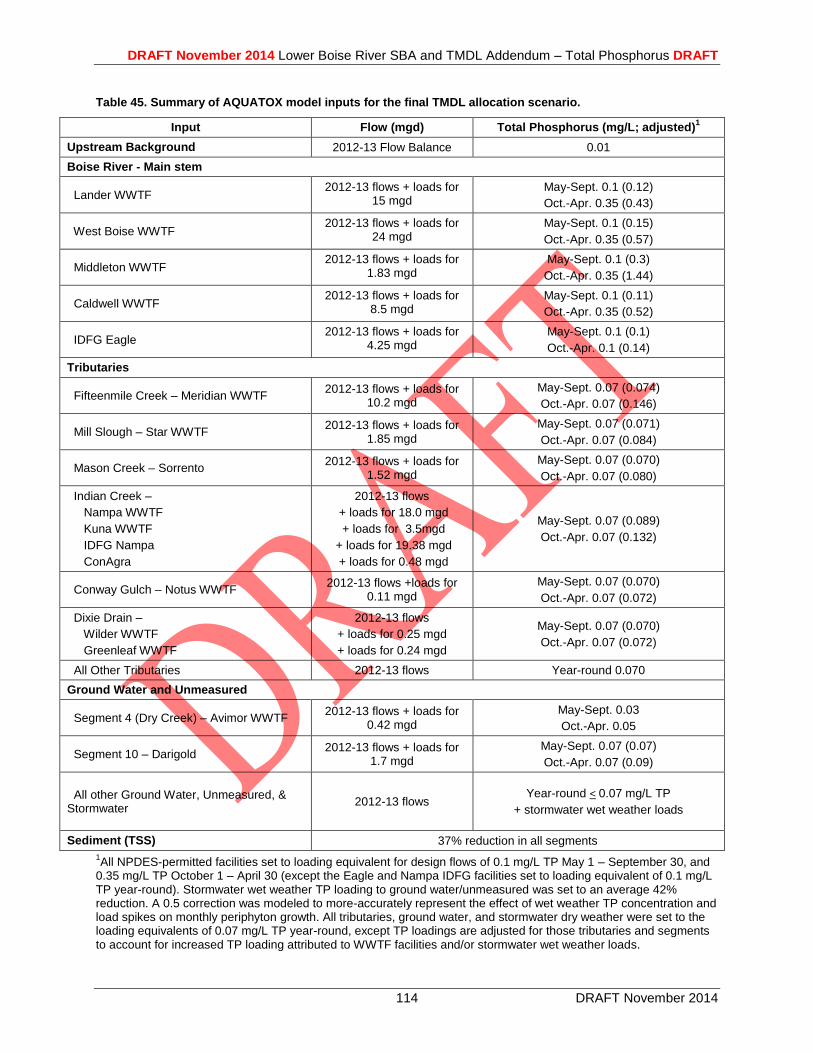
DRAFT November 2014 Lower Boise River SBA and TMDL Addendum – Total Phosphorus DRAFT
114 DRAFT November 2014
Table 45. Summary of AQUATOX model inputs for the final TMDL allocation scenario.
Input Flow (mgd) Total Phosphorus (mg/L; adjusted)1
Upstream Background 2012-13 Flow Balance 0.01
Boise River - Main stem
Lander WWTF 2012-13 flows + loads for
15 mgd May-Sept. 0.1 (0.12)
Oct.-Apr. 0.35 (0.43)
West Boise WWTF 2012-13 flows + loads for
24 mgd May-Sept. 0.1 (0.15)
Oct.-Apr. 0.35 (0.57)
Middleton WWTF 2012-13 flows + loads for
1.83 mgd May-Sept. 0.1 (0.3)
Oct.-Apr. 0.35 (1.44)
Caldwell WWTF 2012-13 flows + loads for
8.5 mgd May-Sept. 0.1 (0.11)
Oct.-Apr. 0.35 (0.52)
IDFG Eagle 2012-13 flows + loads for
4.25 mgd May-Sept. 0.1 (0.1)
Oct.-Apr. 0.1 (0.14)
Tributaries
Fifteenmile Creek – Meridian WWTF 2012-13 flows + loads for
10.2 mgd
May-Sept. 0.07 (0.074)
Oct.-Apr. 0.07 (0.146)
Mill Slough – Star WWTF 2012-13 flows + loads for
1.85 mgd
May-Sept. 0.07 (0.071)
Oct.-Apr. 0.07 (0.084)
Mason Creek – Sorrento 2012-13 flows + loads for
1.52 mgd
May-Sept. 0.07 (0.070)
Oct.-Apr. 0.07 (0.080)
Indian Creek –
Nampa WWTF
Kuna WWTF
IDFG Nampa
ConAgra
2012-13 flows
+ loads for 18.0 mgd
+ loads for 3.5mgd
+ loads for 19.38 mgd
+ loads for 0.48 mgd
May-Sept. 0.07 (0.089)
Oct.-Apr. 0.07 (0.132)
Conway Gulch – Notus WWTF 2012-13 flows +loads for
0.11 mgd
May-Sept. 0.07 (0.070)
Oct.-Apr. 0.07 (0.072)
Dixie Drain –
Wilder WWTF
Greenleaf WWTF
2012-13 flows
+ loads for 0.25 mgd
+ loads for 0.24 mgd
May-Sept. 0.07 (0.070)
Oct.-Apr. 0.07 (0.072)
All Other Tributaries 2012-13 flows Year-round 0.070
Ground Water and Unmeasured
Segment 4 (Dry Creek) – Avimor WWTF 2012-13 flows + loads for
0.42 mgd
May-Sept. 0.03
Oct.-Apr. 0.05
Segment 10 – Darigold 2012-13 flows + loads for
1.7 mgd
May-Sept. 0.07 (0.07)
Oct.-Apr. 0.07 (0.09)
All other Ground Water, Unmeasured, & Stormwater
2012-13 flows Year-round < 0.07 mg/L TP
+ stormwater wet weather loads
Sediment (TSS) 37% reduction in all segments
1All NPDES-permitted facilities set to loading equivalent for design flows of 0.1 mg/L TP May 1 – September 30, and
0.35 mg/L TP October 1 – April 30 (except the Eagle and Nampa IDFG facilities set to loading equivalent of 0.1 mg/L TP year-round). Stormwater wet weather TP loading to ground water/unmeasured was set to an average 42% reduction. A 0.5 correction was modeled to more-accurately represent the effect of wet weather TP concentration and load spikes on monthly periphyton growth. All tributaries, ground water, and stormwater dry weather were set to the loading equivalents of 0.07 mg/L TP year-round, except TP loadings are adjusted for those tributaries and segments to account for increased TP loading attributed to WWTF facilities and/or stormwater wet weather loads.
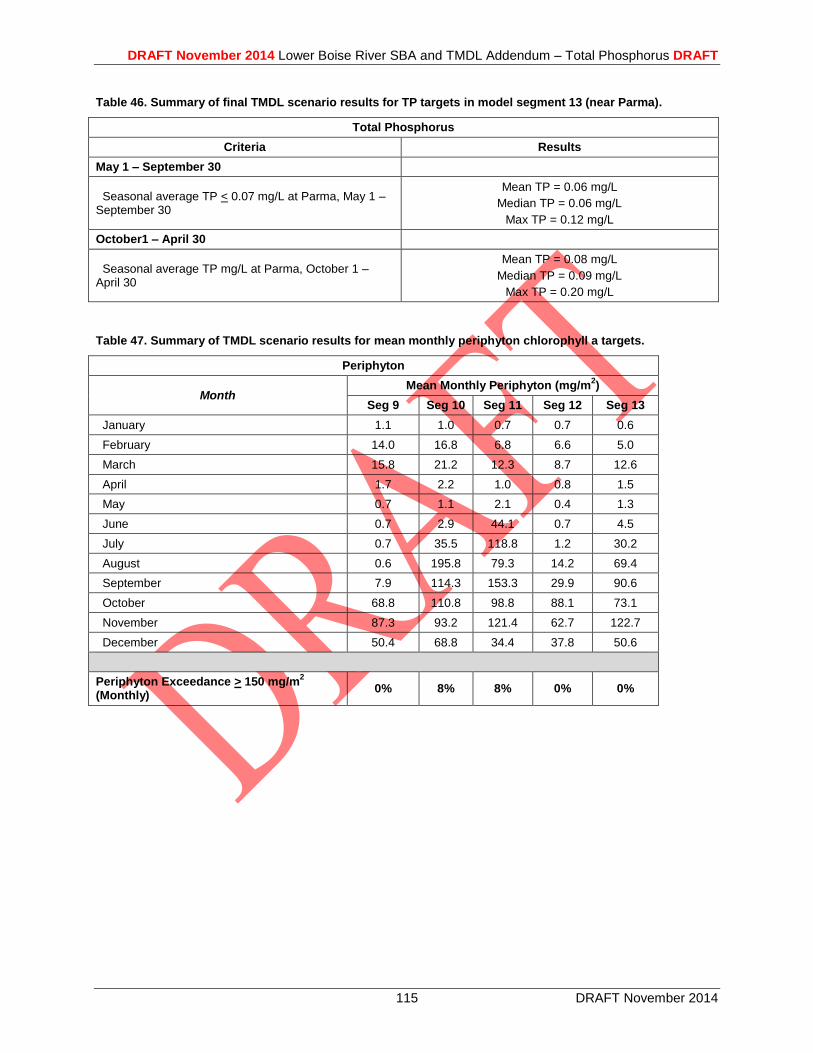
DRAFT November 2014 Lower Boise River SBA and TMDL Addendum – Total Phosphorus DRAFT
115 DRAFT November 2014
Table 46. Summary of final TMDL scenario results for TP targets in model segment 13 (near Parma).
Total Phosphorus
Criteria Results
May 1 – September 30
Seasonal average TP < 0.07 mg/L at Parma, May 1 – September 30
Mean TP = 0.06 mg/L
Median TP = 0.06 mg/L
Max TP = 0.12 mg/L
October1 – April 30
Seasonal average TP mg/L at Parma, October 1 – April 30
Mean TP = 0.08 mg/L
Median TP = 0.09 mg/L
Max TP = 0.20 mg/L
Table 47. Summary of TMDL scenario results for mean monthly periphyton chlorophyll a targets.
Periphyton
Month Mean Monthly Periphyton (mg/m
2)
Seg 9 Seg 10 Seg 11 Seg 12 Seg 13
January 1.1 1.0 0.7 0.7 0.6
February 14.0 16.8 6.8 6.6 5.0
March 15.8 21.2 12.3 8.7 12.6
April 1.7 2.2 1.0 0.8 1.5
May 0.7 1.1 2.1 0.4 1.3
June 0.7 2.9 44.1 0.7 4.5
July 0.7 35.5 118.8 1.2 30.2
August 0.6 195.8 79.3 14.2 69.4
September 7.9 114.3 153.3 29.9 90.6
October 68.8 110.8 98.8 88.1 73.1
November 87.3 93.2 121.4 62.7 122.7
December 50.4 68.8 34.4 37.8 50.6
Periphyton Exceedance > 150 mg/m2
(Monthly) 0% 8% 8% 0% 0%
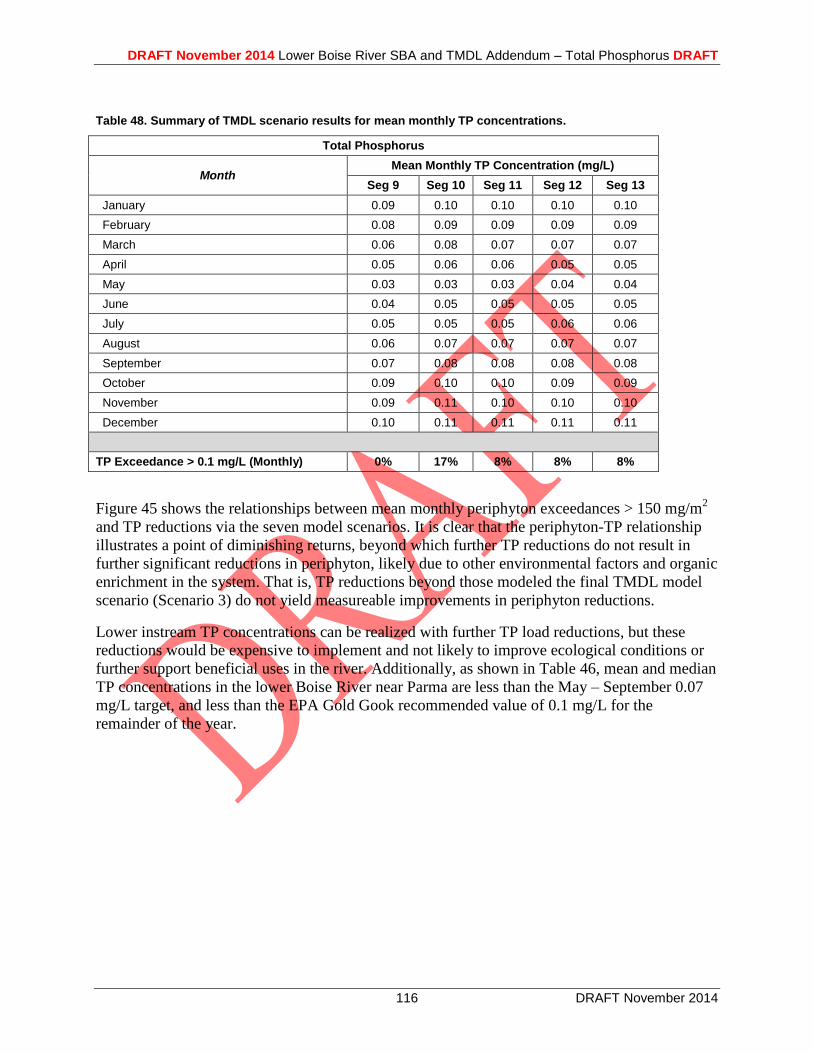
DRAFT November 2014 Lower Boise River SBA and TMDL Addendum – Total Phosphorus DRAFT
116 DRAFT November 2014
Table 48. Summary of TMDL scenario results for mean monthly TP concentrations.
Total Phosphorus
Month Mean Monthly TP Concentration (mg/L)
Seg 9 Seg 10 Seg 11 Seg 12 Seg 13
January 0.09 0.10 0.10 0.10 0.10
February 0.08 0.09 0.09 0.09 0.09
March 0.06 0.08 0.07 0.07 0.07
April 0.05 0.06 0.06 0.05 0.05
May 0.03 0.03 0.03 0.04 0.04
June 0.04 0.05 0.05 0.05 0.05
July 0.05 0.05 0.05 0.06 0.06
August 0.06 0.07 0.07 0.07 0.07
September 0.07 0.08 0.08 0.08 0.08
October 0.09 0.10 0.10 0.09 0.09
November 0.09 0.11 0.10 0.10 0.10
December 0.10 0.11 0.11 0.11 0.11
TP Exceedance > 0.1 mg/L (Monthly) 0% 17% 8% 8% 8%
Figure 45 shows the relationships between mean monthly periphyton exceedances > 150 mg/m2
and TP reductions via the seven model scenarios. It is clear that the periphyton-TP relationship
illustrates a point of diminishing returns, beyond which further TP reductions do not result in
further significant reductions in periphyton, likely due to other environmental factors and organic
enrichment in the system. That is, TP reductions beyond those modeled the final TMDL model
scenario (Scenario 3) do not yield measureable improvements in periphyton reductions.
Lower instream TP concentrations can be realized with further TP load reductions, but these
reductions would be expensive to implement and not likely to improve ecological conditions or
further support beneficial uses in the river. Additionally, as shown in Table 46, mean and median
TP concentrations in the lower Boise River near Parma are less than the May – September 0.07
mg/L target, and less than the EPA Gold Gook recommended value of 0.1 mg/L for the
remainder of the year.

DRAFT November 2014 Lower Boise River SBA and TMDL Addendum – Total Phosphorus DRAFT
117 DRAFT November 2014
Figure 45. Annual average periphyton in model segments 9-13 (the impaired AUs of the lower Boise River) under seven model scenarios. Further descriptions of each model scenario are available in the preceding paragraphs.
Figure 46 shows the existing modeled conditions and mean monthly periphyton in segments 9-
13, with exceedances occurring during multiple months in segment 10 and segment 11. Figure 47
shows mean monthly periphyton in segments 9-13 under the final model scenario (Scenario 3)
and TMDL allocations. This results in a significant reduction in overall periphyton growth
throughout the year. Although overall periphyton drops throughout these segments, the
temporary exceedances in segments 10 and 11 persist because of a shift in periphyton species,
becoming dominated by low nutrient diatoms, which proliferate under low nutrient
concentrations.
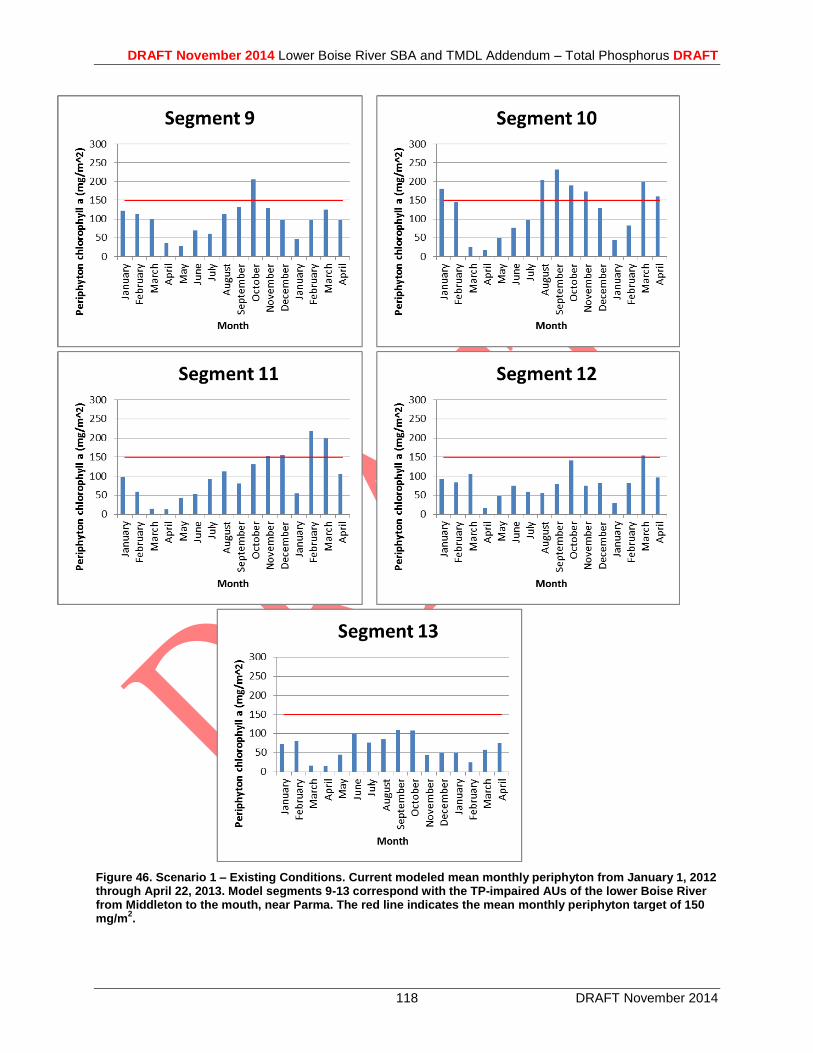
DRAFT November 2014 Lower Boise River SBA and TMDL Addendum – Total Phosphorus DRAFT
118 DRAFT November 2014
Figure 46. Scenario 1 – Existing Conditions. Current modeled mean monthly periphyton from January 1, 2012 through April 22, 2013. Model segments 9-13 correspond with the TP-impaired AUs of the lower Boise River from Middleton to the mouth, near Parma. The red line indicates the mean monthly periphyton target of 150 mg/m
2.
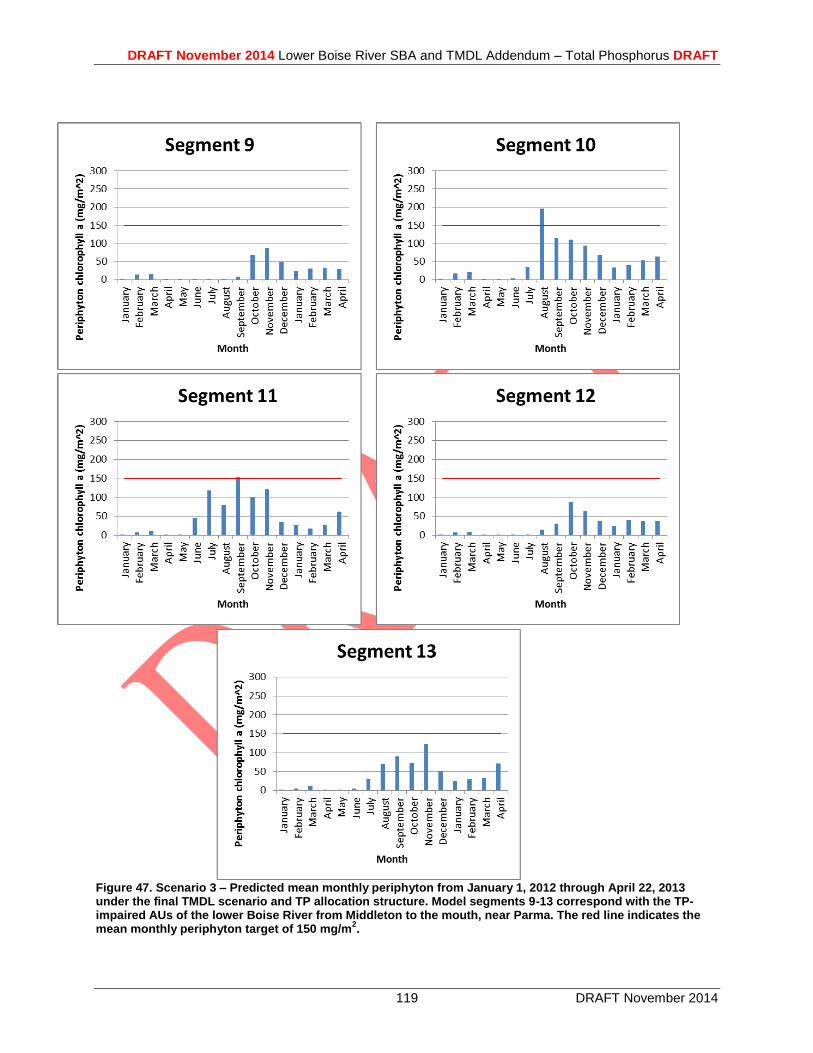
DRAFT November 2014 Lower Boise River SBA and TMDL Addendum – Total Phosphorus DRAFT
119 DRAFT November 2014
Figure 47. Scenario 3 – Predicted mean monthly periphyton from January 1, 2012 through April 22, 2013 under the final TMDL scenario and TP allocation structure. Model segments 9-13 correspond with the TP-impaired AUs of the lower Boise River from Middleton to the mouth, near Parma. The red line indicates the mean monthly periphyton target of 150 mg/m
2.
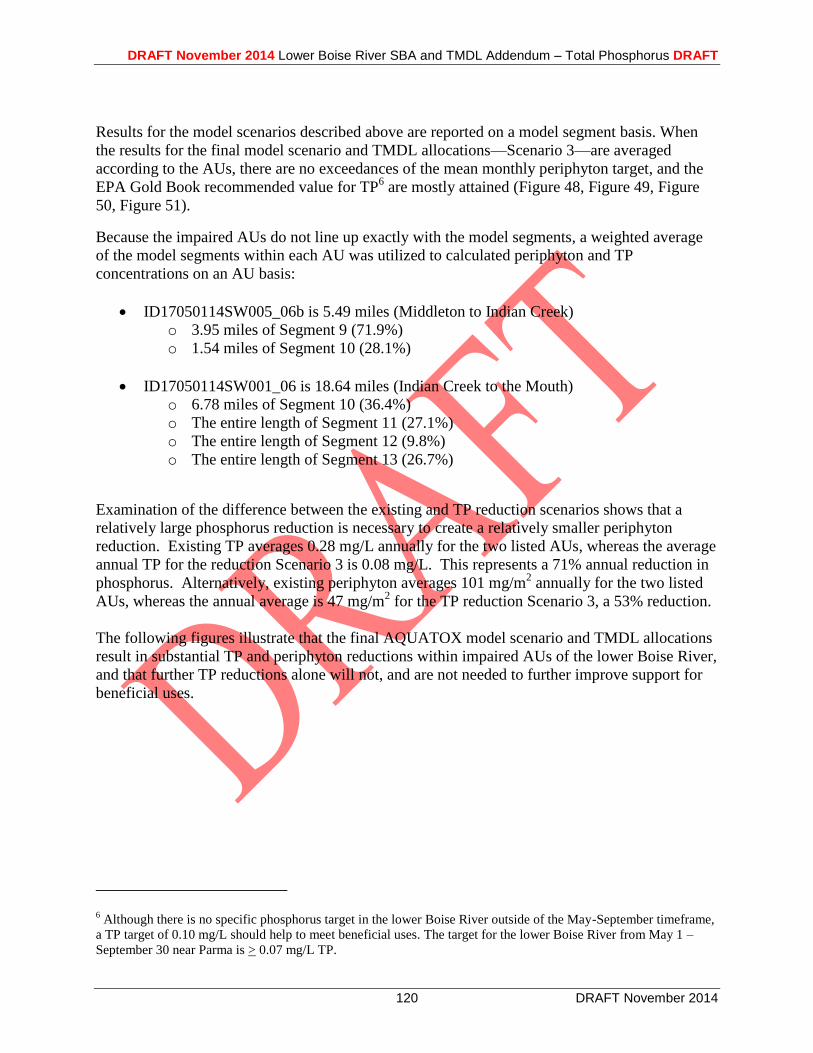
DRAFT November 2014 Lower Boise River SBA and TMDL Addendum – Total Phosphorus DRAFT
120 DRAFT November 2014
Results for the model scenarios described above are reported on a model segment basis. When
the results for the final model scenario and TMDL allocations—Scenario 3—are averaged
according to the AUs, there are no exceedances of the mean monthly periphyton target, and the
EPA Gold Book recommended value for TP6 are mostly attained (Figure 48, Figure 49, Figure
50, Figure 51).
Because the impaired AUs do not line up exactly with the model segments, a weighted average
of the model segments within each AU was utilized to calculated periphyton and TP
concentrations on an AU basis:
ID17050114SW005_06b is 5.49 miles (Middleton to Indian Creek)
o 3.95 miles of Segment 9 (71.9%)
o 1.54 miles of Segment 10 (28.1%)
ID17050114SW001_06 is 18.64 miles (Indian Creek to the Mouth)
o 6.78 miles of Segment 10 (36.4%)
o The entire length of Segment 11 (27.1%)
o The entire length of Segment 12 (9.8%)
o The entire length of Segment 13 (26.7%)
Examination of the difference between the existing and TP reduction scenarios shows that a
relatively large phosphorus reduction is necessary to create a relatively smaller periphyton
reduction. Existing TP averages 0.28 mg/L annually for the two listed AUs, whereas the average
annual TP for the reduction Scenario 3 is 0.08 mg/L. This represents a 71% annual reduction in
phosphorus. Alternatively, existing periphyton averages 101 mg/m2 annually for the two listed
AUs, whereas the annual average is 47 mg/m2 for the TP reduction Scenario 3, a 53% reduction.
The following figures illustrate that the final AQUATOX model scenario and TMDL allocations
result in substantial TP and periphyton reductions within impaired AUs of the lower Boise River,
and that further TP reductions alone will not, and are not needed to further improve support for
beneficial uses.
6 Although there is no specific phosphorus target in the lower Boise River outside of the May-September timeframe,
a TP target of 0.10 mg/L should help to meet beneficial uses. The target for the lower Boise River from May 1 –
September 30 near Parma is > 0.07 mg/L TP.

DRAFT November 2014 Lower Boise River SBA and TMDL Addendum – Total Phosphorus DRAFT
121 DRAFT November 2014
Figure 48. Current modeled mean monthly periphyton from January 1, 2012 through April 22, 2013 in the TP-impaired AUs of the lower Boise River. The red line indicates the mean monthly periphyton target of 150 mg/m
2.

DRAFT November 2014 Lower Boise River SBA and TMDL Addendum – Total Phosphorus DRAFT
122 DRAFT November 2014
Figure 49. Predicted mean monthly periphyton from January 1, 2012 through April 22, 2013 under the final TMDL scenario (Scenario 3) and TP allocation structure in the TP-impaired AUs of the lower Boise River. The red line indicates the mean monthly periphyton target of 150 mg/m
2.
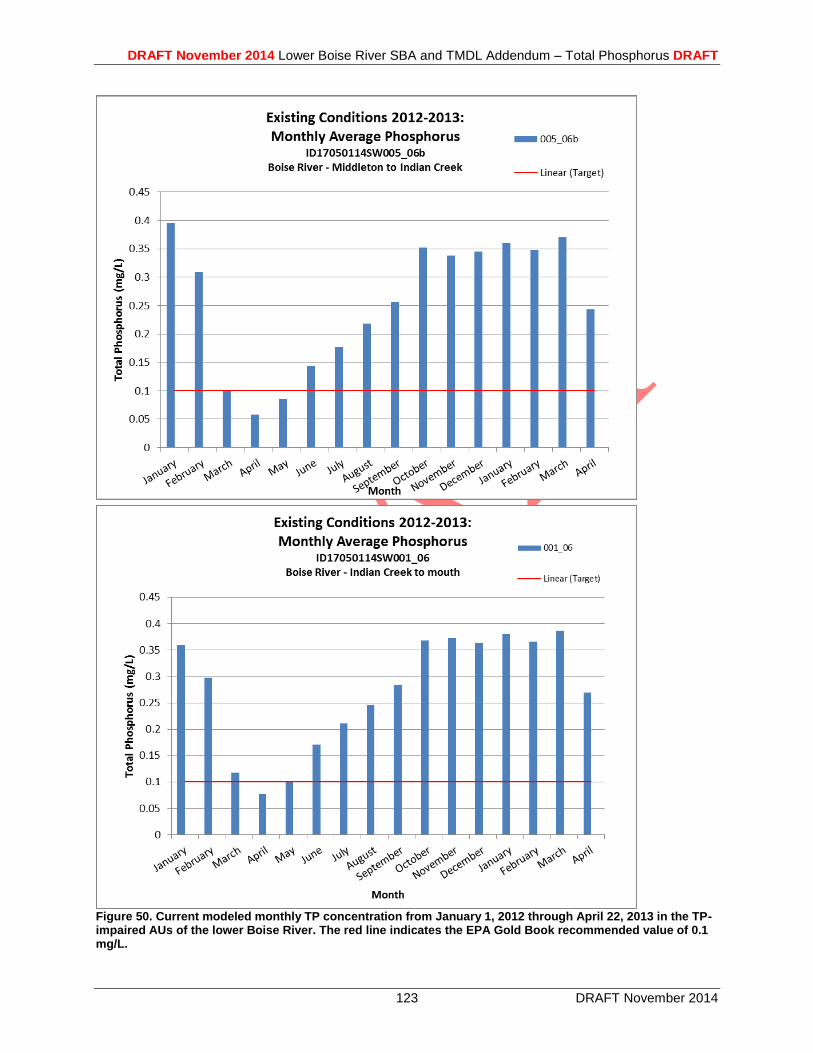
DRAFT November 2014 Lower Boise River SBA and TMDL Addendum – Total Phosphorus DRAFT
123 DRAFT November 2014
Figure 50. Current modeled monthly TP concentration from January 1, 2012 through April 22, 2013 in the TP-impaired AUs of the lower Boise River. The red line indicates the EPA Gold Book recommended value of 0.1 mg/L.
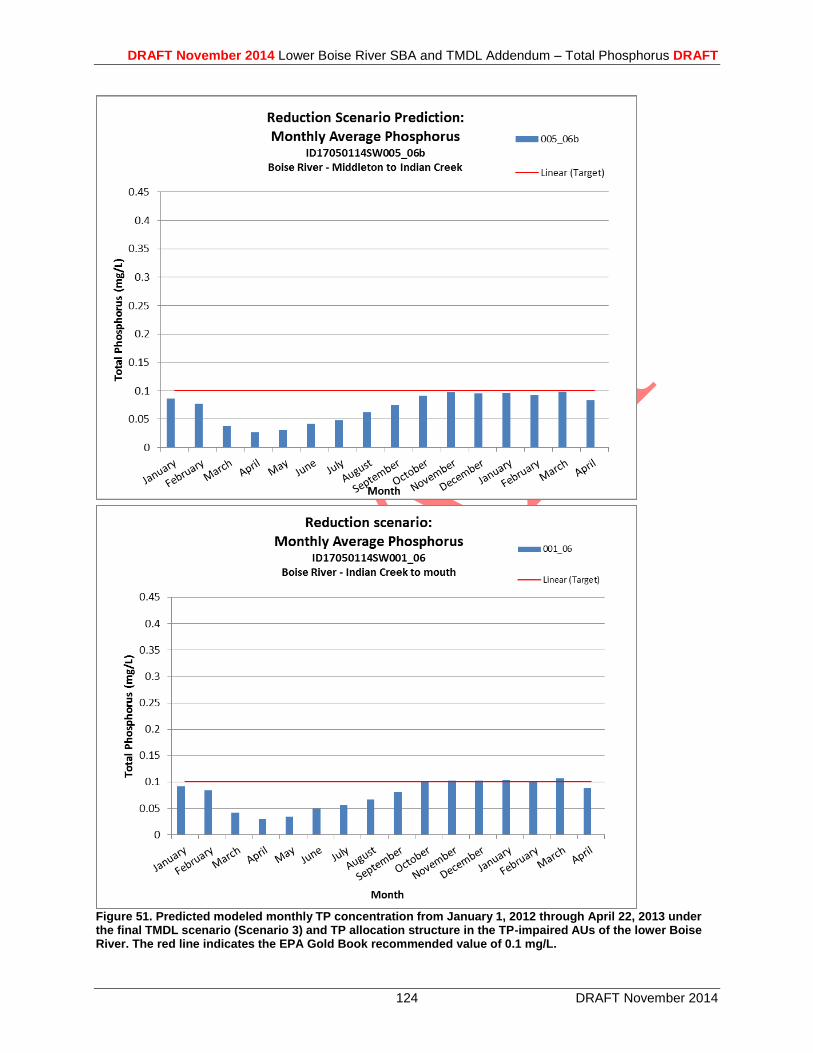
DRAFT November 2014 Lower Boise River SBA and TMDL Addendum – Total Phosphorus DRAFT
124 DRAFT November 2014
Figure 51. Predicted modeled monthly TP concentration from January 1, 2012 through April 22, 2013 under the final TMDL scenario (Scenario 3) and TP allocation structure in the TP-impaired AUs of the lower Boise River. The red line indicates the EPA Gold Book recommended value of 0.1 mg/L.
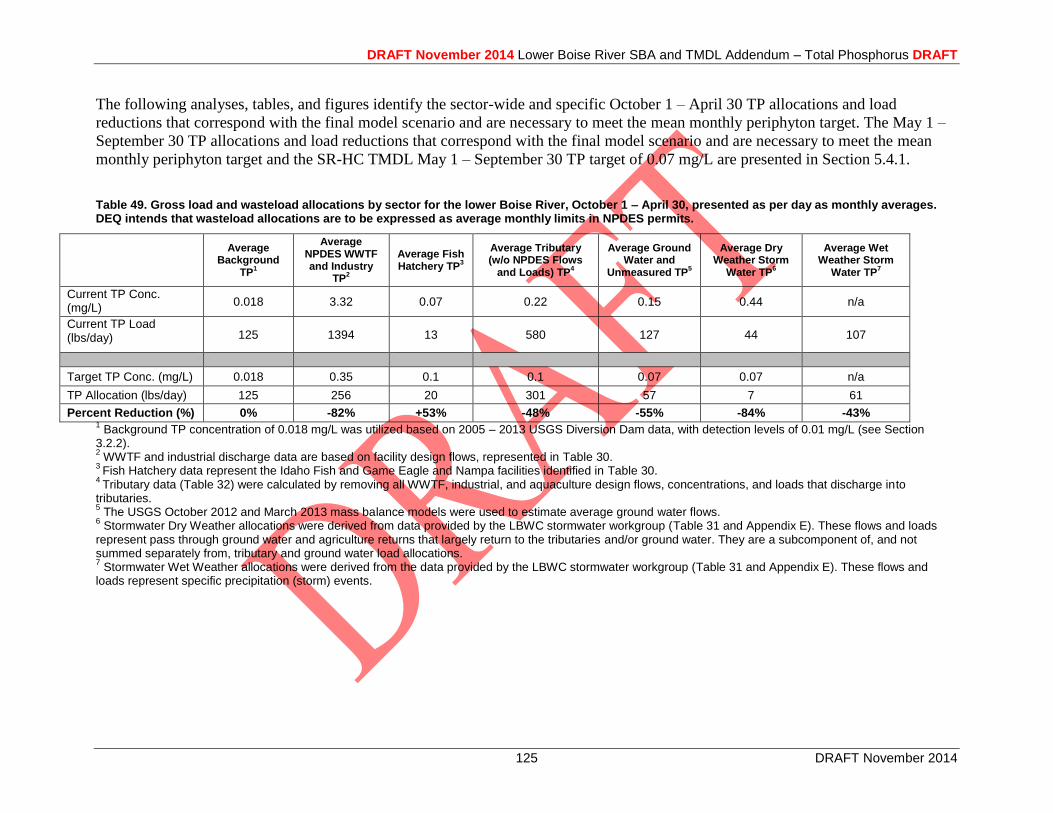
DRAFT November 2014 Lower Boise River SBA and TMDL Addendum – Total Phosphorus DRAFT
125 DRAFT November 2014
The following analyses, tables, and figures identify the sector-wide and specific October 1 – April 30 TP allocations and load
reductions that correspond with the final model scenario and are necessary to meet the mean monthly periphyton target. The May 1 –
September 30 TP allocations and load reductions that correspond with the final model scenario and are necessary to meet the mean
monthly periphyton target and the SR-HC TMDL May 1 – September 30 TP target of 0.07 mg/L are presented in Section 5.4.1.
Table 49. Gross load and wasteload allocations by sector for the lower Boise River, October 1 – April 30, presented as per day as monthly averages. DEQ intends that wasteload allocations are to be expressed as average monthly limits in NPDES permits.
Average Background
TP1
Average NPDES WWTF and Industry
TP2
Average Fish Hatchery TP
3
Average Tributary (w/o NPDES Flows
and Loads) TP4
Average Ground Water and
Unmeasured TP5
Average Dry Weather Storm
Water TP6
Average Wet Weather Storm
Water TP7
Current TP Conc. (mg/L)
0.018 3.32 0.07 0.22 0.15 0.44 n/a
Current TP Load (lbs/day) 125 1394 13 580 127 44 107
Target TP Conc. (mg/L) 0.018 0.35 0.1 0.1 0.07 0.07 n/a
TP Allocation (lbs/day) 125 256 20 301 57 7 61
Percent Reduction (%) 0% -82% +53% -48% -55% -84% -43% 1 Background TP concentration of 0.018 mg/L was utilized based on 2005 – 2013 USGS Diversion Dam data, with detection levels of 0.01 mg/L (see Section
3.2.2). 2 WWTF and industrial discharge data are based on facility design flows, represented in Table 30.
3 Fish Hatchery data represent the Idaho Fish and Game Eagle and Nampa facilities identified in Table 30.
4 Tributary data (Table 32) were calculated by removing all WWTF, industrial, and aquaculture design flows, concentrations, and loads that discharge into
tributaries. 5 The USGS October 2012 and March 2013 mass balance models were used to estimate average ground water flows.
6 Stormwater Dry Weather allocations were derived from data provided by the LBWC stormwater workgroup (Table 31 and Appendix E). These flows and loads
represent pass through ground water and agriculture returns that largely return to the tributaries and/or ground water. They are a subcomponent of, and not summed separately from, tributary and ground water load allocations. 7 Stormwater Wet Weather allocations were derived from the data provided by the LBWC stormwater workgroup (Table 31 and Appendix E). These flows and
loads represent specific precipitation (storm) events.
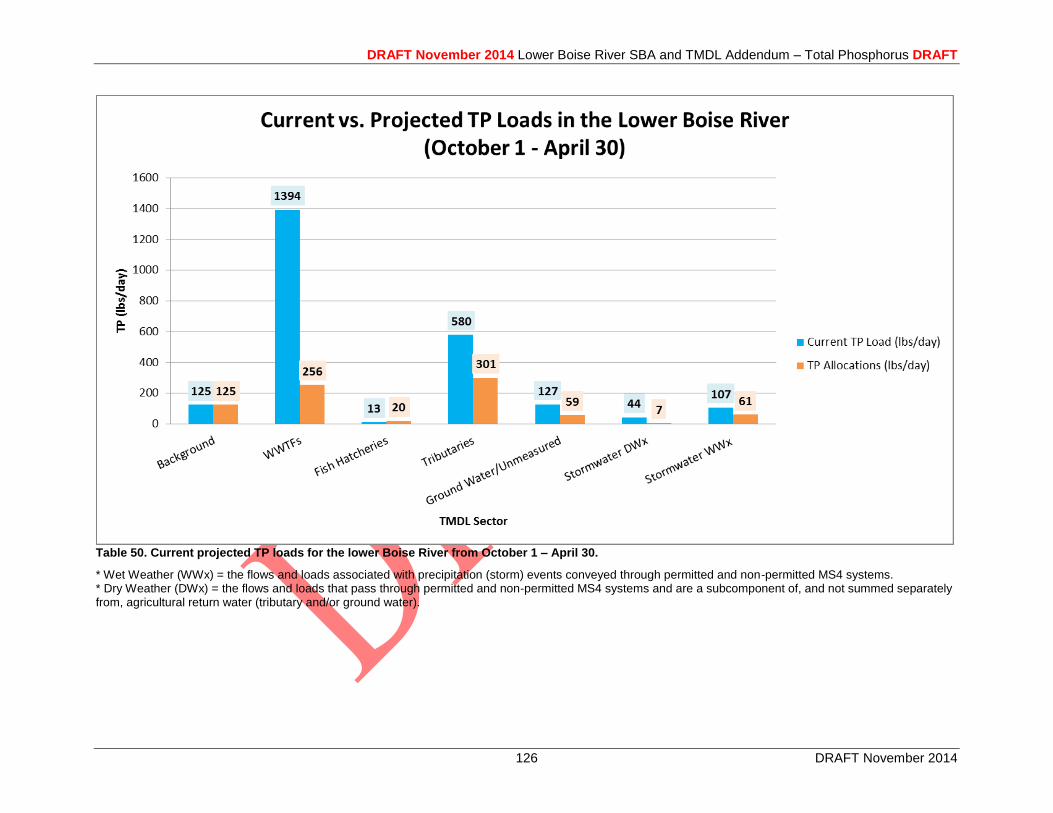
DRAFT November 2014 Lower Boise River SBA and TMDL Addendum – Total Phosphorus DRAFT
126 DRAFT November 2014
Table 50. Current projected TP loads for the lower Boise River from October 1 – April 30.
* Wet Weather (WWx) = the flows and loads associated with precipitation (storm) events conveyed through permitted and non-permitted MS4 systems. * Dry Weather (DWx) = the flows and loads that pass through permitted and non-permitted MS4 systems and are a subcomponent of, and not summed separately from, agricultural return water (tributary and/or ground water).
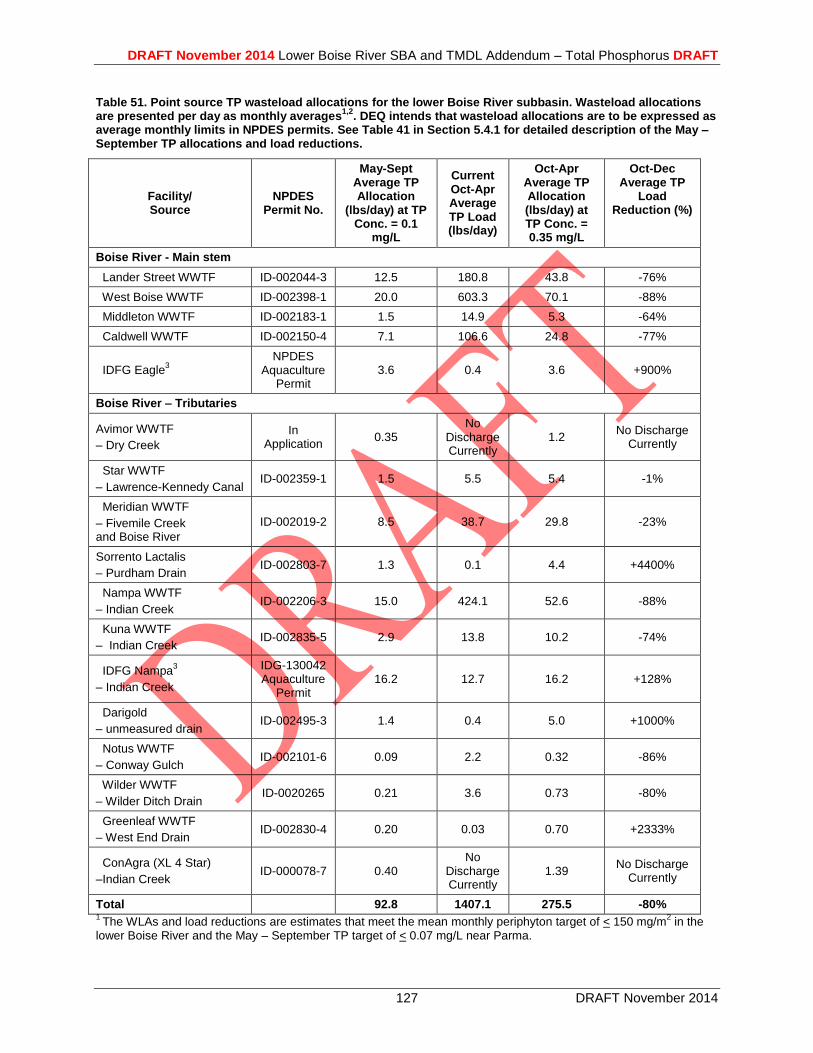
DRAFT November 2014 Lower Boise River SBA and TMDL Addendum – Total Phosphorus DRAFT
127 DRAFT November 2014
Table 51. Point source TP wasteload allocations for the lower Boise River subbasin. Wasteload allocations are presented per day as monthly averages
1,2. DEQ intends that wasteload allocations are to be expressed as
average monthly limits in NPDES permits. See Table 41 in Section 5.4.1 for detailed description of the May – September TP allocations and load reductions.
Facility/ Source
NPDES Permit No.
May-Sept Average TP Allocation
(lbs/day) at TP Conc. = 0.1
mg/L
Current Oct-Apr Average TP Load (lbs/day)
Oct-Apr Average TP Allocation (lbs/day) at TP Conc. = 0.35 mg/L
Oct-Dec Average TP
Load Reduction (%)
Boise River - Main stem
Lander Street WWTF ID-002044-3 12.5 180.8 43.8 -76%
West Boise WWTF ID-002398-1 20.0 603.3 70.1 -88%
Middleton WWTF ID-002183-1 1.5 14.9 5.3 -64%
Caldwell WWTF ID-002150-4 7.1 106.6 24.8 -77%
IDFG Eagle3
NPDES Aquaculture
Permit 3.6 0.4 3.6 +900%
Boise River – Tributaries
Avimor WWTF
– Dry Creek
In Application
0.35 No
Discharge Currently
1.2 No Discharge
Currently
Star WWTF
– Lawrence-Kennedy Canal ID-002359-1 1.5 5.5 5.4 -1%
Meridian WWTF
– Fivemile Creek and Boise River
ID-002019-2 8.5 38.7 29.8 -23%
Sorrento Lactalis
– Purdham Drain ID-002803-7 1.3 0.1 4.4 +4400%
Nampa WWTF
– Indian Creek ID-002206-3 15.0 424.1 52.6 -88%
Kuna WWTF
– Indian Creek ID-002835-5 2.9 13.8 10.2 -74%
IDFG Nampa3
– Indian Creek
IDG-130042 Aquaculture
Permit 16.2 12.7 16.2 +128%
Darigold
– unmeasured drain ID-002495-3 1.4 0.4 5.0 +1000%
Notus WWTF
– Conway Gulch ID-002101-6 0.09 2.2 0.32 -86%
Wilder WWTF
– Wilder Ditch Drain ID-0020265 0.21 3.6 0.73 -80%
Greenleaf WWTF
– West End Drain ID-002830-4 0.20 0.03 0.70 +2333%
ConAgra (XL 4 Star)
–Indian Creek ID-000078-7 0.40
No Discharge Currently
1.39 No Discharge
Currently
Total 92.8 1407.1 275.5 -80% 1
The WLAs and load reductions are estimates that meet the mean monthly periphyton target of < 150 mg/m2 in the
lower Boise River and the May – September TP target of < 0.07 mg/L near Parma.
DRAFT November 2014 Lower Boise River SBA and TMDL Addendum – Total Phosphorus DRAFT
128 DRAFT November 2014
2 It is expected that all NPDES point source facilities will meet the wasteload allocation targets within compliance
schedules granted by DEQ and approved by EPA. Meeting the wasteload allocation targets is expected to occur through enhanced technology and/or water quality trading. This TMDL addendum provides opportunity for potentially re-opening NPDES permits, by providing new water quality information. 3 Due to their operations it is unlikely that the IDFG Eagle and Nampa fish hatcheries will discharge or need to
discharge above a TP concentration of 0.1 mg/L. As a result, their wasteload allocation is set for 0.1 mg/L year-round.
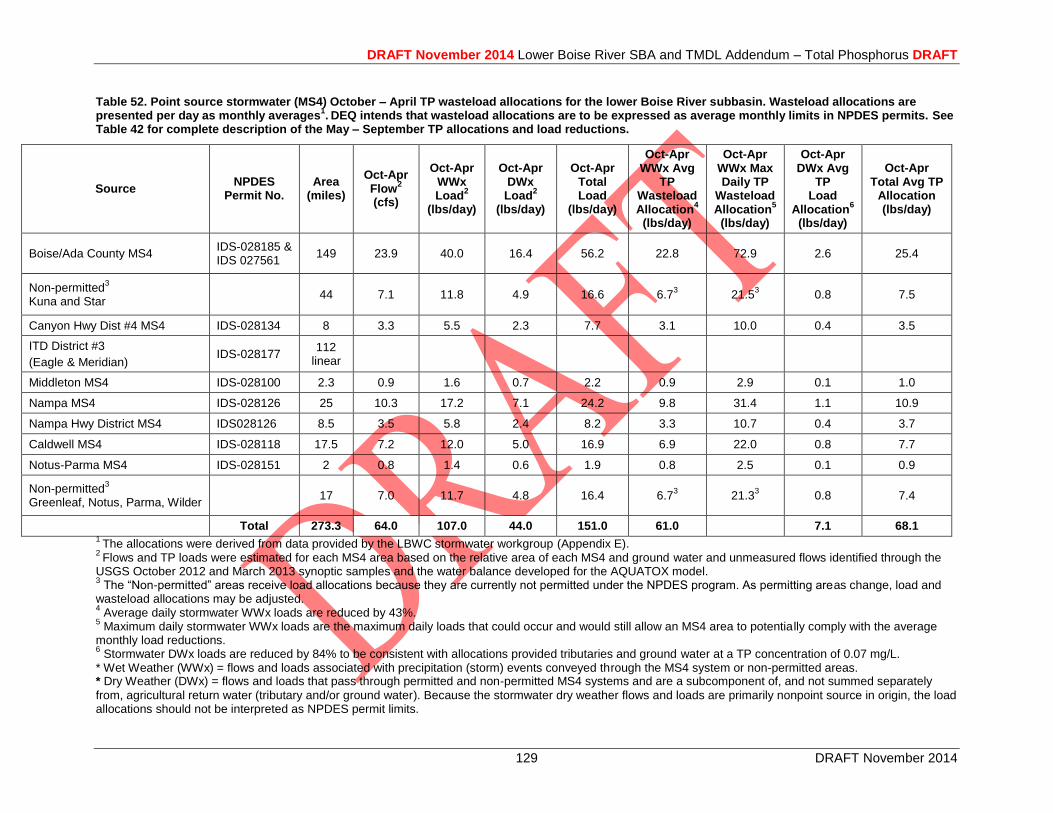
DRAFT November 2014 Lower Boise River SBA and TMDL Addendum – Total Phosphorus DRAFT
129 DRAFT November 2014
Table 52. Point source stormwater (MS4) October – April TP wasteload allocations for the lower Boise River subbasin. Wasteload allocations are presented per day as monthly averages
1. DEQ intends that wasteload allocations are to be expressed as average monthly limits in NPDES permits. See
Table 42 for complete description of the May – September TP allocations and load reductions.
Source NPDES
Permit No. Area
(miles)
Oct-Apr Flow
2
(cfs)
Oct-Apr WWx Load
2
(lbs/day)
Oct-Apr DWx Load
2
(lbs/day)
Oct-Apr Total Load
(lbs/day)
Oct-Apr WWx Avg
TP Wasteload Allocation
4
(lbs/day)
Oct-Apr WWx Max Daily TP
Wasteload Allocation
5
(lbs/day)
Oct-Apr DWx Avg
TP Load
Allocation6
(lbs/day)
Oct-Apr Total Avg TP
Allocation (lbs/day)
Boise/Ada County MS4 IDS-028185 & IDS 027561
149 23.9 40.0 16.4 56.2 22.8 72.9 2.6 25.4
Non-permitted3
Kuna and Star 44 7.1 11.8 4.9 16.6 6.7
3 21.5
3 0.8 7.5
Canyon Hwy Dist #4 MS4 IDS-028134 8 3.3 5.5 2.3 7.7 3.1 10.0 0.4 3.5
ITD District #3
(Eagle & Meridian) IDS-028177
112 linear
Middleton MS4 IDS-028100 2.3 0.9 1.6 0.7 2.2 0.9 2.9 0.1 1.0
Nampa MS4 IDS-028126 25 10.3 17.2 7.1 24.2 9.8 31.4 1.1 10.9
Nampa Hwy District MS4 IDS028126 8.5 3.5 5.8 2.4 8.2 3.3 10.7 0.4 3.7
Caldwell MS4 IDS-028118 17.5 7.2 12.0 5.0 16.9 6.9 22.0 0.8 7.7
Notus-Parma MS4 IDS-028151 2 0.8 1.4 0.6 1.9 0.8 2.5 0.1 0.9
Non-permitted3
Greenleaf, Notus, Parma, Wilder 17 7.0 11.7 4.8 16.4 6.7
3 21.3
3 0.8 7.4
Total 273.3 64.0 107.0 44.0 151.0 61.0 7.1 68.1
1 The allocations were derived from data provided by the LBWC stormwater workgroup (Appendix E).
2 Flows and TP loads were estimated for each MS4 area based on the relative area of each MS4 and ground water and unmeasured flows identified through the
USGS October 2012 and March 2013 synoptic samples and the water balance developed for the AQUATOX model. 3 The “Non-permitted” areas receive load allocations because they are currently not permitted under the NPDES program. As permitting areas change, load and
wasteload allocations may be adjusted. 4 Average daily stormwater WWx loads are reduced by 43%.
5 Maximum daily stormwater WWx loads are the maximum daily loads that could occur and would still allow an MS4 area to potentially comply with the average
monthly load reductions. 6 Stormwater DWx loads are reduced by 84% to be consistent with allocations provided tributaries and ground water at a TP concentration of 0.07 mg/L.
* Wet Weather (WWx) = flows and loads associated with precipitation (storm) events conveyed through the MS4 system or non-permitted areas. * Dry Weather (DWx) = flows and loads that pass through permitted and non-permitted MS4 systems and are a subcomponent of, and not summed separately
from, agricultural return water (tributary and/or ground water). Because the stormwater dry weather flows and loads are primarily nonpoint source in origin, the load allocations should not be interpreted as NPDES permit limits.
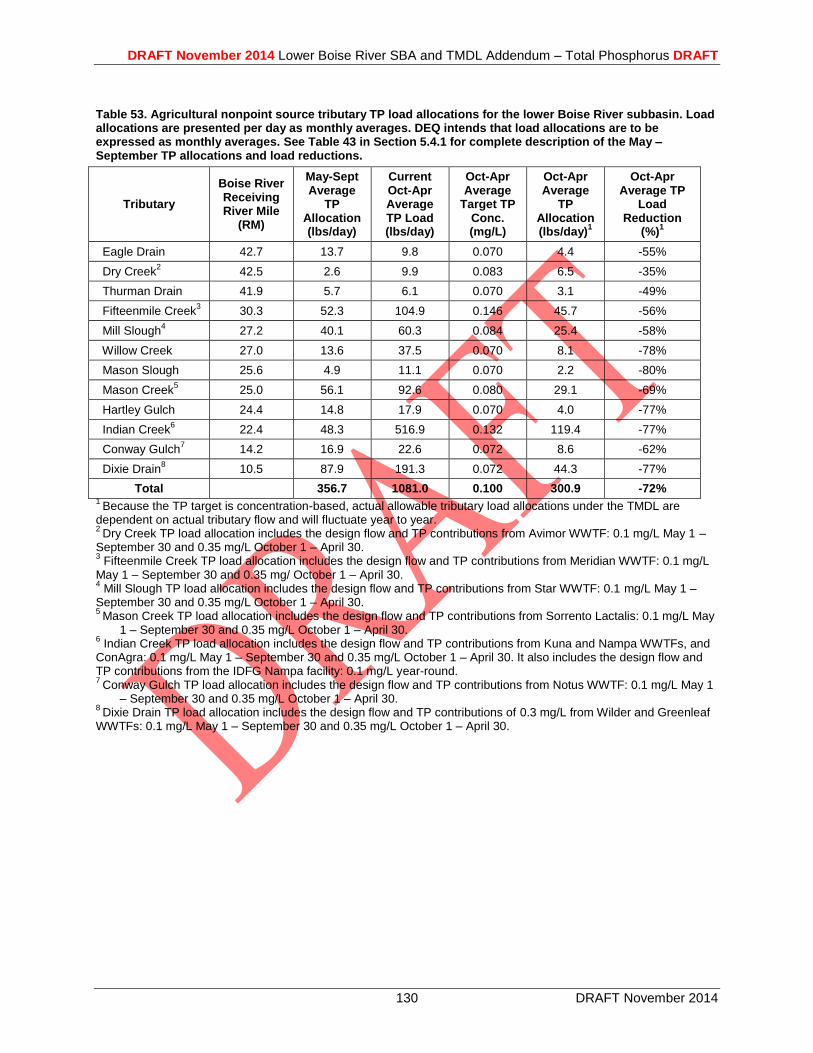
DRAFT November 2014 Lower Boise River SBA and TMDL Addendum – Total Phosphorus DRAFT
130 DRAFT November 2014
Table 53. Agricultural nonpoint source tributary TP load allocations for the lower Boise River subbasin. Load allocations are presented per day as monthly averages. DEQ intends that load allocations are to be expressed as monthly averages. See Table 43 in Section 5.4.1 for complete description of the May – September TP allocations and load reductions.
Tributary
Boise River Receiving River Mile
(RM)
May-Sept Average
TP Allocation (lbs/day)
Current Oct-Apr Average TP Load (lbs/day)
Oct-Apr Average
Target TP Conc. (mg/L)
Oct-Apr Average
TP Allocation (lbs/day)
1
Oct-Apr Average TP
Load Reduction
(%)1
Eagle Drain 42.7 13.7 9.8 0.070 4.4 -55%
Dry Creek2
42.5 2.6 9.9 0.083 6.5 -35%
Thurman Drain 41.9 5.7 6.1 0.070 3.1 -49%
Fifteenmile Creek3
30.3 52.3 104.9 0.146 45.7 -56%
Mill Slough4
27.2 40.1 60.3 0.084 25.4 -58%
Willow Creek 27.0 13.6 37.5 0.070 8.1 -78%
Mason Slough 25.6 4.9 11.1 0.070 2.2 -80%
Mason Creek5
25.0 56.1 92.6 0.080 29.1 -69%
Hartley Gulch 24.4 14.8 17.9 0.070 4.0 -77%
Indian Creek6
22.4 48.3 516.9 0.132 119.4 -77%
Conway Gulch7
14.2 16.9 22.6 0.072 8.6 -62%
Dixie Drain8
10.5 87.9 191.3 0.072 44.3 -77%
Total
356.7 1081.0 0.100 300.9 -72% 1
Because the TP target is concentration-based, actual allowable tributary load allocations under the TMDL are dependent on actual tributary flow and will fluctuate year to year. 2
Dry Creek TP load allocation includes the design flow and TP contributions from Avimor WWTF: 0.1 mg/L May 1 – September 30 and 0.35 mg/L October 1 – April 30. 3 Fifteenmile Creek TP load allocation includes the design flow and TP contributions from Meridian WWTF: 0.1 mg/L
May 1 – September 30 and 0.35 mg/ October 1 – April 30. 4 Mill Slough TP load allocation includes the design flow and TP contributions from Star WWTF: 0.1 mg/L May 1 –
September 30 and 0.35 mg/L October 1 – April 30. 5
Mason Creek TP load allocation includes the design flow and TP contributions from Sorrento Lactalis: 0.1 mg/L May 1 – September 30 and 0.35 mg/L October 1 – April 30.
6 Indian Creek TP load allocation includes the design flow and TP contributions from Kuna and Nampa WWTFs, and
ConAgra: 0.1 mg/L May 1 – September 30 and 0.35 mg/L October 1 – April 30. It also includes the design flow and TP contributions from the IDFG Nampa facility: 0.1 mg/L year-round. 7
Conway Gulch TP load allocation includes the design flow and TP contributions from Notus WWTF: 0.1 mg/L May 1 – September 30 and 0.35 mg/L October 1 – April 30.
8 Dixie Drain TP load allocation includes the design flow and TP contributions of 0.3 mg/L from Wilder and Greenleaf
WWTFs: 0.1 mg/L May 1 – September 30 and 0.35 mg/L October 1 – April 30.
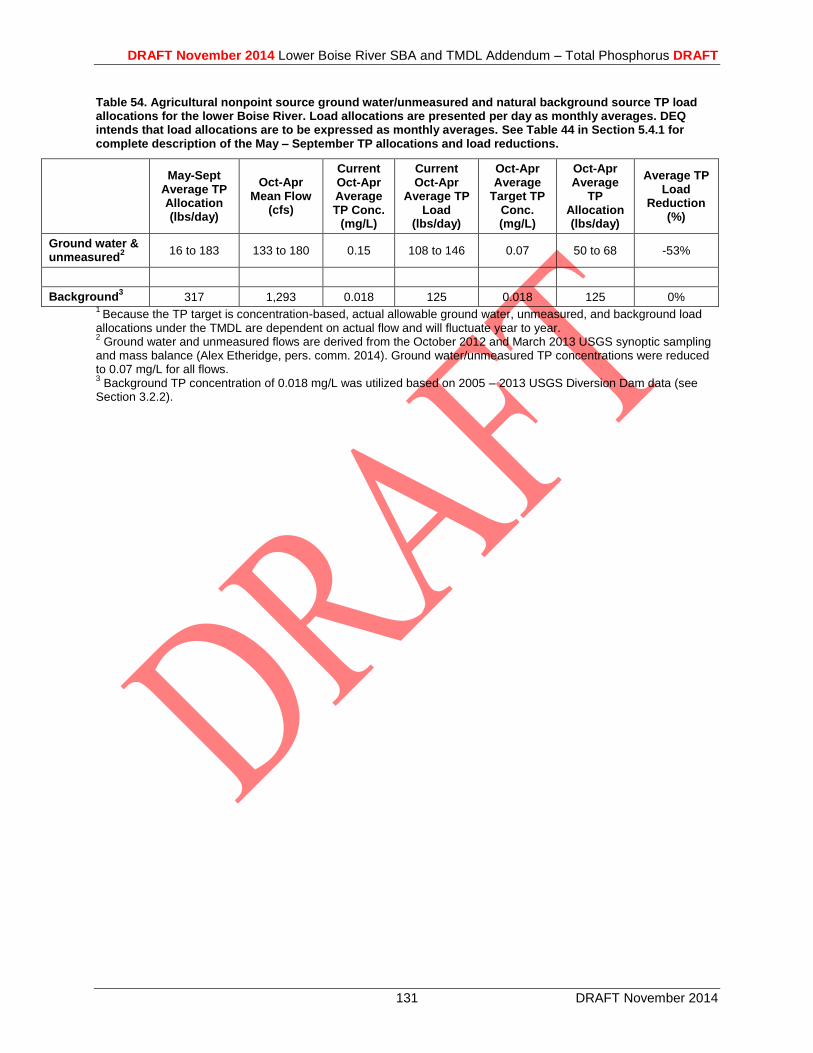
DRAFT November 2014 Lower Boise River SBA and TMDL Addendum – Total Phosphorus DRAFT
131 DRAFT November 2014
Table 54. Agricultural nonpoint source ground water/unmeasured and natural background source TP load allocations for the lower Boise River. Load allocations are presented per day as monthly averages. DEQ intends that load allocations are to be expressed as monthly averages. See Table 44 in Section 5.4.1 for complete description of the May – September TP allocations and load reductions.
May-Sept Average TP Allocation (lbs/day)
Oct-Apr Mean Flow
(cfs)
Current Oct-Apr Average TP Conc.
(mg/L)
Current Oct-Apr
Average TP Load
(lbs/day)
Oct-Apr Average
Target TP Conc. (mg/L)
Oct-Apr Average
TP Allocation (lbs/day)
Average TP Load
Reduction (%)
Ground water & unmeasured
2 16 to 183 133 to 180 0.15 108 to 146 0.07 50 to 68 -53%
Background3
317 1,293 0.018 125 0.018 125 0% 1
Because the TP target is concentration-based, actual allowable ground water, unmeasured, and background load allocations under the TMDL are dependent on actual flow and will fluctuate year to year. 2 Ground water and unmeasured flows are derived from the October 2012 and March 2013 USGS synoptic sampling
and mass balance (Alex Etheridge, pers. comm. 2014). Ground water/unmeasured TP concentrations were reduced to 0.07 mg/L for all flows. 3 Background TP concentration of 0.018 mg/L was utilized based on 2005 – 2013 USGS Diversion Dam data (see
Section 3.2.2).
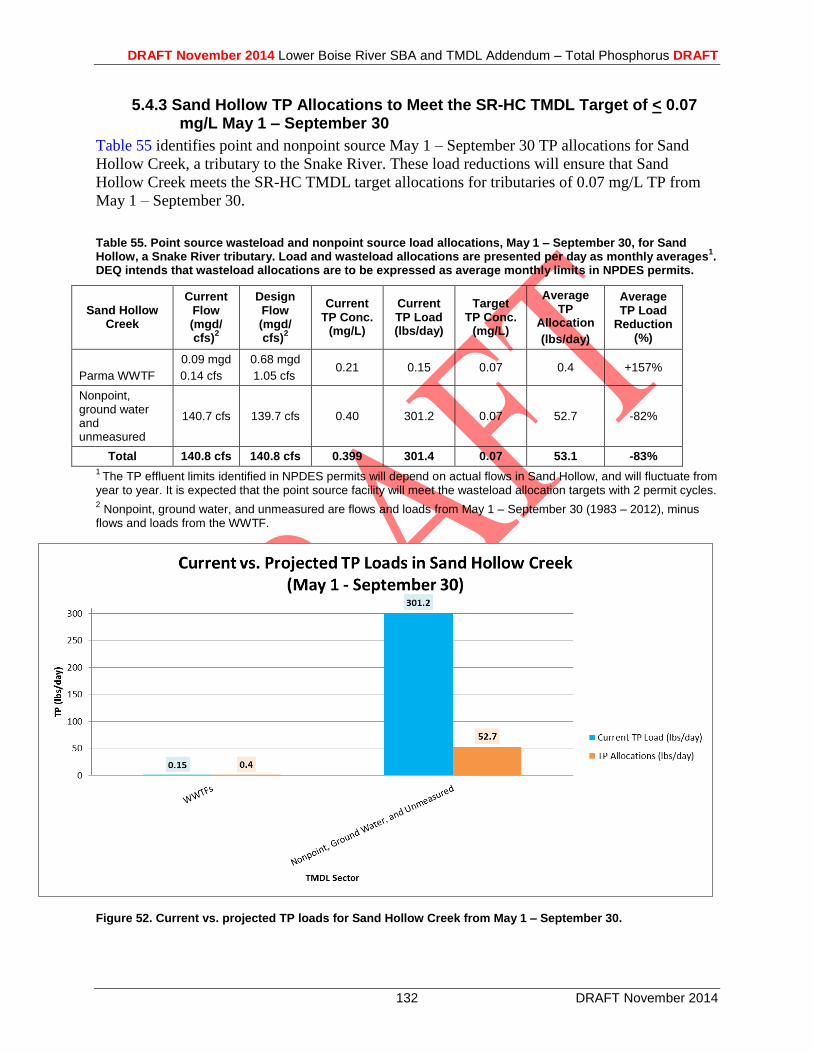
DRAFT November 2014 Lower Boise River SBA and TMDL Addendum – Total Phosphorus DRAFT
132 DRAFT November 2014
5.4.3 Sand Hollow TP Allocations to Meet the SR-HC TMDL Target of < 0.07 mg/L May 1 – September 30
Table 55 identifies point and nonpoint source May 1 – September 30 TP allocations for Sand
Hollow Creek, a tributary to the Snake River. These load reductions will ensure that Sand
Hollow Creek meets the SR-HC TMDL target allocations for tributaries of 0.07 mg/L TP from
May 1 – September 30.
Table 55. Point source wasteload and nonpoint source load allocations, May 1 – September 30, for Sand Hollow, a Snake River tributary. Load and wasteload allocations are presented per day as monthly averages
1.
DEQ intends that wasteload allocations are to be expressed as average monthly limits in NPDES permits.
Sand Hollow Creek
Current Flow (mgd/ cfs)
2
Design Flow (mgd/ cfs)
2
Current TP Conc.
(mg/L)
Current TP Load (lbs/day)
Target TP Conc.
(mg/L)
Average TP
Allocation
(lbs/day)
Average TP Load
Reduction (%)
Parma WWTF
0.09 mgd
0.14 cfs
0.68 mgd
1.05 cfs 0.21 0.15 0.07 0.4 +157%
Nonpoint, ground water and unmeasured
140.7 cfs 139.7 cfs 0.40 301.2 0.07 52.7 -82%
Total 140.8 cfs 140.8 cfs 0.399 301.4 0.07 53.1 -83%
1 The TP effluent limits identified in NPDES permits will depend on actual flows in Sand Hollow, and will fluctuate from
year to year. It is expected that the point source facility will meet the wasteload allocation targets with 2 permit cycles. 2 Nonpoint, ground water, and unmeasured are flows and loads from May 1 – September 30 (1983 – 2012), minus
flows and loads from the WWTF.
Figure 52. Current vs. projected TP loads for Sand Hollow Creek from May 1 – September 30.
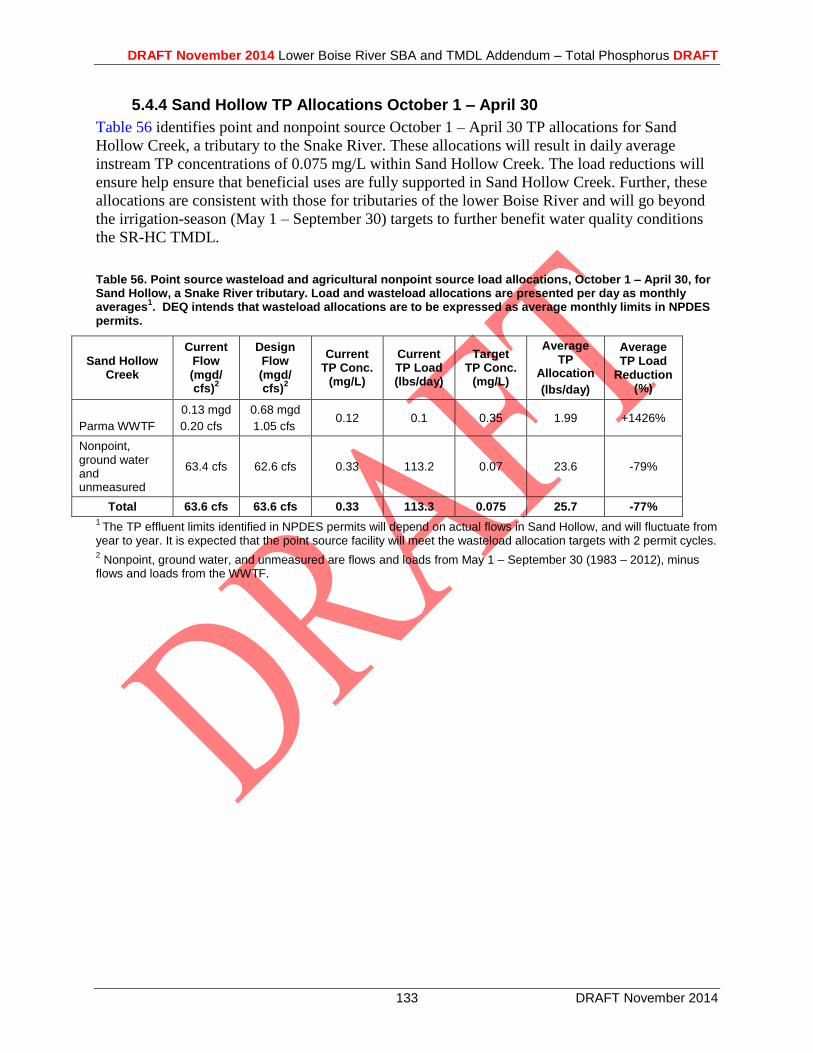
DRAFT November 2014 Lower Boise River SBA and TMDL Addendum – Total Phosphorus DRAFT
133 DRAFT November 2014
5.4.4 Sand Hollow TP Allocations October 1 – April 30
Table 56 identifies point and nonpoint source October 1 – April 30 TP allocations for Sand
Hollow Creek, a tributary to the Snake River. These allocations will result in daily average
instream TP concentrations of 0.075 mg/L within Sand Hollow Creek. The load reductions will
ensure help ensure that beneficial uses are fully supported in Sand Hollow Creek. Further, these
allocations are consistent with those for tributaries of the lower Boise River and will go beyond
the irrigation-season (May 1 – September 30) targets to further benefit water quality conditions
the SR-HC TMDL.
Table 56. Point source wasteload and agricultural nonpoint source load allocations, October 1 – April 30, for Sand Hollow, a Snake River tributary. Load and wasteload allocations are presented per day as monthly averages
1. DEQ intends that wasteload allocations are to be expressed as average monthly limits in NPDES
permits.
Sand Hollow Creek
Current Flow (mgd/ cfs)
2
Design Flow (mgd/ cfs)
2
Current TP Conc.
(mg/L)
Current TP Load (lbs/day)
Target TP Conc.
(mg/L)
Average TP
Allocation
(lbs/day)
Average TP Load
Reduction (%)
Parma WWTF
0.13 mgd
0.20 cfs
0.68 mgd
1.05 cfs 0.12 0.1 0.35 1.99 +1426%
Nonpoint, ground water and unmeasured
63.4 cfs 62.6 cfs 0.33 113.2 0.07 23.6 -79%
Total 63.6 cfs 63.6 cfs 0.33 113.3 0.075 25.7 -77%
1 The TP effluent limits identified in NPDES permits will depend on actual flows in Sand Hollow, and will fluctuate from
year to year. It is expected that the point source facility will meet the wasteload allocation targets with 2 permit cycles. 2 Nonpoint, ground water, and unmeasured are flows and loads from May 1 – September 30 (1983 – 2012), minus
flows and loads from the WWTF.
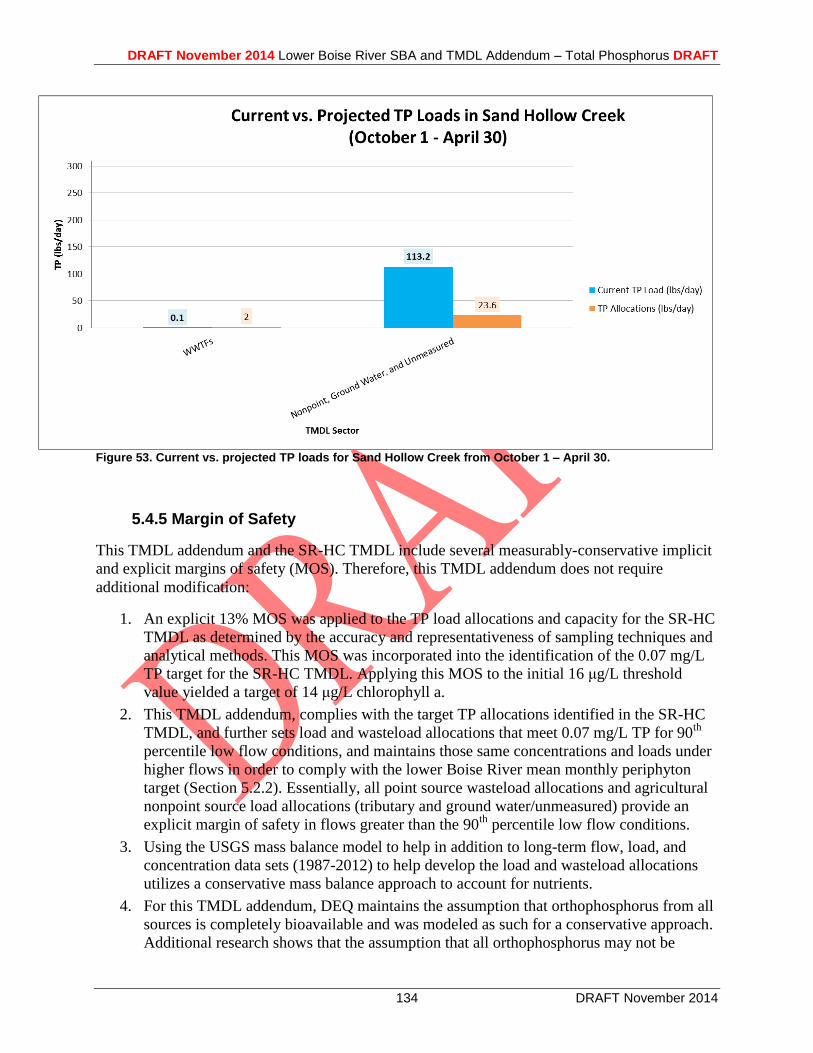
DRAFT November 2014 Lower Boise River SBA and TMDL Addendum – Total Phosphorus DRAFT
134 DRAFT November 2014
Figure 53. Current vs. projected TP loads for Sand Hollow Creek from October 1 – April 30.
5.4.5 Margin of Safety
This TMDL addendum and the SR-HC TMDL include several measurably-conservative implicit
and explicit margins of safety (MOS). Therefore, this TMDL addendum does not require
additional modification:
1. An explicit 13% MOS was applied to the TP load allocations and capacity for the SR-HC
TMDL as determined by the accuracy and representativeness of sampling techniques and
analytical methods. This MOS was incorporated into the identification of the 0.07 mg/L
TP target for the SR-HC TMDL. Applying this MOS to the initial 16 μg/L threshold
value yielded a target of 14 μg/L chlorophyll a.
2. This TMDL addendum, complies with the target TP allocations identified in the SR-HC
TMDL, and further sets load and wasteload allocations that meet 0.07 mg/L TP for 90th
percentile low flow conditions, and maintains those same concentrations and loads under
higher flows in order to comply with the lower Boise River mean monthly periphyton
target (Section 5.2.2). Essentially, all point source wasteload allocations and agricultural
nonpoint source load allocations (tributary and ground water/unmeasured) provide an
explicit margin of safety in flows greater than the 90th
percentile low flow conditions.
3. Using the USGS mass balance model to help in addition to long-term flow, load, and
concentration data sets (1987-2012) to help develop the load and wasteload allocations
utilizes a conservative mass balance approach to account for nutrients.
4. For this TMDL addendum, DEQ maintains the assumption that orthophosphorus from all
sources is completely bioavailable and was modeled as such for a conservative approach.
Additional research shows that the assumption that all orthophosphorus may not be
DRAFT November 2014 Lower Boise River SBA and TMDL Addendum – Total Phosphorus DRAFT
135 DRAFT November 2014
equally bioavailable for algal and plant uptake and growth. However, more data and
analysis would be necessary to further categorize the orthophosphorus sources throughout
the watershed.
5. Using the AQUATOX model to simulate long-term TP loads, concentrations, and
periphyton biomass relationships to help develop the load and wasteload allocations to
meet the mean monthly periphyton target in a conservative manner.
6. The margin of safety accounts for uncertainty about assimilative capacity, the
relationship between the selected target and support of beneficial uses, and includes
variability in target measurement.
5.4.6 Seasonal Variation
Achieving the SR-HC TMDL May 1 – September 30 Target
DEQ believes the May 1 – September 30 seasonal TP target < 0.07 mg/L is protective of cold
water aquatic life and contact recreation by achieving the SR-HC TMDL target of phytoplankton
in the Snake River and reservoirs < 14 μg/L. Achieving this seasonal TP target in the lower
Boise River will help reduce the frequency, magnitude, and duration of algal blooms and other
aesthetic, ecological, and physical nuisance for contact recreation, as well as ecological impacts
for cold water aquatic life, in the Snake River, the lower Boise River, Mason Creek, and Sand
Hollow Creek. TP is neither a toxic nor results in immediate water quality impairment
conditions. TP, along with many other water quality characteristics of the lower Boise River,
exhibit seasonal variations with no single high value resulting in conditions as observed from
May 1 – September 30. Incorporating seasonal variation within this TMDL provides for
flexibility in managing sources and the river.
Meeting the Mean Monthly Benthic Chlorophyll a (Periphyton) Target
Through the TMDL process, DEQ, in consultation with the LBWC, developed a target that
relates nuisance algae growth to the impairment of beneficial uses in the lower Boise River.
Specifically, the target strives to limit mean monthly benthic chlorophyll a of < 150 mg/m2
(indicator of nuisance algae) within impaired AUs of the lower Boise River (see Section 2.2.5).
DEQ asserts this target protects contact recreation and cold water aquatic life beneficial uses.
The target also corresponds well with values established in the academic literature (see Section
2.2.5) and is similar to targets developed and implemented for waters in Montana (MDEQ 2008),
Minnesota (MPCA 2013) and Colorado (CDPHE 2013).
5.4.7 Reasonable Assurance
The point source WLAs and nonpoint source LAs are complementary toward effectively
achieving the TP load capacity for the lower Boise River. However, because point source
contributions are regulated by the EPA through NPDES permits, the reasonable assurances for
this TMDL apply almost exclusively toward nonpoint source load reductions.
TP loading from agricultural and other nonpoint sources that are measured through tributaries
and ground water are anticipated to decline due to a combination of ripple effects from point
source TP reductions, BMPs, nutrient management, and land conversion. Such loading
DRAFT November 2014 Lower Boise River SBA and TMDL Addendum – Total Phosphorus DRAFT
136 DRAFT November 2014
reductions will require time and resources beyond regulation to achieve. However, based on the
USGS mass balance model and other data and reports (e.g. Etheridge 2013; Fox et al. 2002;
Ferguson 1999), DEQ believes that TP concentrations and loads from nonpoint tributary and
ground water sources can be effectively reduced to meet the TMDL targets in the lower Boise
River. The necessary reductions will result from the combination of regulated point source
reductions (which inherently influence the amount of TP moving through the system and are
subsequently used by nonpoint sources), along with concerted voluntary nonpoint source
reductions, which will depend on funding, cost-sharing, willing partners, and effective BMP
implementation to achieve the target.
For example, the DEQ’s 2008 Lower Boise River Implementation Plan Total Phosphorus (DEQ 2008)
asserts:
“2.BMP Effectiveness. The Rock Creek watershed drains to the Snake River upstream from the SR-HC reach. With very little existing infrastructure, a 68% reduction in the discharge of TP from the watershed was achieved. Despite this improvement, TP concentrations from the watershed remained above 0.1 mg/l. (After project funding declined, the range of improvement also declined to approximately 40% due to the inability to fund the recurring annual BMP costs.) 3. Prioritizing Lands for Treatment. It is not necessary to treat all agricultural lands to substantially reduce the discharge of pollutants. BMP implementation should focus on priority lands where treatment will be most effective. Lands can be prioritized in three tiers as described earlier. To the maximum extent possible, treatment should focus on Tier 1 and Tier 2 lands with little or no existing BMPs. Prioritizing lands for treatment will increase BMP effectiveness and the probability of meeting allocation objectives within predictable timeframes… 7. Existing Implementation Levels. …The greatest water quality benefits from BMP implementation will be realized where there has been little or no BMP implementation, on “high priority” lands. Experience in the Rock Creek watershed has demonstrated that, in such areas, implementation of lower per-acre cost BMPs can result in substantial load reductions from irrigated lands. Implementation efforts should therefore be focused in these areas…”
Further examination of data from an Idaho surface irrigated system also directly addresses the
important Reasonable Assurance questions for future nonpoint source ground water and tributary
concentrations. The Northside Canal Company (NSCC) case study is a reasonable application to
consider in the LBR TP TMDL as the climate and soils and trend for irrigation efficiency/yield
using sprinkler and drip are similar. NSCC TP data (Table 57) show an average of 54 ug/l TP
over the last 12 years with a decreasing trend (last 8 year average TP = 49 and OP=20 ug/l).
The NSCC was 100% furrow irrigation in the early 1950’s (similar to the lower Boise River) and
today is 95% sprinkler, which has resulted in the elimination of 100’s or return drains to the
Snake River. NSCC has also constructed wetlands and detention basins within the system to
provide water quality treatment. NSCC’s goal is to have zero returns to the Snake River. This
suggests that widespread conversion of sprinkler could result in similar significant reductions in
tributary/drain flows and TP loads to the lower Boise River.
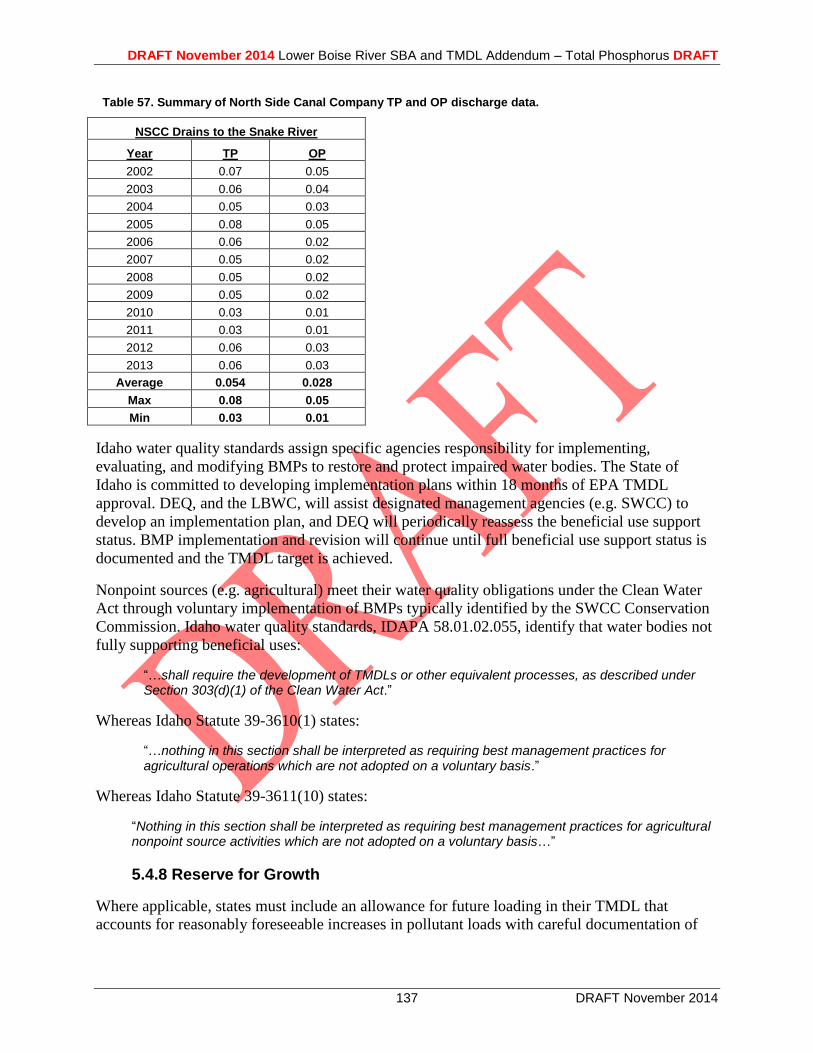
DRAFT November 2014 Lower Boise River SBA and TMDL Addendum – Total Phosphorus DRAFT
137 DRAFT November 2014
Table 57. Summary of North Side Canal Company TP and OP discharge data.
NSCC Drains to the Snake River
Year TP OP
2002 0.07 0.05
2003 0.06 0.04
2004 0.05 0.03
2005 0.08 0.05
2006 0.06 0.02
2007 0.05 0.02
2008 0.05 0.02
2009 0.05 0.02
2010 0.03 0.01
2011 0.03 0.01
2012 0.06 0.03
2013 0.06 0.03
Average 0.054 0.028
Max 0.08 0.05
Min 0.03 0.01
Idaho water quality standards assign specific agencies responsibility for implementing,
evaluating, and modifying BMPs to restore and protect impaired water bodies. The State of
Idaho is committed to developing implementation plans within 18 months of EPA TMDL
approval. DEQ, and the LBWC, will assist designated management agencies (e.g. SWCC) to
develop an implementation plan, and DEQ will periodically reassess the beneficial use support
status. BMP implementation and revision will continue until full beneficial use support status is
documented and the TMDL target is achieved.
Nonpoint sources (e.g. agricultural) meet their water quality obligations under the Clean Water
Act through voluntary implementation of BMPs typically identified by the SWCC Conservation
Commission. Idaho water quality standards, IDAPA 58.01.02.055, identify that water bodies not
fully supporting beneficial uses:
“…shall require the development of TMDLs or other equivalent processes, as described under Section 303(d)(1) of the Clean Water Act.”
Whereas Idaho Statute 39-3610(1) states:
“…nothing in this section shall be interpreted as requiring best management practices for agricultural operations which are not adopted on a voluntary basis.”
Whereas Idaho Statute 39-3611(10) states:
“Nothing in this section shall be interpreted as requiring best management practices for agricultural nonpoint source activities which are not adopted on a voluntary basis…”
5.4.8 Reserve for Growth
Where applicable, states must include an allowance for future loading in their TMDL that
accounts for reasonably foreseeable increases in pollutant loads with careful documentation of
DRAFT November 2014 Lower Boise River SBA and TMDL Addendum – Total Phosphorus DRAFT
138 DRAFT November 2014
the decision-making process. This allowance is based on existing and readily available data at
the time the TMDL is established.
In the case of the lower Boise River TP TMDL addendum, an allowance for future growth is not
recommended until such time as reductions indicate that beneficial uses have been restored or
state water quality standards have been met.
As such, any new point sources discharging directly or indirectly to the lower Boise River,
Mason Creek, or Sand Hollow Creek would receive a wasteload allocation of zero, with no
allowance for future growth, except under the auspices of: (1) a growth reserve is calculated as
the difference between current and design WWTF flows and loads, where the difference could
then be divided among new/existing point sources, as needs arise, during the long-term
implementation period, (2) water quality trading, (3) offsets, or (4) no discharge.
5.5 Implementation Strategies
The implementation strategy outlines a pathway by which the SWCC and Ada and Canyon Soil
and Water Conservation Districts can develop a comprehensive implementation plan within 18
months after TMDL approval. The implementation plan will provide details of the actions
needed to achieve load reductions (set forth in this TMDL), a schedule of those actions, and the
monitoring needed to document actions and progress toward meeting state water quality
standards.
DEQ recognizes that implementation strategies for TMDLs may need to be modified if
monitoring shows that TMDL goals are not being met or significant progress is not being made
toward achieving the goals. Reasonable assurance (addressed in section 5.4.7) for the TMDL to
meet water quality standards is based on the implementation strategy.
A TP implementation plan for the lower Boise River was previously created by DEQ and the
LBWC (DEQ 2008) presented strategies to meet the May 1 – September 30 SR-HC TP
allocation target on the lower Boise River. DEQ asserts that a new implementation plan should
be developed to reflect this current TMDL addendum for the lower Boise River. Activities
addressed in a new implementation plan should include:
TP reductions from point source facilities
o Effluent concentration targets
o Projected flows
o Projected loads on a seasonal basis
TP reductions from stormwater dischargers through BMPs, increased attention to on-site
stormwater inspection, and public education
Voluntary BMP implementation on agricultural lands, contingent on available funding
levels and previously-developed implementation plans
Conversion of agricultural land to other land uses
Water quality trading framework
Monitoring strategy
Some of the original implementation measures from the previous Lower Boise River
Implementation Plan Total Phosphorus (DEQ 2008) could be appropriate for the current TMDL
DRAFT November 2014 Lower Boise River SBA and TMDL Addendum – Total Phosphorus DRAFT
139 DRAFT November 2014
addendum, while acknowledging the need to expand and revise the focus to appropriately
address the specific needs of the AUs in this document given current conditions and knowledge.
5.5.1 Time Frame
The lower Boise River TP TMDL addendum relies on a staged implementation strategy as
referenced in EPA’s Phased TMDL Clarification memo (EPA 2006). The staged implementation
strategy for the lower Boise River acknowledges that NPDES-permitted point sources will strive
to meet the TMDL target as soon as possible, DEQ anticipates that 2 permit cycles (10 years
from the approval of the TMDL) will be provided via 401 certification and justification to
achieve their wasteload allocations. However, in consultation with DEQ, appropriate compliance
schedules may be considered on a case-by-case basis for point source permits.
The lower Boise River TP TMDL addendum, however, does not define an implementation time
frame for nonpoint sources; rather, implementation would begin as soon as possible and continue
until the load allocation targets are met. This acknowledges that successfully achieving the
TMDL target and allocations will depend on voluntary measures, including but not limited to
available funding, cost-sharing, willing partners, and opportunities for water quality trading.
5.5.2 Approach
Point source contributions will be determined and regulated by EPA and NPDES permitting,
whereas, funding provided under section 319, and other funds, will be used to encourage
voluntary projects to reduce nonpoint source pollution. Additionally, upon the development of
the TMDL, it is expected that a lower Boise River trading framework will be updated/developed
and that trading may be utilized to meet the pollutant targets in the subbasin (see Section 5.5.5).
Load allocations will be met over a reasonable period of time based on current pollution
conditions in the watershed, current land management practices, and other relevant factors, as
appropriate. DEQ may provide further guidance on the phased implementation of load
allocations and will provide oversight to ensure that appropriate water quality milestones and
targets are being achieved. If trading exists in the area covered by this TMDL, any phased
implementation of load allocations may be used to derive trading baseline requirements.
5.5.3 Responsible Parties
The final implementation plan for this TMDL addendum will be developed under the existing
practice established for the state of Idaho. The plan will be cooperatively developed by DEQ, the
LBWC, affected private landowners, and designated management agencies with input through
the established public process. Other individuals may also be identified to assist in developing
site-specific implementation plans as their areas of expertise are identified as beneficial to the
process.
Stakeholders in the lower Boise River subbasin have a responsibility for implementing the
TMDL addendum. DEQ and the designated management agencies in Idaho have primary
responsibility for overseeing implementation in cooperation with landowners and managers.
DRAFT November 2014 Lower Boise River SBA and TMDL Addendum – Total Phosphorus DRAFT
140 DRAFT November 2014
Designated state agencies are responsible for assisting with preparation of specific
implementation plans, particularly for those resources for which they have regulatory authority
or programmatic responsibilities:
Idaho Department of Lands (IDL) for timber harvest, oil and gas exploration and
development, and mining—IDL will maintain and update approved BMPs for forest
practices and mining. IDL is responsible for ensuring use of appropriate BMPs on state
and private lands.
Idaho Soil and Water Conservation Commission (SWCC) for grazing and
agriculture—working in cooperation with local soil and water conservation districts, the
Idaho State Department of Agriculture (ISDA), and the NRCS, the SWCC will provide
technical assistance to agricultural landowners. These agencies will help landowners
design BMPs appropriate for their property and identify and seek appropriate cost-share
funds. They also will provide periodic project reviews to ensure BMPs are working
effectively.
Idaho Transportation Department for public roads—The Idaho Transportation
Department will ensure appropriate BMPs are used for construction and maintenance of
public roads.
Idaho State Department of Agriculture (ISDA) for aquaculture, animal feeding
operations, and concentrated animal feeding operations—ISDA will work with
aquaculture facilities to install appropriate pollutant control measures. Under a
memorandum of understanding with EPA and DEQ, ISDA also inspects animal feeding
operations, concentrated animal feeding operations, and dairies to ensure compliance
with NPDES requirements.
WAG and other agencies for other activities—Idaho Statute 39-3616 states:
“…recommending those specific actions needed to control point and nonpoint sources of
pollution within the watershed so that, within reasonable periods of time, designated
beneficial uses are fully supported and other state water quality plans are
achieved..consult with the director and participate in the development of each TMDL and
any supporting subbasin assessment for water bodies within the watershed, and shall
develop and recommend actions needed to effectively control sources of pollution...”
DEQ for other activities—DEQ will oversee and track overall progress on the specific
implementation plan and monitor the watershed response. DEQ will also work with local
governments on urban/suburban issues.
In Idaho, these agencies, and their federal and state partners, are charged by the Clean Water Act
to lend available technical assistance and other appropriate support to local efforts for water
quality improvements.
The designated management agencies, LBWC, and other appropriate public process participants
are expected to:
Develop BMPs to achieve load allocations.
Provide reasonable assurance that management measures will meet load allocations
through both quantitative and qualitative analysis of management measures.
Adhere to measurable milestones for progress.
Develop a timeline for implementation, with reference to costs and funding.
DRAFT November 2014 Lower Boise River SBA and TMDL Addendum – Total Phosphorus DRAFT
141 DRAFT November 2014
Develop a monitoring plan to determine if BMPs are being implemented, individual
BMPs are effective, load allocations and wasteload allocations are being met, and water
quality standards are being met.
In addition to the designated management agencies, the public, through the LBWC and other
processes, will be provided with opportunities to be involved in developing the implementation
plan to the maximum extent practical. Public participation will significantly affect public
acceptance of the document and the proposed control actions. Stakeholders (i.e., landowners,
local governing authorities, taxpayers, industries, and land managers) are the most educated
regarding the pollutant sources and will be called upon to help identify the most appropriate
control actions for each area. Experience has shown that the best and most effective
implementation plans are those developed with substantial public cooperation and involvement.
5.5.4 Implementation Monitoring Strategy
The objectives of a monitoring strategy should be to demonstrate long-term recovery, better
understand natural variability, track implementation of projects and BMPs, and track the TMDL
implementation effectiveness. This monitoring and feedback mechanism is a major component of the
“reasonable assurance” component of the TMDL and implementation plan.
Monitoring will provide information on progress being made toward achieving TMDL allocations
and achieving water quality standards, and will help in the interim evaluation of progress, including
in the development of 5-year reviews and future addendums.
The implementation monitoring strategy should specifically focus on several aspects:
1. May 1 – September 30
a. Measure TP concentration trends (mg/L) and loadings (lbs/day) in the lower Boise River
near Parma relative to the SR-HC May 1 – September 30 TP allocation target of < 0.07
mg/L.
i. Focus monitoring efforts on the various sources identified in this TMDL (e.g.
WWTFs, stormwater, tributaries and drains, and ground water/unmeasured).
b. Identify TP concentration trends (mg/L) and TP load equivalents (lbs/day) in Mason
Creek near the mouth relative to the its allocation target identified in this TMDL for the
May 1 – September 30 time period.
c. Identify TP concentration trends (mg/L) and TP load equivalents (lbs/day) in Sand
Hollow Creek near the mouth relative to the SR-HC May 1 – September 30 TP allocation
target of < 0.07 mg/L.
2. Mean Monthly Benthic Chlorophyll a < 150 mg/m2
a. Identify TP concentration trends (mg/L) and loadings (lbs/day) in the lower Boise River
relative TP allocation targets designed to help meet the mean monthly benthic
chlorophyll a (periphyton) target of < 150 mg/m2.
i. Focus monitoring efforts on the various sources identified in this TMDL (e.g.
WWTFs, stormwater, tributaries and drains, and ground water/unmeasured).
b. Measure mean monthly benthic chlorophyll a (periphyton) in the two lower Boise River
AUs that are currently listed as impaired for TP in the 2014 Integrated Report (DEQ
2014c) in order to help determine the extent in which changes in TP concentrations and
TP load equivalents are helping to achieve the algae growth target.
DRAFT November 2014 Lower Boise River SBA and TMDL Addendum – Total Phosphorus DRAFT
142 DRAFT November 2014
The Implementation Monitoring Strategy should be designed by DEQ, USGS, designated
management agencies, the LBWC, and other affected agencies/organizations/individuals to help
ensure scientifically-defensible and meaningful methodologies are utilized to help to track progress
toward meeting the TMDL objectives. All sampling and analyses would be conducted under DEQ,
USGS, SWCC, or other scientifically-defensible and approved protocols.
5.5.5 Water Quality Trading
Water quality trading (also known as pollutant trading) is a contractual agreement to exchange
pollution reductions between two parties. Water quality trading is a business-like way of helping
to solve water quality problems by focusing on cost-effective, local solutions to problems caused
by pollutant discharges to surface waters. Water quality trading is one of the tools available to
meet reductions called for in a TMDL where point and nonpoint sources both exist in a
watershed.
The appeal of trading emerges when pollutant sources face substantially different pollutant
reduction costs. Typically, a party facing relatively high pollutant reduction costs compensates
another party to achieve an equivalent, though less costly, pollutant reduction.
Water quality trading is voluntary. Parties trade only if both are better off because of the trade,
and trading allows parties to decide how to best reduce pollutant loadings within the limits of
certain requirements.
Water quality trading is recognized in Idaho’s water quality standards at IDAPA
58.01.02.055.06. DEQ allows for water quality trading as a means to meet TMDLs, thus
restoring water quality limited water bodies to compliance with water quality standards. DEQ’s
Water Quality Pollutant Trading Guidance sets forth the procedures to be followed for water
quality trading (DEQ 2010).
5.5.5.1 Trading Components
The major components of water quality trading are trading parties (buyers and sellers) and
credits (the commodity being bought and sold). Ratios are used to ensure environmental
equivalency of trades on water bodies covered by a TMDL. All trading activity must be recorded
in the trading database by DEQ or its designated party.
Both point and nonpoint sources may create marketable credits, which are a reduction of a
pollutant beyond a level set by a TMDL:
Point sources create credits by reducing pollutant discharges below NPDES effluent
limits set initially by the wasteload allocation.
Nonpoint sources create credits by implementing approved BMPs that reduce the amount
of pollutant runoff. Nonpoint sources must follow specific design, maintenance, and
monitoring requirements for that BMP; apply discounts to credits generated, if required;
and provide a water quality contribution to ensure a net environmental benefit. The water
quality contribution also ensures the reduction (the marketable credit) is surplus to the
reductions the TMDL assumes the nonpoint source is achieving to meet the water quality
goals of the TMDL.
DRAFT November 2014 Lower Boise River SBA and TMDL Addendum – Total Phosphorus DRAFT
143 DRAFT November 2014
5.5.5.2 Watershed-Specific Environmental Protection
Trades must be implemented so that the overall water quality of the water bodies covered by the
TMDL are protected. To do this, hydrologically based ratios are developed to ensure trades
between sources distributed throughout TMDL water bodies result in environmentally equivalent
or better outcomes at the point of environmental concern. Moreover, localized adverse impacts to
water quality are not allowed.
5.5.5.3 Trading Framework
For water quality trading to be authorized, it must be specifically mentioned within a TMDL
document. After adoption of an EPA-approved TMDL, DEQ, in concert with the WAG, must
develop a water quality trading framework document. The framework would mesh with the
implementation plan for the watershed that is the subject of the TMDL. The elements of a
trading document are described in DEQ’s water quality trading guidance (DEQ 2010).
6 Conclusions The identified TP pollutant sources in this TMDL are both point and nonpoint in nature. Point
sources include WWTFs, industrial discharges, and stormwater contributions. Nonpoint sources
include tributaries and drains that are generally agriculturally-fed or supplemented streams,
ground water and other unmeasured sources, and background. Allocations in the TMDL
addendum are designed to meet two targets: 1) the May 1 – September 30 SR-HC TP target of <
0.07 mg/L in the Snake River (e.g. in the lower Boise River near Parma and at the mouth of Sand
Hollow Creek near the Snake River), and 2) the lower Boise River-specific TP targets designed
to help achieve the mean monthly benthic chlorophyll a (periphyton) target of < 150 mg/m2
during two distinct seasons: 1) May 1 – September 30, and 2) October 1 – April 30. Meeting
these targets is expected to result in full support cold water aquatic life and contact recreation
beneficial uses in the lower Boise River, Mason Creek, and Sand Hollow Creek.
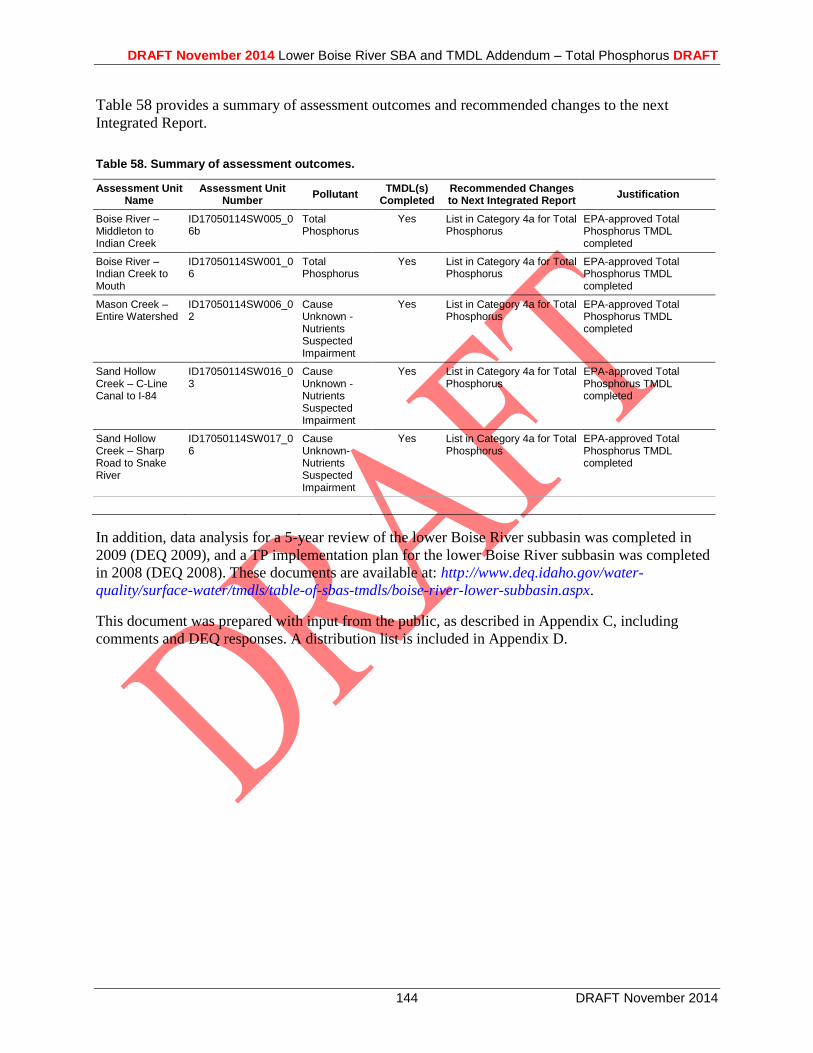
DRAFT November 2014 Lower Boise River SBA and TMDL Addendum – Total Phosphorus DRAFT
144 DRAFT November 2014
Table 58 provides a summary of assessment outcomes and recommended changes to the next
Integrated Report.
Table 58. Summary of assessment outcomes.
Assessment Unit Name
Assessment Unit Number
Pollutant TMDL(s)
Completed Recommended Changes to Next Integrated Report
Justification
Boise River – Middleton to Indian Creek
ID17050114SW005_06b
Total Phosphorus
Yes List in Category 4a for Total Phosphorus
EPA-approved Total Phosphorus TMDL completed
Boise River – Indian Creek to Mouth
ID17050114SW001_06
Total Phosphorus
Yes List in Category 4a for Total Phosphorus
EPA-approved Total Phosphorus TMDL completed
Mason Creek – Entire Watershed
ID17050114SW006_02
Cause Unknown - Nutrients Suspected Impairment
Yes List in Category 4a for Total Phosphorus
EPA-approved Total Phosphorus TMDL completed
Sand Hollow Creek – C-Line Canal to I-84
ID17050114SW016_03
Cause Unknown -Nutrients Suspected Impairment
Yes List in Category 4a for Total Phosphorus
EPA-approved Total Phosphorus TMDL completed
Sand Hollow Creek – Sharp Road to Snake River
ID17050114SW017_06
Cause Unknown-Nutrients Suspected Impairment
Yes List in Category 4a for Total Phosphorus
EPA-approved Total Phosphorus TMDL completed
In addition, data analysis for a 5-year review of the lower Boise River subbasin was completed in
2009 (DEQ 2009), and a TP implementation plan for the lower Boise River subbasin was completed
in 2008 (DEQ 2008). These documents are available at: http://www.deq.idaho.gov/water-
quality/surface-water/tmdls/table-of-sbas-tmdls/boise-river-lower-subbasin.aspx.
This document was prepared with input from the public, as described in Appendix C, including
comments and DEQ responses. A distribution list is included in Appendix D.

DRAFT November 2014 Lower Boise River SBA and TMDL Addendum – Total Phosphorus DRAFT
145 DRAFT November 2014
References Cited
Biggs, B.J.F. 2000. Eutrophication of streams and rivers: dissolved nutrient-chlorophyll
relationships for benthic algae. Journal of North American Benthological Society 19:17-
31.
Carter, D.L. 2002. Proposed Best Management Practices (BMP’s) to be Applied in the Lower
Boise River Effluent Trading Demonstration Project. Report
CDPHE (Colorado Department of Public Health and Environment). 2013. Regulation No. 31.
The Basic Standards and Methodologies for Surface Water (5 CCR 1002-31).
CFR (Code of Federal Regulation). 1977. “Guidelines Establishing Test Procedures for the
Analysis of Pollutants.” 40 CFR 136.
CFR (Code of Federal Regulation). 1983. “EPA Administered Permit Programs: The National
Pollutant Discharge Elimination System.” 40 CFR 122.
CFR (Code of Federal Regulation). 1983. “Water Quality Standards.” 40 CFR 131.
CFR (Code of Federal Regulation). 1995. “Water Quality Planning and Management.”
40 CFR 130.
Chelstrom, T. 2009. Canoeing the Boise River. Fourth Edition, Revised August 2009. REI.
Daly, K. and R. Watters. 1999. Kath and Ron’s Guide to Idaho Paddling: Flatwater and Easy
Whitewater Trips. Great Rift Press.
DEQ (Idaho Department of Environmental Quality). 1999. Lower Boise River TMDL Subbasin
Assessment, Total Maximum Daily Loads. Boise, ID: DEQ. Available at:
http://www.deq.idaho.gov/water-quality/surface-water/tmdls/table-of-sbas-tmdls/boise-
river-lower-subbasin.aspx.
DEQ (Idaho Department of Environmental Quality). 2001a. Lower Boise River Nutrient and
Tributary Subbasin Assessments. Boise, ID: DEQ. Available at:
http://www.deq.idaho.gov/water-quality/surface-water/tmdls/table-of-sbas-tmdls/boise-
river-lower-nutrient-tributary-subbasin.aspx.
DEQ (Idaho Department of Environmental Quality). 2001b. Lower Boise River Nutrient
Subbasin Assessment. Boise, ID: DEQ. Available at: http://www.deq.idaho.gov/water-
quality/surface-water/tmdls/table-of-sbas-tmdls/boise-river-lower-nutrient-tributary-
subbasin.aspx.
DEQ (Idaho Department of Environmental Quality). 2001c. Mason Creek Subbasin Assessment.
Boise, ID: DEQ. Available at: http://www.deq.idaho.gov/water-quality/surface-
water/tmdls/table-of-sbas-tmdls/boise-river-lower-nutrient-tributary-subbasin.aspx
DRAFT November 2014 Lower Boise River SBA and TMDL Addendum – Total Phosphorus DRAFT
146 DRAFT November 2014
DEQ (Idaho Department of Environmental Quality). 2001d. Sand Hollow Creek Subbasin
Assessment. Boise, ID: DEQ. Available at: http://www.deq.idaho.gov/water-
quality/surface-water/tmdls/table-of-sbas-tmdls/boise-river-lower-nutrient-tributary-
subbasin.aspx
DEQ (Idaho Department of Environmental Quality). 2003. Implementation Plan for the Lower
Boise River Total Maximum Daily Load. Boise, ID: DEQ. Available at:
http://www.deq.idaho.gov/water-quality/surface-water/tmdls/table-of-sbas-tmdls/boise-
river-lower-subbasin.aspx
DEQ (Idaho Department of Environmental Quality) and ODEQ (Oregon Department of
Environmental Quality). 2004. Idaho Department of Environmental Quality and Oregon
Department of Environmental Quality. Snake River–Hells Canyon Total Maximum Daily
Load (TMDL). Idaho Department of Environmental Quality/Oregon Department of
Environmental Quality, approved by EPA in September 2004.
DEQ (Idaho Department of Environmental Quality). 2005. Catalog of Stormwater Best
Management Practices for Idaho Cities and Counties. Boise, ID: DEQ. Available at:
http://www.deq.idaho.gov/water-quality/wastewater/stormwater.aspx.
DEQ (Idaho Department of Environmental Quality). 2008. Lower Boise River Implementation
Plan Total Phosphorus. Boise, ID: DEQ. Available at: http://www.deq.idaho.gov/water-
quality/surface-water/tmdls/table-of-sbas-tmdls/boise-river-lower-subbasin.aspx
DEQ (Idaho Department of Environmental Quality) and the Lower Boise Watershed Council.
2008a (revised 2012). Sediment and Bacteria Allocations Addendum to the Lower Boise
River TMDL. Boise, ID: DEQ. Available at: http://www.deq.idaho.gov/water-
quality/surface-water/tmdls/table-of-sbas-tmdls/boise-river-lower-subbasin.aspx.
DEQ (Idaho Department of Environmental Quality). 2009. Lower Boise River TMDL Five-Year
Review. Boise, ID: DEQ. Available at: http://www.deq.idaho.gov/water-quality/surface-
water/tmdls/table-of-sbas-tmdls/boise-river-lower-subbasin.aspx.
DEQ (Idaho Department of Environmental Quality). 2010. Water Quality Pollutant Trading
Guidance. Boise, ID: DEQ. Available at: http://www.deq.idaho.gov/water-
quality/surface-water/pollutant-trading.aspx.
DEQ (Idaho Department of Environmental Quality). 2010b. Lake Lowell TMDL: Addendum to
the Lower Boise River Subbasin Assessment and Total Maximum Daily Loads. Boise,
ID: DEQ. Available at: http://www.deq.idaho.gov/water-quality/surface-
water/tmdls/table-of-sbas-tmdls/boise-river-lower-subbasin.aspx.
DEQ (Idaho Department of Environmental Quality). 2010. Lake Lowell TMDL: Addendum to
the Lower Boise River Subbasin Assessment and Total maximum Daily Loads. Boise,
ID: DEQ. Available at: http://www.deq.idaho.gov/water-quality/surface-
water/tmdls/table-of-sbas-tmdls/boise-river-lower-subbasin.aspx.
DRAFT November 2014 Lower Boise River SBA and TMDL Addendum – Total Phosphorus DRAFT
147 DRAFT November 2014
DEQ (Idaho Department of Environmental Quality). 2011. Idaho’s 2010 Integrated Report.
Boise, ID: DEQ. Available at: http://www.deq.idaho.gov/water-quality/surface-
water/monitoring-assessment/integrated-report.aspx.
DEQ (Idaho Department of Environmental Quality). 2014a. Lower Boise River Phosphorus
AQUATOX Model Report. Boise, ID: DEQ. Available at:
http://www.deq.idaho.gov/regional-offices-issues/boise/basin-watershed-advisory-
groups/lower-boise-river-wag.aspx.
DEQ (Idaho Department of Environmental Quality). 2014b. Quality Assurance Project Plan:
AQUATOX Modeling for the Lower Boise River Total Phosphorus TMDL. Boise, ID:
DEQ.
DEQ (Idaho Department of Environmental Quality). 2014c. Idaho’s 2012 Integrated Report.
Boise, ID: DEQ. Available at: http://www.deq.idaho.gov/water-quality/surface-
water/monitoring-assessment/integrated-report.aspx.
Dodds, W.K., V.H. Smith, and B. Zander. 1997. Developing nutrient targets to control
benthic chlorophyll levels in streams: a case study of the Clark Fork River. Water
Resources 31:1738-1750.
Dodds, W.K., J.R. Jones, and E.B. Welch. 1998. Suggested classification of stream trophic
state: distributions of temperate stream types by chlorophyll, total nitrogen, and
phosphorus. Water Resources 32:1455-1462.
Dodds, K. W. and E.B. Welch. 2000. Establishing nutrient criteria in streams. Journal of
North American Benthological Society 19:186-196.
EPA (U.S. Environmental Protection Agency). 1986. Quality Criteria for Water 1986. EPA
Office of Water Regulations and Standards 440/5-86-001. May 1, 1986.
http://water.epa.gov/scitech/swguidance/standards/criteria/aqlife/upload/2009_01_13_cr
iteria_goldbook.pdf
EPA (U.S. Environmental Protection Agency). 2006. Benita Best-Wong memorandum to Water
Division Directors re: Clarification regarding “Phased” Total Maximum Daily Loads,
August 2, 2006. http://www.epa.gov/owow/tmdl/tmdl_clarification_letter.html.
EPA (U.S. Environmental Protection Agency). 2007. An Approach for Using Load Duration
Curves in the Development of TMDLs. EPA Office of Wetlands, Oceans, and
Watersheds 841-B-07-2006. August 2007. 68 p.
http://water.epa.gov/lawsregs/lawsguidance/cwa/tmdl/upload/2007_08_23_tmdl_duratio
n_curve_guide_aug2007.pdf
EPA (U.S. Environmental Protection Agency). 2008a. The U.S. Environmental Protection
Agency (EPA) Proposes to Issue a National Pollutant Discharge Elimination System
(NPDES) Permit for Storm Water Discharges to: Notus-Parma Highway District. U.S.
EPA Fact Sheet for NPDES Permit # IDS-028151.
DRAFT November 2014 Lower Boise River SBA and TMDL Addendum – Total Phosphorus DRAFT
148 DRAFT November 2014
EPA (U.S. Environmental Protection Agency). 2008b. The U.S. Environmental Protection
Agency (EPA) Proposes to Issue a National Pollutant Discharge Elimination System
(NPDES) Permit for Storm Water Discharges to: Ada County Highway District. U.S.
EPA Fact Sheet for NPDES Permit # IDS-028185.
EPA (U.S. Environmental Protection Agency). 2009a. Final Decision on the Lower Boise River
and Hem Creek. Letter and enclosures from Michael A Bussell, Director, Office of Water
and Watersheds (EPA) to Barry N. Burnell, Administrator, Water Quality Program
(DEQ). October 13, 2009.
EPA (U.S. Environmental Protection Agency). 2009b. Partial approval/partial disapproval of
Idaho’s Final 2008 303(d) list. Letter and report from Michael A Bussell, Director, Office
of Water and Watersheds (EPA) to Barry N. Burnell, Administrator, Water Quality
Program (DEQ). February 4, 2009 (OWW-134).
Etheridge, A.B. 2013. Evaluation of Total Phosphorus Mass Balance in the Lower Boise River,
Southwestern Idaho. U.S. Geological Survey Scientific Investigations Report 2013-5220,
70 p.
Etheridge, A.B., MacCoy, D.E., and Weakland, R.J., 2014, Water-quality and biological
conditions in selected tributaries of the Lower Boise River, southwestern Idaho, water
years 2009–12: U.S. Geological Survey Scientific Investigations Report 2014-5132, 58
p., http://dx.doi.org/10.3133/sir20145132.
Fishman, M.J., ed., 1993, Methods of analysis by the U.S. Geological Survey National Water
Quality Laboratory--Determination of inorganic and organic constituents in water and
fluvial sediments: U.S. Geological Survey Open-File Report 93-125, 217 p.
Ferguson, D.F. 1999. Best Management Practice Effectiveness on Phosphorus Removal from
Field Surface Irrigation Return Flows. Idaho Soil Conservation Commission Technical
Report. Boise, ID 19 p.
Fox, J. R.Carlson, K. Campbell, and G. Bahr. 2002. Ground and surface water interaction related
to nutrients within Mason Creek agricultural drain Canyon County, Idaho. Ground Water
Monitoring Technical Completion Report.
Grafe, C.S., C.A. Mebane, M.J. McIntyre, D.A. Essig, D.H. Brandt, and D.T. Mosier. 2002.
Water Body Assessment Guidance. 2nd ed. Final. Boise, ID: Department of
Environmental Quality. 114 p.
Hammer, M.J. 1986. Water and Wastewater Technology, 2nd ed. Englewood Cliffs, NJ: Prentice
Hall, Inc.
Hilton, J., M. O’Hare, M.J. Bowes, J.I. Jones. 2006. How green is my river? A new paradigm of
eutrophication in rivers. Elsevier 365:66-83.
Idaho Code. 2012. “Creation of Watershed Advisory Groups.” Idaho Code 39-3615.
Idaho Code. 2012. “Development and Implementation of Total Maximum Daily Load or
Equivalent Processes.” Idaho Code 39-3611.
DRAFT November 2014 Lower Boise River SBA and TMDL Addendum – Total Phosphorus DRAFT
149 DRAFT November 2014
MacCoy, D.E. 2004. Water-quality and biological conditions in the lower Boise River, Ada and
Canyon Counties, Idaho, 1994–2002: U.S. Geological Survey Scientific Investigations
Report 2004–5128, 80 p.
MDEQ (Montana Department of Environmental). 2008. Scientific and Technical Basis of the
Numeric Nutrient Criteria for Montana’s Wadeable Streams and Rivers. November 2008.
MPCA (Minnesota Pollution Control Agency). 2013. Minnesota Nutrient Criteria Development
for Rivers (DRAFT). January 2013.
IDAPA. 2012. “Idaho Water Quality Standards. Idaho Administrative Code.” IDAPA 58.01.02.
ISDA (Idaho State Department of Agriculture). 2008. Water Quality Monitoring Report: Lower
Boise River and Snake River Tributaries April 24 through October 9, 2008. ISDA
Technical Report Summary W-29.
MacCoy, D.E., 2004, Water-Quality and Biological conditions in the lower Boise River, Ada and
Canyon Counties, Idaho, 1994–2002: U.S. Geological Survey Scientific Investigations
Report 2004–5128, 80 p.
MacCoy, D.E., 2006, Fish communities and related environmental conditions of the lower Boise
River, southwestern Idaho, 1974–2004: U.S. Geological Survey Scientific Investigations
Report 2006-5111, 36 p.
Idaho, 1974–2004: U.S. Geological Survey Scientific Investigations Report 2006-5111, 36 p.
Miltner, R.J. and E.T. Rankin. 1998. Primary nutrients and the biotic integrity of rivers and
streams. Freshwater Biology 45:145-158.
Miltner, R.J. 2010. A Method and Rationale for Deriving Nutrient Criteria for Small Rivers and
Streams in Ohio. Environmental Management 45:842-855.
Mullins, W.H. 1998. Water-quality conditions of the lower Boise River, Ada and Canyon
Counties, Idaho, May 1994 through February 1997: U.S. Geological Survey Water-
Resources Investigations Report 98-4111, 32 p.
Mullins, W.H. 1999. Biological assessment of the lower Boise River, October 1995 through
January 1998, Ada and Canyon Counties, Idaho: U.S. Geological Survey Water-
Resources Investigations Report 99-4178, 37 p.
Rosgen, D. 1996. Applied River Morphology. Pagosa Springs, CO: Wildland Hydrology.
Rushforth Phycology. 2007. Periphyton Community Analysis Summary: Boise River Study.
Orem, UT: Rushforth Phycology, LLC.
Strahler, A.N. 1957. Quantitative Analysis of Watershed Geomorphology. Transactions
American Geophysical Union 38:913–920.
Suplee, M.W., V. Watson, M. Teply, and H. McKee. 2009. How green is too green? Public
opinion of what constitutes undesirable algae levels in streams. Journal of the American
Water Resources Association 45:123-140.
DRAFT November 2014 Lower Boise River SBA and TMDL Addendum – Total Phosphorus DRAFT
150 DRAFT November 2014
TSIC (Tri-State Implementation Council). 1998. Clark Fork River Voluntary Nutrient Reduction
Program. 33 p. + Appendices.
US Congress. 1972. Clean Water Act (Federal Water Pollution Control Act). 33 USC §1251–
1387.
USGS (U.S. Geological Survey). 2012. Work plan for the assessment of water quality and
biological communities in the lower Boise River and selected tributaries, Ada and
Canyon Counties, Idaho 2012 through 2016. 6 p.
USGS (U.S. Geological Survey). 2013a. Work plan for the assessment of water quality and
biological communities in the lower Boise River and selected tributaries, Ada and
Canyon Counties, Idaho 2013 through 2016. 5 p.
USGS (U.S. Geological Survey). 2013b. Work plan for the assessment of water quality and
biological communities in the lower Boise River and selected tributaries, Ada and
Canyon Counties, Idaho Federal Fiscal Year 2014. 4 p.
Welch, E.G., J.M. Jacoby, R.R. Horner, and M.R. Seeley. 1988. Nuisance biomass levels
of periphytic algae in streams. Hydrobiologia 157:161-168.
Western Regional Climate Center. 2010. NCDC 1981-2012 Monthly Normals: Boise WSFO
Airport, Idaho 101022. Web July 15, 2014. http://www.wrcc.dri.edu/cgi-
bin/cliMAIN.pl?id1022
Wood, M.S., and A.B. Etheridge. 2011. Water-quality conditions near the confluence of the
Snake and Boise Rivers, Canyon County, Idaho: U.S. Geological Survey Scientific
Investigations Report 2011–5217, 70 p.
GIS Coverages
Restriction of liability: Neither the State of Idaho, nor the Department of Environmental Quality,
nor any of their employees make any warranty, express or implied, or assume any legal liability
or responsibility for the accuracy, completeness, or usefulness of any information or data
provided. Metadata are provided for data sets, and no data should be used without first reading
and understanding its limitations. The data could include technical inaccuracies or typographical
errors. The Department of Environmental Quality may update, modify, or revise the data used at
any time, without notice.
DRAFT November 2014 Lower Boise River SBA and TMDL Addendum – Total Phosphorus DRAFT
151 DRAFT November 2014
Glossary §303(d)
Refers to section 303 subsection “d” of the Clean Water Act.
Section 303(d) requires states to develop a list of water bodies that
do not meet water quality standards. This section also requires total
maximum daily loads (TMDLs) be prepared for listed waters. Both
the list and the TMDLs are subject to United States Environmental
Protection Agency approval.
Assessment Unit (AU)
A group of similar streams that have similar land use practices,
ownership, or land management. However, stream order is the
main basis for determining AUs. All the waters of the state are
defined using AUs, and because AUs are a subset of water body
identification numbers, they tie directly to the water quality
standards so that beneficial uses defined in the water quality
standards are clearly tied to streams on the landscape.
Beneficial Use
Any of the various uses of water that are recognized in water
quality standards, including, but not limited to, aquatic life,
recreation, water supply, wildlife habitat, and aesthetics.
Beneficial Use Reconnaissance Program (BURP)
A program for conducting systematic biological and physical
habitat surveys of water bodies in Idaho. BURP protocols address
lakes, reservoirs, and wadeable streams and rivers.
Exceedance
A violation (according to DEQ policy) of the pollutant levels
permitted by water quality criteria.
Fully Supporting
In compliance with water quality standards and within the range of
biological reference conditions for all designated and existing
beneficial uses as determined through the Water Body Assessment
Guidance (Grafe et al. 2002).
Load Allocation (LA)
A portion of a water body’s load capacity for a given pollutant that
is given to a particular nonpoint source (by class, type, or
geographic area).
Load(ing)
The quantity of a substance entering a receiving stream, usually
expressed in pounds or kilograms per day or tons per year. Loading
is the product of flow (discharge) and concentration.
DRAFT November 2014 Lower Boise River SBA and TMDL Addendum – Total Phosphorus DRAFT
152 DRAFT November 2014
Load Capacity (LC)
How much pollutant a water body can receive over a given period
without causing violations of state water quality standards. Upon
allocation to various sources, a margin of safety, and natural
background contributions, it becomes a total maximum daily load.
Margin of Safety (MOS)
An implicit or explicit portion of a water body’s load capacity set
aside to allow for uncertainly about the relationship between the
pollutant loads and the quality of the receiving water body. The
margin of safety is a required component of a total maximum daily
load (TMDL) and is often incorporated into conservative
assumptions used to develop the TMDL (generally within the
calculations and/or models). The margin of safety is not allocated
to any sources of pollution.
Nonpoint Source
A dispersed source of pollutants generated from a geographical
area when pollutants are dissolved or suspended in runoff and then
delivered into waters of the state. Nonpoint sources are without a
discernable point or origin. They include, but are not limited to,
irrigated and nonirrigated lands used for grazing, crop production,
and silviculture; rural roads; construction and mining sites; log
storage or rafting; and recreation sites.
Not Assessed (NA)
A concept and an assessment category describing water bodies that
have been studied but are missing critical information needed to
complete an assessment.
Not Fully Supporting
Not in compliance with water quality standards or not within the
range of biological reference conditions for any beneficial use as
determined through the Water Body Assessment Guidance (Grafe
et al. 2002).
Point Source
A source of pollutants characterized by having a discrete
conveyance, such as a pipe, ditch, or other identifiable “point” of
discharge into a receiving water. Common point sources of
pollution are industrial and municipal wastewater plants.
Pollutant
Generally, any substance introduced into the environment that
adversely affects the usefulness of a resource or the health of
humans, animals, or ecosystems.
Pollution
A very broad concept that encompasses human-caused changes in
the environment that alter the functioning of natural processes and
DRAFT November 2014 Lower Boise River SBA and TMDL Addendum – Total Phosphorus DRAFT
153 DRAFT November 2014
produce undesirable environmental and health effects. Pollution
includes human-induced alteration of the physical, biological,
chemical, and radiological integrity of water and other media.
Stream Order
Hierarchical ordering of streams based on the degree of branching.
A 1st-order stream is an unforked or unbranched stream. Under
Strahler’s (1957) system, higher-order streams result from the
joining of two streams of the same order.
Synoptic
A sampling event that takes place over a relatively short timeframe
and under relatively stable hydrologic conditions.
Total Maximum Daily Load (TMDL)
A TMDL is a water body’s load capacity after it has been allocated
among pollutant sources. It can be expressed on a time basis other
than daily if appropriate. Sediment loads, for example, are often
calculated on an annual basis. A TMDL is equal to the load
capacity, such that load capacity = margin of safety + natural
background + load allocation + wasteload allocation = TMDL. In
common usage, a TMDL also refers to the written document that
contains the statement of loads and supporting analyses, often
incorporating TMDLs for several water bodies and/or pollutants
within a given watershed.
Wasteload Allocation (WLA)
The portion of receiving water’s load capacity that is allocated to
one of its existing or future point sources of pollution. Wasteload
allocations specify how much pollutant each point source may
release to a water body.
Water Body
A stream, river, lake, estuary, coastline, or other water feature, or
portion thereof.
Water Quality Criteria
Levels of water quality expected to render a body of water suitable
for its designated uses. Criteria are based on specific levels of
pollutants that would make the water harmful if used for drinking,
swimming, farming, aquatic habitat, or industrial processes.
Water Quality Standards
State-adopted and United States Environmental Protection
Agency-approved ambient standards for water bodies. The
standards prescribe the use of the water body and establish the
water quality criteria that must be met to protect designated uses.
DRAFT November 2014 Lower Boise River SBA and TMDL Addendum – Total Phosphorus DRAFT
154 DRAFT November 2014
This page intentionally left blank for correct double-sided printing.
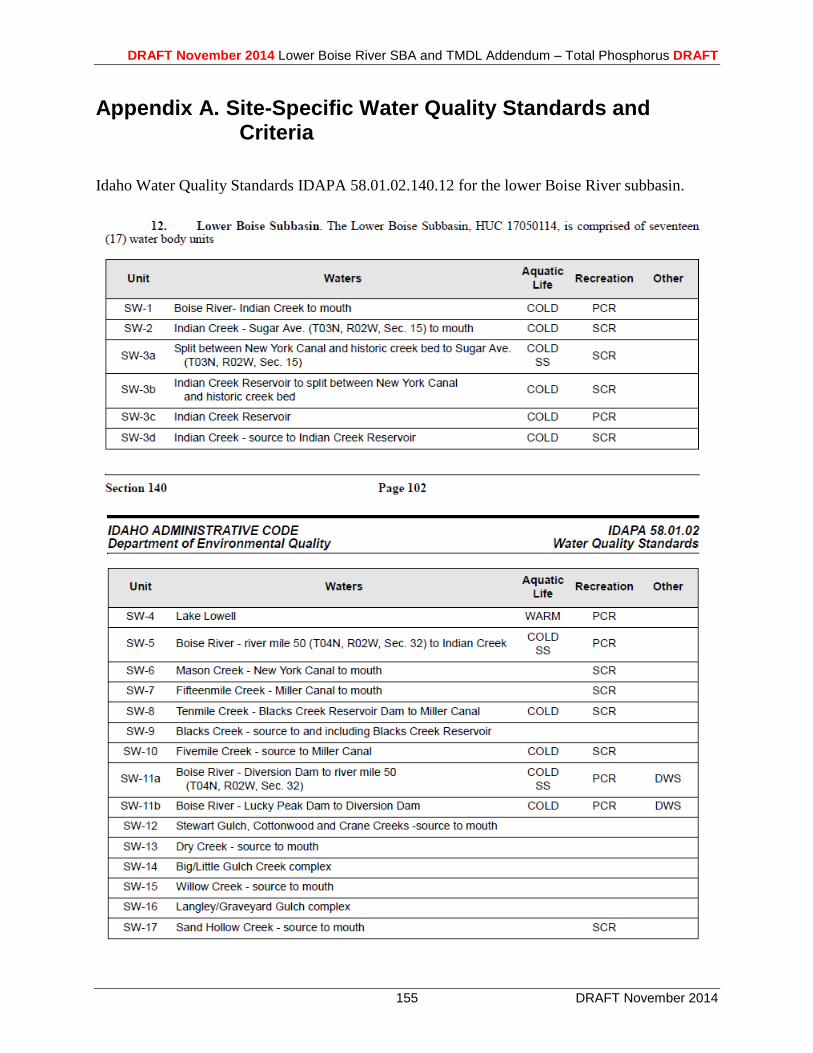
DRAFT November 2014 Lower Boise River SBA and TMDL Addendum – Total Phosphorus DRAFT
155 DRAFT November 2014
Appendix A. Site-Specific Water Quality Standards and Criteria
Idaho Water Quality Standards IDAPA 58.01.02.140.12 for the lower Boise River subbasin.
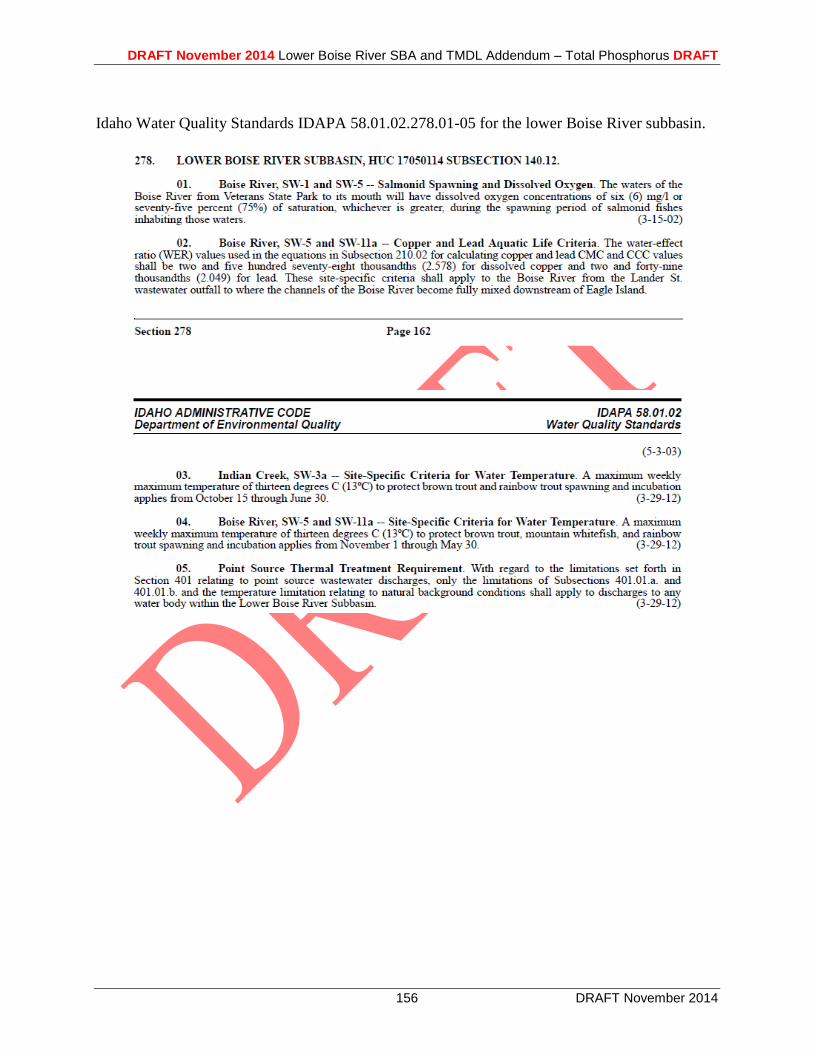
DRAFT November 2014 Lower Boise River SBA and TMDL Addendum – Total Phosphorus DRAFT
156 DRAFT November 2014
Idaho Water Quality Standards IDAPA 58.01.02.278.01-05 for the lower Boise River subbasin.

DRAFT November 2014 Lower Boise River SBA and TMDL Addendum – Total Phosphorus DRAFT
157 DRAFT November 2014
This page intentionally left blank for correct double-sided printing.
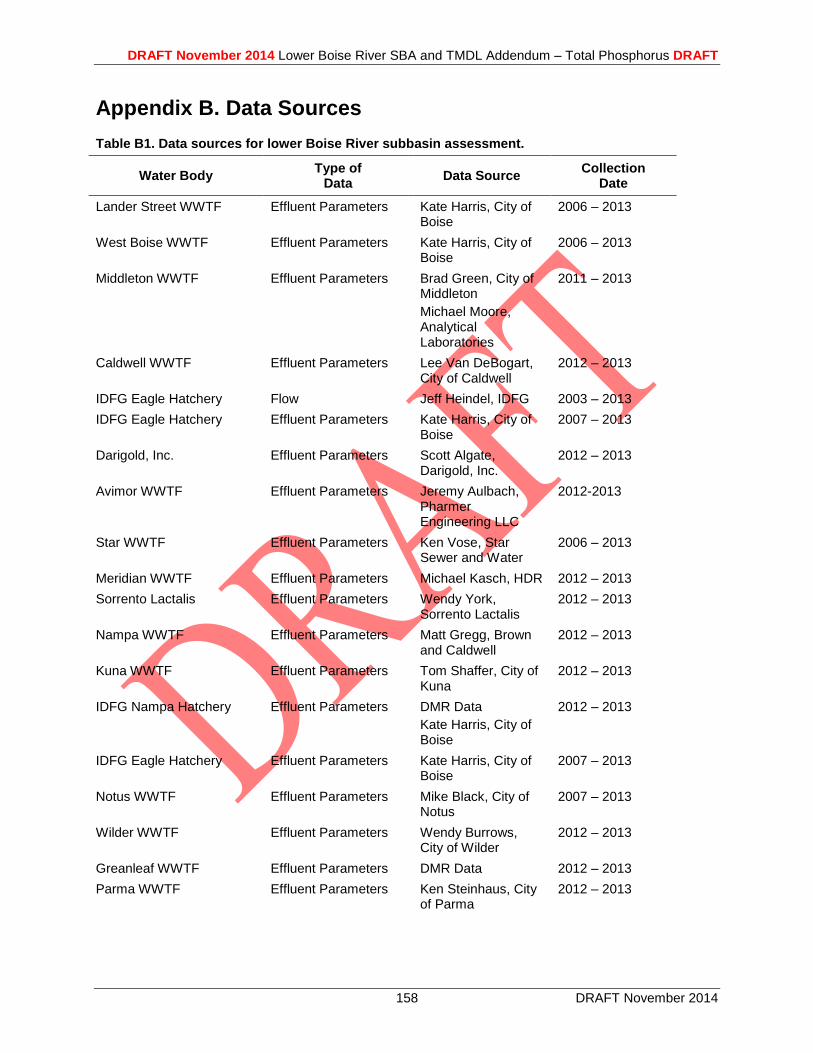
DRAFT November 2014 Lower Boise River SBA and TMDL Addendum – Total Phosphorus DRAFT
158 DRAFT November 2014
Appendix B. Data Sources
Table B1. Data sources for lower Boise River subbasin assessment.
Water Body Type of
Data Data Source
Collection Date
Lander Street WWTF Effluent Parameters Kate Harris, City of Boise
2006 – 2013
West Boise WWTF Effluent Parameters Kate Harris, City of Boise
2006 – 2013
Middleton WWTF Effluent Parameters Brad Green, City of Middleton
Michael Moore, Analytical Laboratories
2011 – 2013
Caldwell WWTF Effluent Parameters Lee Van DeBogart, City of Caldwell
2012 – 2013
IDFG Eagle Hatchery Flow Jeff Heindel, IDFG 2003 – 2013
IDFG Eagle Hatchery Effluent Parameters Kate Harris, City of Boise
2007 – 2013
Darigold, Inc. Effluent Parameters Scott Algate, Darigold, Inc.
2012 – 2013
Avimor WWTF Effluent Parameters Jeremy Aulbach, Pharmer Engineering LLC
2012-2013
Star WWTF Effluent Parameters Ken Vose, Star Sewer and Water
2006 – 2013
Meridian WWTF Effluent Parameters Michael Kasch, HDR 2012 – 2013
Sorrento Lactalis Effluent Parameters Wendy York, Sorrento Lactalis
2012 – 2013
Nampa WWTF Effluent Parameters Matt Gregg, Brown and Caldwell
2012 – 2013
Kuna WWTF Effluent Parameters Tom Shaffer, City of Kuna
2012 – 2013
IDFG Nampa Hatchery Effluent Parameters DMR Data
Kate Harris, City of Boise
2012 – 2013
IDFG Eagle Hatchery Effluent Parameters Kate Harris, City of Boise
2007 – 2013
Notus WWTF Effluent Parameters Mike Black, City of Notus
2007 – 2013
Wilder WWTF Effluent Parameters Wendy Burrows, City of Wilder
2012 – 2013
Greanleaf WWTF Effluent Parameters DMR Data 2012 – 2013
Parma WWTF Effluent Parameters Ken Steinhaus, City of Parma
2012 – 2013
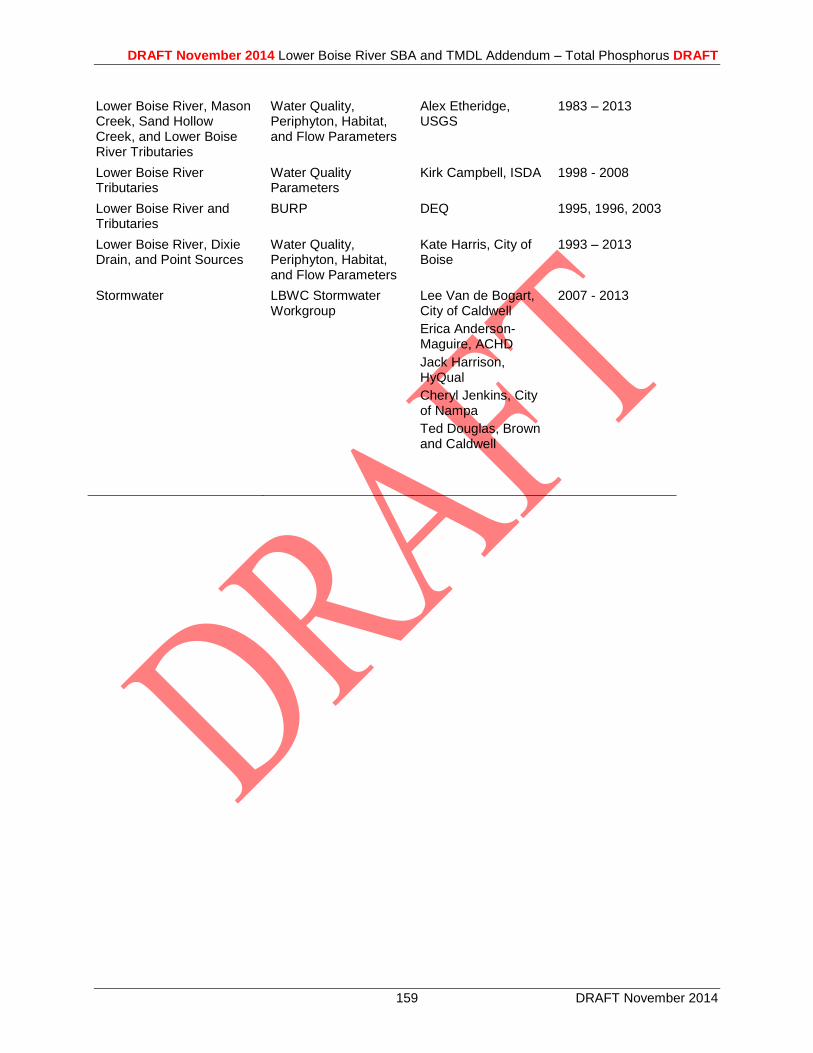
DRAFT November 2014 Lower Boise River SBA and TMDL Addendum – Total Phosphorus DRAFT
159 DRAFT November 2014
Lower Boise River, Mason Creek, Sand Hollow Creek, and Lower Boise River Tributaries
Water Quality, Periphyton, Habitat, and Flow Parameters
Alex Etheridge, USGS
1983 – 2013
Lower Boise River Tributaries
Water Quality Parameters
Kirk Campbell, ISDA 1998 - 2008
Lower Boise River and Tributaries
BURP DEQ 1995, 1996, 2003
Lower Boise River, Dixie Drain, and Point Sources
Water Quality, Periphyton, Habitat, and Flow Parameters
Kate Harris, City of Boise
1993 – 2013
Stormwater LBWC Stormwater Workgroup
Lee Van de Bogart, City of Caldwell
Erica Anderson-Maguire, ACHD
Jack Harrison, HyQual
Cheryl Jenkins, City of Nampa
Ted Douglas, Brown and Caldwell
2007 - 2013

DRAFT November 2014 Lower Boise River SBA and TMDL Addendum – Total Phosphorus DRAFT
160 DRAFT November 2014
This page intentionally left blank for correct double-sided printing.
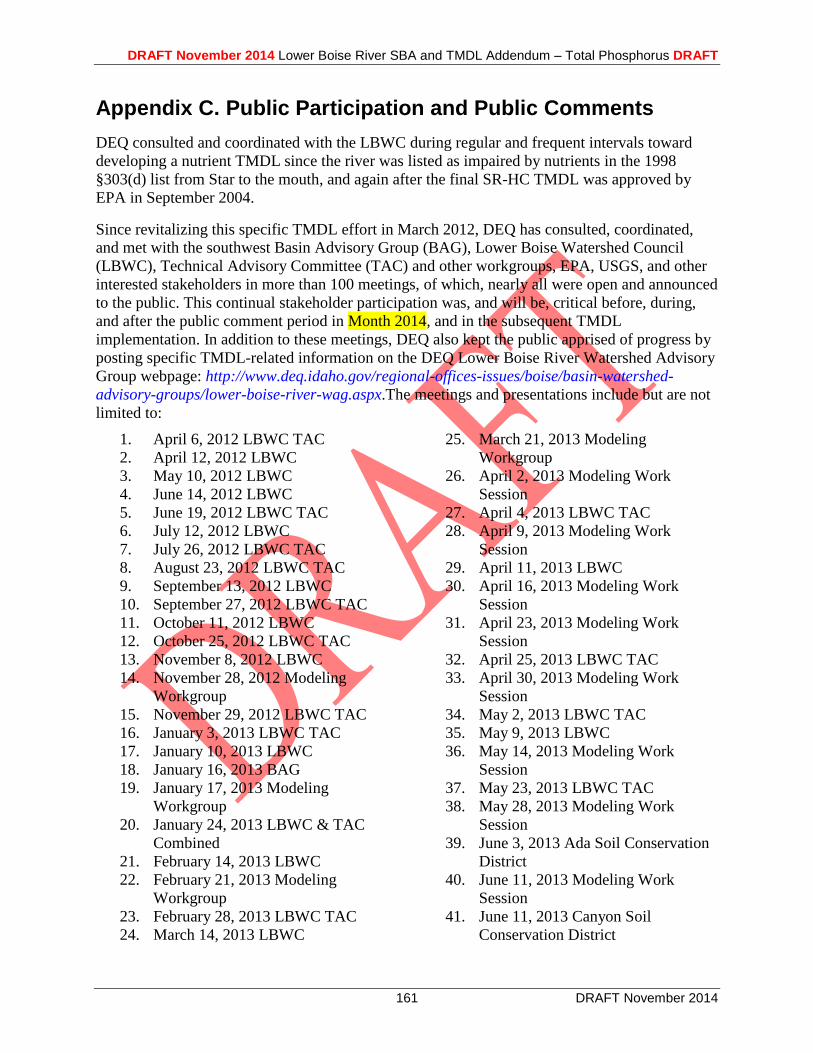
DRAFT November 2014 Lower Boise River SBA and TMDL Addendum – Total Phosphorus DRAFT
161 DRAFT November 2014
Appendix C. Public Participation and Public Comments
DEQ consulted and coordinated with the LBWC during regular and frequent intervals toward
developing a nutrient TMDL since the river was listed as impaired by nutrients in the 1998
§303(d) list from Star to the mouth, and again after the final SR-HC TMDL was approved by
EPA in September 2004.
Since revitalizing this specific TMDL effort in March 2012, DEQ has consulted, coordinated,
and met with the southwest Basin Advisory Group (BAG), Lower Boise Watershed Council
(LBWC), Technical Advisory Committee (TAC) and other workgroups, EPA, USGS, and other
interested stakeholders in more than 100 meetings, of which, nearly all were open and announced
to the public. This continual stakeholder participation was, and will be, critical before, during,
and after the public comment period in Month 2014, and in the subsequent TMDL
implementation. In addition to these meetings, DEQ also kept the public apprised of progress by
posting specific TMDL-related information on the DEQ Lower Boise River Watershed Advisory
Group webpage: http://www.deq.idaho.gov/regional-offices-issues/boise/basin-watershed-
advisory-groups/lower-boise-river-wag.aspx.The meetings and presentations include but are not
limited to:
1. April 6, 2012 LBWC TAC
2. April 12, 2012 LBWC
3. May 10, 2012 LBWC
4. June 14, 2012 LBWC
5. June 19, 2012 LBWC TAC
6. July 12, 2012 LBWC
7. July 26, 2012 LBWC TAC
8. August 23, 2012 LBWC TAC
9. September 13, 2012 LBWC
10. September 27, 2012 LBWC TAC
11. October 11, 2012 LBWC
12. October 25, 2012 LBWC TAC
13. November 8, 2012 LBWC
14. November 28, 2012 Modeling
Workgroup
15. November 29, 2012 LBWC TAC
16. January 3, 2013 LBWC TAC
17. January 10, 2013 LBWC
18. January 16, 2013 BAG
19. January 17, 2013 Modeling
Workgroup
20. January 24, 2013 LBWC & TAC
Combined
21. February 14, 2013 LBWC
22. February 21, 2013 Modeling
Workgroup
23. February 28, 2013 LBWC TAC
24. March 14, 2013 LBWC
25. March 21, 2013 Modeling
Workgroup
26. April 2, 2013 Modeling Work
Session
27. April 4, 2013 LBWC TAC
28. April 9, 2013 Modeling Work
Session
29. April 11, 2013 LBWC
30. April 16, 2013 Modeling Work
Session
31. April 23, 2013 Modeling Work
Session
32. April 25, 2013 LBWC TAC
33. April 30, 2013 Modeling Work
Session
34. May 2, 2013 LBWC TAC
35. May 9, 2013 LBWC
36. May 14, 2013 Modeling Work
Session
37. May 23, 2013 LBWC TAC
38. May 28, 2013 Modeling Work
Session
39. June 3, 2013 Ada Soil Conservation
District
40. June 11, 2013 Modeling Work
Session
41. June 11, 2013 Canyon Soil
Conservation District
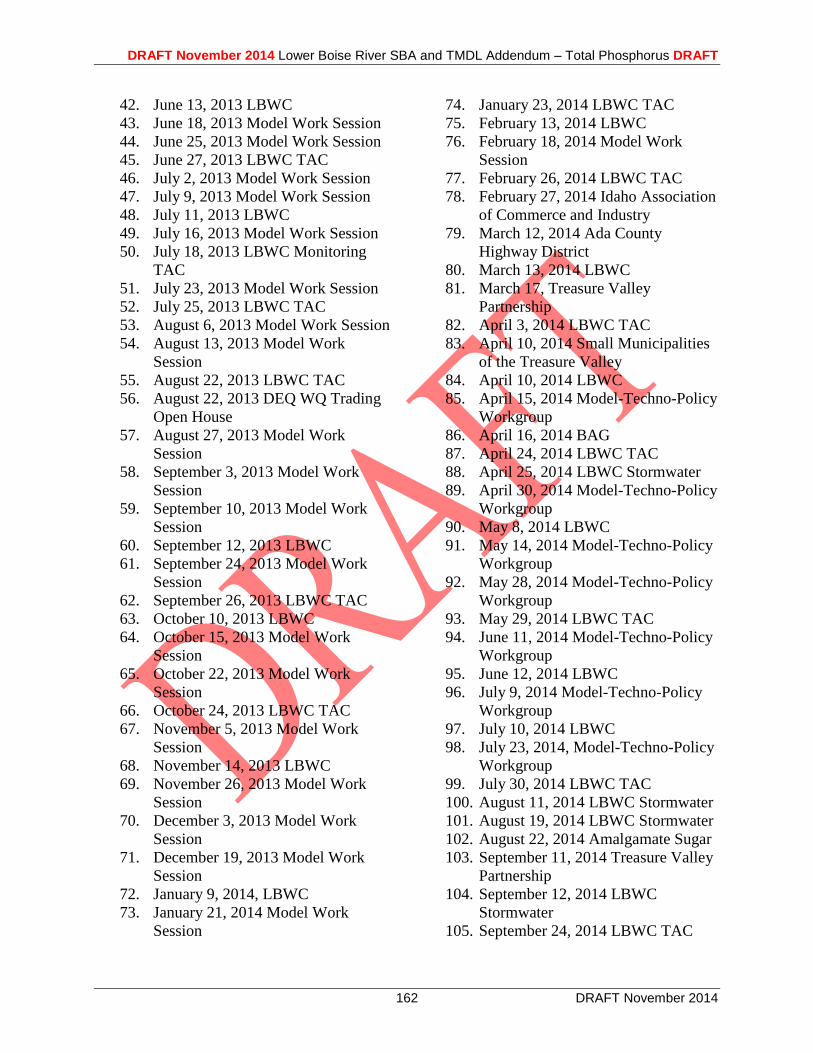
DRAFT November 2014 Lower Boise River SBA and TMDL Addendum – Total Phosphorus DRAFT
162 DRAFT November 2014
42. June 13, 2013 LBWC
43. June 18, 2013 Model Work Session
44. June 25, 2013 Model Work Session
45. June 27, 2013 LBWC TAC
46. July 2, 2013 Model Work Session
47. July 9, 2013 Model Work Session
48. July 11, 2013 LBWC
49. July 16, 2013 Model Work Session
50. July 18, 2013 LBWC Monitoring
TAC
51. July 23, 2013 Model Work Session
52. July 25, 2013 LBWC TAC
53. August 6, 2013 Model Work Session
54. August 13, 2013 Model Work
Session
55. August 22, 2013 LBWC TAC
56. August 22, 2013 DEQ WQ Trading
Open House
57. August 27, 2013 Model Work
Session
58. September 3, 2013 Model Work
Session
59. September 10, 2013 Model Work
Session
60. September 12, 2013 LBWC
61. September 24, 2013 Model Work
Session
62. September 26, 2013 LBWC TAC
63. October 10, 2013 LBWC
64. October 15, 2013 Model Work
Session
65. October 22, 2013 Model Work
Session
66. October 24, 2013 LBWC TAC
67. November 5, 2013 Model Work
Session
68. November 14, 2013 LBWC
69. November 26, 2013 Model Work
Session
70. December 3, 2013 Model Work
Session
71. December 19, 2013 Model Work
Session
72. January 9, 2014, LBWC
73. January 21, 2014 Model Work
Session
74. January 23, 2014 LBWC TAC
75. February 13, 2014 LBWC
76. February 18, 2014 Model Work
Session
77. February 26, 2014 LBWC TAC
78. February 27, 2014 Idaho Association
of Commerce and Industry
79. March 12, 2014 Ada County
Highway District
80. March 13, 2014 LBWC
81. March 17, Treasure Valley
Partnership
82. April 3, 2014 LBWC TAC
83. April 10, 2014 Small Municipalities
of the Treasure Valley
84. April 10, 2014 LBWC
85. April 15, 2014 Model-Techno-Policy
Workgroup
86. April 16, 2014 BAG
87. April 24, 2014 LBWC TAC
88. April 25, 2014 LBWC Stormwater
89. April 30, 2014 Model-Techno-Policy
Workgroup
90. May 8, 2014 LBWC
91. May 14, 2014 Model-Techno-Policy
Workgroup
92. May 28, 2014 Model-Techno-Policy
Workgroup
93. May 29, 2014 LBWC TAC
94. June 11, 2014 Model-Techno-Policy
Workgroup
95. June 12, 2014 LBWC
96. July 9, 2014 Model-Techno-Policy
Workgroup
97. July 10, 2014 LBWC
98. July 23, 2014, Model-Techno-Policy
Workgroup
99. July 30, 2014 LBWC TAC
100. August 11, 2014 LBWC Stormwater
101. August 19, 2014 LBWC Stormwater
102. August 22, 2014 Amalgamate Sugar
103. September 11, 2014 Treasure Valley
Partnership
104. September 12, 2014 LBWC
Stormwater
105. September 24, 2014 LBWC TAC
DRAFT November 2014 Lower Boise River SBA and TMDL Addendum – Total Phosphorus DRAFT
163 DRAFT November 2014
106. October 9, 2014 LBWC
107.
[Public comments and DEQ responses to be inserted following public comment period.]
HyQual
164
This page intentionally left blank for correct double-sided printing.
HyQual
165
Appendix D. Distribution List
Ben Cope and Bill Stewart, EPA
BOR Pacific Northwest Region and Snake River Office
Lower Boise Watershed Council, TAC, 319 TAC, and Workgroup Participants

HyQual
166
This page intentionally left blank for correct double-sided printing.
HyQual
167
Appendix E. Stormwater Information Provided to DEQ by the LBWC Stormwater Workgroup
Lower Boise River
Stormwater Phosphorus Loads
Prepare for: LBR Stormwater Workgroup
Prepared by: Jack Harrison, PhD, PE
Date: November 20, 2014
Purpose and Acknowledgements
Stormwater discharge total phosphorus loading analyses and example wasteload and load allocations
were prepared to support Boise River TP TMDL development by Idaho DEQ. Stormwater discharges met
on August 11, 19, 27, September 12 and October 14, 2014, to discuss loads and potential allocation
scenarios. During these meetings workgroup attendees reviewed and discussed draft information,
stormwater data, methodologies for calculations of loads, and allocation options. The analyses and
example allocations summarized below were developed with significant input from stormwater
representatives for local NPDES permittees, including:
Erica Anderson-Maguire/ACHD
Lee Van De Bogart/Caldwell
Cheryl Jenkins/Nampa
Michael Mieyr/Nampa
Jack Harrison/ACHD and Middleton
Ted Douglass/Nampa
HyQual
168
Contents Summary of Stormwater Loads ................................................................................................................ 169
Stormwater Load Calculations and Methods............................................................................................ 170
Basis for Load Calculations ......................................................................... Error! Bookmark not defined.
Stormwater Management Areas ...................................................................................................... 172
Wet Weather Data Summary ............................................................................................................ 172
Dry Weather Data Summary ............................................................................................................. 173
Dry Weather Percent of Area............................................................................................................ 174
Wet Weather Fractions ..................................................................................................................... 175
Dry Weather Fractions ...................................................................................................................... 176
General Issues and Concerns .................................................................................................................... 176
Concentration vs. Load ..................................................................................................................... 176
Low frequency occurrence of storm ................................................................................................. 176
Permittees and Non-permittees ....................................................................................................... 176
Ag/Over-irrigation/Groundwater ...................................................................................................... 177
MS4 Allocations ................................................................................................................................ 177
References ................................................................................................................................................ 177
Appendices ................................................................................................................................................ 177
Appendix A – Stormwater Areas ........................................................................................................... 177
Appendix B – Wet Weather Data and Analyses .................................................................................... 178
Appendix C – Dry Weather Data and Analyses ..................................................................................... 178
Appendix D – Wet Weather May -Sep Fraction .................................................................................... 178
Appendix E – Previous TMDL Dry Weather Loads ................................................................................ 178
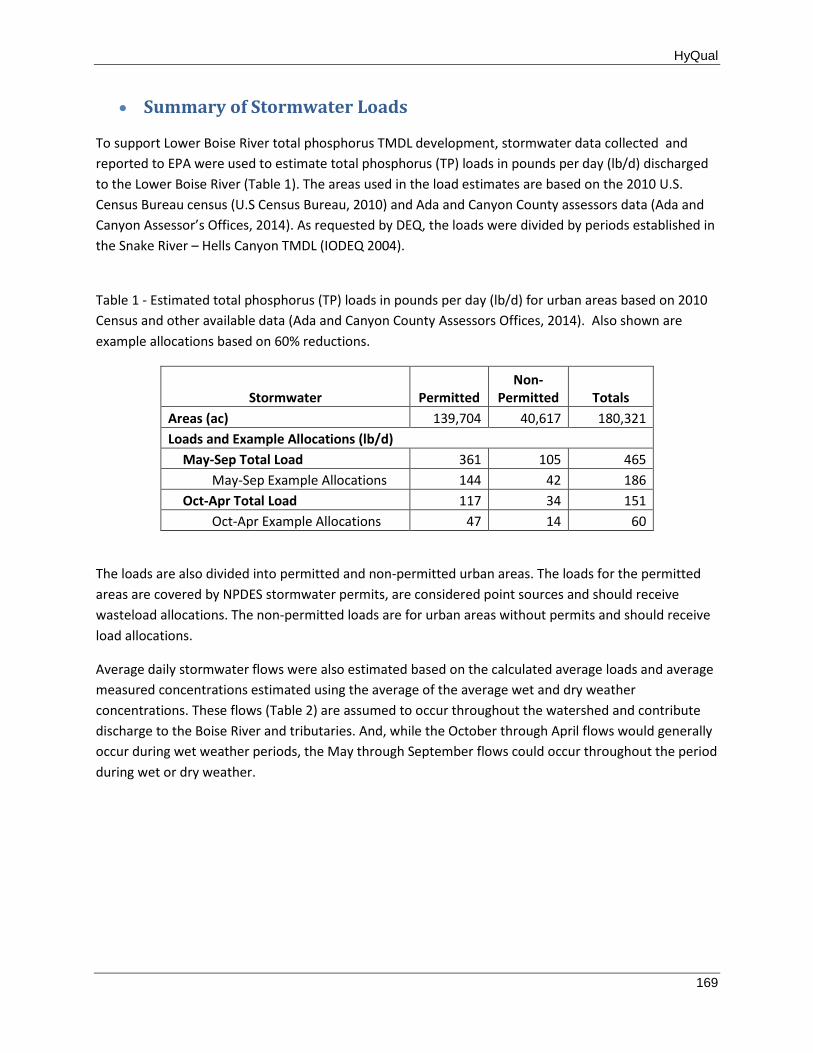
HyQual
169
Summary of Stormwater Loads
To support Lower Boise River total phosphorus TMDL development, stormwater data collected and
reported to EPA were used to estimate total phosphorus (TP) loads in pounds per day (lb/d) discharged
to the Lower Boise River (Table 1). The areas used in the load estimates are based on the 2010 U.S.
Census Bureau census (U.S Census Bureau, 2010) and Ada and Canyon County assessors data (Ada and
Canyon Assessor’s Offices, 2014). As requested by DEQ, the loads were divided by periods established in
the Snake River – Hells Canyon TMDL (IODEQ 2004).
Table 1 - Estimated total phosphorus (TP) loads in pounds per day (lb/d) for urban areas based on 2010
Census and other available data (Ada and Canyon County Assessors Offices, 2014). Also shown are
example allocations based on 60% reductions.
Stormwater Permitted Non-
Permitted Totals
Areas (ac) 139,704 40,617 180,321
Loads and Example Allocations (lb/d)
May-Sep Total Load 361 105 465
May-Sep Example Allocations 144 42 186
Oct-Apr Total Load 117 34 151
Oct-Apr Example Allocations 47 14 60
The loads are also divided into permitted and non-permitted urban areas. The loads for the permitted
areas are covered by NPDES stormwater permits, are considered point sources and should receive
wasteload allocations. The non-permitted loads are for urban areas without permits and should receive
load allocations.
Average daily stormwater flows were also estimated based on the calculated average loads and average
measured concentrations estimated using the average of the average wet and dry weather
concentrations. These flows (Table 2) are assumed to occur throughout the watershed and contribute
discharge to the Boise River and tributaries. And, while the October through April flows would generally
occur during wet weather periods, the May through September flows could occur throughout the period
during wet or dry weather.
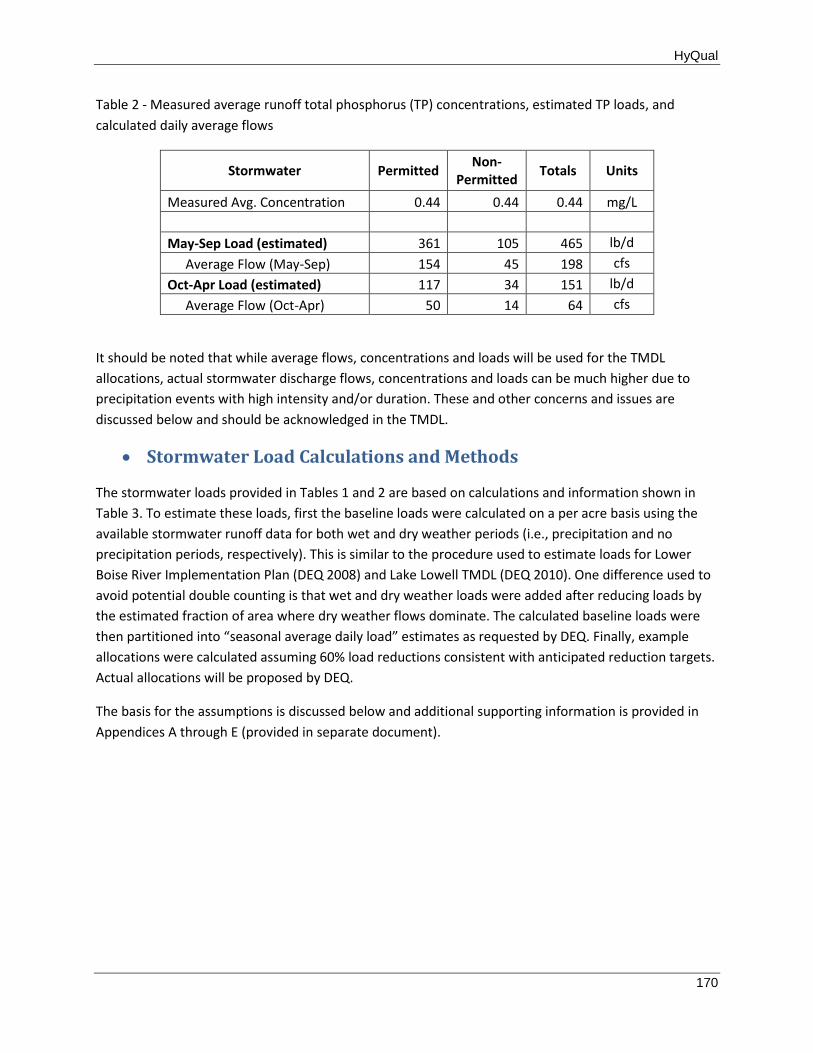
HyQual
170
Table 2 - Measured average runoff total phosphorus (TP) concentrations, estimated TP loads, and
calculated daily average flows
Stormwater Permitted Non-
Permitted Totals Units
Measured Avg. Concentration 0.44 0.44 0.44 mg/L
May-Sep Load (estimated) 361 105 465 lb/d
Average Flow (May-Sep) 154 45 198 cfs
Oct-Apr Load (estimated) 117 34 151 lb/d
Average Flow (Oct-Apr) 50 14 64 cfs
It should be noted that while average flows, concentrations and loads will be used for the TMDL
allocations, actual stormwater discharge flows, concentrations and loads can be much higher due to
precipitation events with high intensity and/or duration. These and other concerns and issues are
discussed below and should be acknowledged in the TMDL.
Stormwater Load Calculations and Methods
The stormwater loads provided in Tables 1 and 2 are based on calculations and information shown in
Table 3. To estimate these loads, first the baseline loads were calculated on a per acre basis using the
available stormwater runoff data for both wet and dry weather periods (i.e., precipitation and no
precipitation periods, respectively). This is similar to the procedure used to estimate loads for Lower
Boise River Implementation Plan (DEQ 2008) and Lake Lowell TMDL (DEQ 2010). One difference used to
avoid potential double counting is that wet and dry weather loads were added after reducing loads by
the estimated fraction of area where dry weather flows dominate. The calculated baseline loads were
then partitioned into “seasonal average daily load” estimates as requested by DEQ. Finally, example
allocations were calculated assuming 60% load reductions consistent with anticipated reduction targets.
Actual allocations will be proposed by DEQ.
The basis for the assumptions is discussed below and additional supporting information is provided in
Appendices A through E (provided in separate document).

HyQual
171
Table 3 - Wet and dry weather loads for the anticipated TMDL periods (i.e., May-Sep and Oct-Apr) basis
and references to more detailed information to support the load estimates
Stormwater Permitted Non-
Permitted Totals Units Note
Area 218 63 mi^2 Appendix A
139,704 40,617 180,321 ac
Baseline Loads
Wet Weather (WWx) 0.64 0.64 g/ac/d Appendix B
Full Yr Load 90 26 116 kg/d
197 57 254 lb/d
Percent of area 70% 70% 70% 138 40 178
Dry Weather (DWx) 3.68 3.68 g/ac/d Appendix C
Full Yr Load 514 149
kg/d
1131 329 1460
Percent of area 30% 30%
339 99 438 lb/d
Seasonal Periods
WWx season fraction 0.4 0.4 Appendix D
May-Sep Wet Wx 55 16 71 lb/d
DWx season fraction 0.9 0.9 May-Sep Dry Wx 305 89 394 lb/d
May-Sep Total 361 105 465 lb/d (SR-HC Critical Period)
WWx season fraction 0.6 0.6 Appendix D
Oct-Apr Wet Wx 83 24 107 lb/d
DWx season fraction 0.1 0.1 Oct-Apr Dry Wx 34 10 44 lb/d
Oct-Apr Total 117 34 151 lb/d (NON Critical Period)
Example Allocations
% reduction 60% 60% Example for discussion
May-Sep Allocations 144 42 186 lb/d (SR-HC Critical Period)
% reduction 60% 60% Example for discussion
Oct-Apr Allocations 47 14 60 lb/d (NON Critical Period)
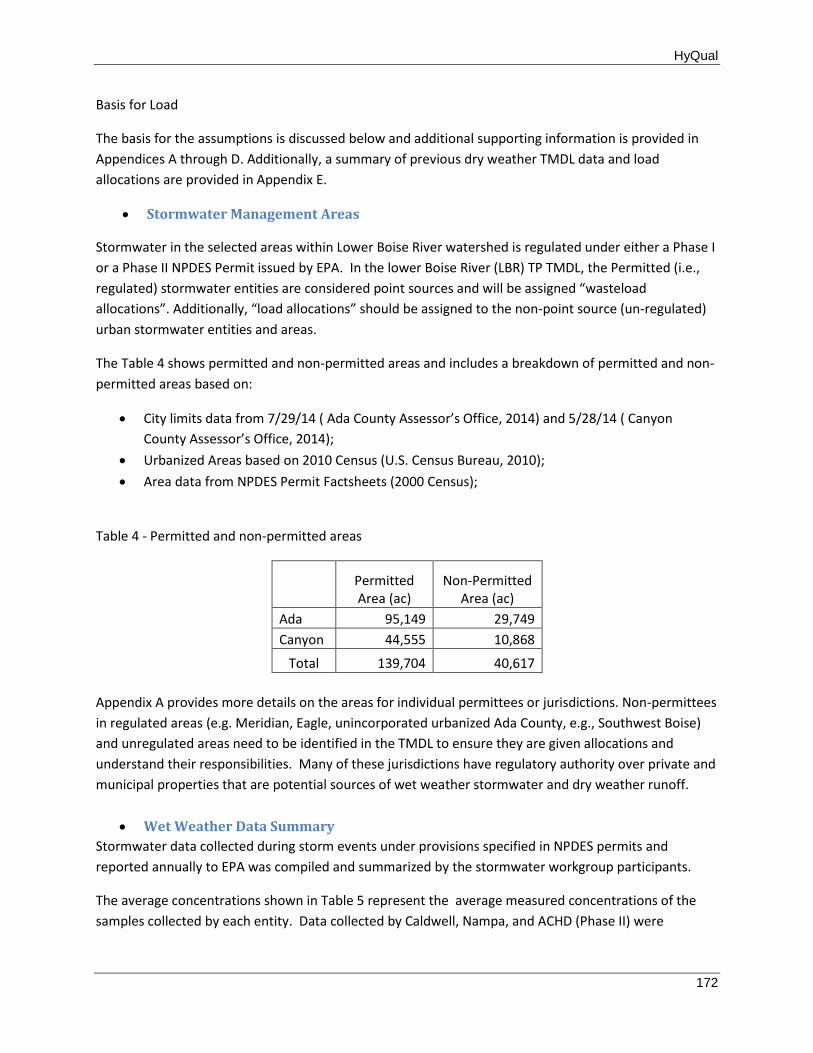
HyQual
172
Basis for Load
The basis for the assumptions is discussed below and additional supporting information is provided in
Appendices A through D. Additionally, a summary of previous dry weather TMDL data and load
allocations are provided in Appendix E.
Stormwater Management Areas
Stormwater in the selected areas within Lower Boise River watershed is regulated under either a Phase I
or a Phase II NPDES Permit issued by EPA. In the lower Boise River (LBR) TP TMDL, the Permitted (i.e.,
regulated) stormwater entities are considered point sources and will be assigned “wasteload
allocations”. Additionally, “load allocations” should be assigned to the non-point source (un-regulated)
urban stormwater entities and areas.
The Table 4 shows permitted and non-permitted areas and includes a breakdown of permitted and non-
permitted areas based on:
City limits data from 7/29/14 ( Ada County Assessor’s Office, 2014) and 5/28/14 ( Canyon
County Assessor’s Office, 2014);
Urbanized Areas based on 2010 Census (U.S. Census Bureau, 2010);
Area data from NPDES Permit Factsheets (2000 Census);
Table 4 - Permitted and non-permitted areas
Permitted Area (ac)
Non-Permitted Area (ac)
Ada 95,149 29,749
Canyon 44,555 10,868
Total 139,704 40,617
Appendix A provides more details on the areas for individual permittees or jurisdictions. Non-permittees
in regulated areas (e.g. Meridian, Eagle, unincorporated urbanized Ada County, e.g., Southwest Boise)
and unregulated areas need to be identified in the TMDL to ensure they are given allocations and
understand their responsibilities. Many of these jurisdictions have regulatory authority over private and
municipal properties that are potential sources of wet weather stormwater and dry weather runoff.
Wet Weather Data Summary
Stormwater data collected during storm events under provisions specified in NPDES permits and
reported annually to EPA was compiled and summarized by the stormwater workgroup participants.
The average concentrations shown in Table 5 represent the average measured concentrations of the
samples collected by each entity. Data collected by Caldwell, Nampa, and ACHD (Phase II) were
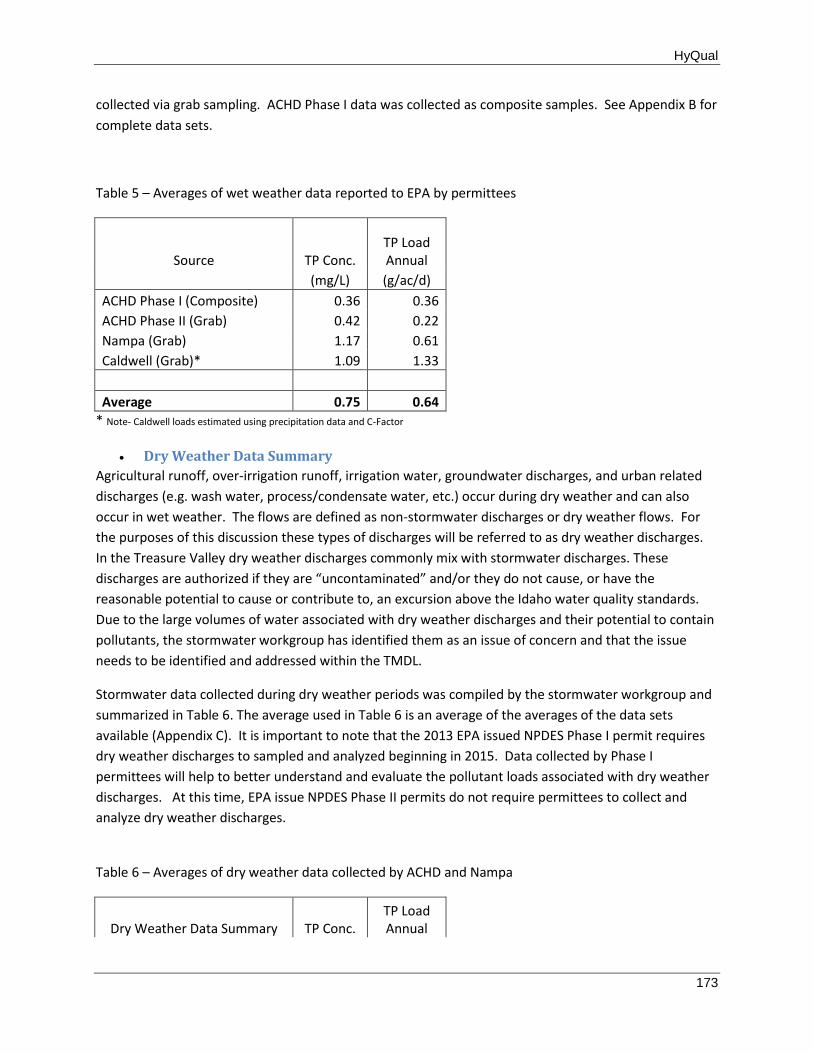
HyQual
173
collected via grab sampling. ACHD Phase I data was collected as composite samples. See Appendix B for
complete data sets.
Table 5 – Averages of wet weather data reported to EPA by permittees
Source TP Conc. TP Load Annual
(mg/L) (g/ac/d)
ACHD Phase I (Composite) 0.36 0.36
ACHD Phase II (Grab) 0.42 0.22
Nampa (Grab) 1.17 0.61
Caldwell (Grab)* 1.09 1.33
Average 0.75 0.64
* Note- Caldwell loads estimated using precipitation data and C-Factor
Dry Weather Data Summary
Agricultural runoff, over-irrigation runoff, irrigation water, groundwater discharges, and urban related
discharges (e.g. wash water, process/condensate water, etc.) occur during dry weather and can also
occur in wet weather. The flows are defined as non-stormwater discharges or dry weather flows. For
the purposes of this discussion these types of discharges will be referred to as dry weather discharges.
In the Treasure Valley dry weather discharges commonly mix with stormwater discharges. These
discharges are authorized if they are “uncontaminated” and/or they do not cause, or have the
reasonable potential to cause or contribute to, an excursion above the Idaho water quality standards.
Due to the large volumes of water associated with dry weather discharges and their potential to contain
pollutants, the stormwater workgroup has identified them as an issue of concern and that the issue
needs to be identified and addressed within the TMDL.
Stormwater data collected during dry weather periods was compiled by the stormwater workgroup and
summarized in Table 6. The average used in Table 6 is an average of the averages of the data sets
available (Appendix C). It is important to note that the 2013 EPA issued NPDES Phase I permit requires
dry weather discharges to sampled and analyzed beginning in 2015. Data collected by Phase I
permittees will help to better understand and evaluate the pollutant loads associated with dry weather
discharges. At this time, EPA issue NPDES Phase II permits do not require permittees to collect and
analyze dry weather discharges.
Table 6 – Averages of dry weather data collected by ACHD and Nampa
Dry Weather Data Summary TP Conc. TP Load Annual
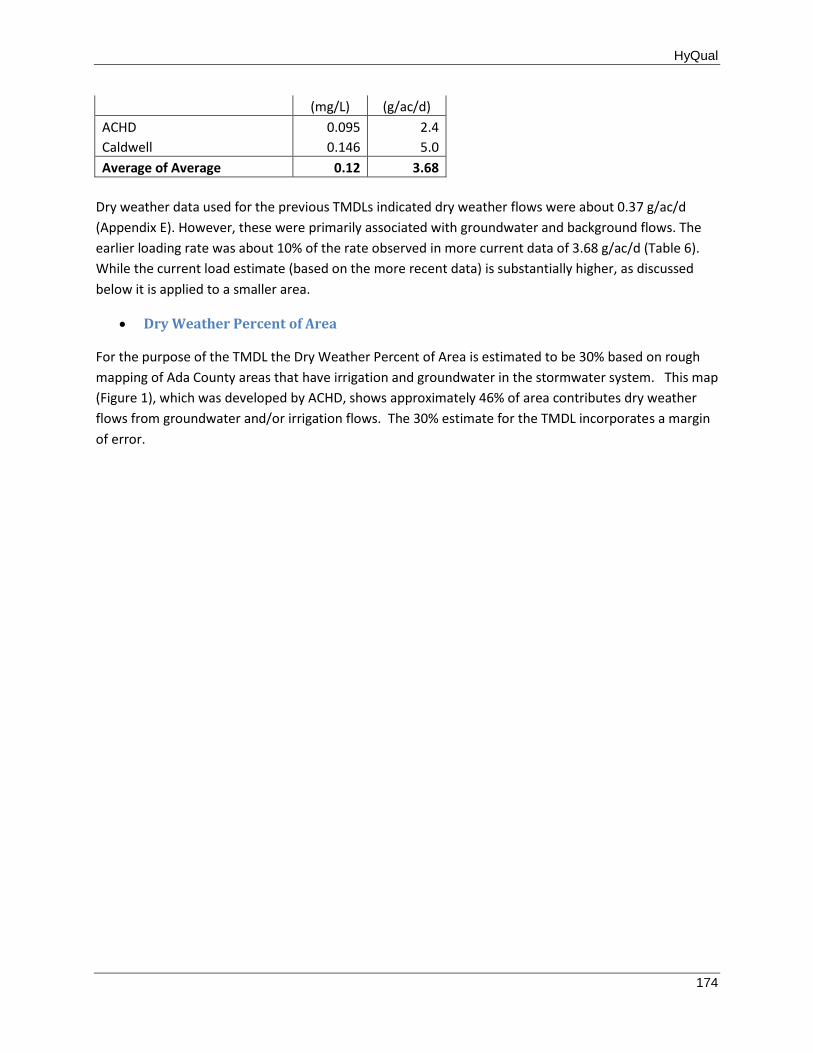
HyQual
174
(mg/L) (g/ac/d)
ACHD 0.095 2.4
Caldwell 0.146 5.0
Average of Average 0.12 3.68
Dry weather data used for the previous TMDLs indicated dry weather flows were about 0.37 g/ac/d
(Appendix E). However, these were primarily associated with groundwater and background flows. The
earlier loading rate was about 10% of the rate observed in more current data of 3.68 g/ac/d (Table 6).
While the current load estimate (based on the more recent data) is substantially higher, as discussed
below it is applied to a smaller area.
Dry Weather Percent of Area
For the purpose of the TMDL the Dry Weather Percent of Area is estimated to be 30% based on rough
mapping of Ada County areas that have irrigation and groundwater in the stormwater system. This map
(Figure 1), which was developed by ACHD, shows approximately 46% of area contributes dry weather
flows from groundwater and/or irrigation flows. The 30% estimate for the TMDL incorporates a margin
of error.
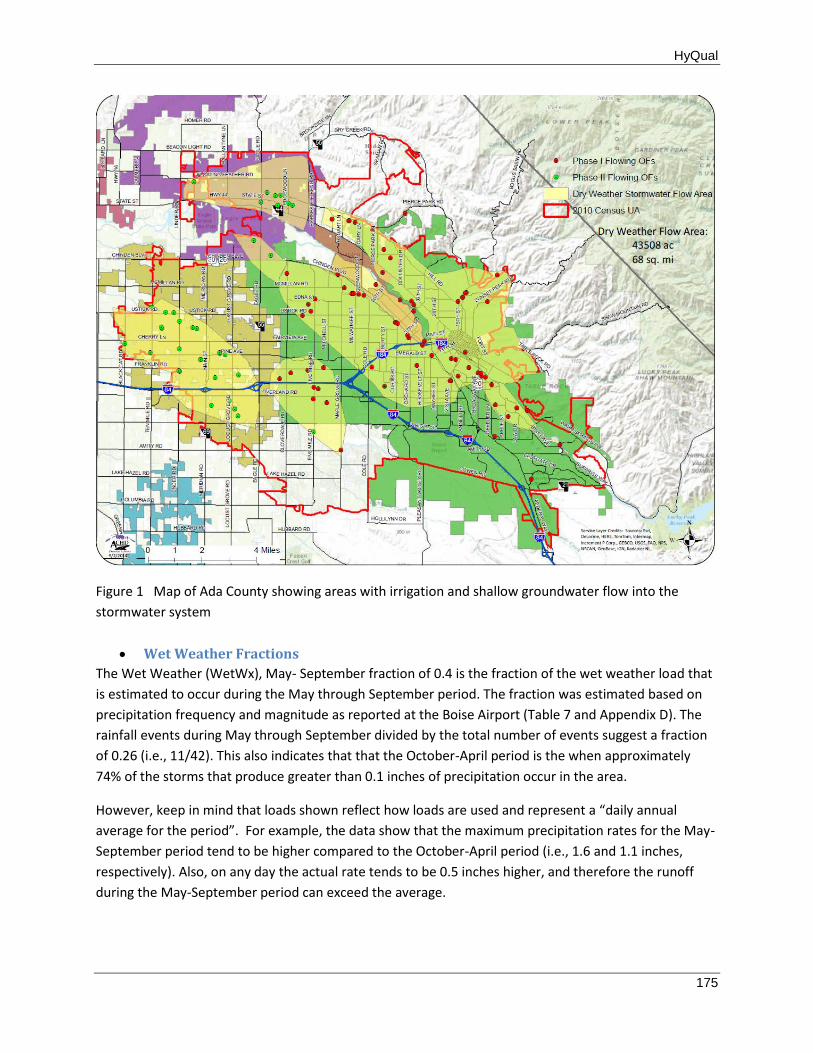
HyQual
175
Figure 1 Map of Ada County showing areas with irrigation and shallow groundwater flow into the
stormwater system
Wet Weather Fractions
The Wet Weather (WetWx), May- September fraction of 0.4 is the fraction of the wet weather load that
is estimated to occur during the May through September period. The fraction was estimated based on
precipitation frequency and magnitude as reported at the Boise Airport (Table 7 and Appendix D). The
rainfall events during May through September divided by the total number of events suggest a fraction
of 0.26 (i.e., 11/42). This also indicates that that the October-April period is the when approximately
74% of the storms that produce greater than 0.1 inches of precipitation occur in the area.
However, keep in mind that loads shown reflect how loads are used and represent a “daily annual
average for the period”. For example, the data show that the maximum precipitation rates for the May-
September period tend to be higher compared to the October-April period (i.e., 1.6 and 1.1 inches,
respectively). Also, on any day the actual rate tends to be 0.5 inches higher, and therefore the runoff
during the May-September period can exceed the average.
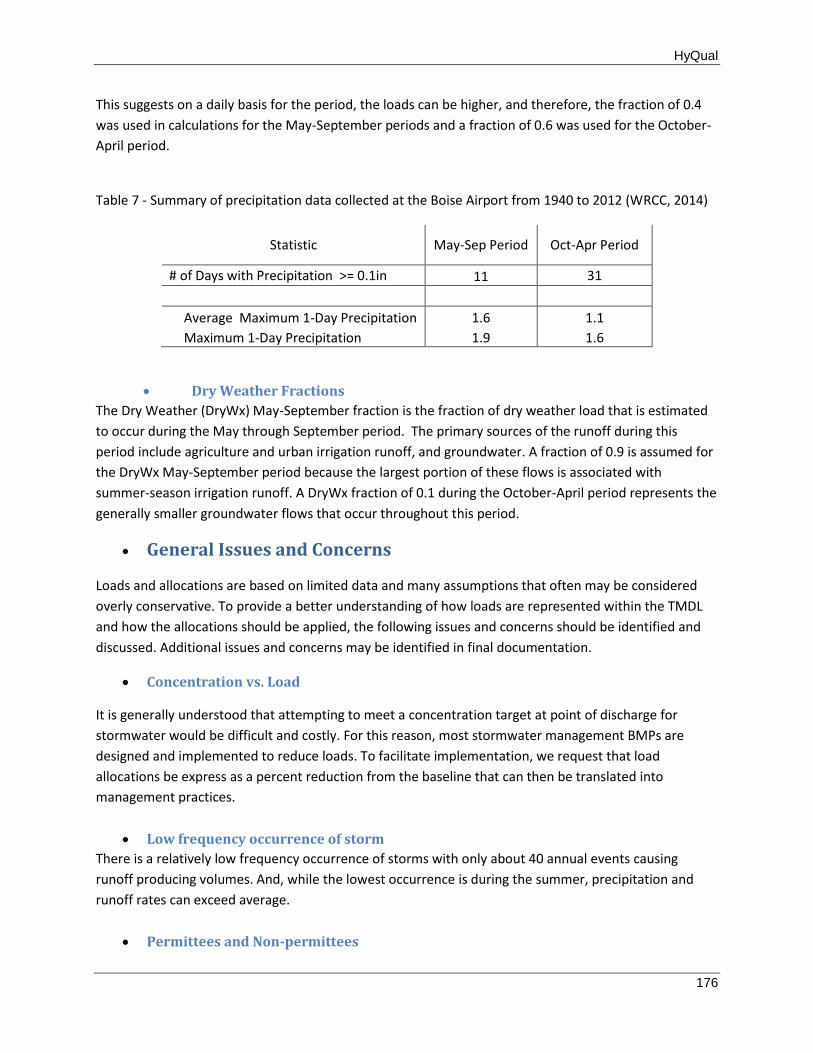
HyQual
176
This suggests on a daily basis for the period, the loads can be higher, and therefore, the fraction of 0.4
was used in calculations for the May-September periods and a fraction of 0.6 was used for the October-
April period.
Table 7 - Summary of precipitation data collected at the Boise Airport from 1940 to 2012 (WRCC, 2014)
Statistic May-Sep Period Oct-Apr Period
# of Days with Precipitation >= 0.1in 11 31
Average Maximum 1-Day Precipitation 1.6 1.1
Maximum 1-Day Precipitation 1.9 1.6
Dry Weather Fractions
The Dry Weather (DryWx) May-September fraction is the fraction of dry weather load that is estimated
to occur during the May through September period. The primary sources of the runoff during this
period include agriculture and urban irrigation runoff, and groundwater. A fraction of 0.9 is assumed for
the DryWx May-September period because the largest portion of these flows is associated with
summer-season irrigation runoff. A DryWx fraction of 0.1 during the October-April period represents the
generally smaller groundwater flows that occur throughout this period.
General Issues and Concerns
Loads and allocations are based on limited data and many assumptions that often may be considered
overly conservative. To provide a better understanding of how loads are represented within the TMDL
and how the allocations should be applied, the following issues and concerns should be identified and
discussed. Additional issues and concerns may be identified in final documentation.
Concentration vs. Load
It is generally understood that attempting to meet a concentration target at point of discharge for
stormwater would be difficult and costly. For this reason, most stormwater management BMPs are
designed and implemented to reduce loads. To facilitate implementation, we request that load
allocations be express as a percent reduction from the baseline that can then be translated into
management practices.
Low frequency occurrence of storm
There is a relatively low frequency occurrence of storms with only about 40 annual events causing
runoff producing volumes. And, while the lowest occurrence is during the summer, precipitation and
runoff rates can exceed average.
Permittees and Non-permittees
HyQual
177
Non-permittees in regulated areas (e.g. Meridian, Eagle, unincorporated urbanized Ada County, e.g,
Southwest Boise) and unregulated areas need to be included and listed in the TMDL. These jurisdictions
have regulatory authority over private and municipal properties that are potential sources of
stormwater/dry weather runoff.
Ag/Over-irrigation/Groundwater
Agricultural runoff, over-irrigation runoff, irrigation water, and groundwater discharges can mix with
stormwater discharges. These discharges are authorized if they are “uncontaminated” and/or they do
not cause, or have the reasonable potential to cause or contribute to, an excursion above the Idaho
water quality standards. This needs to be identified and addressed within the TMDL.
MS4 Allocations
Total phosphorus concentration and some flow data are available for the individual MS4s that could be
included in the LBR TMDL. This would allow for more localized baseline estimates and possibly specific
WLAs for each MS4. If this approach is used, then percent reductions may need to be adjusted such that
the resulting allocations are equal.
References
Internet links to data stormwater data include:
http://www.achdidaho.org/Departments/TechServices/Drainage.aspx
http://city.cityofcaldwell.com/StormWater
http://www.cityofnampa.us/stormwater/
http://canyonhd4.org/stormwater.php
http://www.nampahighway1.com/Stormwater.php
U.S. Census Bureau, 2010. https://www.census.gov/cgi-bin/geo/shapefiles2010/main
Ada County Assessor’s Office, 2014. 7/9/14 data update sent to ACHD server via FTP data transfer.
Canyon County Assessor’s Office, 2014. 5/28/14 data update sent to ACHD server via FTP data transfer.
WWRC. Western Regional Climate Center. http://www.wrcc.dri.edu/
http://www.wrcc.dri.edu/cgi-bin/cliMAIN.pl?id1022
DEQ, 2008. Lower Boise River Implementation Plan
DEQ, 2010. Lake Lowell TMDL
Appendices
Appendix A – Stormwater Areas
HyQual
178
Appendix B – Wet Weather Data and Analyses
Appendix C – Dry Weather Data and Analyses
Appendix D – Wet Weather May -Sep Fraction
Appendix E – Previous TMDL Dry Weather Loads
Appendices
For
Lower Boise River
Stormwater Phosphorus Loads and Example Allocations
November 20, 2014
Contents
Appendix A – Permitted and Non-Permitted Stormwater Management Areas ................................... 179
Permitted (Regulated) Stormwater .................................................................................................. 183
Non-Permitted (Unregulated) Stormwater ...................................................................................... 183
Appendix B - Wet Weather TP Loads .................................................................................................... 184
Previous TMDL Stormwater Baseline TP Loads ................................................................................ 184
Current Wet Weather Loads ............................................................................................................. 185
Appendix C - Dry Weather Loads Discharged from MS4s ..................................................................... 199
Permitted Dry Weather Flows .......................................................................................................... 200
ACHD Phase II Data ........................................................................................................................... 202
Caldwell Data .................................................................................................................................... 204
Appendix D – Wet Weather May -Sep Fraction ......................................... Error! Bookmark not defined.
Appendix E – Previous TMDL Dry Weather Loads ................................................................................ 205
HyQual
179
Appendix A – Permitted and Non-Permitted Stormwater Management
Areas
Stormwater in the selected areas within Lower Boise River watershed is regulated under either a Phase I
or a Phase II NPDES Permit issued by EPA. In the lower Boise River (LBR) TP TMDL, the permitted (i.e.,
regulated) stormwater entities are considered point sources and will be assigned “wasteload
allocations”. Additionally, “load allocations” should be assigned to the non-point source (un-regulated)
urban stormwater entities and areas.
Stormwater management areas for LBR TP TMDL area have been updated based on 2010 census (US
Census Bureau) and current GIS mapping information. Figures 1a and 1b are maps based on available
GIS information for Ada and Canyon County. These show the 2010 urbanized areas and city boundaries
(i.e., incorporated areas). Cities included in urbanized areas include Boise, Meridian, Eagle, Caldwell,
Nampa, and Middleton. Within the urbanized areas are also areas that are unincorporated – urbanized
unincorporated Ada County, and urbanized unincorporated Canyon County. Additionally, there are
areas in each county that are incorporated, but not included in the permitted urbanized areas. These
areas included the Ada County cities of Kuna and Star, and small Canyon County cities of Greenleaf,
Notus, Parma, and Wilder.
The Table A includes a breakdown of permitted and non-permitted areas based on:
City limits data from 7/29/14 (Ada County Assessor) and 5/28/14 (Canyon County Assessor);
Urbanized Area based on 2010 Census;
Area data from NPDES Permit Factsheets (2000 Census);
The basis for area calculations and areas for individual permittees or jurisdictions are discussed in the
text that follows.
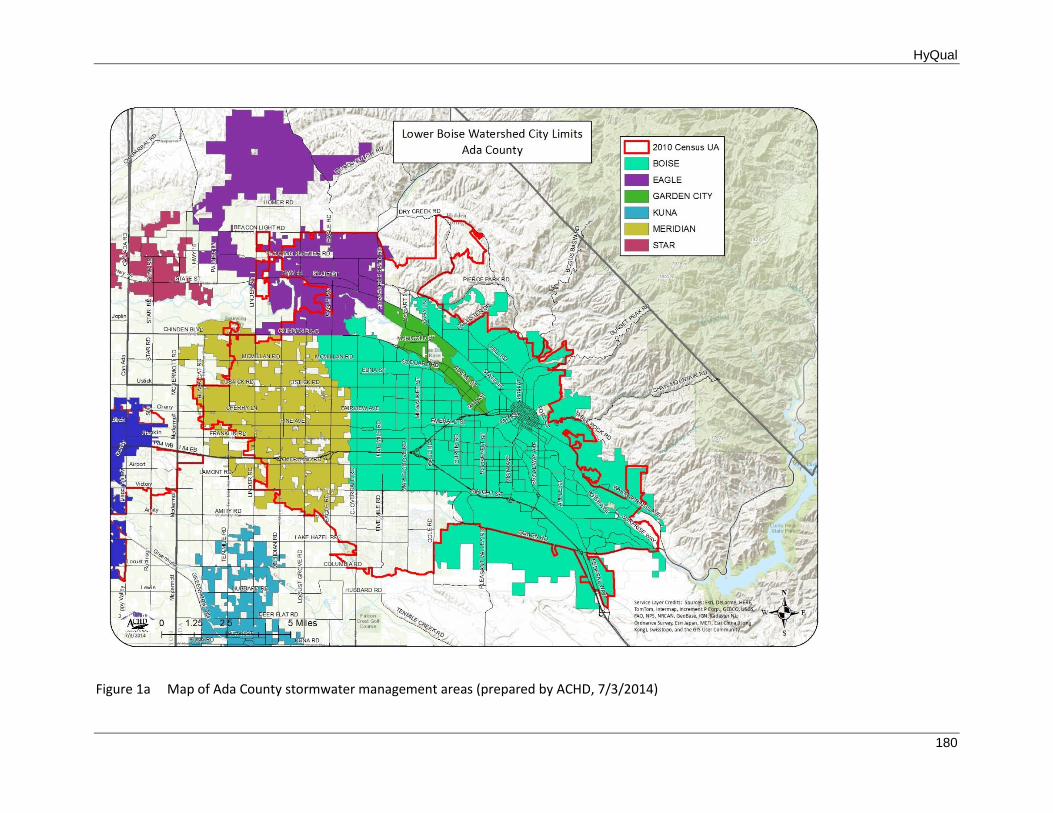
HyQual
180
Figure 1a Map of Ada County stormwater management areas (prepared by ACHD, 7/3/2014)
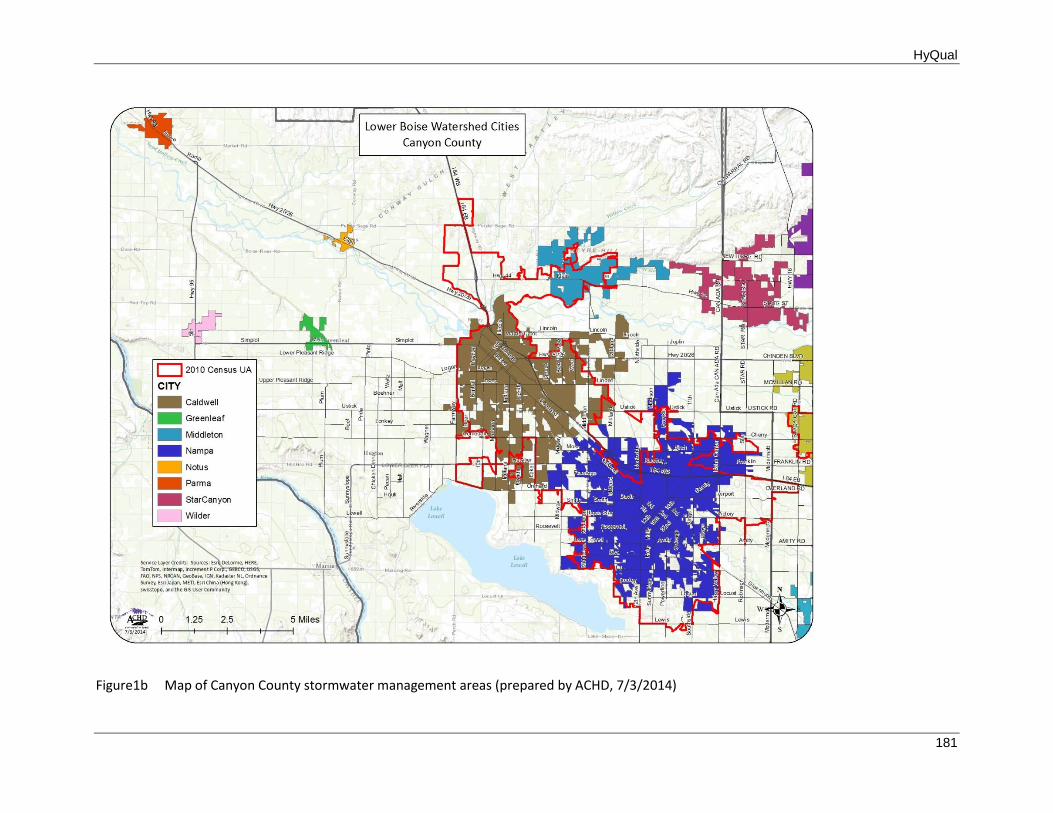
HyQual
181
Figure1b Map of Canyon County stormwater management areas (prepared by ACHD, 7/3/2014)
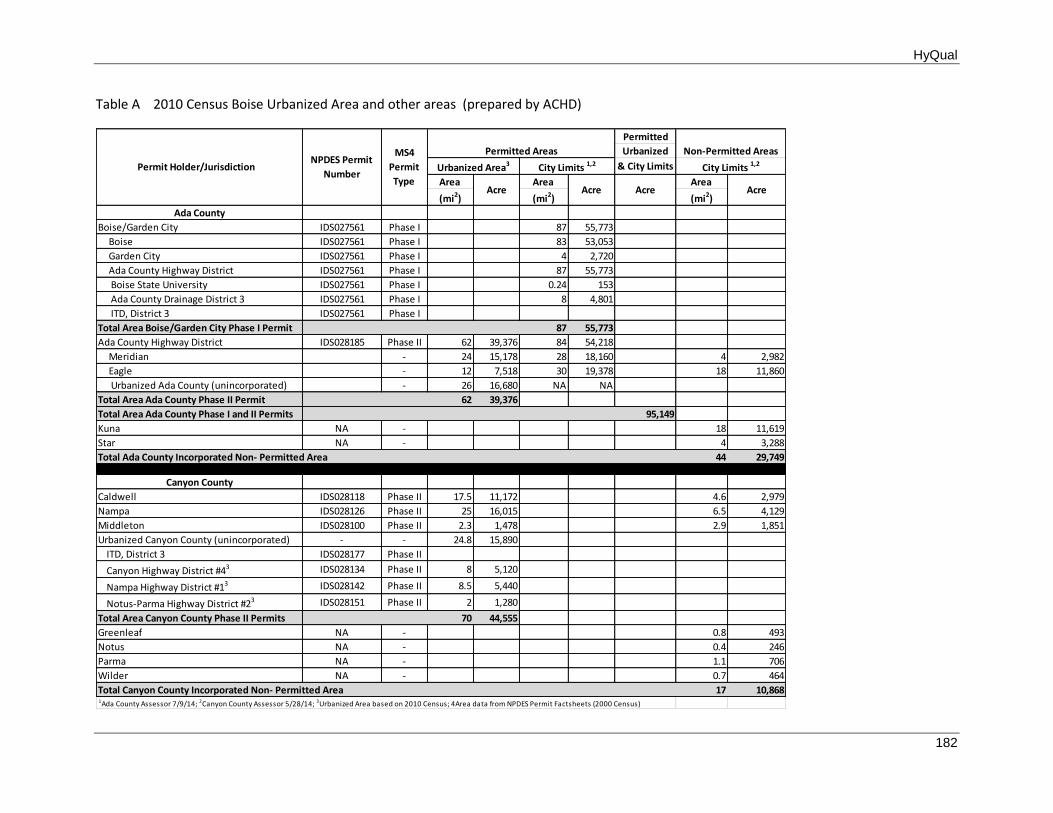
HyQual
182
Table A 2010 Census Boise Urbanized Area and other areas (prepared by ACHD)
Permitted
Urbanized
& City Limits
Area Area Area
(mi2) (mi2) (mi2)
Ada County
Boise/Garden City IDS027561 Phase I 87 55,773
Boise IDS027561 Phase I 83 53,053
Garden City IDS027561 Phase I 4 2,720
Ada County Highway District IDS027561 Phase I 87 55,773
Boise State University IDS027561 Phase I 0.24 153
Ada County Drainage District 3 IDS027561 Phase I 8 4,801
ITD, District 3 IDS027561 Phase I
Total Area Boise/Garden City Phase I Permit 87 55,773
Ada County Highway District IDS028185 Phase II 62 39,376 84 54,218
Meridian - 24 15,178 28 18,160 4 2,982
Eagle - 12 7,518 30 19,378 18 11,860
Urbanized Ada County (unincorporated) - 26 16,680 NA NA
Total Area Ada County Phase II Permit 62 39,376
Total Area Ada County Phase I and II Permits 95,149
Kuna NA - 18 11,619
Star NA - 4 3,288
44 29,749
Canyon County
Caldwell IDS028118 Phase II 17.5 11,172 4.6 2,979
Nampa IDS028126 Phase II 25 16,015 6.5 4,129
Middleton IDS028100 Phase II 2.3 1,478 2.9 1,851
Urbanized Canyon County (unincorporated) - - 24.8 15,890
ITD, District 3 IDS028177 Phase II
Canyon Highway District #43 IDS028134 Phase II 8 5,120
Nampa Highway District #13 IDS028142 Phase II 8.5 5,440
Notus-Parma Highway District #23 IDS028151 Phase II 2 1,280
Total Area Canyon County Phase II Permits 70 44,555
Greenleaf NA - 0.8 493
Notus NA - 0.4 246
Parma NA - 1.1 706
Wilder NA - 0.7 464
17 10,868 1Ada County Assessor 7/9/14; 2Canyon County Assessor 5/28/14; 3Urbanized Area based on 2010 Census; 4Area data from NPDES Permit Factsheets (2000 Census)
MS4
Permit
Type
Permitted Areas Non-Permitted Areas
Acre
City Limits 1,2
Acre
Total Canyon County Incorporated Non- Permitted Area
Total Ada County Incorporated Non- Permitted Area
Urbanized Area3 City Limits 1,2
Acre Acre
Permit Holder/Jurisdiction NPDES Permit
Number
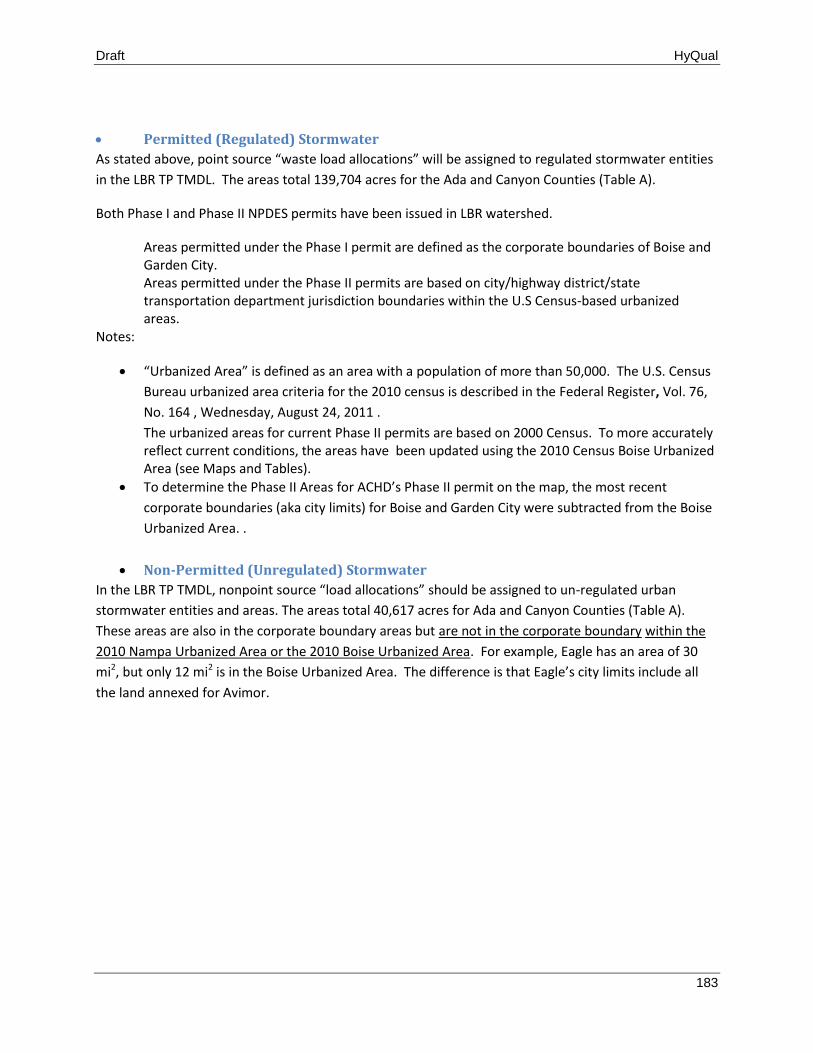
Draft HyQual
183
Permitted (Regulated) Stormwater
As stated above, point source “waste load allocations” will be assigned to regulated stormwater entities
in the LBR TP TMDL. The areas total 139,704 acres for the Ada and Canyon Counties (Table A).
Both Phase I and Phase II NPDES permits have been issued in LBR watershed.
Areas permitted under the Phase I permit are defined as the corporate boundaries of Boise and Garden City. Areas permitted under the Phase II permits are based on city/highway district/state transportation department jurisdiction boundaries within the U.S Census-based urbanized areas.
Notes:
“Urbanized Area” is defined as an area with a population of more than 50,000. The U.S. Census
Bureau urbanized area criteria for the 2010 census is described in the Federal Register, Vol. 76,
No. 164 , Wednesday, August 24, 2011 .
The urbanized areas for current Phase II permits are based on 2000 Census. To more accurately reflect current conditions, the areas have been updated using the 2010 Census Boise Urbanized Area (see Maps and Tables).
To determine the Phase II Areas for ACHD’s Phase II permit on the map, the most recent
corporate boundaries (aka city limits) for Boise and Garden City were subtracted from the Boise
Urbanized Area. .
Non-Permitted (Unregulated) Stormwater
In the LBR TP TMDL, nonpoint source “load allocations” should be assigned to un-regulated urban
stormwater entities and areas. The areas total 40,617 acres for Ada and Canyon Counties (Table A).
These areas are also in the corporate boundary areas but are not in the corporate boundary within the
2010 Nampa Urbanized Area or the 2010 Boise Urbanized Area. For example, Eagle has an area of 30
mi2, but only 12 mi2 is in the Boise Urbanized Area. The difference is that Eagle’s city limits include all
the land annexed for Avimor.
Draft HyQual
184
Appendix B - Wet Weather TP Loads
Previous TMDL Stormwater Baseline TP Loads
Critical period (May through September) loads in previous TMDL (Lake Lowell) and Implementation Plan
for Lower Boise River were as follows:
wet weather TP load is 0.15 g/ac/day.
dry weather TP load is 0.37g/ac/day.
total TP load of 0.52 g/ac/day.
The previous wet weather TP loads were based on a more limited data set collected in Ada County by
ACHD.
Based on:
ACHD data collected from 3 locations – Americana, Lucky, and Walnut
Runoff volume was estimated as a percent of annual runoff (i.e., C-Factor)
The load estimated also included the Walnut site….Walnut was excluded from average the
current average because:
it has extensive treatment ponds that disconnect most of the wet weather flow;
it has continuous dry weather (and groundwater?) flow occurring during much of the year;
dry weather flow is from the Boise Canal that conveys low phosphorus (0.03 mg/L)
discharged from Lucky Peak
Draft HyQual
185
Current Wet Weather Loads
Data from ACHD, Nampa and Caldwell were reviewed, compiled, and analyzed to assess variability in
wet weather loads throughout the valley. The tables that follow show the average total phosphorus
(TP) runoff loads for each sampling location calculated using similar assumptions:
ACHD and Nampa runoff volumes are based on measured runoff; Caldwell runoff
volume is based on measured precipitation and C-Factor
Day (or 24-hr) loads (g/ac/d) are event loads assuming the load is produced over a 24-hr
period
Average annual loads (g/ac/d) are calculated using Average Annual load and assuming
40 events per year; these are similar to baseline loads calculated for previous TMDLs as
previously discussed.
Data from ACHD, Nampa and Caldwell are provided in this Appendix (B) and Appendix C and include
precipitation, runoff, reported concentrations. Load analyses for each location and event are calculated,
and can include the “Event Load” (lb/ac/ev), which is the average load produced during the measured
precipitation period.
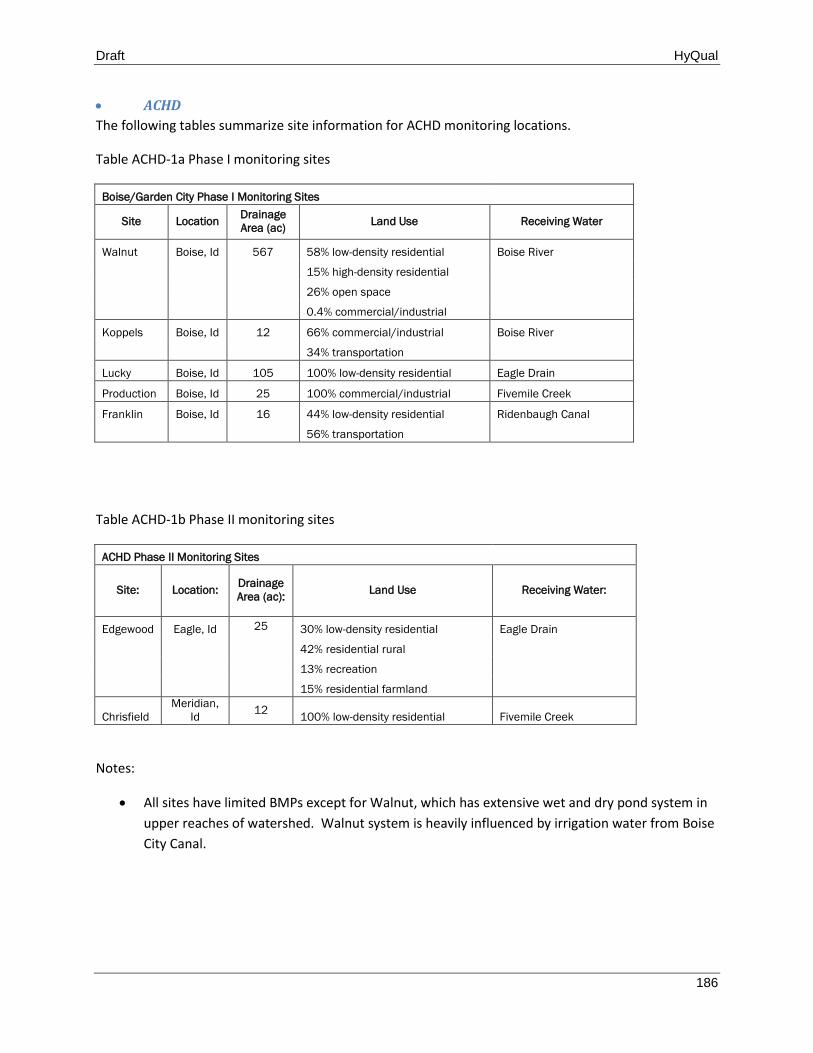
Draft HyQual
186
ACHD
The following tables summarize site information for ACHD monitoring locations.
Table ACHD-1a Phase I monitoring sites
Boise/Garden City Phase I Monitoring Sites
Site Location Drainage
Area (ac) Land Use Receiving Water
Walnut Boise, Id 567 58% low-density residential Boise River
15% high-density residential
26% open space
0.4% commercial/industrial
Koppels Boise, Id 12 66% commercial/industrial Boise River
34% transportation
Lucky Boise, Id 105 100% low-density residential Eagle Drain
Production Boise, Id 25 100% commercial/industrial Fivemile Creek
Franklin Boise, Id 16 44% low-density residential Ridenbaugh Canal
56% transportation
Table ACHD-1b Phase II monitoring sites
ACHD Phase II Monitoring Sites
Site: Location: Drainage
Area (ac): Land Use Receiving Water:
Edgewood Eagle, Id 25 30% low-density residential Eagle Drain
42% residential rural
13% recreation
15% residential farmland
Chrisfield
Meridian,
Id 12
100% low-density residential Fivemile Creek
Notes:
All sites have limited BMPs except for Walnut, which has extensive wet and dry pond system in
upper reaches of watershed. Walnut system is heavily influenced by irrigation water from Boise
City Canal.
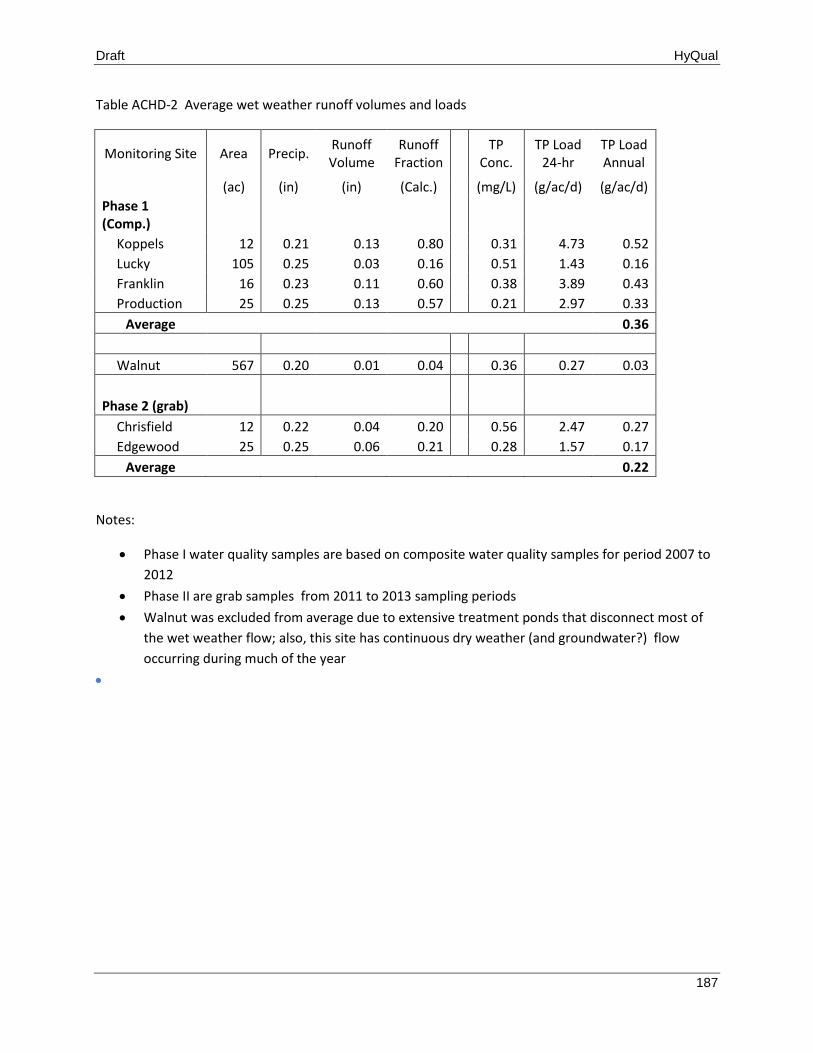
Draft HyQual
187
Table ACHD-2 Average wet weather runoff volumes and loads
Monitoring Site Area Precip. Runoff Volume
Runoff Fraction
TP
Conc. TP Load
24-hr TP Load Annual
(ac) (in) (in) (Calc.)
(mg/L) (g/ac/d) (g/ac/d)
Phase 1 (Comp.)
Koppels 12 0.21 0.13 0.80
0.31 4.73 0.52
Lucky 105 0.25 0.03 0.16
0.51 1.43 0.16
Franklin 16 0.23 0.11 0.60
0.38 3.89 0.43
Production 25 0.25 0.13 0.57
0.21 2.97 0.33
Average 0.36
Walnut 567 0.20 0.01 0.04 0.36 0.27 0.03
Phase 2 (grab)
Chrisfield 12 0.22 0.04 0.20 0.56 2.47 0.27
Edgewood 25 0.25 0.06 0.21 0.28 1.57 0.17
Average 0.22
Notes:
Phase I water quality samples are based on composite water quality samples for period 2007 to
2012
Phase II are grab samples from 2011 to 2013 sampling periods
Walnut was excluded from average due to extensive treatment ponds that disconnect most of
the wet weather flow; also, this site has continuous dry weather (and groundwater?) flow
occurring during much of the year
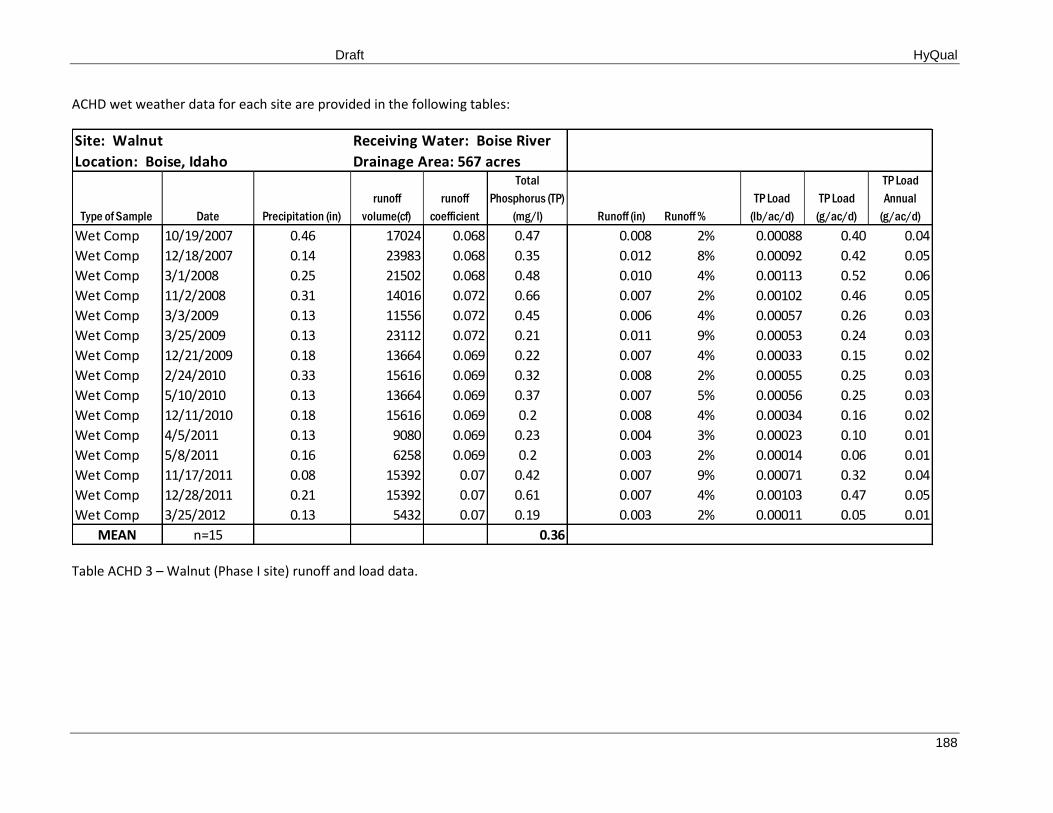
Draft HyQual
188
ACHD wet weather data for each site are provided in the following tables:
Table ACHD 3 – Walnut (Phase I site) runoff and load data.
Site: Walnut Receiving Water: Boise River
Location: Boise, Idaho Drainage Area: 567 acres
Type of Sample Date Precipitation (in)
runoff
volume(cf)
runoff
coefficient
Total
Phosphorus (TP)
(mg/l) Runoff (in) Runoff %
TP Load
(lb/ac/d)
TP Load
(g/ac/d)
TP Load
Annual
(g/ac/d)
Wet Comp 10/19/2007 0.46 17024 0.068 0.47 0.008 2% 0.00088 0.40 0.04
Wet Comp 12/18/2007 0.14 23983 0.068 0.35 0.012 8% 0.00092 0.42 0.05
Wet Comp 3/1/2008 0.25 21502 0.068 0.48 0.010 4% 0.00113 0.52 0.06
Wet Comp 11/2/2008 0.31 14016 0.072 0.66 0.007 2% 0.00102 0.46 0.05
Wet Comp 3/3/2009 0.13 11556 0.072 0.45 0.006 4% 0.00057 0.26 0.03
Wet Comp 3/25/2009 0.13 23112 0.072 0.21 0.011 9% 0.00053 0.24 0.03
Wet Comp 12/21/2009 0.18 13664 0.069 0.22 0.007 4% 0.00033 0.15 0.02
Wet Comp 2/24/2010 0.33 15616 0.069 0.32 0.008 2% 0.00055 0.25 0.03
Wet Comp 5/10/2010 0.13 13664 0.069 0.37 0.007 5% 0.00056 0.25 0.03
Wet Comp 12/11/2010 0.18 15616 0.069 0.2 0.008 4% 0.00034 0.16 0.02
Wet Comp 4/5/2011 0.13 9080 0.069 0.23 0.004 3% 0.00023 0.10 0.01
Wet Comp 5/8/2011 0.16 6258 0.069 0.2 0.003 2% 0.00014 0.06 0.01
Wet Comp 11/17/2011 0.08 15392 0.07 0.42 0.007 9% 0.00071 0.32 0.04
Wet Comp 12/28/2011 0.21 15392 0.07 0.61 0.007 4% 0.00103 0.47 0.05
Wet Comp 3/25/2012 0.13 5432 0.07 0.19 0.003 2% 0.00011 0.05 0.01
MEAN n=15 0.36
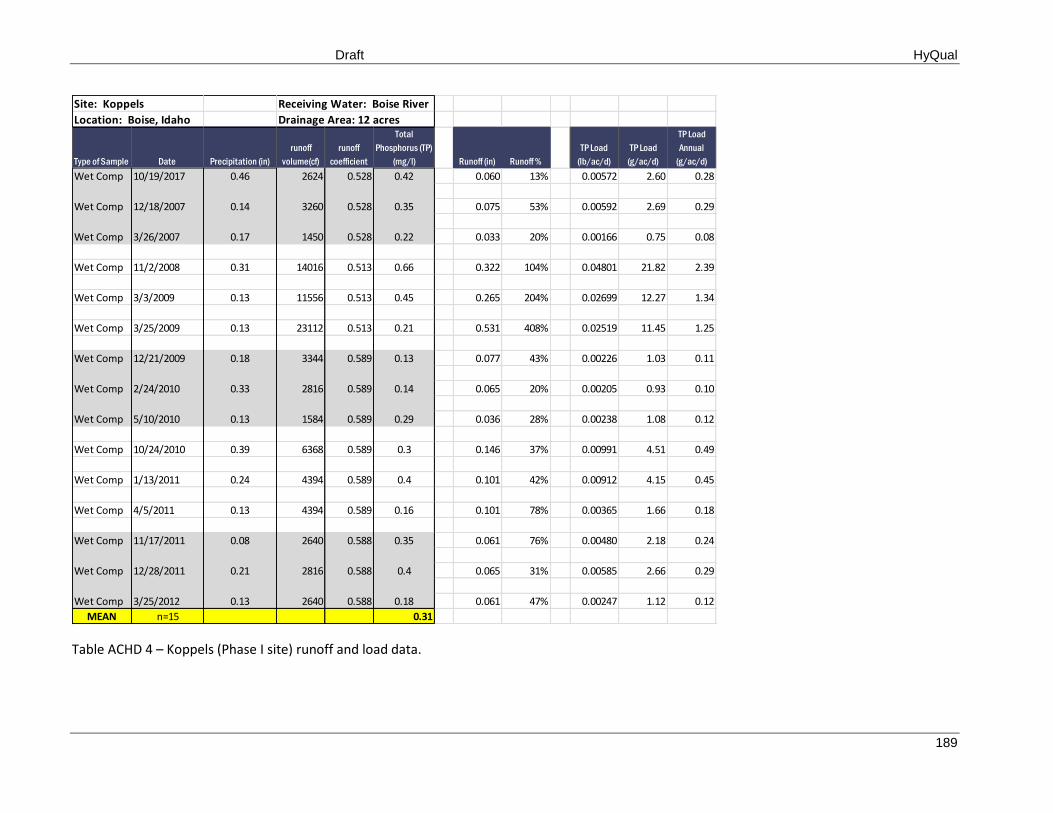
Draft HyQual
189
Table ACHD 4 – Koppels (Phase I site) runoff and load data.
Site: Koppels Receiving Water: Boise River
Location: Boise, Idaho Drainage Area: 12 acres
Type of Sample Date Precipitation (in)
runoff
volume(cf)
runoff
coefficient
Total
Phosphorus (TP)
(mg/l) Runoff (in) Runoff %
TP Load
(lb/ac/d)
TP Load
(g/ac/d)
TP Load
Annual
(g/ac/d)
Wet Comp 10/19/2017 0.46 2624 0.528 0.42 0.060 13% 0.00572 2.60 0.28
Wet Comp 12/18/2007 0.14 3260 0.528 0.35 0.075 53% 0.00592 2.69 0.29
Wet Comp 3/26/2007 0.17 1450 0.528 0.22 0.033 20% 0.00166 0.75 0.08
Wet Comp 11/2/2008 0.31 14016 0.513 0.66 0.322 104% 0.04801 21.82 2.39
Wet Comp 3/3/2009 0.13 11556 0.513 0.45 0.265 204% 0.02699 12.27 1.34
Wet Comp 3/25/2009 0.13 23112 0.513 0.21 0.531 408% 0.02519 11.45 1.25
Wet Comp 12/21/2009 0.18 3344 0.589 0.13 0.077 43% 0.00226 1.03 0.11
Wet Comp 2/24/2010 0.33 2816 0.589 0.14 0.065 20% 0.00205 0.93 0.10
Wet Comp 5/10/2010 0.13 1584 0.589 0.29 0.036 28% 0.00238 1.08 0.12
Wet Comp 10/24/2010 0.39 6368 0.589 0.3 0.146 37% 0.00991 4.51 0.49
Wet Comp 1/13/2011 0.24 4394 0.589 0.4 0.101 42% 0.00912 4.15 0.45
Wet Comp 4/5/2011 0.13 4394 0.589 0.16 0.101 78% 0.00365 1.66 0.18
Wet Comp 11/17/2011 0.08 2640 0.588 0.35 0.061 76% 0.00480 2.18 0.24
Wet Comp 12/28/2011 0.21 2816 0.588 0.4 0.065 31% 0.00585 2.66 0.29
Wet Comp 3/25/2012 0.13 2640 0.588 0.18 0.061 47% 0.00247 1.12 0.12
MEAN n=15 0.31
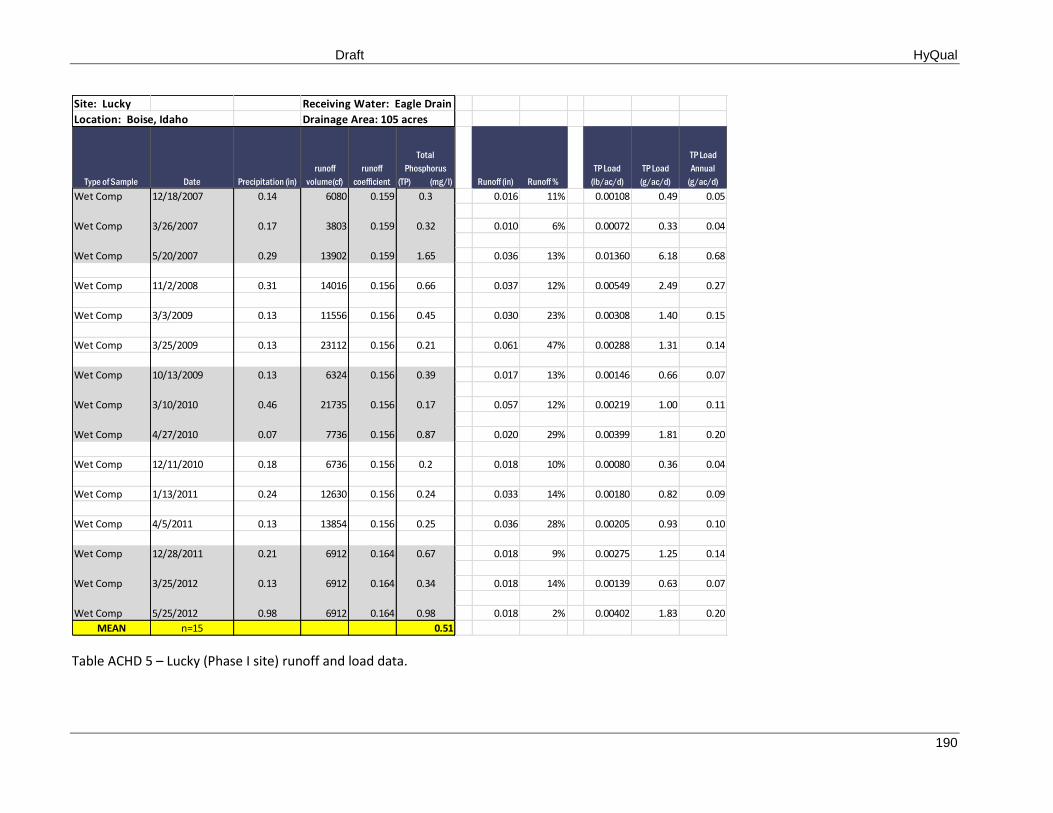
Draft HyQual
190
Table ACHD 5 – Lucky (Phase I site) runoff and load data.
Site: Lucky Receiving Water: Eagle Drain
Location: Boise, Idaho Drainage Area: 105 acres
Type of Sample Date Precipitation (in)
runoff
volume(cf)
runoff
coefficient
Total
Phosphorus
(TP) (mg/l) Runoff (in) Runoff %
TP Load
(lb/ac/d)
TP Load
(g/ac/d)
TP Load
Annual
(g/ac/d)
Wet Comp 12/18/2007 0.14 6080 0.159 0.3 0.016 11% 0.00108 0.49 0.05
Wet Comp 3/26/2007 0.17 3803 0.159 0.32 0.010 6% 0.00072 0.33 0.04
Wet Comp 5/20/2007 0.29 13902 0.159 1.65 0.036 13% 0.01360 6.18 0.68
Wet Comp 11/2/2008 0.31 14016 0.156 0.66 0.037 12% 0.00549 2.49 0.27
Wet Comp 3/3/2009 0.13 11556 0.156 0.45 0.030 23% 0.00308 1.40 0.15
Wet Comp 3/25/2009 0.13 23112 0.156 0.21 0.061 47% 0.00288 1.31 0.14
Wet Comp 10/13/2009 0.13 6324 0.156 0.39 0.017 13% 0.00146 0.66 0.07
Wet Comp 3/10/2010 0.46 21735 0.156 0.17 0.057 12% 0.00219 1.00 0.11
Wet Comp 4/27/2010 0.07 7736 0.156 0.87 0.020 29% 0.00399 1.81 0.20
Wet Comp 12/11/2010 0.18 6736 0.156 0.2 0.018 10% 0.00080 0.36 0.04
Wet Comp 1/13/2011 0.24 12630 0.156 0.24 0.033 14% 0.00180 0.82 0.09
Wet Comp 4/5/2011 0.13 13854 0.156 0.25 0.036 28% 0.00205 0.93 0.10
Wet Comp 12/28/2011 0.21 6912 0.164 0.67 0.018 9% 0.00275 1.25 0.14
Wet Comp 3/25/2012 0.13 6912 0.164 0.34 0.018 14% 0.00139 0.63 0.07
Wet Comp 5/25/2012 0.98 6912 0.164 0.98 0.018 2% 0.00402 1.83 0.20
MEAN n=15 0.51
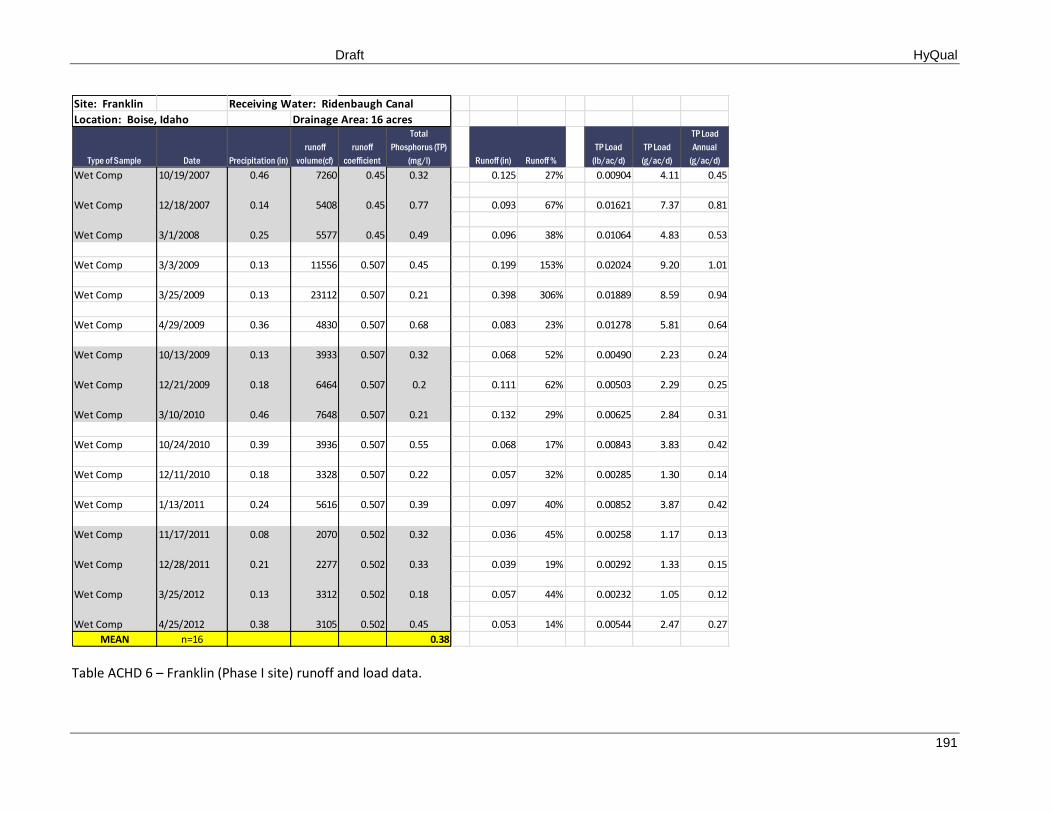
Draft HyQual
191
Table ACHD 6 – Franklin (Phase I site) runoff and load data.
Site: Franklin Receiving Water: Ridenbaugh Canal
Location: Boise, Idaho Drainage Area: 16 acres
Type of Sample Date Precipitation (in)
runoff
volume(cf)
runoff
coefficient
Total
Phosphorus (TP)
(mg/l) Runoff (in) Runoff %
TP Load
(lb/ac/d)
TP Load
(g/ac/d)
TP Load
Annual
(g/ac/d)
Wet Comp 10/19/2007 0.46 7260 0.45 0.32 0.125 27% 0.00904 4.11 0.45
Wet Comp 12/18/2007 0.14 5408 0.45 0.77 0.093 67% 0.01621 7.37 0.81
Wet Comp 3/1/2008 0.25 5577 0.45 0.49 0.096 38% 0.01064 4.83 0.53
Wet Comp 3/3/2009 0.13 11556 0.507 0.45 0.199 153% 0.02024 9.20 1.01
Wet Comp 3/25/2009 0.13 23112 0.507 0.21 0.398 306% 0.01889 8.59 0.94
Wet Comp 4/29/2009 0.36 4830 0.507 0.68 0.083 23% 0.01278 5.81 0.64
Wet Comp 10/13/2009 0.13 3933 0.507 0.32 0.068 52% 0.00490 2.23 0.24
Wet Comp 12/21/2009 0.18 6464 0.507 0.2 0.111 62% 0.00503 2.29 0.25
Wet Comp 3/10/2010 0.46 7648 0.507 0.21 0.132 29% 0.00625 2.84 0.31
Wet Comp 10/24/2010 0.39 3936 0.507 0.55 0.068 17% 0.00843 3.83 0.42
Wet Comp 12/11/2010 0.18 3328 0.507 0.22 0.057 32% 0.00285 1.30 0.14
Wet Comp 1/13/2011 0.24 5616 0.507 0.39 0.097 40% 0.00852 3.87 0.42
Wet Comp 11/17/2011 0.08 2070 0.502 0.32 0.036 45% 0.00258 1.17 0.13
Wet Comp 12/28/2011 0.21 2277 0.502 0.33 0.039 19% 0.00292 1.33 0.15
Wet Comp 3/25/2012 0.13 3312 0.502 0.18 0.057 44% 0.00232 1.05 0.12
Wet Comp 4/25/2012 0.38 3105 0.502 0.45 0.053 14% 0.00544 2.47 0.27
MEAN n=16 0.38
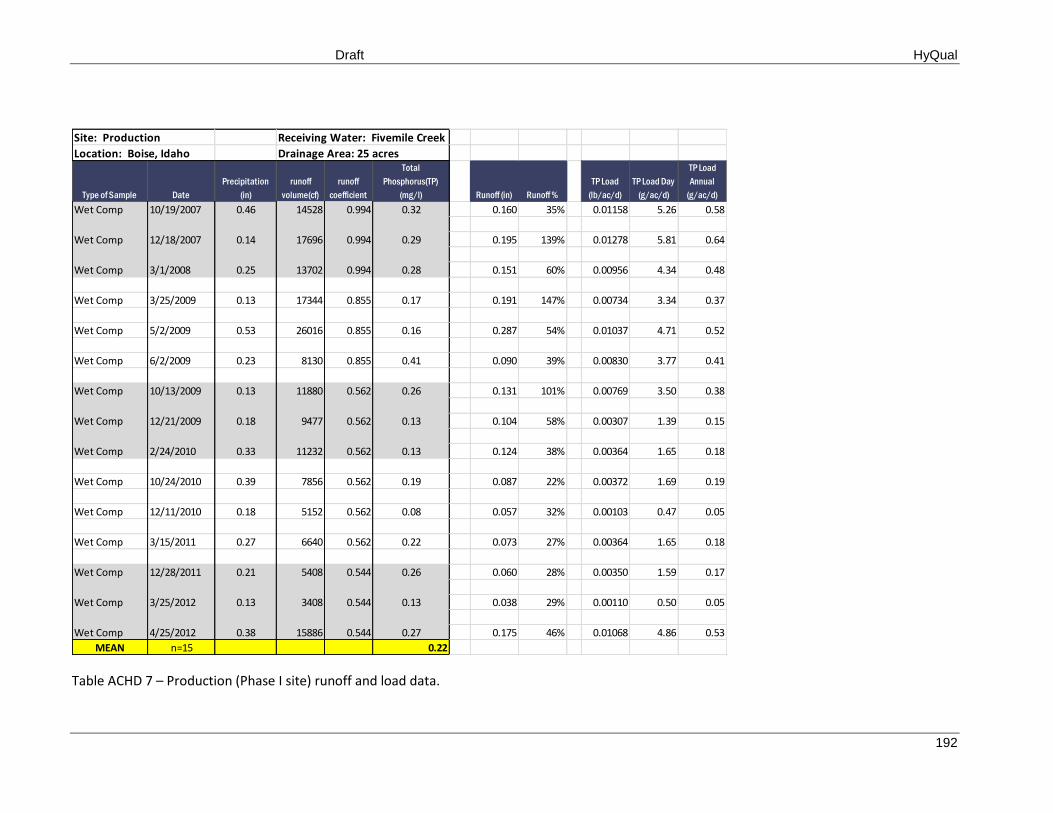
Draft HyQual
192
Table ACHD 7 – Production (Phase I site) runoff and load data.
Site: Production Receiving Water: Fivemile Creek
Location: Boise, Idaho Drainage Area: 25 acres
Type of Sample Date
Precipitation
(in)
runoff
volume(cf)
runoff
coefficient
Total
Phosphorus(TP)
(mg/l) Runoff (in) Runoff %
TP Load
(lb/ac/d)
TP Load Day
(g/ac/d)
TP Load
Annual
(g/ac/d)
Wet Comp 10/19/2007 0.46 14528 0.994 0.32 0.160 35% 0.01158 5.26 0.58
Wet Comp 12/18/2007 0.14 17696 0.994 0.29 0.195 139% 0.01278 5.81 0.64
Wet Comp 3/1/2008 0.25 13702 0.994 0.28 0.151 60% 0.00956 4.34 0.48
Wet Comp 3/25/2009 0.13 17344 0.855 0.17 0.191 147% 0.00734 3.34 0.37
Wet Comp 5/2/2009 0.53 26016 0.855 0.16 0.287 54% 0.01037 4.71 0.52
Wet Comp 6/2/2009 0.23 8130 0.855 0.41 0.090 39% 0.00830 3.77 0.41
Wet Comp 10/13/2009 0.13 11880 0.562 0.26 0.131 101% 0.00769 3.50 0.38
Wet Comp 12/21/2009 0.18 9477 0.562 0.13 0.104 58% 0.00307 1.39 0.15
Wet Comp 2/24/2010 0.33 11232 0.562 0.13 0.124 38% 0.00364 1.65 0.18
Wet Comp 10/24/2010 0.39 7856 0.562 0.19 0.087 22% 0.00372 1.69 0.19
Wet Comp 12/11/2010 0.18 5152 0.562 0.08 0.057 32% 0.00103 0.47 0.05
Wet Comp 3/15/2011 0.27 6640 0.562 0.22 0.073 27% 0.00364 1.65 0.18
Wet Comp 12/28/2011 0.21 5408 0.544 0.26 0.060 28% 0.00350 1.59 0.17
Wet Comp 3/25/2012 0.13 3408 0.544 0.13 0.038 29% 0.00110 0.50 0.05
Wet Comp 4/25/2012 0.38 15886 0.544 0.27 0.175 46% 0.01068 4.86 0.53
MEAN n=15 0.22
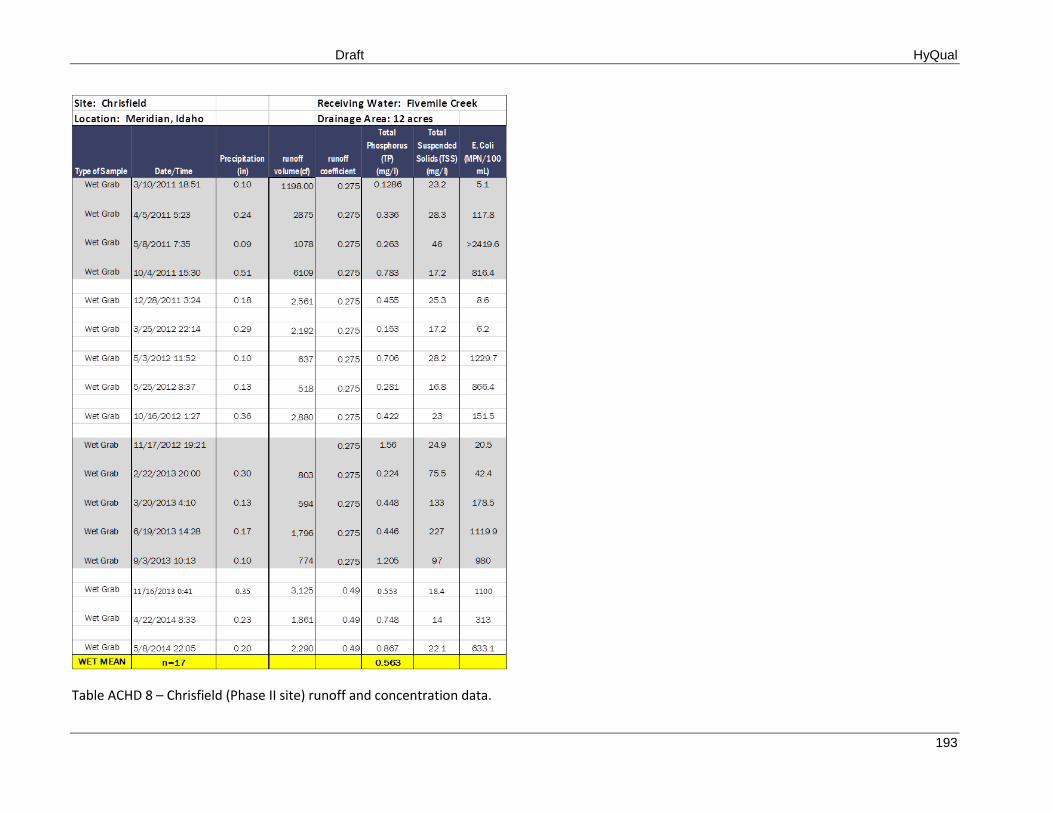
Draft HyQual
193
Table ACHD 8 – Chrisfield (Phase II site) runoff and concentration data.
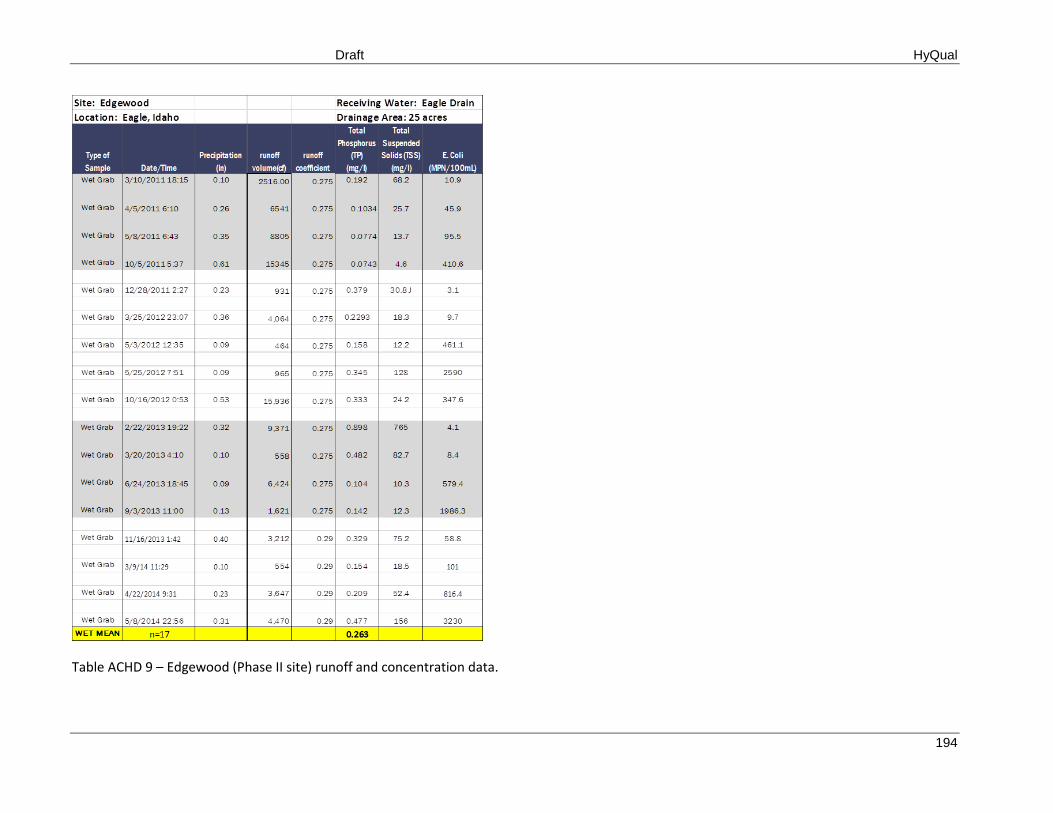
Draft HyQual
194
Table ACHD 9 – Edgewood (Phase II site) runoff and concentration data.
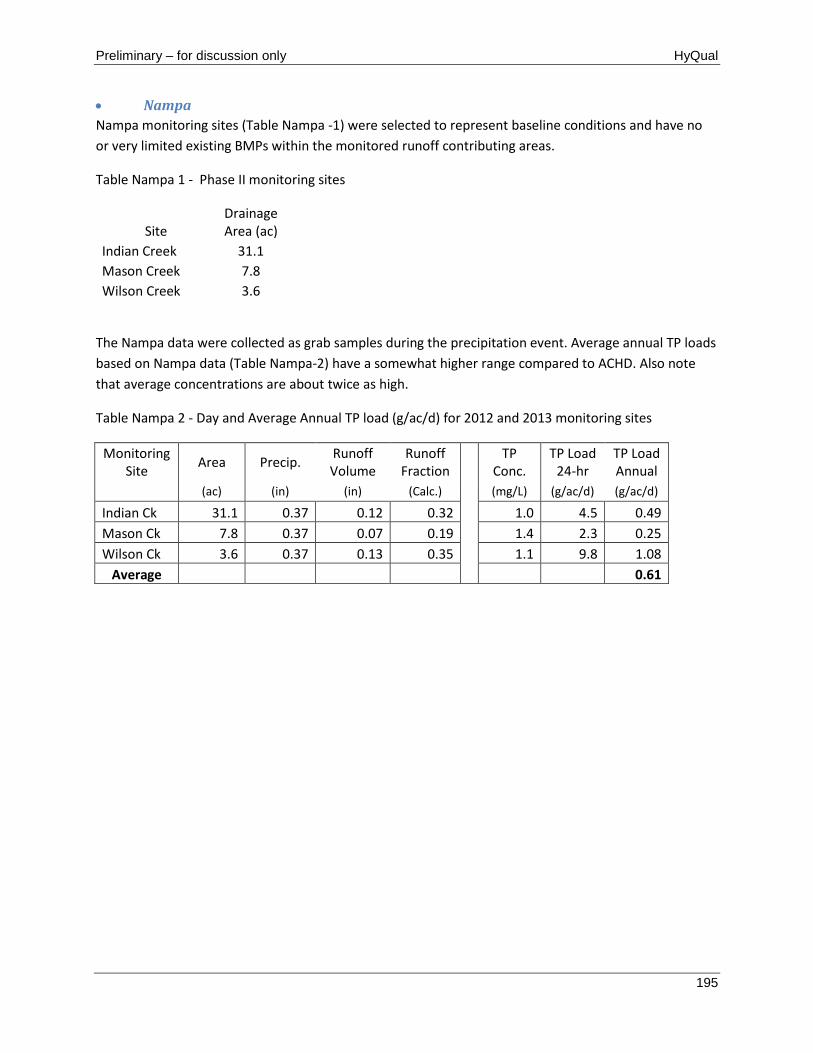
Preliminary – for discussion only HyQual
195
Nampa
Nampa monitoring sites (Table Nampa -1) were selected to represent baseline conditions and have no
or very limited existing BMPs within the monitored runoff contributing areas.
Table Nampa 1 - Phase II monitoring sites
Site Drainage Area (ac)
Indian Creek 31.1
Mason Creek 7.8
Wilson Creek 3.6
The Nampa data were collected as grab samples during the precipitation event. Average annual TP loads
based on Nampa data (Table Nampa-2) have a somewhat higher range compared to ACHD. Also note
that average concentrations are about twice as high.
Table Nampa 2 - Day and Average Annual TP load (g/ac/d) for 2012 and 2013 monitoring sites
Monitoring Site
Area Precip. Runoff Volume
Runoff Fraction
TP
Conc. TP Load
24-hr TP Load Annual
(ac) (in) (in) (Calc.)
(mg/L) (g/ac/d) (g/ac/d)
Indian Ck 31.1 0.37 0.12 0.32
1.0 4.5 0.49
Mason Ck 7.8 0.37 0.07 0.19
1.4 2.3 0.25
Wilson Ck 3.6 0.37 0.13 0.35
1.1 9.8 1.08
Average 0.61
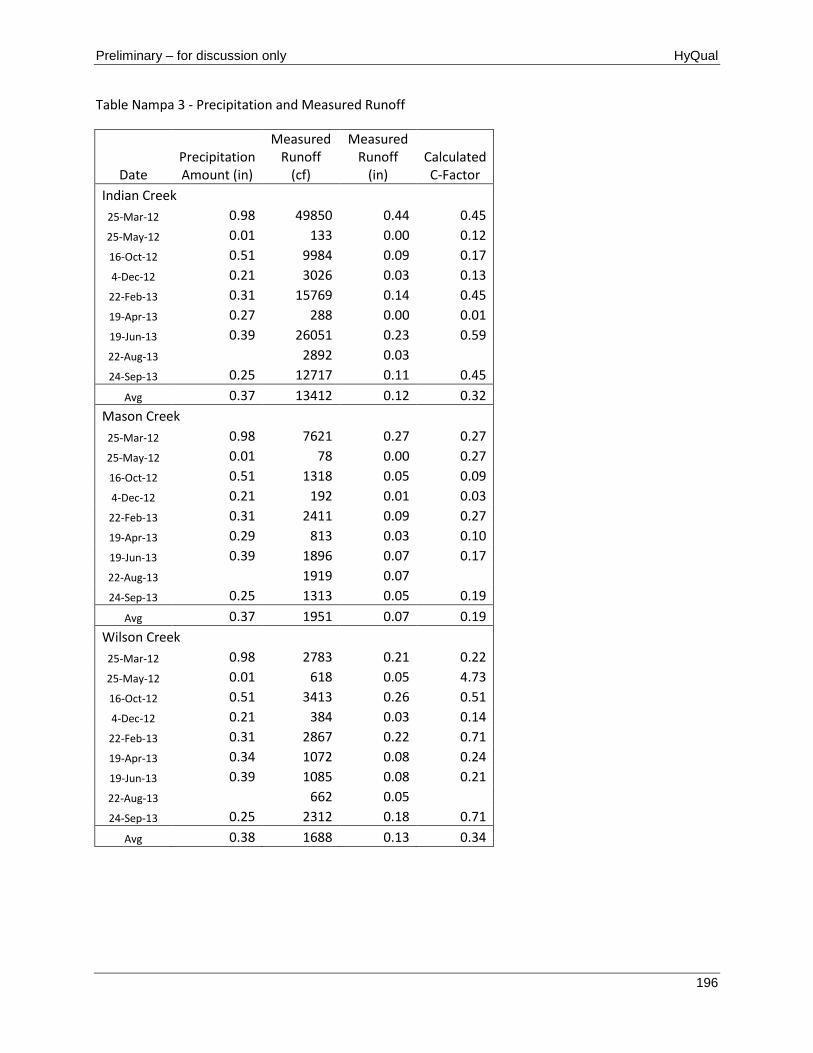
Preliminary – for discussion only HyQual
196
Table Nampa 3 - Precipitation and Measured Runoff
Date Precipitation Amount (in)
Measured Runoff
(cf)
Measured Runoff
(in) Calculated C-Factor
Indian Creek
25-Mar-12 0.98 49850 0.44 0.45
25-May-12 0.01 133 0.00 0.12
16-Oct-12 0.51 9984 0.09 0.17
4-Dec-12 0.21 3026 0.03 0.13
22-Feb-13 0.31 15769 0.14 0.45
19-Apr-13 0.27 288 0.00 0.01
19-Jun-13 0.39 26051 0.23 0.59
22-Aug-13
2892 0.03
24-Sep-13 0.25 12717 0.11 0.45
Avg 0.37 13412 0.12 0.32
Mason Creek
25-Mar-12 0.98 7621 0.27 0.27
25-May-12 0.01 78 0.00 0.27
16-Oct-12 0.51 1318 0.05 0.09
4-Dec-12 0.21 192 0.01 0.03
22-Feb-13 0.31 2411 0.09 0.27
19-Apr-13 0.29 813 0.03 0.10
19-Jun-13 0.39 1896 0.07 0.17
22-Aug-13
1919 0.07
24-Sep-13 0.25 1313 0.05 0.19
Avg 0.37 1951 0.07 0.19
Wilson Creek
25-Mar-12 0.98 2783 0.21 0.22
25-May-12 0.01 618 0.05 4.73
16-Oct-12 0.51 3413 0.26 0.51
4-Dec-12 0.21 384 0.03 0.14
22-Feb-13 0.31 2867 0.22 0.71
19-Apr-13 0.34 1072 0.08 0.24
19-Jun-13 0.39 1085 0.08 0.21
22-Aug-13
662 0.05
24-Sep-13 0.25 2312 0.18 0.71
Avg 0.38 1688 0.13 0.34
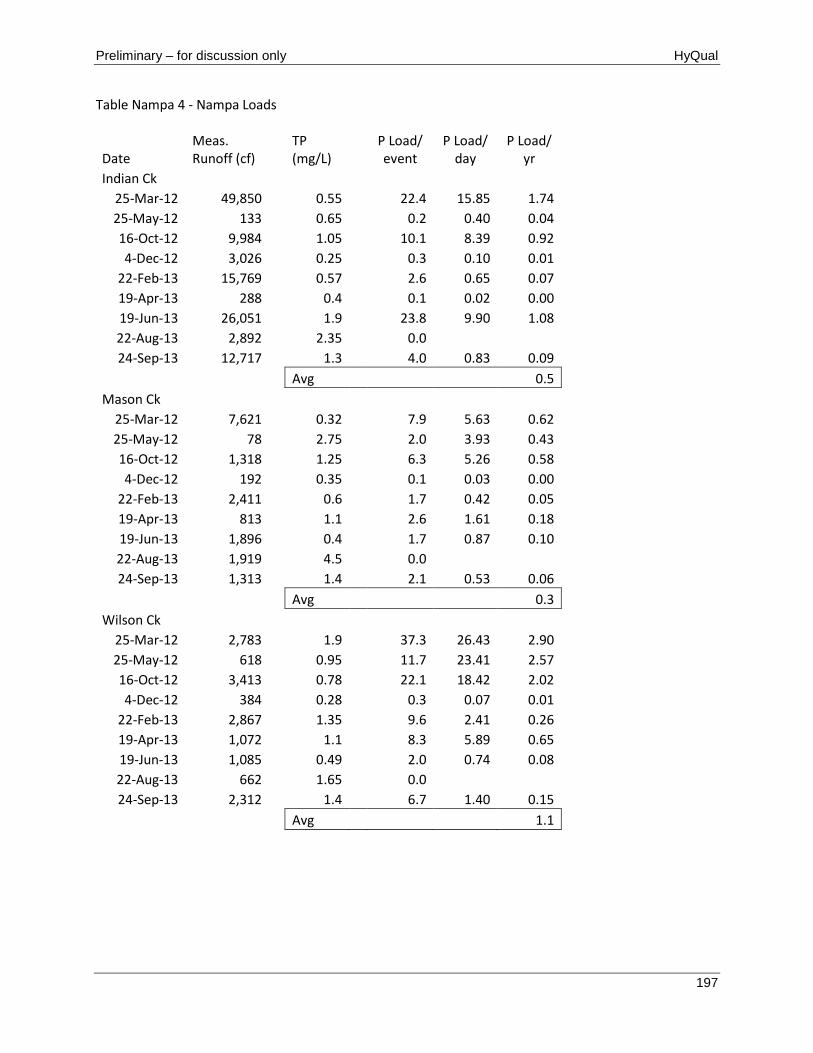
Preliminary – for discussion only HyQual
197
Table Nampa 4 - Nampa Loads
Date Meas. Runoff (cf)
TP (mg/L)
P Load/ event
P Load/ day
P Load/ yr
Indian Ck 25-Mar-12 49,850
0.55
22.4 15.85 1.74
25-May-12 133
0.65
0.2 0.40 0.04
16-Oct-12 9,984
1.05
10.1 8.39 0.92
4-Dec-12 3,026
0.25
0.3 0.10 0.01
22-Feb-13 15,769
0.57
2.6 0.65 0.07
19-Apr-13 288
0.4
0.1 0.02 0.00
19-Jun-13 26,051
1.9
23.8 9.90 1.08
22-Aug-13 2,892
2.35
0.0 24-Sep-13 12,717
1.3
4.0 0.83 0.09
Avg 0.5
Mason Ck 25-Mar-12 7,621
0.32
7.9 5.63 0.62
25-May-12 78
2.75
2.0 3.93 0.43
16-Oct-12 1,318
1.25
6.3 5.26 0.58
4-Dec-12 192
0.35
0.1 0.03 0.00
22-Feb-13 2,411
0.6
1.7 0.42 0.05
19-Apr-13 813
1.1
2.6 1.61 0.18
19-Jun-13 1,896
0.4
1.7 0.87 0.10
22-Aug-13 1,919
4.5
0.0 24-Sep-13 1,313
1.4
2.1 0.53 0.06
Avg 0.3
Wilson Ck 25-Mar-12 2,783
1.9
37.3 26.43 2.90
25-May-12 618
0.95
11.7 23.41 2.57
16-Oct-12 3,413
0.78
22.1 18.42 2.02
4-Dec-12 384
0.28
0.3 0.07 0.01
22-Feb-13 2,867
1.35
9.6 2.41 0.26
19-Apr-13 1,072
1.1
8.3 5.89 0.65
19-Jun-13 1,085
0.49
2.0 0.74 0.08
22-Aug-13 662
1.65
0.0 24-Sep-13 2,312
1.4
6.7 1.40 0.15
Avg 1.1
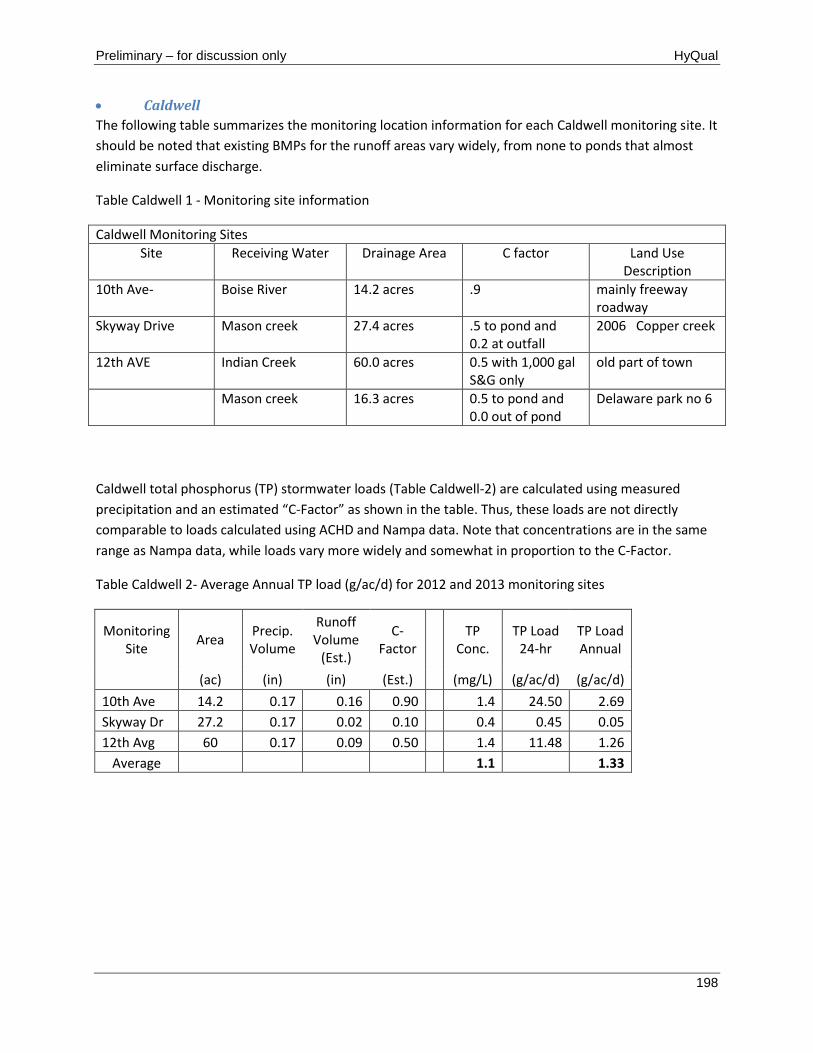
Preliminary – for discussion only HyQual
198
Caldwell
The following table summarizes the monitoring location information for each Caldwell monitoring site. It
should be noted that existing BMPs for the runoff areas vary widely, from none to ponds that almost
eliminate surface discharge.
Table Caldwell 1 - Monitoring site information
Caldwell Monitoring Sites
Site Receiving Water Drainage Area C factor Land Use Description
10th Ave- Boise River 14.2 acres .9 mainly freeway roadway
Skyway Drive Mason creek 27.4 acres .5 to pond and 0.2 at outfall
2006 Copper creek
12th AVE Indian Creek 60.0 acres 0.5 with 1,000 gal S&G only
old part of town
Mason creek 16.3 acres 0.5 to pond and 0.0 out of pond
Delaware park no 6
Caldwell total phosphorus (TP) stormwater loads (Table Caldwell-2) are calculated using measured
precipitation and an estimated “C-Factor” as shown in the table. Thus, these loads are not directly
comparable to loads calculated using ACHD and Nampa data. Note that concentrations are in the same
range as Nampa data, while loads vary more widely and somewhat in proportion to the C-Factor.
Table Caldwell 2- Average Annual TP load (g/ac/d) for 2012 and 2013 monitoring sites
Monitoring Site
Area Precip. Volume
Runoff Volume
(Est.)
C-Factor
TP
Conc. TP Load
24-hr TP Load Annual
(ac) (in) (in) (Est.)
(mg/L) (g/ac/d) (g/ac/d)
10th Ave 14.2 0.17 0.16 0.90 1.4 24.50 2.69
Skyway Dr 27.2 0.17 0.02 0.10 0.4 0.45 0.05
12th Avg 60 0.17 0.09 0.50 1.4 11.48 1.26
Average 1.1
1.33
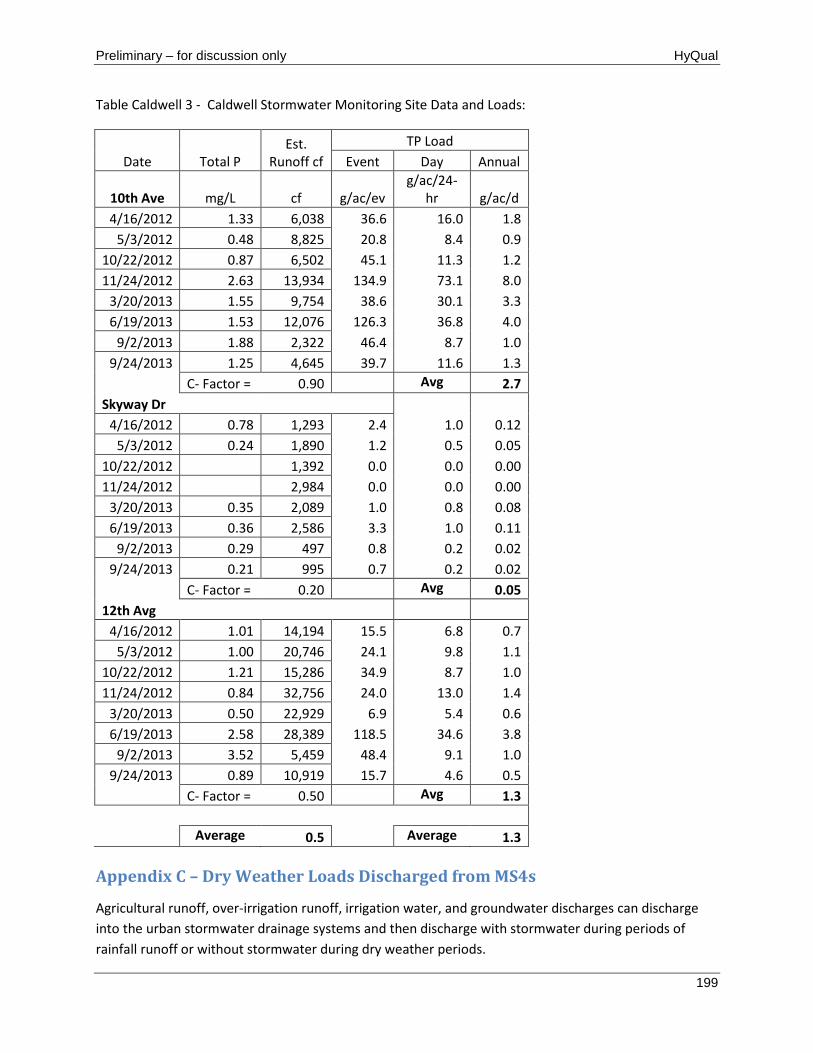
Preliminary – for discussion only HyQual
199
Table Caldwell 3 - Caldwell Stormwater Monitoring Site Data and Loads:
Date Total P Est.
Runoff cf
TP Load
Event Day Annual
10th Ave mg/L cf g/ac/ev g/ac/24-
hr g/ac/d
4/16/2012 1.33 6,038 36.6 16.0 1.8
5/3/2012 0.48 8,825 20.8 8.4 0.9
10/22/2012 0.87 6,502 45.1 11.3 1.2
11/24/2012 2.63 13,934 134.9 73.1 8.0
3/20/2013 1.55 9,754 38.6 30.1 3.3
6/19/2013 1.53 12,076 126.3 36.8 4.0
9/2/2013 1.88 2,322 46.4 8.7 1.0
9/24/2013 1.25 4,645 39.7 11.6 1.3
C- Factor = 0.90 Avg 2.7
Skyway Dr
4/16/2012 0.78 1,293 2.4 1.0 0.12
5/3/2012 0.24 1,890 1.2 0.5 0.05
10/22/2012 1,392 0.0 0.0 0.00
11/24/2012 2,984 0.0 0.0 0.00
3/20/2013 0.35 2,089 1.0 0.8 0.08
6/19/2013 0.36 2,586 3.3 1.0 0.11
9/2/2013 0.29 497 0.8 0.2 0.02
9/24/2013 0.21 995 0.7 0.2 0.02
C- Factor = 0.20 Avg 0.05
12th Avg
4/16/2012 1.01 14,194 15.5 6.8 0.7
5/3/2012 1.00 20,746 24.1 9.8 1.1
10/22/2012 1.21 15,286 34.9 8.7 1.0
11/24/2012 0.84 32,756 24.0 13.0 1.4
3/20/2013 0.50 22,929 6.9 5.4 0.6
6/19/2013 2.58 28,389 118.5 34.6 3.8
9/2/2013 3.52 5,459 48.4 9.1 1.0
9/24/2013 0.89 10,919 15.7 4.6 0.5
C- Factor = 0.50 Avg 1.3
Average 0.5 Average 1.3
Appendix C – Dry Weather Loads Discharged from MS4s
Agricultural runoff, over-irrigation runoff, irrigation water, and groundwater discharges can discharge
into the urban stormwater drainage systems and then discharge with stormwater during periods of
rainfall runoff or without stormwater during dry weather periods.
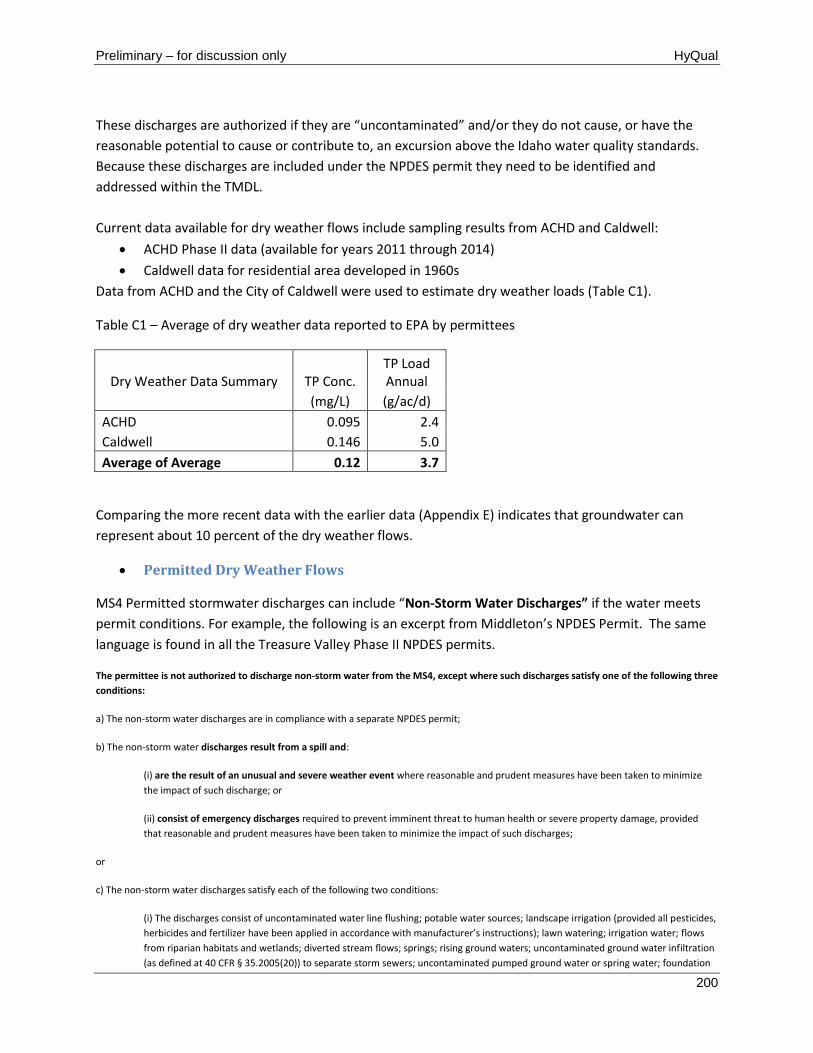
Preliminary – for discussion only HyQual
200
These discharges are authorized if they are “uncontaminated” and/or they do not cause, or have the
reasonable potential to cause or contribute to, an excursion above the Idaho water quality standards.
Because these discharges are included under the NPDES permit they need to be identified and
addressed within the TMDL.
Current data available for dry weather flows include sampling results from ACHD and Caldwell:
ACHD Phase II data (available for years 2011 through 2014)
Caldwell data for residential area developed in 1960s
Data from ACHD and the City of Caldwell were used to estimate dry weather loads (Table C1).
Table C1 – Average of dry weather data reported to EPA by permittees
Dry Weather Data Summary TP Conc. TP Load Annual
(mg/L) (g/ac/d)
ACHD 0.095 2.4
Caldwell 0.146 5.0
Average of Average 0.12 3.7
Comparing the more recent data with the earlier data (Appendix E) indicates that groundwater can
represent about 10 percent of the dry weather flows.
Permitted Dry Weather Flows
MS4 Permitted stormwater discharges can include “Non-Storm Water Discharges” if the water meets
permit conditions. For example, the following is an excerpt from Middleton’s NPDES Permit. The same
language is found in all the Treasure Valley Phase II NPDES permits.
The permittee is not authorized to discharge non-storm water from the MS4, except where such discharges satisfy one of the following three
conditions:
a) The non-storm water discharges are in compliance with a separate NPDES permit;
b) The non-storm water discharges result from a spill and:
(i) are the result of an unusual and severe weather event where reasonable and prudent measures have been taken to minimize
the impact of such discharge; or
(ii) consist of emergency discharges required to prevent imminent threat to human health or severe property damage, provided
that reasonable and prudent measures have been taken to minimize the impact of such discharges;
or
c) The non-storm water discharges satisfy each of the following two conditions:
(i) The discharges consist of uncontaminated water line flushing; potable water sources; landscape irrigation (provided all pesticides,
herbicides and fertilizer have been applied in accordance with manufacturer’s instructions); lawn watering; irrigation water; flows
from riparian habitats and wetlands; diverted stream flows; springs; rising ground waters; uncontaminated ground water infiltration
(as defined at 40 CFR § 35.2005(20)) to separate storm sewers; uncontaminated pumped ground water or spring water; foundation
Preliminary – for discussion only HyQual
201
and footing drains (where flows are not contaminated with process materials such as solvents); uncontaminated air conditioning or
compressor condensate; water from crawlspace pumps; individual residential car washing; dechlorinated swimming pool discharges;
routine external building wash down which does not use detergents; street and pavement wash waters, where no detergents are
used and no spills or leaks of toxic or hazardous materials have occurred (unless all spilled material has been removed); fire hydrant
flushing; or flows from emergency firefighting activities;
and
(ii) The discharges are not sources of pollution to waters of the United States. A discharge is considered a source of pollution to
waters of the United States for the purposes of this permit if it:
(a) Contains hazardous materials in concentrations found to be of public health significance or to impair beneficial uses in
receiving waters. (Hazardous materials are those that are harmful to humans and animals from exposure, but not
necessarily ingestion);
(b) Contains toxic substances in concentrations that impair designated beneficial uses in receiving waters. (Toxic
substances are those that can cause disease, malignancy, genetic mutation, death, or similar consequences);
(c) Contains deleterious materials in concentrations that impair designated beneficial uses in receiving waters.
(Deleterious materials are generally substances that taint edible species of fish, cause taste in drinking waters, or cause
harm to fish or other aquatic life);
(d)Contains radioactive materials or radioactivity at levels exceeding the values listed in 10 CFR Part 20 in receiving
waters;
(e) Contains floating, suspended, or submerged matter of any kind in concentrations causing nuisance or objectionable
conditions or in concentrations that may impair designated beneficial uses in receiving waters;
(f) Contains excessive nutrients that can cause visible slime growths or other nuisance aquatic growths that impair
designated beneficial uses in receiving waters;
(g) Contains oxygen-demanding materials in concentrations that would result in anaerobic water conditions in receiving
waters; or
(h) Contains sediment above quantities specified in IDAPA 58.01.02.250.02.e or in the absence of specific sediment
criteria, above quantities that impair beneficial uses in receiving waters, or
(i) Contains material in concentrations that exceed applicable natural background conditions in receiving waters (IDAPA
58.01.02.200. 09). Temperature levels may be increased above natural background conditions when allowed under IDAPA
58.01.02.401.
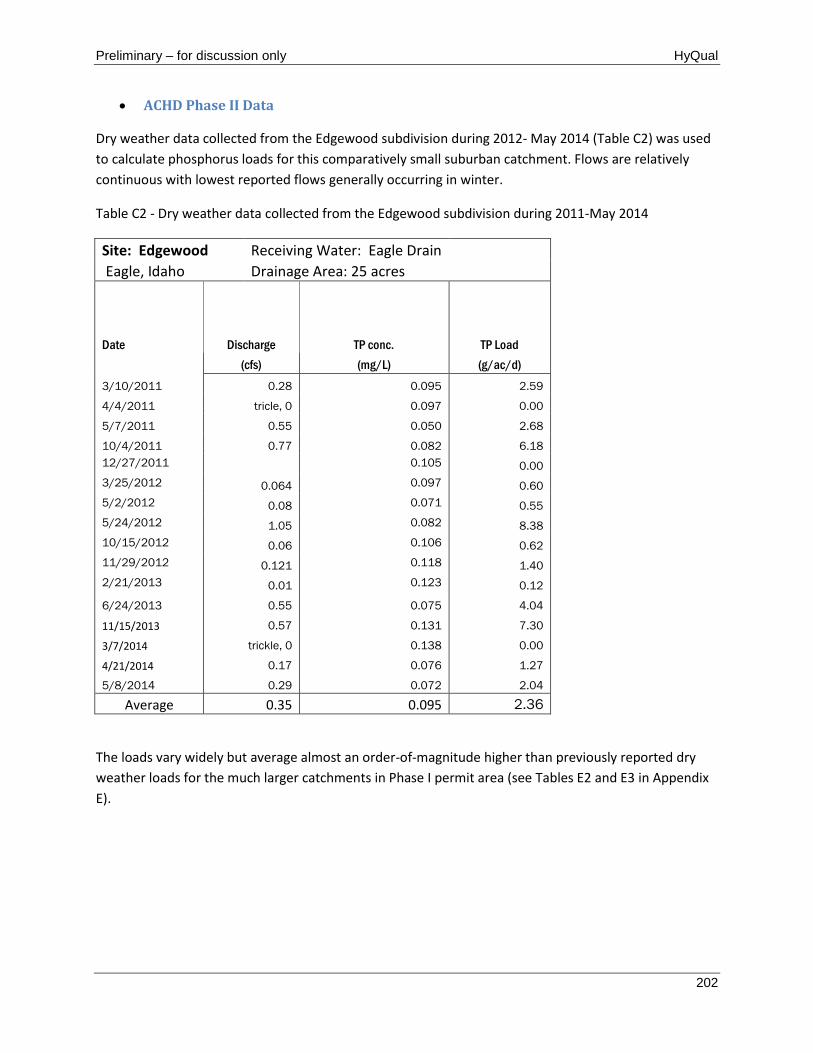
Preliminary – for discussion only HyQual
202
ACHD Phase II Data
Dry weather data collected from the Edgewood subdivision during 2012- May 2014 (Table C2) was used
to calculate phosphorus loads for this comparatively small suburban catchment. Flows are relatively
continuous with lowest reported flows generally occurring in winter.
Table C2 - Dry weather data collected from the Edgewood subdivision during 2011-May 2014
Site: Edgewood Receiving Water: Eagle Drain Eagle, Idaho Drainage Area: 25 acres
Date Discharge TP conc. TP Load
(cfs) (mg/L) (g/ac/d)
3/10/2011 0.28 0.095 2.59
4/4/2011 tricle, 0 0.097 0.00
5/7/2011 0.55 0.050 2.68
10/4/2011 0.77 0.082 6.18
12/27/2011 0.105 0.00
3/25/2012 0.064 0.097 0.60
5/2/2012 0.08 0.071 0.55
5/24/2012 1.05 0.082 8.38
10/15/2012 0.06 0.106 0.62
11/29/2012 0.121 0.118 1.40
2/21/2013 0.01 0.123 0.12
6/24/2013 0.55 0.075 4.04
11/15/2013 0.57 0.131 7.30
3/7/2014 trickle, 0 0.138 0.00
4/21/2014 0.17 0.076 1.27
5/8/2014 0.29 0.072 2.04
Average 0.35 0.095 2.36
The loads vary widely but average almost an order-of-magnitude higher than previously reported dry
weather loads for the much larger catchments in Phase I permit area (see Tables E2 and E3 in Appendix
E).
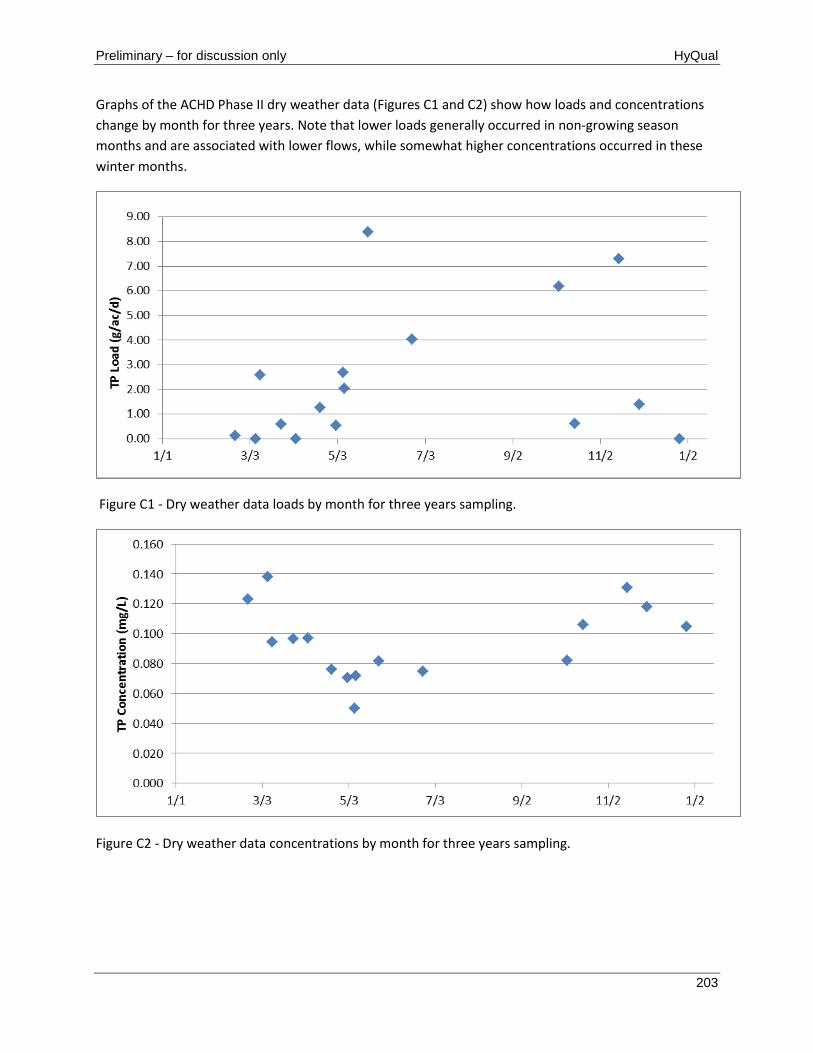
Preliminary – for discussion only HyQual
203
Graphs of the ACHD Phase II dry weather data (Figures C1 and C2) show how loads and concentrations
change by month for three years. Note that lower loads generally occurred in non-growing season
months and are associated with lower flows, while somewhat higher concentrations occurred in these
winter months.
Figure C1 - Dry weather data loads by month for three years sampling.
Figure C2 - Dry weather data concentrations by month for three years sampling.
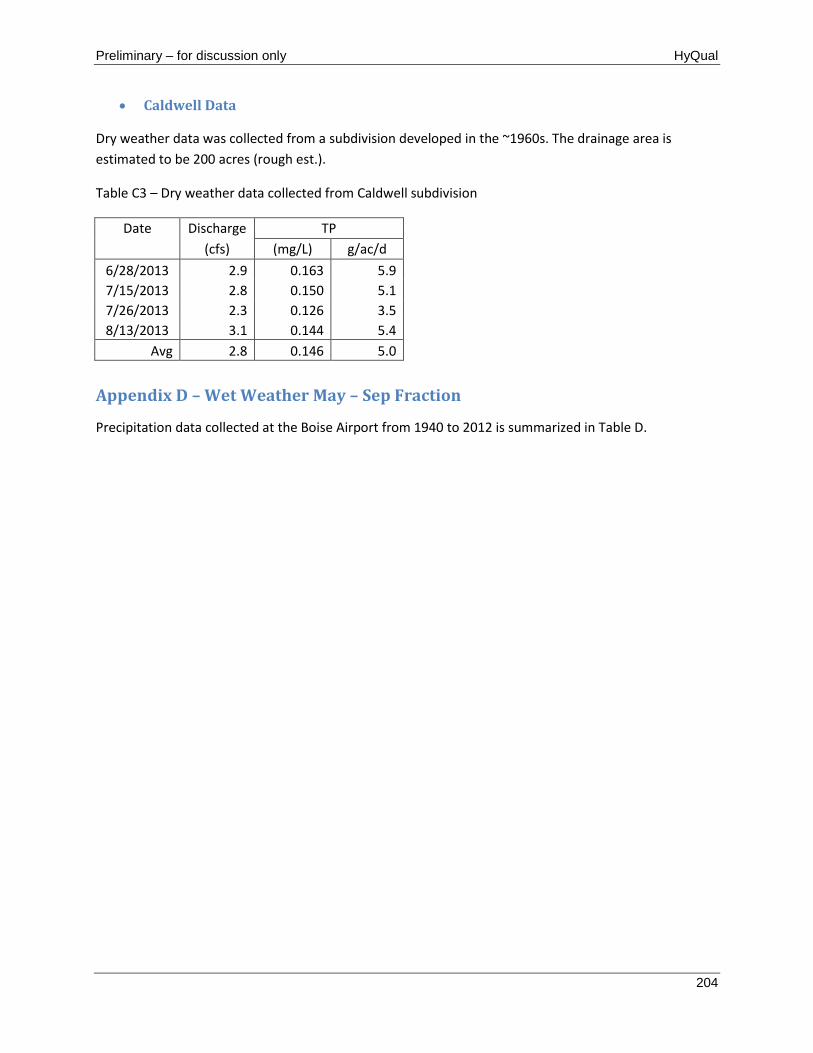
Preliminary – for discussion only HyQual
204
Caldwell Data
Dry weather data was collected from a subdivision developed in the ~1960s. The drainage area is
estimated to be 200 acres (rough est.).
Table C3 – Dry weather data collected from Caldwell subdivision
Date Discharge TP
(cfs) (mg/L) g/ac/d
6/28/2013 2.9 0.163 5.9
7/15/2013 2.8 0.150 5.1
7/26/2013 2.3 0.126 3.5
8/13/2013 3.1 0.144 5.4
Avg 2.8 0.146 5.0
Appendix D – Wet Weather May – Sep Fraction
Precipitation data collected at the Boise Airport from 1940 to 2012 is summarized in Table D.
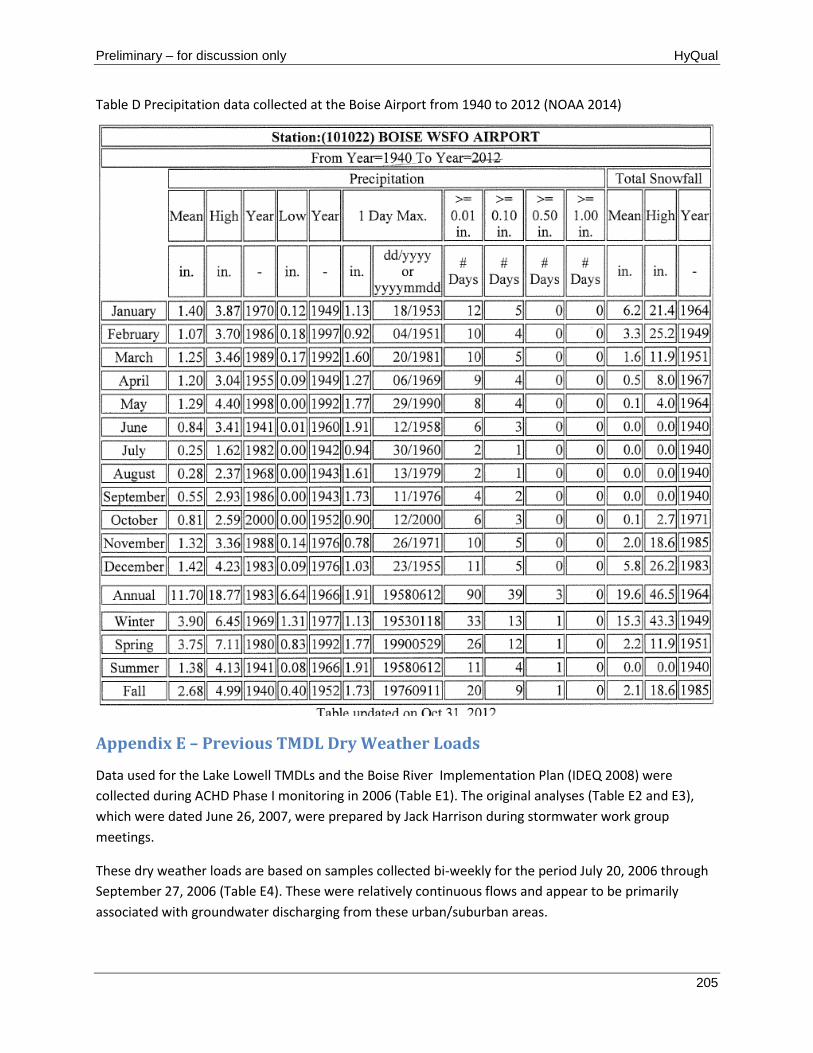
Preliminary – for discussion only HyQual
205
Table D Precipitation data collected at the Boise Airport from 1940 to 2012 (NOAA 2014)
Appendix E – Previous TMDL Dry Weather Loads
Data used for the Lake Lowell TMDLs and the Boise River Implementation Plan (IDEQ 2008) were
collected during ACHD Phase I monitoring in 2006 (Table E1). The original analyses (Table E2 and E3),
which were dated June 26, 2007, were prepared by Jack Harrison during stormwater work group
meetings.
These dry weather loads are based on samples collected bi-weekly for the period July 20, 2006 through
September 27, 2006 (Table E4). These were relatively continuous flows and appear to be primarily
associated with groundwater discharging from these urban/suburban areas.
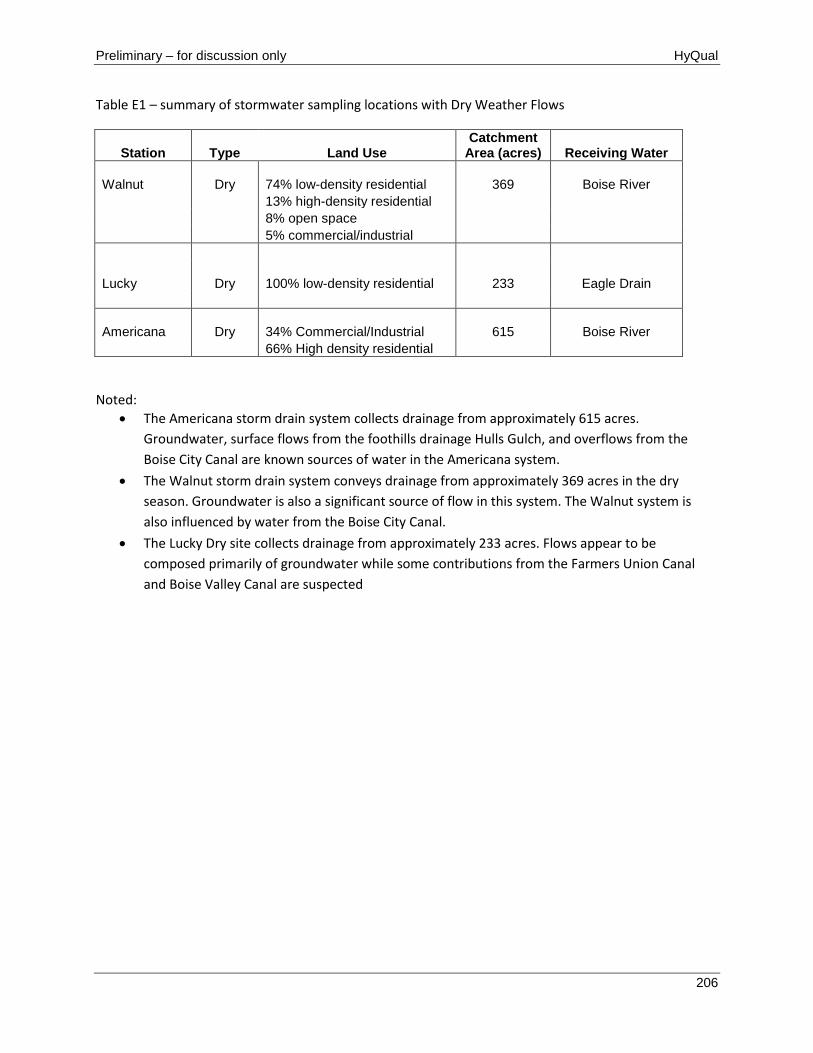
Preliminary – for discussion only HyQual
206
Table E1 – summary of stormwater sampling locations with Dry Weather Flows
Station
Type Land Use Catchment
Area (acres) Receiving Water
Walnut
Dry 74% low-density residential 369 Boise River
13% high-density residential
8% open space
5% commercial/industrial
Lucky
Dry 100% low-density residential 233 Eagle Drain
Americana
Dry 34% Commercial/Industrial 615 Boise River
66% High density residential
Noted:
The Americana storm drain system collects drainage from approximately 615 acres.
Groundwater, surface flows from the foothills drainage Hulls Gulch, and overflows from the
Boise City Canal are known sources of water in the Americana system.
The Walnut storm drain system conveys drainage from approximately 369 acres in the dry
season. Groundwater is also a significant source of flow in this system. The Walnut system is
also influenced by water from the Boise City Canal.
The Lucky Dry site collects drainage from approximately 233 acres. Flows appear to be
composed primarily of groundwater while some contributions from the Farmers Union Canal
and Boise Valley Canal are suspected
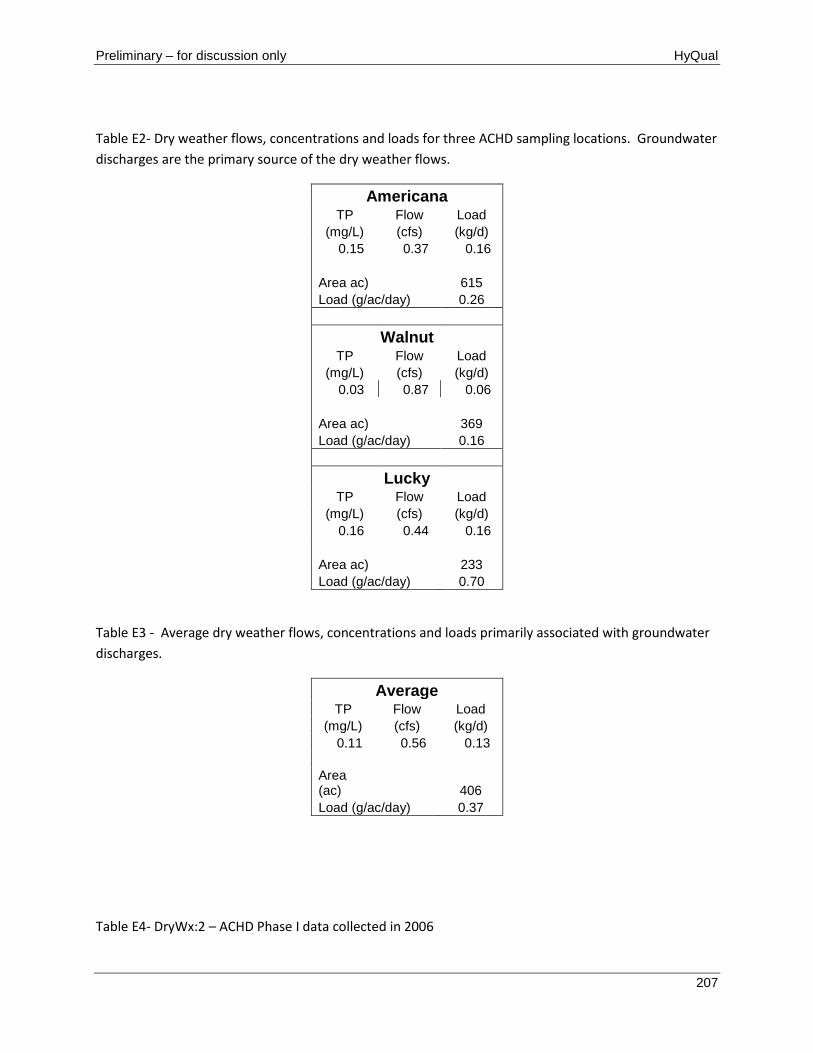
Preliminary – for discussion only HyQual
207
Table E2- Dry weather flows, concentrations and loads for three ACHD sampling locations. Groundwater
discharges are the primary source of the dry weather flows.
Americana TP Flow Load
(mg/L) (cfs) (kg/d)
0.15 0.37 0.16
Area ac) 615
Load (g/ac/day) 0.26
Walnut TP Flow Load
(mg/L) (cfs) (kg/d)
0.03 0.87 0.06
Area ac) 369
Load (g/ac/day) 0.16
Lucky TP Flow Load
(mg/L) (cfs) (kg/d)
0.16 0.44 0.16
Area ac) 233
Load (g/ac/day) 0.70
Table E3 - Average dry weather flows, concentrations and loads primarily associated with groundwater
discharges.
Average TP Flow Load
(mg/L) (cfs) (kg/d)
0.11 0.56 0.13
Area (ac) 406
Load (g/ac/day) 0.37
Table E4- DryWx:2 – ACHD Phase I data collected in 2006
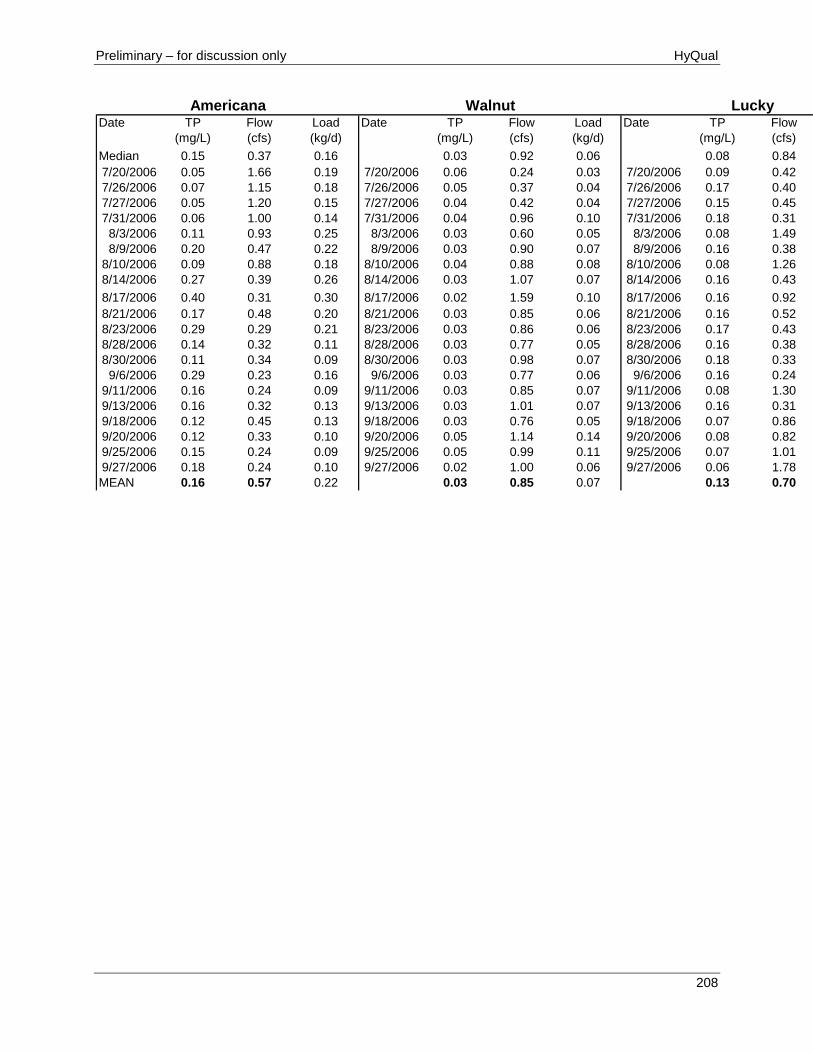
Preliminary – for discussion only HyQual
208
Date TP Flow Load Date TP Flow Load Date TP Flow Load
(mg/L) (cfs) (kg/d) (mg/L) (cfs) (kg/d) (mg/L) (cfs) (kg/d)
Median 0.15 0.37 0.16 0.03 0.92 0.06 0.08 0.84 0.16
7/20/2006 0.05 1.66 0.19 7/20/2006 0.06 0.24 0.03 7/20/2006 0.09 0.42 0.09
7/26/2006 0.07 1.15 0.18 7/26/2006 0.05 0.37 0.04 7/26/2006 0.17 0.40 0.17
7/27/2006 0.05 1.20 0.15 7/27/2006 0.04 0.42 0.04 7/27/2006 0.15 0.45 0.16
7/31/2006 0.06 1.00 0.14 7/31/2006 0.04 0.96 0.10 7/31/2006 0.18 0.31 0.13
8/3/2006 0.11 0.93 0.25 8/3/2006 0.03 0.60 0.05 8/3/2006 0.08 1.49 0.28
8/9/2006 0.20 0.47 0.22 8/9/2006 0.03 0.90 0.07 8/9/2006 0.16 0.38 0.15
8/10/2006 0.09 0.88 0.18 8/10/2006 0.04 0.88 0.08 8/10/2006 0.08 1.26 0.25
8/14/2006 0.27 0.39 0.26 8/14/2006 0.03 1.07 0.07 8/14/2006 0.16 0.43 0.16
8/17/2006 0.40 0.31 0.30 8/17/2006 0.02 1.59 0.10 8/17/2006 0.16 0.92 0.37
8/21/2006 0.17 0.48 0.20 8/21/2006 0.03 0.85 0.06 8/21/2006 0.16 0.52 0.20
8/23/2006 0.29 0.29 0.21 8/23/2006 0.03 0.86 0.06 8/23/2006 0.17 0.43 0.18
8/28/2006 0.14 0.32 0.11 8/28/2006 0.03 0.77 0.05 8/28/2006 0.16 0.38 0.15
8/30/2006 0.11 0.34 0.09 8/30/2006 0.03 0.98 0.07 8/30/2006 0.18 0.33 0.14
9/6/2006 0.29 0.23 0.16 9/6/2006 0.03 0.77 0.06 9/6/2006 0.16 0.24 0.09
9/11/2006 0.16 0.24 0.09 9/11/2006 0.03 0.85 0.07 9/11/2006 0.08 1.30 0.26
9/13/2006 0.16 0.32 0.13 9/13/2006 0.03 1.01 0.07 9/13/2006 0.16 0.31 0.12
9/18/2006 0.12 0.45 0.13 9/18/2006 0.03 0.76 0.05 9/18/2006 0.07 0.86 0.15
9/20/2006 0.12 0.33 0.10 9/20/2006 0.05 1.14 0.14 9/20/2006 0.08 0.82 0.15
9/25/2006 0.15 0.24 0.09 9/25/2006 0.05 0.99 0.11 9/25/2006 0.07 1.01 0.16
9/27/2006 0.18 0.24 0.10 9/27/2006 0.02 1.00 0.06 9/27/2006 0.06 1.78 0.25
MEAN 0.16 0.57 0.22 0.03 0.85 0.07 0.13 0.70 0.22
Americana Walnut Lucky