lower value care in denmark - echo · lower value care in denmark february 2014 garcía-armesto s,...
TRANSCRIPT

Lower Value Care
in Denmark
February 2014
García-Armesto S, Martinez-Lizaga N, Angulo-Pueyo E, Thygesen LC, Christiansen T, Bernal-Delgado E on behalf of the ECHO consortium
ECHO Atlas on Lower Value Care EUROPEAN COLLABORATION FOR HEALTHCARE OPTIMIZATION (ECHO)

Edited by
Seral Rodríguez M., García Armesto S., Bernal Delgado E. Instituto Aragonés
de Ciencias de la Salud- Instituto de Investigación Sanitaria Aragón.
Acknowledgment and disclaimer
The ECHO Consortium appreciates the key role of the national institutions
that kindly provided the data used in this research project.
ECHO Consortium strives to keep the content of this Atlas accurate according
to rigorous professional standards. Their institutions do not necessarily share
the contents of this report, which is entirely the responsibility of the authors.
Funding
The research leading to these results has
received funding from the European
Community's Seventh Framework Programme
(FP7/2007-2013). Sole responsibility lies with
the authors. The EC is not responsible for any
use that might be made of the information
contained there in.
This ECHO Atlas has been elaborated by the Institute for Health Sciences
In Aragon in partnership with the following organisations:
-
This publication should be cited as
European Collaboration for Healthcare Optimization (ECHO) Project. www.echo-
health.eu . Zaragoza (Spain): Instituto Aragonés de Ciencias de la Salud - Instituto
Investigación Sanitaria Aragón; c2010. García Armesto S, Martinez Lizaga N,
Angulo Pueyo E, Thygesen LC, Christiansen T, Bernal-Delgado E on behalf of the
ECHO consortium . ECHO Atlas on Lower Value Care; February 2014 [accessed:
date]; Available from: www.echo-health.eu/echo-atlas-reports
More details and ECHO Atlases available at www.echo-health.eu
© ECHO Consortium. Reproduction, distribution, transmission, re-publication,
display or performance, of the Content delivered in this ECHO Atlas is only
allowed for non-commercial purposes and shall acknowledge the source.
1
EUROPEAN COLLABORATION FOR
HEALTHCARE OPTIMIZATION
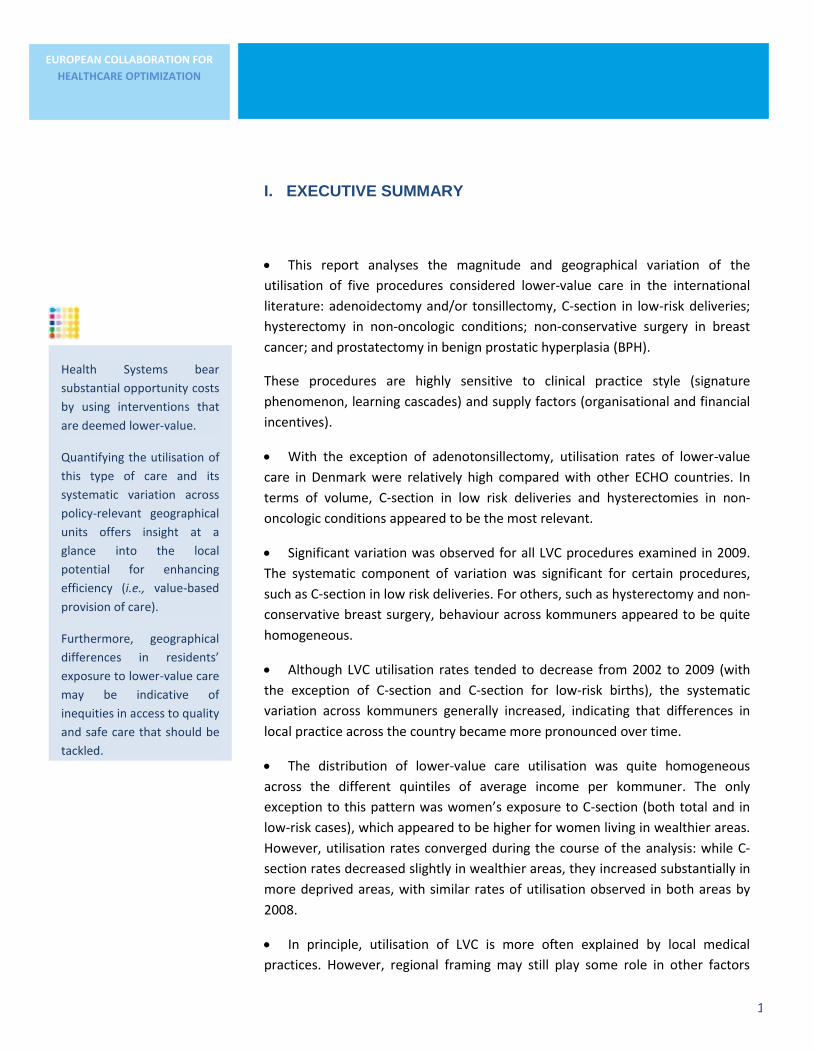
I. EXECUTIVE SUMMARY
This report analyses the magnitude and geographical variation of the
utilisation of five procedures considered lower-value care in the international
literature: adenoidectomy and/or tonsillectomy, C-section in low-risk deliveries;
hysterectomy in non-oncologic conditions; non-conservative surgery in breast
cancer; and prostatectomy in benign prostatic hyperplasia (BPH).
These procedures are highly sensitive to clinical practice style (signature
phenomenon, learning cascades) and supply factors (organisational and financial
incentives).
With the exception of adenotonsillectomy, utilisation rates of lower-value
care in Denmark were relatively high compared with other ECHO countries. In
terms of volume, C-section in low risk deliveries and hysterectomies in non-
oncologic conditions appeared to be the most relevant.
Significant variation was observed for all LVC procedures examined in 2009.
The systematic component of variation was significant for certain procedures,
such as C-section in low risk deliveries. For others, such as hysterectomy and non-
conservative breast surgery, behaviour across kommuners appeared to be quite
homogeneous.
Although LVC utilisation rates tended to decrease from 2002 to 2009 (with
the exception of C-section and C-section for low-risk births), the systematic
variation across kommuners generally increased, indicating that differences in
local practice across the country became more pronounced over time.
The distribution of lower-value care utilisation was quite homogeneous
across the different quintiles of average income per kommuner. The only
exception to this pattern was women’s exposure to C-section (both total and in
low-risk cases), which appeared to be higher for women living in wealthier areas.
However, utilisation rates converged during the course of the analysis: while C-
section rates decreased slightly in wealthier areas, they increased substantially in
more deprived areas, with similar rates of utilisation observed in both areas by
2008.
In principle, utilisation of LVC is more often explained by local medical
practices. However, regional framing may still play some role in other factors
Health Systems bear
substantial opportunity costs
by using interventions that
are deemed lower-value.
Quantifying the utilisation of
this type of care and its
systematic variation across
policy-relevant geographical
units offers insight at a
glance into the local
potential for enhancing
efficiency (i.e., value-based
provision of care).
Furthermore, geographical
differences in residents’
exposure to lower-value care
may be indicative of
inequities in access to quality
and safe care that should be
tackled.

2
EUROPEAN COLLABORATION FOR
HEALTHCARE OPTIMIZATION
such as the availability of services, the organisation of care paths, and incentives
frameworks, which may affect decisions made at the local level. Interestingly, the
percentage of variation attributable to the region was close to zero for
adenotonsillectomy and prostatectomy, increasing to 11% for C-section in low
risk deliveries, and ranging from 20% to 30% for hysterectomy and non-
conservative breast surgery.
The analysis conducted suggests that there is plenty of room to increase
value for money in the Danish system. Although utilisation rates are generally
higher than those of the other ECHO countries, LVC utilization rates tended to
decrease over the period of analysis, with the exception of C-section, and the
main driver resided at the local level. Focusing on local practices, particularly
learning cascades and established medical practice styles, together with patient
information and empowerment in decision making, could potentially have a
major impact.
Further analysis of institutional factors that underlie overexposure to LVC at
the kommuner level, as well local organisational and budgetary contexts and
regional framing, will serve as a basis for recommendations to guide decision
makers in tackling this allocative inefficiency. The aim is not to create savings, but
rather to foster “value for money”, i.e., to avoid non-efficient public expenditure.
Procedures eligible as “lower value”
- Those superseded by more cost-effective alternatives (non-conservative breast
cancer surgery, hysterectomy in non-oncologic conditions);
- Those applied to types of patients for whom evidence of value is unclear
(prostatectomy in BPH, C-section);
- Relatively ineffective procedures prone to overuse (adenotonsillectomy, C-
section in low-risk births).
Atlas Rationale: The report analyses the actual utilisation rate per 10,000
inhabitants in each geographical area and compares two scenarios of
“minimisation of lower-value care use”:
I. All the areas in the country behave as those in the 10th percentile of LVC
utilisation (90% of areas will exhibit rates above that threshold).
II. All the areas in the country behave as those in the first quartile of LVC
utilisation (75% of areas will exhibit rates above that threshold).
The potential for realignment is determined as the difference between the
number of procedures observed and those expected if LVC utilisation were
minimised to either of these two levels.

3
3
EUROPEAN COLLABORATION FOR
HEALTHCARE OPTIMIZATION
II. INTERNATIONAL COMPARISON
This section describes the utilisation of selected lower-value care (LVC) procedures in Denmark compared with the other countries in the ECHO project.
Two dimensions are explored: the magnitude of the phenomenon, and the
variation across the policy-relevant administrative areas in each country.
Adenoidectomy and/or tonsillectomy
Despite their indication being exceedingly restricted, these are still frequently
used paediatric surgical procedures. Geographical variability in the utilisation of
these interventions unexplained by appropriate medical indication has been
registered from 1938 to the present.
Denmark had the lowest age-standardised rates of adenotonsillectomy across
ECHO countries (Figure 1a); around 1 per 300 children under 14 years of age
underwent the procedure in 2009 (i.e., about 2.5 times fewer than recorded in
Slovenia, the country with the highest rate, at 1 per 120 children in 2009;
Appendix 1, Table 1).
Figure 1a. Standardised rates of adenoidectomy and/or
tonsillectomy per 10,000 children (natural scale). Year 2009 Figure 1b. Standardised rates of adenoidectomy and/or
tonsillectomy per 10,000 children (normalized scale). Year 2009
Each dot represents the relevant administrative area in the country of interest (Kommuners for Denmark). The y-axis charts the rate per 10,000 inhabitants (children). The figure is based on the total number of interventions performed in 2009 in each country. In Figure 2b, utilisation rates have been normalised to facilitate comparison of the degree of variation across countries.
The magnitude and
variation of lower-value
care utilisation in ECHO
health systems provides a
wider perspective in
assessing the relative
need for specific activities
focused on enhancing the
value of health care
provided, as compared
with other relevant
countries.

4
4
EUROPEAN COLLABORATION FOR
HEALTHCARE OPTIMIZATION
The difference between the highest and lowest rates in Denmark was among the
highest of all ECHO counties: children living in high-rate kommuners had a 4-fold
greater likelihood of undergoing the procedure than those living in low-rate
areas. Only Spain showed larger differences, at close to 5-fold (Figure 1b,
Appendix 1, Table 1). Like Denmark, England had a relatively low rate of
adenotonsillectomy, although the range of variation across local authorities was
narrower than that observed in Denmark, with a 2.5-fold difference between
areas with the highest and lowest rates.
The systematic component of this variation was significant in all countries
examined except England, ranging from 21% to 66% above that excepted due to
chance.
Caesarean section in low risk pregnancies and deliveries
C-section is considered a highly effective procedure to avoid maternal and child
mortality at birth as well as complications resulting from foetal distress.
However, in the last decade, a growing body of literature has highlighted
overuse, and in particular, misuse in lower-value indications such as low-risk and
normal births.
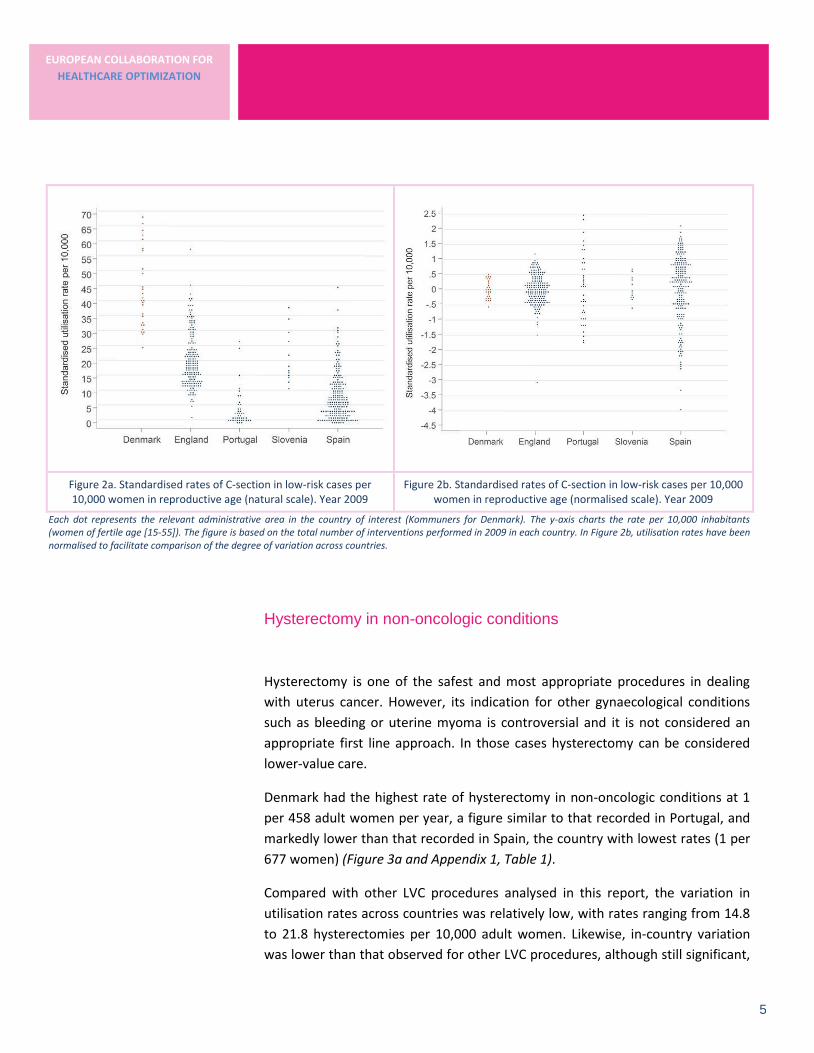
Denmark had the highest C-section rate in low-risk births across ECHO countries;
twice that recorded in England and Slovenia, and 5 and 10 times greater than
that recorded in Spain and Portugal, respectively (Figure 2a and Appendix 1,
Table 1). Interestingly, regardless of the rate, variation for this procedure across
the territory was quite high in all countries studied. In Denmark variation was
comparatively low: there was 2-fold difference detected between areas with the
highest and lowest rates. In the case of Spain, values ranged from zero in some
healthcare areas to as high as 50 in others (Figure 2b and Appendix 1, Table 1).
The systematic component of variation was also large across the countries
examined, exceeding that expected due to chance by between 0.5 and 6-fold,
depending on the country analysed (Figure 2b and Appendix 1, Table 1).
5
5
EUROPEAN COLLABORATION FOR
HEALTHCARE OPTIMIZATION
Figure 2a. Standardised rates of C-section in low-risk cases per 10,000 women in reproductive age (natural scale). Year 2009
Figure 2b. Standardised rates of C-section in low-risk cases per 10,000 women in reproductive age (normalised scale). Year 2009
Each dot represents the relevant administrative area in the country of interest (Kommuners for Denmark). The y-axis charts the rate per 10,000 inhabitants (women of fertile age [15-55]). The figure is based on the total number of interventions performed in 2009 in each country. In Figure 2b, utilisation rates have been normalised to facilitate comparison of the degree of variation across countries.
Hysterectomy in non-oncologic conditions
Hysterectomy is one of the safest and most appropriate procedures in dealing
with uterus cancer. However, its indication for other gynaecological conditions
such as bleeding or uterine myoma is controversial and it is not considered an
appropriate first line approach. In those cases hysterectomy can be considered
lower-value care.
Denmark had the highest rate of hysterectomy in non-oncologic conditions at 1
per 458 adult women per year, a figure similar to that recorded in Portugal, and
markedly lower than that recorded in Spain, the country with lowest rates (1 per
677 women) (Figure 3a and Appendix 1, Table 1).
Compared with other LVC procedures analysed in this report, the variation in
utilisation rates across countries was relatively low, with rates ranging from 14.8
to 21.8 hysterectomies per 10,000 adult women. Likewise, in-country variation
was lower than that observed for other LVC procedures, although still significant,

6
6
EUROPEAN COLLABORATION FOR
HEALTHCARE OPTIMIZATION
particularly in Spain (see Figure 3b and Appendix 1, Table 1). However, the
systematic component of this variation (variation not attributable to chance) was
low to moderate.
Each dot represents the relevant administrative area in the country of interest (Kommuners for Denmark). The y-axis charts the rate per 10,000 inhabitants (women of fertile age [15-55]). The figure is based on the total number of interventions performed in 2009 in each country. In Figure 2b, utilisation rates have been normalised to facilitate comparison of the degree of variation across countries.
Figure 3a. Standardised rates of hysterectomy in non-oncologic conditions per 10,000 women (natural scale). Year 2009
Figure 3b. Standardised rates of hysterectomy in non-oncologic conditions per 10,000 women (normalised scale). Year 2009
7
7
EUROPEAN COLLABORATION FOR
HEALTHCARE OPTIMIZATION
Non conservative surgery in breast cancer
The current therapeutic approach for breast cancer includes surgery, often
followed by hormonal therapy and radiotherapy. Surgical treatment can be
conservative (CS), which preserves part of breast glandular tissue, or non-
conservative (NCS) which entails total removal of breast glandular tissue,
maintaining or removing the skin tissue. CS is recommended at any stage of
breast cancer as it is associated with fewer complications and better quality of
life, and the use of NCS is limited to situations in which the tumour's size relative
to the total breast mass prevents conservative resection.
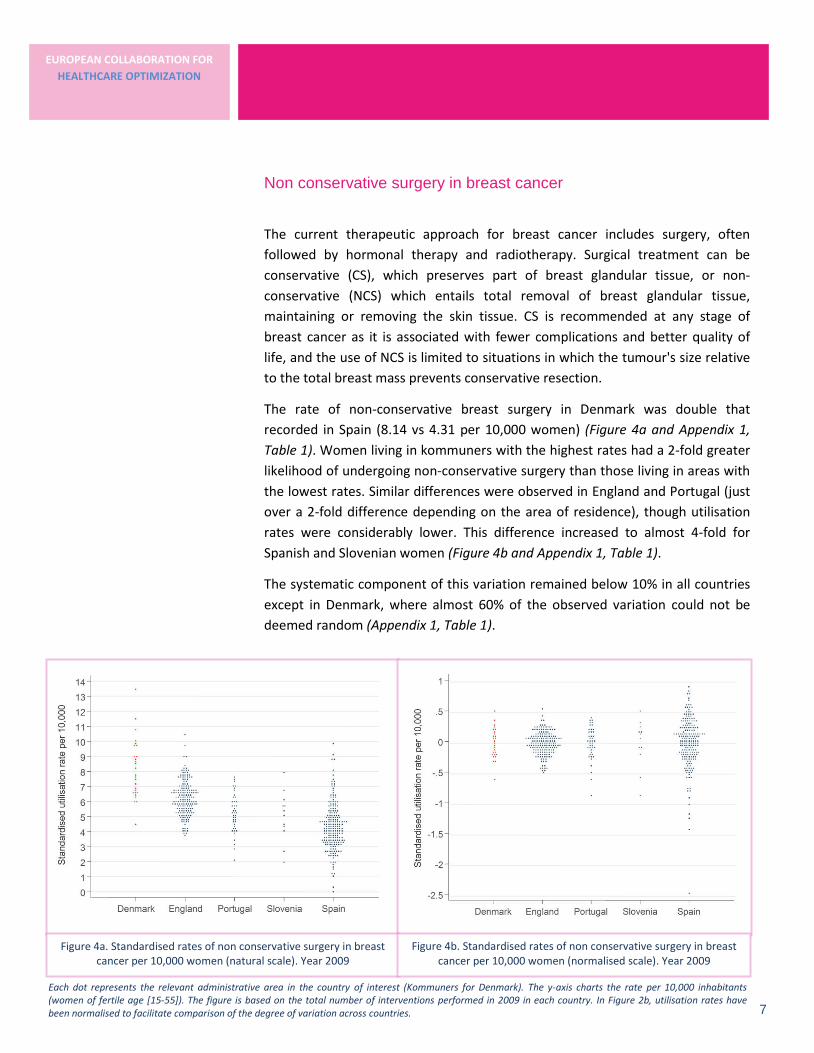
The rate of non-conservative breast surgery in Denmark was double that
recorded in Spain (8.14 vs 4.31 per 10,000 women) (Figure 4a and Appendix 1,
Table 1). Women living in kommuners with the highest rates had a 2-fold greater
likelihood of undergoing non-conservative surgery than those living in areas with
the lowest rates. Similar differences were observed in England and Portugal (just
over a 2-fold difference depending on the area of residence), though utilisation
rates were considerably lower. This difference increased to almost 4-fold for
Spanish and Slovenian women (Figure 4b and Appendix 1, Table 1).
The systematic component of this variation remained below 10% in all countries
except in Denmark, where almost 60% of the observed variation could not be
deemed random (Appendix 1, Table 1).
Each dot represents the relevant administrative area in the country of interest (Kommuners for Denmark). The y-axis charts the rate per 10,000 inhabitants (women of fertile age [15-55]). The figure is based on the total number of interventions performed in 2009 in each country. In Figure 2b, utilisation rates have been normalised to facilitate comparison of the degree of variation across countries.
Figure 4a. Standardised rates of non conservative surgery in breast cancer per 10,000 women (natural scale). Year 2009
Figure 4b. Standardised rates of non conservative surgery in breast cancer per 10,000 women (normalised scale). Year 2009

8
8
EUROPEAN COLLABORATION FOR
HEALTHCARE OPTIMIZATION
Prostatectomy in benign prostatic hyperplasia
Open prostatectomy is the oldest surgical method used to treat heavily
symptomatic benign prostatic hyperplasia (BPH). This method is still preferred if
the prostate is very large but, in general terms, has been superseded by less
invasive interventions such as transurethral resection of the prostate (TURP), and
should be considered lower-value care. However, there is growing evidence of
overuse of surgical options (particularly less invasive types) in dealing with BPH
and, in particular, misuse in asymptomatic or minor cases.
Denmark had comparatively high rates of prostatectomy in BPH, at 1 intervention
per 453 adult men per year, which was considerably higher than the rates
recorded in Portugal and Slovenia, the countries with the lowest rates, at around
1 per 800 adult men (Figure 5a and Appendix 1, Table 1). A 6-fold difference was
observed between areas with the highest and lowest rates Slovenia. This value
fell to 4-fold in Denmark and Spain (Figure 5b and Appendix 1, Table 1). The
systematic component of this variation not attributable to chance ranged from
10% to almost 50% across countries.
Each dot represents the relevant administrative area in the country of interest (Kommuners for Denmark). The y-axis charts the rate per 10,000 inhabitants (men). The figure is based on the total number of interventions performed in 2009 in each country. In Figure 2b, utilisation rates have been normalised to facilitate comparison of the degree of variation across countries.
Figure 5a. Standardised rates of prostatectomy in BPH per 10,000
men (natural scale). Year 2009
Figure 5b. Standardised rates of prostatectomy in BPH per 10,000
men (normalised scale). Year 2009

9
EUROPEAN COLLABORATION FOR
HEALTHCARE OPTIMIZATION
Variation in the utilisation of each LVC procedure is represented using two
geographical units: kommuners and regions. The first mapping is composed of 98
units and the second comprises 5 regions. Analysis by kommuners is more linked to
local medical practices, while regions are considered a surrogate for regional policies
affecting all the kommuners within.
III. IN COUNTRY VARIATION
With the exception of adenotonsillectomy, utilisation rates of lower-value care in
Denmark were relatively high compared to other ECHO countries. In terms of
volume, C-section in low-risk deliveries and hysterectomies in non-oncologic
conditions were the most relevant (Appendix 2, Table 2).
Significant variation was observed for all LVC procedures examined. The
systematic component of variation was particularly significant for certain
procedures, such as such as C-section in low risk deliveries, while for others, such
as hysterectomy and non-conservative breast surgery, behaviour across
kommuners was quite homogeneous, with only 7% of the observed variation
beyond that expected due to chance.
In this section, the geographical pattern of utilisation for each procedure is
mapped out for the two relevant tiers of the health system organisation:
kommuners and regions.
Whenever possible, proxies of “burden of disease” or utilisation of related or
alternative procedures have been included in the analysis to better characterise
the observed phenomena.
The potential for minimisation of LVC utilisation is also mapped out; each
geographical area is identified by its distance in excess-cases to the desirable
benchmark. To this end, two scenarios have been considered: the first takes as
reference the behaviour of the 10 kommuners with the lowest rates (the lowest
10%), while the other, more conservative scenario, benchmarks against lowest
quartile of rate distribution in the country (25th percentile of utilisation and
below).
Although, in principle, utilisation of LVC is more often explained by local medical
practices, regions may still play some role in other factors such as the availability
of services and the organisation of care devices, which may affect decisions made
locally. Interestingly, the percentage of variation explained by the region was
close to zero for adenotonsillectomy and prostatectomy, increasing to 11% in the
case of C-section in low-risk deliveries, and ranging from 20% and 30% for
hysterectomy and non-conservative breast surgery.
The higher the rate of utilisation of low-value
care, the more room there is to enhance efficiency.
The higher the systematic variation across areas, the greater the likelihood of inequitable exposure to
lower-value care linked to place of residence.
10
EUROPEAN COLLABORATION FOR
HEALTHCARE OPTIMIZATION
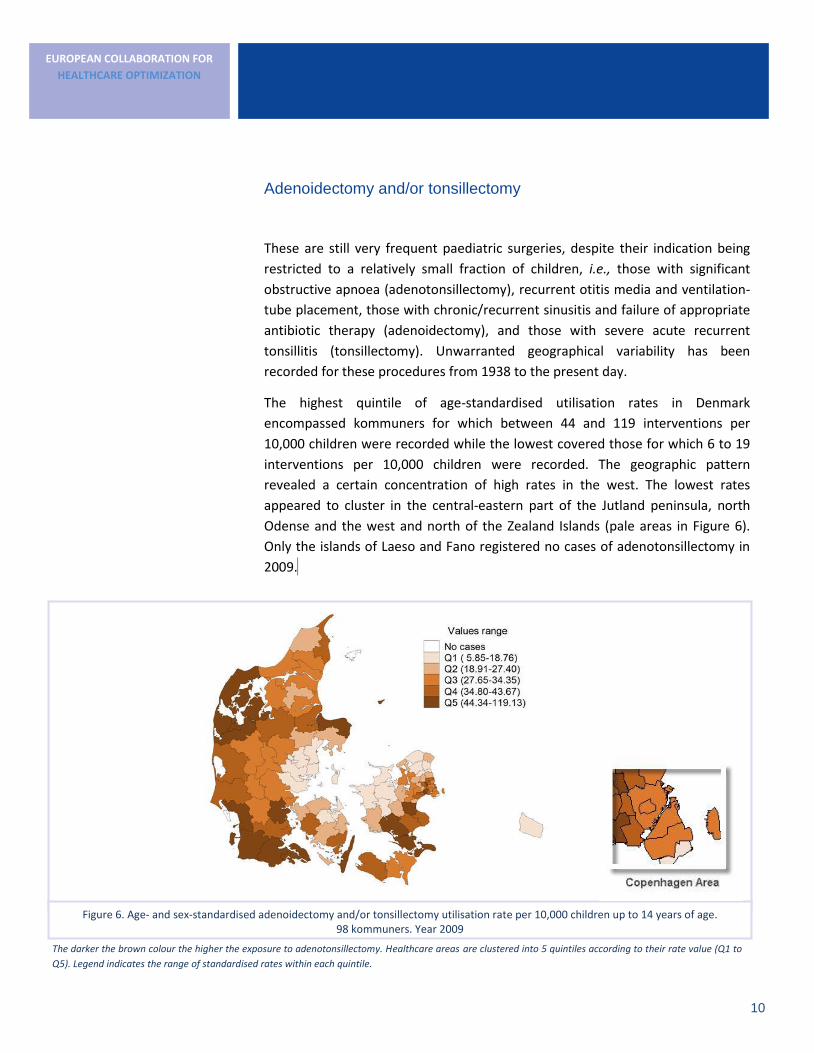
Adenoidectomy and/or tonsillectomy
These are still very frequent paediatric surgeries, despite their indication being
restricted to a relatively small fraction of children, i.e., those with significant
obstructive apnoea (adenotonsillectomy), recurrent otitis media and ventilation-
tube placement, those with chronic/recurrent sinusitis and failure of appropriate
antibiotic therapy (adenoidectomy), and those with severe acute recurrent
tonsillitis (tonsillectomy). Unwarranted geographical variability has been
recorded for these procedures from 1938 to the present day.
The highest quintile of age-standardised utilisation rates in Denmark
encompassed kommuners for which between 44 and 119 interventions per
10,000 children were recorded while the lowest covered those for which 6 to 19
interventions per 10,000 children were recorded. The geographic pattern
revealed a certain concentration of high rates in the west. The lowest rates
appeared to cluster in the central-eastern part of the Jutland peninsula, north
Odense and the west and north of the Zealand Islands (pale areas in Figure 6).
Only the islands of Laeso and Fano registered no cases of adenotonsillectomy in
2009. ..
Figure 6. Age- and sex-standardised adenoidectomy and/or tonsillectomy utilisation rate per 10,000 children up to 14 years of age. 98 kommuners. Year 2009
The darker the brown colour the higher the exposure to adenotonsillectomy. Healthcare areas are clustered into 5 quintiles according to their rate value (Q1 to
Q5). Legend indicates the range of standardised rates within each quintile.

11
EUROPEAN COLLABORATION FOR
HEALTHCARE OPTIMIZATION
When the analysis was performed by region, the highest rates were observed for
Syddanmark and Nordjylland, although the differences shown in Figure 7 were
much smaller than those in Figure 6, in which the full range of variation within
regions is displayed rather than smoothed out. The regional level only accounted
for less than 1% of the observed variation, suggesting that the main driver was
medical practice at the kommuner level (Appendix 2, Table 2).
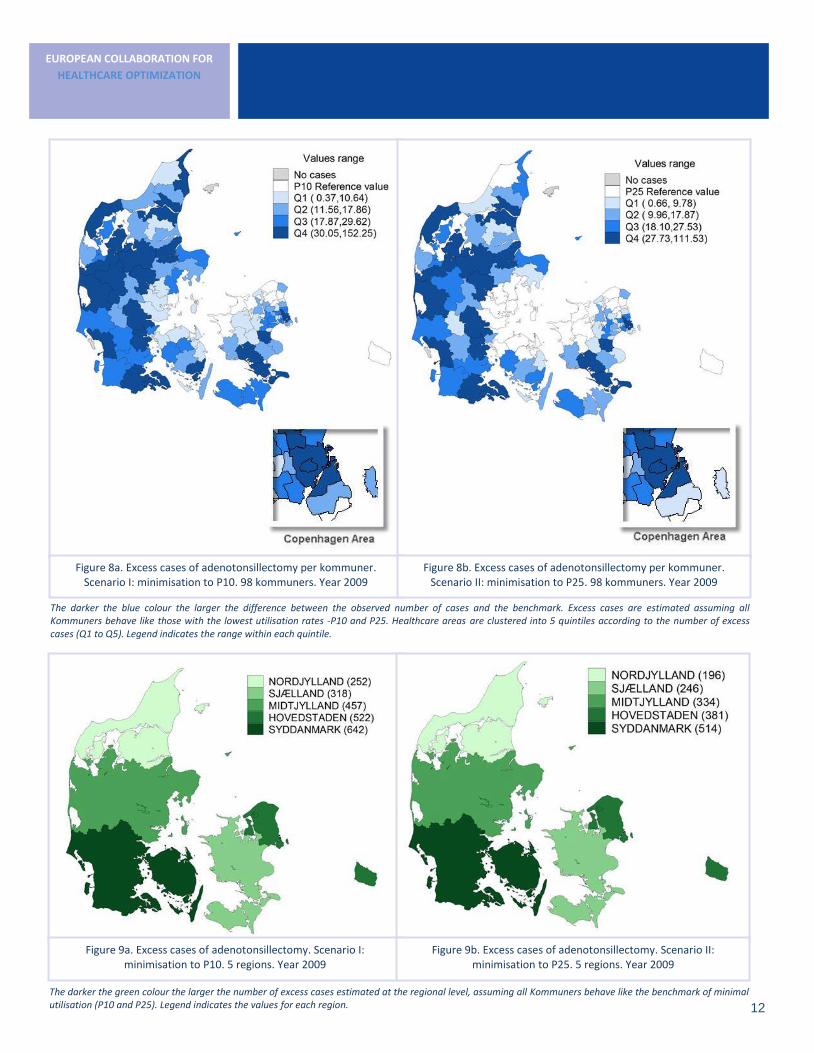
The greatest opportunities for minimising the use of adenotonsillectomy were
found in the western part of the country (Figures 8 and 9). According to the most
conservative scenario, the areas most in need of intervention to decrease
utilisation were those performing up to 112 excess adenotonsillectomies per year
(150 when using the more demanding benchmark in Scenario I). The overall
number of excess interventions in the country in 2009 was conservatively
estimated at around 1707 (Appendix 1, Table 3).
Figure 7. Age- and sex-standardised adeno and/or tonsillectomy utilisation rate per 10,000 children up to 14 years of age. 5 regions. Year 2009
12
EUROPEAN COLLABORATION FOR
HEALTHCARE OPTIMIZATION
The darker the green colour the larger the number of excess cases estimated at the regional level, assuming all Kommuners behave like the benchmark of minimal utilisation (P10 and P25). Legend indicates the values for each region.
Figure 9a. Excess cases of adenotonsillectomy. Scenario I: minimisation to P10. 5 regions. Year 2009
Figure 9b. Excess cases of adenotonsillectomy. Scenario II: minimisation to P25. 5 regions. Year 2009
Figure 8a. Excess cases of adenotonsillectomy per kommuner. Scenario I: minimisation to P10. 98 kommuners. Year 2009
Figure 8b. Excess cases of adenotonsillectomy per kommuner. Scenario II: minimisation to P25. 98 kommuners. Year 2009
The darker the blue colour the larger the difference between the observed number of cases and the benchmark. Excess cases are estimated assuming all Kommuners behave like those with the lowest utilisation rates -P10 and P25. Healthcare areas are clustered into 5 quintiles according to the number of excess cases (Q1 to Q5). Legend indicates the range within each quintile.
13
EUROPEAN COLLABORATION FOR
HEALTHCARE OPTIMIZATION
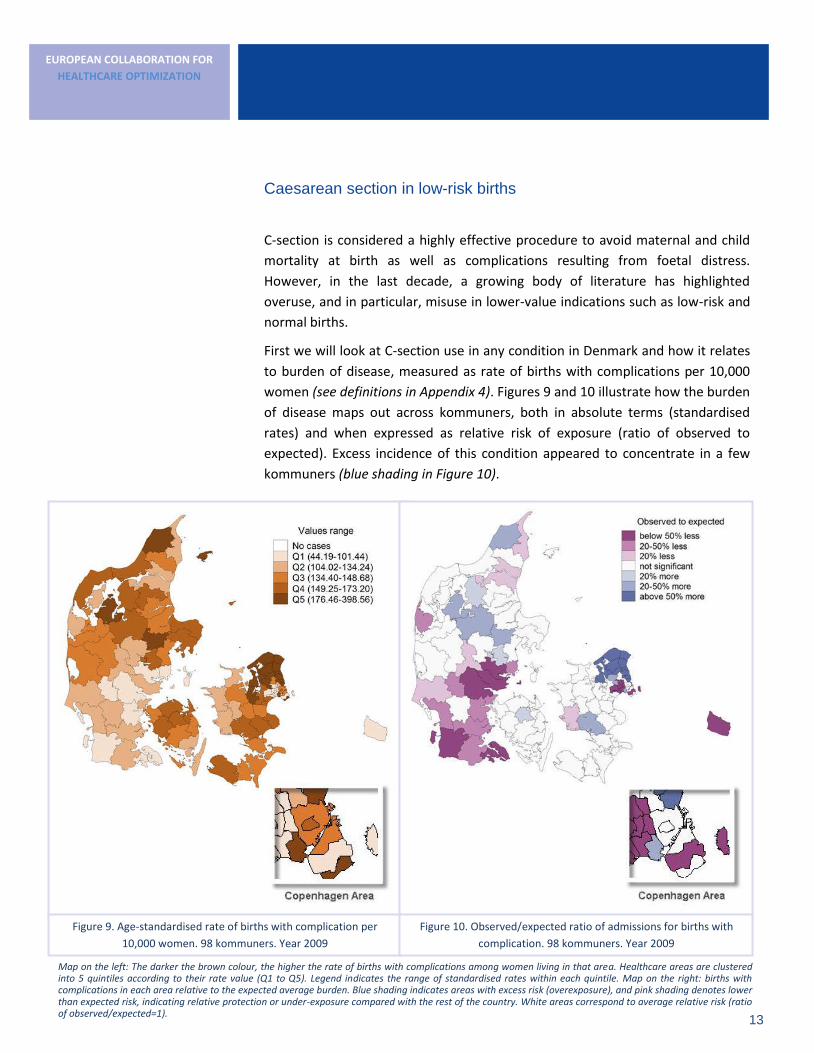
Caesarean section in low-risk births
C-section is considered a highly effective procedure to avoid maternal and child
mortality at birth as well as complications resulting from foetal distress.
However, in the last decade, a growing body of literature has highlighted
overuse, and in particular, misuse in lower-value indications such as low-risk and
normal births.
First we will look at C-section use in any condition in Denmark and how it relates
to burden of disease, measured as rate of births with complications per 10,000
women (see definitions in Appendix 4). Figures 9 and 10 illustrate how the burden
of disease maps out across kommuners, both in absolute terms (standardised
rates) and when expressed as relative risk of exposure (ratio of observed to
expected). Excess incidence of this condition appeared to concentrate in a few
kommuners (blue shading in Figure 10).
Figure 9. Age-standardised rate of births with complication per
10,000 women. 98 kommuners. Year 2009
Figure 10. Observed/expected ratio of admissions for births with
complication. 98 kommuners. Year 2009
Map on the left: The darker the brown colour, the higher the rate of births with complications among women living in that area. Healthcare areas are clustered into 5 quintiles according to their rate value (Q1 to Q5). Legend indicates the range of standardised rates within each quintile. Map on the right: births with complications in each area relative to the expected average burden. Blue shading indicates areas with excess risk (overexposure), and pink shading denotes lower than expected risk, indicating relative protection or under-exposure compared with the rest of the country. White areas correspond to average relative risk (ratio of observed/expected=1).

14
EUROPEAN COLLABORATION FOR
HEALTHCARE OPTIMIZATION
An overlap, even if imperfect, between the mapping of higher relative risk of
births with complications and that of the intensity of C-section utilisation can be
reasonably expected. However, the pattern revealed in Figure 11 shows a great
deal of incongruence when compared with those shown in Figures 9 and 10. The
conclusion that can be drawn is that the intensity of C-section utilisation in
several kommuners in the country is driven by factors other than need.
Exploring the extent of overlap between C-section utilisation patterns and C-
section in low-risk deliveries (lower-value care) yields a much more congruent
picture (Figures 11 and 12). This suggests that, in most kommuners with high C-
section rates, women are more exposed to lower-value care. However, it is worth
noting that some areas with low-medium rates of C-section utilization had high
levels of exposure to lower-value interventions.
Differences of up 3-fold were observed between areas with the lowest and
highest rates (Appendix 2, Table 2); 16% of this variation could not be deemed
random.
The darker the brown colour, the higher the probability that women of reproductive age living in those areas will undergo the procedure. Healthcare areas are clustered into 5 quintiles according to their rate value (Q1 to Q5). Legend indicates the range of standardised rates within each quintile..
Figure 11. Age-standardised rate of C-sections per 10,000 women aged 15-55. 98 kommuners. Year 2009
Figure 12. Age-standardised rate of C-sections in low-risk deliveries per 10,000 women aged 15-55. 98 kommuners. Year 2009

15
EUROPEAN COLLABORATION FOR
HEALTHCARE OPTIMIZATION
The regional level accounted for 11% of the detected variation across
kommuners (Appendix 2, Table 2).
When the analysis was conducted at the regional level, the mismatch between
the burden of births with complications and the intensity of utilization of C-
section became more severe (Figures 13 to 15). Syddanmark had the lowest rates
of complicated births and among the highest of C-section utilization. Conversely
women living in Hovedstaden bore the highest burden of births with
complications, yet this area had the lowest intensity of C-section utilization.
The regional pattern of lower-value C-section use followed the overall pattern of
utilization (Figures 15 and 16), with the exception of Sjaelland where relative high
rates of C-section corresponded to the lowest regional level of lower-value
procedures.
Figure 13. Age standardised rate of births with complications per 10,000 women. 5 regions. Year 2009
Figure 14. Observed/expected ratio of admissions for births with complication. 5 regions. Year 2009
Map on the left: The darker the brown colour, the higher the exposure to complications among women of reproductive age living in that region. Legend indicates the actual values of the standardised rate. Map on the right: relative risk of birth with complication in the region compared with the expected average exposure. Blue shading indicates areas with excess risk (overexposure), and pink shading denotes lower than expected risk, indicating relative protection or under-exposure compared with the rest of the country. White areas correspond to average relative risk (ratio of observed/expected=1).

16
EUROPEAN COLLABORATION FOR
HEALTHCARE OPTIMIZATION
The distance between the observed exposure to lower-value C-sections and the
optimisation benchmarks is shown in Figures 18 and 19 for the two tiers of health
administration; kommuners and regions.
The most conservative scenario of minimisation (Figures 17b and 18. b)
estimated excess lower-value C-sections in Denmark in 1 year at almost 1600
interventions (Appendix 2, Table 3). The distribution of those cases is obviously
uneven across healthcare areas; the darker shades in Figures 17a and b denote
areas that may be priority targets for interventions to reduce C-section utilisation
in low-risk births (the maximum local potential for reduction is estimated at
between 30 and 132 interventions per year; Q4 in Figures 17a and b).
The same quantification was conducted at the regional level to identify potential
means of reducing the use of lower value C-sections (Figures 18a and b). The
most conservative scenario (Figure 18b) yielded an estimate of between 50 and
560 excess lower-value interventions. The more demanding scenario estimated
100 to 650 per year depending on the region.
Figure 15. Age-standardised rate of C-sections per 10,000 women aged 15-55. 5 regions. Year 2009
Figure 16. Age-standardised rate of C-sections in low risk deliveries per 10,000 women aged 15-55. 5 regions. Year 2009

17
EUROPEAN COLLABORATION FOR
HEALTHCARE OPTIMIZATION
Figure 18a. Excess cases of C-section in low risk deliveries Scenario I: minimisation to P10. 5 regions. Year 2009
Figure 18b. Excess cases of C-section in low risk deliveries. Scenario II: minimisation to P25. 5 regions. Year 2009
The darker the green colour the larger the number of excess cases estimated at the regional level, assuming all Kommuners behave like the benchmark of minimal utilisation (P10 and P25). Legend indicates the values for each region.
Figure 17a. Excess cases of C-section in low risk deliveries per healthcare area. Scenario I: minimisation to P10.
98 kommuners. Year 2009
Figure 17b. Excess cases of C-section in low risk deliveries per healthcare area. Scenario II: minimisation to P25.
98 kommuners. Year 2009
The darker the blue colour the larger the difference between the observed number of cases and the benchmark. Excess cases are estimated assuming all Kommuners behave like those with the lowest utilisation rates -P10 and P25. Healthcare areas are clustered into 5 quintiles according to the number of excess cases (Q1 to Q5). Legend indicates the range within each quintile.
18
EUROPEAN COLLABORATION FOR
HEALTHCARE OPTIMIZATION
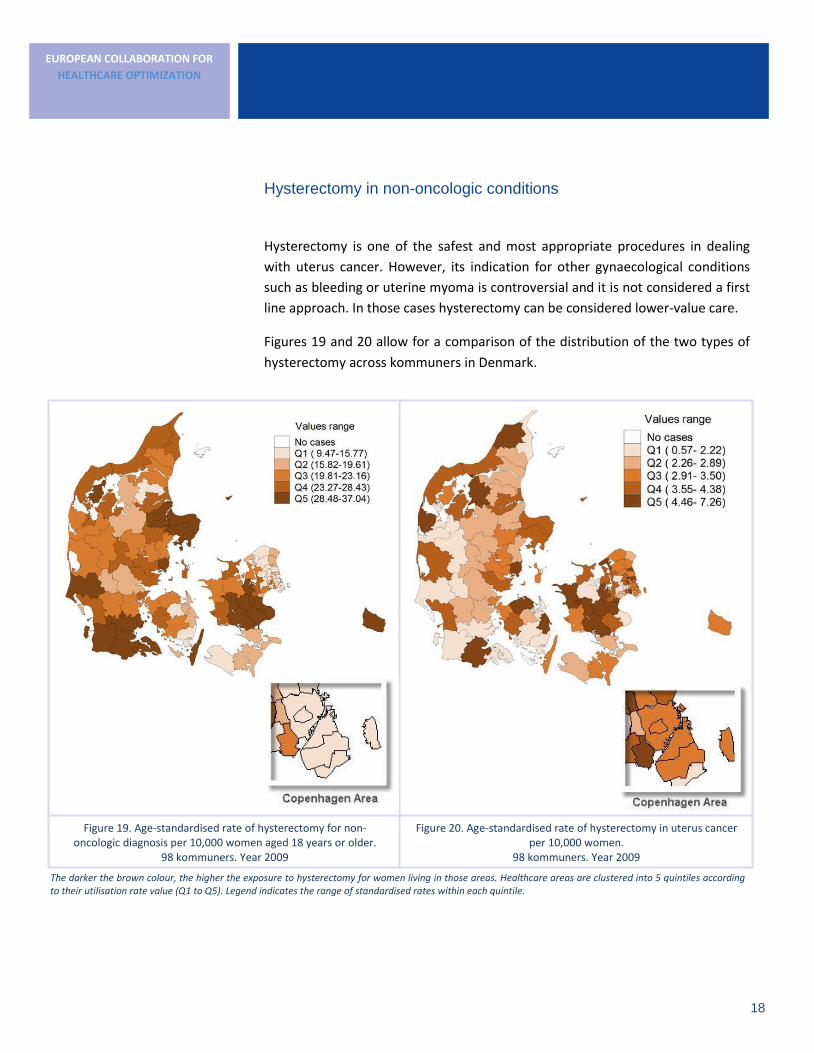
Hysterectomy in non-oncologic conditions
Hysterectomy is one of the safest and most appropriate procedures in dealing
with uterus cancer. However, its indication for other gynaecological conditions
such as bleeding or uterine myoma is controversial and it is not considered a first
line approach. In those cases hysterectomy can be considered lower-value care.
Figures 19 and 20 allow for a comparison of the distribution of the two types of
hysterectomy across kommuners in Denmark.
Figure 19. Age-standardised rate of hysterectomy for non-oncologic diagnosis per 10,000 women aged 18 years or older.
98 kommuners. Year 2009
Figure 20. Age-standardised rate of hysterectomy in uterus cancer per 10,000 women.
98 kommuners. Year 2009
The darker the brown colour, the higher the exposure to hysterectomy for women living in those areas. Healthcare areas are clustered into 5 quintiles according to their utilisation rate value (Q1 to Q5). Legend indicates the range of standardised rates within each quintile.

19
EUROPEAN COLLABORATION FOR
HEALTHCARE OPTIMIZATION
Note that utilisation rates for the lower-value indication were significantly higher
than those for the adequate indication (kommuners with the highest
hysterectomy utilisation rates for cancer indication recorded between 5 and 7
procedures per 10,000 adult women, increasing to 29 to 37 interventions for the
lower-value indication).
Furthermore, exclusion of the cancer indication revealed a 2.5-fold difference in
hysterectomy rates between areas with the lowest and highest values (Appendix
2, Table 2).
Although only 7% of this variation could be deemed not random (systematic), the
region to which the kommuner belonged accounted for almost 30% of it,
suggesting a relevant role of regional policy and/or services organisation in
modulating local clinical practice.
Using region as the unit of analysis (Figures 21 and 22), the highest rates of both
cancer-related and lower-value hysterectomy indications were found in Sjaelland
and Nordjylland. Syddanmark and Midtjylland showed similar rates for both types
of indication. Hovedstaden was notable in that it showed the lowest rates of
lower-value hysterectomy and an average rate for the cancer indication. As
expected, the range of variation across regions was higher for lower-value
hysterectomies.
Figure 21. Age-standardised rate of hysterectomy for non-oncologic diagnosis per 10,000 women aged 18 years or older.
5 regions. Year 2009
Figure 22. Age-standardised rate of hysterectomy in uterus cancer per 10,000 women. 5 regions. Year 2009
20
EUROPEAN COLLABORATION FOR
HEALTHCARE OPTIMIZATION
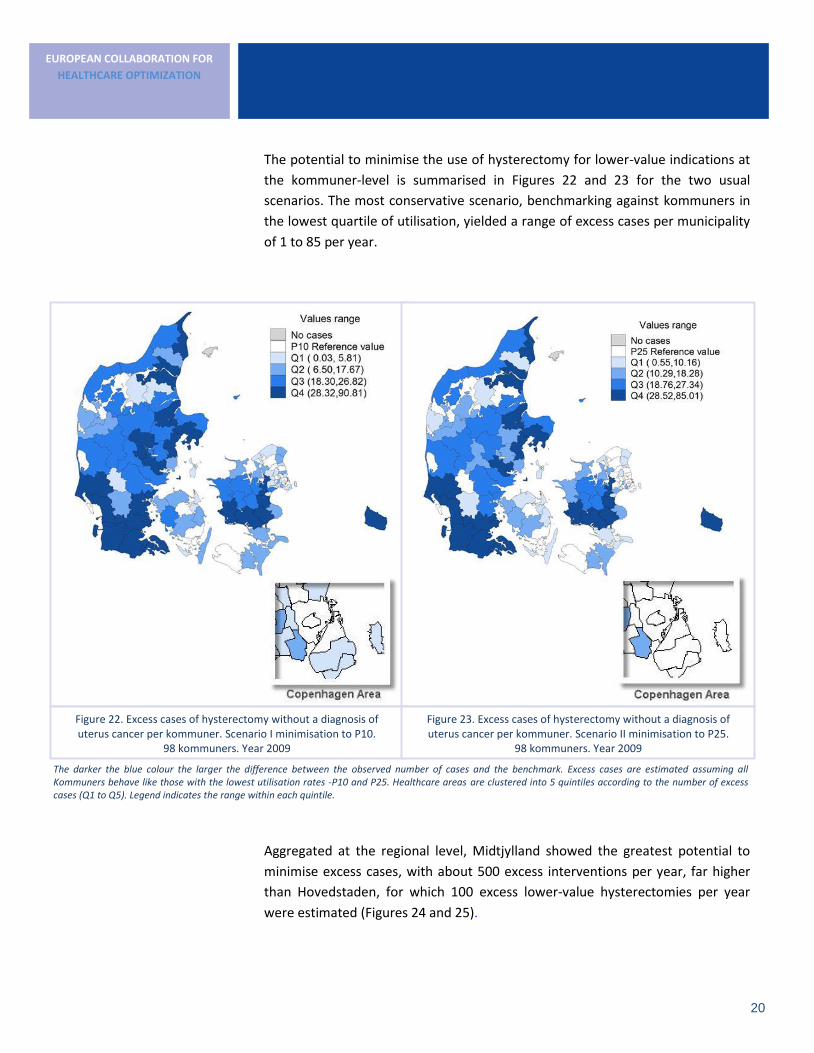
The potential to minimise the use of hysterectomy for lower-value indications at
the kommuner-level is summarised in Figures 22 and 23 for the two usual
scenarios. The most conservative scenario, benchmarking against kommuners in
the lowest quartile of utilisation, yielded a range of excess cases per municipality
of 1 to 85 per year.
Aggregated at the regional level, Midtjylland showed the greatest potential to
minimise excess cases, with about 500 excess interventions per year, far higher
than Hovedstaden, for which 100 excess lower-value hysterectomies per year
were estimated (Figures 24 and 25).
Figure 22. Excess cases of hysterectomy without a diagnosis of uterus cancer per kommuner. Scenario I minimisation to P10.
98 kommuners. Year 2009
Figure 23. Excess cases of hysterectomy without a diagnosis of uterus cancer per kommuner. Scenario II minimisation to P25.
98 kommuners. Year 2009
The darker the blue colour the larger the difference between the observed number of cases and the benchmark. Excess cases are estimated assuming all Kommuners behave like those with the lowest utilisation rates -P10 and P25. Healthcare areas are clustered into 5 quintiles according to the number of excess cases (Q1 to Q5). Legend indicates the range within each quintile.

21
EUROPEAN COLLABORATION FOR
HEALTHCARE OPTIMIZATION
Non conservative surgery in breast cancer
The current therapeutic approach for breast cancer includes surgery, often
followed by hormonal therapy and radiotherapy. Surgical treatment can be
conservative (CS), which preserves part of breast glandular tissue, or non-
conservative (NCS) which entails total removal of breast glandular tissue,
maintaining or removing the skin tissue. CS is recommended at any stage of
breast cancer as it is associated with fewer complications and better quality of
life, and the use of NCS is limited to situations in which the tumour's size relative
to the total breast mass prevents conservative resection. In specialised breast
cancer centres, approximately 75% of women with early stage breast cancer are
candidates for breast conserving therapy and 50% to 75% would prefer the
conservative approach. Thus, in most situations, NCS is considered lower-value
care as it has been superseded by the conservative alternative.
The previous section on international comparison revealed that Denmark had the
highest NCS utilisation rate across ECHO countries. Figure 26 shows how the
national rate translates to individual kommuners.
Figure 24. Excess cases of hysterectomy without a diagnosis of uterus cancer. Scenario I minimisation to P10. 5 regions. 2009
Figure 25. Excess cases of hysterectomy without a diagnosis of uterus cancer. Scenario II minimisation to P25. 5 regions. 2009
The darker the green colour the larger the number of excess cases estimated at the regional level, assuming all Kommuners behave like the benchmark of minimal utilisation (P10 and P25). Legend indicates the values for each region.

22
EUROPEAN COLLABORATION FOR
HEALTHCARE OPTIMIZATION
The range of age-standardised rates across the country was wide: depending on
their kommuner of residence the probability of undergoing lower-value breast
surgery differed by up to 3-fold (Appendix 2, Table 2). Although only 7% of this
variation exceeded that which could be randomly expected, the region to which
the kommuner belonged accounted for over 20% of the variation.
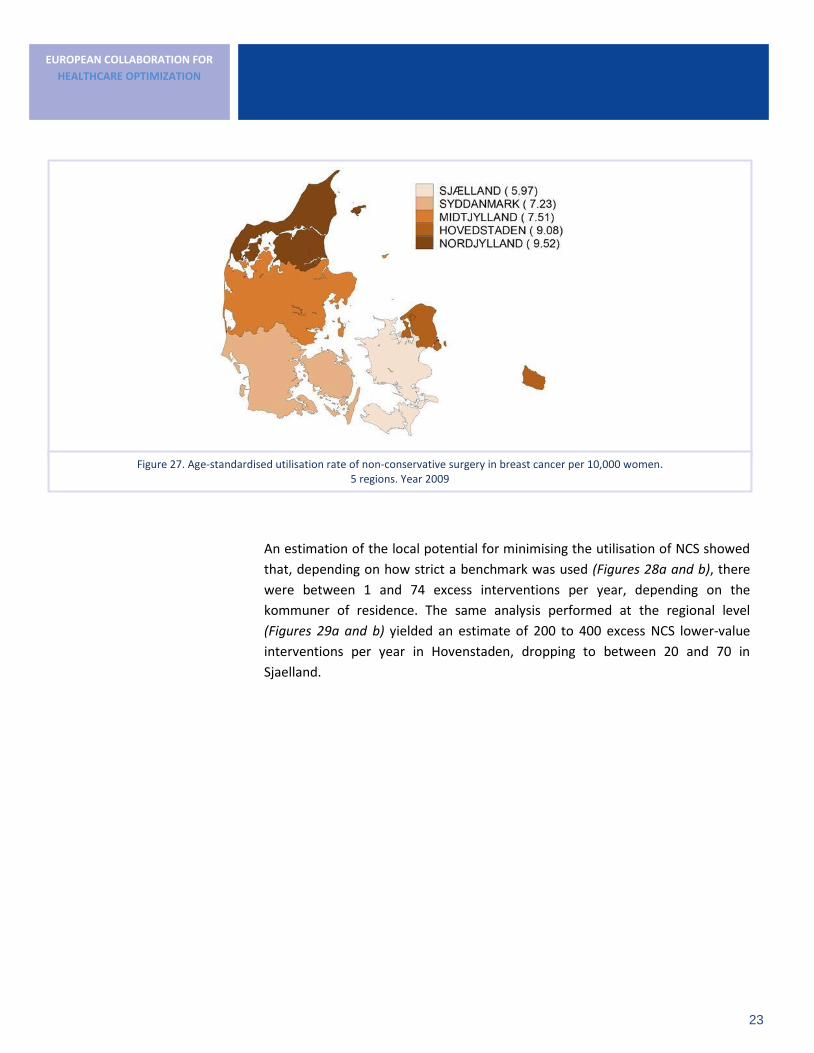
Analysis at regional level revealed that Nordjylland had the highest NCS
utilisation rate (1 per 1000 adult women), just above Hovedstaden, but about
four points higher than Sjaelland, the regions with the lowest rate, at roughly 1
per 1667 women.
Figure 26. Age-standardised utilisation rate of non-conservative surgery in breast cancer per 10,000 women. 98 kommuners. Year 2009
The darker the brown colour, the higher the exposure of women living in the corresponding areas to non-conservative surgery. Healthcare areas are clustered into 5 quintiles according to their rate value (Q1 to Q5). Legend indicates the range of standardised rates within each quintile.
23
EUROPEAN COLLABORATION FOR
HEALTHCARE OPTIMIZATION
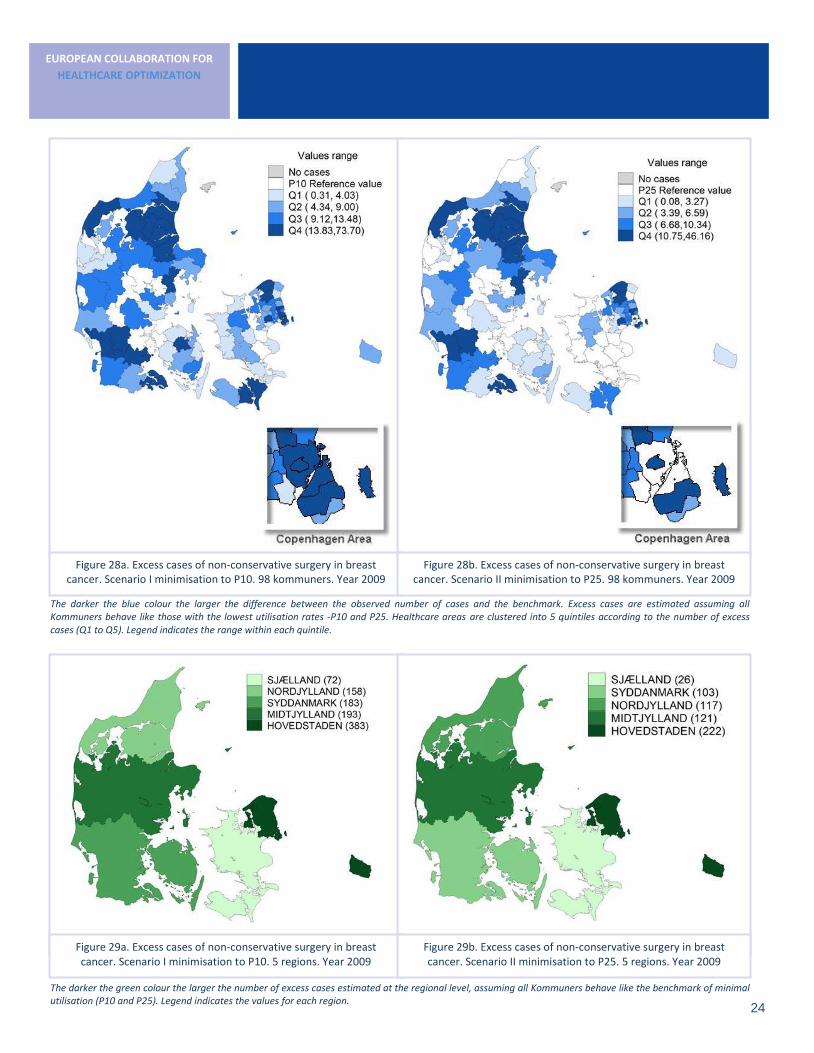
An estimation of the local potential for minimising the utilisation of NCS showed
that, depending on how strict a benchmark was used (Figures 28a and b), there
were between 1 and 74 excess interventions per year, depending on the
kommuner of residence. The same analysis performed at the regional level
(Figures 29a and b) yielded an estimate of 200 to 400 excess NCS lower-value
interventions per year in Hovenstaden, dropping to between 20 and 70 in
Sjaelland.
Figure 27. Age-standardised utilisation rate of non-conservative surgery in breast cancer per 10,000 women. 5 regions. Year 2009
24
EUROPEAN COLLABORATION FOR
HEALTHCARE OPTIMIZATION
Figure 29a. Excess cases of non-conservative surgery in breast cancer. Scenario I minimisation to P10. 5 regions. Year 2009
Figure 29b. Excess cases of non-conservative surgery in breast cancer. Scenario II minimisation to P25. 5 regions. Year 2009
The darker the green colour the larger the number of excess cases estimated at the regional level, assuming all Kommuners behave like the benchmark of minimal utilisation (P10 and P25). Legend indicates the values for each region.
Figure 28a. Excess cases of non-conservative surgery in breast cancer. Scenario I minimisation to P10. 98 kommuners. Year 2009
Figure 28b. Excess cases of non-conservative surgery in breast cancer. Scenario II minimisation to P25. 98 kommuners. Year 2009
The darker the blue colour the larger the difference between the observed number of cases and the benchmark. Excess cases are estimated assuming all Kommuners behave like those with the lowest utilisation rates -P10 and P25. Healthcare areas are clustered into 5 quintiles according to the number of excess cases (Q1 to Q5). Legend indicates the range within each quintile.
25
EUROPEAN COLLABORATION FOR
HEALTHCARE OPTIMIZATION
Prostatectomy in benign prostatic hyperplasia
Open prostatectomy is the oldest surgical method used to treat heavily
symptomatic benign prostatic hyperplasia (BPH). This method is still preferred if
the prostate is very large but, in general terms, has been superseded by less
invasive interventions such as transurethral resection of the prostate (TURP), and
should be considered lower-value care. However, there is growing evidence of
overuse of surgical options (particularly less invasive types) in dealing with BPH
and, in particular, misuse in asymptomatic or minor cases.
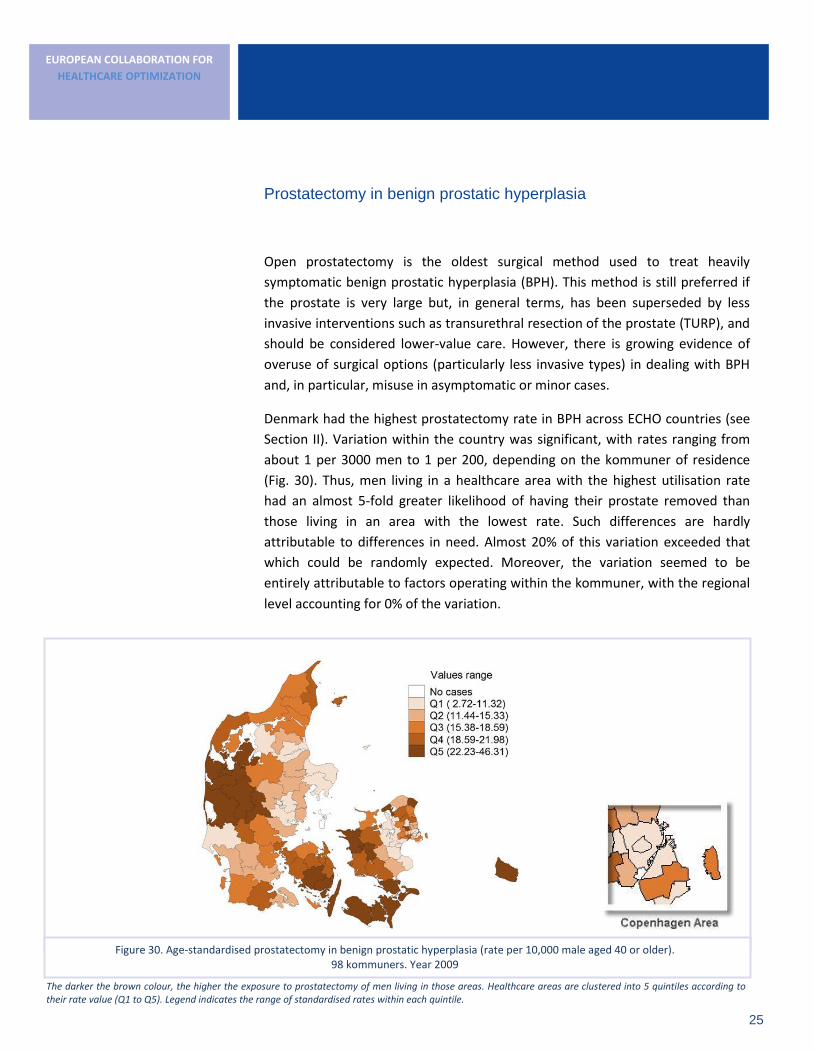
Denmark had the highest prostatectomy rate in BPH across ECHO countries (see
Section II). Variation within the country was significant, with rates ranging from
about 1 per 3000 men to 1 per 200, depending on the kommuner of residence
(Fig. 30). Thus, men living in a healthcare area with the highest utilisation rate
had an almost 5-fold greater likelihood of having their prostate removed than
those living in an area with the lowest rate. Such differences are hardly
attributable to differences in need. Almost 20% of this variation exceeded that
which could be randomly expected. Moreover, the variation seemed to be
entirely attributable to factors operating within the kommuner, with the regional
level accounting for 0% of the variation.
Figure 30. Age-standardised prostatectomy in benign prostatic hyperplasia (rate per 10,000 male aged 40 or older).
98 kommuners. Year 2009
The darker the brown colour, the higher the exposure to prostatectomy of men living in those areas. Healthcare areas are clustered into 5 quintiles according to their rate value (Q1 to Q5). Legend indicates the range of standardised rates within each quintile.
26
EUROPEAN COLLABORATION FOR
HEALTHCARE OPTIMIZATION
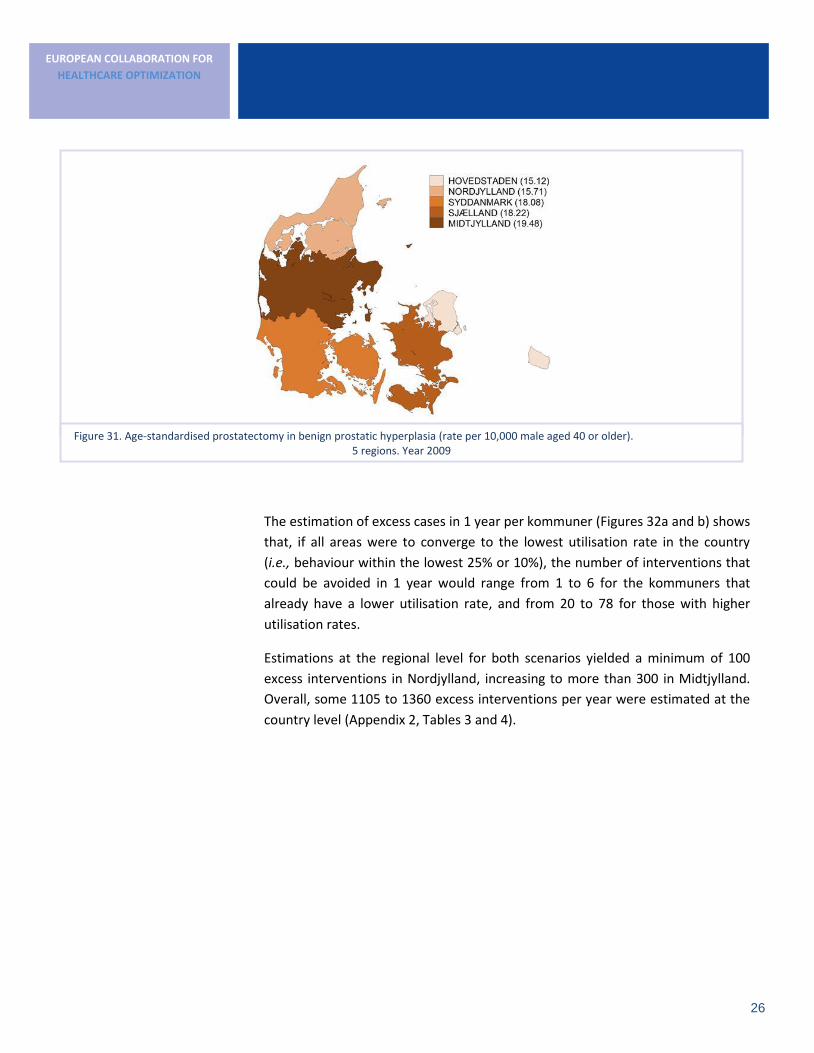
The estimation of excess cases in 1 year per kommuner (Figures 32a and b) shows
that, if all areas were to converge to the lowest utilisation rate in the country
(i.e., behaviour within the lowest 25% or 10%), the number of interventions that
could be avoided in 1 year would range from 1 to 6 for the kommuners that
already have a lower utilisation rate, and from 20 to 78 for those with higher
utilisation rates.
Estimations at the regional level for both scenarios yielded a minimum of 100
excess interventions in Nordjylland, increasing to more than 300 in Midtjylland.
Overall, some 1105 to 1360 excess interventions per year were estimated at the
country level (Appendix 2, Tables 3 and 4).
Figure 31. Age-standardised prostatectomy in benign prostatic hyperplasia (rate per 10,000 male aged 40 or older). 5 regions. Year 2009

27
EUROPEAN COLLABORATION FOR
HEALTHCARE OPTIMIZATION
Figure 37a. Excess cases of prostatectomy in benign prostatic hyperplasia. Scenario I: minimisation to P10. 5 regions. Year 2009
Figure 37b. Excess cases of prostatectomy in benign prostatic hyperplasia. Scenario II: minimisation to P25. 5 regions. Year 2009
The darker the green colour the larger the number of excess cases estimated at the regional level, assuming all Kommuners behave like the benchmark of minimal utilisation (P10 and P25). Legend indicates the values for each region.
Figure 32a. Excess cases of prostatectomy in benign prostatic hyperplasia per kommuner. Scenario I minimisation to P10.
98 kommuners. Year 2009
Figure 32b. Excess cases of prostatectomy in benign prostatic hyperplasia per kommuner. Scenario II minimisation to P25.
98 kommuners. Year 2009
The darker the blue colour the larger the difference between the observed number of cases and the benchmark. Excess cases are estimated assuming all Kommuners behave like those with the lowest utilisation rates -P10 and P25. Healthcare areas are clustered into 5 quintiles according to the number of excess cases (Q1 to Q5). Legend indicates the range within each quintile.

28
EUROPEAN COLLABORATION FOR
HEALTHCARE OPTIMIZATION
IV. EVOLUTION OVER TIME
Between 2002 and 2009, utilisation rates of lower-value care showed different
trends depending on the procedure analysed, but the general feature seems to
be relative stability in rates over the study period (Figures 38 and 39). In some
cases a slight upward trend was observed (C-section in low risk deliveries
increased by 9%), but in most cases we observed modest declines (8% for NC
cancer breast surgery, 10% for non-oncologic hysterectomy). A more substantial
decrease was observed for adeno and/or tonsillectomy (24%), and the most
marked decrease was observed for prostatectomy, with rates of utilisation
almost halving over the period of analysis (although these rates remained the
highest of all ECHO countries) (Appendix 2, Tables 5 to 9).
Systematic variation, on the other hand, only decreased for hysterectomy, and
increased for all lower-value procedures examined, particularly from 2006
onwards. The most dramatic change was observed for prostatectomy: at the
beginning of the study period, 11% of the observed variation across kommuners
exceeded that randomly expected, and by 2009 this had increased to 36%. This
suggests an increasing systematic divergence in the behaviour of individual
kommuners over time.
Graphs in this section provide information on the evolution of the utilisation rate
(blue lines represent the standardised rate) and of the non-random variation
(green dots represent the systematic component of variation) over time.
We should look first at the utilisation trend: an upwards trend indicates an
undesirable progression, regardless of changes in variation. The most desirable
outcome would be a simultaneous decline in utilisation and variation. A decrease
in utilisation concurrent with increased variation indicates more divergence in local
behaviours, i.e., certain populations being systematically more exposed to lower-
value care, which in turn should be followed up with the identification and specific
targeting of healthcare areas that deviate most from the desired minimum
utilisation.
Although LVC utilisation
rates tended to decline
since 2002, the systematic
variation across kommuners
generally increased,
indicating that differences in
local practice across the
country have become more
pronounced

29
EUROPEAN COLLABORATION FOR
HEALTHCARE OPTIMIZATION
Adenotonsillectomy
ASTHMA
Caesarean section in low risk deliveries
0
10
20
30
40
50
2002 2003 2004 2005 2006 2007 2008 2009
Stan
dar
dis
ed
ad
en
oid
ect
om
y an
d
ton
sill
ect
om
y ra
te p
er
10
,00
0 c
hil
dre
n
0
0.2
0.4
0.6
0.8
1
Syst
emat
ic C
ompo
nent
of
Var
iati
on
Adenoidectomy and tonsillectomy utilisation
Systematic variation in adenoidectomy and tonsillectomy utilisation across kommuners
0
10
20
30
40
50
2002 2003 2004 2005 2006 2007 2008 2009
Stan
dar
dis
ed
c-s
ect
ion
in
lo
w r
isk
bir
ths
rate
pe
r
10
,00
0 w
om
en
in
re
pro
du
ctiv
e a
ge
0
0.2
0.4
0.6
0.8
1
Syst
emat
ic C
ompo
nent
of
Var
iati
on
C- section utilisation in low risk births Systematic variation in c- section utilisation across kommuners
Hysterectomy Non conservative surgery in breast cancer
0
6
12
18
24
30
2002 2003 2004 2005 2006 2007 2008 2009Stan
dar
dis
ed
hys
tere
cto
my
rate
pe
r
10
,00
0 w
om
en
0
0.2
0.4
0.6
0.8
1
Syst
emat
ic C
ompo
nent
of
Var
iati
on
Hysterectomy utilisation Systematic variation in hysterectomy utilisation across kommuners
0
2
4
6
8
10
2002 2003 2004 2005 2006 2007 2008 2009
Stan
dar
dis
ed
no
n.c
on
serv
ativ
e s
urg
ery
rate
pe
r 1
0,0
00
wo
me
n
0
0.2
0.4
0.6
0.8
1
Syst
emat
ic C
ompo
nent
of
Var
iati
on
Non conservative surgery in breast cancer
Systematic variation in non-conservative surgery utilisation across kommuners
Prostatectomy in benign prostatic hyperplasia
0
7
14
21
28
35
2002 2003 2004 2005 2006 2007 2008 2009
Stan
dar
dis
ed
pro
stat
ect
om
y ra
te p
er
10
,00
0 m
en
0
0.2
0.4
0.6
0.8
1
Syst
emat
ic C
om
po
nen
t o
f V
aria
tio
n
Prostatectomy in BPH Systematic variation in BPH prostatectomy utilisation across kommuners
Figure 39. Evolution of standardised rates (blue lines) and systematic variation (green dots) over time

30
EUROPEAN COLLABORATION FOR
HEALTHCARE OPTIMIZATION
Individual trends for kommuners at either extreme of the spectrum of
lower-value care utilisation (2002–2009)
The insight obtained by considering overall trends in utilisation rate and
systematic variation can be confirmed by looking at the individual behaviour of
healthcare areas over the period of analysis.
As mentioned above, Danish adenotonsillectomy rates declined slightly while the
systematic component of variation became larger. Figure 40a tracks two
kommuners that ranked as good performers at the beginning of the study period
(among the lowest 20% in the country in terms of rates per 10,000 children, i.e.,
Quintile 1). However, their patterns begin to diverge from 2004 onwards: the
likelihood of undergoing the corresponding intervention increased for children in
one while decreasing for those in the otrer. Despite beginning at the same level
of utilisation, the 2 kommuners end up at opposite extremes of the spectrum in
2009. Figure 40b shows the same phenomenon, but for poor performers, i.e.,
kommuners that began in the uppermost quintile of utilisation in 2002.
The resulting array of bubbles in 2009 shows that about half of the kommuners
that began in Quintile 1 moved up by 1 or 2 quintiles. Conversely, most of those
that began in the upper utilisation level remained in this position.
For C-section in low-risk births, the majority of those kommuners that began in
the lowermost quintile moved up 1 or 2 quintiles, while those that began in the
uppermost quintile often moved downwards to any one of the 5 potential
quintiles.
Besides the specific examples of change in intensity of lower-value care use, it is
also important to consider the spread of bubbles in 2009. Since all began in the
same utilisation quintile in 2002, the variety of colours they have acquired by the
final year (one for each quintile of utilisation intensity) provides an idea of how
homogeneous and established the medical practice underlying the observed rate of
utilisation is, both over time and across kommuners.

31
EUROPEAN COLLABORATION FOR
HEALTHCARE OPTIMIZATION
Figure 40a. Trends in adenotonsillectomy. Q1 Figure 40b. Trends in adenotonsillectomy. Q5
Figure 41a. Trends in C-section in low risk deliveries. Q1 Figure 41b. Trends in C-section in low risk deliveries. Q5
Figure 42a. Trends in non-conservative cancer breast surgery. Q1
Figure 42b. Trends in non-conservative cancer breast surgery. Q5
All figures chart standardised utilisation rates per 10,000 inhabitants overtime (in years). Bubbles represent individual kommuners; size is proportional to population size. Colours reflect the utilisation ranking: Q5 corresponds to the highest quintile of utilisation, and Q1 the lowest. Changes in colour over time reflect changes in the relative intensity of use compared with other kommuners(quintile of utilisation). The absolute value of the standardized rate each year is indicated on the y-axis. The array of bubbles for 2009 reflects only kommuners that were in Q1 or Q5 in 2002.

32
EUROPEAN COLLABORATION FOR
HEALTHCARE OPTIMIZATION
The same pattern was observed for rates of NCS in breast cancer at either
extreme of the utilisation spectrum; by the end of the study period these
kommuners had moved to positions throughout the entire spectrum of
utilization.
Kommuners with rates of hysterectomy utilisation in non-oncologic conditions at
either extreme of the utilisation spectrum at the beginning of the period tended
to lie in the same position in 2009.
Overall, the rate of prostatectomy in BPH almost halved over the course of the
study, while systematic variation increased by 3-fold. The group of kommuners
that began in Quintile 1 in 2002 moved to occupy positions covering entire
spectrum of utilization by 2009. However, those that began in Quintile 5 in 2002
tended to remain in this position, with few exceptions (Figures 44a and 44b)
Figure 43a. Trends in hysterectomy (non-oncologic). Q1 Figure 43b. Trends hysterectomy (non-oncologic). Q5
Figure 44a. Trends in Prostatectomy in benign prostate
hyperplasia. Q1
Figure 44b. Trends in Prostatectomy in benign prostate
hyperplasia. Q5
All figures chart standardised utilisation rates per 10,000 inhabitants overtime (in years). Bubbles represent individual kommuners; size is proportional to population size. Colours reflect the utilisation ranking: Q5 corresponds to the highest quintile of utilisation, and Q1 the lowest. Changes in colour over time reflect changes in the relative intensity of use compared with other kommuners(quintile of utilisation). The absolute value of the standardized rate each year is indicated on the y-axis. The array of bubbles for 2009 reflects only kommuners that were in Q1 or Q5 in 2002.
33
EUROPEAN COLLABORATION FOR
HEALTHCARE OPTIMIZATION
V. SOCIAL GRADIENT
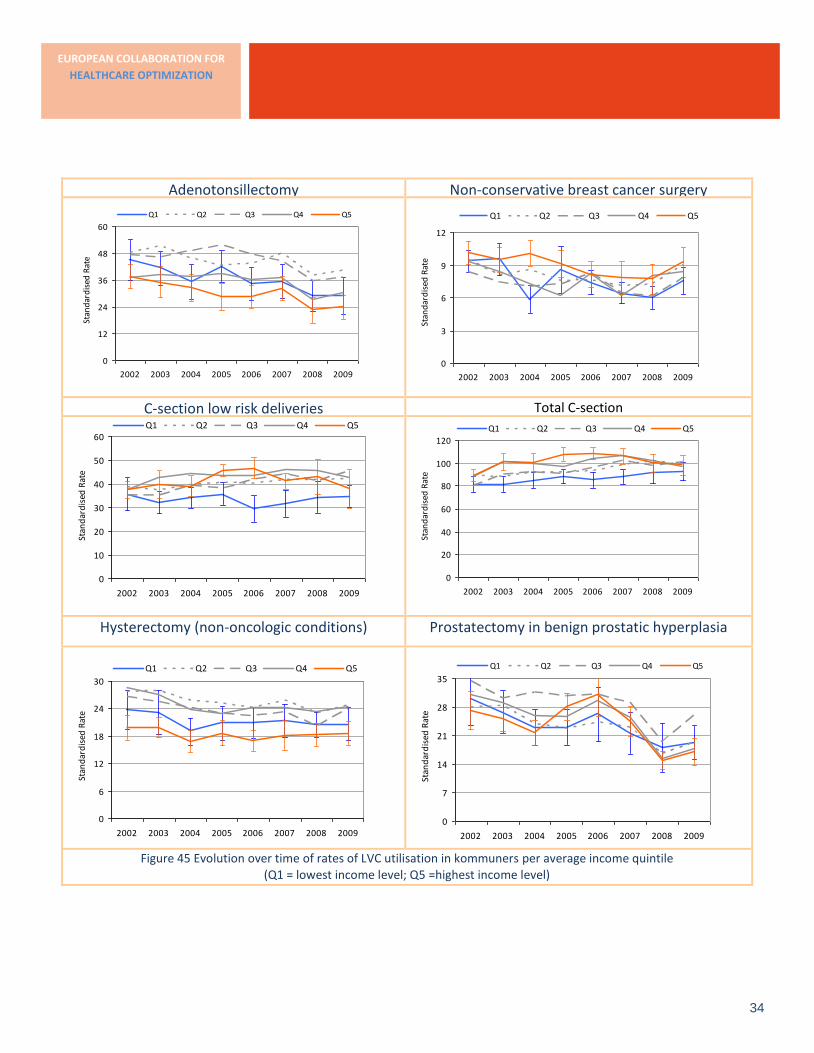
The distribution of lower-value care utilisation was quite homogeneous across
different kommuner when broken down according to income level. The only
exception was rates of C-section (both total rates and those for low risk cases),
which increased in wealthier areas. However, utilisation rates appeared to
converge over the period of analysis: while C-section rates decreased slightly in
wealthier areas, they increased substantially in the most deprived areas, until
similar utilisation rates were observed by at both extremes by 2008.
A similar pattern was observed for NCS in breast cancer, with higher rates in
more affluent areas, although significant differences were only observed for
2004.
For prostatectomy in BPH, differences in rates across income levels were never
significant. However, the trends at both extremes of the income spectrum
switched relative positions over the duration of the study. The point at which
rates are highest for all income levels, 2005-2006, coincides with the highest
exposure of more affluent areas. When utilisation starts to decline it does it so
most noticeably for the higher income levels, leaving the lowest income levels
with the highest utilisation rates.
An opposite pattern was observed for children’s exposure to adenotonsillectomy
and women’s exposure to hysterectomy for non-oncologic conditions. Although
these patterns were stable over time, the differences were not statistically
significant at any point.
LVC utilisation rates were compared across kommuners clustered into quintiles according to average income level. Each line in the graphs corresponds to one of these quintiles.
The wider the gap between most and least affluent quintiles, the more inequitably distributed the exposure to low-value care. These gaps can widen, narrow or remain stable over time.
In addition to the relative position of the lines over time, it is important to keep track of the 95% confidence intervals (whiskers drawn around annual rate) for Quintiles 1 and 5. Statistically significant differences between wealthiest and most deprived kommuners only occur where no overlap is observed.
The most desirable pattern is an absence of statistically significant differences attributable to wealth across kommuners. In cases where differences are observed, the desirable trend is a progressive narrowing of the gap until it eventually disappears.
However, given the nature of the type of care examined, attention should be paid to the direction of convergence. The most desirable progression should minimise lower-value care provision at all income levels. Horizontal equity at high levels of lower-value care utilisation can hardly be considered an indicator of good performance.
Only rates of C-section
differed significantly
between better and worse-
off areas. This difference
was consistent over time;
for most of the study period
the rate was significantly
higher in wealthier
kommuners, although by
2008 deprived areas had
already caught up.
34
EUROPEAN COLLABORATION FOR
HEALTHCARE OPTIMIZATION
Adenotonsillectomy Non-conservative breast cancer surgery
0
12
24
36
48
60
2002 2003 2004 2005 2006 2007 2008 2009
Stan
dar
dis
ed R
ate
Q1 Q2 Q3 Q4 Q5
0
3
6
9
12
2002 2003 2004 2005 2006 2007 2008 2009
Stan
dar
dis
ed R
ate
Q1 Q2 Q3 Q4 Q5
C-section low risk deliveries Total C-section DENMARK C-SECTION IN LOW RISK BIRTHS
0
10
20
30
40
50
60
2002 2003 2004 2005 2006 2007 2008 2009
Stan
dar
dis
ed R
ate
Q1 Q2 Q3 Q4 Q5
DENMARK C-SECTION
0
20
40
60
80
100
120
2002 2003 2004 2005 2006 2007 2008 2009
Stan
dar
dis
ed R
ate
Q1 Q2 Q3 Q4 Q5
Hysterectomy (non-oncologic conditions) Prostatectomy in benign prostatic hyperplasia
0
6
12
18
24
30
2002 2003 2004 2005 2006 2007 2008 2009
Stan
dar
dis
ed R
ate
Q1 Q2 Q3 Q4 Q5
0
7
14
21
28
35
2002 2003 2004 2005 2006 2007 2008 2009
Stan
dar
dis
ed R
ate
Q1 Q2 Q3 Q4 Q5
Figure 45 Evolution over time of rates of LVC utilisation in kommuners per average income quintile
(Q1 = lowest income level; Q5 =highest income level)

35
EUROPEAN COLLABORATION FOR
HEALTHCARE OPTIMIZATION
VI. POLICY IMPLICATIONS
The conceptual framing of the analysis presented above is relatively simple:
utilisation of lower-value care is associated with a loss of value-for-money in the
health system (allocation of resources that leads to lower quality and safety of
care, i.e., inefficiency). Typically, these phenomena occur at the local level,
resulting in differential exposure or access to services depending on the place of
residence (often described as the “post-code lottery”).
The analysis yields two types of knowledge that are useful for action: on the one
hand, it quantifies the magnitude of the problem, contrasting it with other
relevant European countries, and on the other, it actually identifies areas within
the country with the greatest potential for realignment towards value-based
provision of care on the basis of national benchmarks (which are less prone to
cultural and organisational biases, and thus relevant to this cluster of care).
The two scenarios of minimising LVC use are somewhat arbitrary. They are only
intended to provide a reasonable indication of the potential for improvement on
the basis that, when it comes to lower-value care, the lesser the better. Overall,
minimisation of the use of the 5 LVC procedures analysed here would eliminate
6700 excess interventions per year according to the conservative scenario and
8300 according to the drastic scenario. These estimates are summarised in the
following table:
Estimated excess interventions in a year
LVC procedures Conservative P25 Drastic P10
Adeno and/or tonsillectomy 1707 2199
C-section in LRD 1592 1984
Hysterectomy (non-oncologic) 1651 1752
NC breast cancer surgery 639 993
Prostatectomy BPH 1105 1360
Total 6694 8288
Policy-wise, the key lies in understanding the situation in outlying healthcare
areas in order to then appropriately tailor any intervention aimed at limiting the
use of lower-value care. Factors that have been often proposed to underpin
these phenomena and maybe worth analysing in Denmark include:

36
EUROPEAN COLLABORATION FOR
HEALTHCARE OPTIMIZATION
• Local schools of practice that lead to well established clinical styles that
may involve lower-value care. Learning cascades and the leadership of
prestige figures play a paramount role here.
• Existing clinical guidelines/protocols, both local and regional. These could
exert influence in two opposite directions: :
1. Perfectly adequate guidelines may have no impact on clinical practice
if they are not binding and/or the general perception is that they lack
legitimacy in daily practice. This can occur because the
recommended courses of action are not locally available (no
contextualising effort is acknowledged) or simply because
professionals feel excluded from the application of these practices,
and thus do not accept them as relevant.
2. Local protocols of care for certain conditions may have been adapted
due to limited availability of cost-effective conservative alternatives,
consolidating certain practice styles. Such alternatives often involve
more intense follow-up and consultation and/or co-adjuvant
therapies, which may be more difficult to implement in certain
settings, such as in dispersed populations, which entail considerable
travel costs, both direct and indirect.
The lack of clinical guidelines has also been reported to foster the
utilisation of low-value care. In October 2007, an agreement between the
government and Danish Regions on the implementation of integrated
cancer pathways was reached1. The binding integrated cancer pathways
were developed as organizational and clinical standards for the diagnosis
and treatment for most types of cancer. They were fully implemented by
January 2009. Prostatectomy, breast surgery and hysterectomy are
typical cancer-related interventions. Although the indications examined
in this report are inappropriate, the wide straightening of their adequate
indications within the pathways’ implementation may have had a positive
spill-over effect, decreasing lower-value utilisation. Unfortunately, they
were only fully implemented by the end of our period of analysis, in
2009. Extending the analysis to the following years will help to better
assess this hypothesis
1 All background information on Danish Health System can be consulted at European
Observatory of Health Systems and policy platform: Health Systems Policy Monitor
http://www.hspm.org/countries/denmark27012013/countrypage.aspx
37
EUROPEAN COLLABORATION FOR
HEALTHCARE OPTIMIZATION
The analysis conducted suggests that there is room to enhance value for money in the Danish system.
Although utilisation rates remained generally larger than those of other ECHO countries, LVC use tended to decrease over the period of analysis, with the exception of C-section. The main driver resided at the local level. A focus on local practices, particularly learning cascades and established medical practice styles, and informing and empowering patients to facilitate decision-making could potentially have a major impact.
Further analysis of institutional factors underlying overuse of LVC at the kommuner level, and of social, organisational and budgetary local contexts, will serve as the basis for developing recommendations to guide relevant decision makers in enhancing allocative efficiency.
The goal here is not to generate savings, but rather to foster “value for money”, i.e., to avoid non-efficient public expenditure.
• This report is restricted to publicly-funded activity, regardless the nature
of the provider. Private providers have been shown to be more likely to
provide lower-value care, particularly when the structure of payments is
activity-based and the profit derived from surgery exceeds that attached
to more conservative options. The “extended free choice” of hospital
introduced in Denmark in 2002 may have contributed to the increase in
the share of activity conducted under those schemes (440,000 patients
are reported to have used it since its inception). How evenly distributed
the option is across territory and types of procedures may have partly
influenced some of the results presented in this report.
• Since all procedures analysed can be considered “elective” types of
surgery, patient’s preferences may be very relevant. The choice or
acceptance of lower-value care may stem from insufficient, and even
inadequate, information about consequences and alternative courses of
action. Such misinformation has been frequently reported, particularly in
relation to prostatectomy and C-section. Patient empowerment and
adequate exposure to complete information may help change to change
patient views.
• Other factor proposed to influence local use of lower-value care include
the characteristics of supply: local capacity (total beds, share of surgeons
over medical staff, tertiarity and teaching) as well as propensity to
perform surgery (total volume of surgical procedures and share over total
discharges, surgical length of stay).
38
EUROPEAN COLLABORATION FOR
HEALTHCARE OPTIMIZATION
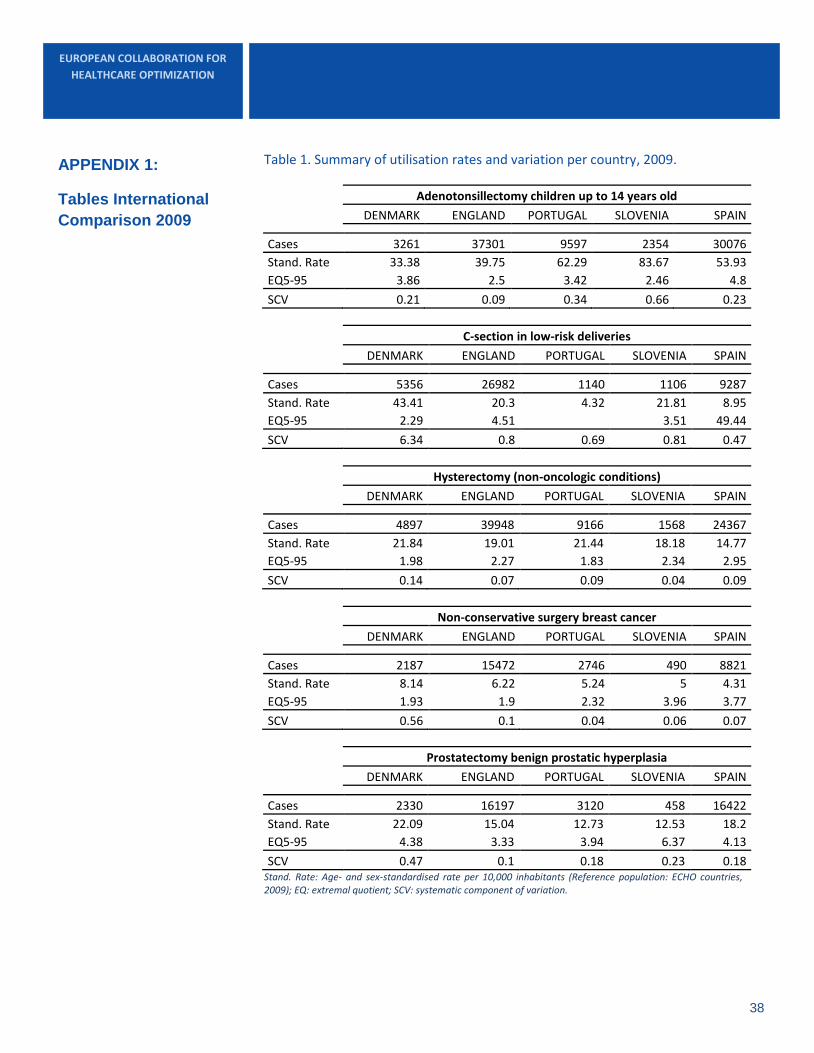
Table 1. Summary of utilisation rates and variation per country, 2009.
Adenotonsillectomy children up to 14 years old
DENMARK ENGLAND PORTUGAL SLOVENIA SPAIN
Cases 3261 37301 9597 2354 30076
Stand. Rate 33.38 39.75 62.29 83.67 53.93
EQ5-95 3.86 2.5 3.42 2.46 4.8
SCV 0.21 0.09 0.34 0.66 0.23
C-section in low-risk deliveries
DENMARK ENGLAND PORTUGAL SLOVENIA SPAIN
Cases 5356 26982 1140 1106 9287
Stand. Rate 43.41 20.3 4.32 21.81 8.95
EQ5-95 2.29 4.51 3.51 49.44
SCV 6.34 0.8 0.69 0.81 0.47
Hysterectomy (non-oncologic conditions)
DENMARK ENGLAND PORTUGAL SLOVENIA SPAIN
Cases 4897 39948 9166 1568 24367
Stand. Rate 21.84 19.01 21.44 18.18 14.77
EQ5-95 1.98 2.27 1.83 2.34 2.95
SCV 0.14 0.07 0.09 0.04 0.09
Non-conservative surgery breast cancer
DENMARK ENGLAND PORTUGAL SLOVENIA SPAIN
Cases 2187 15472 2746 490 8821
Stand. Rate 8.14 6.22 5.24 5 4.31
EQ5-95 1.93 1.9 2.32 3.96 3.77
SCV 0.56 0.1 0.04 0.06 0.07
Prostatectomy benign prostatic hyperplasia
DENMARK ENGLAND PORTUGAL SLOVENIA SPAIN
Cases 2330 16197 3120 458 16422
Stand. Rate 22.09 15.04 12.73 12.53 18.2
EQ5-95 4.38 3.33 3.94 6.37 4.13
SCV 0.47 0.1 0.18 0.23 0.18 Stand. Rate: Age- and sex-standardised rate per 10,000 inhabitants (Reference population: ECHO countries, 2009); EQ: extremal quotient; SCV: systematic component of variation.
APPENDIX 1:
Tables International
Comparison 2009
39
EUROPEAN COLLABORATION FOR
HEALTHCARE OPTIMIZATION
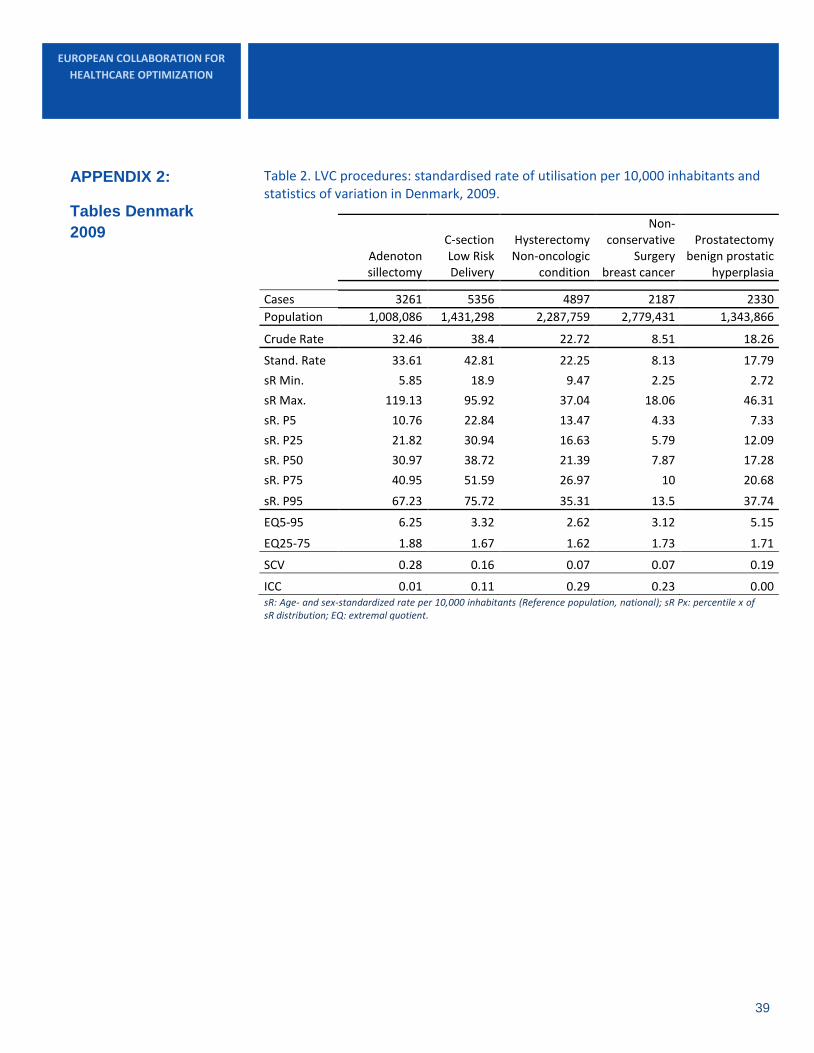
Table 2. LVC procedures: standardised rate of utilisation per 10,000 inhabitants and statistics of variation in Denmark, 2009.
sR: Age- and sex-standardized rate per 10,000 inhabitants (Reference population, national); sR Px: percentile x of sR distribution; EQ: extremal quotient.
Adenoton sillectomy
C-section Low Risk Delivery
Hysterectomy Non-oncologic
condition
Non-conservative
Surgery breast cancer
Prostatectomy benign prostatic
hyperplasia
Cases 3261 5356 4897 2187 2330
Population 1,008,086 1,431,298 2,287,759 2,779,431 1,343,866
Crude Rate 32.46 38.4 22.72 8.51 18.26
Stand. Rate 33.61 42.81 22.25 8.13 17.79
sR Min. 5.85 18.9 9.47 2.25 2.72
sR Max. 119.13 95.92 37.04 18.06 46.31
sR. P5 10.76 22.84 13.47 4.33 7.33
sR. P25 21.82 30.94 16.63 5.79 12.09
sR. P50 30.97 38.72 21.39 7.87 17.28
sR. P75 40.95 51.59 26.97 10 20.68
sR. P95 67.23 75.72 35.31 13.5 37.74
EQ5-95 6.25 3.32 2.62 3.12 5.15
EQ25-75 1.88 1.67 1.62 1.73 1.71
SCV 0.28 0.16 0.07 0.07 0.19
ICC 0.01 0.11 0.29 0.23 0.00
APPENDIX 2:
Tables Denmark
2009
40
EUROPEAN COLLABORATION FOR
HEALTHCARE OPTIMIZATION
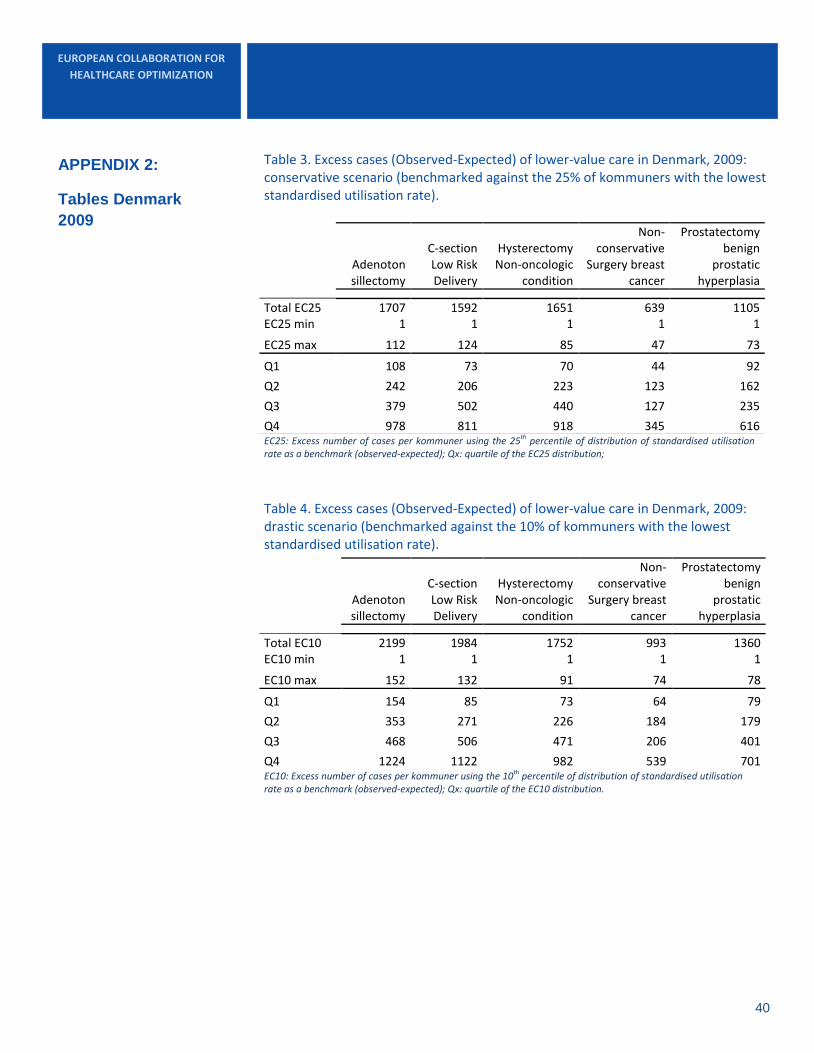
Table 3. Excess cases (Observed-Expected) of lower-value care in Denmark, 2009: conservative scenario (benchmarked against the 25% of kommuners with the lowest standardised utilisation rate).
EC25: Excess number of cases per kommuner using the 25th percentile of distribution of standardised utilisation rate as a benchmark (observed-expected); Qx: quartile of the EC25 distribution;
Table 4. Excess cases (Observed-Expected) of lower-value care in Denmark, 2009: drastic scenario (benchmarked against the 10% of kommuners with the lowest standardised utilisation rate).
EC10: Excess number of cases per kommuner using the 10th percentile of distribution of standardised utilisation rate as a benchmark (observed-expected); Qx: quartile of the EC10 distribution.
Adenoton sillectomy
C-section Low Risk Delivery
Hysterectomy Non-oncologic
condition
Non-conservative
Surgery breast cancer
Prostatectomy benign
prostatic hyperplasia
Total EC25 1707 1592 1651 639 1105 EC25 min 1 1 1 1 1
EC25 max 112 124 85 47 73
Q1 108 73 70 44 92
Q2 242 206 223 123 162
Q3 379 502 440 127 235
Q4 978 811 918 345 616
Adenoton sillectomy
C-section Low Risk Delivery
Hysterectomy Non-oncologic
condition
Non-conservative
Surgery breast cancer
Prostatectomy benign
prostatic hyperplasia
Total EC10 2199 1984 1752 993 1360 EC10 min 1 1 1 1 1
EC10 max 152 132 91 74 78
Q1 154 85 73 64 79
Q2 353 271 226 184 179
Q3 468 506 471 206 401
Q4 1224 1122 982 539 701
APPENDIX 2:
Tables Denmark
2009

41
EUROPEAN COLLABORATION FOR
HEALTHCARE OPTIMIZATION
Table 5
sR: Age- and sex-standardised rate per 10,000 inhabitants (Reference population: national, 2002); sR Qx:
quintile of sR distribution; SCV: systematic component of variation.
Table 6
sR: Age- and sex-standardised rate per 10,000 inhabitants (Reference population: national, 2002); sR Qx:
quintile of sR distribution; SCV: systematic component of variation.
Table 7
sR: Age- and sex-standardised rate per 10,000 inhabitants (Reference population: national, 2002); sR Qx: quintile
of sR distribution; SCV: systematic component of variation.
Adenotonsillectomy
2002 2003 2004 2005 2006 2007 2008 2009
Cases 4221 4217 3986 3967 3796 3973 3043 3261
Stand. Rate 43.1 43 40.93 40.82 38.47 39.86 30.88 32.88
sR Q1. 45.09 41.29 35.26 42.12 34.41 35.44 29.14 29.13
sR Q5. 37.58 34.96 32.57 28.32 28.51 32.27 22.63 23.99
SCV 0.12 0.15 0.13 0.18 0.13 0.14 0.23 0.23
C-section Low Risk Delivery
2002 2003 2004 2005 2006 2007 2008 2009
Cases 5102 4931 5444 5287 5447 5502 5358 5356
Stand. Rate 37.3 37.45 39.31 40.74 41.05 41.38 41.64 40.57
sR Q1. 35.76 32.10 34.02 35.69 29.48 31.78 34.33 34.72
sR Q5. 37.35 39.75 39.15 45.62 46.58 41.11 43.02 37.92
SCV 0.08 0.08 0.07 0.06 0.07 0.09 0.1 0.14
Hysterectomy (non-oncologic) condition
2002 2003 2004 2005 2006 2007 2008 2009
Cases 5611 5401 4896 4854 4756 4891 4545 4897
Stand. Rate 25.34 24.74 21.99 22.15 21.77 22.59 21.11 22.7
sR Q1. 23.75 23.15 19.01 20.91 20.83 21.39 20.55 20.59
sR Q5. 19.79 19.87 16.85 18.65 16.94 18.09 18.32 18.67
SCV 0.09 0.09 0.07 0.07 0.09 0.08 0.05 0.07
APPENDIX 2:
Tables Denmark
Evolution over time
2002-2009

42
EUROPEAN COLLABORATION FOR
HEALTHCARE OPTIMIZATION
Table 8
sR: Age- and sex-standardised rate per 10,000 inhabitants (Reference population: national, 2002); sR Qx:
quintile of sR distribution; SCV: systematic component of variation.
Table 9
sR: Age- and sex-standardised rate per 10,000 inhabitants (Reference population: national, 2002); sR Qx:
quintile of sR distribution; SCV: systematic component of variation.
Non-conservativeSurgery breast cancer
2002 2003 2004 2005 2006 2007 2008 2009
Cases 2563 2320 2146 2052 2083 1901 1900 2187
Stand. Rate 9.32 8.59 7.92 7.88 7.93 6.87 7.11 8.51
sR Q1. 9.33 9.54 5.87 8.56 7.42 6.42 6.01 7.55
sR Q5. 10.16 9.50 10.08 9.09 8.14 7.82 7.71 9.28
SCV -0.02 0.02 0.04 0.06 0.01 0.03 0.05 0.09
Prostatectomy benign prostatic hyperplasia
2002 2003 2004 2005 2006 2007 2008 2009
Cases 3483 3275 750 607 2698 2332 1624 1900
Stand. Rate 30.14 27.81 6.94 5.55 23.39 20.21 13.96 16.28
sR Q1. 29.99 26.77 22.99 23.00 26.27 21.52 18.07 19.35
sR Q5. 27.12 25.09 21.75 28.11 30.99 24.44 14.93 16.96
SCV 0.11 0.08 0.83 0.38 0.2 0.27 0.16 0.36
APPENDIX 2:
Tables Denmark
Evolution over time
2002-2009

43
EUROPEAN COLLABORATION FOR
HEALTHCARE OPTIMIZATION
Utilisation of lower-value care is measured using geographical indicators within the ECHO performance model.
This has certain implications both for methodology and the interpretation of results. This report is based on ecological analyses; data aggregated at a certain geographical level serves as the unit of analysis for this report. Thus, correct interpretation of the findings provides an indication of the risk of exposure to avoidable hospitalisations of the population living in a certain area (as opposed to the risk of an individual patient).
Main endpoints:
This report maps out standardised utilisation rates per geographical area. As a summary measure of variation, the report includes the classical statistics Ratio of Variation between extremes and Component of Systematic Variation. The other variable consistently mapped out throughout the report is the number of excess cases per area in two different scenarios in which utilisation is minimised.
Where burden of disease or activity calibrators were available, the report also includes the corresponding standardised utilization rates and ratios.
Instruments:
As this is an ecological study, each admission was allocated to the place of residence of the patient, which in turn was linked to a meaningful geographic unit; the 98 kommuners and the 5 Regions comprising the Danish National Health System.
The operational definitions for each indicator are detailed in the coding table in Appendix 4. The indicators used are based on those in use in the international arena, as proposed by AHRQ and OECD. For the analysis of variation across countries indicators were subjected to a construct validity process developed by the Atlas VPM project in Spain. Furthermore, as part of a task within the ECHO project, cross-walks across different diseases and procedure classifications were constructed in order to face-validate the indicators used.
This report is based on the hospital admissions registered in the National Discharges Dataset (Ministeriet Sunhed Forebyggelse). Cross- and in-country sections were built based on 2009 discharge data, whereas time-trends and social gradient analyses used data from the period 2002-2009.
Social gradient data were obtained from the National Statistics office (Danmarks Statistik Statistikbanken) and data for kommuners on average family annual income (both based on transfer and available income) was obtained from the Statistikbanken.
APPENDIX 3:
Technical note

44
EUROPEAN COLLABORATION FOR
HEALTHCARE OPTIMIZATION
Diagnosis (ICD10) and Procedures (Nomesco) Codes
Primary diagnosis Secondary diagnosis2-30 Procedures
Inclusions Exclusions Inclusions Exclusions Inclusions Exclusions
Non-conservative surgery in breast cancer Women
C50 D05 Z85.3 HAC15 HAC20 HAC25
Prostatectomy in prostate cancer
Male population aged 40 or older
C61 D07.5 D09.9 D40.0
KEC KED KEW
Prostatectomy in benign prostatic hyperplasia
Male population aged 40 or older
N40 D29.1 KEC KED KEW
Births with complications (CB)
Women Aged between 15 and 55
O44 O45 O46 O47 O48 O11 O14 O15 O23 O300 O301 O302 O308 O32 O34 O43 O364 O362 O420 O756 O611 O610 O753 O321 O648 O345 O640 O660 O661 O664 O665 O658 O669 O632 O690 O691 O710 O711 O713 O290 O291 O750 O751 O830 O291 O987 O641
O44 O45 O46 O47 O48 O11 O14 O15 O23 O300 O301 O302 O308 O32 O34 O43 O364 O362 O420 O756 O611 O610 O753 O321 O648 O345 O640 O660 O661 O664 O665 O658 O669 O632 O690 O691 O710 O711 O713 O290 O291 O750 O751 O830 O291 O987 O641
APPENDIX 4:
Definitions of
indicators
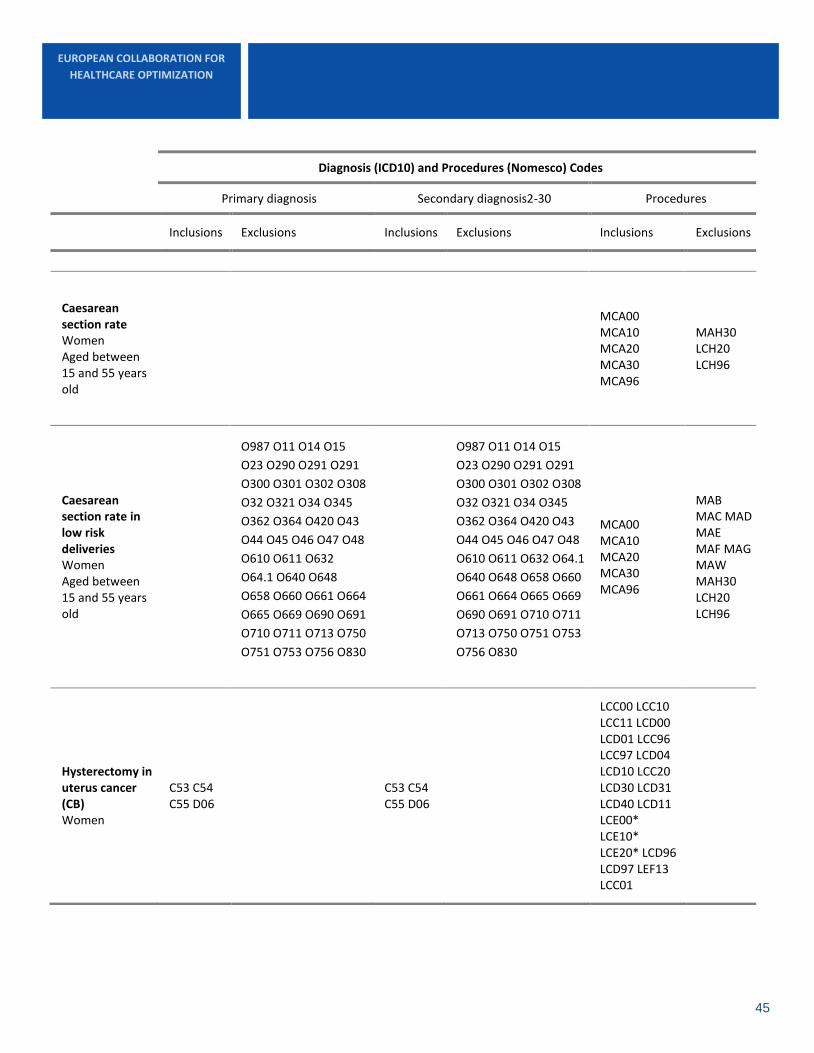
45
EUROPEAN COLLABORATION FOR
HEALTHCARE OPTIMIZATION
Diagnosis (ICD10) and Procedures (Nomesco) Codes
Primary diagnosis Secondary diagnosis2-30 Procedures
Inclusions Exclusions Inclusions Exclusions Inclusions Exclusions
Caesarean section rate Women Aged between 15 and 55 years old
MCA00 MCA10 MCA20 MCA30 MCA96
MAH30 LCH20 LCH96
Caesarean section rate in low risk deliveries Women Aged between 15 and 55 years old
O987 O11 O14 O15
O23 O290 O291 O291
O300 O301 O302 O308
O32 O321 O34 O345
O362 O364 O420 O43
O44 O45 O46 O47 O48
O610 O611 O632
O64.1 O640 O648
O658 O660 O661 O664
O665 O669 O690 O691
O710 O711 O713 O750
O751 O753 O756 O830
O987 O11 O14 O15
O23 O290 O291 O291
O300 O301 O302 O308
O32 O321 O34 O345
O362 O364 O420 O43
O44 O45 O46 O47 O48
O610 O611 O632 O64.1
O640 O648 O658 O660
O661 O664 O665 O669
O690 O691 O710 O711
O713 O750 O751 O753
O756 O830
MCA00 MCA10 MCA20 MCA30 MCA96
MAB MAC MAD MAE MAF MAG MAW MAH30 LCH20 LCH96
Hysterectomy in uterus cancer (CB) Women
C53 C54 C55 D06
C53 C54 C55 D06
LCC00 LCC10 LCC11 LCD00 LCD01 LCC96 LCC97 LCD04 LCD10 LCC20 LCD30 LCD31 LCD40 LCD11 LCE00* LCE10* LCE20* LCD96 LCD97 LEF13 LCC01

46
EUROPEAN COLLABORATION FOR
HEALTHCARE OPTIMIZATION
Diagnosis (ICD10) and Procedures (Nomesco) Codes
Primary diagnosis Secondary diagnosis2-30 Procedures
Inclusions Exclusions Inclusions Exclusions Inclusions Exclusions
Hysterectomy without uterus cancer diagnosis
Women Aged 18 or older
Cancer in female genital organs or uterus. Abdominal trauma (Appendix 7) O00-O99
Cancer in female genital organs or uterus. Abdominal trauma (Appendix 7) O00-O99
LCC00 LCC10 LCC11 LCC20 LCC96 LCC97 LCD00 LCD01 LCD04 LCD10 LCD11 LCD30 LCD31 LCD40 LCD96 LCD97 LCE LEF13 MCA33
Adenoidectomy and/or Tonsillectomy Population Aged 14 and younger
EMB20 EMB30 EMB99 EMB00 EMB10 EMB15 EMW99