lss.fnal.govlss.fnal.gov/archive/2011/conf/fermilab-conf-11-922-ad-ae-cd-td.pdf · 32dn...
TRANSCRIPT

32ND INTERNATIONAL COSMIC RAY CONFERENCE, BEIJING 2011
The Pierre Auger Observatory III: Other Astrophysi-cal Observations
THE PIERRE AUGER COLLABORATION
Observatorio Pierre Auger, Av. San Martın Norte 304, 5613 Malargue, Argentina
1 Anisotropies and Chemical Composition of Ultra-High Energy Cosmic Rays Using Arrival DirectionsMeasured by the Pierre Auger Observatorypresented by Edivaldo M. Santos 1
2 Bounds on the density of sources of ultra high energy cosmic rays from Pierre Auger Observatory datapresented by Manlio De Domenico 5
3 Search for energy-position correlated multiplets in Pierre Auger Observatory datapresented by Geraldina Golup 9
4 Search for Galactic point-sources of EeV neutronspresented by Benjamin Rouille d’Orfeuil 13
5 An update on a search for ultra-high energy photons using the Pierre Auger Observatorypresented by Mariangela Settimo 17
6 The Pierre Auger Observatory and ultra-high energy neutrinos: upper limits to the diffuse and pointsource fluxespresented by Yann Guardincerri 21
7 Analysis of the modulation in the first harmonic of the right ascension distribution of cosmic rays detectedat the Pierre Auger Observatorypresented by Haris Lyberis 25
8 Influence of geomagnetic effects on large scale anisotropy searchespresented by Moritz Munchmeyer 29
9 Measurement of Energy-Energy-Correlations with the Pierre Auger Observatorypresented by Peter Schiffer 33
10 Back-tracking studies of the arrival directions of UHECR detected by the Pierre Auger Observatorypresented by Michael S. Sutherland 37
11 Measurement of Low Energy Cosmic Radiation with the Water Cherenkov Detector Array of the PierreAuger Observatorypresented by Hernan Asorey 41
FERMILAB-CONF-11-922-AD-AE-CD-TD
Operated by Fermi Research Alliance, LLC under Contract No. DE-AC02-07CH11359 with the United States Department of Energy

32ND INTERNATIONAL COSMIC RAY CONFERENCE, BEIJING 2011
The Pierre Auger Collaboration
P. ABREU74 , M. AGLIETTA57, E.J. AHN93, I.F.M. ALBUQUERQUE19 , D. ALLARD33, I. ALLEKOTTE1,J. ALLEN96, P. ALLISON98, J. ALVAREZ CASTILLO67 , J. ALVAREZ-MUNIZ84, M. AMBROSIO50 , A. AMINAEI 68 ,L. A NCHORDOQUI109 , S. ANDRINGA74 , T. ANTICIC27 , A. ANZALONE56, C. ARAMO50 , E. ARGANDA81 ,F. ARQUEROS81 , H. ASOREY1 , P. ASSIS74 , J. AUBLIN35 , M. AVE41, M. AVENIER36, G. AVILA 12, T. BACKER45 ,M. BALZER40 , K.B. BARBER13 , A.F. BARBOSA16 , R. BARDENET34 , S.L.C. BARROSO22 , B. BAUGHMAN98 ,J. BAUML 39 , J.J. BEATTY98, B.R. BECKER106 , K.H. BECKER38 , A. BELLETOILE37, J.A. BELLIDO13,S. BENZVI108 , C. BERAT36, X. BERTOU1 , P.L. BIERMANN42 , P. BILLOIR35 , F. BLANCO81 , M. BLANCO82 ,C. BLEVE38, H. BLUMER41, 39, M. BOHACOVA29, 101 , D. BONCIOLI51 , C. BONIFAZI25, 35 , R. BONINO57 ,N. BORODAI72 , J. BRACK91 , P. BROGUEIRA74 , W.C. BROWN92 , R. BRUIJN87 , P. BUCHHOLZ45 , A. BUENO83 ,R.E. BURTON89 , K.S. CABALLERO-MORA99 , L. CARAMETE42, R. CARUSO52 , A. CASTELLINA57, O. CATALANO 56,G. CATALDI 49, L. CAZON74 , R. CESTER53, J. CHAUVIN 36 , S.H. CHENG99 , A. CHIAVASSA57 , J.A. CHINELLATO20,A. CHOU93, 96, J. CHUDOBA29 , R.W. CLAY 13 , M.R. COLUCCIA49 , R. CONCEICAO74 , F. CONTRERAS11 , H. COOK87 ,M.J. COOPER13 , J. COPPENS68, 70, A. CORDIER34 , U. COTTI66 , S. COUTU99 , C.E. COVAULT89 , A. CREUSOT33, 79,A. CRISS99 , J. CRONIN101 , A. CURUTIU42 , S. DAGORET-CAMPAGNE34 , R. DALLIER37, S. DASSO8, 4,K. DAUMILLER 39, B.R. DAWSON13, R.M. DE ALMEIDA 26, M. DE DOMENICO52 , C. DE DONATO67, 48, S.J. DE
JONG68, 70, G. DE LA VEGA10 , W.J.M. DE MELLO JUNIOR20 , J.R.T.DE MELLO NETO25, I. DE M ITRI49 , V. DE
SOUZA18 , K.D. DE VRIES69 , G. DECERPRIT33 , L. DEL PERAL82, O. DELIGNY32, H. DEMBINSKI41 , N. DHITAL 95,C. DI GIULIO47, 51, J.C. DIAZ95 , M.L. D IAZ CASTRO17 , P.N. DIEP110, C. DOBRIGKEIT 20, W. DOCTERS69 ,J.C. D’OLIVO67, P.N. DONG110, 32, A. DOROFEEV91 , J.C.DOS ANJOS16, M.T. DOVA7, D. D’URSO50 , I. DUTAN42,J. EBR29 , R. ENGEL39, M. ERDMANN43 , C.O. ESCOBAR20 , A. ETCHEGOYEN2, P. FACAL SAN LUIS101 , I. FAJARDO
TAPIA67 , H. FALCKE68, 71, G. FARRAR96 , A.C. FAUTH20, N. FAZZINI 93, A.P. FERGUSON89 , A. FERRERO2 ,B. FICK95 , A. FILEVICH2 , A. FILIPCIC78, 79, S. FLIESCHER43 , C.E. FRACCHIOLLA91 , E.D. FRAENKEL69,U. FROHLICH45 , B. FUCHS16 , R. GAIOR35 , R.F. GAMARRA2 , S. GAMBETTA46, B. GARCIA10 , D. GARCIA
GAMEZ83, D. GARCIA-PINTO81 , A. GASCON83 , H. GEMMEKE40, K. GESTERLING106, P.L. GHIA35, 57,U. GIACCARI49 , M. GILLER73, H. GLASS93 , M.S. GOLD106 , G. GOLUP1, F. GOMEZ ALBARRACIN7 , M. GOMEZ
BERISSO1 , P. GONCALVES74, D. GONZALEZ41, J.G. GONZALEZ41, B. GOOKIN91 , D. GORA41, 72, A. GORGI57 ,P. GOUFFON19 , S.R. GOZZINI87, E. GRASHORN98 , S. GREBE68, 70, N. GRIFFITH98 , M. GRIGAT43 , A.F. GRILLO58,Y. GUARDINCERRI4 , F. GUARINO50 , G.P. GUEDES21, A. GUZMAN67, J.D. HAGUE106, P. HANSEN7, D. HARARI1 ,S. HARMSMA69, 70, J.L. HARTON91, A. HAUNGS39 , T. HEBBEKER43 , D. HECK39 , A.E. HERVE13, C. HOJVAT93,N. HOLLON101, V.C. HOLMES13, P. HOMOLA72, J.R. HORANDEL68, A. HORNEFFER68 , M. HRABOVSKY30, 29,T. HUEGE39, A. INSOLIA52, F. IONITA101, A. ITALIANO 52, C. JARNE7 , S. JIRASKOVA68 , M. JOSEBACHUILI2 ,K. K ADIJA27 , K.-H. KAMPERT38, P. KARHAN28 , P. KASPER93 , B. KEGL34, B. KEILHAUER39 , A. KEIVANI 94 ,J.L. KELLEY68, E. KEMP20, R.M. KIECKHAFER95 , H.O. KLAGES39, M. KLEIFGES40, J. KLEINFELLER39,J. KNAPP87, D.-H. KOANG36, K. KOTERA101 , N. KROHM38 , O. KROMER40 , D. KRUPPKE-HANSEN38 ,F. KUEHN93 , D. KUEMPEL38, J.K. KULBARTZ44, N. KUNKA40, G. LA ROSA56 , C. LACHAUD33 , P. LAUTRIDOU37 ,M.S.A.B. LEAO24, D. LEBRUN36 , P. LEBRUN93 , M.A. L EIGUI DE OLIVEIRA 24 , A. LEMIERE32, A. LETESSIER-SELVON35 , I. LHENRY-YVON32, K. L INK41, R. LOPEZ63, A. LOPEZ AGUERA84 , K. LOUEDEC34 , J. LOZANO
BAHILO83 , A. LUCERO2, 57 , M. LUDWIG41 , H. LYBERIS32, M.C. MACCARONE56 , C. MACOLINO35 , S. MALDERA57,D. MANDAT29, P. MANTSCH93 , A.G. MARIAZZI 7 , J. MARIN11, 57, V. MARIN37 , I.C. MARIS35 , H.R. MARQUEZ
FALCON66 , G. MARSELLA54, D. MARTELLO49, L. MARTIN37 , H. MARTINEZ64, O. MARTINEZ BRAVO63 ,

H.J. MATHES39, J. MATTHEWS94, 100, J.A.J. MATTHEWS106, G. MATTHIAE51, D. MAURIZIO53 , P.O. MAZUR93,G. MEDINA-TANCO67 , M. MELISSAS41, D. MELO2, 53 , E. MENICHETTI53, A. MENSHIKOV40, P. MERTSCH85,C. MEURER43 , S. MI CANOVIC27 , M.I. M ICHELETTI9, W. MILLER106, L. M IRAMONTI48 , S. MOLLERACH1,M. M ONASOR101 , D. MONNIER RAGAIGNE34 , F. MONTANET36, B. MORALES67, C. MORELLO57, E. MORENO63,J.C. MORENO7 , C. MORRIS98 , M. MOSTAFA91, C.A. MOURA24, 50, S. MUELLER39, M.A. M ULLER20,G. MULLER43, M. M UNCHMEYER35, R. MUSSA53 , G. NAVARRA57 †, J.L. NAVARRO83 , S. NAVAS83 , P. NECESAL29,L. NELLEN67, A. NELLES68, 70, J. NEUSER38, P.T. NHUNG110, L. NIEMIETZ38, N. NIERSTENHOEFER38,D. NITZ95, D. NOSEK28, L. NOZKA29, M. NYKLICEK 29 , J. OEHLSCHLAGER39, A. OLINTO101, V.M. OLMOS-GILBAJA84 , M. ORTIZ81, N. PACHECO82 , D. PAKK SELMI -DEI20, M. PALATKA 29, J. PALLOTTA 3, N. PALMIERI 41 ,G. PARENTE84 , E. PARIZOT33 , A. PARRA84 , R.D. PARSONS87 , S. PASTOR80 , T. PAUL97 , M. PECH29 , J. PEKALA 72,R. PELAYO84 , I.M. PEPE23, L. PERRONE54 , R. PESCE46, E. PETERMANN105 , S. PETRERA47 , P. PETRINCA51 ,A. PETROLINI46 , Y. PETROV91, J. PETROVIC70 , C. PFENDNER108, N. PHAN106 , R. PIEGAIA4 , T. PIEROG39 ,P. PIERONI4 , M. PIMENTA74, V. PIRRONELLO52 , M. PLATINO2, V.H. PONCE1 , M. PONTZ45, P. PRIVITERA101 ,M. PROUZA29 , E.J. QUEL3, S. QUERCHFELD38 , J. RAUTENBERG38 , O. RAVEL37, D. RAVIGNANI 2 , B. REVENU37,J. RIDKY 29 , S. RIGGI84, 52, M. RISSE45 , P. RISTORI3 , H. RIVERA48 , V. RIZI47 , J. ROBERTS96 , C. ROBLEDO63 ,W. RODRIGUES DE CARVALHO84, 19, G. RODRIGUEZ84 , J. RODRIGUEZ MARTINO11, 52, J. RODRIGUEZ ROJO11 ,I. RODRIGUEZ-CABO84 , M.D. RODRIGUEZ-FRIAS82 , G. ROS82 , J. ROSADO81 , T. ROSSLER30 , M. ROTH39 ,B. ROUILL E-D’ORFEUIL101, E. ROULET1, A.C. ROVERO8 , C. RUHLE40 , F. SALAMIDA 47, 39, H. SALAZAR 63,G. SALINA 51 , F. SANCHEZ2 , M. SANTANDER11 , C.E. SANTO74, E. SANTOS74, E.M. SANTOS25 , F. SARAZIN90 ,B. SARKAR38 , S. SARKAR85 , R. SATO11, N. SCHARF43 , V. SCHERINI48 , H. SCHIELER39, P. SCHIFFER43 ,A. SCHMIDT40 , F. SCHMIDT101 , O. SCHOLTEN69, H. SCHOORLEMMER68, 70 , J. SCHOVANCOVA29 , P. SCHOVANEK29 ,F. SCHRODER39 , S. SCHULTE43, D. SCHUSTER90 , S.J. SCIUTTO7 , M. SCUDERI52 , A. SEGRETO56, M. SETTIMO45,A. SHADKAM 94 , R.C. SHELLARD16, 17, I. SIDELNIK 2 , G. SIGL44, H.H. SILVA LOPEZ67, A. SMIAŁKOWSKI 73 ,R. SMIDA39, 29, G.R. SNOW105 , P. SOMMERS99 , J. SOROKIN13 , H. SPINKA88, 93 , R. SQUARTINI11 , S. STANIC79 ,J. STAPLETON98, J. STASIELAK72, M. STEPHAN43, E. STRAZZERI56, A. STUTZ36, F. SUAREZ2 , T. SUOMIJARVI32 ,A.D. SUPANITSKY8, 67 , T. SUSA27 , M.S. SUTHERLAND94, 98, J. SWAIN97 , Z. SZADKOWSKI73 , M. SZUBA39,A. TAMASHIRO8 , A. TAPIA2, M. TARTARE36 , O. TASCAU38 , C.G. TAVERA RUIZ67 , R. TCACIUC45 ,D. TEGOLO52, 61, N.T. THAO110 , D. THOMAS91, J. TIFFENBERG4 , C. TIMMERMANS70, 68, D.K. TIWARI66 ,W. TKACZYK 73 , C.J. TODEROPEIXOTO18, 24, B. TOME74, A. TONACHINI53 , P. TRAVNICEK29 , D.B. TRIDAPALLI 19 ,G. TRISTRAM33 , E. TROVATO52, M. TUEROS84, 4, R. ULRICH99, 39 , M. UNGER39 , M. URBAN34 , J.F. VALD ES
GALICIA 67 , I. VALI NO84, 39 , L. VALORE50, A.M. VAN DEN BERG69, E. VARELA63 , B. VARGAS CARDENAS67 ,J.R. VAZQUEZ81, R.A. VAZQUEZ84, D. VEBERIC79, 78 , V. VERZI51, J. VICHA29 , M. V IDELA10, L. V ILLASENOR66,H. WAHLBERG7 , P. WAHRLICH13 , O. WAINBERG2 , D. WALZ43, D. WARNER91 , A.A. WATSON87, M. WEBER40 ,K. WEIDENHAUPT43 , A. WEINDL39 , S. WESTERHOFF108 , B.J. WHELAN13, G. WIECZOREK73 , L. WIENCKE90 ,B. WILCZY NSKA72 , H. WILCZY NSKI72 , M. WILL 39, C. WILLIAMS 101 , T. WINCHEN43 , L. WINDERS109 ,M.G. WINNICK13 , M. WOMMER39 , B. WUNDHEILER2 , T. YAMAMOTO101 a, T. YAPICI95 , P. YOUNK45 , G. YUAN94 ,A. Y USHKOV84, 50 , B. ZAMORANO83 , E. ZAS84, D. ZAVRTANIK 79, 78, M. ZAVRTANIK 78, 79, I. ZAW96, A. ZEPEDA64,M. Z IMBRES-SILVA 20, 38 M. Z IOLKOWSKI45
1 Centro Atomico Bariloche and Instituto Balseiro (CNEA- UNCuyo-CONICET), San Carlos de Bariloche, Argentina2 Centro Atomico Constituyentes (Comision Nacional de Energıa Atomica/CONICET/UTN-FRBA), Buenos Aires,Argentina3 Centro de Investigaciones en Laseres y Aplicaciones, CITEFA and CONICET, Argentina4 Departamento de Fısica, FCEyN, Universidad de Buenos Aires y CONICET, Argentina7 IFLP, Universidad Nacional de La Plata and CONICET, La Plata, Argentina8 Instituto de Astronomıa y Fısica del Espacio (CONICET- UBA), Buenos Aires, Argentina9 Instituto de Fısica de Rosario (IFIR) - CONICET/U.N.R. and Facultad de Ciencias Bioquımicas y FarmaceuticasU.N.R., Rosario, Argentina10 National Technological University, Faculty Mendoza (CONICET/CNEA), Mendoza, Argentina11 Observatorio Pierre Auger, Malargue, Argentina12 Observatorio Pierre Auger and Comision Nacional de Energıa Atomica, Malargue, Argentina13 University of Adelaide, Adelaide, S.A., Australia16 Centro Brasileiro de Pesquisas Fisicas, Rio de Janeiro, RJ,Brazil17 Pontifıcia Universidade Catolica, Rio de Janeiro, RJ, Brazil
32ND INTERNATIONAL COSMIC RAY CONFERENCE, BEIJING 2011
18 Universidade de Sao Paulo, Instituto de Fısica, Sao Carlos, SP, Brazil19 Universidade de Sao Paulo, Instituto de Fısica, Sao Paulo, SP, Brazil20 Universidade Estadual de Campinas, IFGW, Campinas, SP, Brazil21 Universidade Estadual de Feira de Santana, Brazil22 Universidade Estadual do Sudoeste da Bahia, Vitoria da Conquista, BA, Brazil23 Universidade Federal da Bahia, Salvador, BA, Brazil24 Universidade Federal do ABC, Santo Andre, SP, Brazil25 Universidade Federal do Rio de Janeiro, Instituto de Fısica, Rio de Janeiro, RJ, Brazil26 Universidade Federal Fluminense, EEIMVR, Volta Redonda, RJ, Brazil27 Rudjer Boskovic Institute, 10000 Zagreb, Croatia28 Charles University, Faculty of Mathematics and Physics, Institute of Particle and Nuclear Physics, Prague, CzechRepublic29 Institute of Physics of the Academy of Sciences of the Czech Republic, Prague, Czech Republic30 Palacky University, RCATM, Olomouc, Czech Republic32 Institut de Physique Nucleaire d’Orsay (IPNO), Universite Paris 11, CNRS-IN2P3, Orsay, France33 Laboratoire AstroParticule et Cosmologie (APC), Universite Paris 7, CNRS-IN2P3, Paris, France34 Laboratoire de l’Accelerateur Lineaire (LAL), Universite Paris 11, CNRS-IN2P3, Orsay, France35 Laboratoire de Physique Nucleaire et de Hautes Energies (LPNHE), Universites Paris 6 et Paris 7, CNRS-IN2P3,Paris, France36 Laboratoire de Physique Subatomique et de Cosmologie (LPSC), Universite Joseph Fourier, INPG, CNRS-IN2P3,Grenoble, France37 SUBATECH,Ecole des Mines de Nantes, CNRS-IN2P3, Universite de Nantes, Nantes, France38 Bergische Universitat Wuppertal, Wuppertal, Germany39 Karlsruhe Institute of Technology - Campus North - Institutfur Kernphysik, Karlsruhe, Germany40 Karlsruhe Institute of Technology - Campus North - Institutfur Prozessdatenverarbeitung und Elektronik, Karlsruhe,Germany41 Karlsruhe Institute of Technology - Campus South - Institutfur Experimentelle Kernphysik (IEKP), Karlsruhe,Germany42 Max-Planck-Institut fur Radioastronomie, Bonn, Germany43 RWTH Aachen University, III. Physikalisches Institut A, Aachen, Germany44 Universitat Hamburg, Hamburg, Germany45 Universitat Siegen, Siegen, Germany46 Dipartimento di Fisica dell’Universita and INFN, Genova, Italy47 Universita dell’Aquila and INFN, L’Aquila, Italy48 Universita di Milano and Sezione INFN, Milan, Italy49 Dipartimento di Fisica dell’Universita del Salento and Sezione INFN, Lecce, Italy50 Universita di Napoli ”Federico II” and Sezione INFN, Napoli, Italy51 Universita di Roma II ”Tor Vergata” and Sezione INFN, Roma, Italy52 Universita di Catania and Sezione INFN, Catania, Italy53 Universita di Torino and Sezione INFN, Torino, Italy54 Dipartimento di Ingegneria dell’Innovazione dell’Universita del Salento and Sezione INFN, Lecce, Italy56 Istituto di Astrofisica Spaziale e Fisica Cosmica di Palermo(INAF), Palermo, Italy57 Istituto di Fisica dello Spazio Interplanetario (INAF), Universita di Torino and Sezione INFN, Torino, Italy58 INFN, Laboratori Nazionali del Gran Sasso, Assergi (L’Aquila), Italy61 Universita di Palermo and Sezione INFN, Catania, Italy63 Benemerita Universidad Autonoma de Puebla, Puebla, Mexico64 Centro de Investigacion y de Estudios Avanzados del IPN (CINVESTAV), Mexico, D.F., Mexico66 Universidad Michoacana de San Nicolas de Hidalgo, Morelia,Michoacan, Mexico67 Universidad Nacional Autonoma de Mexico, Mexico, D.F., Mexico68 IMAPP, Radboud University Nijmegen, Netherlands69 Kernfysisch Versneller Instituut, University of Groningen, Groningen, Netherlands70 Nikhef, Science Park, Amsterdam, Netherlands71 ASTRON, Dwingeloo, Netherlands72 Institute of Nuclear Physics PAN, Krakow, Poland

73 University of Łodz, Łodz, Poland74 LIP and Instituto Superior Tecnico, Lisboa, Portugal78 J. Stefan Institute, Ljubljana, Slovenia79 Laboratory for Astroparticle Physics, University of Nova Gorica, Slovenia80 Instituto de Fısica Corpuscular, CSIC-Universitat de Valencia, Valencia, Spain81 Universidad Complutense de Madrid, Madrid, Spain82 Universidad de Alcala, Alcala de Henares (Madrid), Spain83 Universidad de Granada & C.A.F.P.E., Granada, Spain84 Universidad de Santiago de Compostela, Spain85 Rudolf Peierls Centre for Theoretical Physics, Universityof Oxford, Oxford, United Kingdom87 School of Physics and Astronomy, University of Leeds, United Kingdom88 Argonne National Laboratory, Argonne, IL, USA89 Case Western Reserve University, Cleveland, OH, USA90 Colorado School of Mines, Golden, CO, USA91 Colorado State University, Fort Collins, CO, USA92 Colorado State University, Pueblo, CO, USA93 Fermilab, Batavia, IL, USA94 Louisiana State University, Baton Rouge, LA, USA95 Michigan Technological University, Houghton, MI, USA96 New York University, New York, NY, USA97 Northeastern University, Boston, MA, USA98 Ohio State University, Columbus, OH, USA99 Pennsylvania State University, University Park, PA, USA100 Southern University, Baton Rouge, LA, USA101 University of Chicago, Enrico Fermi Institute, Chicago, IL, USA105 University of Nebraska, Lincoln, NE, USA106 University of New Mexico, Albuquerque, NM, USA108 University of Wisconsin, Madison, WI, USA109 University of Wisconsin, Milwaukee, WI, USA110 Institute for Nuclear Science and Technology (INST), Hanoi, Vietnam† Deceaseda at Konan University, Kobe, Japan

32ND INTERNATIONAL COSMIC RAY CONFERENCE, BEIJING 2011
Anisotropies and Chemical Composition of Ultra-High Energy Cosmic Rays Using Arrival Di-rections Measured by the Pierre Auger ObservatoryEDIVALDO M. SANTOS1, FOR THE PIERRE AUGER COLLABORATION2
1Instituto de Fısica, Universidade Federal do Rio de Janeiro, 21941-972, Rio de Janeiro, Brazil2Observatorio Pierre Auger, Av. San Martin Norte 304, 5613 Malarg ue, Argentina(Full Author list: http://www.auger.org/archive/authors 2011 05.html)auger [email protected]
Abstract: The Pierre Auger Collaboration has reported evidence for anisotropies in the arrival directions of cosmic rayswith energies larger thanEth = 55 EeV. There is a correlation above the isotropic expectation with nearby active galaxiesand the largest excess is in a celestial region around the position of the radio galaxy Cen A. If these anisotropies are dueto nuclei of charge Z, the protons accelerated in those sources are expected, under reasonable assumptions, to lead toexcesses in the same regions of the sky at energies above Eth/Z. We here report the lack of anisotropies at these lowerenergies for illustrative values of Z = 6, 13 and 26. These observations set stringent constraints on the allowed protonfraction at the sources.
Keywords: Ultra-High Energy Cosmic Rays, Anisotropies, Chemical Composition, Pierre Auger Observatory
1 Introduction
Measurements of the anisotropies in the distribution ofarrival directions of Ultra-High Energy Cosmic Rays(UHECR), when combined with information on theirchemical composition and spectral features can providevaluable information on the sources and accelerationmech-anisms capable of producing subatomic particles withmacroscopic energies.The Pierre Auger Observatory, the largest cosmic ray de-tector ever built, has observed [1] a flux suppression above40 EeV (where 1 EeV = 1018 eV) consistent with that ex-pected from the interaction of protons or heavy nuclei withthe cosmic microwave background [2, 3]. In addition, ithas reported evidence for anisotropy in the distribution ofarrival directions of the highest energy events [4, 5, 6].The arrival directions of the events with energies above 55EeV show a degree of correlation within an angular scaleof ! 3! with the positions of nearby (within ! 75 Mpc)Active Galactic Nuclei (AGN) from the VCV catalog [7],which is above that expected from chance coincidences inan isotropic sky. However, one cannot identify AGN as theactual sources of UHECR since these trace the distributionof matter in the local Universe where other potential accel-eration sites (such as Gamma Ray Bursts) are also present.Another interesting feature observed in the data sample isan excess of arrival directions towards the celestial positionof Cen A, which is most significant in an angular windowof radius 18!. This is the nearest radio loud AGN at ! 4
Mpc from Earth, and is located at equatorial coordinates(!," ) = (201.4!,"43.0!).The determination of the composition of primary CRs atthe energies for which their flux is measured to be stronglysuppressed is an active area of study. This stems from boththe low observed flux and the reliance on Monte Carlomodels that require large extrapolations from currentlymeasured physics. A method was recently proposed link-ing the anisotropy measurements to the cosmic ray com-position by exploiting that particles with the same rigidityfollow the same path through a magnetic field [8]. Givengeneric assumptions about the acceleration process at thesource, neglecting interactions with the photon backgroundand assuming that the anisotropies at energiesE are causedby heavy primaries with charge Z , it relates the strength ofan anisotropy at energy E/Z to the fraction of protons atthat energy in the same source. We here describe observa-tions related to a search for this kind of effect using datacollected by the Pierre Auger Observatory [9].
2 The Detector and the Data Sample
Located in the city of Malargue, Mendoza, Argentina, thePierre Auger Observatory is a hybrid detector consistingof a Surface Detector (SD) with 1660 stations coveringan area of ! 3000 km2 and a Fluorescence Detector (FD)comprised of 27 fluorescence telescopes in four locationsaround the border and overlooking the array. As the showerdevelops in the atmosphere, the nitrogen scintillation light
1

E.M. SANTOS ET AL, ANISOTROPIES AND CHEMICAL COMPOSITION AT THE PIERRE AUGER OBSERVATORY
is detected by the telescopes which are able to record theultraviolet radiation emitted during the de-excitation ofmolecular nitrogen. When shower particles reach groundlevel they are detected through water-Cherenkov light pro-duced within the SD stations [10].The reconstruction of the event direction is done by fittinga certain shower front model propagating at the speed oflight to the measured arrival times and particle densities inthe stations triggered by the air shower. By profiting fromthe unique hybrid nature of the Auger Observatory, eventswhich are detected simultaneously by the SD and the FDare used to inter-calibrate these two detectors, providing anenergy estimate almost independent of Monte Carlo sim-ulations. Firstly, the estimated signal at 1000 m from thereconstructed shower core, S(1000), is corrected for atmo-spheric attenuation, and gives rise to a signal value at areference zenith angle (S38). Finally, this signal can thenbe correlated to the calorimetric energy measurement per-formed by the FD. Such a calibration curve has been deter-mined for the hybrid events and can be used for the wholehigh statistics sample measured by the SD [11].The data used in this analysis were collected by the SDfrom 1 January 2004 to 31 December 2009 and containshowers with reconstructed zenith angle # < 60 degrees.Only events for which the station with the highest signalwas surrounded by an entire hexagon of active detectorsat the time of detection have been included. Recordingthe number of active detector configurations able to trig-ger such showers allows one to obtain the array exposureas a function of time. Also, by monitoring the commu-nications between individual stations and the Central DataAcquisition System, we are able to identify dead times inthe detectors. After accounting for these and removing pe-riods of large fluctuations in the array aperture we are leftwith a livetime for the SD array of about 87%.
3 Low Energy Anisotropy Searches
In ref. [8] Lemoine and Waxman explored the conse-quences of the assumption that the anisotropies observed atthe highest energies (above a threshold Eth) were causedby a predominantly heavy component. Assuming the pres-ence of protons in the same source, and considering thefact that the Larmor radius in a given magnetic field de-pends only on rigidity, E/Z for relativistic particles, if thehigh energy anisotropy is due to particles with charge Zthere should be a corresponding low energy anisotropy ofprotons at energies aboveEth/Z .In ref. [6] the most significant excess for a top-hat win-dow centered on Cen A was found for a radius of 18 !,and we will hence focus on this region. There are a to-tal of 60 events in this data set, and 10 are at a distancesmaller than 18! of the position of Cen A1. The number ofevents expected by random correlations inside this angu-lar window for the case of a completely isotropic sky, tak-ing into account also the detector exposure, is estimated as
Nbkg = (Ntot"Nobs)x/(1"x) = 2.44, where x # 0.0466is the fraction of the sky, weighted by the observatory’s ex-posure, covered by the 18! circular window around CenA. The a posteriori nature of the observed excess aroundCen A (the location of the excess, the energy threshold andangular size were chosen so as to maximize the excess)implies that new independent data will be required to de-termine the actual strength of the source and establish itssignificance in an a priori way.Taking as representative values for the atomic number ofheavy primaries Z = 6, 13 and 26, we have searched foranisotropies in an 18! window around Cen A above thresh-old energies of Eth/Z = 9.2 EeV, 4.2 EeV and 2.1 EeV,respectively. Table 1 presents the total, observed, and ex-pected number of events adopting different values ofZ . Nosignificant excesses have been found.
Z Emin [EeV] Ntot Nobs Nbkg
6 9.2 4455 219 207± 1413 4.2 16640 797 774± 2826 2.1 63600 2887 2920± 54
Table 1: Total number of events, Ntot, and those observedin an angular window of 18! around Cen A, Nobs, as wellas the expected backgroundNbkg . Results are given for dif-ferent energy thresholds, corresponding to Emin = Eth/Zfor the indicated values of Z and Eth = 55 EeV.
Above an energy of Eth = 55 EeV, the arrival directionsmeasured by Auger have a degree of correlation aboveisotropic expectations with the positions of nearby AGNin the VCV catalog at less than 75 Mpc (zmax = 0.018)in an angular window of 3.1! [6]. Therefore, we have alsolooked for anisotropies above the same low energy thresh-olds for events in $ = 3.1! windows around the same VCVAGN. Once again, no statistically significant excesses havebeen identified and a summary of the searches is shown intable 2. It is worth mentioning that the data collected dur-ing the exploratory scan, i.e., the period during which thecollected data were used to tune the correlation parameters(Eth, zmax,$) in order to maximize the correlation signal(see [6] for details), were not used to produce this table.For the heaviest primaries considered here (Z = 26), thelow energy threshold (2.1 EeV) falls below the region offull SD efficiency (E > 3 EeV). In this case, we have per-formed a fit to the observed zenith angle distribution of theevents in order to account for the zenith angle dependentdetection efficiency in the estimate of the isotropic expec-tations in the windows considered.
1. In ref. [6], 13 out of 69 arrival directions are reported within18!. of Cen A. The difference with the numbers reported here isdue to a stricter event selection necessary for an accurate estimateof the exposure at low energies.
2

32ND INTERNATIONAL COSMIC RAY CONFERENCE, BEIJING 2011
0.1
1
10
1.6 1.8 2 2.2 2.4
fp / fZ
s
95% CL upper bounds from Cen A
Z=6 Z=13Z=26
0.1
1
10
1.6 1.8 2 2.2 2.4
fp / fZ
s
95% CL upper bounds from VCV
Z=6 Z=13Z=26
Figure 1: Upper bounds at 95%CL on the allowed proton to heavy fractions in the source as a function of the assumedlow energy spectral index s. The different lines are for charges Z = 6, 13 and 26, as indicated. Left: bounds from the CenA analysis. Right: bounds from the VCV analysis.
Z Emin [EeV] Ntot Nobs Nbkg
6 9.2 3626 763 770± 2813 4.2 13482 2852 2860± 5426 2.1 51641 10881 10966± 105
Table 2: Total number of events, Ntot, and those observedwithin 3.1! from objects with z $ 0.018 in the VCV cat-alog, Nobs, as well as the expected isotropic backgroundNbkg . Results are given for different energy thresholds,corresponding to Emin = Eth/Z for the indicated valuesof Z and Eth = 55 EeV.
4 Chemical Composition Constraints
In astrophysical environments for which the accelerationprocesses are essentially dependent on the magnetic rigid-ity, one can write the differential cosmic ray energy spec-trum for primaries of atomic number Z as:
dnZ
dE= kZ!
!E
Z
",
where kZ is a normalization constant for the spectrum.Under this assumption, the expected number of protonsNp(E > Eth/Z) above Eth/Z can be shown to be relatedto the number of heavy primariesNZ(E > Eth) aboveEth
through Np(E > Eth/Z) = kp
ZkZNZ(E > Eth). Experi-
mentally one can estimate the ratio of source event numbersabove the low and high energy thresholds as
RZ % N(E > Eth/Z)
N(E > Eth),
where N = Nobs " Nbkg . The numerator of this ratio isequal to the sum of protons (Np(E > Eth/Z)) and heavynuclei (NZ(E > Eth/Z)), whereas the denominator isconsidered to be dominated essentially by heavy primaries,i.e.,NZ(E > Eth). Therefore, a conservative upper bound
on the ratio is RZ > kp
ZkZ+ 1, where no extra assumption
was made on the spectral shapes of both chemical species.This inequality can be interpreted as a lower bound on thespectral normalizations kp/kZ < (RZ " 1)Z .We use the profile likelihood method [12] to derive upperbounds on the ratio RZ both for events around Cen A andthose around the positions of the VCV AGN. This methodtakes into account Poisson fluctuations in the signal andexpected background at both high and low energies simul-taneously. We find the following 95% CL bounds:
RCenA26 < 12.9, RCenA
13 < 17.3, RCenA6 < 9.1
RVCV26 < 14.7, RVCV
13 < 12.4, RVCV6 < 6.0
If we now assume that below a certain cutoffE1 the energyspectra are proportional to power laws of rigidity, one canwrite
!
!E
Z
"&
!E
Z
""s
and the ratio of spectral normalizations can be written interms of the relative abundances of protons to species ofcharge Z at the sources fp
fZ= kp
kZZ"s.
Figure 1 shows the corresponding upper limits on the pro-ton to heavy primary abundances at the sources as a func-tion of the spectral index s for different Z . The boundsobtained from the analysis of Cen A are similar to thoseobtained from VCV AGN, becoming more stringent as thespectral index hardens. Even though we have not includedenergy losses in this analysis, these will eventually degradethe energy of the high energy nuclei, increasing the sizeof the predicted low energy anisotropy [8]. Therefore, thebounds discussed here are conservative.Since the size of the angular window around Cen A waschosen a posteriori, an unbiased estimate of the signifi-cance will only be found with new independent data. How-ever, it is worth mentioning that varying the energy thresh-old to 50 or 60 EeV leads to similar results. Also, vary-
3

E.M. SANTOS ET AL, ANISOTROPIES AND CHEMICAL COMPOSITION AT THE PIERRE AUGER OBSERVATORY
ing the angular window to 10! has no large impact on thebounds, with the main effects coming from the change inthe expected background, the limits being relaxed by a fac-tor ! 2 in this case.
5 Conclusions
We have presented observations of the distribution ofevents at energies above Eth/Z in the directions whereanisotropies have been previously observed above E th =55 EeV. We pursued the idea that the anisotropies at highenergies could be caused by heavy primaries, either forthe excess of events around Cen A at an angular scale of18! or for an angular scale of 3.1! around the positions ofVCV AGN. We have taken as representative values for theatomic numbers present in the sources Z = 6, 13, and 26.The low energy (Eth/Z) anisotropy caused by the protonsin the same sources are not observed, allowing us to de-rive upper bounds on the light to heavy composition abun-dances at the sources. The bounds from both the VCV andthe Cen A analyses are similar, and their dependence withthe source spectral index is such that softer spectra pro-duce less stringent upper limits. Low energy abundancemeasurements have been performed by the ATIC-2 experi-ment [13] and they point to fp/fZ values, as measured onEarth, above the upper limits presented here (for example,fp # fHe # 2fCNO # 2fNe"Si # 2fZ>17 # 4fFe).At these low energies (100 TeV), cosmic rays are believedto be of galactic origin, and the larger diffusion coefficientof protons in our galaxy’s magnetic field as compared toheavier nuclei imply that the corresponding fp/fZ at thesources are even larger. However, the probable extragalac-tic origin of UHECR, as well as their much higher ener-gies, implies that the ATIC measured abundances do notnecessarily apply to the sources contributing to the Augerdata and should be taken only as indicative values of theexpected ratios.Therefore, scenarios in which a rigidity dependent accel-eration mechanism leads to a heavy primary dominationat the highest energies and in which there is an abundantproton component at low energies are not favored (see Fig.1). How these conclusions are modified in the presence ofstrong structured magnetic fields and taking into accountthe relevant energy losses remains to be seen. Finally, wemention that this joint composition-anisotropy study is in-dependent of measurements of the average depth of themaximum of shower development [14, 15]. Instead, it de-pends on assumptions related to propagation and accelera-tion mechanisms at the sources.
References
[1] The Pierre Auger Collaboration, Phys. Lett. B, 2010,685: 239.
[2] K. Greisen, Phys. Rev. Lett., 1966, 16: 748.
[3] G. T. Zatsepin, V. A. Kuz’min, Sov. Phys. JETP Lett.,1966, 4: 78.
[4] The Pierre Auger Collaboration, Science, 2007, 318:938.
[5] The Pierre Auger Collaboration, Astropart. Phys.,2008, 29: 188; Erratum-ibid., 2008, 30: 45.
[6] The Pierre Auger Collaboration, Astropart. Phys.2010, 34: 314.
[7] M.-P. Veron-Cetty, P. Veron, Astron. & Astrophys.2006, 455: 773.
[8] M. Lemoine and E. Waxman, JCAP, 2009, 11: 009.[9] The Pierre Auger Collaboration, JCAP, 2011, 06: 022.[10] The Pierre Auger Collaboration, Nucl. Instr. andMeth. in Physics Research, 2010, A613: 29.
[11] The Pierre Auger Collaboration, Phys. Rev. Lett.,2008, 101: 061101.
[12] W. A. Rolke, A. M. Lopez, J. Conrad, Nucl. Instrum.and Meth. in Physics Research, 2005,A551: 493.
[13] A. Pavnov et al., (ATIC-2 Collaboration), Bull. Russ.Acad. Sc.: Physics, 2007, 71: 494; ibidem Physics,2009, 73: 564.
[14] The Pierre Auger Collaboration, Phys. Rev. Lett.,2010, 104: 091101.
[15] The High Resolution Fly’s Eye Collaboration, Phys.Rev. Lett., 2010, 104: 161101.
4

32ND INTERNATIONAL COSMIC RAY CONFERENCE, BEIJING 2011
Bounds on the density of sources of ultra high energy cosmic rays from the Pierre Auger Ob-servatory data
MANLIO DE DOMENICO1,2, FOR THEPIERRE AUGER COLLABORATION3
1 Laboratorio sui Sistemi Complessi, Scuola Superiore di Catania, Via Valdisavoia 9, 95123 Catania, Italy2 Istituto Nazionale di Fisica Nucleare, Sez. di Catania, ViaS. Sofia 64, 95123 Catania, Italy3 Observatorio Pierre Auger, Av. San Martın Norte 304, 5613 Malargue, Argentina(Full author list: http://www.auger.org/archive/authors_2011_05.html)[email protected]
Abstract: We present constraints on the density of sources obtained byanalyzing the clustering (or absence of clustering)of the arrival directions of ultra-high energy cosmic rays detected at the Pierre Auger Observatory. We consider boundsfor isotropically distributed sources and for sources distributed according to the 2MRS catalog.
Keywords: Pierre Auger Observatory, ultra-high energy cosmic rays, clustering, autocorrelation, large scale structure
1 Introduction
The identification of the sources of ultra-high energy cos-mic rays (UHECRs) is a major challenge in astroparticlephysics. Only few astrophysical objects in the universe areexpected to be able to accelerate particles up to100 EeV(1 EeV is1018 eV) [1]. It is likely that those sources areextragalactic, and only sources closer than about 200 Mpcfrom Earth can contribute appreciably to the observed fluxabove 60 EeV. Interactions with the cosmic microwavebackground by cosmic ray protons, or nuclei, with largerenergies lead to strong attenuation of their flux from moredistant sources (the Greisen-Zatsepin-Kuz’min (GZK) ef-fect [2, 3]). Observing in the southern hemisphere, thePierre Auger Collaboration has reported the measurementof a correlation above the isotropic expectation between thearrival directions of cosmic rays with energies exceeding∼ 60 EeV and the positions of active galactic nuclei (AGN)within 75 Mpc [4, 5, 6], at angular scales of∼ 3. This ob-servation, along with the measurement of a suppression ofthe flux at the highest energies [7, 8] is consistent with anextragalactic origin of the UHECRs and with the expec-tation from the GZK effect. Note however that the HiResCollaboration has reported an absence of a comparable cor-relation in observations in the northern hemisphere [9].
If the deflections in the trajectories of UHECRs caused byintervening magnetic fields are small, the distribution oftheir arrival directions in the energy range above the GZKthreshold is expected to reflect the clustering properties ofthose local sources. A large number of multiplets of arrivaldirections is expected if the local density of sources is suf-ficiently small, whereas fewer multiplets are expected for
larger values of the density. Indeed, the lower the density ofsources is, the larger is the probability that more than oneof the observed cosmic rays come from the same source.Hence, a statistical analysis of clustering in the observedUHECR arrival directions should shed light on the densityof their sources, further reducing the list of candidate astro-physical sources. Conversely, if the deviations in the tra-jectories of UHECRs are large, as expected if heavy nucleiare the dominant composition or if intervening magneticfields have a strong effect, this approach may not be suit-able for establishing constraints on the density of sources,since the clustering signal could be similar to that expectedfor smaller deflections and a larger density.
Estimates of the density of sources in our cosmic neighbor-hood have been obtained in the range10−6− 10−4 Mpc−3
(with large uncertainties), using data from previous ex-periments, under various assumptions on the sources andtheir distribution [10, 11, 12, 13, 14]. More recently, ap-proaches involving the two-point autocorrelation functionor its variants have been used to constrain the source den-sity. Representative studies can be found in [15], in whichsource models that trace the distribution of matter in thenearby universe as well as a model with a continuous, uni-form distribution of sources were analysed in an autocor-relation study of the first 27 arrival directions of UHECRswith energies larger than 56 EeV measured by the PierreAuger Observatory [5]. Results from such analyses sug-gest a source density ranging from0.2 × 10−4 Mpc−3 to5 × 10−4 Mpc−3 with an upper bound≈ 10−2 Mpc−3 at95% CL.
In the present study, we derive bounds on the densityof sources through an autocorrelation analysis of the set
5

M. DE DOMENICO et al. BOUNDS ON THE DENSITY OF SOURCES OFUHECRS FROM THEPAO
of 67 arrival directions of UHECRs with energies largerthan 60 EeV measured by the Pierre Auger Observatorythrough 31 December 2010. We compare the autocorrela-tion properties in the data with the expectation from simula-tion sets of arrival directions drawn from randomly locatedsources with varying density. We consider two astrophys-ical scenarios: one with sources distributed uniformly inthe nearby universe, and another in which the source dis-tribution follows the large scale structure of nearby matteraccording to the 2MASS Redshift Survey (2MRS) catalogof galaxies. The bounds apply if the deflections of CR tra-jectories by intervening magnetic fields do not erase theclustering properties expected from the models at the an-gular scales considered.
2 Data set
The surface detector of the Auger Observatory consistsof 1660 water-Cherenkov stations that detect photons andcharged particles in air showers at ground level. A tri-angular grid of detectors with 1.5 km spacing spans over3000 km2, and operates with a duty cycle of almost 100%.The energy resolution is 15%, with a systematic uncer-tainty of 22% [16]. The angular resolution, defined asthe angular radius that would contain 68% of the recon-structed events, is better than0.9 above 10 EeV. The dataset consists of 67 events recorded by the Auger Obser-vatory from 1 January 2004 to 31 December 2010, withreconstructed energies above 60 EeV and zenith anglessmaller than60. The event selection implemented in thepresent analysis requires that at least five active nearest-neighbors surround the station with the highest signal whenthe event was recorded, and that the reconstructed showercore be inside an active equilateral triangle of detectors.The integrated exposure for this event selection amounts to2.58× 104 km2 sr yr.
3 Statistical method and astrophysical mod-els
As an estimator of the clustering, in this study we makeuse of the two-point autocorrelation function (ACF), i.e.the cumulative number of pairs within the angular distanceθ, defined by
np(θ) =n∑
i=2
i−1∑j=1
Θ (θ − θij) (1)
wheren is the number of UHECRs being considered,Θ isthe step function andθij is the angular distance betweeneventsi andj. In figure 1 (left panel) we show the ACFof the arrival directions of CRs with energy larger than60 EeV measured by the Auger Observatory and the 90%confidence region for the isotropic expectation. In the rightpanel of figure 1, the autocorrelation of the same set of ar-rival directions, but restricted to galactic latitudes|b| >
Figure 1: Number of pairsnp as a function of the angularscaleθ for the data (diamonds) and 90% confidence regionfor the isotropic expectation (shaded area).Left: 67 eventswith energy above60 EeV. Right: 51 events with energyabove60 EeV and galactic latitude|b| > 10.
10, is shown. This cut in galactic latitude is needed forthe comparison with the scenario based in the 2MRS cata-log of galaxies, due to its incompleteness near the galacticplane.
In our analysis, we only consider angular scales larger than5 to constrain the source density from the ACF. Deflec-tions of this size are likely to affect the trajectories of pro-tons, and they may be larger for heavier nuclei. The effectof magnetic fields, which are not known in enough detail tobe taken into account in this analysis, could smooth awaythe clustering pattern expected from a particular source sce-nario at scales smaller than the typical deflections. For an-gular scales ranging from5 to 30, we measure the num-ber of pairsnp(θ) in the data and we compare it to thatin simulated sets of arrival directions with distributionsex-pected in a given astrophysical model, as a function of thesource densityρ. This allows us to obtain the range ofdensities compatible with the observations at a given confi-dence level. We chose the scenario based on 2RMS galax-ies to illustrate the expectations from sources that trace thedistribution of matter in the nearby universe, and we inves-tigated the clustering differences with a scenario based ona finite number of random uniformly distributed sources.
The particular choices of the uniform and the 2MRS mod-els is justified by the fact that, for a fixed value of thesource densityρ, we are interested in investigating theclustering differences between sets of events following thedistribution of matter in the nearby universe and sets ofevents generated by a finite number of random uniformlydistributed sources. In both cases, we assume a power-law injection spectrum at the source with spectral indexs = 2.7 and an equal intrinsic luminosity of cosmic rays.The simulated particles are successively propagated in aΛ−Cold Dark Matter universe (Hubble constant at presenttimeH0 = 70.0 km/s/Mpc, density of matterΩm = 0.27and density of energyΩΛ = 0.73) [17], taking into ac-count non-negligible energy-loss processes in the cosmicmicrowave background photon field. For a given energy
6

32ND INTERNATIONAL COSMIC RAY CONFERENCE, BEIJING 2011
Figure 2: Events withE > 60 EeV and a uniform distri-bution of sources.Top and bottom-left:Number of pairsas a function of the source density, for three different val-ues of the angular scale (θ = 6, 12 and 24). Solidlines indicate the average number of pairs in the case ofMonte-Carlo simulations, the shaded area denotes the 90%confidence region and the dashed line indicates the valueobtained from the data.Bottom-right: source density ob-tained from the average number of pairs (solid line) andthe allowed region for source density with 90% CL (shadedarea).
thresholdEthr of the events, the probability for a source togenerate an event is proportional to the inverse square ofits distanceD and to a factor accounting for the expectedflux attenuation of UHECRs due to the GZK effect. Such aprobability is defined by
ω(D,Ethr) ∝1
D2
s− 1
E−s+1thr
∫∞
Ei(D,Ethr)
E−sdE, (2)
whereEi (D,Ethr) is the initial energy, estimated as in[18], required by the particle to reach the Earth with fi-nal energyEthr. Moreover, events are generated by takinginto account the non-uniform exposure of the Auger Obser-vatory. The GZK horizonRGZK is defined as the distancewithin which 90% of the observed flux above the energythreshold is expected to be produced, i.e.ω(RGZK, Ethr) =0.1. It is similar for both UHE protons and iron nuclei, buttypically much shorter for nuclei with intermediate mass.In what follows we evaluate the predictions from the as-trophysical scenarios using the GZK attenuation expectedfor protons. We tested the density of sources from10−6
Mpc−3 to 10−3 Mpc−3 and present the results for three dif-ferent values of the energy threshold: 60 EeV, 70 EeV and80 EeV. For higher values of the energy threshold, the num-ber of events becomes too small to perform a reliable clus-tering analysis. Conversely, lower energy thresholds im-ply larger GZK horizons, and the incompleteness of galaxycatalogs limits the discrimination power of the method, aswill be discussed at the end of this section. For each value
of the densityρ, N = 43πρR
3GZK sources are generated in
a sphere with radiusRGZK(Ethr) for each energy thresholdconsidered. We make use of the 2MRS catalog because it isthe most densely sampled all-sky redshift survey to date. Itis a compilation [19] of the redshifts of theKmag < 11.25brightest galaxies from the 2MASS catalog [20]. It con-tains approximately 22,000 galaxies within 200 Mpc, pro-viding an unbiased measure of the distribution of galaxiesin the local universe, out to a mean redshift of z = 0.02, andto within 10 of the Galactic plane. To avoid biases due toits incompleteness in the galactic plane region, we excludegalaxies (as well as event arrival directions) with galac-tic latitudes|b| < 10 from all analyses. We use galax-ies with magnitudeM < −23.1, which makes the samplecomplete up to 80 Mpc with density≈ 10−3 Mpc−3, thelargest values we test. At larger distances, the density ofa complete sample is smaller, for instance≈ 10−4 Mpc−3
for D = 200 Mpc. In order to test higher values, we ex-tend the original catalog between 80 Mpc and 200 Mpcwith sources isotropically distributed in the sky in numbersuch that the density is also≈ 10−3 Mpc−3. Our approachis rather conservative, reducing the clustering signal in theskies obtained in the 2MRS case and providing, as a conse-quence, smaller values of the lower bounds of the densityof sources. The incompleteness of the catalog representsthe main impediment for performing our analysis with alower energy threshold for the events. The GZK horizonincreases for decreasing energy thresholds and, as a con-sequence, a greater isotropic contamination is required tocomplete the catalog, further reducing the clustering signaldue to large scale structure. On the other hand, the num-ber of events decreases by increasing the energy threshold,reducing the discrimination power of clustering detection.
4 Application to the data
The procedure for constraining the source density fromthe clustering properties of the UHECRs measured withthe Auger Observatory is as follows. We evaluate theACF function of a large number of simulated sets of ar-rival directions drawn (in number equal to the events in thedataset) from the two astrophysical scenarios under consid-eration and for different values of the source density. The95% CL upper (lower) bounds on the source density are thevalues for which only 5% of the simulated sets show more(less) clustering than the data, at a given angular scale.
We illustrate the procedure in figure 2 (top and bottom-left)for the particular case of the scenario with a uniform distri-bution of sources, for an energy thresholdEthr = 60 EeV,and for three different angular scales, namelyθ = 6, 12
and24. The solid line is the average number of pairs pre-dicted in this scenario as a function of the source densityand the shaded area represents the dispersion in the num-ber of pairs within 90% of the simulations. The dashedline corresponds to the number of pairs in the data. The95% CL lower and upper limits are the ends of the range insource density for whichnp in the data is within the shaded
7

M. DE DOMENICO et al. BOUNDS ON THE DENSITY OF SOURCES OFUHECRS FROM THEPAO
Figure 3: Lower bound (95% CL) on the source density ofUHECRs, as a function of the angular scale and for differ-ent values of the energy threshold (Ethr = 60, 70 and 80EeV). The number of events corresponding to each energythreshold is 67, 33 and 17, respectively (if the cut|b| > 10
is not applied, otherwise it is 51, 26 and 15, respectively).Left: uniform case.Right: 2MRS case.
area. In figure 2 (bottom-right) we show the result of thisprocedure as a function of the angular scale. The solid lineis the value of the source density for which the averagenumber of pairs coincides with that in the data at the an-gular scale considered. The shaded area incorporates the95% CL limits on the source density. The bounds are (typ-ically) more restrictive at smaller angular scales and theirvalidity depends on the uncertain strength of magnetic de-flections. Moreover, such bounds apply if typical magneticdeflections do not significantly modify the clustering prop-erties above the angular scale considered. In practice, theclustering observed in the current data set is insufficient toestablish upper bounds on the density of sources at 95%CLfor the astrophysical scenarios considered here, and onlylower bounds can be derived. In figure 3 we show the lowerboundρLB (95% CL) for the three energy thresholds con-sidered, for both the uniform (left panel) and the 2MRS(right panel) models. The bounds decrease with increas-ing angular scales and can also differ by up to one order ofmagnitude for the same angular scale and different energythresholds. At relatively small angular scales, the boundsderived from lower energy thresholds are more stringent,being of order of10−4 Mpc−3, regardless of the astrophys-ical scenario.
5 Conclusions
In this study we have shown that the number of pairs of ar-rival directions of UHECRs detected with the Pierre AugerObservatory, with energy larger than 60 EeV, can be usedto constrain the local density of their sources in particularastrophysical models. We have investigated two scenarios,one with sources uniformly distributed in the nearby uni-verse, and another one with sources distributed followingthe large scale structure of nearby matter. In both cases,equal intrinsic luminosity of the sources has been assumed.
If the effects of intervening magnetic fields do not smoothout the clustering properties of UHECRs on scales of about5 (as can be expected in the case of a proton composi-tion), the measurements imply a 95%CL lower limit onthe source density of order10−4 Mpc−3. Conversely, ifmagnetic deflections are larger, and such that the clusteringproperties observed reflect the expectation from the sourcescenario only at larger angular scales, then less stringentlower bounds apply. They are about one order of magni-tude smaller for angular scales around25. The boundsapply to specific scenarios, since they depend on the over-all distribution of sources.
References
[1] A.M. Hillas, Annu. Rev. Astron. Astr., 1984,22(1):425–444
[2] K. Greisen, Phys. Rev. Lett., 1966,16(17): 748–750[3] G.T. Zatsepin, V.A. Kuz’Min, JETP Lett., 1966,4: 78[4] J. Abraham et al., Science, 2007,318(5852): 938-943[5] J. Abraham et al., Astrop. Phys., 2008,29(3): 188–
204[6] P. Abreu et al., Astrop. Phys., 2010,34(5): 314–326[7] J. Abraham et al., Phys. Lett. B, 2010,685(4): 239–
246[8] R.U. Abbasi et al., Phys. Rev. Lett., 2008,100(10):
101101[9] R.U. Abbasi et al., Astrop. Phys., 2008,30(4): 175–
179[10] S.L. Dubovsky, P.G. Tinyakov, I.I. Tkachev, Phys.
Rev. Lett., 2000,85(6): 1154–1157[11] Z. Fodor, S.D. Katz, Phys. Rev. D, 2000,63(2):
23002[12] H. Yoshiguchi et al., Astroph. J., 2003,586(2): 1211–
1231[13] P. Blasi, D. De Marco, Astrop. Phys., 2004,20(5):
559–577[14] M. Kachelrieß, D. Semikoz, Astrop. Phys., 2005,
23(5): 486–492[15] A. Cuoco et al., Astroph. J., 2009,702(2): 825–832[16] R. Pesce, for the Pierre Auger Collaboration, paper
1160, these proceedings[17] D. Larson et al., Ap. J.S., 2011,192(2): 16[18] D. Harari, S. Mollerach, E. Roulet, JCAP, 2006,11:
012[19] J. Huchra et al., in: IAU Symposium No. 216, 2005,
p. 170; J. Huchra, L. Macri, et al., in preparation[20] T.H. Jarrett et al., Astron. J., 2000,119(5): 2498–
2531
8

32ND INTERNATIONAL COSMIC RAY CONFERENCE, BEIJING 2011
Search for energy-position correlated multiplets in Pierre Auger Observatory data
GERALDINA GOLUP1 FOR THE PIERRE AUGER COLLABORATION2
1Centro Atomico Bariloche, Instituto Balseiro (CNEA-UNCuyo-CONICET), S. C. de Bariloche, Argentina2 Observatorio Pierre Auger, Av. San Martın Norte 304, 5613 Malargue, Argentina(Full author list: http://www.auger.org/archive/authors_2011_05.html)[email protected]
Abstract: We present the results of an analysis of data recorded at the Pierre Auger Observatory in which we searchfor groups of directionally-aligned events (or ‘multiplets’) which exhibit a correlation between arrival direction and theinverse of the energy. These signatures are expected from sets of events coming from the same source after having beendeflected by intervening coherent magnetic fields. We here report the largest multiplets found in the data and compute theprobability that they arise by chance from an isotropic distribution of events. There is no statistically significant evidencefor the presence of multiplets arising from magnetic deflections in the present data.
Keywords: Pierre Auger Observatory, ultra-high energy cosmic rays, magnetic fields, multiplets.
1 Introduction
The identification of the sources of cosmic rays is greatlycomplicated by the fact that cosmic rays traverse magneticfields as they propagate from their sources to Earth.However, the deflections caused by magnetic fields areexpected to be inversely proportional to the energy of thecosmic rays. Therefore, it may be possible to identifyseveral cosmic ray events from the same source by lookingfor spatial alignments in their arrival directions and largecorrelations between the directions and the inverse of theenergy1. The identification of these kind of multipletswould not only allow for the accurate location of the direc-tion of the source, but would also provide a measurementof the integral of the component of the magnetic fieldorthogonal to the trajectory of the cosmic rays.
Cosmic rays are deflected by galactic and extragalacticmagnetic fields. The strength of extragalactic fields is notwell known, and the importance of their effect is a matterof debate [1, 2, 3]. In this study, we focus on the effectof the galactic field. The galactic field is also poorly con-strained, although there are considerable efforts underwayto provide measurements of its amplitude and orientation[4, 5, 6]. This field is usually described as the superposi-tion of a large-scale regular component and a turbulent one.The regular component has a few µG strength and is coher-ent on scales of a few kpc with a structure related to thespiral arms of the galactic disk. The deflection of cosmicrays with energy E and charge Z by the regular compo-nent of the magnetic field B after traversing a distance L is
given by
δ ≃ 1620 EeV
E/Z
∣∣∣∣∣∫ L
0
dl
3 kpc× B
2 µG
∣∣∣∣∣ . (1)
This is the predominant deflection because, although theturbulent component has a root mean square amplitude ofBrms ≃ (1 − 2)Breg, it has a much smaller coherencelength (typically Lc ≃ 50-100 pc) [7, 8], leading to asmaller deflection,
δrms ≃ 1.520 EeV
E/Z
Brms
3 µG
√L
1 kpc
√Lc
50 pc. (2)
In this study, we perform a search for correlated multipletsin the data set of events with energy above 20 EeV recordedat the Pierre Auger Observatory. This analysis relies onthe acceleration at the source of at least one abundant lightcomponent. Due to the magnitude of the magnetic fields in-volved, heavy nuclei at these energies would appear spreadover a very large region of the sky, probing regions withdifferent amplitudes and directions of the magnetic field,and hence losing their alignment and correlation with theinverse of energy.
1. To detect several events from the same source, the sourcesof cosmic rays should be steady, in the sense that the lifetime ofthe source is larger than the difference in the time delays due tothe propagation in the intervening magnetic fields for the ener-gies considered. Moreover, magnetic fields should also be steadyin the same sense so that cosmic rays traverse approximately thesame fields.
9

G. GOLUP et al. SEARCH FOR MULTIPLETS IN PIERRE AUGER OBSERVATORY DATA
2 The Pierre Auger Observatory and thedata set
The Pierre Auger Observatory, located in Malargue,Argentina, at 1400 m a.s.l., is the largest air shower arrayin the world and its main purpose is to measure ultra-highenergy cosmic rays (energy E > 1018 eV ≡ 1 EeV).It consists of a surface array of 1660 water Cherenkovstations. The surface array is arranged in an equilateraltriangular grid with 1500 m spacing, covering an area ofapproximately 3000 km2 [9]. The array is overlooked by27 telescopes at four sites [10] which constitute the fluores-cence detector. The surface and air fluorescence detectorsare designed to perform complementary measurements ofair showers created by cosmic rays. The surface array isused to observe the lateral distribution of the air showerparticles at ground level, while the fluorescence telescopesare used to record the longitudinal development of theshower as it moves through the atmosphere.
The data used for this analysis are 1509 events withE > 20 EeV and zenith angles smaller than 60 recordedby the surface detector array from 1st January 2004 to31st December 2010. The events are required to haveat least five active detectors surrounding the station withthe highest signal, and the reconstructed core must beinside an active equilateral triangle of stations [11]. Theangular resolution, defined as the 68th percentile ofthe distribution of opening angles between the true andreconstructed directions of simulated events, is better than0.9 for events that trigger at least six surface detectors(E > 10 EeV) [12]. The absolute energy scale, given bythe fluorescence calibration, has a systematic uncertaintyof 22% and the energy resolution is about 15% [13].
3 Method for searching multiplets
If the magnetic deflections are small, it is a good approxi-mation to consider a linear relation between the cosmic rayobserved arrival directions θ and the inverse of the energyE,
θ = θs +Ze
E
∫ L
0
dl × B ≃ θs +D(θs)
E, (3)
where θs denotes the actual source direction, and D(θs)will be called the deflection power2. In the case of protonsources, departures from the linear approximation arerelevant for energies below 20 EeV for typical galacticmagnetic field models [14].
In order to identify sets of events coming from the samesource, the main requirement will be that they appearaligned in the sky and have a high value of the correlationcoefficient between θ and 1/E. We will further requirethat the multiplets contain at least one event3 with energyabove 45 EeV and that the multiplets do not extend more
than 20 in the sky.
To compute the correlation coefficient for a given subset ofN nearby events, we first identify the axis along which thecorrelation is maximal. For this we initially use an arbitrarycoordinate system (x, y) in the tangent plane to the celestialsphere (centered in the average direction to the events) andcompute the covariances Cov(x, 1/E) = 1
N
∑Ni=1(xi −
⟨x⟩)(1/Ei − ⟨1/E⟩) and Cov(y, 1/E). We then rotate thecoordinates to a system (u,w) in which Cov(w, 1/E) = 0,and hence Cov(u, 1/E) is maximal. This corresponds to arotation angle between the u and x axes given by
α = arctan
(Cov(y, 1/E)
Cov(x, 1/E)
). (4)
The correlation between u and 1/E is measured throughthe correlation coefficient
C(u, 1/E) =Cov(u, 1/E)√Var(u)Var(1/E)
, (5)
where the variances are given by Var(x) =⟨(x− ⟨x⟩)2
⟩.
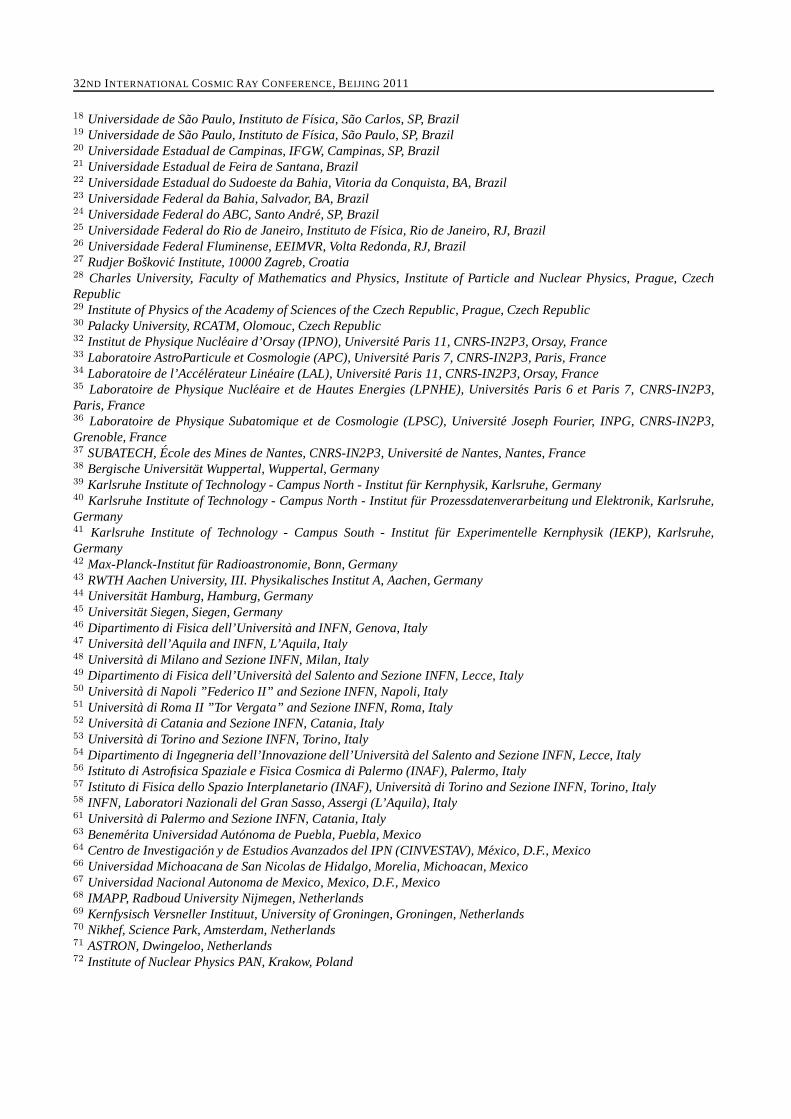
A given set of events will be identified as a corre-lated multiplet when C(u, 1/E) > Cmin and whenthe spread in the transverse direction w is small,W = max(|wi − ⟨w⟩ |) < Wmax. The values forCmin and Wmax were chosen as a compromise betweenmaximizing the signal from a true source and minimizingthe background arising from chance alignments. Weperformed numerical simulations of sets of events fromrandomly-located extragalactic sources. In these simu-lations, protons were propagated through a bisymmetricmagnetic field with even symmetry (BSS-S) [15, 16] andthe effect of the turbulent magnetic field included bysimply adding a random deflection with root mean squareamplitude δrms = 1.5(20 EeV/E). We considered onehundred extragalactic sources located at random directionsand simulated sets of N events with energies following anE−2 spectrum at the source and adding random gaussianuncertainties in the angular directions and energies toaccount for the experimental resolution. As an example weshow in Figure 1 (left panel) the resulting distribution ofW for multiplets of 14 events. The significance of a givenmultiplet can be quantified by computing the fraction ofisotropic simulations in which a multiplet with the sameor larger multiplicity and passing the same cuts appearsby chance. We note that when reducing Wmax, someof the events of the multiplets will be missed and theirmultiplicity will be reduced. However, the significance ofa smaller multiplet passing a tighter bound on Wmax can
2. The deflection power will be given in units of 1 100 EeV,which is ≈ 1.9 e µG kpc.
3. Note that the energy of the most energetic event of a set of10 events with E > 20 EeV from a source with spectral indexs = 2.5 is larger than 45 EeV with a probability of 97% (for aspectral index s = 3 this probability is ∼ 90%).
10

32ND INTERNATIONAL COSMIC RAY CONFERENCE, BEIJING 2011
be larger than the significance of the complete multipletwith a looser Wmax cut. It turns out that the largest meansignificance for the simulated sources appears when acut Wmax ≃ 1.5 is applied. In the case of 14-plets, in50% of the simulations all the events pass this cut and themultiplet will be reconstructed as a 14-plet, while in 38%of the cases one event is lost and in 11% of the cases twoevents are lost. The angular scale of 1.5 provides in facta reasonable cut which accounts for the angular resolutionand the mean value of the turbulent field deflections.
A similar analysis can be performed to fix the cut onthe correlation coefficient Cmin. The distribution ofC(u, 1/E) for the simulated 14-plets is shown in Figure 1(right panel). The largest mean significance is attained nowfor values of Cmin in the range from 0.85 to 0.9, dependingon the multiplicity considered. For a cut Cmin = 0.9,in 57% of simulations with 14 events all events pass thecuts, in 12% of the simulations one event is lost and in11% of them two events are lost. We will then fix in thefollowing Wmax = 1.5 and Cmin = 0.9. We note that thechoice of the optimal cut slightly depends on the galacticmagnetic field model considered in the simulations and onthe modeling of the turbulent field deflections.
When a correlated multiplet is identified it is possible toreconstruct the position of its potential source (us, 0) (in theu-w coordinate system) and estimate the deflection powerD by performing a linear fit to the relation
u = us +D
E. (6)
4 Results
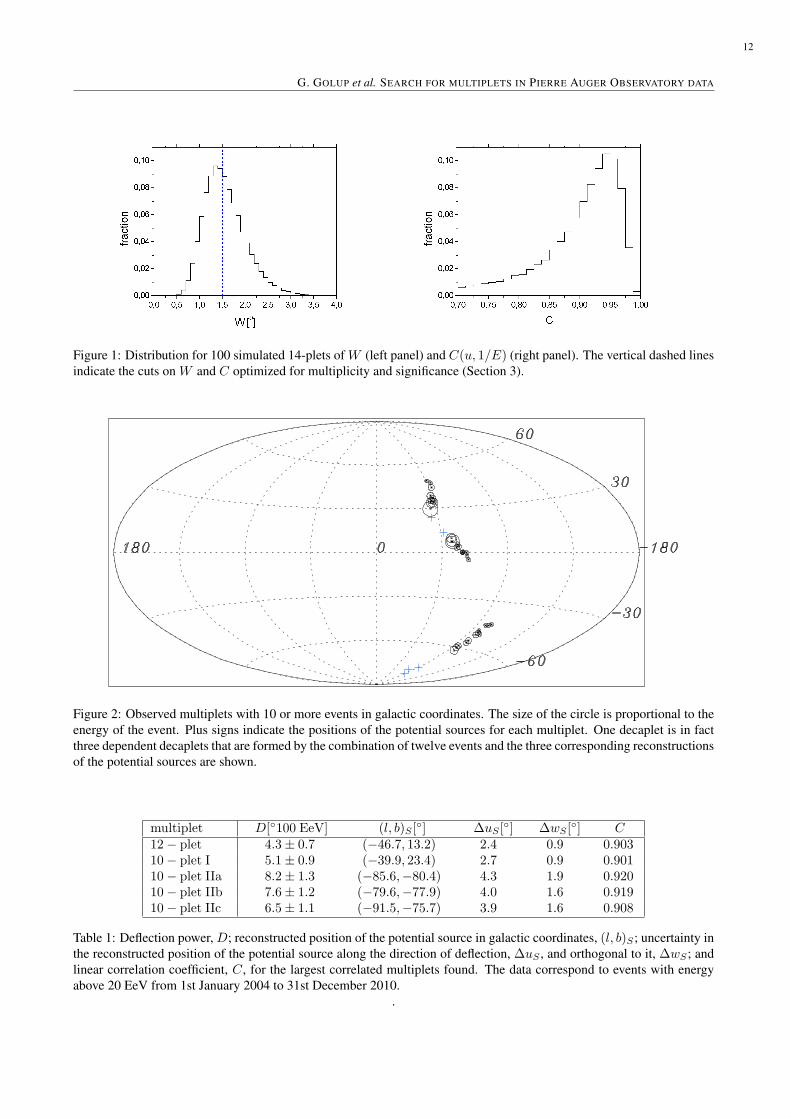
A search for correlated multiplets was performed in thePierre Auger Observatory data with events with energiesabove 20 EeV. The largest multiplet found is one 12-pletand there are also two independent decaplets. We show thearrival directions in galactic coordinates of these multipletsin Figure 2. In Table 1, we list their deflection power,position of the potential source location and correlationcoefficient4. The uncertainties in the reconstruction ofthe position of the potential sources have been calculatedby propagating the uncertainties in energy and arrivaldirection to an uncertainty in the rotation angle (Eq. 4) andin the linear fit performed to the deflection vs. 1/E (Eq. 6).
We performed the same analysis applied to simulationsof events with random arrival directions, weighted by thegeometric exposure of the experiment [17], and with theenergies of the observed events. From these realizationswe computed the probability that the observed number(or more) of correlated multiplets appears by chance. Thefraction of simulations with at least one multiplet with 12or more events is 6%, and the fraction having at least threemultiplets with 10 or more events is 20%. From these
chance probabilities we conclude that, in the present dataset, there is no statistically significant evidence for thepresence of multiplets from actual sources. We note thatwith the present statistics, a multiplet passing the requiredselection cuts should have at least 14 correlated events inorder that its chance probability be 10−3.
5 Conclusions
We performed a search for energy-position correlated mul-tiplets in the data collected by the Pierre Auger Observatorywith energy above 20 EeV. The largest multiplet found wasone 12-plet. The probability that it appears by chance froman isotropic distribution of events is 6%. Therefore, there isno significant evidence for the presence of correlated mul-tiplets arising from magnetic deflections in the present dataset. We will continue analyzing future data and check ifsome of the observed multiplets grow significantly or ifsome new large multiplets appear.
References
[1] G. Sigl, F. Miniati, T. Ensslin, Phys. Rev. D, 2003, 68:043002.
[2] K. Dolag, D. Grasso, V. Springel, I. Tkachev, J. Cos-mology Astropart. Phys., 2005, 0501: 009.
[3] S. Das, H. Kang, D. Ryu, J. Cho, Astrophys. J., 2008,682: 29.
[4] J. L. Han, IAU Symposium, 2009, 259: 455.[5] R. Beck, AIP Conf. Proc., 2009, 1085: 83.[6] J. C. Brown, ASP Conf. Series, 2011, 438: 216.[7] R. J. Rand, S.R. Kulkarni, Astrophys. J., 1989, 343:
760.[8] H. Ohno, S. Shibata, Mon. Not. R. Astron. Soc., 1993,
262: 953.[9] I. Allekotte et al. , Nucl. Instrum. Meth., 2008, A586:
409.[10] The Pierre Auger Collaboration, Nucl. Instrum.
Meth., 2010, A620: 227.[11] The Pierre Auger Collaboration, Nucl. Instrum.
Meth., 2010, A613: 29.[12] C. Bonifazi, for the Pierre Auger Collaboration, Nucl.
Phys. B (Proc. Suppl.), 2009, 190: 20.[13] R. Pesce, for the Pierre Auger Collaboration, paper
1160, these proceedings.[14] G. Golup, D. Harari, S. Mollerach, E. Roulet, As-
tropart. Phys., 2009, 32: 269.[15] T. Stanev, Astrophys. J., 1997, 479: 290.[16] D. Harari, S. Mollerach, E. Roulet, J. High Energy
Phys., 1999, 08: 022.[17] P. Sommers, Astropart. Phys., 2001, 14: 271.
4. Decaplet II in Table 1 consists of three dependent sets of tenevents (a-c) that are formed by the combination of a set of twelveevents. These three decaplets are not independent of each othersince they have most events in common.
11
G. GOLUP et al. SEARCH FOR MULTIPLETS IN PIERRE AUGER OBSERVATORY DATA
Figure 1: Distribution for 100 simulated 14-plets of W (left panel) and C(u, 1/E) (right panel). The vertical dashed linesindicate the cuts on W and C optimized for multiplicity and significance (Section 3).
Figure 2: Observed multiplets with 10 or more events in galactic coordinates. The size of the circle is proportional to theenergy of the event. Plus signs indicate the positions of the potential sources for each multiplet. One decaplet is in factthree dependent decaplets that are formed by the combination of twelve events and the three corresponding reconstructionsof the potential sources are shown.
multiplet D[100 EeV] (l, b)S [] ∆uS [
] ∆wS [] C
12− plet 4.3± 0.7 (−46.7, 13.2) 2.4 0.9 0.90310− plet I 5.1± 0.9 (−39.9, 23.4) 2.7 0.9 0.90110− plet IIa 8.2± 1.3 (−85.6,−80.4) 4.3 1.9 0.92010− plet IIb 7.6± 1.2 (−79.6,−77.9) 4.0 1.6 0.91910− plet IIc 6.5± 1.1 (−91.5,−75.7) 3.9 1.6 0.908
Table 1: Deflection power, D; reconstructed position of the potential source in galactic coordinates, (l, b)S ; uncertainty inthe reconstructed position of the potential source along the direction of deflection, ∆uS , and orthogonal to it, ∆wS ; andlinear correlation coefficient, C, for the largest correlated multiplets found. The data correspond to events with energyabove 20 EeV from 1st January 2004 to 31st December 2010.
.
12

32ND INTERNATIONAL COSMIC RAY CONFERENCE, BEIJING 2011
Search for Galactic point-sources of EeV neutrons
BENJAMIN ROUILL E D’ORFEUIL1 FOR THEPIERRE AUGER COLLABORATION2
1Kavli Institute for Cosmological Physics and Enrico Fermi Institute, The University of Chicago, Chicago, IL, USA2Observatorio Pierre Auger, Av. San Martin Norte 304, (5613)Malargue, Mendoza, ArgentinaFull author list: http://www.auger.org/archive/[email protected]
Abstract: The Pierre Auger Observatory has sensitivity to neutron fluxes produced at cosmic ray acceleration sites inthe Galaxy. Because of relativistic time dilation, the neutron mean decay length is(9.2 × E) kpc, whereE is theneutron energy in EeV. A blind search over the field of view of the Auger Observatory for a point-like excess yieldsno statistically significant candidates. The neutron flux upper limit is reported as a celestial function for three differentenergy thresholds. Also a search for excesses of cosmic raysin the direction of selected populations of candidate Galacticsources is performed. The bounds obtained constrain modelsfor persistent discrete sources of EeV cosmic rays in theGalaxy.
Keywords: Pierre Auger Observatory; high-energy neutron sources; neutron flux limits.
1 Motivations for EeV neutron astronomy
At EeV (1 EeV = 1018 eV) energies, the Galactic mag-netic field isotropizes the charged particle fluxes, makingit impossible to pick out possible Galactic proton sources.On the other hand, neutron astronomy inside our Galaxy ispossible. Neutrons travel indeed undeflected by magneticfields, and their mean decay lengthλn = (9.2 × E) kpc,whereE is the neutron energy in EeV, is comparable to theEarth distance from the Galactic center. Hence, neutroninduced extensive air showers (EAS) could produce a di-rectional excess of cosmic rays (CRs) in the sky, clusteredwithin the observatory’s angular resolution.
High energy neutrons can be produced by the interactionof accelerated protons or heavier nuclei with the radiationand baryonic backgrounds inside the sources or in their sur-roundings. They can take over most of the initial CR en-ergy per nucleon and would not be magnetically bound tothe accelerating region. Gamma-rays can also be generatedvia these interactions, but they acquire a lesser fraction ofthe primary CR energy.
If one assumes that CRs are produced with a continuouspower-law spectrum that extends from GeV to EeV with aninjection spectral index of−2, the energy deposited in eachdecade should be comparable. Accordingly, the observedGeV-TeV gamma-ray fluxes, provided that they have a sig-nificant component of hadronic origin, would motivate thesearch for neutron fluxes in the EeV range.
In terms of high energy CR astrophysics, it is crucial tolook for Galactic sources that could accelerate particles up
to EeV energies. A time-honored picture is that the transi-tion between particles produced in Galactic and extragalac-tic sources happens at the ‘ankle’, a hardening of the slopein the CR energy spectrum appearing in the middle of theEeV energy decade [1], that could naturally be explainedby the emergence of a dominant extragalactic component(see [2] for a review). This model requires that particles beaccelerated above∼ 1 EeV by sources inside our Galaxy.
2 Methodology
The array of surface detectors (SD) of the Pierre Auger Ob-servatory is used to search for point-like excesses at EeVenergies that would be indicative of a flux of neutral parti-cles from a discrete source. The sensitivity of the SD in thisenergy range and its large aperture ensures that constrain-ing limits can be set over a large fraction of the sky. Theseupper limits will be interpreted as upper limits on neutronfluxes since (i) above any fixed energy, the emission rateof neutrons from a CR source in our Galaxy is expected tobe well above the emission rate of gamma-rays of hadronicorigin and (ii) in the search for an excess of arrival direc-tions in a small solid angle, the SD is far more sensitiveto neutrons than to gamma-rays. Indeed, roughly half ofthe signal in hadronic EAS is due to muons traversing thewater Cherenkov-stations. Gamma-ray EAS, being muonpoor, should, for a given energy, produce a smaller signal,they hence have a reduced trigger efficiency and are alsoharder to identify in the larger background of lower energyCRs.
13

B. ROUILL E D’ORFEUIL et al.SEARCH FORGALACTIC SOURCES OFEEV NEUTRONS
Figure 1: Distribution of the Li-Ma significances of the blind searches together with the 3σ containment of 5000 Monte-Carlo samples of an isotropic sky. From left to right:[1 − 2] EeV, [2 − 3] EeV, andE ≥ 1 EeV.
We perform here two analyses to constrain the neutron fluxfrom Galactic sources in three energy bands:[1 − 2] EeV,[2 − 3] EeV, andE ≥ 1 EeV. First, a blind search forlocalized excesses in the CR flux over the exposed sky wascarried out. The search compared the number of observedevents with that expected from an isotropic background,in top-hat counting regions matching the angular resolu-tion of the instrument. Flux upper limits were derived andplotted on celestial maps. Second, a stacking analysis wasperformed in the direction of bright Galactic gamma-raysources detected by the Fermi LAT (100 MeV – 100 GeV)and the H.E.S.S. (100 GeV – 100 TeV) telescopes.
These analyses use high quality events with zenith anglesθ < 60 recorded by the SD between 1 January 2004 and30 October 2010. Periods of unstable acquisition were re-moved. More than 340000 SD events have been recon-structed with energies above 1 EeV.
3 Blind search over the covered sky
To study the possible presence of overdensities, one needsfirst to obtain the background expectations for the differentsky directions under the assumption of an isotropic CR dis-tribution. This is achieved by parametrizing the zenith an-gle distribution of the observed events in the energy rangeunder study to smooth out statistical fluctuations [3].
Sensitivity to point sources is optimized by matching thetarget region size to the angular resolution of the instru-ment. The angular resolution of the SD,ψ, correspond-ing to the 68% containment radius, is better than1.8 and1.5 above 1 EeV and 2 EeV, respectively [5]. For a gaus-sian point spread function characterized byσ, the signal-to-noise ratio is optimized for a top-hat radius given by1.59σ = 1.05ψ.
We use an HEALPix [4] grid with resolution parameterNside = 128 to define the center point of each target re-gion. The size of a pixel being small (27.5′) compared to atarget region, there is a significant overlap between neigh-boring targets. The number of arrival directions (observedor expected) in any target is taken as the sum of the counts
in the pixels (using a higher resolution:Nside = 1024)whose center is contained in the target region.
We evaluate the Li-Ma significance1 [6] in each target. Thedistribution of the significances of the blind searches areshown in Figure 1. The blind search over the field of view(FOV) of the SD reveals no candidate point on the sky thatclearly stands up above the expected distribution of signifi-cances in isotropic simulations (shaded region). It is there-fore sensible to derive a flux upper limit in each target.
We adopt the definition of [7] to compute the upper limitsUL of confidence levelCL = 1−α on the expected signals, when an observation results in a countn in the presenceof a Poisson background distribution with mean valueb:
P (≤ n|b+ sUL) = α× P (≤ n|b) (1)
The CL is set to 95%. For each target we derive the boundson the neutron flux by dividingsUL by the exposure (inkm2 yr). The latter is obtained by dividing, for each region,the expected number of background events per target solidangle by the intensity of CRs in the energy bin under study,which is obtained from the measured CR energy spec-trum [1]. As the target circle encompasses 71.75% of thetotal gaussian-distributed signal, the final upper limit totheflux is obtained by scaling the above bound by 1/0.7175.Figure 2 presents sky maps of the flux upper limits for thethree energy bins considered for the analysis. The upperlimits become less stringent near the border of the FOV be-cause of the reduced statistics. We hence only present theresults forδ < 15 to avoid the lowest exposure regions.
Note that if the background were due to a heavier com-position, since the efficiency for detection of heavy nucleiis expected to be slightly larger at EeV energies than forthe potential neutron signal, the bounds could be slightlyrelaxed. We note however that the measurements of thedepth of shower maximum are consistent with a predomi-nantly light composition at EeV energies [8].
The galactic center is a particularly interesting target be-cause of the presence of a massive black hole. The results
1. For theα parameter in the expression of the Li-Ma signifi-cance, we useαLM = nexp/ntot with nexp the background ex-pected in the target andntot the total number of events.
14

32ND INTERNATIONAL COSMIC RAY CONFERENCE, BEIJING 2011
Figure 2: Flux upper limits celestial maps (in unit of km−2 yr−1) in Galactic coordinates. From top to bottom:[1−2] EeV,[2 − 3] EeV, andE ≥ 1 EeV.
for the window centered on it and forE ≥ 1 EeV showsno excess (S = −1.43) and hence we obtain a 95% CL up-per limit on the flux from a point source in this directionof 0.01 km−2 yr−1, which updates the bounds obtainedpreviously in [9]. We note that for directions along theGalactic plane the upper limits are below 0.024 km−2 yr−1,0.014 km−2 yr−1 and 0.026 km−2 yr−1 for the energy bins[1 − 2] EeV, [2 − 3] EeV andE ≥ 1 EeV, respectively.
4 Targeted search
The targeted search involves the selection of bright gamma-ray sources and the search for an excess in their directions.We define the excess signal in a solid angleΩ around onesource as:S = Ns/
√Niso, whereNs is the difference be-
tween the observed and expected (Niso) number of eventsin the target region around each source.
In order to improve the signal over background, we performa stacking analysis on sets ofNs sources. The stacked ex-cess signal readsSstacked =
∑
Ns/√
∑
Niso and scales asS√Ns for the ideal case in which sources producing equal
neutron flux on Earth are detected with uniform coverage.
The acceleration of particles above 1 EeV by sources insideour Galaxy is theoretically challenging. The most powerfulGalactic objects either do not possess the required luminos-ity to accelerate particles to such high energy, or presentacceleration environments that are too dense for particlesto escape without losing energy. Pulsars and Pulsar WindNebulæ (PWN) however are considered to be good poten-tial accelerators (see e.g., [10, 11]), and recent work shows
15

B. ROUILL E D’ORFEUIL et al.SEARCH FORGALACTIC SOURCES OFEEV NEUTRONS
that the maximum energy of accelerated iron nuclei mayreach5 EeV in certain supernova remnants (SNR) [12].Models predicting the production of neutrons at EeV en-ergies from powerful Galactic sources have also been dis-cussed (e.g., [13, 14]). The candidate sources are expectedto be strong gamma-ray emitters at GeV and TeV energies.
For this reason, we apply this analysis to Galactic gamma-ray sources extracted from the Fermi LAT Point SourceCatalog [15] and the H.E.S.S. Source Catalog2, focussingon pulsars, PWN and SNR. Targets were selected amongthe sources located in the portion of the Galactic plane, de-fined as|b| < 10, covered by the FOV of the SD, andlocated at a distance shorter than 9 kpc (λn at 1 EeV). Asan example, we built two sets by selecting from each cat-alog the ten brightest sources (in flux observed on Earth)fulfilling these criteria. Our targets are listed in Tables 1and 2.
Name 1FGL l [deg] b [deg] distance [kpc]
J0835.3-4510 263.55 -2.79 0.29 ± 0.02J1709.7-4429 343.10 -2.69 1.4 − 3.6J1856.1+0122 34.70 -0.42 2.8J1809.8-2332 7.39 -1.99 1.7 ± 1.0J1801.3-2322c 6.57 -0.21 1.9J1420.1-6048 313.54 0.23 5.6 ± 1.7J1018.6-5856 284.32 -1.70 2.2J1028.4-5819 285.06 -0.49 2.3 ± 0.7J1057.9-5226 285.98 6.65 0.7 ± 0.2J1418.7-6057 313.33 0.14 2 − 5
Table 1: Set of bright sources selected from the Fermi LATPoint Source Catalog. Distances are from [16] and the ref-erences cited in [17].
Name HESS l [deg] b [deg] distance [kpc]
J0852-463 266.28 -1.24 0.2J0835-455 263.85 -3.09 0.29J1713-397 347.28 -0.38 1J1616-508 332.39 -0.14 6.5J1825-137 17.82 -0.74 3.9J1708-443 343.04 -2.38 2.3J1514-591 320.33 -1.19 5.2J1809-193 10.92 0.08 3.7J1442-624 315.41 -2.30 2.5J1640-465 338.32 -0.02 8.6
Table 2: Set of bright sources selected from the H.E.S.S.Source Catalog. Distances are from the TeVCat catalog(http://tevcat.uchicago.edu/).
The stacked signal computed from the SD data at the posi-tions of the two sets of sources are presented in Table 3 forthe three energy bins under study. No excess is found.
Set of sources Energy bin [EeV]Sstacked
Table 1 [1 − 2] 2.07Table 1 [2 − 3] 0.51Table 1 ≥ 1 2.35Table 2 [1 − 2] -0.75Table 2 [2 − 3] -0.40Table 2 ≥ 1 -0.89
Table 3: Application to sets of sources (Tables 1 and 2).Stacked excess signals,Sstacked derived for the SD data.
5 Conclusion
The data recorded by the Auger Observatory in the EeV en-ergy range has been used to search for point like excessesthat would be indicative of a flux of neutrons from Galacticsources. Two analyses were performed, (i) a blind searchof the exposed sky and (ii) a stacking analysis in the di-rection of bright gamma-ray sources detected by the FermiLAT and H.E.S.S. telescopes. Both analyses reveal no sta-tistically significant excess. Upper limits were calculatedfor all parts of the sky. Above 1 EeV, the flux upper limit isless than0.065 km−2 yr−1 corresponding to an energy fluxof 0.13 EeV km−2 yr−1 ≃ 0.4 eV cm−2 s−1 in the EeVdecade assuming an1/E2 differential energy spectrum.
References
[1] The Pierre Auger Collaboration, Phys. Lett., 2010,B685: 239-246
[2] K. Kotera, A. V. Olinto, ARAA, 2011,49: 119-53[3] J.-Ch. Hamilton, for the Pierre Auger Collaboration,
Proc. 29th ICRC, Pune, India, 2005,7: 63-66[4] K. M. Gorski et al., ApJ, 2005,622: 759-771[5] C. Bonifazi, for the Pierre Auger Collaboration, Nucl.
Phys. B (Proc. Suppl.), 2009,190: 20-25[6] T.-P. Li, Y.-Q. Ma, ApJ, 1983,272: 317-324[7] G. Zech, Nucl. Instrum. Meth., 1989,A277: 608-610[8] The Pierre Auger Collaboration, PRL, 2010,104:
091101[9] The Pierre Auger Collaboration, Astropart. Phys.,
2007,27: 244-253[10] M. Giller, M. Lipski, J. Phys., 2002,G28: 1275-1286[11] W. Bednarek, M. Bartosik, A&A, 2004,423: 405-413[12] V. Ptuskin, V. Zirakashvili, E.-S. Seo, ApJ, 2010,718:
31-36[13] D. Grasso, L. Maccione, Astropart. Phys., 2005,24:
273-288[14] F. Aharonian, A. Neronov, ApSS, 2005,300: 255-265[15] A. A. Abdo et al., ApJS, 2010,188: 405-436[16] D. A. Green, Bull. Astron. Soc. India, 2009,37: 45-
61[17] A. A. Abdo et al., ApJS, 2010,187: 460-494
2. http://www.mpi-hd.mpg.de/hfm/HESS/pages/home/sources/
16

32ND INTERNATIONAL COSMIC RAY CONFERENCE, BEIJING 2011
An update on a search for ultra-high energy photons using the Pierre Auger Observatory
MARIANGELA SETTIMO1 FOR THEPIERRE AUGER COLLABORATION2
1University of Siegen, Department of Physics, 57068 Siegen,Germany2Observatorio Pierre Auger, Av. San Martın Norte 304, 5613 Malargue, Argentina(Full author list: http://www.auger.org/archive/authors 201105.html)[email protected]
Abstract: The large collection area of the Pierre Auger Observatory and the availability of a variety of composition-sensitive parameters provide an excellent opportunity to search for photons in the cosmic ray flux above 1018 eV. Upperlimits published previously, using data from the Observatory, placed severe constraints on top-down models. Now, theincrease in exposure by more than a factor 2 since 2008 together with the combination of different observables means thatthe detection of GZK-photons predicted using bottom-up models is almost within reach. Current results will be presentedand their implications will be discussed.
Keywords: Pierre Auger Observatory, UHE Photons, cosmic rays
1 Introduction
Photons are one of the theoretical candidates for ultra-high energy cosmic rays (UHECR) with energies largerthan 1018 eV. A large fraction (∼ 50%) of photons inthe cosmic-ray spectrum at the highest energies is in-deed predicted within several “top-down” models to ex-plain the origin of cosmic rays. Severe constraints to thesemodels were imposed by previous photon searches above1019 eV [1]. A smaller contribution of typically (0.01 - 1)%above 1019 eV [2] is additionally expected as the productof the photoproduction of pions with the microwave back-ground (GZK effect [3, 4]). The Pierre Auger Observa-tory [5] has reported a suppression of the cosmic ray en-ergy spectrum beyond 1019.6 eV [6] which is consistentwith the predicted GZK cut-off for protons but could alsobe due to the photon disintegration of heavy nuclei or dueto a limit in the maximum particle energy reached at thesources. The observation of a photon flux compatible withthis theoretical prediction could provide an independentproof of the GZK process. The upper limits on the pho-ton fraction were extended to 2 EeV in [7] using the hybriddetection mode provided by the Pierre Auger Observatory.The analysis was based on the measurement of the depth ofthe shower maximum,Xmax , since photon induced show-ers are expected to develop deeper in the atmosphere com-pared to hadrons. In addition, they are also characterizedby a smaller number of secondary muons and a more com-pact “footprint” at the ground.
In this work we improve the search for EeV photons withhybrid events by: (i) combining observables of the fluores-
cence detector and the surface array for a better photon-hadron discrimination; (ii) extending the energy range by afactor 2, down to 1 EeV; and (iii) determining bounds onthe flux of photons.
2 Photon search
The Pierre Auger Observatory, located in Malargue, Ar-gentina, consists of a surface array (SD) [8] of 1660 waterCherenkov stations spread over an area of 3000 km2 andoverlooked by 27 air fluorescence telescopes [9]. The SDsamples the density of the secondary particles of the airshower at the ground while the fluorescence detector (FD)observes the longitudinal development of the shower. Theanalysis presented in this work useshybrid data (detectedby at least one FD telescope and one SD station) collectedbetween January 2005 and September 2010. Due to theFD duty cycle (∼ 13%) the event statistics is reduced com-pared to the SD-only detection mode. However, the hybriddetection technique provides a precise geometry and en-ergy determination with the additional benefit of a smallerenergy threshold for detection (around the EeV range).
To improve the photon-hadron discrimination powerwe complement the previous analysis, based on theXmax measurement, with an SD observable,Sb, definedin [10] as
Sb =∑i
Si
(Ri
Rref
)b
(1)
where the sum runs over the triggered stations,Si is therecorded signal in the station at distanceRi from the hybrid
17

M. SETTIMO et al. PAPERAN UPDATE ON A SEARCH FOR ULTRA-HIGH ENERGY PHOTONS USING THEPIERRE AUGEROBSERVATORY
)b
(S10
log-3 -2 -1 0 1 2 3
) -2
(g
cmm
axX
500
600
700
800
900
1000
1100
1200
1300
proton
photon
/eV) < 18.5γ
(E10
18 < log
Figure 1: Scatter plot ofXmax vs log10(Sb) for proton (redcrosses) and photon (empty blue circles) simulated showerswith energy between 1018 and 1018.5 eV.
reconstructed axis andRref is a reference distance equalto 1000 m for this analysis. The exponentb is chosen equalto 4 for maximizing the separation power between photonsand hadrons. TheSb parameter combines the different am-plitude of the signal in the surface detector and the sharperlateral distribution function (i.e. the signals recorded in theSD stations as a function of distance from the axis) ex-pected for photon induced showers. Events with zenith an-gle smaller than 60 and with a good geometry reconstruc-tion are selected for the analysis. To ensure a reliable pro-file reconstruction we require: a reducedχ2 of the longitu-dinal profile fit to the Gaisser-Hillas function smaller than2.5, aχ2 of a linear fit to the longitudinal profile exceed-ing the Gaisser-Hillas fitχ2 by at least a factor of 1.1, theXmax observed within the field of view of the telescopes,the Cherenkov light contamination smaller than 50% andthe uncertainty of the reconstructed energy less than 20%.To reject misreconstructed profiles, only time periods withthe sky not obscured by clouds and with a reliable measure-ment of the vertical optical depth of aerosols [11, 12], areselected. On the SD side we require at least 4 active sta-tions within 2 km from the hybrid reconstructed axis. Thisprevents an underestimation ofSb (which would mimic thebehavior of a photon event) due to missing or temporarilyinefficient detectors. For the classification of photon candi-dates we perform a Fisher analysis [13] trained with a sam-ple of a total of∼30000 photon and proton CORSIKA [14]showers generated according to a power law spectrum be-tween 1017 and 1020 eV. QGSJET-II [15] and FLUKA [16]are used as hadronic interaction models. To carefully repro-duce the operating conditions of the DAQ, time dependentsimulations are performed according to the hybrid detec-tor on-time [17]. The actual configurations of FD and SDand realistic atmospheric conditions are also taken into ac-count. The correlation betweenXmax andSb is shown inFigure 1 for well reconstructed photon (empty blue circles)
Fisher response-1.5 -1 -0.5 0 0.5 1 1.5
num
ber
of e
ntrie
s (a
rbitr
ary
units
)
0.5
1
1.5
2
2.5
3
3.5
4/eV) <18.5
γ18< Log(EProton
Photon
Figure 2: Distribution of the Fisher response for proton(red) and photon (blue) for simulations with energy be-tween 1018 and 1018.5 eV. Photon-like events are selectedrequiring a Fisher value larger than Xcut (dashed line) asindicated by the arrow.
and proton (red crosses) showers, in the energy interval be-tween 1018 and 1018.5 eV. Photon-like events are expectedto lie in the top-left part of the plot because of the deeperXmax and of the smallerSb. A Fisher analysis is performedin bins of 0.5 in the logarithm of energy and, for the mo-ment, using only proton showers since they are expectedto be the main source of background for the photon search.The impact of a mixed composition assumption will be dis-cussed later. The Fisher response is shown in Figure 2, forthe same conditions of Figure 1. The best performance ofthis combination of observables, compared to FD-only orSD-only, is reached at the lowest energies. Particularly athigher energies, the main contribution to the Fisher observ-able comes fromXmax . Photon-like events are selectedby applying an “a priori” cut at 50% of the photon detec-tion efficiency. This provides a conservative result in theupper limit calculation by reducing the dependence on thehadronic interaction models and on the mass compositionassumption. With this choice the expected hadron contam-ination is about 1% in the lowest energy interval (between1018 and 1018.5 eV) and it becomes smaller for increasingenergies.
Applying the method to data, 6, 0, 0, 0 and 0 photon can-didates are found for energies above 1, 2, 3, 5 and 10 EeV.We checked with simulations that the observed number ofphoton candidates is consistent with the expectation for nu-clear primaries, under the assumption of a mixed composi-tion. For the two events with the deepestXmax (both largerthan 1000 g cm−2) the hadronic background has been in-dividually checked by simulating 1000 dedicated protonCORSIKA showers with the same energy, arrival directionand core position as reconstructed for the real events. Theactual SD and FD configurations at the detection time areconsidered. The profile of one candidate is shown in Fig-
18

32ND INTERNATIONAL COSMIC RAY CONFERENCE, BEIJING 2011
]2slant depth [g/cm700 800 900 1000 1100 1200 1300
)]2dE
/dX
[PeV
/(g/
cm
0.5
1
1.5
2
2.5
3
3.5/Ndf= 93.8/952χ-2 10 gcm± = 1023 maxX
)b
(S10
log-1 -0.5 0 0.5 1 1.5 2 2.5
)-2
Xm
ax (
g cm
600
700
800
900
1000
1100
1200 Selected candidateRealistic proton simulations
Photon-like events
Figure 3: Example of one photon candidate. Top: longi-tudinal profile and a Gaisser-Hillas fit. Bottom:Xmax vslog10(Sb) for the candidate (triangle) compared to dedi-cated proton simulations (crosses). Photon-like events se-lected after the Fisher analysis are marked as empty circles.
ure 3 (top). The values ofXmax andSb are compared tothe expectation for protons (bottom). A fraction of about2% of such background events passes the cut on the Fisherobservable (empty circles).
3 Photon upper limits
The 95% CL upper limits on the photon fluxΦ95CLγ inte-
grated above an energy thresholdE0 is given by:
Φ95CLγ =
N95CLγ (Eγ > E0)
Eγ,min. (2)
whereEγ is the reconstructed energy assuming that theprimary particle is a photon (i.e., the calorimetric energymeasured by FD plus a correction of about 1% due to theinvisible energy [18]),N95CL
γ is the number of photon can-didates aboveE0 at 95% of confidence level andEγ,min isthe exposure of the hybrid detector. To be conservative,in equation (2) we use the minimum value of the expo-sure aboveE0 and a possible nuclear background is notsubtracted for the calculation ofN95CL
γ . An additionalindependent sample of 20000 photon showers is used fordetermining the exposure of the hybrid detector using aprocedure as the one discussed in [17]. Events are se-lected with the same criteria applied to data, and the fi-nal exposure is shown in Figure 4 for photon primariesafter the Fisher analysis and the “a priori” cut discussedbefore. To reduce the impact of statistical fluctuation, a
(Energy/eV)10
log17.5 18 18.5 19 19.5
sr
y]2
Hyb
rid E
xpos
ure
for
phot
ons
[km
-110
1
10
210
310
January 2005 - September 2010
Photon candidate level
Figure 4: Exposure of the hybrid detector for photon pri-maries as a function of energy after all cuts.
fit of a Gamma function to the exposure values has beenperformed and is shown as a dashed line. The arrow in-dicates the energy region of interest for the analysis pre-sented in this work. Upper limits on the integral pho-ton flux of 8.2 · 10−2 km−2 sr−1 y−1 above 1 EeV and2.0 ·10−2 km−2 sr−1 y−1 above 2, 3, 5 and 10 EeV are de-rived. They are shown in Figure 5 compared to previous ex-perimental results (SD [1], Hybrid 2009 [7], AGASA [19])and Yakutsk [20] and to model predictions [2, 21]. The Hy-brid 2009 limits on the photon fraction are converted to fluxlimits using the integrated Auger spectrum [6]. The boundscorroborate previous results disfavoring exotic models alsoin the lowest energy region. Comparing the flux limits onthe measured Auger spectrum [6], upper bounds to the frac-tion of photons of about 0.4%, 0.5%, 1.0%, 2.6% and 8.9%are obtained for energies above 1, 2, 3, 5 and 10 EeV.
We studied the robustness of the results against differ-ent sources of uncertainty. Increasing (reducing) allXmax values by the uncertainty∆Xmax = 13 g cm−2 [22]changes the number of photon candidates above 1 EeV by+1 (-2) not affecting the higher energies. As a consequence,this leads to an increase of∼10% (decrease of∼ 25%) ofthe first point of the upper limits. The uncertainty on theshower geometry determination corresponds to∆Sb ∼5%,changing the number of photon candidates by±0 (+1)above 1 EeV. The overall uncertainty on the hybrid expo-sure calculation for photons is about 5%. It includes the un-certainty due to on-time calculation (∼4%), input spectrafor Monte Carlo simulations and dependence of the triggerefficiency on the fluorescence yield model (∼2%). Anothersource of systematic uncertainties is the energy scale whichhas been estimated to be about 22% [23]. An increase (re-duction) of the energy scale, keeping the energy thresholdsE0 fixed, would change the upper limits by +14% (-54%)above 1 EeV and by +6% (-7%) above 2, 3, 5 and 10 EeV.This is a consequence of a different number of photon can-didates (+1
−4 in the first bin, unchanged in the others) and of
the exposure (−6%+7%).
19

M. SETTIMO et al. PAPERAN UPDATE ON A SEARCH FOR ULTRA-HIGH ENERGY PHOTONS USING THEPIERRE AUGEROBSERVATORY
Energy[eV]1810 1910 2010
]-1
y-1
sr
-2 [k
m0
Inte
gral
Flu
x E
>E
-310
-210
-110
1
upper limits 95% C.L.
SD
this workHybrid
Hybrid 2009A
A
Y
Y
SHDMSHDM’TDZ-burstGZK
Figure 5: Upper limits on the photon flux above 1, 2, 3, 5and 10 EeV derived in this work (red arrows) compared toprevious limits from Auger (SD [1] and Hybrid 2009 [7]),from AGASA (A) [19] and Yakutsk (Y) [20]. The shadedregion and the lines give the predictions for the GZK pho-ton flux [2] and for top-down models (TD, Z-Burst, SHDMfrom [2] and SHDM’ from [21]). The Hybrid 2009 limitson the photon fractions are converted to flux limits usingthe integrated Auger spectrum.
As the photon induced showers have an almost pure elec-tromagnetic nature, no significant impact is expected whenusing another hadronic interaction model. However, sincethe Fisher analysis is also driven by the hadronic showers,we performed the same analysis using a sample of protonCORSIKA showers with QGSJET 01 [24]. In this casethe separation capability improves by about 20% becausethis model predicts shallowerXmax and a larger number ofmuons for proton showers. The number of photon candi-dates is then reduced by 1 above 1 EeV. The same effectis obtained when a 50% proton - 50% iron mixed compo-sition assumption is used in the classification phase. Theimpact on the exposure is about a few percent.
4 Conclusions and Outlook
Using more than 5 years of hybrid data collected by thePierre Auger Observatory we obtain an improved set of up-per limits on the photon flux, in an energy region not cov-ered by the SD-alone, and we extend the range of these lim-its down to 1018 eV. The derived limits on the photon frac-tion are 0.4%, 0.5%, 1.0%, 2.6% and 8.9% above 1, 2, 3, 5and 10 EeV, significantly improving previous results at thelower energies, where limits well below the 1% level arereached now. These bounds also help reduce the systematicuncertainties on primary mass composition, energy spec-trum and proton-air cross section measurements in the EeVrange. The photon search conducted in this work benefitsfrom the combination of complementary information pro-vided by the fluorescence and surface detectors. While thefocus of the current analysis was the low EeV range, fu-
ture work will be performed to improve the photon-hadronseparation also at higher energies using further informationprovided by the SD.
References
[1] The Pierre Auger Collaboration, Astropart. Phys.,2008,29(4): 243-256.
[2] G. Gelmini, O. Kalashev, D. Semikoz, J. Exp. Theor.Phys., 2008106: 1061-1082.
[3] K. Greisen, Phys. Rev. Lett., 1966,16:748-750.[4] G.T. Zatsepin, V.A. Kuz’min, Pis’ma Zh. Eksp. Teor.
Fiz., 1966,4(3): 114-117.[5] The Pierre Auger Collaboration, Nucl. Instr. Meth.
Phys. Res. A, 2004,523(1): 50-95.[6] F. Salamida, for the Pierre Auger Collaboration, paper
0893, these proceedings.[7] The Pierre Auger Collaboration, Astropart. Phys.,
2009,31(6): 399-406.[8] The Pierre Auger Collaboration, Nucl. Instr. Meth.
Phys. Res. A, 2010,613(1): 29-39.[9] The Pierre Auger Collaboration, Nucl. Instr. Meth.
Phys. Res. A, 2010,620(2): 227-251.[10] G. Roset al., A new composition-sensitive parameter
for Ultra-High Energy Cosmic Rays, arXiv:1104.3399[astro-ph].
[11] S. Y. BenZviet al., Nucl. Instr. Meth. Phys. Res. A,2007,574: 171-184.
[12] L. Valore for the Pierre Auger Collaboration, Proc.31st ICRC, Łodz, Poland, 2009, arXiv:0906.2358[astro-ph].
[13] R. A. Fisher, Annals Eugenics, (1936),7: 179-188.[14] D. Heck et al.,“CORSIKA: A Monte Carlo Code to
Simulate Extensive Air Showers”, Report FZKA, 1998,6019.
[15] S. Ostapchenko, Phys. Lett. B, 2006,636(1): 40-45.[16] A. Fasso et al., CERN-2005-10 (2005)
INFN/TC 05/11, SLAC-R-773.[17] The Pierre Auger Collaboration, Astropart. Phys.,
2011,34: 368-381.[18] T. Pierog, R. Engel, D. Heck, Czech. J. Phys., 2006,
56: A161-A172.[19] K. Shinozakiet al., Astrophys. J., 2002,571: L117-
L120.[20] A. Glushkovet al., Phys. Rev. D, 2002,82: 041101:
1-5.[21] J. Elliset al., Phys. Rev. D, 2006,74: 115003:1-11.[22] The Pierre Auger Collaboration, Phys. Rev. Lett.,
2010,104: 091101:1-7.[23] R. Pesce, for the Pierre Auger Collaboration, paper
1160, these proceedings.[24] N. N. Kalmykov and S. Ostapchenko, Sov. J. Nucl.
Phys., 1989,50(2): 315-318.
20

32ND INTERNATIONAL COSMIC RAY CONFERENCE, BEIJING 2011
The Pierre Auger Observatory and ultra-high energy neutrinos: upper limits to the diffuse andpoint source fluxes
YANN GUARDINCERRI1 FOR THEPIERRE AUGER COLLABORATION2
1Facultad de Ciencias Exactas y Naturales, Universidad de Buenos Aires, Buenos Aires, Argentina2Observatorio Pierre Auger, Av. San Martın Norte 304, 5613 Malargue, Argentina(Full author list: http://www.auger.org/archive/authors_2011_05.html)[email protected]
Abstract: With the Surface Detector of the Pierre Auger Observatory, we can detect ultra-high energy neutrinos in thesub-EeV energy range and above. Neutrinos of all flavours can interact in the atmosphere and induce inclined showersclose to the ground (down-going). The sensitivity of the Surface Detector to tau neutrinos is further enhanced throughthe “Earth-skimming” mechanism (up-going). Both types of neutrino interactions can be identified through the broadtime structure of the signals induced in the Surface Detector stations. Two independent sets of identification criteria weredesigned to search for down and up-going neutrinos in the data collected from 1 January 2004 to 31 May 2010, with nocandidates found. Assuming a differential fluxf(Eν) = kE−2
ν, we place a 90% CL upper limit on the single flavour
neutrino flux ofk < 2.8× 10⁻⁸ GeV cm−2 s−1 sr−1 in the energy interval1.6× 1017 eV − 2.0× 10¹⁹ eV based onEarth-skimming neutrinos andk < 1.7× 10⁻⁷ GeV cm−2 s−1 sr−1 in the energy interval1× 1017 eV− 1× 10²⁰ eVbased on down-going neutrinos. We also show that the Auger Observatory is sensitive to ultra-high energy neutrinos froma large fraction of the sky, and we place limits on the neutrino flux from point-like sources as a function of declination,and in particular from the active galaxy Centaurus A.
Keywords: UHE neutrinos, cosmic rays, Pierre Auger Observatory
1 Introduction
Essentially all models of Ultra High Energy Cosmic Ray(UHECR) production predict neutrinos as the result of thedecay of charged pions, produced in interactions of the cos-mic rays within the sources themselves or in their propaga-tion through background radiation fields [1, 2]. Neutrinosare also copiously produced in top-down models proposedas alternatives to explain the production of UHECRs [1].
With the surface detector (SD) of the Pierre Auger Ob-servatory [3] we can detect and identify UHE neutri-nos (UHEνs) in the 0.1 EeV range and above. “Earth-skimming” tau neutrinos [4] are expected to be observedthrough the detection of showers induced by the decayproducts of an emergingτ lepton, after the propagation andinteraction of aντ inside the Earth. “Down-going” neutri-nos of all flavours can interact in the atmosphere and inducea shower close to the ground [5].
This contribution updates both, Earth-skimming [6, 7, 8]and down-going [8] analyses with data until the 31 May2010 and shows, for the first time, the sensitivity of thePierre Auger surface detector to neutrinos from point-likesources.
2 Identifying neutrinos in data
Identifying neutrino-induced showers in the much largerbackground of the ones initiated by nucleonic cosmic raysis based on a simple idea: neutrinos can penetrate largeamounts of matter and generate “young” inclined show-ers developing close to the SD, exhibiting shower frontsextended in time. In contrast, UHE particles such as pro-tons or heavier nuclei interact within a few tens ofg cm−2
after entering the atmosphere, producing “old” showerswith shower fronts narrower in time. In Fig. 1 we showa sketch of these two kinds of showers together with anEarth-skimming shower and aντ interacting in the Andes,which can also be identified.
Although the SD is not directly sensitive to the nature of thearriving particles, the 25 ns time resolution of the FADCtraces, with which the signal is digitised in the SD stations,allows us to distinguish the narrow signals in time expectedfrom a shower initiated high in the atmosphere from thebroad signals expected from a young shower. Several ob-servables can be used to characterise the time structure andshape of the FADC traces. They are described in [9] wheretheir discrimination power is also studied.
In this work we use two different sets of identificationcriteria to select neutrinos. One is used to define Earth-
21

Y. GUARDINCERRI et al. NEUTRINO LIMITS PIERRE AUGER OBSERVATORY
Figure 1: Sketch of different inclined showers which can be detected by the Pierre Auger Observatory. (1) An inclinedshower induced by a proton interacting high in the atmosphere whose electromagnetic component is absorbed and onlythe muons reach the detector. Inclined showers presenting significant electromagnetic component at the detector level:(2) a deep down-goingν shower; (3) an Earth-skimmingντ shower; (4) and aντ interacting in the mountains.
skimming tau neutrinos and the other for down-going neu-trinos. They are given in Table 1 and described in the fol-lowing.
Table 1: Criteria to select Earth-skimmingντ and down-goingν. See text for details.
Earth-skimming Down-going
N of Stations≥ 3 N of Stations≥ 4L/W > 5 L/W > 3
Inclined 0.29mns < V < 0.31m
ns V < 0.313mns
Showers RMS(V )< 0.08mns
RMS(V )V < 0.08
- θrec > 75
Young ToT fraction>0.6 Fisher discriminatorShowers based on AoP
The analyses start with the inclined shower selection(down-going:θ > 75 and Earth-skimmingθ < 96).These showers usually have elongated patterns on theground along the azimuthal arrival direction. A lengthLand a widthW are assigned to the pattern and a cut on theirratioL/W is applied. We also calculate the apparent speedV of an event using the times of signals at ground and thedistances between stations projected ontoL. Finally, fordown-going events, we reconstruct the zenith angleθrec.
Once we have selected inclined showers we look for youngshowers. A station having signals extended in time usu-ally has a Time over Threshold (ToT) local trigger whilenarrow signals have other local triggers [3, 10]. The Earth-skimming analysis identifies young showers placing a cuton the fraction of ToT stations (ToT fraction). For down-going events, to optimize the discrimination power, weuse the Fisher discriminant method using AoP (area of theFADC trace over its peak value, which gives an estimateof the spread in time of the signal) as input variables. Theadvantage of the Fisher discriminant is that it allows us toplace an optimized cut to reject backgrounds from regularhadronic showers, and that it provides an a priori measureof how neutrino-like a possible candidate is.
3 Exposure and limit on the diffuse flux
The Earth skimming and down going criteria are applied todata collected from 1 Jan 04 to 31 May 10, and from 1 Nov07 to 31 May 10, respectively. The down-going sampleis smaller than the Earth-skimming one because data from1 Jan 04 to 31 Oct 07 was used as a training sample forthe Fisher discriminator1. Due to the fact that the Obser-vatory was continuously growing during the constructionphase (2004 - 2008) and that the SD is a dynamic array(some stations can occasionally be not operative), the pre-vious periods correspond to 3.5 yr (Earth-skimming) and2 yr (down-going) of data of a full SD array. No neutrinocandidates were found and an upper limit on the diffuseflux of ultra-high energy neutrinos can be placed.
For this purpose the exposure of the SD array to UHE neu-trinos is calculated. For down-going neutrinos, this in-volves folding the SD array aperture with the interactionprobability and the identification efficiency, and integrat-ing in time, taking into account changes in the array con-figuration due to the installation of new stations and otherchanges. The identification efficiencyε for the set of cutsdefined above depends on the neutrino energyEν , the slantdepthD from ground to the neutrino interaction point, thezenith angleθ, the core position~r = (x, y) of the shower inthe surfaceS covered by the array, and the timet throughthe instantaneous configuration of the array. Moreover itdepends on the neutrino flavour (νe, νµ, or ντ ), and thetype of interaction – charged (CC) or neutral current (NC)– since the different combinations of flavour and interac-tion induce different types of showers. The efficienciesε
were obtained through MC simulations of the first inter-action between theν and a nucleon with HERWIG [11],of the development of the shower in the atmosphere withAIRES [12], and of the response of the surface detectorarray, see [9] for more details. Assuming a 1:1:1 flavour
1. In the case of Earth-skimming analysis, data from 1 Nov to31 Dec 04 was used as a test sample and excluded from the searchsample.
22

32ND INTERNATIONAL COSMIC RAY CONFERENCE, BEIJING 2011
energy (eV)ν1710 1810 1910 2010
s s
r]2
Exp
osur
e [c
m
1310
1410
1510
1610
1710Exposure
Down-going(2 yr of full Auger)
TotalCC e
µCC τCC
NC x MountainsτCC
Earth-skimming (3.5 yr of full Auger)
Figure 2: Exposure of the surface detector of the PierreAuger Observatory for Earth-skimming neutrino initiatedshowers (3.5 yr of full Auger) and for down-going neutrinoinitiated showers for all the considered channels as a func-tion of neutrino energy (2 yr of full Auger).
ratio, the total exposure can be written as:
EDG(Eν) =2π
m
∑i
[σi(Eν)
∫dt dθ dD dS
sin θ cos θ εi(~r, θ,D,Eν , t)]
(1)
where the sum runs over the 3 neutrino flavours and the CCand NC interactions,m is the mass of a nucleon, andσi istheν cross section with a nucleon. Forντ we have takeninto account the possibility that it produces a double showerin the atmosphere triggering the array – one in theντ CCinteraction itself and another in the decay of theτ lepton.Furthermore, we consider the possibility of aντ interactingin the Andes inducing a shower through the decay productsof theτ lepton.
For the Earth-skimming neutrinos the procedure is de-scribed in Ref [7].
In Fig. 2 we show both the Earth-skimming and down-going exposures for the respective search periods.
Several sources of systematic uncertainties have been takeninto account and their effect on the exposure evaluated.For down-going neutrinos there is[−30%, 10%] system-atic uncertainty in the exposure due to the neutrino-inducedshower simulations and the hadronic models. Anothersource of uncertainty comes from the neutrino cross sectionwhich is∼ 10% [13]. For the Earth-skimming showers thesystematic uncertainties are dominated by the tau energylosses, the topography and the shower simulations [7].
Using the computed exposures and assuming a typicalf(Eν) = k · E−2
ν differential neutrino flux and a 1:1:1flavour ratio, an upper limit on the value ofk can be ob-tained. We use a semi-Bayesian extension [14] of theFeldman-Cousins approach [15] to include the uncertain-ties in the exposure. The updated single-flavour 90%C.L. limit based on Earth-skimming neutrinos is:k <
energy (eV)ν1710 1810 1910 2010 2110
]-1
sr
-1 s
-2(E
) [G
eV c
mƒ 2
E
-910
-810
-710
-610
-510Single flavour neutrino limits (90% CL)
Down-going (2yr)EarthSkimming (3.5yr)IceCube-40 (333.5 days)Anita-IIRiceExoticCosmogenic
Figure 3: Differential and integrated upper limits (90%C.L.) from the Pierre Auger Observatory for a diffuse fluxof down-goingν (2 yr of full Auger) and Earth-skimmingντ (3.5 yr of full Auger). Limits from other experimentsare also plotted [16]. Expected fluxes are shown for cosmo-genic neutrinos [17] and for a theoretical exotic model [18].
2.8 × 10⁻⁸ GeV cm−2 s−1 sr−1 in the energy interval1.6 × 1017 eV − 2.0 × 10¹⁹ eV and the updated single-flavour 90% C.L. limit based on down-going neutrinos is:k < 1.7×10⁻⁷ GeV cm−2 s−1 sr−1 in the energy interval1×1017 eV−1×10²⁰ eV. These results are shown in Fig. 3including the limit in different bins of width 0.5 inlog10 Eν
(differential limit) to show at which energies the sensitivityof the Pierre Auger Observatory peaks. The expected num-ber of events from a cosmogenic [17] (neutrinos producedby the interaction of cosmic rays with background radia-tion fields) and an exotic model [18] (neutrinos produceddue to the decay of heavy particles) are given in Table 2.
4 Limits to point-like sources
As we found no candidate events in the search period, wecan place a limit on the UHE neutrino flux from a source atdeclinationδ.
A point source moves through the sky so that it is visiblefrom the SD of the Pierre Auger Observatory with zenithangleθ(t) which depends on the sidereal timet. For anobservatory located at a latitudeλ the relation between thezenith angle and the declination of the sourceδ is given by:
cos θ(t) = sinλ sin δ + cosλ cos δ sin(ωt− α0) (2)
with ω = 2π/T , whereT is the duration of one siderealday andα0 depends on the right ascension.
The sensitivity to UHEνs is limited to large zenith anglesso the rate of events from a point source in the sky de-pends strongly on its declination. The point-source expo-sureEPS(Eν , δ) can be obtained in a similar way as thediffuse exposure but avoiding the integration in solid an-gle and taking into account that the probability of neutrino
23

Y. GUARDINCERRI et al. NEUTRINO LIMITS PIERRE AUGER OBSERVATORY
Source declination [deg]-80 -60 -40 -20 0 20 40 60 80
]-1
s-2
g(E
) [G
eV c
m2
E
-910
-810
-710
-610
-510Single flavour neutrino limits (90% CL)
Down-going (2yr)
Earth-skimming (3.5yr)
IceCube-40 (375.5 days)
Cen A
Figure 4: Neutrino flux limits to aE−2 differential neutrinoflux from a point source as a function of the declination ofthe source, as obtained with the SD of the Pierre AugerObservatory for1.6 × 1017 eV − 2.0 × 10¹⁹ eV (Earth-skimming) and1× 1017 eV− 1× 10²⁰ eV (down-going).Also shown is the limit obtained by IceCube [19] that ap-plies below1017 eV (or lower depending on declination).
identificationε depends onθ, while theθ of the source de-pends on sidereal time through Eq. (2). Alsoε itself de-pends explicitly on time because the configuration of theSD array changes with time.
We perform the integration over time and we obtain thepoint source exposure which depends not only onEν butalso onδ. Assuming now a point source flux which de-creases in energy asg(Eν) = kPS ·E−2
ν and a 1:1:1 flavourratio, we can obtain a point source upper limitkPS(δ).
In Fig. 4 we show the value ofkPS as a function of the dec-lination of the source. In both Earth-skimming and down-going analyses the sensitivity has a broad “plateau” span-ning∆δ ∼ 100 in declination. We also show the sensitiv-ity of IceCube which is at a lower neutrino energy.
In Fig. 5 we show the constraints onk for the case of the ac-tive galaxy Centaurus A (CenA) at a declinationδ ∼ −43.We also show three models of UHEν production in thejets and the core of CenA [21]. The expected number ofevents from each of these models with the current exposureis given in Table 2.
Table 2: Expected number of events for two diffuse neu-trino flux models and two CenA neutrino flux models.
Diffuse flux model Earth-skimming Down-goingCosmogenic 0.71 0.14
Exotic 3.5 0.97
CenA flux model Earth-skimming Down-goingCuocoet al. 0.10 0.02
Kachelriesset al. 0.006 0.001
energy (eV)ν1510 1610 1710 1810 1910 2010 2110 2210 2310
]-1
s-2
g(E
) [G
eV c
m2
E
-1010
-910
-810
-710
-610
-510
-410Centaurus A - Single flavour neutrino limits (90% CL)
Down-going (2yr)
Earth-skimming (3.5yr)
IceCube-40 (375.5 days)
LUNASKA - 2008
Cuoco - 2008Kachelriess - 2009
Anchordoqui - 2011
Figure 5: Limits on Cen A coming from the Earth-skimming and down-going analyses. Also shown are limitsfrom IceCube [19] and LUNASKA [20] in different energyranges and three theoretical predictions [21].
References
[1] F. Halzenet al., Rep. Prog. Phys., 2002,65:1025-1078.[2] R. Engelet al., Phys. Rev. D, 2001,64: 093010.[3] The Pierre Auger Collaboration, Nucl. Instrum. Meth.,
2004,A523: 50-95.[4] X. Bertouet al., Astropart. Phys, 2002,17: 183-193.[5] K. S. Capelleet al., Astropart. Phys., 1998,8: 321-328.[6] The Pierre Auger Collaboration, Phys. Rev. Lett.,
2008,100: 211101.[7] The Pierre Auger Collaboration, Phys. Rev. D, 2009,
79: 102001.[8] J. Tiffenberg, for the Pierre Auger Collaboration,
Proc.31st ICRC, Łodz, Poland, 2009. arXiv:0906.2347[astro-ph].
[9] D. Gora, for the Pierre Auger Collaboration, Proc.31st
ICRC, Łodz, Poland, 2009. arXiv:0906.2319 [astro-ph].[10] The Pierre Auger Collaboration, Nucl. Instrum.
Meth., 2010,A613: 2939.[11] G. Corcellaet al., JHEP, 2001,0101: 010.[12] S. Sciutto, http://www.fisica.unlp.edu.ar/auger/aires[13] A. Cooper-Sarkar, S. Sarkar, JHEP, 2008,0801: 075.[14] J. Conradet al., Phys. Rev. D, 2003,67: 012002.[15] G. J. Feldman, R. D. Cousins, Phys. Rev. D, 1998,57:
3873-3889.[16] The IceCube Collaboration, Phys. Rev. D, 2011,83:
092003; The ANITA Collaboration, Phys. Rev. D, 2010,82: 022004, Erratum arXiv:1011.5004v1 [astro-ph]; I.Kravchenkoet al., Phys. Rev. D, 2006,73: 082002.
[17] M. Ahlerset al., Astropart. Phys., 2010,34: 106-115.[18] D. Semikoz, G. Sigl, JCAP, 2004,0404:003.[19] The IceCube Collaboration, ApJ., 2011,732: 18.[20] C. W. Jameset al., Mon. Not. R. Astron. Soc., 2011,
410: 885-889.[21] A. Cuoco, S. Hannestad, Phys. Rev. D, 2008,78:
023007; M. Kachelriesset al., New J. Phys., 2009,11:065017; L. A. Anchordoqui arXiv:1104.0509 [hep-ph].
24

32ND INTERNATIONAL COSMIC RAY CONFERENCE, BEIJING 2011
Analysis of the modulation in the first harmonic of the right ascension distribution of cosmicrays detected at the Pierre Auger Observatory
HARIS LYBERIS1,2, FOR THEPIERRE AUGER COLLABORATION3
1IPN Orsay, CNRS/IN2P3 & Universite Paris Sud, Orsay, France2Universita degli Studi di Torino, Torino, Italy3 Observatorio Pierre Auger, Av. San Martın Norte 304, 5613 Malargue, Argentina(Full author list: http://www.auger.org/archive/authors_2011_05.html)[email protected]
Abstract: We present an update of the results of searches for first harmonic modulations in the right ascension distributionof cosmic rays detected with the surface detector of the Pierre Auger Observatory over a range of energies. The upperlimits obtained provide the most stringent bounds at present above2.5× 1017 eV. The infill surface detector array whichis now operating at the Pierre Auger Observatory will allow us to extend this search for large scale anisotropies to lowerenergy thresholds.
Keywords: Ultra-high energy cosmic rays, large scale anisotropies, Pierre Auger Observatory.
1 Introduction
The large scale distribution of arrival directions of cosmicrays represents one of the main tools for understandingtheir origin, in particular in the EeV energy range - where1 EeV≡ 1018 eV. Using the large statistics provided bythe surface detector (SD) array of the Pierre Auger Ob-servatory, upper limits below 2% at 99%C.L. have beenrecently reported [1] for EeV energies on the dipole com-ponent in the equatorial plane. Such upper limits are sen-sible, because cosmic rays of galactic origin, while escap-ing from the galaxy in this energy range, might generate adipolar large-scale anisotropy with an amplitude at the %level as seen from the Earth [2, 3]. Even for isotropic ex-tragalactic cosmic rays, a large scale anisotropy may be leftdue to the motion of our galaxy with respect to the frameof extragalactic isotropy. This anisotropy would be dipolarin a similar way to theCompton- Getting effect[4] in theabsence of the galactic magnetic field, but this field couldtransform it into a complicated pattern as seen from theEarth, described by higher order multipoles [5].
Continued scrutiny of the large scale distribution of arrivaldirections of cosmic rays as a function of the energy is thusimportant to constrain different models for the cosmic raysorigin. To do so, we present an update of the results ofsearches for anisotropies by applying first harmonic analy-ses to events recorded by the SD array data from 1 January2004 to 31 December 2010, with the same criteria for eventselection as in [1].
2 First harmonic analyses
2.1 Analysis methods
A dipolar modulation ofexperimental originin the distri-bution of arrival times of the events with a period equalto one solar day may induce a spurious anisotropy in theright ascension distribution. Such spurious variations canbe accounted for thanks to the monitoring of the numberof unitary cellsncell(t) recorded every second by the trig-ger system of the Observatory, reflecting the array growthas well as the dead periods of each surface detector. Here,accordingly to the fiducial cut applied to select events [6],a unitary cell is defined as an active detector surrounded bysix neighbouring active detectors. For any periodicityT ,the total number of unitary cellsNcell(t) as a function oftime t within a period and summed over all periods, and itsassociated relative variations are obtained from :
Ncell(t) =∑
j
ncell(t + jT ), ∆Ncell(t) =Ncell(t)
〈Ncell(t)〉.
(1)
with 〈Ncell(t)〉 = 1/T∫
T
0dtNcell(t). Hence, to perform
a first harmonic analysis accounting for the slighlty non-uniform exposure in different parts of the sky, we weighteach event with right ascensionαi by the inverse of the in-tegrated number of unitary cells for computing the Fouriercoefficientsa andb as :
a =2
N
N∑
i=1
cos (αi)
∆Ncell(α0
i), b =
2
N
N∑
i=1
sin (αi)
∆Ncell(α0
i), (2)
25

LYBERIS et al. FIRST HARMONIC ANALYSIS
whereN =∑
N
i=1[∆Ncell(α
0
i)]−1 andα0
iis the local side-
real time expressed here in radians and chosen so that itis always equal to the right ascension of the zenith at thecenter of the array. The amplituder and phaseϕ are thengiven byr =
√a2 + b2 andϕ = arctan (b/a), and fol-
low respectively a Rayleigh and uniform distributions inthe case of an underlying isotropy.
Changes in the air density and pressure have been shownto affect the development of extensive air showers and con-sequently to induce a temporal variation of the observedshower size at a fixed energy [7]. Such an effect is im-portant to control, because any seasonal variation of themodulation of the daily counting rate induces sidebands atboth the sidereal and the anti-sidereal frequencies, whichmay lead to misleading measures of anisotropy in case theamplitude of the sidebands significantly stands out fromthe background noise [8]. To eliminate these variations,the conversion of the shower size into energy is performedby relating the observed shower size to the one that wouldhave been measured at reference atmospheric conditions.Above 1 EeV, this procedure is sufficient to control the sizeof the sideband amplitude to well below≃ 10−3 [1].
Below 1 EeV, as weather effects affect the detection effi-ciency to a larger extent, spurious variations of the count-ing rate are amplified. Hence, we adopt the differentialEast-West method[9]. Since the instantaneous exposure forEastward and Westward events is the same, the differencebetween the event counting rate measured from the Eastsector,IE(α0), and the West sector,IW (α0), allows us toremove at first order the direction independent effects of ex-perimental origin without applying any correction, thoughat the cost of a reduced sensitivity. This counting differ-ence is directly related to the right ascension modulationrby [9] :
IE(α0) − IW (α0) = − N
2π
2 〈sin(θ)〉π 〈cos(δ)〉r sin (α0 − ϕ). (3)
whereδ is the declination andθ the zenith angle of the de-tected events. The amplituder and phaseϕ can thus be cal-culated from the arrival times ofN events using the stan-dard first harmonic analysis slightly modified to accountfor the subtraction of the Western sector to the Eastern one.The Fourier coefficientsaEW and bEW are thus definedby :
aEW =2
N
N∑
i=1
cos (α0
i+ ζi),
bEW =2
N
N∑
i=1
sin (α0
i+ ζi), (4)
whereζi equals 0 if the event is coming from the Eastor π if coming from the West (so as to effectively sub-tract the events from the West direction). This allows usto recover the right ascension amplituder and the phaseϕEW from r = π〈cos(δ)〉
2〈sin(θ)〉
√
a2
EW+ b2
EWand ϕEW =
arctan (bEW /aEW ). Note however thatϕEW , being the
Frequency [cycles/year]363.5 364 364.5 365 365.5 366 366.5 367
Am
plitu
de [i
n %
]
0
2
4
6No correctionEnergy correction+ Exposure correction
Figure 1: Amplitude of the Fourier modes as a function ofthe frequency above 1 EeV (see text).
phase corresponding to the maximum in the differentialof the East and West fluxes, is related toϕ throughϕ =ϕEW + π/2.
2.2 Analysis of solar frequency above 1 EeV
Over a 7-years period, spurious modulations are partiallycompensated in sidereal time. Though, since the ampli-tude of an eventual sideband effect isproportional to thesolar amplitude, it is interesting to look at the impact ofthe corrections at and around the solar frequency by per-forming the Fourier transform of the modified time distri-bution [10] :
α0
i=
2π
Tsid
ti + αi − α0
i. (5)
The amplitude of the Fourier modes when considering allevents above 1 EeV are shown in Fig. 1 as a function of fre-quencies close to the solar one (dashed line at 365.25 cy-cles/year). The thin dotted curve is obtained without ac-counting for the variations of the exposure and without ac-counting for the weather effects. There is a net solar am-plitude of∼ 4%, highly significant. The impact of the cor-rection of the energies is evidenced by the dashed curvewithin the resolved solar peak (reduction of≃ 20% of thespurious modulations). In addition, when accounting alsofor the exposure variation at each frequency, the solar peakis then reduced at a level close to the statistical noise, asevidenced by the thick curve. This provides support thatthe variations in the exposure and weather effects are undercontrol.
2.3 Analysis of the sidereal frequency
The amplituder at the sidereal frequency as a function ofthe energy is shown in Fig. 2. The size of the energy in-tervals was chosen to be∆log10(E) = 0.3 below 8 EeV,so that it was larger than the energy resolution (about 15%[11]) even at low energies. Above 8 EeV, to guarantee the
26

32ND INTERNATIONAL COSMIC RAY CONFERENCE, BEIJING 2011
[EeV] E0.2 1 2 3 4 5 10 20
Am
plitu
de
-310
-210
-110
1
East/West analysisRayleigh analysis
Figure 2: Amplitude of the first harmonic as a functionof energy. The dashed line indicates the 99%C.L. upperbound on the amplitudes that could result from fluctuationsof an isotropic distribution.
[EeV]th E0.2 1 2 3 4 5 10 20
Am
plitu
de
-310
-210
-110
1East/West analysisRayleigh analysis
Figure 3: Same as Fig. 2, but as a function of energy thresh-olds.
determination of the amplitude measurement within an un-certaintyσ ≃ 2%, all events (≃ 5, 000) where gathered ina single energy interval. The dashed line indicates the 99%C.L. upper bound on the amplitudes that could result fromfluctuations of an isotropic distribution. There is no evi-dence of any significant signal in any energy range. Theprobability with which the 6 observed amplitudes couldhave arisen from an underlying isotropic distribution can bemade by combining the amplitudes in all bins. It is foundto be 45%.
Results of the analysis performed in terms of energy thresh-olds (strongly correlated bins) are shown in Fig. 3. Theyprovide no further evidence in favor of a significant ampli-tude.
Energy [eV]1410 1510 1610 1710 1810 1910 2010
Equ
ator
ial d
ipol
e d
-410
-310
-210
-110
1
A
S
C-G XGal
EAS-TOP
KASCADE
Grand
e AGASA
Auger
Gal
Figure 4: Upper limits on the anisotropy : equatorial dipolecomponentd⊥ as a function of energy from this analy-sis. Results from EAS-TOP, AGASA, KASCADE andKASCADE-Grande experiments are also displayed, in ad-dition to several predictions (see text).
3 Upper limits
From the analyses reported in the previous Section, upperlimits on amplitudes at 99%C.L. can be derived accordingto the distribution drawn from a population characterisedby an anisotropy of unknown amplitude and phase as de-rived by Linsley [12]. The Rayleigh amplitude measuredby an observatory depends on its latitude and on the rangeof zenith angles considered. The measured amplitude canbe related to a real equatorial dipole componentd⊥ byd⊥ ≃ r/〈cos δ〉, whereδ is the declination of the detectedevents, allowing a direct comparison of results from differ-ent experiments and from model predictions [1]. The upperlimits ond⊥ are shown in Fig. 4, together with previous re-sults from EAS-TOP [13], KASCADE [14], KASCADE-Grande [15] and AGASA [16], and with some predictionsfor the anisotropies arising from models of both galacticand extragalactic cosmic ray origin. In modelsA andS(A andS standing for 2 different galactic magnetic fieldsymmetries) [3], the anisotropy is caused by drift motionsdue to the regular component of the galactic magnetic field,while in modelGal [17], the anisotropy is caused by purelydiffusive motions due to the turbulent component of thefield. Some of these amplitudes are challenged by our cur-rent sensitivity. For extragalactic cosmic rays consideredin modelC-GXgal [18], the motion of our galaxy with re-spect to the CMB (supposed to be the frame of extragalacticisotropy) induces the small dipolar anisotropy (neglectingthe effect of the galactic magnetic field).
4 Phase of first harmonic analyses
The phase of the first harmonic is shown in Fig. 5 as a func-tion of the energy. While the measurements of the ampli-tudes do not provide any evidence for anisotropy, it does
27

LYBERIS et al. FIRST HARMONIC ANALYSIS
[EeV] E0.2 1 2 3 4 5 10 20
]°P
hase
[
180
270
0
90
180
12h
6h
0h
18h
12h
East/West analysisRayleigh analysis
Figure 5: Phase of the first harmonic as a function of en-ergy. The dashed line, resulting from an empirical fit, isused in the likelihood ratio test (see text).
not escape our notice that these measurements suggest asmooth transition between a common phase of≃ 270 be-low 1 EeV and another phase (right ascension≃ 100)above 5 EeV. This is potentially interesting, because with areal underlying anisotropy, a consistency of the phase mea-surements in ordered energy intervals is indeed expectedwith lower statistics than that required for the amplitudesto significantly stand out of the background noise [19]. Toquantify whether or not a parent random distribution of ar-rival directions reproduces the phase measurements in adja-cent energy intervals better than an alternative dipolar par-ent distribution, we introduced a likelihood ratio test in ourprevious report [1]. When applied to data points of Fig. 5,this test leads to a probability of∼ 10−3 to accept the ran-dom distribution compared to the alternative one. Since wedid not perform ana priori search for such a smooth tran-sition in the phase measurements, no confidence level canbe derived from this result. With an independent data setof comparable size, we will be able to confirm whether thiseffect is real or not.
It is important to note that an apparent constancy of phase,even though the significances of the amplitudes are rel-atively small, has been pointed out previously in sur-veys of measurements made in the range1014 < E <1017 eV [20]. A clear tendency for maxima to occur around20 hours l.s.t. was stressed, not far from our own measure-ments in the energy range2.5 × 1017 < E < 1018 eV.Greisenet al. pointed out that most of these experimentswere conducted at northern latitudes, and therefore re-garded the reality of such sidereal waves as not yet estab-lished due to possible atmospheric effects leading to spuri-ous waves. It is important that the Auger measurements aremade with events coming largely from the southern hemi-sphere. In future analyses, we will benefit from the lowerenergy threshold now available at the Pierre Auger Obser-vatory thanks to the infill array [21], allowing a better over-lap with the energy ranges presented in Ref. [20]. Prelimi-
nary analyses of this data with the East-West method showalso an apparent constancy of the phase.
References
[1] The Pierre Auger Collaboration, Astropart. Phys.,2011,34: 627.
[2] V. Ptuskinet al. ., Astron. Astrophys., 1993,268: 726.[3] J. Candia, S. Mollerach, E. Roulet, JCAP, 2003,0305:
003.[4] A.H. Compton, I.A. Getting, Phys. Rev., 1935,47:
817.[5] D. Harari, S. Mollerach, E. Roulet, JCAP, 2010,11:
033.[6] The Pierre Auger Collaboration, Nucl. Instr. Meth. A,
2010,613: 29.[7] The Pierre Auger Collaboration, Astropart. Phys.,
2009,32: 89.[8] F.J.M.Farley and J.R.Storey, Proc. Phys. Soc. A, 1954,
67: 996.[9] R. Bonino et al. , submitted to ApJ. See also H. Ly-
beris, paper 1145, these proceedings.[10] P. Billoir, A. Letessier-Selvon, Astropart. Phys.,
2008,29: 14.[11] R. Pesce, for the Pierre Auger Collaboration, paper
1160, these proceedings.[12] J. Linsley, Phys. Rev. Lett., 1975,34: 1530.[13] The EAS-TOP Collaboration, ApJ. Lett., 2009,692:
130.[14] The KASCADE Collaboration, ApJ, 2004,604: 687.[15] S. Overet al. , Proc. 30th ICRC, Merida, Mexico,
2007,4: 223.[16] N. Hayashidaet al. , Astropart. Phys., 1999,10: 303.[17] A. Calvez, A. Kusenko, S. Nagataki, Phys. Rev. Lett.,
2010,105: 091101.[18] M. Kachelriess, P. Serpico, Phys. Lett. B, 2006,640:
225.[19] J. Linsley and A.A. Watson, Private communications.[20] K. Greisenet al. , Proc. International Conference on
Cosmic Rays and Earth Storms, Japan, 1962, J. Phys.Soc. Japan17 (Suppl. A-III): 76.
[21] M. Platino, for the Auger Collaboration, Proc. 31stICRC, Lodz, Poland, 2009, arXiv:0906.2354[astro-ph].
28
32ND INTERNATIONAL COSMIC RAY CONFERENCE, BEIJING 2011
Influence of geomagnetic effects on large scale anisotropy searches
MORITZ M UNCHMEYER1 FOR THEPIERRE AUGER COLLABORATION2
1Laboratoire de Physique Nucleaire et de Hautes Energies, Universites Paris 6 et Paris 7, CNRS-IN2P3, Paris, France2Observatorio Pierre Auger, Av. San Martin Norte 304, 5613 Malargue, Argentina(Full author list: http://www.auger.org/archive/authors 201105.html)auger [email protected]
Abstract: We discuss the influence of the geomagnetic field on the energyestimate of extensive air showers with zenithangles smaller than60, detected with the Surface Detector array of the Pierre Auger Observatory. The geomagneticfield induces a modulation of the energy estimator, depending on the shower direction, at the∼ 2% level at large zenithangles. We present a method to account for this modulation inthe reconstruction of the energy of the cosmic rays. Weanalyse the effect of the energy shift on large scale anisotropy searches in the arrival direction distributions of cosmicrays above the energy threshold at which the detection efficiency of the surface detector array is saturated (3 EeV). At agiven energy, the geomagnetic effect is shown to induce a pseudo-dipolar pattern at the percent level in the declinationdistribution that needs to be accounted for before performing large scale anisotropy searches.
Keywords: geomagnetic field, energy estimate, large scale anisotropy, Pierre Auger Observatory
1 Introduction
The development of extensive air showers in the Earth’satmosphere is influenced by the geomagnetic field, whichacts on the charged particles in the shower. This results inbroadening of the spatial distribution of the particles in thedirection of the Lorentz force. Current empirical models,used in the reconstruction of the primary energy and otherparameters for showers with zenith angleθ < 60 detectedwith the Surface Detector array of the Pierre Auger Ob-servatory, assume a radial symmetry of the particle distri-bution in the plane perpendicular to the shower axis. Thegeomagnetic field induces a systematic effect on the en-ergy estimate, depending on the angle between geomag-netic field and the shower direction. This effect is currentlyneglected in the measurement of the energy spectrum withthe Pierre Auger Observatory based on showers with zenithangles smaller than60. This is reasonable since the mag-nitude of the effect is well below the statistical uncertaintyof the energy reconstruction, which is of order15% [1].However, in the search for large scale anisotropies at thepercent level it induces a modulation of the measured cos-mic ray event rate [2], resembling a true dipolar asymmetryin the North-South direction. The local magnetic field vec-tor is approximately time independent, so this effect has noinfluence on a large scale anisotropy search in the right as-cension distribution of cosmic rays [3, 4]. An analysis ofthe geomagnetic effect in the framework of horizontal airshowers can be found in [5, 6].
2 Influence of the geomagnetic field on ex-tensive air showers
The primary interaction of a cosmic ray in the atmosphereis followed by a hadronic cascade generating the muonicand electromagnetic shower components. The showermuons are produced by the decay of charged pions andhave a typical energyEµ of a few GeV. The productionpoint of these muons is within tens of metres of the showeraxis and their energy loss, mainly due to ionisation, is rela-tively small (about 2 MeV g−1 cm2). Unlike the electronsin the electromagnetic cascade, muons are weakly scatteredand a large fraction of them reaches the ground. The geo-magnetic effect will be therefore dominated by the actionof the Lorentz force on the shower muons. In this anal-ysis we treat the geomagnetic fieldB at the Pierre AugerObservatory site as a constant field
B = 24.6 µT, DB = 2.6, IB = −35.2, (1)
DB andIB being the field’s declination and inclination.
2.1 Distortion of the shower symmetry
Using a simple toy model we aim at understanding the mainfeatures of the muon density distortion induced by the ge-omagnetic field. In the absence of this field and neglectingscattering processes, a relativistic muon of energyEµ andtransverse momentumpT that travels a distanced will have
29

M. M UNCHMEYER et al. INFLUENCE OF GEOMAGNETIC EFFECTS ON LARGE SCALE ANISOTROPY SEARCHES
x [m] -1500 -1000 -500 0 500 1000 1500
y [m
]
-1000
-500
0
500
1000
-4
-2
0
2
4
6
8
[in %]µ
ρ/µ
ρ∆
Figure 1:Relative changes of∆ρµ/ρµ in the transverse showerfront plane due to the presence of the geomagnetic field, for azenith angleθ = 60 and with the azimuth angle aligned alongDB + 180.
a radial deviationr from the shower axis given by
r ≃ pT
pµ
d ≃ cpT
Eµ
d. (2)
The deflection of a relativistic muon in the presence of amagnetic field with transverse componentBT can be ap-proximated with
δx± ≃ ±ecBTd2
2Eµ
, (3)
where thex-axis is oriented along the direction of the de-flection. Given a muon densityρµ(x, y) in the showerplane in the absence of the geomagnetic field, the corre-sponding densityρ
µ(x, y) in the presence of the geomag-
netic field is given by
ρµ(x, y) = ρµ+
(x − δx+, y) + ρµ−
(x − δx−, y), (4)
neglecting a dependence ofδx± onx andy, which is onlyvalid for a restricted range inr. Here we are interested inthe shower size atr ≃ 1000 m, which is used to estimatethe primary energy [8]. Assuming a symmetry in the dis-tribution of positive and negative muons, we can furthersimplify this equation to
ρµ(x, y) ≃ ρµ(x, y) +
(δx)2
2
∂2ρµ
∂x2(x, y), (5)
where we usedδx = δx+ = −δx− andρµ−
= ρµ+=
ρµ/2. The geomagnetic field thus changes the muon den-sity by a factor proportional toB2
T(θ, ϕ). This term de-
scribes the azimuthal behavior of the effect, as verified inthe next section by Monte Carlo shower simulations.
2.2 Observation of the distortion
We illustrate the relative changeρµ/ρµ by shower simula-
tions in the presence and in the absence of the geomagneticfield. A predominantly quadrupolar asymmetry is visible,
Ground plane
Φ
S
B
E
Nr
Shower core
Figure 2: Definition of the polar angleΦ, with respect to theshower core of a showerS and the magnetic East E.
]° Polar Angle on the Ground [-150 -100 -50 0 50 100 150
exp
Sob
sS
∑1
1.02
1.04
1.06Real data
Figure 3: Ratio between observed and expected signal in thesurface detectors (with radial distancer to the shower core largerthan 1000 m) as a function of the polar angleΦ. The solid line isa fit of a quadrupolar modulation.
corresponding to the separation of positive and negativecharges in the direction of the Lorentz force (Fig. 1).
This effect is expected to manifest itself in a quadrupolarmodulation of the surface detector signals as a function ofthe polar angleΦ, defined with respect to the magnetic Eastas shown in Fig. 2. The ratio between observed and ex-pected signal (which is calculated assuming radial showersymmetry) as a function ofΦ is shown in Fig. 3, drawnfrom approximately 30 000 showers with energies largerthan 4 EeV, observed by the Pierre Auger Observatory un-til December 2010 and passing standard fiducial cuts [7].A significant quadrupolar modulation of(1.2 ± 0.2)% isobserved in the data. Its origin can be ascribed to the ge-omagnetic field, as was verified by an end-to-end MonteCarlo simulation, that was constructed to be similar to thereal data in terms of shower energies and arrival direc-tions. The quadrupolar amplitude in the case of simulationsis (1.1 ± 0.2)% in the presence of the geomagnetic field(phase consistent with the real data case) and(0.1± 0.2)%in its absence. Details of this analysis can be found in [9].
3 Geomagnetic distortions of the energy es-timator
The energy estimates of showers detected with the SurfaceDetector array are done in a three step procedure [8]. First,
30

32ND INTERNATIONAL COSMIC RAY CONFERENCE, BEIJING 2011
]° [ϕ Azimuth Angle 0 50 100 150 200 250 300 350
[%]
S(1
000)
/S(1
000)
∆
0
2
4
6
8
10Real field2x Real field
Figure 4: ∆S(1000)/S(1000) (in %) as a function of the az-imuth angleϕ, at zenith angleθ = 55.
the shower sizeS(1000) at 1000 m from the shower coreis calculated, by fitting the lateral distribution functiontothe detector signals. Then the dependence ofS(1000) onthe zenith angle, arising from the attenuation of the showerin the atmosphere and from the surface detector geometryis quantified by applying theConstant Intensity Cut(CIC)method, resulting in the shower sizeS38 at reference zenithangleθ = 38. The conversion ofS38 to energyE is thenachieved using a relation of the formE = ASB
38which
is calibrated using hybrid events that have an independentenergy measurement from the Fluorescence Detector [1].
As predicted by the toy model above, the shower sizeS(1000) shifts proportionally toB2
T∝ sin2(u, b), the hat
notation denoting the angle between shower directionu andmagnetic field directionb. We verified this prediction bysimulating sets of showers with fixed directions, each setcontaining 1000 showers simulated in the presence and inthe absence of the geomagnetic field. The showers weregenerated with the AIRES program [10] and the hadronicinteraction model QGSJET, simulating protons of 5 EeV.We find a systematic shift of the reconstructedS(1000) val-ues, that follows the predicted azimuthal behavior (Fig. 4).
The zenithal behavior of theS(1000) shift depends on themuon distribution properties and cannot be predicted by thetoy model. To obtain it by a Monte Carlo calculation, wecreated further sets of 1000 showers, for different zenithangles. The result is shown in Fig. 5, where the superim-posed curveG(θ) is an empirical fit of the data points. Toobtain the pure zenithal dependency, theS(1000) shift wasdivided bysin2(u, b).
Placing the azimuthal and the zenithal dependence to-gether, we arrive at a parametrisation of the geomagneticshower size shift given by
∆S(1000)
S(1000)(θ, ϕ) = 4.2 × 10⁻³ cos−2.8(θ) sin2(u, b).
(6)Note that these results were obtained by simulating pro-tons of 5 EeV. It is shown in [9] that the above parametrisa-tion depends only weakly on energy, composition and thehadronic interaction model used in the simulations.
]° [θ Zenith Angle 0 10 20 30 40 50 60 70
) [%
]θ
G(
0
2
4
6
Figure 5: G(θ) = ∆S(1000)/S(1000)/ sin2( u, b) as a func-tion of zenith angleθ.
Part of the zenithal shift ofS(1000) induced by the geo-magnetic field is already corrected for by the CIC proce-dure, which assumes a uniform flux. By construction theCIC averages over the azimuthal variation. We thereforeobtain the following correction formula that gives the re-constructed energyE in terms of the valueE0 that is re-constructed if the effect of the geomagnetic field is not ac-counted for
E =E0
(1 + ∆(θ, ϕ))B, (7)
with
∆(θ, ϕ) = G(θ)
[
sin2(u, b) −⟨
sin2(u, b)⟩
ϕ
]
(8)
where〈·〉ϕ
denotes the average overϕ, taking the influenceof the CIC procedure into account andB is one of the pa-rameters used in theS38 to E conversion described above.
4 Consequences for large scale anisotropysearches
The influence of the geomagnetic effect on large scaleanisotropy analysis is caused by the angular dependence ofthe energy estimate, that translates into a shift in the mea-sured event rate at a fixed estimated energy.
4.1 Impact on the event rate
Above 3 EeV, the surface array has full acceptance, so theexposure is geometrical [7] and given by
ω(θ) ∝ cos(θ)H(θ − θmax) (9)
whereH is the Heaviside step function that imposes a max-imum observed zenith angleθmax. The event rate at a givendeclinationδ and above an energy thresholdEth is obtainedby integrating in energy and right ascensionα
N(δ) ∝∫
∞
Eth
dE
∫ 2π
0
dα ω(θ)dN(θ, ϕ, E)
dE(10)
31

M. M UNCHMEYER et al. INFLUENCE OF GEOMAGNETIC EFFECTS ON LARGE SCALE ANISOTROPY SEARCHES
]° [δ Declination -80 -60 -40 -20 0 20
[%]
N/N∆
-4
-2
0
2
°=60maxθ°=50maxθ
Figure 6: Relative differences∆N/Ncorr as a function of thedeclination.
We assume that the cosmic ray spectrum is a power law,i.e. dN/dE ∝ E−γ . From Eqn. (7) it follows that if theeffect of the geomagnetic field were not accounted for, thespectral distribution would have a directional modulationgiven by
(
dN
dE
)
0
∝ [1 + ∆(θ, ϕ)]B(γ−1) × E−γ
0, (11)
The event rateN0(δ) as a function of declination is thencalculated using Eqn. (11) in Eqn. (10). The relative dif-ference∆N/N is shown in Fig. 6 as a function of the dec-lination, with spectral indexγ = 2.7. It corresponds tothe deviation from isotropy that would be observed abovea fixed energy threshold if the geomagnetic effect were notaccounted for in the reconstruction of the energy. The pat-tern displayed in Fig. 6 is similar to that produced by adipole anisotropy in North-South direction with an ampli-tude at the percent level.
4.2 Impact on dipolar anisotropy searches
To study the effect of the modulation in the energy estima-tor on dipolar anisotropy searches we drew samples of sim-ulated data from the ”uncorrected” event rateN0(δ). Forthe dipolar anisotropy search we used the method describedin [11], which is adapted to a partial sky coverage. The re-sults of the reconstructed dipolar amplitudes for 1000 mockdata sets are shown in Fig. 7, for two different sample sizes.The expected isotropic distribution is plotted in the curveswith solid lines. Its analytical expression is derived in [9].For N = 300 000 events, we find a strong deviation fromthe expected distribution. The conditionN = 32 000 isthe number of events, for which the mean of the histogramis of the same order as the mean noise amplitude from theisotropic distribution.
In addition to having a non-isotropic amplitude distribu-tion, the reconstructed dipole is preferentially orientedto-wards the South. ForN = 32 000 events, the declinationdistribution is shown in Fig. 8.
Amplitude0 0.01 0.02 0.03 0.04 0.05 0.06
0
50
100
150
200N=300,000N=32,000
Figure 7:Two distributions of dipolar amplitudes reconstructedfrom arrival directions of mock data sets whose event rate isdis-torted by the geomagnetic effect, and their expected isotropic dis-tribution.
]°Declination [-80 -60 -40 -20 0 20 40 60 80
0
20
40
60
80
100N=32,000
Figure 8:Distribution of reconstructed dipolar declinations andexpected isotropic distribution.
References
[1] R. Pesce, for The Pierre Auger Collaboration, paper1160, these proceedings
[2] A. Ivanovet al., JETP Letters, 1999,69: 288[3] The Pierre Auger Collaboration, Astropart. Phys.,
2011,34: 627[4] H. Lyberis, for The Pierre Auger Collaboration, paper
0493, these proceedings[5] M. Ave, R. A. Vazquez, and E. Zas, Astropart. Phys.,
2000,14: 91[6] H. Dembinskiet al., Astropart. Phys., 2010,34: 128[7] The Pierre Auger Collaboration, Nucl. Instr. and Meth.
A, 2010,613: 29[8] The Pierre Auger Collaboration, Phys. Rev. Lett.,
2008,101: 061101[9] The Pierre Auger Collaboration, in preparation[10] S.J. Sciutto, Proc. 27th ICRC, Hamburg, Germany,
2001,1: 237[11] P. Billoir, O. Deligny, JCAP, 2008,02: 009
32

32ND INTERNATIONAL COSMIC RAY CONFERENCE, BEIJING 2011
Measurement of Energy-Energy-Correlations with the Pierre Auger Observatory
PETER SCHIFFER1, 2 FOR THEPIERRE AUGER COLLABORATION3
1III. Physikalisches Institut A, RWTH Aachen University, Otto-Blumenthal-Str., 52074 Aachen, Germany2II. Institut fur Theoretische Physik, Universitat Hamburg, Luruper Chausee 149, 22761 Hamburg, Germany3Observatorio Pierre Auger, Av. San Martın Norte 304, 5613 Malargue, Argentina(Full author list: http://www.auger.org/archive/authors 201105.html)auger [email protected]
Abstract: To investigate energy ordering effects close to the most energetic cosmic rays, a measurement of Energy-Energy-Correlations (EEC) has been performed with the dataof the surface detector of the Pierre Auger observatory. Themeasurement includes the ultra high energy cosmic rays (UHECRs) with energies above E=5 EeV arriving within a smallsolid angular region around UHECRs withE > 60 EeV. The measured EEC distribution is compared to the expectationfor isotropic arrival directions of UHECRs.
Keywords: Pierre Auger Observatory, UHECRs, Magnetic Fields, UHECR Sources, Energy-Energy-Correlations
1 Introduction
The origin of ultra-high energy cosmic rays (UHECRs) isunknown. While there are strong hints that UHECRs areaccelerated in discrete sources [1] and that the source dis-tribution follows the large scale structure of the universe[2, 3], it has not been possible so far to identify individ-ual sources. The main obstacle has been that galactic andextragalactic magnetic fields (GMF & EGMF) deflect theUHECRs as they propagate. On the other hand, the deflec-tion offers a chance to constrain these magnetic fields. Inmany source and magnetic field scenarios, a characteris-tic energy-ordering of the arrival directions relative to thesource position is expected.
The Energy-Energy-Correlation (EEC) distribution is anobservable that is sensitive to such energy-ordering effectsand was recently proposed as an observable sensitive to tur-bulent cosmic magnetic fields [4]. The EEC is a quantityoriginally developed in high energy physics analyses fortesting strong interaction phenomena (e.g. [5, 6, 7]).
2 Energy-Energy-Correlations
In this section the EEC is introduced and its properties arestudied for a scenario in which the arrival directions areisotropically distributed.
2.1 Definition
The EEC distribution is calculated as described in [4], ex-cept from one adjustment accounting for the field of viewof the Pierre Auger observatory.
Firstly, regions of interest (ROI) are defined as cones withan opening angle of0.2 rad, centered around each UHECRwith an energy above 60 EeV. A cone jet-algorithm is thenapplied to these ROIs:
1. The “center of mass” of the UHECRs withineach ROI is calculated using the arrival directionsweighted by the UHECR energies and the inverse ex-posure at each arrival direction.
2. Each ROI is moved to the corresponding center ofmass.
3. The algorithm concludes after three iterations.
The Energy-Energy-CorrelationΩ is calculated for everypair of UHECRs within each ROI using
Ωij =(Ei − 〈Ei(αi)〉) · (Ej − 〈Ej(αj)〉)
Ei · Ej
. (1)
HereEi is the energy of an UHECRi with an angular dis-tanceαi to the center of the ROI.〈Ei(αi)〉 is the averageenergy of all UHECRs at the angular distanceαi from thecenters of the ROIs.
The angular distribution of the EEC is determined by av-eraging over allΩij calculated in all ROIs. EachΩij is
33

P. SCHIFFERet al. MEASUREMENT OF THEENERGY-ENERGY-CORRELATIONS
taken into account twice, once at the angular distanceαi
and once atαj .
2.2 Isotropic Expectation
Here we evaluate the EEC distribution for a scenario inwhich the arrival directions are isotropic. Later, we willcompare this to the distribution obtained from data (see sec-tion 3.3 below).
An isotropic set is realized using 18744 directions and thesame energy spectrum as the Auger data above 5 EeV. Toachieve this, the original energies of the actual events (seesection 3.1) are reassigned to new directions according tothe acceptance [8] of the Pierre Auger Observatory.
The average EEC distribution of 100 isotropic data sets isshown in Figure 1 as the black triangular symbols. Theerror bar denotes the RMS of these realizations. In thisdistribution two distinct features can be seen.
Firstly, there is a plateau at larger angles which is charac-teristic of the energy range and spectrum used. The levelcan be estimated by removing the angular dependence from(1) and calculating the expectation value
〈Ωij〉 =
(1 − 〈E〉
⟨1
E
⟩)2
. (2)
Secondly, an increase towards smaller angles is observed.This is caused by the jet algorithm used for the determina-tion of the ROI (see section 2.1), which leads to a system-atic overdensity of the most energetic events near the centerof the ROIs. This effect increases the average value of theEEC at smaller angles.
A signal of energy-ordering of events would be a broaderincrease of the distribution, beyond that seen for isotropicsets, near the center of the ROI. The shape will depend onthe scale of the ordering.
3 Data Analysis
The Pierre Auger Observatory is a hybrid air shower detec-tor located in Malargue, Argentina. The Surface Detector(SD) consists of a3000 km2 array of 1660 surface detec-tors overlooked by the 27 fluorescence telescopes of theFluorescence Detector (FD) grouped at 4 sites on the arrayboundary. This allows for complementary measurementsof the lateral distribution of air shower particles at groundlevel by the SD and the longitudinal development of the airshower by the FD.
3.1 Event Selection
For the measurement of the EEC, all events with energiesabove 5 EeV measured between 1 January 2004 and 31 De-cember 2010 SD are used. These event energies are abovethe so-called spectral ankle [9], and can thus be reasonablyhypothesized to be of extragalactic origin [10].
The following additional cuts are applied to the SD dataset:
• A reconstructed zenith angle of less than60.
• The SD tank with the highest signal has to be sur-rounded by 6 operating tanks during the time theUHECR is measured.
• Time periods in which the data acquisition was un-stable are excluded. These are associated to unavoid-able problems in the construction phase, or moregenerally to hardware instabilities [11].
This results in a set ofNevents = 18744 UHECRs.
3.2 Experimental Uncertainties
In this section the relevant experimental uncertainties ofthe Pierre Auger Observatory are discussed and propa-gated to the EEC analysis. The error propagation is per-formed either by variation of the data itself, if possible, orwith Monte Carlo (MC) data of isotropic arrival directions.Since the EEC distribution depends on the total number ofevents in the data set, this number is fixed for all the studiesperformed below.
3.2.1 Energy Resolution
Events with energies larger than 3 EeV are measured bythe SD with an energy resolution of 14.8% [13]. To modelthe effect on the EEC distribution the energies of the eventsare varied or “smeared” by a Gaussian with this width. Byvarying all Auger events, including those below 5 EeV,events may cross the imposed threshold from above orfrom below. Due to the steep spectrum, this variation willslightly increase the number of events exceeding the thresh-old. To keep the number of events fixed, events are ran-domly removed.
This variation of the energies is performed 100 times andeach time the EEC distribution is calculated. The RMS ofthese distributions then is considered to be the statisticaluncertainty resulting from the energy resolution.
3.2.2 Angular Resolution
The angular resolution of the SD is better than1 for en-ergies above 5 EeV [12], where the angular resolution isgiven in terms of the 68% quantile of a two-dimensionalGaussian distribution. The angular resolution is propagatedin the same way as in section 3.2.1. The RMS of 100 datasets gives the statistical uncertainty resulting from the an-gular resolution.
3.2.3 Absolute Energy Scale
The energy measurement of the SD is calibrated using thefluorescence detector of the Pierre Auger Observatory [9].
34

32ND INTERNATIONAL COSMIC RAY CONFERENCE, BEIJING 2011
There is a systematic uncertainty of 22% on the overall en-ergy scale. In order to keep the number of UHECRs con-stant the corresponding uncertainty has been studied us-ing 100 isotropic MC data sets of 70000 UHECRs above3 EeV. The MC set has a spectrum according to [9] and thegeometrical coverage of the Pierre Auger observatory givenin reference [8], using a latitude of−35 S for the observa-tory site. In a second step, the following three types of datasets are produced:
• For the nominal value of energy, the firstNevents
above 5 EeV are taken from each data set.
• All energies are shifted up by 22%, then the firstNevents above 5 EeV are taken from each data set.
• All energies are shifted down by 22%, then the firstNevents above 5 EeV are taken from each data set.
The average of the EEC distributions of the unshifted datasets is taken as the mean value and the average of theshifted EEC distributions as the uncertainty of the mean.The relative uncertainties of this MC study are used toquantify the effect of a systematic shift of the energy scale.
3.2.4 Detector Acceptance
The detector acceptance has no direct influence on the mea-surement of the EEC distribution, but the effects are impor-tant for a comparison with models of UHECR propagationlike the one performed in section 2.2. At energies largerthan 5 EeV the Pierre Auger observatory has reached fulltrigger efficiency [11], so a geometrical acceptance model[8] can be assumed. Historically, data was taken while theObservatory was being constructed. The effect from thegrowing SD before 2008 and from bad periods of opera-tion is much smaller than the uncertainty from the angularand energy resolutions. Therefore it is sufficient to use ageometrical acceptance model for MC comparisons.
3.3 Measurement of the Energy-Energy-Correlations
The measurement of Energy-Energy-Correlation in thedata set as defined in section 3.1 is shown in Figure 1 bythe red circular symbols.
The statistical uncertainty has been determined as de-scribed above (sections 3.2.1 and 3.2.2). The arrival di-rections and the energies of the UHECRs have been variedsimultaneously by their respective uncertainty. The RMSof the average distribution is the statistical uncertaintyde-noted by the error bars. The systematic uncertainty is cal-culated as described in section 3.2.3, by varying the energyscale of isotropic MC data sets. It is denoted by the blueerror band.
For comparison the expectation from isotropically arrivingUHECRs with the same energy spectrum as the data setis shown as the black triangular symbols. The error barsindicate the RMS of 100 realizations.
[rad]α0 0.05 0.1 0.15 0.2
Ω
0
0.1
0.2
0.3
0.4
0.5
Figure 1: Measurement of the EEC distribution by thePierre Auger Observatory (red circular symbols). The er-ror bars denote the statistical uncertainty from angular andenergy resolution effects, the band denotes the systematicuncertainty from the overall energy scale. For comparisonan EEC distribution from a simulated data set with isotropicarrival directions is shown (black triangular symbols). Theerror bars denote the RMS of 100 realizations.
3.4 Discussion
As can be seen in figure 1 the measured EEC distribution iscompatible with the expectation from isotropic arrival di-rections. This means, in particular, that in this analysis noenergy-ordered deflections are observed near the most en-ergetic UHECRs. Such a distribution can be caused eitherby a high source density for an isotropic source distributionor by large deflections of the UHECRs in cosmic magneticfields.
4 Conclusions
The observableΩ of the Energy-Energy-Correlations hasbeen used to investigate the strength of energy-orderingeffects close to the most energetic UHECRs aboveE =60 EeV. The measurement presented in this contributionincludes UHECRs above 5 EeV arriving within regions ofinterest (ROI), each of size 0.2 rad, near the most energeticevents. The average value ofΩ has been measured as afunction of the angular distance in each ROI. In this mea-surement no energy ordering has been found.
References
[1] The Pierre Auger Collaboration, Astropart. Phys,2009,31: 399-406
[2] The Pierre Auger Collaboration, Science, 2007,318(5852): 938
[3] The Pierre Auger Collaboration, Astropart. Phys.,2010,34: 314-326
[4] M. Erdmann, P. Schiffer, Astropart Phys, 201033:201-205
35

P. SCHIFFERet al. MEASUREMENT OF THEENERGY-ENERGY-CORRELATIONS
[5] Basham, C. L., et al., Phys. Rev. Lett., 1978,41: 1585-1588
[6] Akrawy, M. Z. et al., Phys. Lett. B, 1990252: 159 -169
[7] S. Aid et al., Z. Phys. C, 199670: 17-30[8] P. Sommers, Astroparticle Physics, 2001,14: 271-286[9] The Pierre Auger Collaboration, Phys. Letters B, 2010
685: 239[10] R. Aloisio et. al, Phys. Rev. D, 2008,77: 025007[11] The Pierre Auger Collaboration, Nuclear Instruments
and Methods A, 2010613: 2939[12] C. Bonifazi et al., Nucl. Phys. B (Proc. Suppl.), 2009,
190: 20-25[13] R. Pesce, for the Pierre Auger Collaboration, paper
1160, these proceedings
36

32ND INTERNATIONAL COSMIC RAY CONFERENCE, BEIJING 2011
Back-tracking studies of the arrival directions of UHECR detected by the Pierre Auger Obser-vatory
M ICHAEL S. SUTHERLAND1, FOR THEPIERRE AUGER COLLABORATION2
1Louisiana State University, Baton Rouge, LA 70803-4001, United States2Observatorio Pierre Auger, Av. San Martın Norte 304, 5613 Malargue, Argentina(Full author list: http://www.auger.org/archive/authors 201105.html)auger [email protected]
Abstract: The Pierre Auger Observatory has performed precise measurements of ultra-high energy cosmic rays (UHE-CRs) which carry information on their source and propagation environments. We present an analysis that explores variousfeatures of the geometry and intensity of magnetic fields that influence the trajectories of ultra-high energy cosmic rays.Under the hypothesis of pure primary protons at the energy ofinterest (i.e., above 50 EeV), using different catalog-basedassumptions on sources and a variety of simplistic Galacticmagnetic field (GMF) models, we backtrack the arrival direc-tions of UHECRs observed with the Pierre Auger Observatory.We quantify self-consistency by comparing to results fora simulated set of isotropic directions. The obtained results represent an illustrative example of the potential of UHECRdata for obtaining information on their origin, their propagation, and on the properties of the GMF.
Keywords: Ultra-High Energy Cosmic Rays, Pierre Auger Observatory, Magnetic Fields, Sources
1 Introduction
The observation of cosmic rays at the highest energies(UHECRs) and the precise measurement of their kine-matic properties with the Pierre Auger Observatory en-ables approaches towards the fundamental questions on theUHECR origin and propagation. As the physics of particlepropagation is well established through laboratory studies,comparison of UHECR measurements with astrophysicalmodels constitutes a promising method for obtaining infor-mation on their sources and characterization of the mag-netic fields traversed from those sources.
In this contribution, we present a first comparison of thePierre Auger dataset with specific astrophysical models us-ing an analysis method previously shown in [1] which hasbeen extended in [2]. For a variety of hypothesis setseach comprised of Galactic magnetic field (GMF) mod-els and UHECR sources, we perform a search for hypothe-sis set self-consistency when folded with the Pierre Augermeasurements. The primary focus of this analysis is theGMF, whose properties have been measured previously us-ing Faraday rotation and starlight polarization techniques[3, 4, 5, 6, 7]. Observed UHECRs are backtracked assingle-charged particles through simple GMF geometries.In order to quantify a self-consistent hypothesis set wecompare the resulting particle trajectories with source can-didates using different catalogues and test this source corre-lation against the expectation of backtracked isotropic sim-ulations.
The paper is structured as follows. We first introducethe method for determining hypothesis set self-consistency.We then specify the data set recorded by the Pierre AugerObservatory. In the third section we explain the differentastrophysical model components of catalog-based sourcesand GMF parameterizations. The fourth section containsresults obtained by scanning the different models in com-parison to the hypothesis of isotropic expectations. Finally,we discuss the effects of the measurement uncertainties andthe influence of additional magnetic turbulent componentson a representative hypothesis set.
2 Method Description
The Field Scan Method (FSM) [2] assesses the self-consistency of a set of UHECR and GMF hypotheses.It compares the correlation between source locations andevent trajectories after backtracking both a dataset of in-terest (DOI) and isotropic simulations. The results of themethod are explicitly dependent on the choice of the in-dividual components. The comparison with isotropy ac-counts for chance correlation with sources as well as forlensing due to the GMF configuration, building on the pro-cedure used in [1]. The test statistic (TS)
Ψi = Θi/(1 + ∆i) (1)
is computed for each eventi, where∆i is the deflectionmagnitude andΘi the angular distance to the nearest source
37

M. S. SUTHERLAND et al., BACK-TRACKING STUDIES OFUHECRARRIVAL DIRECTIONS
object. A Kolmogorov-Smirnov (KS) test is performed be-tween the DOI and isotropic TS distributions, using thelargest signed differenceDmax between the cumulative TSdistributions.|Dmax| maps to the probabilityPKS that theTS distributions are drawn from the same parent distribu-tion.
The hypothesis set is deemedself-consistentto the extentthat thePKS value indicatesinconsistencywith isotropyand that the DOI correlates well with the source hypothe-sis. A large positiveDmax, resulting in smallPKS, locatedat a small TS value indicates that the DOI better correlateswith the source hypothesis than the isotropic expectationand is inconsistent with the isotropic expectation. Con-versely, if the dataset differs little from the isotropic expec-tation (smallDmax and largePKS), then one or more of thehypothesis components may be incorrect, or perhaps themethod is probing a regime where self-consistency cannotbe identified (e.g., strong lensing that hinders identifica-tion of significant source correlation beyond the isotropicexpectation). PositiveDmax at large TS values and anynegativeDmax are also indicators of these scenarios.
3 Dataset
The Pierre Auger Observatory is a hybrid air shower detec-tor located in Malargue, Argentina. The Surface Detector(SD) consists of a 3000 km2 array of 1660 surface detec-tors overlooked by the 27 fluorescence telescopes of theFluorescence Detector (FD) grouped at 4 sites on the arrayboundary. This allows for complementary measurementsof the lateral distribution of air shower particles at groundlevel by the SD and the longitudinal development of the airshower by the FD.
The data used here consists of 126 events recorded between1 January 2004 and 31 December 2010 with reconstructedenergies greater than 50 EeV and zenith angles smaller than60. These events are required to have at least five ac-tive detectors surrounding the detector reporting the highestsignal and that the reconstructed core location lie within anequilateral triangle of active detectors.
4 Hypothesis Sets
4.1 Composition
The data and simulations are hypothesized here to be en-tirely protons (Zp = 1). This approach appears limitedwith respect to measurements of the air shower character-istics which are consistent with a heavy composition at thehighest energies [8]. Another measurement, namely thecorrelation of the observed arrival direction at the highestenergies (E ≥ 55 EeV) with extragalactic objects, is sug-gestive of a light composition and deflection magnitudes oforder a few degrees [9].
Parameter Min. Value Max. Value Step SizeB⊙ -2.0µG 10.0µG 0.5µGp −20 −1 1
Z1 0.2 kpc 4.0 kpc 0.2 kpc
Table 1: GMF Parameter Space Grid
4.2 Source Distributions
Choices for source distributions are drawn from differ-ent expectations. Four (4) distinct source distributionsare assumed. We use Active Galactic Nuclei (AGN)from the Veron Catalog of Quasars & AGN, 12th Edition[10] (VCV). The 39 month SWIFT-BAT catalog [11] pro-vides a comprehensive all-sky AGN survey in hard X-rays(Swift39). We also use the 2MRS compilation [12] of red-shifts of theKmag < 11.25 brightest galaxies from the2MASS catalog [13]. This catalog provides an excellenttracer of the nearby matter distribution in the universe. Weapply a variety of redshift cutsz ≤ zcut to these threecatalogs using the valueszcut = (0.010, 0.011, ..., 0.024).Additionally for the 2MRS catalog, we apply an absolutebrightness cut that scales with the redshift cut to prevent abias towards faint galaxies at small distances (2MRS-VS);this cut would be equivalent toMK < −25.25 at redshiftz = 0.048 (d =200 Mpc). Finally, the radio galaxy Cen-taurus A is treated as a sole source (CenA).
4.3 Galactic Magnetic Field Models
In this work, we implement logarithmic symmetric spiralfield models as models for the large-scale regular GMF.Logarithmic symmetric spirals representa priori reason-able models for the functional form of the regular compo-nent of the Galactic magnetic field [14]. Such spiral modelshave been explored in previous studies of UHECR deflec-tion in GMF models [15, 16, 17, 18]. Turbulent and halocomponents are not considered here, nor are extra-galacticmagnetic fields [19, 20, 21].
We investigate the axisymmetric (ASSA) and bisymmet-ric models (BSSS) as described in [16]. These aresmoothed versions of models given by [15]. The ASSA(BSSS) model exhibits (anti-) symmetry under rotations ofπ around the Galactic pole and is antisymmetric (symmet-ric) under reflection across the Galactic mid-plane. Threemodel parameters are scanned using the volume defined bythe range shown in Table 1: the field strength in the localsolar vicinityB⊙, the pitch anglep giving the orientation ofthe local field vector in the mid-plane, and the scale heightZ1 giving the exponential attenuation of the field strengthwith distance from the mid-plane. All other parameters arethe same as in [16].
38

32ND INTERNATIONAL COSMIC RAY CONFERENCE, BEIJING 2011
Figure 1: PKS contours for (BSSS, Proton, 2MRS-VS)hypothesis set withzcut = 0.017 atZ1 = 2.0 kpc.
5 Results
The isotropic TS expectation is comprised of 100 simula-tions1 generated by randomly reassigning event directionswhile respecting the detector exposure. Data and simula-tions are backtracked using theCRTpropagation code [22].
Regions of hypothesis set self-consistency will appear assets of neighboring points in the GMF parameter space in-dicating comparable small values ofPKS, positiveDmax
and excess source correlation at small angular scales. Suchregions are observed for sets comprised of both field mod-els and the VCV, Swift39, and 2MRS-VS catalogs imple-menting redshift cuts between roughly 0.014 and 0.020.For the BSSS model, these regions typically encompasspositive field strengths less than about +4µG andp ≈−15 ± few degrees. Regions in the ASSA parameterspace are found for slightly smaller field strengths of theopposite sign, possibly resulting from a nearby field rever-sal inside the solar Galactic orbit induced by the modelchange. Using smaller or larger redshift cuts, these re-gions are smaller in extent and shallower inPKS as wellas shifted within the parameter space. Values of the scaleheight range from 1 - 3 kpc depending on the specific hy-pothesis set. These parameter values are compatible withthose determined from radio astronomical measurements[3, 4, 6].
Figure 1 depicts an example self-consistent region withinthe (Proton, BSSS, 2MRS-VS) hypothesis set. The small-est value ofPKS in this set is6.2×10−6 at (2.0µG, -15.0),marked by the white star. Low values ofPKS indicate thatthe dataset is behaving differently than isotropy for an ex-tensive region of parameter space, although themselves donot indicate actual source correlation.
Figure 2 depicts the dimensionless deviation from theisotropic expectation of source correlation within 5, de-fined asz5 = (nd
5− ni
5)/si
5, for the same hypothesis set.
At each pointnd5
is the number of dataset events. The num-ber of isotropic events is calculated for each of the 100simulations;ni
5andsi
5are the mean and standard devia-
tion of this distribution. At (2.0µG, -15.0) marked by
Figure 2: Deviation from isotropic source correlation ex-pectation for (BSSS, Proton, 2MRS-VS) hypothesis setwith zcut = 0.017 atZ1 = 2.0 kpc.
the white star,z5 = 3.25, resulting from 36 events corre-lating within 5 compared to 21.47 expected. The com-bination of this small-scale correlation and smallPKS in-dicates that this hypothesis set is self-consistent. Pointsin the surrounding parameter space possess similarnd5 andPKS values. Largerz5 are observed outside this region al-though marginal TS inconsistency with isotropy is foundusingPKS. One such point is (3.0µG, -4.0) marked bythe white circle where 35 events comprisend
5(18.76 ex-
pected) givingz5 = 4.35 but PKS = 0.051. Here the skydistribution of the data closely matches that of the isotropicsimulations.
Hypothesis set combinations with Cen-A indicate no re-gions of self-consistency for either field model. Themethod returns a minimumPKS value of 0.3% (0.05%) forthe BSSS (ASSA) model. No parameter point in eitherhypothesis set returnsnd
5≥ 12 and largez5 is not observed
in conjunction with smallPKS.
We note that the averagePKS for B⊙ = 0 µG in Figure 1is 0.0123 indicating marginal inconsistency with isotropy.This is in accordance with a previous study of correlationsof UHECR arrival directions with extragalactic objects re-ported in [9] using similar catalogs.
5.1 Energy and Angular Resolutions
We also investigate the effects of the energy and angularresolutions to determine the robustness ofPKS. The AugerObservatory energy (σE) and angular (σψ) resolutions are15% and 0.9 [23, 24]. 103 “mock” datasets are gener-ated where the event energies and directions are simulta-neously resampled from gaussian distributions with widthsσE andσψ centered on the reconstructed energies and ar-rival directions, respectively. Then, 100 isotropic simu-lations are constructed for each “mock” dataset by keep-ing the resampled energies and reassigning an exposure-modulated isotropic direction for each event. APKS distri-
1. Simulations are unique for each parameter point. ForB⊙ =0 µG this will naturally induce variation inPKS.
39

M. S. SUTHERLAND et al., BACK-TRACKING STUDIES OFUHECRARRIVAL DIRECTIONS
Figure 3: PKS distribution of resolution-smeared “mock”datasets. ThePKS value for the unsmeared dataset is de-picted by the vertical dotted line.
Figure 4: PKS distribution for the regular plus turbulentGMF model. ThePKS value for the regular component-only model is depicted by the vertical dotted line.
bution sharply peaked about the value calculated using thereconstructed energy and direction would indicate strongrobustness against experimental uncertainties. Figure 3shows thePKS distribution of the (Proton, BSSS, 2MRS-VS) hypothesis set underzcut = 0.017 for (B⊙, p, Z1) =(2.0 µG,−15, 3.0 kpc). The determination of self-consistency using the reconstructed energies and directionsappears robust against the experimental resolutions.
5.2 Turbulent GMF Component
The addition of a turbulent field component is expectedto induce isotropization with respect to the hypothesizedsource distribution. We compare thePKS distribution of103 realizations of a GMF with regular and turbulent com-ponents to thePKS value of the sole regular field. The reg-ular component is the same as in Section 5.1. The turbulentcomponent consists of independent spherical cells of vary-ing sizes drawn from a gaussian distribution with mean 0.1kpc and rms 0.06 kpc. The field within individual cells hasconstant magnitude and direction, which is drawn from agaussian distribution centered at2.5 µG with rms1 µG.Figure 4 shows thePKS distribution for a particular BSSSand 2MRS-VS hypothesis set. The addition of a turbulentcomponent tends to strongly isotropize the data.
6 Conclusion
In this contribution we have presented a comparison ofthe Pierre Auger data with specific astrophysical mod-els of the origin, composition, and propagation of UHE-CRs putting special emphasis on the GMF. In the com-parisons we folded the measurements with the astrophys-ical hypothesis sets and performed a quantitative searchfor self-consistency. Interesting self-consistent descrip-tions are found for GMF parameter values that are consis-tent with contemporary radio astronomical measurements.By scanning a broad phase space of conventional GMFmodel parameters and several cosmic ray source hypothe-ses, we have shown an illustrative example of the potentialof UHECR precision measurements to obtain new and im-portant information on the fundamental characteristics ofthe high energy universe.
References
[1] B. M. Baughman, for the Pierre Auger Collaboration,Proc. 31st ICRC, Łodz, Poland, 2009. arXiv:0906.2347[astro-ph].
[2] B. M. Baughmanet al., submitted to Astropart. Phys.,2010.
[3] H. Men et al., Astron. and Astrophys., 2008,486:819.[4] X. H. Sun et al., Astron. and Astrophys., 2008,
477:573.[5] S. A. Maoet al., Astrophys. Journ., 2010,714:1170.[6] C. L. Van Ecket al., Astrophys. Journ., 2011,729:97.[7] M. Haverkornet al., Space Sci. Rev., 2011,3:29.[8] The Pierre Auger Collaboration, Phys. Rev. Lett.,
2010,104:091101.[9] The Pierre Auger Collaboration, Astropart. Phys.,
2010,34:314.[10] M. P. Veron-Cettyet al.. Astron. and Astrophys.,
2006,455:773.[11] G. Cusumanoet al., Astron. and Astrophys., 2010,
510:A48.[12] J. Huchraet al., IAU Symp., 2005,216:170.[13] T. H. Jarrettet al., Astronom. J., 2000,119:2498.[14] F. S. Tabatabaeiet al., Astron. and Astrophys., 2008,
490:1005.[15] T. Stanev. Astrophys. Journ., 1997,479:290.[16] D. Harariet al., JHEP, 1999,8:22.[17] M. Kachelrießet al., Astropart. Phys., 2007,26:378.[18] H. Takamiet al., Astrophys. Journ., 2008,681:1279.[19] S. Daset al., Astrophys. Journ., 2008,682:29.[20] D. Ryuet al., Science, 2008,320:909.[21] K. Dolaget al., JCAP, 2009,01:33.[22] M. S. Sutherlandet al., Astropart. Phys., 2010,
34:198.[23] The Pierre Auger Collaboration, Phys. Rev. Lett.,
2008,101:061101.[24] C. Bonifazi, for The Pierre Auger Collaboration, Nuc.
Phys. B (Proc. Suppl.), 2009,190:20.
40

32ND INTERNATIONAL COSMIC RAY CONFERENCE, BEIJING 2011
Measurement of Low Energy Cosmic Radiation with the Water Cherenkov Detector Array ofthe Pierre Auger Observatory
HERNAN ASOREY1 FOR THE PIERRE AUGER COLLABORATION2
1Centro Atomico Bariloche (CNEA), U. N. de Cuyo and U. N. de Rıo Negro, Bariloche, Rıo Negro, Argentina2Observatorio Pierre Auger, Av. San Martın Norte 304, 5613 Malargue, Argentina(Full author list: http://www.auger.org/archive/authors_2011_05.html)[email protected]
Abstract: The flux of secondary cosmic ray particles recorded in the 1660 water Cherenkov detectors of the PierreAuger Observatory is continuously monitored and analysed for calibration purposes. It is possible to study the flux ofprimary cosmic rays within the GeV to TeV energy range using calibration histograms of the total energy deposited inthe detectors, or data from low threshold scaler counters, which are publicly available. The observed flux is affectedby several factors, such as solar activity, the directional properties of Galactic cosmic rays, and local meteorologicalconditions. The measured secondary flux (of the order of 108 counts per minute) can provide important data on thesefactors by virtue of the high counting rates which are possible due to the large collecting area of the whole array. Currentresults of the analysis of each of these factors are presented.
Keywords: Pierre Auger Observatory, low energy cosmic rays, solar activity
1 Introduction
The flux of low energy Galactic cosmic rays (GCRs) ismodulated by transient solar eruptions and by changes ofthe global structure and polarity of the magnetic field inthe heliosphere. Variations in the intensity of secondarycosmic rays observed at the surface of the Earth also pro-vide valuable information about the transport of particlesin the inner and outer heliosphere, as well as about parti-cles coming into the solar system from the local interstellarmedium [1].The flux of GCRs shows a long-term modulation associatedwith the solar cycle and short-term variations produced bythe passage near the Earth of solar ejecta (i.e., the inter-planetary manifestation of a coronal mass ejection, ICME),known as Forbush decreases (Fds) [1]. When observedwith neutron monitors and with muon detectors, these Fdsexhibit an asymmetrical structure: a characteristic fast de-crease of the cosmic ray flux with a time-scale of somehours, and a smooth recovery with a timescale of severaldays. In some cases, Fds can show complex structures [2]due to the interaction of ICMEs with fast streams of plasmaor with other ICMEs during their propagation through theinterplanetary space [3].In this article we present measurements of low energy cos-mic radiation, in the range from GeV to several TeV, per-formed with the Pierre Auger Observatory. In section 2 wedescribe the water Cherenkov detectors of the Pierre Auger
Observatory and their calibration with background muons.In sections 3 and 4 we describe the scaler mode for measur-ing the flux of low energy radiation and how the calibrationhistograms can be used to study the dependence of the in-tensity on energy, while in section 5 the detector responseis evaluated. We present conclusions in section 6.
2 The Pierre Auger Observatory
The Pierre Auger Observatory [4], located at Malargue, Ar-gentina (69.3o W, 35.3o S, 1400 m a.s.l.), was designed forthe study of cosmic rays of the highest energies. It com-bines two complementary techniques for the detection ofthe secondary particles in extensive atmospheric showers(EAS), produced by the interaction of cosmic rays with theatmosphere. In this hybrid design, two types of detectorsregister EAS: the fluorescence detector (FD) consists oftwenty-seven telescopes located at four sites for the obser-vation of ultraviolet fluorescence radiation produced by theshower, and the surface detector array (SD) measures thelateral distribution of secondary particles at ground level.The SD consists of an arrangement of 1660 waterCherenkov detectors. The detectors of the main array areplaced in a triangular grid with a spacing of 1500m, dis-tributed over an area of 3000 km2. It has an operation dutycycle of nearly 100%. Each water Cherenkov detector con-sists of a tank containing 12m3 of high-purity water withan area of 10m2, providing the full array with a total detec-
41

H. ASOREY ET AL. LOW ENERGY MEASUREMENTS AT THE PIERRE AUGER OBSERVATORY
tor area of about 16 600m2. Cherenkov radiation is gener-ated by the passage of charged, ultra-relativistic EAS parti-cles through the water in the detector. While each detectorworks as a calorimeter for e± and photons (which create e±
pairs in water), typical muons possess enough energy to gothrough the full detector, and their Cherenkov emission isproportional to their track length within the water volume.Three 9” Photonis photomultiplier tubes (PMTs) collect theCherenkov light in each detector and their signals are pro-cessed with a sampling rate of 40 MHz by six 10-bit flashanalog-to-digital converters (FADC). Each detector is anautonomous station linked to the central data acquisitionsystem (CDAS) in Malargue through a dedicated radio net-work with a bandwidth of 1200 bps per station.As detailed in [5], the detector is self-calibrated by measur-ing the pulse signals produced by the particles interactingin the water volume and by building one-minute histogramsof their total charge. Since the total signal from a muondepends mainly on its track length, muons produce a char-acteristic peak. The position of the peak corresponds to(1.03 ± 0.02) times the total signal deposited by a verti-cal and central through-going muon [6]. Since the energyloss for energetic muons is dE/dX ' 2MeV g−1 cm2, itis possible to calibrate the charge histograms, originallyin arbitrary units of FADC counts, in units of energy de-posited within the water volume, Ed. Figure 1 shows atypical charge histogram, with deposited energy measuredin MeV.
0.01
0.1
1
10
15 30 60 120 240 480 960
Rat
e [c
ounts
MeV
-1 s
-1 m
-2]
Deposited energy [MeV]
Scaler rate counting interval
(Period II)
Scaler rate counting interval
(Period I)
Figure 1: Charge histogram of the signals recorded byone PMT of a water Cherenkov detector of the SD, inbins of energy Ed. Both indicated energy regions (15 ≤(Ed/MeV) < ∞ for Period I, and 15 ≤ (Ed/MeV) ≤ 100for period II) correspond to the counting interval of thescaler mode of the SD, as described in section 3.
Each time the SD detects an EAS, the current one-minutehistograms of all nearby detectors with significant signalare sent to CDAS for their storage in order to be used for anoff-line calibration of the stations. In this way, on average10 one-minute histograms of the flux of secondary particlesat ground level are registered every minute.
3 The Scaler Mode
In March 2005, a new detection mode known as “singleparticle technique” was implemented in all the detectors ofthe SD at the Pierre Auger Observatory. This mode consistsin the recording of low threshold rates (scalers) for the sur-face detectors of the array. It is intended for measurementsof low energy radiation, long term stability and monitoringstudies, and the search of transient events such as gammaray bursts or Forbush decreases [7].Two different configurations of the scaler mode were im-plemented at Auger, in different time periods. In Period I,from 01 Mar 2005 to 20 Sep 2005, the scaler mode countedthe total number of signals per second in each detectorabove a threshold of 3FADC counts above the baseline(corresponding to Ed ∼ 15MeV), with a typical rate ofabout 380 counts s−1 m−2. In Period II, starting at theend of Sep 2005, an upper bound of 20 FADC counts(Ed ∼ 100MeV) was introduced in order to diminish thesensitivity of the scalers to muon signals. This produced areduction of the counting rate to about 200 counts s−1 m−2.The main characteristics of the scaler rates for both periodsare summarised in table 1. As both periods include the con-struction phase of the Observatory, the total detector col-lecting area ranged from 6 660 m2 at the beginning of 2005to 16 600 m2 after its completion in 2008, with countingrates of ∼ 2× 10⁸ counts min−1 for the full SD.The flux of low energy particles at ground level, producedby the interaction of primary cosmic rays at the top of theatmosphere, is intrinsically non-constant. It is furthermoremodulated by several atmospheric factors, such as atmo-spheric pressure. As expected, a strong anti-correlation isobserved between the scaler rate and atmospheric pressure,corresponding to (−2.7± 0.2)h per hPa for Period I, and(−3.6± 0.2)h per hPa for Period II [7].A comparison of the pressure-corrected Auger scalerrate with data from the close-by Los Cerrillos Observa-tory 6NM64 neutron monitor [8] (Chile, 33.3o S, 70.4o W,10.8GV cut-off rigidity) is shown in figure 2. Peaking at15 May 2005 08:05 UTC, Auger scalers show a decrease of2.9% with respect to the reference rate for May 2005. Thefit of an exponential function for the recovery phase gives atime constant of 2.21±0.18(stat) days. A decrease of 4.8%is found in the Los Cerrillos neutron rate, with a time con-stant of 3.52 ± 0.12(stat) days. The observatories possessa similar cut-off rigidity. The differences in the observedtime constants result from the higher energy threshold ofthe Auger detectors compared to neutron monitors.Instead of using averaged scaler rates for the whole array,it is also possible to study the scaler rate of individual sta-tions, in order to study the propagation of some phenom-ena across the Auger SD, like the crossing of a storm overthe 3000 km2 of the SD (see [9]). The flux of secondaryparticles changes as the pressure front moves from the SWtowards the NE border of the SD. Additional analyses tostudy the influence of the variation of electric fields on theflux of EAS particles are currently being carried out.
42

32ND INTERNATIONAL COSMIC RAY CONFERENCE, BEIJING 2011
Period Energy range Average scaler rate Total collection area[MeV] [counts s−1 m−2] [m2]
I: 01 Mar 2005 - 20 Sep 2005 E & 15 ∼ 380 6 660 - 8 420II: After 20 Sep 2005 15 . E . 100 ∼ 200 8 420 - 16 600
Table 1: Count rates for Auger scalers in both periods as defined in section 3. The collecting area range is due to theinstallation of new detectors in the SD, up to its completion in 2008.
365
370
375
380
385
0 2 4 6 8 10 12 1459
60
61
62
63
64
Au
ger
sca
ler
rate
[co
un
ts s
-1 m
-2]
Lo
s C
erri
llo
s ra
te [
cou
nts
s-1
]
Days since 13 May 2005 00:00 UTC (Period I)
6h45m
Average Auger SD scalersLos Cerrillos (Chile) 6NM64
Figure 2: Auger scaler rate (solid line) for the 15 May 2005Forbush event, compared with the Los Cerrillos (Chile)neutron monitor rate (dashed line). A 2.9% decrease is ob-served in the Auger data, peaked at 15 May 2005 08:05UTC, taking 6h45 (solid vertical lines) to reach the peakvalue. Similar daily variations in the flux are seen at bothobservatories.
It has been suggested that an increment in the flux of lowenergy cosmic rays could be expected as a precursor to theoccurrence of a major earthquake, and some low signifi-cance correlations have been found with low altitude space-craft measurements [10]. At 27 Feb 2010 06h34 UTC an8.8 magnitude earthquake occurred in Chile, with the epi-centre located at 35.9o S, 72.7o W in the Bio-Bio Region,300 km SW from the Auger Observatory. The averagedscaler rate for the whole array and also for individual sta-tions showed a 24σ decrease beginning (90± 2) secondsafter the earthquake. This delay is compatible with thepropagation of seismic S-waves over that distance. Thescaler rate from 6h15 to 6h45 UTC is shown in figure 3.Although other minor quakes have been recorded by seis-mographs near the SD, no other similar effects have beenfound in 6 years of data. Detailed analyses to identify thecauses of the observed drop in the scaler rate are underway.These include simulations and shaking tests of selected de-tectors in the array. After 6 hours, the scaler rate recoveredto the mean value for February 2010.
4 The Histogram Mode
Except for a strong Forbush decrease observed on 13 Dec2006, no other significant activity in the heliosphere wasrecorded in the period 2006–2009. This period was there-
193.0
193.5
194.0
194.5
15 20 25 30 35 40 45A
ug
er s
cale
r ra
te [
cou
nts
s-1
m-2
]Time since 27 Feb 2010 06:00 UTC [minutes]
10 s average
Chile 2010 Earthquake 27 Feb 2010 06:34:14 UTC
Decrease in the scaler rate 27 Feb 2010 06:35:44 UTC
Figure 3: Ten seconds average of the Auger scaler rate forthe 27 Feb 2010 Chile major 8.8 magnitude earthquake. Astrong 24σ decrease is found 90 ± 2 (stat) seconds after-wards, compatible with the time delay expected for seis-mic S-waves traversing the distance from the epicentre tothe Auger Observatory.
fore selected to study the influence of atmospheric condi-tions on the charge histograms. A subset of detectors of thecomplete array was selected and, for each PMT of each ofthose stations, a fit of the correlation of the observed rateof particles in each 20MeV bin of deposited energy withatmospheric pressure was performed, and the fitted param-eters were averaged over the selected sub array.The scaler rate in the “single particle technique” mode isrelated to the integral of the calibration histogram betweentwo limits defined by the lower and upper scaler triggerbounds (see figure 1). By integrating the calibration his-tograms with other bounds, it is possible to obtain a raterelated to the flux of secondary particles in a specific rangeof deposited energy. As shown by simulations (see section5), this flux is related to the number of incident primarycosmic rays of different energies.The pressure corrected histogram data of the sub arraydetectors for the 15 May 2005 Fd are shown in figure 4.Six-hour averages in five 20MeV deposition energy bandsof the charge histogram are shown, centred at 140MeV,240MeV, 480MeV, 840MeV and 1GeV. Since a verticaland central through-going muon deposits ∼ 240MeV inthe water volume, the integrated counting rate of this bandis strongly related to the counting of muons at ground level.The Fd is clearly visible in all the energy bands.
43

H. ASOREY ET AL. LOW ENERGY MEASUREMENTS AT THE PIERRE AUGER OBSERVATORY
-4.5
-3
-1.5
0
1.5
3
0 2 4 6 8 10 12 14
1 GeV
840 MeV
440 MeV
240 MeV
140 MeV
Dev
iati
on
s fr
om
mea
n v
alu
e [%
] (s
hif
ted
)
Days since 13 May 2005 00:00 UTC
Figure 4: May 2005 Forbush decrease observed by thePierre Auger Observatory. Each curve shows, as a func-tion of time, the integral of the pressure corrected chargehistogram over a 20MeV bin of deposited energy Ed, cen-tred at 140MeV, 240MeV, 480MeV, 840MeV and 1GeV.Each energy band was offset by a value of 3%, 1.5%, 0%,−1.5%, and −3% resp.
5 Detector response
To determine the energies of primary GCRs to which theAuger Observatory low energy modes are sensitive, a setof low energy EAS simulations was performed using COR-SIKA 6.980 [11] with QGSJET-II model for the high en-ergy hadronic interactions and GHEISHA low energy in-teraction routines. The flux of primaries at the top of theatmosphere for all nuclei in the range 1 ≤ Zp ≤ 26(1 ≤ Ap ≤ 56) was assumed to be a power law of the formj(Ep) = j0(Ep/TeV)−γ . The values for j0 and the spec-tral index γ were obtained from [12], from the measuredspectra in the range (10 × Zp) < (Ep/GeV) < 106, andfor 0o ≤ θp ≤ 88o in zenith angle. The detector responsewas simulated using a simple simulator developed withinthe Auger data analysis framework. Results are shown infigure 5, where the fraction of the observed contribution forfour primary GCR energy bands is plotted as a function ofthe energy deposition within the detector volume. Differentregimes are visible in the figure: while for Ed ∼ 240MeV,the typical deposited energies for single muons, the con-tribution is dominated by primaries of Ep < 350GeV, atEd & 600MeV the contribution becomes dominated byGCRs of higher energies.
6 Conclusions
The study of variations in the galactic cosmic ray flux isimportant because it carries information about the local in-terstellar and interplanetary media, and about the physicalmechanisms involved in the interaction between chargedparticles and plasma in the heliosphere.In this work, measurements of low energy cosmic radiationin the GeV–TeV range using the surface detector array ofthe Pierre Auger Observatory are described. The capabili-
0
5
10
15
20
25
30
35
40
45
0 200 400 600 800 1000
Fra
ctio
n o
f obse
rved
contr
ibuti
on [
%]
Deposited Energy [MeV]
E < 35 GeV35 GeV < E < 90 GeV90 GeV < E < 350 GeVE > 350 GeV
Vertical and central through-going muon
Figure 5: Simulated response of the water Cherenkov de-tector for four primary GCRs energy bands as a function ofthe deposited energy of EAS particles within the detectorvolume. At higher values of Ed, the contribution is domi-nated by GCRs of Ep > 350GeV.
ties of water Cherenkov detectors for the study of transientsolar events at the Earth surface has been demonstrated us-ing the scaler data.The scaler mode is now complemented by the analysis ofthe calibration charge histograms, which enable the studyof the time evolution of transient solar events at the samerigidity cut-off for different bands of deposited energy.The full scaler data set, averaged every 15minutes for thewhole surface detector array, is publicly available and canbe downloaded from the Pierre Auger Observatory PublicEvent Display web site [13]. A user-friendly web interfacehas been set up to handle, visualise and download the data.
References
[1] H. Cane, S. Sci. Rev., 2000, 93: 55–77.[2] G. Wibberenz et al. , S. Sci. Rev., 1998, 83: 309-348.[3] S. Dasso et al. , JGR, 2009, 114: A02109.[4] The Pierre Auger Collaboration, NIM A, 2004, 523:
50–95.[5] X. Bertou et al. , for The Pierre Auger Collaboration,
NIM A, 2006, 568: 839–846.[6] M. Aglietta et al. , for the Pierre Auger Collaboration,
in Proc. 29th ICRC Pune, India, 2005, 7: 83–86.[7] The Pierre Auger Collaboration, JINST, 2011, 6:
P01003.[8] E. Cordaro, E. Olivares, Rep. C.R. Res. Lab., 2005.[9] X. Bertou, for The Pierre Auger Collaboration, NIM
A, 2011, 639: 73–76.[10] S. Aleksandrin et al. , Ann. Geophys, 2003, 21: 597–
602.[11] D. Heck et al. , FZKA, 1998, 6019: 1–99.[12] B. Wiebel-Sooth et al. : 1998, Cosmic Rays, Landolt-
Bornstein, Springer Verlag.[13] The Pierre Auger Collaboration, 2011, see Event Dis-
play at http://www.auger.org
44

32ND INTERNATIONAL COSMIC RAY CONFERENCE, BEIJING 2011
AcknowledgmentsThe successful installation, commissioning and operationof the Pierre Auger Observatory would not have been possiblewithout the strong commitment and effort from the technicaland administrative staff in Malargue.
We are very grateful to the following agencies and organizations for financial support:
Comision Nacional de Energıa Atomica, Fundacion Antorchas, Gobierno De La Provincia de Mendoza, Municipali-dad de Malargue, NDM Holdings and Valle Las Lenas, in gratitude for their continuing cooperation over land ac-cess, Argentina; the Australian Research Council; Conselho Nacional de Desenvolvimento Cientıfico e Tecnologico(CNPq), Financiadora de Estudos e Projetos (FINEP), Fundac¸ao de Amparo a Pesquisa do Estado de Rio de Janeiro(FAPERJ), Fundacao de Amparo a Pesquisa do Estado de SaoPaulo (FAPESP), Ministerio de Ciencia e Tec-nologia (MCT), Brazil; AVCR AV0Z10100502 and AV0Z10100522, GAAV KJB100100904, MSMT-CR LA08016,LC527, 1M06002, and MSM0021620859, Czech Republic; Centrede Calcul IN2P3/CNRS, Centre National de laRecherche Scientifique (CNRS), Conseil Regional Ile-de-France, Departement Physique Nucleaire et Corpusculaire(PNC-IN2P3/CNRS), Departement Sciences de l’Univers (SDU-INSU/CNRS), France; Bundesministerium fur Bildungund Forschung (BMBF), Deutsche Forschungsgemeinschaft (DFG), Finanzministerium Baden-Wurttemberg, Helmholtz-Gemeinschaft Deutscher Forschungszentren (HGF), Ministerium fur Wissenschaft und Forschung, Nordrhein-Westfalen,Ministerium fur Wissenschaft, Forschung und Kunst, Baden-Wurttemberg, Germany; Istituto Nazionale di Fisica Nu-cleare (INFN), Ministero dell’Istruzione, dell’Universita e della Ricerca (MIUR), Italy; Consejo Nacional de Cienciay Tecnologıa (CONACYT), Mexico; Ministerie van Onderwijs, Cultuur en Wetenschap, Nederlandse Organisatie voorWetenschappelijk Onderzoek (NWO), Stichting voor Fundamenteel Onderzoek der Materie (FOM), Netherlands; Min-istry of Science and Higher Education, Grant Nos. 1 P03 D 014 30, N202 090 31/0623, and PAP/218/2006, Poland;Fundacao para a Ciencia e a Tecnologia, Portugal; Ministry for Higher Education, Science, and Technology, SlovenianResearch Agency, Slovenia; Comunidad de Madrid, Consejer´ıa de Educacion de la Comunidad de Castilla La Mancha,FEDER funds, Ministerio de Ciencia e Innovacion and Consolider-Ingenio 2010 (CPAN), Xunta de Galicia, Spain; Sci-ence and Technology Facilities Council, United Kingdom; Department of Energy, Contract Nos. DE-AC02-07CH11359,DE-FR02-04ER41300, National Science Foundation, Grant No. 0450696, The Grainger Foundation USA; ALFA-EC /HELEN, European Union 6th Framework Program, Grant No. MEIF-CT-2005-025057, European Union 7th FrameworkProgram, Grant No. PIEF-GA-2008-220240, and UNESCO.