lst validation and analysis simon j. hook et al. email:[email protected]
TRANSCRIPT


Outline
• Introduction– Why is validation so important
• Locations– Tahoe and Salton Sea, Pseudo-Invariant sites
• Results – MODIS
• Summary and Conclusions

Introduction• The Idea– Temperatures of lakes and reservoirs have potential
as good indicators of climatic trends
– Existing in situ data is insufficient in space and time
– Nearly 30-year record of satellite thermal infrared imagery available
• Project Objectives– Use satellite derived water surface temperatures to
characterize the temporal thermal behavior of lakes and inland water bodies worldwide
– Relate changes in the thermal behavior of the water bodies to global and regional climate change as indicated by surface air temperature data
– Study sites: 165 large lakes worldwide
– Case study: 6 lakes in California and Nevada
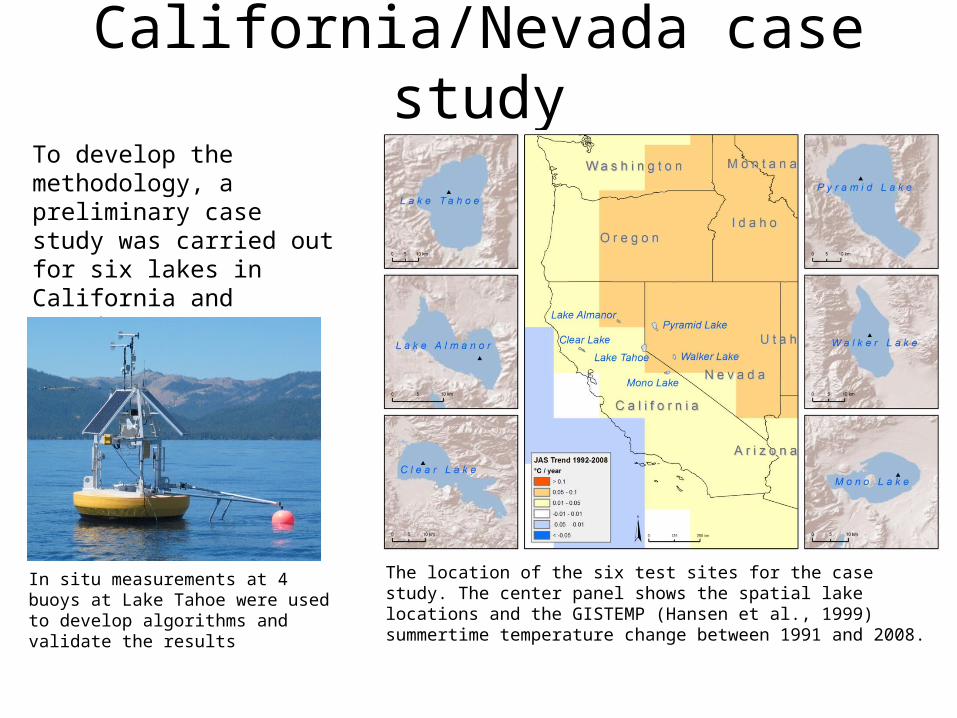
California/Nevada case study
The location of the six test sites for the case study. The center panel shows the spatial lake locations and the GISTEMP (Hansen et al., 1999) summertime temperature change between 1991 and 2008.
In situ measurements at 4 buoys at Lake Tahoe were used to develop algorithms and validate the results
To develop the methodology, a preliminary case study was carried out for six lakes in California and Nevada.

Results:Summertime (JAS) trends since 1991
Schneider et al. (2009), Satellite observations indicate rapid warming trend for lakes in California and Nevada. Geophys. Res. Lett., 36, L22402, doi:10.1029/2009GL040846.

Outline
• Introduction– Why is validation so important
• Locations– Tahoe and Salton Sea
• Results – MODIS
• Summary and Conclusions
• Future Work

2000-09-20-D
• Large 35 km x 16 km• High 2 km• Available year round (does not
freeze in winter).• Homogenous compared with land.• Large annual temperature range 5-
25 C.• Freshwater (kind to instruments!)• Good infrastructure and easy access.

TB3 Installed 11-04-2002
Skin temperature
Air temperature & Rel. Humidity
Wind Speed & Direction
LoggingSystem
BatteriesBulk WaterTemperature
3m

MODIS Terra Split Window Day and Night Surface Kinetic Temperatures at Lake Tahoe and Salton Sea CY2000-2009 v4-5.x
278.0
283.0
288.0
293.0
298.0
303.0
308.0
313.0
3/1/00 3/1/01 3/1/02 3/1/03 2/29/04 2/28/05 2/28/06 2/28/07 2/28/08 2/27/09
Year
Su
rfac
e T
emp
erat
ure
(K
)
Day1x1 lineNight

Cloud Free Filtered Statistics for MODIS Terra LST Products at Lake Tahoe and Salton Sea CY2000-2009, All Angles v4-5.x
0
100
200
300
400
500
600
700
800
900
1000
2000 2001 2002 2003 2004 2005 2006 2007 2008 2009
Year
Nu
mb
er o
f M
atch
up
s
AllNight onlyDay only
Standard Filter1. Buoy must be with 1km of center value2. All 9 values (3x3) must be good quality3. Std Dev. Of JPL SW 3x3 must be < 0.3K

Delta Temperature Between Vicarious and MODIS Terra LST Products with Instrument Zenith at Lake Tahoe and Salton Sea CY2000-2009, v4-5.x
-1.5
-1
-0.5
0
0.5
1
1.5
0-7 7-18 18-28 28-37 37-43 43-51 51-56
Instrument Zenith
Vic
ario
us
min
us
Pro
du
ct T
emp
erat
ure
(K
)
mod11 jplsw
MODIS LST Spec. ±1K

Delta Temperature between Vicarious and MODIS Terra LST Products at Lake Tahoe and Salton Sea CY2000-2009, All Angles v4-5.x
-2
-1.5
-1
-0.5
0
0.5
1
1.5
2
2000 2001 2002 2003 2004 2005 2006 2007 2008 2009 All Years
Year
Vic
ario
us
min
us
MO
DIS
Der
ived
(K
)
MOD11JPLSW
MODIS LST Spec. ±1K

Delta Temperature between Vicarious and MODIS Aqua LST Products at Lake Tahoe and Salton Sea CY2000-2009, All Angles v4-5.x
-2
-1.5
-1
-0.5
0
0.5
1
1.5
2
2000 2001 2002 2003 2004 2005 2006 2007 2008 2009 All Years
Year
Vic
ario
us
min
us
MO
DIS
Der
ived
(K
)
MOD11JPLSW
MODIS LST Spec. ±1K

14
Validation of North American ASTER Emissivity Database (NAALSED)
Hulley, G. C., Hook, S. J., and A.M. Baldridge, (2009), Validation of the North American ASTER Land Surface Emissivity Database (NAALSED) Version 2.0, Remote Sensing of Environment, 113, 2224-2233

MODIS Emissivities are over-estimated

Summary and Conclusions• Established automated sites for validating thermal infrared data at
Lake Tahoe CA/NV and Salton Sea CA. Lake Tahoe Site has been operating since 1999.
• Measurements made at the site include skin- bulk- air- temperature, wind speed, wind direction and net radiation at multiple locations every 2 minutes. Multiple locations (4 buoys) allow validation of several points within a scene.
• Validated data from multiple instruments including, AATSR, ASTER, MODIS (Terra, Aqua), Landsat 5 and Landsat ETM+, MTI.
• Results so far for MODIS indicate:– MODIS algorithm works extremely well over water– MODIS algorithms have some issues over arid and sem-arid areas. Version
4.1 better than 5.0– MODIS algorithms have some issues over wet surfaces. Version 4.1 better
than 5.0

Backup

Namib Desert Rainfall event during April 2006TRMM rainfall anomaly for April, 2006 (mm)
From 16-22 April 2006, almost 100 mm rain was recorded at Luderitz – 6 times the long-term annual rainfall average!Muller et al. (2008) found that wet conditions over Southern Africa during this time resulted from a combination of La Niña event and warming of the southeast Atlantic Ocean.

Increase in Emissivity
TRMM Rainfall

Namib Desert