lucas bols reports first-half revenue and net profit in ... bols reports first-half... · interim...
TRANSCRIPT

Half-year results 2016/17 (1 April 2016 – 30 September 2016)
17 November 2016
Lucas Bols reports first-half revenue and net profit in line with last year Good performance in North America and Emerging Markets
Highlights first half year 2016/17
Revenue of € 39.4 million, in line with last year, driven by 2.2% growth in the global brands at constant currency
North America and Emerging Markets reported strong revenue growth and Asia-Pacific showed recovery, while Western Europe remains challenging
Dutch genever brands Floryn and Legner were acquired as part of the takeover of the Cooymans distillery by the Avandis joint venture
Increased investments in commercial organisation and A&P largely funded by higher EBIT achieved by regional brands, including one-off gain on Cooymans acquisition
EBIT of € 11.3 million, down 2.4% at constant currency
Net profit of € 7.8 million, up 1.7% at constant currency
Interim dividend set at € 0.31 per share in cash
Agreement with Rémy Cointreau on Passoã joint venture announced in October
Huub van Doorne, CEO Lucas Bols: “In the first half of the 2016/17 financial year we saw favourable
developments in North America and the Emerging Markets regions, with organic revenue growth of 10.7% and
9.2%, respectively. Asia-Pacific recovered, as expected, with good developments in Australia and New Zealand. In
Western Europe the market remains challenging, mainly in the German and Benelux markets. In the first half of the
year we took steps to further leverage our asset-light platform. Firstly, we acquired Dutch genever brands Floryn
and Legner, strengthening our market leadership position in the Dutch market. Furthermore, we signed an
agreement with Rémy Cointreau to establish a joint venture to manage the Passoã brand. We look forward to
further building this iconic brand within our portfolio of global brands. The Passoã activities will add significant value
to our shareholders as it is expected to increase our earnings per share by around 20% on a full-year basis.”
Key figures
(in € million unless otherwise stated, for the half year ended)
30 September 2016
30 September 2015
% change reported
% change organic1
Revenue 39.4 39.4 +0.1% +0.3%
Gross margin 60.3% 60.8% -50 bps -50 bps
EBIT2 11.3 11.6 -2.5% -2.4%
Net profit 7.8 7.7 +1.6% +1.7%
Operating free cash flow3 7.8 8.8 -11.3% -11.2%
Earnings per share (in €) 0.62 0.61 +1.6% +1.6%
Interim dividend per share (in €) 0.31 0.31 - -
1 at constant currency 2 EBIT is defined as operating profit plus share of profit of joint ventures 3 Operating free cash flow is defined as net cash from operating activities minus CAPEX

2
Financial review
Revenue Lucas Bols’ revenue for H1 ended 30 September 2016 (H1 2016/17) amounted to € 39.4 million, in line with the same period in the previous financial year. The effect of currencies on revenue was limited. Our global brands segment showed an improvement in revenue of 2.2%, whereas revenue of the regional brands decreased 3.9% compared to last year (organically). Looking at the regions, strong growth was achieved in North America (10.7% organically) and in the Emerging Markets (9.2% organically). Asia-Pacific showed recovery and reported modest growth of 1.5% organically. In Western Europe, where the majority of the revenue of the regional brands is achieved, we saw an organic decline of 6.9%. Gross profit Gross profit for H1 2016/17 decreased slightly to € 23.8 million compared to last year (H1 2015/16: € 24.0 million). The reported gross margin of 60.3% decreased by 50 bps, primarily as a result of changes in the regional mix. EBIT EBIT for H1 2016/17 was down 2.5% to € 11.3 million (H1 2015/16: € 11.6 million). At constant currency EBIT decreased by 2.4%. As previously communicated, Lucas Bols decided to step up its investments in both the commercial organisation and A&P behind the global brands. In this first half of the year the level of investment was around € 1 million higher than in the first half year 2015/16. Furthermore, Lucas Bols recorded a preliminary one-off gain of € 0.7 million related to the acquisition of the Cooymans distillery by Avandis in the first half of the financial year, as the amount paid for the activities is less than the fair value of the acquired activities. Developments by global brands and regional brands Global brands Our portfolio of global brands consists of Bols Liqueurs, Bols Genever, Bols Vodka, Damrak Gin and the Italian liqueurs Galliano and Vaccari Sambuca.
(in € million unless otherwise
stated, for the half year ended)
30 September
2016
30 September
2015
% change
reported
% change
organic*
Revenue 27.7 27.2 +1.8% +2.2%
Gross profit
% of revenue
17.7
63.8%
17.8
65.3%
-0.5%
-150 bps
-0.2%
-150 bps
EBIT
% of revenue
11.8
42.7%
12.0
44.0%
-1.1%
-130 bps
-1.0%
-140 bps
* at constant currency Revenue of the global brands for H1 2016/17 amounted to € 27.7 million, an increase of € 0.5 million compared to € 27.2 million in the same period in 2015/16. The white spirits segment (Bols Vodka, Bols Genever and Damrak Gin) continued to achieve double-digit revenue growth. All three brands expanded to new markets and healthy organic growth was realised in the Netherlands and Scandinavia for Bols Vodka and in the US and the Netherlands for Damrak Gin. In addition, there were further distribution gains for Bols Genever in the on-premise market. The Italian liqueurs showed strong revenue gains on the back of the recovery of shipments to Australia. Bols Liqueurs was slightly down, mainly on lower shipments to South America and the German/Scandinavian border. Revenue of the global brands in Western Europe was lower compared to the first half of the previous financial year. This can be attributed to a weaker performance in Belgium following the significant excise increase in November 2015 and a revenue decline as we let go of a number of retail contracts at the German/Scandinavian border. We achieved double-digit growth in the Netherlands, where we realised strong market share gains with Damrak Gin and Bols Vodka. Furthermore, the markets in Spain, Ireland and Austria performed well.

3
In Asia-Pacific we saw a clear recovery of shipments to Australia and New Zealand in the first half of the year. Shipments to Southeast Asia also increased as the first positive results from the changes in our distribution network in the region became more visible. In Japan shipments were lower compared to last year when there were high shipments in anticipation of the price increase implemented last year. In North America growth in all brands in the US drove strong shipments. The Bols Liqueurs range continues to grow in depletions on the back of more listings in national accounts and further expansion in the number of listings in control states. The other global brands also performed well in terms of both shipments and depletions. This resulted in a healthy mid-single-digit growth in depletions. Canada had a solid, stable half year, with a growing trend for Galliano and Damrak Gin, which was recently introduced. In the Emerging Markets region, the Russian and Polish markets achieved continued strong growth. We are clearly bearing the fruits of our continued investments in that region. In Central America an intentional decrease in shipments to some customers resulted in lower revenue compared to last year. Gross profit of the global brands decreased slightly from € 17.8 million in the first half of last year to € 17.7 million in the first half year 2016/17. The gross margin was down 150 bps mainly as a result of the changing regional mix, with increased sales in the US. Despite a 6% increase in D&A expenses, EBIT decreased only slightly by € 0.2 million or 1% to € 11.8 million. Regional brands Our regional brand portfolio contains the portfolio of Dutch Genevers and Vieux (which enjoy market leadership in the Dutch market), the Pisang Ambon and Coebergh brands as well as a broader range of products that are sold on one continent or in a specific country such as Henkes Star Schnapps in West-Africa or Regnier Crème de Cassis in Japan.
(in € million unless otherwise
stated, for the half year ended)
30 September
2016
30 September
2015
% change
reported
% change
organic*
Revenue 11.7 12.2 -3.8% -3.9%
Gross profit
% of revenue
6.1
52.1%
6.2
50.9%
-1.5%
+120 bps
-1.8%
+110 bps
EBIT
% of revenue
5.9
50.6%
5.3
43.5%
+11.8%
+710 bps
+11.5%
+700 bps
* at constant currency Revenue of the regional brands for H1 2016/17 amounted to € 11.7 million, a decrease of € 0.5 million compared to € 12.2 million for H1 2015/16. The decrease in revenue was mainly the result of lower sales in France and the Benelux. The retail markets in Belgium and the Netherlands continued to be challenging, as the increase in excise duties in Belgium is still impacting the market. Our market share of domestic spirits in the Netherlands was nevertheless able to continue to grow. This position will be strengthened even further with the acquisition of the Dutch genever brands Floryn and Legner. In Africa revenue rose significantly compared to a year earlier. Progress was made in southern Africa due to the change in distributor and with the support of the local sales agent. The gross margin increased by 110 bps on an organic basis mainly as a result of changes in the regional mix, with higher sales in Africa. EBIT for the regional brands increased by 11.5% and consequently the EBIT margin was substantially higher at 50.6% compared to 43.5% in the comparable period last year. This was mainly the result of the one-off gain that was recorded following the acquisition of the Cooymans distillery by the Avandis joint venture. Excluding the one-off gain and at constant currency, the regional brands posted stable EBIT compared to last year, fulfilling Lucas Bols’ objective of stabilising the regional brands segment. Finance costs Finance costs were slightly lower compared to last year at € 1.3 million (H1 2015/16: € 1.4 million). Taxes The effective tax rate was approximately 23% for H1 2016/17, slightly below the nominal tax rate, as a result of the effect of the share of profit of joint ventures. The effective tax rate was lower this half year compared to H1 2015/16 (approximately 26%) as the share of profit of joint ventures is higher in the first half of this year.
4
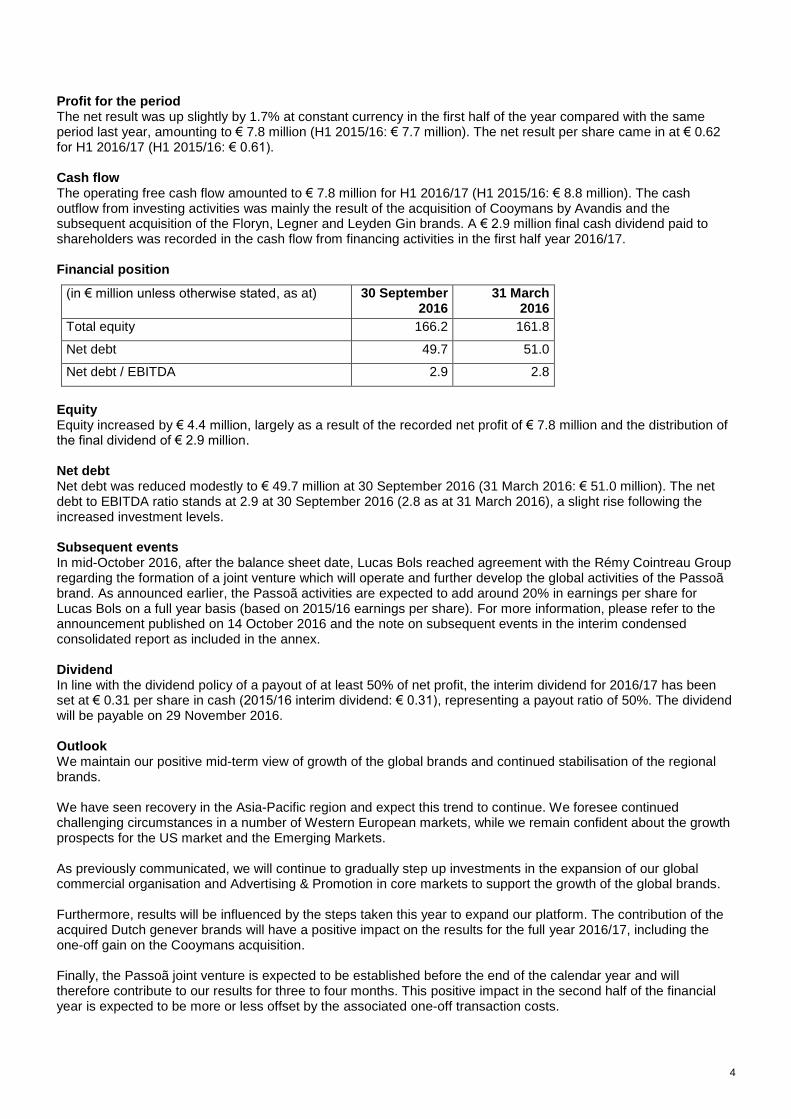
Profit for the period The net result was up slightly by 1.7% at constant currency in the first half of the year compared with the same period last year, amounting to € 7.8 million (H1 2015/16: € 7.7 million). The net result per share came in at € 0.62 for H1 2016/17 (H1 2015/16: € 0.61). Cash flow The operating free cash flow amounted to € 7.8 million for H1 2016/17 (H1 2015/16: € 8.8 million). The cash outflow from investing activities was mainly the result of the acquisition of Cooymans by Avandis and the subsequent acquisition of the Floryn, Legner and Leyden Gin brands. A € 2.9 million final cash dividend paid to shareholders was recorded in the cash flow from financing activities in the first half year 2016/17. Financial position
(in € million unless otherwise stated, as at)
30 September 2016
31 March 2016
Total equity 166.2 161.8
Net debt 49.7 51.0
Net debt / EBITDA 2.9 2.8
Equity Equity increased by € 4.4 million, largely as a result of the recorded net profit of € 7.8 million and the distribution of the final dividend of € 2.9 million. Net debt Net debt was reduced modestly to € 49.7 million at 30 September 2016 (31 March 2016: € 51.0 million). The net debt to EBITDA ratio stands at 2.9 at 30 September 2016 (2.8 as at 31 March 2016), a slight rise following the increased investment levels. Subsequent events In mid-October 2016, after the balance sheet date, Lucas Bols reached agreement with the Rémy Cointreau Group regarding the formation of a joint venture which will operate and further develop the global activities of the Passoã brand. As announced earlier, the Passoã activities are expected to add around 20% in earnings per share for Lucas Bols on a full year basis (based on 2015/16 earnings per share). For more information, please refer to the announcement published on 14 October 2016 and the note on subsequent events in the interim condensed consolidated report as included in the annex. Dividend In line with the dividend policy of a payout of at least 50% of net profit, the interim dividend for 2016/17 has been set at € 0.31 per share in cash (2015/16 interim dividend: € 0.31), representing a payout ratio of 50%. The dividend will be payable on 29 November 2016. Outlook We maintain our positive mid-term view of growth of the global brands and continued stabilisation of the regional brands. We have seen recovery in the Asia-Pacific region and expect this trend to continue. We foresee continued challenging circumstances in a number of Western European markets, while we remain confident about the growth prospects for the US market and the Emerging Markets. As previously communicated, we will continue to gradually step up investments in the expansion of our global commercial organisation and Advertising & Promotion in core markets to support the growth of the global brands. Furthermore, results will be influenced by the steps taken this year to expand our platform. The contribution of the acquired Dutch genever brands will have a positive impact on the results for the full year 2016/17, including the one-off gain on the Cooymans acquisition. Finally, the Passoã joint venture is expected to be established before the end of the calendar year and will therefore contribute to our results for three to four months. This positive impact in the second half of the financial year is expected to be more or less offset by the associated one-off transaction costs.

5
For further information
www.lucasbols.com Huub van Doorne (CEO) / Joost de Vries (CFO) +31 20 570 85 48
About Lucas Bols
Lucas Bols is the world’s oldest distilled spirits brand and one of the oldest Dutch companies still in business. Building on its more than 440-year-old heritage dating back to 1575, the company has mastered the art of distilling, mixing and blending liqueurs, genever, gin and vodka. Lucas Bols owns a portfolio of more than 20 premium and super premium brands of different spirits used in cocktail bars worldwide. Its products are sold in more than 110 countries around the world. Lucas Bols has been listed on Euronext Amsterdam (BOLS) since 4 February 2015. Lucas Bols holds the number one position in liqueur ranges worldwide (outside the USA) and is the wor ld’s largest player in the genever segment. Many of Lucas Bols’ other products have market or category-leading positions. Furthermore, Lucas Bols is a leading player in the bartending community. Through the House of Bols Cocktail & Genever Experience and Europe’s largest bartending school, the Bols Bartending Academy, the company provides inspiration and education to both bartenders and consumers. Financial calendar
8 June 2017 Publication of full-year results 2016/17
7 September 2017 Annual General Meeting of Shareholders
16 November 2017 Publication half-year results 2017/18
Interim dividend
22 November 2016 Ex-dividend date
23 November 2016 Record date
29 November 2016 Payment of interim dividend
Annexes
1. Segment information
2. Brand information
3. Interim condensed consolidated report H1 2016/17

6
Brand information
Global brands Our portfolio of global brands consists of Bols Liqueurs, Bols Genever, Bols Vodka, Damrak Gin and the Italian liqueurs Galliano and Vaccari Sambuca.
(in € million unless otherwise stated,
for the half year ended)
30 September
2016
30 September
2015
% change
reported
% change
organic*
Revenue 27.7 27.2 +1.8% +2.2%
Gross profit
% of revenue
17.7
63.8%
17.8
65.3%
-0.5%
-150 bps
-0.2%
-150 bps
D&A expenses
% of revenue
-6.2
22.2%
-5.8
21.3%
+6.1%
+90 bps
+6.7%
+100 bps
EBIT
% of revenue
11.8
42.7%
12.0
44.0%
-1.1%
-130 bps
-1.0%
-140 bps
Regional brands Our regional brand portfolio contains the portfolio of Dutch Genevers and Vieux (which enjoy market leadership in the Dutch market), the Pisang Ambon and Coebergh brands as well as a broader range of products that are sold on one continent or in a specific country such as Henkes Star Schnapps in West Africa or Regnier Crème de Cassis in Japan.
(in € million unless otherwise stated,
for the half year ended)
30 September
2016
30 September
2015
% change
reported
% change
organic*
Revenue 11.7 12.2 -3.8% -3.9%
Gross profit
% of revenue
6.1
52.1%
6.2
50.9%
-1.5%
+120 bps
-1.8%
+110 bps
D&A expenses
% of revenue
-0.9
7.5%
-0.9
7.6%
-5.7%
-20 bps
-6.5%
-20 bps
EBIT
% of revenue
5.9
50.6%
5.3
43.5%
+11.8%
+710 bps
+11.5%
+700 bps
Total
(in € million unless otherwise stated,
for the half year ended)
30 September
2016
30 September
2015
% change
reported
% change
organic*
Revenue 39.4 39.4 +0.1% +0.3%
Gross profit
% of revenue
23.8
60.3%
24.0
60.8%
-0.7%
-50 bps
-0.6%
-50 bps
D&A expenses (allocated)
% of revenue
-7.0
17.8%
-6.7
17.1%
+4.4%
+70 bps
+4.9%
+80 bps
D&A expenses (unallocated)
% of revenue
-6.4
16.3%
-5.6
14.3%
+13.8%
+200bps
+13.7%
+190 bps
EBIT
% of revenue
11.3
28.8%
11.6
29.5%
-2.5%
-70 bps
-2.4%
-80 bps
* at constant currency

7
Segment information
Western Europe
(in € million unless otherwise stated, for the
half year ended)
30 September
2016
30 September
2015
% change
reported
% change
organic*
Revenue
% of total revenue
17.3
43.9%
18.7
47.5%
-7.7%
-6.9%
Gross profit
% of total gross profit
9.2
38.7%
10.3
43.1%
-11.0%
-10.0%
Gross margin (gross profit as a % of revenue)
53.0% 55.3% -230 bps -190 bps
Asia-Pacific
(in € million unless otherwise stated, for the
half year ended)
30 September
2016
30 September
2015
% change
reported
% change
organic*
Revenue
% of total revenue
8.6
21.8%
8.1
20.7%
+5.7%
+1.5%
Gross profit
% of total gross profit
6.3
26.5%
5.8
24.4%
+8.5%
+2.6%
Gross margin (gross profit as a % of revenue) 73.8% 71.8% +200 bps +80 bps
North America
(in € million unless otherwise stated, for the
half year ended)
30 September
2016
30 September
2015
% change
reported
% change
organic*
Revenue
% of total revenue
8.3
21.1%
7.6
19.2%
+10.0%
+10.7%
Gross profit
% of total gross profit
4.7
19.8%
4.4
18.5%
+6.7%
+7.3%
Gross margin (gross profit as a % of revenue) 56.9% 58.6% -170 bps -180bps
Emerging Markets
(in € million unless otherwise stated, for the
half year ended)
30 September
2016
30 September
2015
% change
reported
% change
organic*
Revenue
% of total revenue
5.2
13.2%
5.0
12.7%
+5.4%
+9.2%
Gross profit
% of total gross profit
3.6
15.1%
3.4
14.0%
+6.7%
+12.5%
Gross margin (gross profit as a % of revenue) 68.0% 67.2% +80 bps +200bps
* at constant currency

Interim condensed consolidated financial information
for the six months period ended 30 September 2016
2
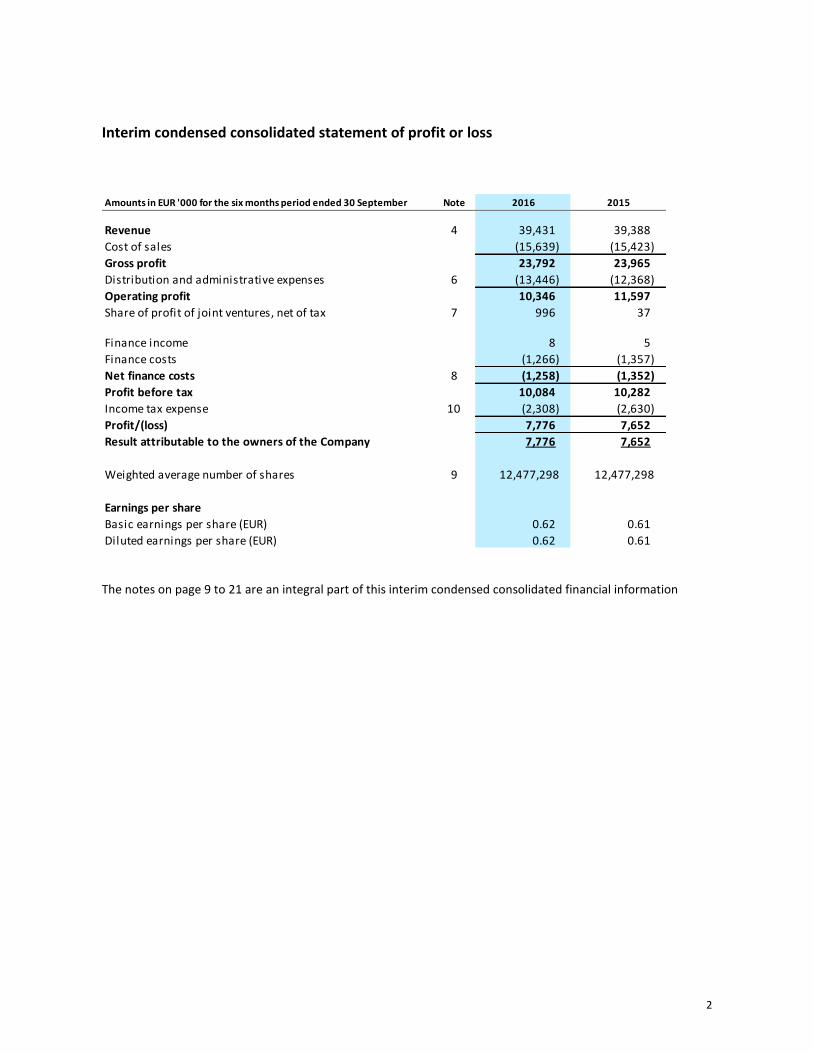
Interim condensed consolidated statement of profit or loss
The notes on page 9 to 21 are an integral part of this interim condensed consolidated financial information
Amounts in EUR '000 for the six months period ended 30 September Note 2016 2015
Revenue 4 39,431 39,388
Cost of sales (15,639) (15,423)
Gross profit 23,792 23,965
Distribution and administrative expenses 6 (13,446) (12,368)
Operating profit 10,346 11,597
Share of profit of joint ventures, net of tax 7 996 37
Finance income 8 5
Finance costs (1,266) (1,357)
Net finance costs 8 (1,258) (1,352)
Profit before tax 10,084 10,282
Income tax expense 10 (2,308) (2,630)
Profit/(loss) 7,776 7,652
Result attributable to the owners of the Company 7,776 7,652
Weighted average number of shares 9 12,477,298 12,477,298
Earnings per share
Basic earnings per share (EUR) 0.62 0.61
Diluted earnings per share (EUR) 0.62 0.61

3
Interim condensed consolidated statement of other comprehensive income
The notes on page 9 to 21 are an integral part of this interim condensed consolidated financial information
Amounts in EUR '000 for the six months period ended 30 September Note 2016 2015
Result for the period 7,776 7,652
Items that will never be reclassified to profit or loss
Remeasurement of defined benefit l iability (73) -
Items that are or may be reclassified to profit or loss
Foreign operations - foreign currency translation differences 13 (22)
Equity-accounted investees - share of other comprehensive
income10 (35)
Net change in hedging reserve (598) 1,103
Related tax 149 (276)
(425) 770
Other comprehensive income for the period, net of tax (498) 770
Total comprehensive income for the period, net of tax 7,278 8,422
Total comprehensive income attributable to the owners of
the Company7,278 8,422

4
Interim condensed consolidated statement of changes in equity
The notes on page 9 to 21 are an integral part of this interim condensed consolidated financial information
Amounts in EUR '000 NoteShare
capital
Share
premium
Treasury
shares
Translation
reserve
Hedging
reserve
Other legal
reserves
Retained
earnings
Result for
the periodTotal equity
Balance as at 1 April 2016 1,248 130,070 - (68) (1,114) 377 19,578 11,714 161,805
Transfer result prior period - - - - - 11,714 (11,714) -
Total comprehensive income
Profit (loss) for the period - - - - - - - 7,776 7,776
Other comprehensive income - - - 23 (448) - (73) - (498)
Total comprehensive income - - - 23 (448) - (73) 7,776 7,278
Dividend paid - - - - - - (2,870) - (2,870)
Purchase own shares (ESPP) - - 13 - - - - - 13
Own shares delivered (ESPP) - - (13) - - - - - (13)
Transfer to legal reserves - - - - - 131 (131) - -
Balance as at 30 September 2016 1,248 130,070 0 (45) (1,562) 508 28,219 7,776 166,213
Amounts in EUR '000 NoteShare
capital
Share
premium
Treasury
shares
Translation
reserve
Hedging
reserve
Other legal
reserves
Retained
earnings
Result for
the periodTotal equity
Balance as at 1 April 2015 1,248 130,070 - 32 (1,536) 295 22,853 220 153,182
Transfer result prior period - - - - - - 220 (220) -
Total comprehensive income
Profit (loss) for the period - - - - - - - 7,652 7,652
Other comprehensive income - - - (57) 827 - - - 770
Total comprehensive income - - - (57) 827 - - 7,652 8,422
Purchase own shares (ESPP) - - 92 - - - - - 92
Own shares delivered (ESPP) - - (92) - - - - - (92)
Transfer to legal reserves - - - - - 249 (249) - -
Balance as at 30 September 2015 1,248 130,070 0 (25) (709) 544 22,824 7,652 161,604

5
Interim condensed consolidated statement of financial position
The notes on page 9 to 21 are an integral part of this interim condensed consolidated financial information
Amounts in EUR '000 as at Note 30 September 2016 31 March 2016
Assets
Property, plant and equipment 11 1,497 1,546
Intangible assets 12 216,193 214,943
Investments in joint ventures 7,262 5,766
Other investments, including derivatives 771 599
Non-current assets 225,723 222,854
Inventories 6,140 7,024
Trade and other receivables 19,269 15,152
Derivative financial instruments 46 88
Cash and cash equivalents 2,306 6,477
Current assets 27,761 28,741
Total assets 253,484 251,595

6
Interim condensed consolidated statement of financial position (continued)
The notes on page 9 to 21 are an integral part of this interim condensed consolidated financial information
Amounts in EUR '000 as at Note 30 September 2016 31 March 2016
Equity
Share capital 1,248 1,248
Share premium 130,070 130,070
Treasury shares - -
Translation Reserve (45) (68)
Hedging Reserve (1,562) (1,114)
Other legal reserves 508 377
Retained earnings 28,218 19,578
Result for the period 7,776 11,714
Total equity 166,213 161,805
Liabilities
Loans and borrowings 13 47,421 49,749
Other non-current financial l iabilities 1,091 916
Employee benefits 335 220
Deferred tax liabilities 24,213 22,169
Total non-current liabilities 73,059 73,054
Loans and borrowings 13 4,115 7,135
Trade and other payables 8,983 8,854
Derivative financial instruments 1,112 747
Total current liabilities 14,211 16,736
Total liabilities 87,270 89,790
Total equity and liabilities 253,484 251,595

7
Interim condensed consolidated statement of cash flows
Amounts in EUR '000 for the six months period ended 30 September Note 2016 2015
Cash flows from operating activities
Result for the period 7,776 7,652
Adjustments for:
• Depreciation 258 242
• Net finance costs 8 1,258 1,352
• Share of profit joint ventures (996) (37)
• Income tax expense 2,308 2,630
• Provision for employee benefits 43 -
10,647 11,839
Change in:
• Inventories 884 693
• Trade and other receivables (4,031) 865
• Trade and other payables 250 (4,393)
Net changes in working capital 14 (2,896) (2,835)
Dividends from joint ventures 300 -
Interest received 9 5
Income tax paid (72) (69)
Income tax received - -
Net cash from operating activities 7,987 8,940

8
Interim condensed consolidated statement of cash flows (continued)
The notes on page 9 to 21 are an integral part of this interim condensed consolidated financial information
Amounts in EUR '000 for the six months period ended 30 September Note 2016 2015
Cash flows from investing activities
Acquisition of/additions to joint ventures 7 (914) (73)
Acquisition of property, plant and equipment 11 (209) (174)
Loans issued and other investments 7 (1,498) -
Net cash from (used in) investing activities (2,620) (247)
Cash flows from financing activities
Repayment of borrowings (2,415) (4,500)
Cash dividends paid to shareholders (2,870) -
Interest paid (1,078) (961)
Net cash from (used in) financing activities (6,362) (5,461)
Net increase (decrease) in cash and cash equivalents (995) 3,232
Cash and cash equivalents at 1 April 3,341 630
Effect of exchange rate fluctuations (155) (86)
Net cash and cash equivalents at 30 September 2,191 3,776
Cash and cash equivalents (asset) 2,306 4,224
Less: bank overdrafts included in current loans and borrowings (115) (449)
Net cash and cash equivalents at 30 September 2,191 3,776

9
Notes to the interim condensed consolidated financial statements for the six months period ended 30 September 2016 and 2015
1. Reporting entity
Lucas Bols N.V. (the `Company') is domiciled in the Netherlands. The address of the Company's registered office is Paulus Potterstraat 14, Amsterdam. The interim condensed consolidated financial statements of the Company as at and for the six months ended 30 September 2016 comprise the Company and its subsidiaries (together referred to as the `Group') and the Group's interest in jointly controlled entities. Lucas Bols N.V. is primarily involved in managing the product development, bottling, distribution, sales and marketing of the brands Bols, Galliano, Vaccari, Pisang Ambon, Bokma, Hartevelt, Coebergh and a large group of Dutch jenevers and liqueurs.
2. Basis of preparation
(a) Statement of compliance The interim condensed consolidated financial statements have been prepared in accordance with IAS 34 Interim Financial Reporting as endorsed by the EU. They do not include all the information required for a complete set of IFRS financial statements. However, selected explanatory notes are included to explain events and transactions that are significant to an understanding of the changes in the Group's financial position and performance since the last annual consolidated financial statements as at and for the year ended 31 March 2016. The interim condensed consolidated financial statements were authorised for issue by the Management Board and Supervisory Board on 16 November 2016. (b) Basis of measurement The interim condensed consolidated financial statements have been prepared on each reporting date on the historical cost basis except for the following material items in the statement of financial position:
derivative financial instruments are measured at fair value;
interests in the joint venture are accounted for using the equity method;
the net defined benefit liability is recognised as the present value of the defined benefit obligation, less the fair value of plan assets.
Measurement of fair values
A number of the Group's accounting policies and disclosures require the measurement of fair values, for both financial and non-financial assets and liabilities. Fair values have been determined for measurement and/or disclosure purposes based on the valuation techniques as outlined below. When measuring the fair value of an asset or a liability, the Group uses market observable data as far as possible.
Fair values are categorized into different levels in a fair value hierarchy based on the inputs used in the
valuation techniques as follows
Level 1: quoted prices (unadjusted) in active markets for identical assets or liabilities.
Level 2: inputs other than quoted prices included in Level 1 that are observable for the asset or liability, either directly (i.e. as prices) or indirectly (i.e. derived from prices).
Level 3: inputs for the asset or liability that are not based on observable market data (unobservable inputs).
If the inputs used to measure the fair value of an asset or a liability might be categorized in different levels of the fair value hierarchy, then the fair value measurement is categorized in its entirety in the same level of the fair value hierarchy as the lowest level input that is significant to the entire measurement. The Group recognizes transfers between levels of the fair value hierarchy at the end of the reporting period during which the change has occurred.

10
Further information about the assumptions made in measuring fair values is included in note 12 – financial instruments.
(c) Functional and presentation currency The interim condensed consolidated financial statements are presented in Euro, which is the Company's functional currency. All financial information presented in Euro has been rounded to the nearest thousand, except when otherwise indicated.
(d) Use of estimates and judgements In preparing these consolidated financial statements, management has made judgements, estimates and assumptions that affect the application of accounting policies and the reported amounts of assets, liabilities, income and expenses. Actual results may differ from these estimates.
Estimates and underlying assumptions are reviewed on an ongoing basis. Revisions to accounting estimates are recognised prospectively. The significant judgements made by management in applying the Group’s accounting policies and the key sources of estimation uncertainty were the same as those that applied to the consolidated financial statements as at and for the year ended 31 March 2016.
3. Significant accounting policies
The accounting policies adopted in the preparation of the interim condensed consolidated financial
statements are consistent with those followed in the preparation of the Group’s annual consolidated financial
statements for the year ended 31 March 2016, except for the adoption of new standards and interpretations
effective as of 1 January 2016.
The following standards and amendments became effective as of 1 January 2016:
• IFRS 14 Regulatory Deferral Accounts
• Amendments to IFRS 11 Joint Arrangements: Accounting for Acquisitions of Interests
• Amendments to IAS 16 and IAS 38: Clarification of Acceptable Methods of Depreciation and Amortization
• Amendments to IAS 16 and IAS 41 Agriculture: Bearer Plants
• Amendments to IAS 27: Equity Method in Separate Financial Statements
• Annual Improvements Cycle - 2012-2014
• Amendments to IAS 1 Disclosure Initiative
• Amendments to IFRS 10, IFRS 12 and IAS 28 Investment Entities: Applying the Consolidation Exception
Not all of these standards and amendments impact the Group’s interim condensed consolidated financial
statements. Although these new standards and amendments apply for the first time in 2016, they do not have
a material impact on the annual consolidated financial statements of the Group or the interim condensed
consolidated financial statements of the Group. The nature and the impact of the new standard or
amendment applicable to the Group are described below: IFRS 11 Joint arrangements: accounting for acquisition if interests
The amendments to IFRS 11 require that a joint operator accounting for the acquisition of an interest in a joint
operation, in which the activity of the joint operation constitutes a business, must apply the relevant IFRS 3
Business Combinations principles for business combination accounting. The amendments also clarify that a
previously held interest in a joint operation is not remeasured on the acquisition of an additional interest in
the same joint operation if joint control is retained. In addition, a scope exclusion has been added to IFRS 11
to specify that the amendments do not apply when the parties sharing joint control, including the reporting
entity, are under common control of the same ultimate controlling party.

11
The amendments apply to both the acquisition of the initial interest in a joint operation and the acquisition of
any additional interests in the same joint operation and are prospectively effective for annual periods
beginning on or after 1 January 2016, with early adoption permitted. These amendments do not have any
impact on the Group as there has been no interest acquired in a joint operation during the period.
A number of new standards, amendments to standards and interpretations are effective for annual periods
beginning after 1 January 2017, and have consequently not been applied in preparing these interim condensed
consolidated financial statements. Those which may be relevant to the Group are set out below. The Group
does not plan to early adopt these standards:
IAS 7 Statement of cash flows
The amendments require a disclosure of the amounts in the opening and closing statement of financial
position for each item classified as financing in the statement of cash flows.
The amendments are effective for financial years beginning on or after 1 January 2017 and will consequently
be incorporated in the annual account 2017/18.
IFRS 9 Financial instruments IFRS 9, published in July 2014, replaces the existing guidance in IAS 39 Financial Instruments: Recognition and Measurement. IFRS 9 includes revised guidance on the classification and measurement of financial instruments, including a new expected credit loss model for calculating impairment on financial assets, and the new general hedge accounting requirements. It also carries forward the guidance on recognition and derecognition of financial instruments from IAS 39.
IFRS 9 is effective for annual reporting periods beginning on or after 1 January 2018, with early adoption permitted (not yet endorsed by the European Union).
The Company is in the process of assessing the potential impact on its consolidated financial statements resulting from the application of IFRS 9.
IFRS 15 Revenue from contracts with customers IFRS 15 establishes a comprehensive framework for determining whether, how much and when revenue is recognised. It replaces existing revenue recognition guidance, including IAS 18 Revenue, IAS 11 Construction Contracts and IFRIC 13 Customer Loyalty Programmes.
IFRS 15 is effective for annual reporting periods beginning on or after 1 January 2018, with early adoption permitted (endorsed by the European Union).
The Company is in the process of assessing the potential impact on its consolidated financial statements resulting from the application of IFRS 15.
IFRS 16 Leases IFRS 16 replaces existing guidance on lessee accounting for leases. It requires lessees to bring most leases on balance sheet in a single lease accounting model, recognizing a right of use asset and a lease liability.
IFRS 16 is effective for annual reporting periods beginning on or after 1 January 2019, with early adoption permitted (not yet endorsed by the European Union).
The Company will be assessing the potential impact on its consolidated financial statements resulting from the application of IFRS 16.

12
4. Operating segments
The Group sells products which can be divided in two reportable segments. This segmentation is also the structure in which the brands are managed within the Group, as they require different marketing and sales strategies. Within the Group separate financial information is available internally and used by the main operational decision-makers for resource allocation.
Brand information The Group identifies global and regional brands:
(I) Global brands
The global brands represent the Group’s brands which in general are sold on more than one continent, on which the Group achieves a relatively high margin and which have an on-premise character. The main global brands consist of the Bols Liqueur range, Italian Liqueurs (Galliano and Vaccari) and the white spirits portfolio (Bols Vodka , Bols Genever and Damrak Gin). (II) Regional brands
The regional brands represent the Group’s brands which in general are sold on one continent and predominantly have an off-premise character.
The main regional brands are the Group’s jenever/vieux portfolio, Pisang Ambon, Coebergh, the Strike brands, Regnier and La Fleurette. The Group's management reviews internal management reports of each segment. Information regarding the results of each reportable segment is set out on the next page. Allocation to the brand segments takes place on specific brand contribution level. Items managed on a group basis (i.e. overheads, finance and tax items) are not allocated to the segments. Only direct brand allocated assets and liabilities are allocated to the brand segments, all other assets and liabilities are managed on a group basis and not allocated to the segments.

13
Brand Information (continued)
1 EBIT is defined as operating profit plus share of profit of joint ventures
Amounts in EUR '000
for the six months period ended 30 September2016 2015 2016 2015 2016 2015 2016 2015
Revenue 27,697 27,196 11,735 12,192 - - 39,431 39,388
Cost of goods sold (10,013) (9,432) (5,626) (5,991) - - (15,639) (15,423)
Gross profit 17,684 17,764 6,109 6,201 - - 23,792 23,965
A&P and distribution expenses (6,152) (5,801) (876) (929) - - (7,027) (6,730)
Personnel and other expenses - - - - (6,419) (5,638) (6,419) (5,638)
Total result from operating activities 11,532 11,963 5,233 5,272 (6,419) (5,638) 10,346 11,597
Share of profits of joint ventures and
associates296 - 700 37 - - 996 37
EBIT 1 11,827 11,963 5,933 5,309 (6,419) (5,638) 11,342 11,634
Amounts in EUR '000 as at 30 September 2016 31 March 2016 30 September 2016 31 March 2016 30 September 2016 31 March 2016 30 September 2016 31 March 2016
Intangible assets 124,031 124,031 92,162 90,912 - - 216,193 214,943
Inventories 5,134 5,969 1,007 1,055 - - 6,140 7,024
Other assets - - - - 31,150 29,628 31,150 29,628
Total segment assets 129,165 130,000 93,169 91,967 31,150 29,628 253,484 251,595
Total segment liabilities - - - - (87,270) (89,790) (87,270) (89,790)
Global brands Regional brands Unallocated Total

14
Geographical information
From a geographical perspective, management has identified the following regions on which they manage their business:
5. Seasonality of operations
The Group's business is to a certain extent affected by seasonality. In full year 2015/16 the Group made 54% of its revenue in the first half year (April - September 2015) as distributors built up their stocks in anticipation of the year-end period. In 2015/16 we have experienced some changes in normal supply patterns related to in-market stock reductions in some markets, which could impact this year’s revenue seasonality. On the expense side the seasonality is reflected in higher advertising and promotional costs in the second half of the year, which traditionally results in a lower share of operating profit in the second half year.
6. Distribution and administrative expenses
Amounts in EUR '000
for the six months period ended 30 September2016 2015 2016 2015
Western Europe *) 17,262 18,702 9,143 10,335
Asia Pacific **) 8,599 8,137 6,343 5,845
North America ***) 8,303 7,551 4,724 4,428
Emerging markets 5,267 4,998 3,582 3,357
Consolidated totals 39,431 39,388 23,792 23,965
*) of which revenue attributed to The Netherlands: 8,301 (H1 2016/17) and 8,640 (H1 2015/16)
**) of which revenue attributed to distributor in Japan: 4,192 (H1 2016/17) and 4,551 (H1 2015/16)
***) of which revenue attributed to the USA: 6,829 (H1 2016/17) and 6,066 (H1 2015/16)
Revenue by region of destination Gross profit
Amounts in EUR '000 for the six months period ended 30 September 2016 2015
Advertising and promotional expenses (5,389) (5,067)
Distribution expenses (1,638) (1,663)
Personnel expenses (4,576) (4,039)
Other administrative expenses (1,585) (1,357)
Depreciation and amortisation (258) (242)
(13,446) (12,368)

15
7. Joint ventures
On July 26, 2016, Avandis, together with its joint venture partners Lucas Bols, De Kuyper Royal Distillers and Herman Jansen, reached agreement with the liquidator about the acquisition of the activities of Distilleerderij Cooymans and the wine operations of Delcave/NCK in Oosterhout, the Netherlands, both part of the Dirkzwager Groep. A provisional gain of EUR 2,9 million has been recognized as gain on bargain purchase by Avandis on the acquisition of Cooymans business (EUR 2,2 million after tax). Lucas Bols has recognized its 33% share of the gain, namely EUR 0,7 million as part of its profit from joint ventures as of September 30, 2016.
The valuation of the Cooymans acquisition is to be finalized later in the year.
As part of the Cooymans transaction, Lucas Bols has acquired the brands Legner, Floryn and Leyden Gin for a
consideration of EUR 1,3 million. The brands have been included as intangible assets of Lucas Bols as of September
2016.
Lucas Bols has also invested in the extension of joint venture capital by EUR 0,5 million in Avandis B.V. and EUR
0,4 million in BolsKyndal India.
8. Net finance costs
Finance costs decreased as a result of repayment of borrowings.
9. Earnings per share
Total weighted average number of shares has not changed compared to the number in the consolidated financial statements as at and for the year ended 31 March 2016.
10. Tax expense
Tax expense comprises deferred tax. The Group's consolidated effective tax rate in respect of continuing operations for the six months ended 30 September 2016 was 22.9% (six months ended 30 September 2015: 25.6%). The percentage of the effective tax rate for the six months ended 30 September 2016 versus the official tax rate in the Netherlands of 25% was caused predominantly by the effect of share of profit of equity-accounted investees, which is excluded from the tax expense on operations (see table).
Amounts in EUR '000 for the six months period ended 30 September 2016 2015
Interest income 8 5
Finance income 8 5
Interest on loans and borrowings (1,194) (1,285)
Amortization refinancing fees (72) (72)
Finance costs (1,266) (1,357)
Net finance costs recognised in profit or loss (1,258) (1,352)

16
Reconciliation of effective tax rate
Deferred tax liabilities
The deferred tax liabilities (EUR 24,213 thousand) as at 30 September 2016 is a netted amount (EUR 22,169 thousand as at 31 March 2016). It is the net balance of deferred tax assets of EUR 5,406 thousand (EUR 7,381 thousand as at 31 March 2016) and deferred tax liabilities of EUR 29,619 thousand (EUR 29,550 thousand as at 31 March 2016).
11. Property, plant and equipment
During the six months ended 30 September 2016, the Group acquired assets with a cost of EUR 209 thousand (the six months ended 30 September 2015: EUR 174 thousand).
12. Intangible assets
Each year the Company carries out a formal impairment test at the end of its financial year. For the six month period ended 30 September 2016 no impairment test has been performed as the operations during the six month period ended 30 September 2016 are in line with assumptions as used in last year's impairment test which is performed at 31 March 2016. Management has not identified any indicators at 30 September 2016, nor at 30 September 2015 for carrying out an additional impairment test as no triggering event was in place.
As part of the Cooymans transaction, Lucas Bols has acquired the brands Legner, Floryn and Leyden Gin for a
consideration of EUR 1,3 million. The brands have been included as intangible assets of Lucas Bols as of September
2016.
13. Loans and borrowings
In addition to the share capital raised the Group has drawn EUR 18,0 million term loans and EUR 33,9 million revolving credit facilities under the existing bank facilities. No major changes have occurred in the position as reflected in the consolidated financial statements as at and for the year ended 31 March 2016.
14. Net working capital
The increase in working capital for the six-month period ended 30 September 2016 and 2015 is caused by seasonality.
For the six months period ended 30 September
% EUR 1,000 % EUR 1,000
Profit before tax 10,084 10,282
Tax using the Company's domestic tax rate 25.0 (2,521) 25.0 (2,570)
Effect of tax rates in foreign jurisdictions 0.4 (36) 0.7 (69)
Effect of share of profits of equity-accounted investees (2.5) 249 (0.1) 9
22.9 (2,308) 25.6 (2,630)
2016 2015

17
15. Financial instruments
The following table shows the carrying amounts and fair values of financial assets and financial liabilities, including their levels in the fair value hierarchy.
30 September 2016
'
Amounts in EUR ̀ 000
Fair value –
hedging
instruments
Loans and
receivables
Other
financial
liabilities
Total Level 1 Level 2 Level 3 Total
Financial assets measured at fair value
Interest rate swaps used for hedging - - - - - - - -
Forward exchange contracts used for
hedging46 - - 46 - 46 - 46
46 - - 46 - 46 - 46
Financial assets not measured at fair
value
Loan to joint venture Avandis CV - 599 - 599 - 599 - 599
Other long term loan - 172 - 172 - 172 - 172
Trade and other receivables - 19,269 - 19,269 - 19,269 - 19,269
Cash and cash equivalents - 2,306 2,306 - 2,306 - 2,306
- 22,346 - 22,346 - 22,346 - 22,346
Financial liabilities measured at fair
value
Interest rate swaps used for hedging (1,420) - - (1,420) - (1,420) - (1,420)
Forward exchange contracts used for
hedging(708) - - (708) - (708) - (708)
(2,128) - - (2,128) - (2,128) - (2,128)
Financial liabilities not measured at
fair value
Secured bank loans - - (51,421) (51,421) - (51,421) - (51,421)
Other long term loan - - (75) (75) - (75) - (75)
Bank overdrafts - - (115) (115) - (115) - (115)
Trade and other payables - - (8,983) (8,983) - (8,983) - (8,983)
- - (60,594) (60,594) - (60,594) - (60,594)

18
30 September 2015
'
Amounts in EUR ̀ 000
Fair value –
hedging
instruments
Loans and
receivables
Other
financial
liabilities
Total Level 1 Level 2 Level 3 Total
Financial assets measured at fair value
Interest rate swaps used for hedging - - - - - - - -
Forward exchange contracts used for
hedging133 - - 133 - 133 - 133
133 - - 133 - 133 - 133
Financial assets not measured at fair
value
Loan to joint venture Avandis CV - 599 - 599 - 599 - 599
Other long term loan - - - - - - - -
Trade and other receivables - 17,477 - 17,477 - 17,477 - 17,477
Cash and cash equivalents - 4,224 4,224 - 4,224 - 4,224
- 22,301 - 22,301 - 21,702 - 21,702
Financial liabilities measured at fair
value
Interest rate swaps used for hedging (1,059) - - (1,059) - (1,059) - (1,059)
Forward exchange contracts used for
hedging(19) - - (19) - (19) - (19)
(1,078) - - (1,078) - (1,078) - (1,078)
Financial liabilities not measured at
fair value
Secured bank loans - - (56,677) (56,677) - (56,677) - (56,677)
Other long term loan - - (104) (104) - (104) - (104)
Bank overdrafts - - (449) (449) - (449) - (449)
Trade and other payables - - (7,418) (7,418) - (7,418) - (7,418)
- - (64,647) (64,647) - (64,647) - (64,647)

19
Measurement of fair values
Valuation techniques and significant unobservable inputs
The following tables show the valuation techniques used in measuring Level 2 fair values at 30 September 2016 and 30 September 2015, as well as the significant unobservable inputs used.
Financial instruments measured at fair value:
Type Valuation technique Significant unobservable inputs
Inter-relationship between significant unobservable inputs and fair value measurement
Forward exchange contracts and interest rate swaps
Market comparison technique: The fair values are based on broker quotes. Similar contracts are traded in an active market and the quotes reflect the actual transactions in similar instruments
Not applicable Not applicable
Financial instruments not measured at fair value:
Type Valuation technique Significant unobservable inputs
Financial assets Discounted cash flows Not applicable
Financials liabilities Discounted cash flows Not applicable
Financial assets include trade and other receivables and cash and cash equivalents. Other financial liabilities include bank loans, other short term financial liabilities, trade and other payables. The book value of the secured bank loans are considered to be the best approximation of the fair value. For all other financial instruments, the fair value is considered to be consistent with the book value.
16. Employee Share Purchase Plan (ESPP)
In 2015 the Group set up an employee share purchase plan. Under this plan, employees are offered the opportunity to buy depositary receipts for shares (investment shares) of the Company from own payment twice a year following publication of the half-year and full-year results, whereas the first time occurred after publication of the full-year 2014/15 results. The employees are entitled to buy shares at a discount of 13.5% of the share price at that time. Each participant may determine at his or her own discretion the amount of money to be invested in investment shares with a yearly maximum of 33.33% of the gross base salary of the participant. Shares issued under the ESPP are bought on the regulated market of Euronext Amsterdam and will be held by a trust foundation. A three-year lock up period is applicable, during which the participants cannot dispose of their investment shares. No other vesting or performance conditions are applicable. The plan qualifies as share based arrangements (equity settled) under IFRS 2. No share based payment costs are recognized in the profit and loss account as the fair value of the share based payment is zero.

20
17. Commitments and operating leases
Leases as lessee
The Group leases offices under operating lease.
The Group determined that the office leases are an operating lease. The rent paid to the owner is adjusted to market rent at regular intervals, and the Group does not have an interest in the residual value of the office building. As a result, it was determined that substantially all of the risks and rewards of the office buildings are with the owner.
Future minimum lease payments
At 30 September 2016 the future minimum payable lease payments under non-cancellable leases were as follows:
For the lessor a guarantee has been issued for an amount of EUR 138 thousand.
18. Related parties
The Group has related party relationships with its shareholders, subsidiaries, Management Board and Supervisory Board and post-employment benefit plans. The financial transactions between the Company and its subsidiaries comprise financing related transactions and operational transactions in the normal course of business and are eliminated in the consolidated financial statements. The related party transactions in the first six-month period ended 30 September 2016 do in substance not deviate from the transactions as reflected in the consolidated financial statements as at and for the year ended 31 March 2016.
Other related party transactions
Amounts in EUR '000 for the six months period ended 30 September 2016 2015
Less than 1 year 608 625
Between 1 and 5 years 1,716 2,087
More than 5 years - 197
2,324 2,909
Amounts in EUR ̀ 000 2016 2015 2016 2015
Sale of goods and services
Joint ventures 6,579 6,925 875 791
Purchase of goods and services
Joint ventures (10,372) (9,005) (872) (443)
Others
Joint venture dividends received 300 -
Joint ventures loan and related interest - - 599 599
Transaction values for the
6 months period ended
30 September
Balance outstanding as at
30 September

21
19. Subsequent event On October 14th, 2016, Lucas Bols announced that it had reached agreement with the Rémy Cointreau Group regarding the formation of Passoa S.A, a jointly owned entity based in France, which will operate and further develop the global activities of the iconic Passoã brand. Lucas Bols acquired interest in Passoa SA and will perform day to day management of the jointly owned entity and run the Passoã brand in the ordinary course of business. Lucas Bols will assume operational and financial control of Passoa S.A.. Lucas Bols shall fund Passoa S.A’s working capital requirements which are, at the establishment of the entity, of an amount of EUR 5 million. Lucas Bols will consolidate the full financials of Passoa S.A. into its accounts and the results will be fully attributable to the shareholders of Lucas Bols. Passoa S.A. is expected to generate revenues of around EUR 18 million on a full year basis, with margins in line with Lucas Bols’ global brand EBIT margins. In due time the jointly owned entity could lead to the acquisition by Lucas Bols of all shares then held by Rémy Cointreau, only in the event of the exercise of a put or call option, for a consideration of approximately EUR 70 million. The transaction is expected to close before the end of 2016. Lucas Bols is in the process of determining the accounting for the transaction and performing the valuation.
20. Auditor’s review
The interim condensed consolidated financial statements for the period ended 30 September 2016 have not been reviewed by the external auditor.
21. Responsibility statement
The Management Board of Lucas Bols N.V. hereby declares that, to the best of its knowledge, the interim condensed consolidated financial statements as at and for the six months ended 30 September 2016 as prepared in accordance with IAS 34 Interim Financial Reporting gives a true and fair view of the assets, liabilities, financial position and the profit or loss of Lucas Bols N.V. and its consolidated companies included in the consolidation as a whole, and that the semi-annual report gives a fair view of the information required in accordance with section 5:25d subsections 8 and 9 of the Dutch Financial Supervision Act (Wet op het financieel toezicht).