luminosity discrepancy in the equal-mass, pre-main...
TRANSCRIPT

The Astrophysical Journal, 745:58 (22pp), 2012 January 20 doi:10.1088/0004-637X/745/1/58C© 2012. The American Astronomical Society. All rights reserved. Printed in the U.S.A.
LUMINOSITY DISCREPANCY IN THE EQUAL-MASS, PRE-MAIN-SEQUENCE ECLIPSING BINARYPAR 1802: NON-COEVALITY OR TIDAL HEATING?
Yilen Gomez Maqueo Chew1,2, Keivan G. Stassun1,3,4, Andrej Prsa5,6, Eric Stempels7, Leslie Hebb1,Rory Barnes8, Rene Heller9, and Robert D. Mathieu10
1 Department of Physics and Astronomy, Vanderbilt University, Nashville, TN 37235, USA; [email protected] Astrophysics Research Centre, Queen’s University Belfast, University Rd. Belfast, County Antrim BT7 1NN, UK
3 Department of Physics, Fisk University, Nashville, TN 37208, USA4 Department of Physics, Massachusetts Institute of Technology, Cambridge, MA 02139, USA
5 Department of Astronomy and Astrophysics, Villanova University, Villanova, PA 19085, USA6 Department of Physics, University of Ljubljana, 1000 Ljubljana, Slovenia
7 Department of Astronomy and Space Physics, Uppsala University, SE-752 67 Uppsala, Sweden8 Department of Astronomy, University of Washington, Seattle, WA 98195, USA
9 Leibniz-Institut fur Astrophysik Potsdam (AIP), An der Sternwarte 16, 14482 Potsdam, Germany10 Department of Astronomy, University of Wisconsin–Madison, Madison, WI 53706, USA
Received 2011 June 20; accepted 2011 October 21; published 2011 December 29
ABSTRACT
Parenago 1802, a member of the ∼1 Myr Orion Nebula Cluster, is a double-lined, detached eclipsing binary ina 4.674 day orbit, with equal-mass components (M2/M1 = 0.985 ± 0.029). Here we present extensive VICJHKS
light curves (LCs) spanning ∼15 yr, as well as a Keck/High Resolution Echelle Spectrometer (HIRES) opticalspectrum. The LCs evince a third light source that is variable with a period of 0.73 days, and is also manifested in thehigh-resolution spectrum, strongly indicating the presence of a third star in the system, probably a rapidly rotatingClassical T Tauri star. We incorporate this third light into our radial velocity and LC modeling of the eclipsing pair,measuring accurate masses (M1 = 0.391 ± 0.032 and M2 = 0.385 ± 0.032 M�), radii (R1 = 1.73 ± 0.02 and R2 =1.62 ± 0.02 R�), and temperature ratio (Teff,1/Teff,2 = 1.0924 ± 0.0017). Thus, the radii of the eclipsing stars differby 6.9% ± 0.8%, the temperatures differ by 9.2% ± 0.2%, and consequently the luminosities differ by 62% ± 3%,despite having masses equal to within 3%. This could be indicative of an age difference of ∼3 × 10⁵ yr between thetwo eclipsing stars, perhaps a vestige of the binary formation history. We find that the eclipsing pair is in an orbitthat has not yet fully circularized, e = 0.0166 ± 0.003. In addition, we measure the rotation rate of the eclipsingstars to be 4.629 ± 0.006 days; they rotate slightly faster than their 4.674 day orbit. The non-zero eccentricity andsuper-synchronous rotation suggest that the eclipsing pair should be tidally interacting, so we calculate the tidalhistory of the system according to different tidal evolution theories. We find that tidal heating effects can explainthe observed luminosity difference of the eclipsing pair, providing an alternative to the previously suggested agedifference.
Key words: binaries: eclipsing – stars: fundamental parameters – stars: individual (Parenago 1802) – stars:low-mass – stars: pre-main sequence
Online-only material: color figures, machine-readable tables
1. INTRODUCTION
The initial mass and chemical composition of newly formedstars are key factors in determining their evolutionary path.Multiple systems are commonly considered to be formedsimultaneously from the same protostellar core, such that theircomponents are assumed to be coeval and to have the samemetallicity. Equal-mass components of binary systems—i.e.,twins (e.g., Simon & Obbie 2009)—are therefore expected toevolve following essentially the same evolutionary track.
Eclipsing binary (EB) systems are useful observational toolsthat render direct measurements of their components’ physicalparameters, independent of theoretical models, and distancedetermination, against which theoretical evolutionary modelscan be tested. There are a few tens of pre-main-sequence (PMS)systems for which the dynamical stellar masses are measured(Mathieu et al. 2007, and references therein); EBs howeverare the only ones that allow for the direct measurement ofthe radii of the components. EBs are rare, because their orbitshave to be oriented such that we see the components eclipse.For PMS, low-mass EBs, where both components have masses
below 1.5 M�, there are only seven such systems reported inthe literature: ASAS J052821+0338.5 (Stempels et al. 2008);RX J0529.4+0041 (Covino et al. 2000, 2001, 2004); V1174 Ori(Stassun et al. 2004); MML 53 (Hebb et al. 2010); Parenago1802 (Cargile et al. 2008; Stassun et al. 2008, and target of thisstudy); JW 380 (Irwin et al. 2007); and 2M0535−05 (Stassunet al. 2006, 2007; Gomez Maqueo Chew et al. 2009). For thelatter, the components are below the hydrogen-burning limit, i.e.,they are brown dwarfs. For this particular system, the effectivetemperatures of the two bodies are observed to be reversed withthe more massive brown dwarf appearing to be cooler. Similarto the approach we apply here for Par 1802, Heller et al. (2010)have explored the effects of tidal heating in that system.
The discovery of Par 1802 was previously presented, alongwith its radial velocity (RV) study that found the system to be anEB with a period of ∼4.67 days where both components havenear equal masses, M1 = 0.40 ± 0.03 M� and M2 = 0.39 ±0.03 M� (Cargile et al. 2008, hereafter Paper I). Par 1802, as amember of the Orion Nebula Cluster (ONC; Hillenbrand 1997),is considered to have an age of ∼1 Myr (Paper I). A follow-up analysis which included the radial velocity curves and the
1

The Astrophysical Journal, 745:58 (22pp), 2012 January 20 Gomez Maqueo Chew et al.
IC-band light curve (LC) found the components’ masses to beequal to within ∼2%, but their radii and effective temperaturesto differ by ∼5%–10% (Stassun et al. 2008, hereafter Paper II).They suggest that these disparate radii and temperatures arethe result of a difference in age of a few hundred thousandyears.
In this paper, we present new VICJHKS LCs for Par 1802as well as a newly acquired high-resolution optical spectrum(Section 2). The multi-band nature of our analyses (Section 3)allows us to probe the radiative properties of the system. Theanalysis includes an in-depth periodicity analysis of the LCs,which enables us to refine the orbital period for the binary andidentify the rotation periods of its components (Section 3.1).We are also able to measure the presence of a third lightsource in the system (Section 3.2), through identification ofa very short period modulation in the LCs that definitivelycannot be due to rotation of either of the eclipsing stars,through the analysis of an additional continuum contributionin the spectra, through analysis of third-light dilution in theLCs, and through analysis of the system’s broadband spectralenergy distribution (SED). We combine these analyses into acomprehensive, global model of the EB’s fundamental orbitaland physical properties (Section 4), along with formal andheuristic uncertainties (obtained from a direct χ2 mapping of theparameter space) in these parameters. Par 1802 is found to be alow-mass PMS EB with a nominal age of ∼1 Myr, comprisingtwo equal-mass eclipsing stars of 0.39 M� and a third similarlylow-mass star, probably in a wide orbit, that is rapidly rotatingand likely accreting (i.e., a Classical T Tauri star). The radiiof the eclipsing pair differ by 6.9% ± 0.8%, their effectivetemperatures differ by 9.2% ± 0.2%, and consequently, theirluminosities differ by 62% ± 3%, despite their masses beingequal to within 3%.
In Section 5, we discuss possible explanations for the largedifference in luminosity of the eclipsing pair, including magneticactivity, non-coevality arising from mass-equalizing effectsin the binary’s formation, and tidal heating arising from thebinary’s past orbital evolution. The last two explanations appearplausible, with the latter predicting a possible misalignment ofthe stellar spin axes, which could be observable. We summarizeour conclusions in Section 6.
2. DATA
2.1. Photometric Observations
We present the LCs of Par 1802 in V (with a total of 2286data points), IC (3488), J (564), H (176), and KS (365). Thedetailed observing campaign is described in Table 1, and theindividual measurements in each observed passband are givenin Tables 2–6. The IC data cover the largest time span, from1994 December to 2009 January; it includes the previouslypublished LC (Paper II) and 1279 new data points obtainedbetween 2007 March and 2009 January. The V LC includesdata obtained between 2001 January and 2009 January withthe 0.9 m telescope at KPNO and with the SMARTS 0.9 m,1.0 m, and 1.3 m telescopes at CTIO. Using the ANDICAMinstrument which allows for simultaneous optical and near-infrared imaging, Par 1802 was observed photometrically withthe SMARTS 1.3 m telescope at CTIO between 2005 Februaryand 2008 February, constituting the entirety of the JHKS LCs.We also observed Par 1802 in the B band; however, the resultingLC was not well sampled and it is very noisy due to thephotometric variability of the third star in the system (see below).
Table 1Photometric Time Series Observations of Par 1802
Telescope HJD Rangea Filter Nobsb
KPNO 0.9 m 49698.35–49714.50 IC 110KPNO 0.9 m 50820.62–50829.78 IC 21CTIO 0.9 m 51929.59–51936.78 IC 164
V 153KPNO 0.9 m 52227.75–52238.00 IC 131KPNO 0.9 m 52595.75–52624.95 IC 279
V 146CTIO 0.9 m 52622.57–52631.51 IC 80
V 83SMARTS 0.9 m 53011.57–53024.77 IC 200
V 104SMARTS 1.3 m 53403.53–53463.53 IC 246
V 176J 90
KC 88SMARTS 1.3 m 53646.86–53728.69 IC 188
V 113J 57
KC 52SMARTS 1.0 m 53719.56–53727.83 IC 117
V 101SMARTS 1.3 m 53745.63–53846.51 IC 276
V 182J 80
KC 73SMARTS 1.3 m 53980.89–54100.65 IC 254
V 190J 99
KC 98SMARTS 1.0 m 54103.58–54112.773 IC 105
V 103SMARTS 1.3 m 54103.73–54191.53 IC 183
V 61J 63
KC 54SMARTS 1.3 m 54375.81–54465.82 IC 371
V 250J 128H 129
SMARTS 1.3 m 54467.62–54497.69 IC 142V 96J 47H 47
SMARTS 1.0 m 54482.58–54494.74 IC 218V 169B 183
SMARTS 1.0 m 54835.56–54853.78 IC 403V 359
Notes.a Range of Heliocentric Julian Dates (2,400,000+).b Number of observations.
Thus, we do not include the B band in the rest of our analyses,except as a consistency check of our final solution.
Because the LC data were obtained mostly in queue modeon a variety of instruments over a long period of time, indi-vidual exposure times varied depending on the instrument andobserving conditions. Typically, however, the VIC LC data wereobtained with typical exposure times of 60 s. The observationsin the near-infrared were made in sets of five dither positions forthe J band and seven dither positions for the HKS bands, withtotal integration times of 150 s and 175 s, respectively.
2
The Astrophysical Journal, 745:58 (22pp), 2012 January 20 Gomez Maqueo Chew et al.
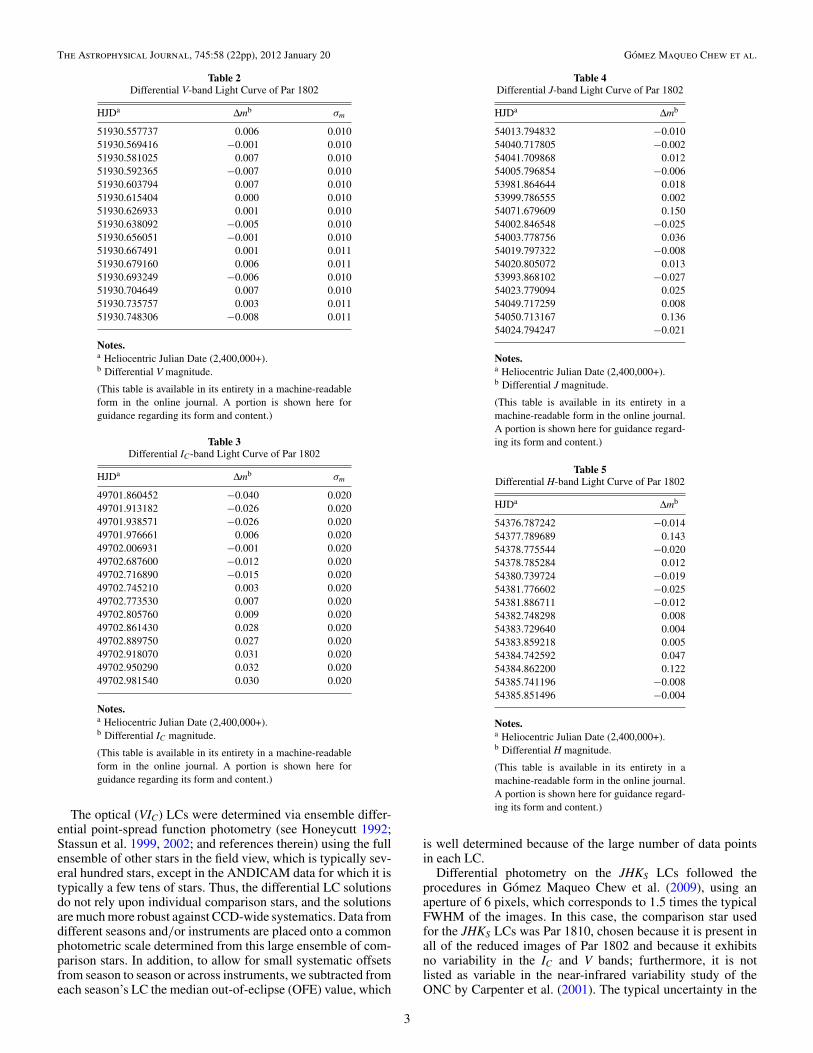
Table 2Differential V-band Light Curve of Par 1802
HJDa Δmb σm
51930.557737 0.006 0.01051930.569416 −0.001 0.01051930.581025 0.007 0.01051930.592365 −0.007 0.01051930.603794 0.007 0.01051930.615404 0.000 0.01051930.626933 0.001 0.01051930.638092 −0.005 0.01051930.656051 −0.001 0.01051930.667491 0.001 0.01151930.679160 0.006 0.01151930.693249 −0.006 0.01051930.704649 0.007 0.01051930.735757 0.003 0.01151930.748306 −0.008 0.011
Notes.a Heliocentric Julian Date (2,400,000+).b Differential V magnitude.
(This table is available in its entirety in a machine-readableform in the online journal. A portion is shown here forguidance regarding its form and content.)
Table 3Differential IC-band Light Curve of Par 1802
HJDa Δmb σm
49701.860452 −0.040 0.02049701.913182 −0.026 0.02049701.938571 −0.026 0.02049701.976661 0.006 0.02049702.006931 −0.001 0.02049702.687600 −0.012 0.02049702.716890 −0.015 0.02049702.745210 0.003 0.02049702.773530 0.007 0.02049702.805760 0.009 0.02049702.861430 0.028 0.02049702.889750 0.027 0.02049702.918070 0.031 0.02049702.950290 0.032 0.02049702.981540 0.030 0.020
Notes.a Heliocentric Julian Date (2,400,000+).b Differential IC magnitude.
(This table is available in its entirety in a machine-readableform in the online journal. A portion is shown here forguidance regarding its form and content.)
The optical (VIC) LCs were determined via ensemble differ-ential point-spread function photometry (see Honeycutt 1992;Stassun et al. 1999, 2002; and references therein) using the fullensemble of other stars in the field view, which is typically sev-eral hundred stars, except in the ANDICAM data for which it istypically a few tens of stars. Thus, the differential LC solutionsdo not rely upon individual comparison stars, and the solutionsare much more robust against CCD-wide systematics. Data fromdifferent seasons and/or instruments are placed onto a commonphotometric scale determined from this large ensemble of com-parison stars. In addition, to allow for small systematic offsetsfrom season to season or across instruments, we subtracted fromeach season’s LC the median out-of-eclipse (OFE) value, which
Table 4Differential J-band Light Curve of Par 1802
HJDa Δmb
54013.794832 −0.01054040.717805 −0.00254041.709868 0.01254005.796854 −0.00653981.864644 0.01853999.786555 0.00254071.679609 0.15054002.846548 −0.02554003.778756 0.03654019.797322 −0.00854020.805072 0.01353993.868102 −0.02754023.779094 0.02554049.717259 0.00854050.713167 0.13654024.794247 −0.021
Notes.a Heliocentric Julian Date (2,400,000+).b Differential J magnitude.
(This table is available in its entirety in amachine-readable form in the online journal.A portion is shown here for guidance regard-ing its form and content.)
Table 5Differential H-band Light Curve of Par 1802
HJDa Δmb
54376.787242 −0.01454377.789689 0.14354378.775544 −0.02054378.785284 0.01254380.739724 −0.01954381.776602 −0.02554381.886711 −0.01254382.748298 0.00854383.729640 0.00454383.859218 0.00554384.742592 0.04754384.862200 0.12254385.741196 −0.00854385.851496 −0.004
Notes.a Heliocentric Julian Date (2,400,000+).b Differential H magnitude.
(This table is available in its entirety in amachine-readable form in the online journal.A portion is shown here for guidance regard-ing its form and content.)
is well determined because of the large number of data pointsin each LC.
Differential photometry on the JHKS LCs followed theprocedures in Gomez Maqueo Chew et al. (2009), using anaperture of 6 pixels, which corresponds to 1.5 times the typicalFWHM of the images. In this case, the comparison star usedfor the JHKS LCs was Par 1810, chosen because it is present inall of the reduced images of Par 1802 and because it exhibitsno variability in the IC and V bands; furthermore, it is notlisted as variable in the near-infrared variability study of theONC by Carpenter et al. (2001). The typical uncertainty in the
3

The Astrophysical Journal, 745:58 (22pp), 2012 January 20 Gomez Maqueo Chew et al.
Figure 1. Observed and modeled VICJHKS light curves of Par 1802. We show the observed photometric light curves with their corresponding uncertainties as describedin Section 2.1. The data have been folded over the binary’s orbital period and shifted in magnitude for easier visualization. The solid line represents the best RV+LCsolution for Par 1802 (see Section 4 for a detailed description of the modeling procedure and see Table 10 for the physical parameters of the EB components and theirorbit).
(A color version of this figure is available in the online journal.)
Table 6Differential KS-band Light Curve of Par 1802
HJDa Δmb
54013.798334 −0.00654040.721410 0.00554041.713265 0.00154005.800356 −0.01153981.868447 0.01553999.790149 0.01254071.683111 0.15154002.850061 −0.01754003.782373 0.04354019.800928 −0.00254020.808574 −0.00953993.871639 −0.01154023.782514 0.02754049.720749 0.00354050.716645 0.133
Notes.a Heliocentric Julian Date (2,400,000+).b Differential KS magnitude.
(This table is available in its entirety in amachine-readable form in the online journal.A portion is shown here for guidance regard-ing its form and content.)
VIC LCs is σI = 0.01 mag and σV = 0.025 mag, the latterdominated by poor sky subtraction due to scattered light inthe nebular background. The uncertainty in the produced JHKS
LCs is dominated by the systematic uncertainties in the skybackground subtraction. The JH bands have a similar scatter,σJ = σH = 0.01 mag; however, the interference pattern of thesky emission lines in the KS LC is more significant making thescatter in this band larger, σKS
= 0.02 mag. These uncertaintieswere estimated by calculating the standard deviation of the LCs,with the data during eclipses excluded and the periodic low-amplitude variability (see Section 3.1) subtracted.
Figure 1 shows the VICJHKS LCs, including those publishedin Paper II. The data have been folded on the orbital period andeach band has been offset for clarity. Each point is an individualobservation and the solid line represents the model of our finalLC solution (Section 4).
2.2. Spectroscopic Observations
We observed Par 1802 on the night of UT 2007 October 23with the High Resolution Echelle Spectrometer (HIRES) onKeck-I.11 The exposure time was 900 s. We observed in thespectrograph’s “red” (HIRESr) configuration with an echelleangle of −0.403 and a cross-disperser angle of 1.703. Weused the OG530 order-blocking filter and 1.′′15 × 7.′′0 slit, andbinned the chip during readout by 2 pixels in the dispersiondirection. The resulting resolving power is R ≈ 34,000 per3.7 pixel (∼8.8 km s−1) FWHM resolution element. For theanalyses discussed below, we used the 21 spectral orders fromthe “blue” and “green” CCD chips, covering the wavelengthrange λλ5782–8757. ThAr arc lamp calibration exposures wereobtained before and after the Par 1802 exposure, and sequencesof bias and flat-field exposures were obtained at the end ofthe night. The data were processed using standard IRAF12
tasks and the MAKEE reduction package written for HIRES byT. Barlow, which includes optimal extraction of the orders aswell as subtraction of the adjacent sky background. The signalto noise of the final spectrum is ≈70 per resolution element.
In addition, we observed the late-type spectral standards(see Kirkpatrick et al. 1991), Gl 205 (M1) and Gl 251 (M3),at high signal to noise. These spectral types were chosen tomatch the inferred spectral types of the eclipsing componentsof Par 1802, based on the tomographic reconstruction analysispresented in Paper II. They were observed immediately before
11 Time allocation through NOAO via the NSF’s Telescope SystemInstrumentation Program (TSIP).12 IRAF is distributed by the National Optical Astronomy Observatory, whichis operated by the Association of Universities for Research in Astronomy(AURA) under cooperative agreement with the National Science Foundation.
4
The Astrophysical Journal, 745:58 (22pp), 2012 January 20 Gomez Maqueo Chew et al.
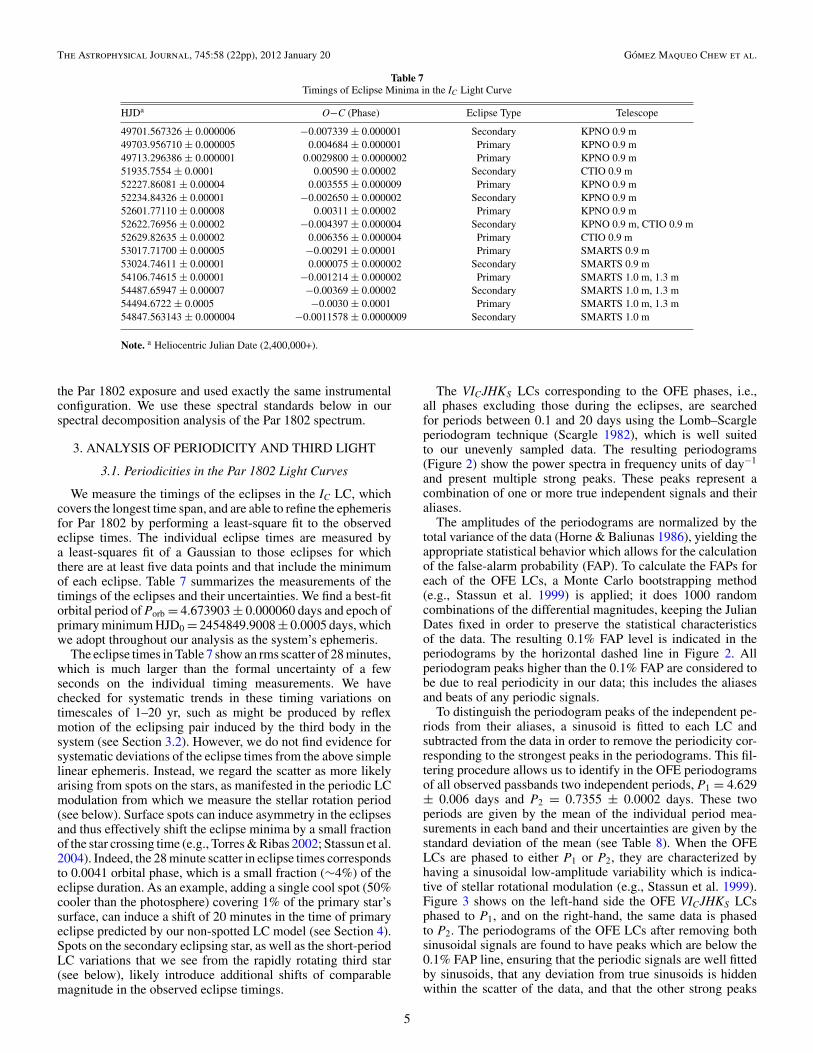
Table 7Timings of Eclipse Minima in the IC Light Curve
HJDa O−C (Phase) Eclipse Type Telescope
49701.567326 ± 0.000006 −0.007339 ± 0.000001 Secondary KPNO 0.9 m49703.956710 ± 0.000005 0.004684 ± 0.000001 Primary KPNO 0.9 m49713.296386 ± 0.000001 0.0029800 ± 0.0000002 Primary KPNO 0.9 m51935.7554 ± 0.0001 0.00590 ± 0.00002 Secondary CTIO 0.9 m52227.86081 ± 0.00004 0.003555 ± 0.000009 Primary KPNO 0.9 m52234.84326 ± 0.00001 −0.002650 ± 0.000002 Secondary KPNO 0.9 m52601.77110 ± 0.00008 0.00311 ± 0.00002 Primary KPNO 0.9 m52622.76956 ± 0.00002 −0.004397 ± 0.000004 Secondary KPNO 0.9 m, CTIO 0.9 m52629.82635 ± 0.00002 0.006356 ± 0.000004 Primary CTIO 0.9 m53017.71700 ± 0.00005 −0.00291 ± 0.00001 Primary SMARTS 0.9 m53024.74611 ± 0.00001 0.000075 ± 0.000002 Secondary SMARTS 0.9 m54106.74615 ± 0.00001 −0.001214 ± 0.000002 Primary SMARTS 1.0 m, 1.3 m54487.65947 ± 0.00007 −0.00369 ± 0.00002 Secondary SMARTS 1.0 m, 1.3 m54494.6722 ± 0.0005 −0.0030 ± 0.0001 Primary SMARTS 1.0 m, 1.3 m54847.563143 ± 0.000004 −0.0011578 ± 0.0000009 Secondary SMARTS 1.0 m
Note. a Heliocentric Julian Date (2,400,000+).
the Par 1802 exposure and used exactly the same instrumentalconfiguration. We use these spectral standards below in ourspectral decomposition analysis of the Par 1802 spectrum.
3. ANALYSIS OF PERIODICITY AND THIRD LIGHT
3.1. Periodicities in the Par 1802 Light Curves
We measure the timings of the eclipses in the IC LC, whichcovers the longest time span, and are able to refine the ephemerisfor Par 1802 by performing a least-square fit to the observedeclipse times. The individual eclipse times are measured bya least-squares fit of a Gaussian to those eclipses for whichthere are at least five data points and that include the minimumof each eclipse. Table 7 summarizes the measurements of thetimings of the eclipses and their uncertainties. We find a best-fitorbital period of Porb = 4.673903 ± 0.000060 days and epoch ofprimary minimum HJD0 = 2454849.9008 ± 0.0005 days, whichwe adopt throughout our analysis as the system’s ephemeris.
The eclipse times in Table 7 show an rms scatter of 28 minutes,which is much larger than the formal uncertainty of a fewseconds on the individual timing measurements. We havechecked for systematic trends in these timing variations ontimescales of 1–20 yr, such as might be produced by reflexmotion of the eclipsing pair induced by the third body in thesystem (see Section 3.2). However, we do not find evidence forsystematic deviations of the eclipse times from the above simplelinear ephemeris. Instead, we regard the scatter as more likelyarising from spots on the stars, as manifested in the periodic LCmodulation from which we measure the stellar rotation period(see below). Surface spots can induce asymmetry in the eclipsesand thus effectively shift the eclipse minima by a small fractionof the star crossing time (e.g., Torres & Ribas 2002; Stassun et al.2004). Indeed, the 28 minute scatter in eclipse times correspondsto 0.0041 orbital phase, which is a small fraction (∼4%) of theeclipse duration. As an example, adding a single cool spot (50%cooler than the photosphere) covering 1% of the primary star’ssurface, can induce a shift of 20 minutes in the time of primaryeclipse predicted by our non-spotted LC model (see Section 4).Spots on the secondary eclipsing star, as well as the short-periodLC variations that we see from the rapidly rotating third star(see below), likely introduce additional shifts of comparablemagnitude in the observed eclipse timings.
The VICJHKS LCs corresponding to the OFE phases, i.e.,all phases excluding those during the eclipses, are searchedfor periods between 0.1 and 20 days using the Lomb–Scargleperiodogram technique (Scargle 1982), which is well suitedto our unevenly sampled data. The resulting periodograms(Figure 2) show the power spectra in frequency units of day−1
and present multiple strong peaks. These peaks represent acombination of one or more true independent signals and theiraliases.
The amplitudes of the periodograms are normalized by thetotal variance of the data (Horne & Baliunas 1986), yielding theappropriate statistical behavior which allows for the calculationof the false-alarm probability (FAP). To calculate the FAPs foreach of the OFE LCs, a Monte Carlo bootstrapping method(e.g., Stassun et al. 1999) is applied; it does 1000 randomcombinations of the differential magnitudes, keeping the JulianDates fixed in order to preserve the statistical characteristicsof the data. The resulting 0.1% FAP level is indicated in theperiodograms by the horizontal dashed line in Figure 2. Allperiodogram peaks higher than the 0.1% FAP are considered tobe due to real periodicity in our data; this includes the aliasesand beats of any periodic signals.
To distinguish the periodogram peaks of the independent pe-riods from their aliases, a sinusoid is fitted to each LC andsubtracted from the data in order to remove the periodicity cor-responding to the strongest peaks in the periodograms. This fil-tering procedure allows us to identify in the OFE periodogramsof all observed passbands two independent periods, P1 = 4.629± 0.006 days and P2 = 0.7355 ± 0.0002 days. These twoperiods are given by the mean of the individual period mea-surements in each band and their uncertainties are given by thestandard deviation of the mean (see Table 8). When the OFELCs are phased to either P1 or P2, they are characterized byhaving a sinusoidal low-amplitude variability which is indica-tive of stellar rotational modulation (e.g., Stassun et al. 1999).Figure 3 shows on the left-hand side the OFE VICJHKS LCsphased to P1, and on the right-hand, the same data is phasedto P2. The periodograms of the OFE LCs after removing bothsinusoidal signals are found to have peaks which are below the0.1% FAP line, ensuring that the periodic signals are well fittedby sinusoids, that any deviation from true sinusoids is hiddenwithin the scatter of the data, and that the other strong peaks
5

The Astrophysical Journal, 745:58 (22pp), 2012 January 20 Gomez Maqueo Chew et al.
Figure 2. OFE VICJHKS Lomb–Scargle periodograms. The out-of-eclipse (OFE) light curves were searched for periodicities, as described in Section 3.1, identifyingtwo independent periodic signals with frequencies of ∼0.216 and ∼1.36 day−1, corresponding to periods of P1 = 4.629 ± 0.006 and P2 = 0.7355 ± 0.0002 days,respectively. Table 8 lists the identified periods in each observed passband with their corresponding uncertainties. The vertical, dashed lines on the top panel mark thefrequency corresponding to P1 and its aliases and beats; while the vertical, dotted lines correspond to the frequency of P2 and its aliases and beats. The significance ofthe peaks is given by the horizontal, dashed line which denotes the 0.1% false-alarm probability; since most of the significant peaks are found between 0 and 4 day−1,only the V-band periodogram is shown in its entirety. The out-of-eclipse VICJHKS light curves folded over the two identified periods are presented in Figure 3.
(A color version of this figure is available in the online journal.)
Table 8Periodicity in the Light Curves of Par 1802 in Days
Passband OFEa O−Cb
P1 P2 P1 P2
V. . . 4.626 ± 0.001 0.73557 ± 0.00002 4.6257 ± 0.0009 0.73558 ± 0.00001IC. . . 4.6257 ± 0.0005 0.73560 ± 0.00001 4.6259 ± 0.0004 0.735606 ± 0.000009J. . . 4.628 ± 0.003 0.73551 ± 0.00007 4.627 ± 0.002 0.73551 ± 0.00005H. . . 4.64 ± 0.03 0.7353 ± 0.0008 4.64 ± 0.03 0.7353 ± 0.0007KS. . . 4.629 ± 0.003 0.7355 ± 0.0001 4.627 ± 0.004 0.7355 ± 0.0001
Notes.a Only the phases of the light curves that are out-of-eclipse, i.e., excluding the eclipses, were searched for periodicities.b We did the periodicity analysis on the residuals of the modeling of the light curves; any periodicity due to the EB nature ofthe system would be removed from the O−C periodograms.
in the periodograms are aliases or beats of these two periodicsignals.
When we assess in detail the significant peaks in the peri-odograms of the OFE LCs, we find multiple-peaked structuresdue to the finite sampling of the data. The peaks correspond-ing to P1 and its aliases, attributed to the one-day sampling ofthe LCs, are indicated in Figure 2 by the vertical dashed lines;while P2 and its one-day aliases are marked by the vertical dot-ted lines. We also find at each significant period that there is
a finely spaced three-peaked structure, which is confirmed toarise from the seasonal (i.e., one-year) sampling of the data (seeAppendix A).
P1 is close to the orbital period of the binary (Porb =4.673903 ± 0.000060 days), but is significantly different ata 7σ level. In order to better understand P1, we search forperiodicities in the residuals (O−C) of the EB modeling suchthat any period due to the EB nature of the system would beremoved from the periodograms. We are able to again identify
6

The Astrophysical Journal, 745:58 (22pp), 2012 January 20 Gomez Maqueo Chew et al.
Figure 3. Low-amplitude, photometric variability. The sinusoidal shape shown by the OFE light curves, folded over either of the two independent periods found in allobserved passbands from the periodicity analysis (see Figure 2 and Table 8), is characteristic of spot-induced, rotational modulation. The left-hand panel shows theVICJHKS light curves folded over P1 and displaced from zero for easier visualization. Superimposed is a sinusoid of period P1 fitted to the data. In a similar way, theright-hand panel shows the same photometric OFE data folded over the shorter period, P2, and its corresponding sinusoidal fit. The actual data points are repeated overeach of the three phases shown. P1 is attributed to the rotation period of the eclipsing components, and is consistent with their measured v sin i and radii; whereas P2is attributed to the stellar source of third light (see Section 3.2.4 for discussion on the third body). The amplitudes of this spot-induced variation at different passbandsare obtained from the simultaneous fit of two sinusoids, and are given in Table 9.
(A color version of this figure is available in the online journal.)
both P1 and P2 in the O−C periodograms of all observedpassbands. Table 8 describes in detail both identified periodsin each observed LC with their uncertainty, determined via apost-mortem analysis (Schwarzenberg-Czerny 1991), for all ofthe OFE and O−C periodograms. We are able to verify that wehave sufficient frequency resolution to distinguish P1 from Porb(see Appendix A). Thus, we conclude that P1 is not due to orbitaleffects, and in particular, P1 significantly differs from Porb. Ifthe photometric, low-amplitude variability is caused by surfacespots rotating in and out of view on one or both of the binarycomponents, the difference between P1 and Porb indicates thatthe rotation of the stars is not fully synchronized to the orbitalmotion (see below).
We measured the amplitudes of the periodic variability forboth P1 and P2 by simultaneously fitting two sinusoids withthese periods to each LC. The measured amplitudes of theP1 and P2 signals are similar, ∼0.01–0.02 mag, and moreoverthey decrease with increasing wavelength as expected for spotmodulated variability (see Table 9). The error of the amplitudesfrom the fit of the data to the double sinusoid is <0.03% in allbands.
The 4.629 day period (P1) is consistent with the spectro-scopically determined v sin i (17 ± 2 and 14 ± 3 km s−1
for the primary and secondary components, respectively;
Table 9Amplitude of Periodic Photometric Variability of Par 1802
Passband AP1 AP2
(mag) (mag)
V. . . 0.029 0.016IC. . . 0.016 0.015J. . . 0.011 0.009H. . . 0.012 0.013KS. . . 0.009 0.011
Paper II) and the directly measured radii of the EB compo-nents, Prot,1/Prot,2 = 0.88 ± 0.22. Thus, we adopt P1 as theirrotational periods Prot. We defer to Section 5.3 a full discussionof Prot in the context of tidal evolution theory, but we note herethat it is reasonable to assign the same rotation period to botheclipsing stars. As the eclipsing components are being driven bytides toward synchronization to their orbital motion, radial con-traction is changing the spin rates via conservation of angularmomentum. In addition, Zahn & Bouchet (1989) and Khaliullin& Khaliullina (2011) both argue that the orbital period ofPar 1802 is small enough for circularization and synchroniza-tion to occur prior to the arrival on the main sequence. As such,the assignment of P1 as the rotational period of both eclipsing
7
The Astrophysical Journal, 745:58 (22pp), 2012 January 20 Gomez Maqueo Chew et al.
components is reasonable. It is consistent with the independentlydetermined observational constraints (i.e., v sin i, R1, and R2),and moreover, it represents the conservative choice in our dis-cussion of the tidal heating effects in Section 5.3.
The short period (P2) is too fast to be due to rotation of eitherof the binary components; with measured radii of ∼1.7 R�, P2would imply v sin i ≈ 115 km s−1, which is entirely inconsistentwith the measured v sin i of the eclipsing components. Thisperiodicity, which as discussed above is clearly present at allepochs of our LCs spanning 15 yr, strongly suggests the presenceof a rapidly rotating third star. Indeed, there is ample additionalevidence for the existence of a third star in the Par 1802 system,as we now discuss.
3.2. Characterization of a Third Stellar Component in Par 1802
In this section, we present additional evidence for a thirdstellar component in the Par 1802 system, which includes (1)the presence of a featureless continuum in the high-resolutionspectrum of Par 1802 that dilutes the spectral features ofthe eclipsing components, (2) the presence of “third light” in themulti-band LCs which dilutes the eclipse depths, and (3) theoverall SED of Par 1802, which is best matched by a third stellarphotosphere plus blue excess in addition to the photospheres ofthe two eclipsing components. The properties of the third stellarcomponent are then used to refine the physical parameters thatwe determine for the EB pair in Section 4.
3.2.1. High-resolution Spectroscopic Decomposition
In Paper II, we applied the method of tomographic decom-position on the same multi-epoch spectra from which we de-termined the EB radial velocities to recover the spectra of theindividual stars, and found in that analysis that the reconstructedspectra of the primary and secondary are compatible with spec-tral types of M1V and M3V, respectively, implying Teff ,1 =3705 K and Teff ,2 = 3415 K (from the spectral-type-Teff scale ofLuhman 1999), which are consistent with Teff ’s determined fromthe LC modeling of the system (see Section 4). In addition, adetailed analysis of the relative line depths of the reconstructedspectra made it possible to estimate their monochromatic lu-minosity ratio, which was found to be L1/L2 ≈ 1.75 for thewavelength region around 7000 Å. This luminosity ratio wasalso shown in Paper II to be consistent with the Teff ratio andradii ratio measured from the LC modeling of the system.
In that analysis, we found that the photospheric absorptionlines appeared diluted, but we attributed this to poor backgroundsubtraction because the spectra used in Paper II were obtainedwith a fiber-fed spectrograph that does not allow direct subtrac-tion of the strong nebular background surrounding Par 1802.Thus, here we have instead performed our analysis on the newlyobtained high-resolution Keck/HIRES spectrum (Section 2.2),which was obtained through a long slit permitting better back-ground subtraction. We extended the methods used by Stempels& Piskunov (2003) to the case of three spectral components byfirst constructing a model spectrum for the two eclipsing starsof Par 1802. This model spectrum is again a combination of twoobserved template spectra with spectral types of ∼M1V and∼M3V (see Section 2.2), and again with a luminosity ratio of1.75 for the region around 7000 Å (this luminosity ratio for theeclipsing pair from our spectral disentangling analysis is basedon the relative strengths of the spectral features, and thus is nota function of the additional continuum light from the third star).The template spectra are rotationally broadened, and are shiftedin radial velocities, to match the widths and Doppler shifts of
the lines in the observed spectrum. The radial velocities of thetemplate spectra are consistent with our final orbital solution.We then applied a χ2 minimization on each spectral order tosolve for any contribution of a third component.
We find that there is a featureless continuum present in thespectrum of Par 1802, with a luminosity at 7000 Å that is ap-proximately equal to that of the primary eclipsing component.This is illustrated for two of the Keck/HIRES spectral ordersin Figure 4, where we show how the combined spectrum canbe reproduced by adding the two eclipsing stellar componentsand a third featureless component. The double-lined nature ofthe system is obvious around the narrow absorption lines ob-served in the redder order shown. The best-fitting normalizedluminosity ratio of all three components is found to be (pri-mary:secondary:extra continuum) 0.39:0.22:0.39 for the spec-tral orders shown in Figure 4, which correspond approximatelyto the RC and IC passbands. The uncertainty in the normalizedluminosity of the third component is 0.15, as determined fromthe scatter of the measurement from the different spectral or-ders. Figure 4 shows that one cannot reproduce the strong linesaround 6120 Å without additional continuum. Furthermore, thegravity-sensitive Ca i lines at 6103 and 6122 Å present in theupper panel, show a good quantitative agreement in strength andshape, that could not be matched by a different gravity and/orextra continuum. This supports that one really needs the extracontinuum to explain the fluxes in Par 1802, and that any gravitydifference between the templates and Par 1802 are marginal. Inorder to further quantify this effect, we explored the effect ofgravity on the atomic lines using synthetic spectra by decreasinglog g from 4.5 to 3.5, and we find that the line depths for atomiclines increase between 0% and 10%. This would imply that weare slightly overestimating the contribution of the third body,and the flux ratios would be 0.41:0.22:0.36. Thus, we concludethat the difference in gravity between the templates and the PMSeclipsing components does not affect our ability to measure theextra continuum within the quoted uncertainty.
The analysis above does not assume anything about the natureof the third light source. We only state that an extra featurelesscomponent is needed in the high-resolution spectrum, and thatthis is not an artifact of the reduction process. Given that thereis no clear infrared excess in the SED of the system as would becharacteristic of a disk (see Paper II and Section 3.2.3 below),and that the Hα emission of several mÅ seen in the eclipsingstellar components is too weak to arise from accretion (Paper I),we conclude that the third spectral component must be relatedto a source other than the two eclipsing stars.
3.2.2. Analysis of Third Light in the Par 1802 Light Curves
We constrain the level of third light (L3) in each passbandfrom the spectral measurements described above, and fromthe amount of third light needed to simultaneously fit all of theobserved LCs. The details of the EB modeling and of theexploration of the parameter correlations are described inSection 4, as are the uncertainties of the system’s fundamentalparameters introduced by the uncertainty in L3. Here, wespecifically discuss L3 in the context of providing additionalevidence for a third star in Par 1802.
The upper limit of L3 allowed by the LCs is obtained bysetting the inclination (i) of the system to 90◦, and fitting for L3as a free parameter in our modeling of the LCs (see Section 4).This is the upper limit because at i = 90◦ the eclipses areintrinsically deepest, and thus the observed shallow eclipsesimply the maximum dilution. We find that the maximum level
8

The Astrophysical Journal, 745:58 (22pp), 2012 January 20 Gomez Maqueo Chew et al.
Figure 4. Observed and model spectrum of Par 1802. This figure illustrates how the observed spectrum of Par 1802 (black solid line and gray underlying area) canbe reproduced by a simple three-component model (thick gray line). This model consists of an ∼M1V template for the primary (upper spectrum), an ∼M3V templatefor the secondary (lower spectrum), and a third featureless spectrum (dashed line). The components are scaled such that the continuum ratio of the componentscorresponds to 0.39:0.22:0.39. Each panel corresponds to a different order of the Keck/HIRES spectrum. See Section 3.2.1 for a more complete description.
L3 allowed by the Par 1802 LCs is one that contributes ∼75%to the total luminosity of the system in the IC band.
To further explore the relationship between L3 and i, we fit L3in all passbands for i between 75◦ and 90◦. We find two trendsfrom this analysis. The first one is that, for any given i, therequired L3 is approximately constant for the ICJHKS LCs. Thesecond trend is that L3 has a blue excess, i.e., the V band requiresan additional 20% L3 contribution to fit the eclipse depths thanin the other passbands.
Using the spectroscopic measurements described above, weare able to break the degeneracy between L3 and i. We take L3in the IC band (L3,IC
) to be 0.39 (see Section 3.2.1), i.e., 39% ofthe system’s total luminosity (Ltot,IC
). That is, L3,IC= 0.39 ×
(L1,IC+ L2,IC
+ L3,IC) = 0.39 Ltot,IC
. Similarly, we take L3 =0.39 Ltot for the JHKSbands, since our tests above indicatedcomparable L3 in the ICJHKS LCs. For the V band, which ourtests above found requires an additional 20% L3 contributionrelative to the ICJHKS bands, we therefore ascribe L3,V = 0.59Ltot,V . Even though these L3 values have high uncertainties(∼15%), we show below that a variation in L3 between 5% and75% of the system’s luminosity does not greatly affect the finalphysical parameters of the eclipsing components of Par 1802(see Section 4).
3.2.3. Spectral Energy Distribution of Par 1802
In order to probe further into the properties of the third lightsource in the system, we have attempted to model the full
SED of the system using NextGen model stellar atmospheres(Hauschildt et al. 1999). The SED data consist of the 12broadband flux measurements described in Paper II, plus thetwo bluer Wide-Field Infrared Survey Explorer (WISE) channels(Duval et al. 2004) covering from 0.36 μm to 8.0 μm. The WISEdatabase has labeled the two longest WISE channels with the“h” flag which means they are likely “ghosts” due to the verylow signal to noise in those channels (3.8 and 2.0, respectively).To avoid any confusion, we have excluded the two redder WISEchannels in our analysis.
For each of the SED modeling attempts described here,we held fixed the radii of the two eclipsing components, aswell as their ratio of Teff , at the values determined from thedetailed LC modeling of the system (see Section 4). Thus,the luminosity ratio between the eclipsing pair is held fixed at1.75 at 7000 Å, as determined from our spectral decompositionanalysis (Section 3.2.1). We adopted a Teff for the primaryeclipsing component of 3675 K based on the system’s reportedM2 spectral type (see Section 4).
We first attempted to model the SED by adding to the eclipsingcomponents a third stellar photosphere with Teff between 3000and 6000 K, scaled to contribute 39% of the system’s luminosityin the IC band (see Section 3.2.2). However, regardless of theTeff chosen for the third component, the L3 found from our testswith the LCs (Section 3.2.2) are not well reproduced by suchan SED model. For example, the blue excess (i.e., the additional20% L3 in the V band relative to the IC band; Section 3.2.2)
9

The Astrophysical Journal, 745:58 (22pp), 2012 January 20 Gomez Maqueo Chew et al.
Figure 5. SED fit of Par 1802 including the measured Teff and radii of theeclipsing pair, as well as a third star with Teff and luminosity equal to theprimary eclipsing star. The third star also includes a hot spot with T = 7500 Kcovering 0.1% of the star’s surface. The free parameters of the fit are AV anddistance, for which we derive 1.2 ± 0.6 and 440 ± 45 pc, respectively. Thereduced χ2 of the fit is 1.94. See Section 3.2.3 for details.
(A color version of this figure is available in the online journal.)
can be modeled by a third component with Teff > 5000 K.However, such a star then contributes far more third light inJHKS than observed in the LCs, and moreover, the level ofthe third component’s contribution decreases with increasingwavelength. It is only for a third stellar component with Teffbetween 3400 and 3700 K, i.e., with a Teff very similar to theaverage Teff of the eclipsing components, 3560 K (see Section 4),that the L3 contribution remains constant at 39% across theICJHKS bands. However, in this case the L3 is also ∼39% inthe V band, i.e., the observed blue excess is not reproduced.Evidently, the source of third light cannot be a simple bare star.
Finally, we again performed an SED fit in which we includeda third stellar component, this time fixing its temperature to theaverage Teff of the primary and secondary eclipsing components,and once again scaling its luminosity so that it contributes 39%of the total system flux at IC band. We also included a fourthcomponent with a fixed Teff of 7500 K in order to simulate a“hot spot” as observed in many Classical T Tauri stars (e.g.,Whitney et al. 2003). The luminosity of this fourth componentwas scaled so that it contributes 20% of the total flux at V band(Section 3.2.2). The remaining free parameters of the fit arethe distance to the system and the line-of-sight extinction tothe system. The resulting best fit (χ2
ν = 1.94; Figure 5) has adistance of 440 ± 45 pc and an extinction AV = 1.2 ± 0.6. Thesevalues are in good agreement with the accepted distance to theONC (436 ± 20 pc; O’Dell & Henney 2008) and the typicalextinction measured to ONC members (Hillenbrand 1997).
We have not done a more extensive fitting of possible systemparameters, such as different possible temperatures or fillingfactors for the modeled hot component. Rather, we present thisSED as a plausibility check on the inferred levels of thirdlight measured spectroscopically and from the LCs, and toconfirm that a putative third star with hot spot does not violatethe available SED observational constraints. In Paper II, weperformed a similar SED fit but including only the two eclipsingstellar components. The fit was acceptable, though a modestexcess in the infrared portion of the SED was apparent. Thenew fit presented here fits the observed fluxes very well over theentire range 0.36–8 μm.
3.2.4. Summary: The Third Stellar Component in Par 1802
We find clear observational evidence for the existence of athird stellar component in the Par 1802 system. The principalevidence is three-fold. First, there is a clear modulation of theVICJHKS LCs on a very short period of 0.7355 days. Thisperiodicity manifests itself strongly in the periodogram analysisof the LCs at all observed epochs spanning more than 15 yr(Section 3.1). Based on the measured radii and v sin i of theeclipsing components, we can definitively rule out that thisperiod is due to the rotation of either of the two eclipsing stars.Second, a spectral disentangling analysis applied to our high-resolution spectrum of Par 1802 clearly shows the presence ofadded continuum which dilutes the spectra of the two eclipsingstars (Section 3.2.1). Third, our simultaneous modeling of theVICJHKS LCs of Par 1802 clearly shows third light that dilutesthe eclipse depths (Section 3.2.2, and see also Section 4). Theeclipse-depth analysis also clearly indicates that, in the IC andJHKS passbands, the third light source is characterized by colorsvery similar to those of the eclipsing stars, but that in V the thirdsource exhibits an additional strong “blue excess” similar towhat is observed in Classical T Tauri stars. In addition to theseprincipal lines of evidence, we have shown that the SED ofPar 1802 is consistent with a simple SED model comprising thetwo eclipsing stars and a third star which also includes a blue“hot spot” (Section 3.2.3). A third stellar component in Par 1802was also suggested in Paper I by a long-term trend identified inthe residuals of the orbit solution, suggesting a low-mass bodyin a wide, eccentric orbit.
Since the ONC is in front of a very dense, optically thickcloud, the source of third light cannot be a background object andis likely to be associated with the young cluster. The observedshort-period, low-amplitude variability can only arise from arapidly rotating star and cannot be attributed to either of theeclipsing components because there is no evidence for suchrapid rotation in their spectra. The rapid rotation itself suggestsa young star. An active late-type star, that is contributing 40% ofthe system’s luminosity and is rotating with a 0.7355 day periodcan cause the observed spot modulation (∼3% in the IC band)if its intrinsic variability is ∼5%, which is within the typicalobserved variability for PMS stars. Other low-mass stars in theONC have been found to have similarly fast rotation periods(e.g., Stassun et al. 1999). Moreover, if this third star is rapidlyrotating and contains a strong contribution from a hot spot asour data suggest, this could very well produce very shallowline profiles that are not detectable in our spectrum and mayappear as the measured additional continuum (see Section 3.2.1and Figure 4). As discussed in Section 3.2.3, including a thirdstar with properties typical of Classical T Tauri stars allows thebroadband SED of Par 1802 to be well fit, with a distance andextinction that are consistent with the ONC.
If the third body is indeed actively accreting as suggested bythe blue excess, then it must be at a large enough separationfrom the eclipsing pair to permit it to harbor an accretion disk.At the distance of the ONC, the third star could be separatedby as much as ∼400 AU and remain spatially unresolved in the∼1 arcsec imaging of our photometric observations.
4. RESULTS: ORBITAL AND PHYSICAL PARAMETERSOF THE ECLIPSING BINARY STARS IN Par 1802
We use the Wilson–Devinney (WD) based code PHOEBE (Prsa& Zwitter 2005) to do the simultaneous modeling of the EB’sRV and LCs. The individual RV and LC data sets are weighted
10

The Astrophysical Journal, 745:58 (22pp), 2012 January 20 Gomez Maqueo Chew et al.
Table 10Orbital and Physical Parameters of Par 1802
Parameter Symbol Paper II This Work(Units) RVs + IC RVs + VICJHKS
Orbital period Porb (days) 4.673843 ± 0.000068 4.673903 ± 0.000060Epoch of primary minimuma HJD0 (days) · · · 54849.9008 ± 0.0005Eccentricity e 0.029 ± 0.005 0.0166 ± 0.003Orientation of periastron ω (π rads) 1.478 ± 0.010 1.484 ± 0.010Semimajor axis a sin i (AU) 0.0501 ± 0.0006 0.0496 ± 0.0008c
Inclination angle i (deg) 78.1 ± 0.6 80.8 +8.0−2.0
d
Systemic velocity vγ (km s−1) 23.7 ± 0.5 23.4 ± 0.7c
Primary semiamplitude K1 (km s−1) 57.74 ± 0.75b 57.28 ± 2.20Secondary semiamplitude K2 (km s−1) 58.92 ± 0.95b 58.19 ± 2.78Mass ratio q ≡ M2/M1 0.98 ± 0.01 0.985 ± 0.029c
Total mass M sin3 i (M�) 0.768 ± 0.028 0.745 ± 0.034c
Primary mass M1 (M�) 0.414 ± 0.015 0.391 ± 0.032Secondary mass M2 (M�) 0.406 ± 0.014 0.385 ± 0.032Primary radius R1 (R�) 1.82 ± 0.05 1.73 +0.01
−0.02d
Secondary radius R2 (R�) 1.69 ± 0.018 1.62 +0.01−0.02
d
Primary gravity log g1 3.54 ± 0.09b 3.55 ± 0.04Secondary gravity log g2 3.62 ± 0.10b 3.61 ± 0.04Primary surface potential Ω1 · · · 7.27 ± 0.06Secondary surface potential Ω2 · · · 7.62 ± 0.06Primary synchronicity parameter F1 · · · 1.0097 ± 0.0013Secondary synchronicity parameter F2 · · · 1.0097 ± 0.0013Effective temperature ratio Teff,1/Teff,2 1.084 ± 0.007 1.0924 ± 0.0017Primary effective temperature Teff,1 (K) 3945 ± 100 3675 ± 150e
Secondary effective temperature Teff,2 (K) 3655 ± 100 3365 ± 150e
Notes.a Heliocentric Julian Date (2,400,000+).b Calculated from parameters and uncertainties in Paper II.c The uncertainties in these parameters are conservatively estimated from the formal errors of a fit to the RV data alone. See Section 4.d The uncertainties in these parameters are conservatively estimated from a variation in the level of third light between 5% and 75% of thesystem’s total luminosity. See Section 4.e The uncertainty in Teff is dominated by the systematic uncertainty in the conversion to Teff from the mean spectral type that we adopt for thesystem (see Section 4). The Teff ratio, via which Teff,2 is derived from Teff ,1, is independently and accurately determined from the light curves;Teff,1 and Teff,2 differ by 9.2% ± 0.2% regardless of their absolute value.
inversely by the square of their rms relative to the model, and theweights are updated with each fit iteration until convergence.
In all of our fits, we adopt the orbital period Porb determinedin Section 3.1. The rotational synchronicity parameters arecalculated from the rotation period of the eclipsing componentsdetermined in Section 3.1, F1 = F2 = Porb/Prot = 1.0097 ±0.0013. We also adopt Teff,1 = 3675 ± 150 K for the primary starby assuming a primary-to-secondary luminosity ratio of 1.75(see Section 3.2.1) and adopting a combined Teff = 3560 K(Luhman 1999) from Par 1802’s combined spectral type ofM2 (Hillenbrand 1997). The presence of the third star in thesystem does not significantly affect this average spectral typesince its Teff is evidently similar to that of the eclipsing pair(see Section 3.2). The uncertainty in Teff ,1 is dominated by thesystematic uncertainty in the spectral-type-Teff scale for low-mass PMS stars.
4.1. Model Fits to Radial-velocity and Light-curve Data
To minimize the effect of systematic correlations in the fitparameters, we begin our analysis by doing an initial fit to onlythe RV curves from Paper II, comprised of 11 measurements forthe primary and 9 for the secondary. We initially set i = 90◦,because the RV data provide information only about sin i, while iis derived from the LCs later on. We utilize as our initial guessesfor the RV solution the best-fit values from Paper II (see Table 1in that paper) of the parameters to be refined: the semimajor axis
(a sin i), the mass ratio (q ≡ M2/M1), the systemic velocity(vγ ), and the total system mass M sin3 i. The eccentricity (e)and the argument of periastron (ω) are later determined throughthe fit to the RV+LC data. These parameters and their formaluncertainties, derived conservatively from the covariance matrixof the fit to the RV curves alone, are given in Table 10 and aremarked with a dagger (†). The resulting a sin i, M sin3 i, q, andvγ remain fixed throughout the rest of our analysis.
We next proceed to fit the parameters that depend exclusivelyon the LC data: i, Teff,2 (via the Teff ratio), the surface potentialsΩj , and the luminosities, without minimizing for the otherparameters. For this task, we include the previously published ICLC and the VICJHKS LCs presented in this paper (Section 2.1).Given that the short period, low-amplitude variability is notattributed to the eclipsing components but to a third body in thesystem, the LCs are first rectified by removing the sinusoidalvariability due to the 0.7355 day period. We do not remove thesinusoidal variation attributed to the rotation of the eclipsingcomponents, as this information is encoded in the model via theF1 and F2 parameters (see above).
Adopting the third light levels, L3, described in Section 3.2.2,we are able to fit the observed eclipse depths in all bands to ourEB model. The effects of the uncertainty in L3 on the binary’sphysical properties is minimal and is explored in detail below.By fitting the RV and LC data simultaneously (RV+LC), weare able to refine e and ω. We iterate both the LC and RV+LC
11

The Astrophysical Journal, 745:58 (22pp), 2012 January 20 Gomez Maqueo Chew et al.
Figure 6. Effects of the IC third light on the system’s parameters. By exploring the effects of the amount of third light on the inclination, we are able to determine thatthe system’s parameters, in particular those that depend directly on i (semimajor axis, radii, and masses), do not change significantly with a change in third light. Avariation of the level of third light in the IC band, between 5% and 75% of the total luminosity of the system, corresponds to a change in inclination angle between∼78◦and 88◦ as shown in the top left panel. The formal errors for the inclination and the radii (±1σ ) are denoted by the horizontal dotted lines in their respectivepanel; the formal uncertainties for the semimajor axis and the mass are larger than the effect of the variation of the third light on these parameters. This variation ofthe third light, and consequently of i, corresponds to a change in the semimajor axis is of less than ± 1.5% (top right panel). It also translates into a change of less than± 4% in the masses, corresponding to less than ± 0.015 M� (bottom left panel). The solid line and dashed line represent the change in the primary and secondarymasses, respectively. The change in the radii of the primary and secondary components of +0.01 and −0.02 R� is presented in the bottom right panel by the solid lineand dashed line, respectively. Thus, the main source of uncertainty in the determination of the inclination and the radii is the uncertainty in the level of third light.
(A color version of this figure is available in the online journal.)
solutions, until we reach a consistent set of parameters for whichthe reduced χ2 of the fit is close to χ2
ν = 1.Figure 1 presents the observed LCs with this best-fit model
overplotted, and the physical and orbital parameters of Par 1802from this model are summarized in Table 10. The results fromthis study are generally consistent with those from Paper II towithin ∼1σ (see Table 10). However, the system parametersare now determined more precisely, especially the eccentricitywhich is important for modeling the tidal evolution historyof the system. The system inclination angle is now formallymore uncertain than in Paper II, but this is the result ofnow properly including the effects of the third light levels.However, the third light levels do not strongly affect the physicalparameters (e.g., Figure 6). The reported parameter uncertaintiesof our best solution include both the formal and heuristicparameter uncertainties (obtained from a direct χ2 mappingof the parameter space), as well as the uncertainties associatedwith our choice of third light levels, as we now discuss.
4.2. Effects of Third Light
L3 and i are highly degenerate, i.e., an increase in i may becompensated by an increase in L3, rendering the same goodnessof the fit. Consequently, L3 most strongly impacts the parametersthat depend directly on i: a, the radii, and the masses. The Teffratio is weakly dependent on a change in i and its correspondingL3, because the Teff ratio is constrained by the observedrelative depths of the eclipses which is itself not stronglydependent on i.
To explore these degeneracies as a function of L3, we varyL3 in the IC band such that it contributes between 5% and 75%of the system’s total luminosity, adjusting L3 in the other bandsaccording to the trends identified in Section 3.2.2. Figure 6shows the relationship between the change in L3 and i, a, andthe measured masses and radii of the eclipsing components. Wefind that the corresponding value for i for this variation in L3lies in the range 78◦–88◦. Since this change in i is greater thanits formal error of ∼0.◦1, we adopt σi =+8.0
−2.0 deg. The changein the value of a as L3 is varied is less than 2%. Thus, themasses vary by less than 4% or 0.015 M�. These changes arewell below our formal uncertainty of 0.032 M�, which includesthe above uncertainty in i. The radii change by +0.01
−0.02 R�, or±1%. Without including the uncertainty in L3, the formal errorsfrom the RV+LC fit are 0.002 R�, for both the primary andsecondary. The main source of uncertainty in the determinationof the radii is therefore the uncertainty in L3. Therefore weadopt conservatively a 1σ error of 0.02 R� for the radii of botheclipsing components.
4.3. Non-zero Orbital Eccentricity
Interestingly, our best-fit solution yields an orbital eccentric-ity that is significantly different from zero: e = 0.0166+0.0017
−0.0026.Small eccentricities can arise spuriously because of the positive-definite nature of e. Thus, it was of concern that the best-fit argu-ment of periastron is very close to 3π/2. Moreover, e and ω arecorrelated parameters through e cos ω and e sin ω. Therefore,we have explored e and ω in depth using two approaches.
12

The Astrophysical Journal, 745:58 (22pp), 2012 January 20 Gomez Maqueo Chew et al.
Figure 7. RV+LC joint confidence levels for e − ω. Given our data set, we are able to measure the very small but significant orbital eccentricity of the EB. Theheuristic errors of the eccentricity e and the argument of periastron ω are estimated by the variation of a χ2 distribution with two degrees of freedom with e and ω.The center of the cross marks the point at which the χ2 of the RV+LC fit attains its minimum value; its length and width indicate the 1σ uncertainties for the sampledparameters as given by the innermost contour level. Each subsequent contour represents a 1σ increase. The RV+LC parameter hyperspace is sampled for 0.0 < ω <
2π and 0.0 < e < 0.1; this is the same parameter range sampled for the LC contours shown in Figure 8.
First, we estimated e and ω from simple arguments involvingthe phases of primary and secondary eclipse minima, tp andts, and from the phase duration of each eclipse, Θp and Θs .The derived e and ω are then related as follows (Kallrath& Milone 2009): e cos ω ≈ π (ts − tp − 1
2 )/(1 + csc2 i) ande sin ω ≈ (Θp − Θs)/(Θp + Θs). A lower limit for e maythus be estimated by assuming | cos ω| = 1. In order tomeasure the separation and duration of the eclipses, we fit aGaussian to both minima in the phased IC band and obtainfrom the phases at which they occur that their separation ists − tp = 0.49799 ± 0.00025, where the uncertainty is fromthe formal uncertainty on the centroids of the fitted Gaussians.Note that by fitting the eclipses in the entire phased LC we areeffectively averaging over the random scatter in the individualeclipse times (see Section 3.1). The phase separation of theeclipses differs from 0.5 by 8σ . Hence, we can set as a firm lowerlimit, e � 0.0031. The separation of the minima in conjunctionwith the measured durations, Θp = 0.1010 ± 0.0007 and Θs =0.0877 ± 0.0012, render ω ≈ 1.514 ± 0.004 π radians. Thesee and ω are estimates only, but demonstrate that e > 0 fromsimple theoretical arguments unrelated to LC modeling.
Second, we performed a detailed sampling of the parametercross section between e and ω by fitting all of the RV and LCdata in order to determine the best-fit values of these parametersand their heuristic uncertainties from a detailed examination ofthe shape of the χ2 space. Figure 7 shows the joint confidencelevels for e and ω following the variation of a χ2-distributionwith two degrees of freedom around the RV+LC solution’sminimum. This cross section was sampled 1750 times byrandomly selecting values for e in the range 0.0–0.1, and for ω inthe range 0–2π radians. The phase shift, which gives the orbitalphase at which the primary eclipse occurs, is strongly correlatedwith both explored parameters and is therefore minimized foreach set of randomly selected values; whereas the rest of theparameters are less correlated and kept constant at their best-fitvalues. In order to verify that e, ω, and their uncertainties arenot artificially skewed by the weighting of both the RV and
LCs as undertaken in PHOEBE by WD, given that our data setis comprised mostly of photometric measurements, we sampledthe same range in e and ω 1900 times by fitting to the LCsalone and obtaining their LC confidence contour levels. We findthat the LC contours, shown in Figure 8, are very similar tothe RV+LC contours (Figure 7). The minimum value of χ2 tothe RV+LC fit is e = 0.0166+0.0017
−0.0026 and ω = 1.484 ± 0.010π radians. For the LC fit, it is e = 0.0182+0.0015
−0.0032 and ω =1.485+0.009
−0.008π radians. The detailed LC contours up to 3σ areshown in the inset in Figure 8; for comparison, the 1σ and 3σRV+LC contours are overplotted in the dashed lines. The twosets of contours are consistent with one another, and thus weadopt the values of e and ω and their heuristic uncertainties fromthe RV+LC contours.
Extensive numerical integrations, like those performed forthe system υ Andromedae (Barnes et al. 2011), spanning theplausible range of orbits and masses of a third body that producethe measured eclipse timing variations (see Section 3.1) andsmall eccentricity are beyond the scope of this paper, but couldbe the best way to constrain the mass and orbit of an unseencompanion.
4.4. Temperature Ratio and Stellar Radii
We sampled the parameter hyperspace between (Teff,1/Teff,2)and (R1/R2) over 2000 times, shown in Figure 9, in order toconfirm the significance of the differences in radii and Teffbetween the eclipsing components of Par 1802. We explorethe Teff ratio in the range 1.0382–1.1271. The radius for thecomponent of a detached EB depends on the surface potentialsas ∼1/Ωj ; so the ratio of the radii was sampled by choosingvalues for Ω1 in the range 5.5–8.4, and minimizing for Ω2. Tofacilitate the convergence of Ω2, we exploit the fact that thesum of the radii must remain the same due to the observationalconstraint provided by the eclipse durations. We confirm thatthe ratio of Teff as shown in Paper II is different from unity,Teff,1/Teff,2 = 1.0924+0.0017
−0.0013. We also confirm this disparity
13

The Astrophysical Journal, 745:58 (22pp), 2012 January 20 Gomez Maqueo Chew et al.
Figure 8. LC joint confidence levels for e − ω. The LC confidence contours allows us to confirm that the values for e and ω from the RV+LC contours are notsystematically skewed by the weighting of the data, due to the abundant number of photometric data in comparison to the number of RV measurements. The figureshows the sampled parameter cross section in its entirety. The cross marks the lowest-χ2 point to the LC fit with 1σ uncertainties, surrounded by the solid line 3σ
confidence level. The shaded contours beyond 3σ do not correspond to a particular uncertainty level but are shown to display the two valleys in χ2 when the orbit’ssemimajor axis is parallel to the line of sight. The inset shows in detail the confidence interval for e and ω within 3σ ; and for comparison, the dashed lines denote the1σ and 3σ RV+LC contours from Figure 7.
(A color version of this figure is available in the online journal.)
Figure 9. Joint confidence levels for (Teff,1/Teff,2) – (R1/R2). Similar to Figures 5 and 6, the significance levels given by the contours are representative of the changein χ2 as the ratios of temperatures and radii are explored. Even though the masses of the components are almost equal, q = 0.985 ± 0.029, the effective temperaturesdiffer by 9.2% ± 0.2%, and the radii of the eclipsing binary components by 6.9% ± 0.8%. Consequently, their luminosities differ by 62% ± 3%.
in the case of the ratio of the eclipsing components radii,R1/R2 = 1.0687+0.0093
−0.0075.
5. DISCUSSION: POSSIBLE ORIGINS OF THE“DISSIMILAR IDENTICAL TWINS” IN Par 1802
Par 1802 is a unique system providing important observa-tional constraints in the low-mass regime at the earliest evo-lutionary stages. Not only does it provide precise and direct
measurements of the mass and the radius of each of its compo-nents; but because the component masses are very nearly equal(q = 0.985±0.029; Table 10), Par 1802 affords a unique oppor-tunity to examine the degree to which two otherwise identicalstars in a close binary share identical evolutionary histories. De-spite having equal masses, the stars’ radii that we have measuredaccurately to ∼1%, differ by 7%. The measured Teff ratio, ac-curate to ∼0.2%, indicates that the individual stellar Teff differby 9%.
14

The Astrophysical Journal, 745:58 (22pp), 2012 January 20 Gomez Maqueo Chew et al.
Figure 10. Mass–radius diagram. We show the mass–radius diagram comparingthe measured physical properties of the youngest and lowest mass EBs in theONC to the BCAH98 theoretical isochrones with ages between 1 Myr and1 Gyr. The components of Par 1802 are marked by the filled circles; JW 380and 2M0535−05 are shown with the open circles.
In this section, we consider possible implications of thesephysical differences between the two eclipsing stars in Par 1802.We compare the measured properties of Par 1802 to fourdifferent PMS stellar evolutionary models: DAM97 (D’Antona& Mazzitelli 1997); SDF00 (Siess et al. 2000); BCAH98(Baraffe et al. 1998); and PS99 (Palla & Stahler 1999). Asan example, in Figure 10, we show the predicted masses andradii of stars from 0.01 to 0.6 M� and with a range of agesfrom 1 Myr to 1 Gyr from the BCAH98 evolutionary modelscompared to the observed properties of Par 1802. In Figures 10and 11, the physical properties of the two other known PMSEBs in the ONC with the lowest masses and the youngestages (2M0535−05 and JW 380) are shown to provide context.We show these particular models because they are specificallydesigned to predict the properties of very low mass objects (late-type stars and brown dwarfs) at very young ages (τ � 1 Myr),and they are reasonably successful at reproducing the structuralproperties of these particular systems.
Despite the complex phenomena that young objects can po-tentially experience in their very early evolution (i.e., accretion,magnetic activity, contraction, rapid rotation, tidal interactions,etc.), the observed radii of these objects are surprisingly wellpredicted by theoretical isochrones with an age consistent withthe ONC (1–2 Myr). The radii of the equal-mass eclipsing com-ponents of Par 1802 are enlarged, as expected for PMS stars.However, when we look in more in detail, the measured radii ofthe two eclipsing components are significantly different, and thisis not predicted by a single theoretical isochrone. Moreover, theeffective temperatures of these two stars are also significantlydifferent. In the temperature–radius diagram that compares theBCAH98 models with the observed properties from the PMSEBs (Figure 11), this implies that the two equal-mass stars can-not both be fit by the same mass track.
In the first 10 Myr, as these low-mass stars descend alongthe Hyashi track to the main sequence, a rapid contraction inradius at roughly constant temperature is predicted. All themodels we examined show similar trends from 1 to 10 Myr,however the BCAH98 models predict a cooler temperaturefor this contraction by ∼200 K than the other three models.Furthermore, the DAM97 model is unique in that it showsan additional rapid evolution in Teff prior to the first 1 Myr
Figure 11. Teff–radius diagram. The observed EB properties and the BCAH98theoretical isochrones (from 1 Myr to 1 Gyr) are denoted as described inFigure 10. The lines that start at the 1 Myr isochrone (i.e., the solid line at far-right top corner) and descend almost vertically during the first few Myr representthe evolution of stars of different masses (from 0.1 to 1.2 M�) as predicted byBCAH98. In this diagram, it is clear that the components of Par 1802 are young;however, the measured Teff and radii of both eclipsing components cannot bedescribed by the 0.4 M� mass track. It is only the secondary Teff that is consistentwith the measured mass. Additional heating mechanisms that might explain theobserved primary Teff are explored in Section 5.
(as shown in Paper II). Despite some genuine successes, noexisting single star evolutionary model (that does not includeaccretion, magnetic activity, tidal heating, rotation, and detailedconvection) is able to reproduce the observed properties of botheclipsing components of Par 1802 with a single age and mass.
Moreover, the different predictions by each of the theoreticalmodels lead to different possible physical interpretations forPar 1802. The Teff and radius of the secondary star is wellreproduced by the BCAH98 models for a 0.4 M� star with anage of 1–2 Myr (see Figure 11), but the primary star is too hot forits mass. However, the models by DAM97, PS99, and SDF00predict a 2 Myr, 0.4 M� star to have a Teff consistent with theprimary star, but overestimate the temperature of the secondary.This comparison suggests that one of the two components(probably the primary star) may have experienced some form ofadditional heating making it unexpectedly hotter than its twin. Inaddition, as discussed in Paper II, the DMA97 models suggest asmall age difference could be invoked to explain the differencesin physical properties between the two eclipsing components ofPar 1802 if the system is hotter by ∼250 K and younger than1 Myr (see Section 5.2). We consider the possible explanationsbelow in more detail.
5.1. Magnetic Activity
Evolutionary models have typically not included the effectsof magnetic fields because of the complexity and difficultyinvolved in their modeling. However, the effects of magneticfields are thought to be the cause of the enlarged radii and cooltemperatures of field M dwarfs found in EB systems (Lopez-Morales 2007). The presence of spots and/or the reduction ofthe convective efficiency of the star, due to increased magneticactivity, lower the effective temperature and increase the radiusin order to maintain the star’s luminosity (Chabrier et al. 2007).Par 1802’s nearly equal-mass components should have similarconvection zone depths and are rotating at similar rates, thusit is likely that they have similar magnetic activity levels.Moreover, the measured Hα emission of both stars is weak.
15

The Astrophysical Journal, 745:58 (22pp), 2012 January 20 Gomez Maqueo Chew et al.
If magnetic activity were the cause of the discrepant radii andeffective temperatures in Par 1802, we would expect the coolercomponent to have the larger radius. However, we find theopposite. The secondary star has the smaller radius and coolertemperature, thus magnetic activity is unlikely to be causing thedisparate radii and temperature reversal found between the twincomponents of Par 1802.
5.2. Competitive Accretion
As discussed in Paper II, a difference in age of a few ×105 yrcould potentially explain the observed differences in Teff andradius for the eclipsing stars in Par 1802. The idea here isthat mass equalizing mechanisms during the binary formationprocess may have preferentially directed accretion from thecircumbinary disk to the (initially) lower-mass component,leading that star to cease the phase of heavy accretion later thanits companion, and causing its “birth” to be effectively delayedrelative to its companion (i.e., causing it to appear younger). This“competitive accretion” scenario has been specifically advancedin the context of Par 1802 by Simon & Obbie (2009).
If the Teff’s for both stars could be shifted ∼250 K hotter(while preserving the accurately measured Teff ratio), implyinga ∼2σ shift relative to the likely systematic uncertainty on theabsolute Teff scale for these stars, the stars are best matched bythe DAM97 models, which predict that a 0.4 M� star decreasesin Teff during the first Myr. This would imply that the primarystar is the younger component, being both hotter and larger.In this scenario, the primary will presumably evolve along the0.4 M� track and, within a few Myr, appear identical to its(presumed slightly older) twin.
5.3. Tidal Evolution and Heating
Another potential explanation for the observed differences inluminosity of the Par 1802 EB components is the presence ofadditional energy sources. We have determined that the orbitof Par 1802 is not circular, but rather has a non-zero eccentricityof e = 0.0166 ± 0.003. In addition, we have measured therotation period of the EB components to be very close tobut significantly different than the orbital period (Section 3.1).Consequently, the EB components should be experiencing somedegree of tidal interaction. In this section, we consider the roleof tides and the amount of tidal heating that the two stars mayhave experienced during their lifetimes in order to reproducetheir observed physical properties. In particular, we wish todetermine whether the primary star could have acquired enoughadditional tidal heating to explain its apparent overluminosityrelative to its twin.
A substantial body of research is devoted to tidal theory.The reader is referred to Hut (1981), Ferraz-Mello et al.(2008), Leconte et al. (2010), Mazeh (2008), Zahn (2008),and references therein for a more complete description of thederivations and nuances of various theoretical treatments. Forthis investigation, we consider the so-called constant phase lag(CPL) and constant time lag (CTL) models, the details of whichare provided in Appendix B (and see Heller et al. 2011). Ourapproach is not intended to be a definitive treatment of thetidal evolution of this binary. Rather we estimate tidal effectsusing standard assumptions and linear theory. More detailedmodeling could prove enlightening, but is beyond the scope ofthis investigation. Even so, the discussion below indicates thatstandard assumptions suggest tidal heating is important in thisbinary.
Table 11Fits Parameters to Radial Contraction Models
Model a0 a1 a2 a3
Baraffe et al. (1998) −1.754 1.378 0.3444 0.02758D’Antona & Mazzitelli (1997) −2.557 2.7085 0.9177 0.09971
The CPL and CTL models assume that the physical propertiesof the stars are constant with time. However, as the Par 1802system is very young (∼1 Myr), the radii are expected to becontracting quickly. This contraction could have a profoundeffect on tidal processes as the radius enters both the CPL and theCTL models at the fifth power (see Equations (B5) and (B14)).Radial contraction will also enter into the angular momentumevolution through the rotational frequency (Equations (B3) and(B12)). Thus, we have added radial contraction to the CPLand CTL models, in a manner similar to that in Khaliullin& Khaliullina (2011), but note that their treatment does notinclude obliquity effects. D’Antona & Mazzitelli (1997) andBaraffe et al. (1998) provide from their calculations the timerate of change of the radius, dR/dt in R�/Myr, for 0.4 M�stars. We fit their models with a third-order polynomial usingLevenberg–Marquardt minimization,
dR
dt= a0 + a1t + a2t
2 + a3t3, (1)
where a0, . . . , a3 are constants listed in Table 11. For simplicity,we assume the radial contraction is independent of the tidalevolution. Therefore, the “radius of gyration” rg, i.e., themoment of inertia is M(rgR)2, is held constant, and moreover,we can express the change in stellar spin due solely to radialcontraction as
dω
dt= −2ω
R
dR
dt. (2)
In Figure 12, we present the history of Par 1802 due to bothtidal evolution (for both the CPL and CTL models) and radialcontraction (for both the DM97 and BCAH98 stellar evolutionmodels). The behavior of the resulting tidal evolution historyis qualitatively different as compared to the evolution withoutradial contraction effects (see Appendix B). We assume theprimary star’s obliquity ψP = 1◦ at the present time, i.e., t = 0,in order to be able to determine the evolution of ψP . The CTLmodel evolution (blue curves) predicts that the stellar obliquitieswere anti-parallel up to 0.5 Myr ago, and then ψP rapidly“flipped” (actually its rotation was halted and then reversed).For the CPL model (red curves), the evolution breaks downat ∼0.5 Myr in the past as the stars are predicted to havebeen merged (and consequently the model fails to conserveangular momentum within a factor of 10; bottom right panel).In principle this could be taken as a constraint on the system’smaximum age, but more likely this reflects the limitations ofthe simplified linear tidal theory that we have adopted; themodel is unable to account for effects such as Roche lobeoverflow that would certainly have been important if the starshad once been in physical contact. This behavior of the CPLmodel could be avoided by tuning the model’s Q parameter[here we have adopted the standard value for PMS stars of 106
(see Zahn 2008)], however for the current discussion we discardthe prediction of formerly merged stars and instead adopt theCTL model predictions as more physically plausible.
Finally, in Figure 13 we consider whether tidal effects canexplain the increased radius of the primary. We consider a range
16

The Astrophysical Journal, 745:58 (22pp), 2012 January 20 Gomez Maqueo Chew et al.
Figure 12. History of the eclipsing components of Par 1802 due to tidal processes and radial contraction for ψP = 1◦ and ψS = 0. Blue curves are for the CTL modeland red for the CPL. Solid curves use the Baraffe et al. (1998) radial contraction model and dashed the D’Antona & Mazzitelli (1997) model. Top left: semimajoraxis. Top right: orbital eccentricity. Middle left: primary’s rotation period. Middle right: primary’s obliquity. Bottom left: primary’s tidal heat. Bottom right: the totalangular momentum of the system.
(A color version of this figure is available in the online journal.)
of possibilities, all of which assume ψS = 0 for simplicity.There are four possible combinations of models: CTL-B98,CPL-B98, CTL-DM97, and CPL-DM97. The CPL models(solid and dotted curves) do not predict much difference inthe tidal heating rates between the primary and secondary star.The CTL-B98 model (dashed curve) predicts about a factor of10 difference between the stars, and with the primary receiving>1026 W as recently as 0.2 Myr ago (ψP = 45◦). The modelthat predicts the largest difference in the heating rates betweenthe two stars is the CTL-DM97 case (dot-dashed curves), whichpredicts a difference in heating of more than three orders ofmagnitude as recently as 0.5 Myr ago. Moreover, the heating rateseems to level out at about 1026 W (and roughly independent ofψP ). However, the CTL models, as shown in Figure 12, predictthat the obliquities were anti-parallel when the heating rates aremost different.
A tidal heating rate of ∼1026 W is comparable to the observeddifference between the Par 1802 primary and secondary stars’luminosities (ΔL ≈ 7 × 1025 W; see Table 10). The models inFigure 13 are able to supply at least this amount of tidal heatingto the primary up to ∼0.2 Myr in the past. Thus, assumingthat the primary star will have retained this extra heat for atleast 0.2 Myr, we conclude that tidal processes are able toprovide a sufficient energy source to explain the differencesin the luminosities of the Par 1802 EB pair. However, thisrequires the spins to have been misaligned, at least in the past.
Observation of misaligned spin axes in Par 1802 (e.g., via theRossiter–McLaughlin effect) would provide strong additionalevidence in favor of this interpretation, though it may be achallenging observation if the obliquity is small.
6. SUMMARY
Parenago 1802 is a PMS, double-lined, detached EB, and isthe youngest known example of a low-mass system with a massratio of unity (q = 0.99 ± 0.03). It presents a unique sourceof observational constraints for low-mass stars during the earlystages of their evolution. Contrary to what theoretical evolu-tionary models predict for stars of the same mass, composition,and age, the radii of the eclipsing pair differ by 6.9% ± 0.8%,their effective temperatures differ by 9.2% ± 0.2%, and con-sequently their luminosities differ by 62% ± 3%, despite theirmasses being equal to within 3%.
The Par 1802 system appears to include an unresolved, low-mass third star that is rapidly rotating and likely accreting (i.e.,a Classical T Tauri star) in a wide orbit about the eclipsing pair.This third star manifests itself in multiple ways, including avery short period modulation of the LCs, excess continuum inthe spectra, and dilution of the eclipse depths in the LCs. Thebroadband SED of the Par 1802 system can be modeled by twostars with the measured properties of the eclipsing pair, plus a
17
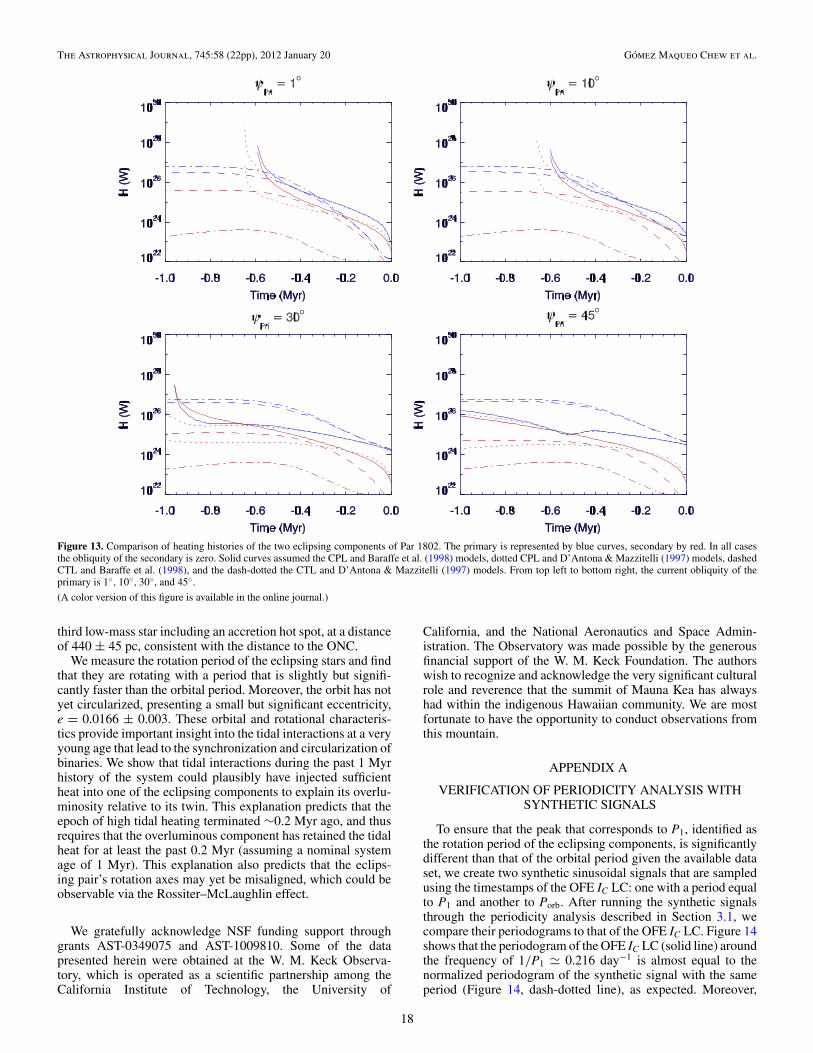
The Astrophysical Journal, 745:58 (22pp), 2012 January 20 Gomez Maqueo Chew et al.
Figure 13. Comparison of heating histories of the two eclipsing components of Par 1802. The primary is represented by blue curves, secondary by red. In all casesthe obliquity of the secondary is zero. Solid curves assumed the CPL and Baraffe et al. (1998) models, dotted CPL and D’Antona & Mazzitelli (1997) models, dashedCTL and Baraffe et al. (1998), and the dash-dotted the CTL and D’Antona & Mazzitelli (1997) models. From top left to bottom right, the current obliquity of theprimary is 1◦, 10◦, 30◦, and 45◦.
(A color version of this figure is available in the online journal.)
third low-mass star including an accretion hot spot, at a distanceof 440 ± 45 pc, consistent with the distance to the ONC.
We measure the rotation period of the eclipsing stars and findthat they are rotating with a period that is slightly but signifi-cantly faster than the orbital period. Moreover, the orbit has notyet circularized, presenting a small but significant eccentricity,e = 0.0166 ± 0.003. These orbital and rotational characteris-tics provide important insight into the tidal interactions at a veryyoung age that lead to the synchronization and circularization ofbinaries. We show that tidal interactions during the past 1 Myrhistory of the system could plausibly have injected sufficientheat into one of the eclipsing components to explain its overlu-minosity relative to its twin. This explanation predicts that theepoch of high tidal heating terminated ∼0.2 Myr ago, and thusrequires that the overluminous component has retained the tidalheat for at least the past 0.2 Myr (assuming a nominal systemage of 1 Myr). This explanation also predicts that the eclips-ing pair’s rotation axes may yet be misaligned, which could beobservable via the Rossiter–McLaughlin effect.
We gratefully acknowledge NSF funding support throughgrants AST-0349075 and AST-1009810. Some of the datapresented herein were obtained at the W. M. Keck Observa-tory, which is operated as a scientific partnership among theCalifornia Institute of Technology, the University of
California, and the National Aeronautics and Space Admin-istration. The Observatory was made possible by the generousfinancial support of the W. M. Keck Foundation. The authorswish to recognize and acknowledge the very significant culturalrole and reverence that the summit of Mauna Kea has alwayshad within the indigenous Hawaiian community. We are mostfortunate to have the opportunity to conduct observations fromthis mountain.
APPENDIX A
VERIFICATION OF PERIODICITY ANALYSIS WITHSYNTHETIC SIGNALS
To ensure that the peak that corresponds to P1, identified asthe rotation period of the eclipsing components, is significantlydifferent than that of the orbital period given the available dataset, we create two synthetic sinusoidal signals that are sampledusing the timestamps of the OFE IC LC: one with a period equalto P1 and another to Porb. After running the synthetic signalsthrough the periodicity analysis described in Section 3.1, wecompare their periodograms to that of the OFE IC LC. Figure 14shows that the periodogram of the OFE IC LC (solid line) aroundthe frequency of 1/P1 0.216 day−1 is almost equal to thenormalized periodogram of the synthetic signal with the sameperiod (Figure 14, dash-dotted line), as expected. Moreover,
18

The Astrophysical Journal, 745:58 (22pp), 2012 January 20 Gomez Maqueo Chew et al.
Figure 14. OFE IC and synthetic periodograms. We compare the periodogram of the OFE IC light curve (solid line) around the frequency of 1/P1 0.216 day−1 withtwo synthetic sinusoidal signals, one with a period equal to P1 (dash-dotted line) and another with a period of Porb (dashed line). Both synthetic signals have beensampled to the timestamps of the IC data to preserve its statistical characteristics; and their periodograms have been scaled to the amplitude of the OFE IC periodogram.The three-peaked structure around the most significant peak is due to the yearly sampling of the light curve; the side peaks are separated from the central peak by afrequency of 1/360 day−1. Since we are able to clearly distinguish between the periodogram peaks of the P1 signal and those of the Porb signal, we conclude the P1 issignificantly distinct from the orbital period.
(A color version of this figure is available in the online journal.)
the periodogram of the synthetic signal with a period equal tothe orbital period (Figure 14, dashed line) is clearly distinct fromthe other two periodograms. By directly assessing the windowfunction of the data through the periodograms of the syntheticperiodic signals, we are able to discard the possibility thatthe three-peaked structure found in the periodograms centeredaround the most prominent peaks is an artifact of our periodicityanalysis. The periodograms of the synthetic signals, as shownin Figure 14, also present the three-peaked structure confirmingthat it arises from the sampling of the data and that we haveenough frequency resolution to discern P1 from Porb.
APPENDIX B
DETAILS OF TIDAL EVOLUTION MODELS
For our calculations of tidal evolution, we employ “equilib-rium tide” models, originally derived by Darwin (1879, 1880).These models assume the gravitational potential of the tide raisercan be expressed as the sum of Legendre polynomials and thatthe elongated equilibrium shape of the perturbed body is slightlymisaligned with respect to the line which connects the two cen-ters of mass. This misalignment is due to dissipative processeswithin the deformed body, i.e., friction, causing a secular evo-lution of the orbit as well as the angular momenta of the twobodies. When consistently calculating the tidal interaction oftwo bodies, the roles of the tide raiser and the perturbed bodycan be switched. This approach leads to a set of six coupled,nonlinear differential equations, but note that the model is infact linear in the sense that there is no coupling between thesurface waves which sum to the equilibrium shape.
B.1. The Constant Phase Lag Model
In the “constant-phase-lag” (CPL) model of tidal evolution,the angle between the line connecting the centers of massand the tidal bulge is assumed to be constant. This approach has
the advantage of being analogous to a damped-driven harmonicoscillator, a well-studied system, and is quite commonly utilizedin planetary studies (e.g., Goldreich & Soter 1966). In this case,the evolution is described by the following equations:
de
dt= − ae
8GM1M2
∑i = j
Z′i
(2ε0,i − 49
2ε1,i +
1
2ε2,i + 3ε5,i
)
(B1)
da
dt= a2
4GM1M2
∑i = j
Z′i
(4ε0,i + e2
[−20ε0,i +
147
2ε1,i
+1
2ε2,i − 3ε5,i
]− 4 sin2(ψi)[ε0,i − ε8,i]
)(B2)
dωi
dt= − Z′
i
8Mir2g,iR
2i n
(4ε0,i + e2[−20ε0,i + 49ε1,i + ε2,i]
+ 2 sin2(ψi)[−2ε0,i + ε8,i + ε9,i]) (B3)
dψi
dt= Z′
i sin(ψi)
4Mir2g,iR
2i nωi
([1−ξi]ε0,i +[1+ξi]{ε8,i −ε9,i}), (B4)
where e is eccentricity, t is time, a is semimajor axis, G isNewton gravitational constant, M1 and M2 are the two masses,R1 and R2 are the two radii, ω is the rotational frequency, ψ isthe obliquity, rg is the “radius of gyration,” i.e., the moment ofinertia is M(rgR)2, and n is the mean motion. The quantity Z′
i
is
Z′i ≡ 3G2k2M
2j (Mi + Mj )
R5i
a9
1
nQi
, (B5)
19

The Astrophysical Journal, 745:58 (22pp), 2012 January 20 Gomez Maqueo Chew et al.
Figure 15. History of Par 1802 due to tidal processes, and assuming the constant phase lag (CPL) model, for three different current obliquities of the primary: 0◦ (solidcurves), 1◦ (dotted curves; indistinguishable from the solid curves in this case), and 45◦ (dashed curves). The system’s observed properties are adopted as the “initialvalues” at t = 0 and the tidal evolution equations evolved back in time. For context the evolution is shown slightly beyond the system’s nominal age of 1 Myr. Topleft: semimajor axis. Top right: orbital eccentricity. Middle left: primary’s rotation period. Middle right: primary’s obliquity. Bottom left: primary’s tidal heat. Bottomright: total angular momentum (orbital + spin) of the system.
where k2 is the Love number of order 2 and tidal Q is the “tidalquality factor.” The parameter ξi is
ξi ≡ r2g,iR
2i ωian
GMj
, (B6)
where i and j refer to the two bodies. The signs of the phase lagsare
ε0,i = Σ(2ωi − 2n)ε1,i = Σ(2ωi − 3n)ε2,i = Σ(2ωi − n)ε5,i = Σ(n)ε8,i = Σ(ωi − 2n)ε9,i = Σ(ωi),
(B7)
with Σ(x) the sign of any physical quantity x, thus Σ(x) =+1 ∨ −1 ∨ 0.
The tidal heating of the ith body is due to the transformation ofrotational and orbital energy into frictional heating. The heatingfrom the orbit is
Eorb,i = Z′i
8×
(4ε0,i + e2
[−20ε0,i +
147
2ε1,i +
1
2ε2,i − 3ε5,i
]
− 4 sin2(ψi)[ε0,i − ε8,i]
),
and that from the rotation is
Erot,i = −Z′i
8
ωi
n× (4ε0,i + e2[−20ε0,i + 49ε1,i + ε2,i]
+ 2 sin2(ψi)[−2ε0,i + ε8,i + ε9,i]).
The total heat input rate into the ith body is therefore
ECPLtide,i = −(Eorb,i + Erot,i) > 0. (B8)
It can also be shown (Goldreich 1966; Murray & Dermott1999) that the equilibrium rotation period for both bodies is
P CPLeq = P
1 + 9.5e2(B9)
for low e and no obliquity. However, given the discretenature of the CPL model, we caution that integration ofEquations (B1)–(B4) will not always yield the value predictedby Equation (B9).
In the CPL model, for a given ψ the rate of evolution andamount of heating are set by three free parameters: Q, k2, and rg.We choose for these parameters 106, 0.5, and 0.5, respectively.These choices are consistent with observations of other stars(Lin et al. 1996; Jackson et al. 2009).
20
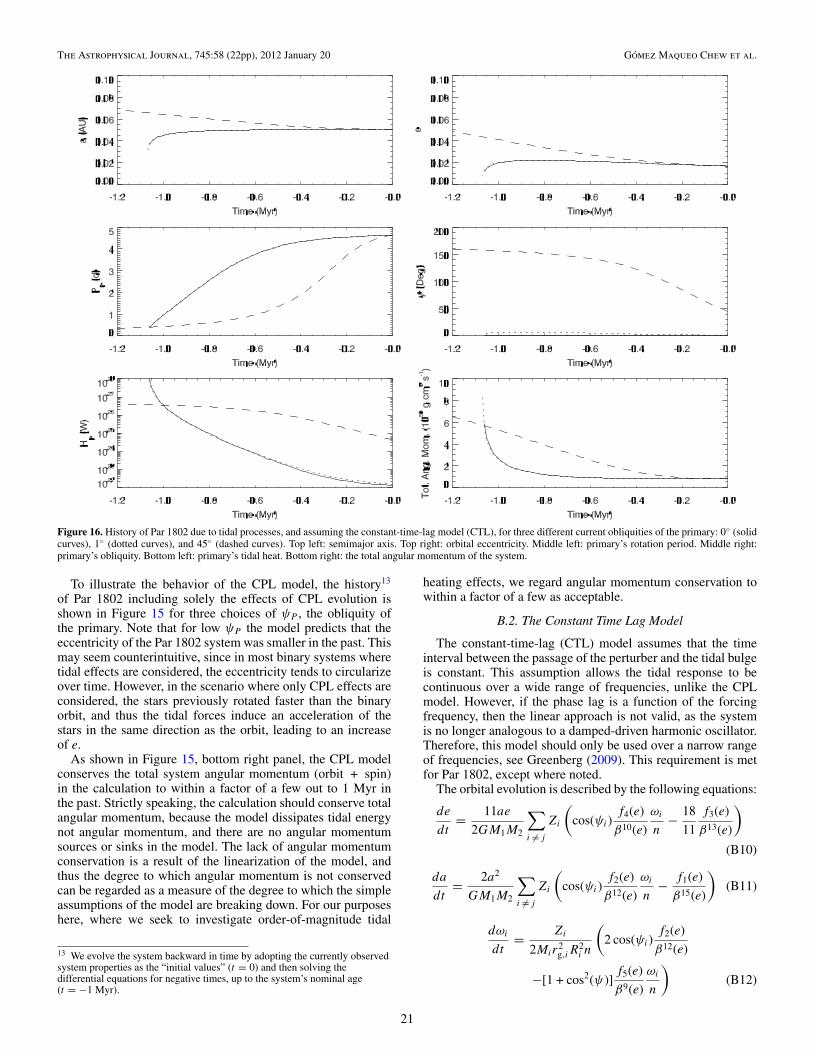
The Astrophysical Journal, 745:58 (22pp), 2012 January 20 Gomez Maqueo Chew et al.
Figure 16. History of Par 1802 due to tidal processes, and assuming the constant-time-lag model (CTL), for three different current obliquities of the primary: 0◦ (solidcurves), 1◦ (dotted curves), and 45◦ (dashed curves). Top left: semimajor axis. Top right: orbital eccentricity. Middle left: primary’s rotation period. Middle right:primary’s obliquity. Bottom left: primary’s tidal heat. Bottom right: the total angular momentum of the system.
To illustrate the behavior of the CPL model, the history13
of Par 1802 including solely the effects of CPL evolution isshown in Figure 15 for three choices of ψP , the obliquity ofthe primary. Note that for low ψP the model predicts that theeccentricity of the Par 1802 system was smaller in the past. Thismay seem counterintuitive, since in most binary systems wheretidal effects are considered, the eccentricity tends to circularizeover time. However, in the scenario where only CPL effects areconsidered, the stars previously rotated faster than the binaryorbit, and thus the tidal forces induce an acceleration of thestars in the same direction as the orbit, leading to an increaseof e.
As shown in Figure 15, bottom right panel, the CPL modelconserves the total system angular momentum (orbit + spin)in the calculation to within a factor of a few out to 1 Myr inthe past. Strictly speaking, the calculation should conserve totalangular momentum, because the model dissipates tidal energynot angular momentum, and there are no angular momentumsources or sinks in the model. The lack of angular momentumconservation is a result of the linearization of the model, andthus the degree to which angular momentum is not conservedcan be regarded as a measure of the degree to which the simpleassumptions of the model are breaking down. For our purposeshere, where we seek to investigate order-of-magnitude tidal
13 We evolve the system backward in time by adopting the currently observedsystem properties as the “initial values” (t = 0) and then solving thedifferential equations for negative times, up to the system’s nominal age(t = −1 Myr).
heating effects, we regard angular momentum conservation towithin a factor of a few as acceptable.
B.2. The Constant Time Lag Model
The constant-time-lag (CTL) model assumes that the timeinterval between the passage of the perturber and the tidal bulgeis constant. This assumption allows the tidal response to becontinuous over a wide range of frequencies, unlike the CPLmodel. However, if the phase lag is a function of the forcingfrequency, then the linear approach is not valid, as the systemis no longer analogous to a damped-driven harmonic oscillator.Therefore, this model should only be used over a narrow rangeof frequencies, see Greenberg (2009). This requirement is metfor Par 1802, except where noted.
The orbital evolution is described by the following equations:
de
dt= 11ae
2GM1M2
∑i = j
Zi
(cos(ψi)
f4(e)
β10(e)
ωi
n− 18
11
f3(e)
β13(e)
)
(B10)
da
dt= 2a2
GM1M2
∑i = j
Zi
(cos(ψi)
f2(e)
β12(e)
ωi
n− f1(e)
β15(e)
)(B11)
dωi
dt= Zi
2Mir2g,iR
2i n
(2 cos(ψi)
f2(e)
β12(e)
−[1 + cos2(ψ)]f5(e)
β9(e)
ωi
n
)(B12)
21
The Astrophysical Journal, 745:58 (22pp), 2012 January 20 Gomez Maqueo Chew et al.
dψi
dt= Zi sin(ψi)
2Mir2g,iR
2i nωi
([cos(ψi) − ξi
β
]
× f5(e)
β9(e)
ωi
n− 2
f2(e)
β12(e)
), (B13)
where
Zi ≡ 3G2k2,iM2j (Mi + Mj )
R5i
a9τi, (B14)
and
β(e) = √1 − e2,
f1(e) = 1 +31
2e2 +
255
8e4 +
185
16e6 +
25
64e8,
f2(e) = 1 +15
2e2 +
45
8e4 +
5
16e6,
f3(e) = 1 +15
4e2 +
15
8e4 +
5
64e6,
f4(e) = 1 +3
2e2 +
1
8e4,
f5(e) = 1 + 3e2 +3
8e4.
(B15)
The tidal heating of the ith body is therefore
ECTLtide,i = Zi
(f1(e)
β15(e)− 2
f2(e)
β12(e)cos(ψi)
ωi
n
+
[1 + cos2(ψi)
2
]f5(e)
β9(e)
ω2i
n2
).
It can also be shown that the equilibrium rotation period forboth bodies is
P CTLeq,i = 2πβ3(e)f5(e)
nf2(e)
1 + cos2 (ψi)
2 cos (ψi). (B16)
In the CTL model, Q is replaced by the “time lag,” τ . Forthe limiting case of e = 0 and ψ = 0◦ the two parameters arerelated as Q = 1/nτ (Leconte et al. 2010; Heller et al. 2011).For Par 1802, n = 1.56 × 10⁻⁵, corresponding to τ = 0.064 sat t = 0. We therefore choose this time lag, and as a resultthe CTL model predicts about the same rate of change as theCPL model near t = 0, but note that the CPL and CTL evo-lutions diverge as the orbital period changes (n = 2π/P ) intothe past.
In Figure 16, we show the history of Par 1802 includingsolely the effects of CTL tidal evolution, once again for severalchoices of ψP . In this case, because there is much more energyin the orbit than in the stellar rotation, e and a do not evolvemuch (in the case of low ψP ) even though the stellar spins areevolving significantly. In all cases, the angular momentum isconserved to within a factor of five back to t = −1 Myr. If thesystem is evolved back further than this, the requirement that theforcing frequency (n in this case) be nearly constant fails. Thehigh ψP case in general conserves angular momentum poorly,due to the neglect of higher order ψ terms which are especiallyimportant for ψ ≈ 90◦. Again, because the Par 1802 system ispresumed to have a nominal age of ≈1 Myr, the calculationsbeyond t = −1 Myr are not reliable and are shown only forcontext. Moreover, the CTL model predictions for high ψP
should be regarded with caution. Finally, note that the behaviorsshown here are modified in our final treatment which includesthe effects of radial contraction.
REFERENCES
Baraffe, I., Chabrier, G., Allard, F., & Hauschildt, P. H. 1998, A&A, 337,403
Barnes, R., Greenberg, R., Quinn, T. R., McArthur, B. E., & Benedict, G. F.2011, ApJ, 726, 71
Cargile, P. A., Stassun, K. G., & Mathieu, R. D. 2008, ApJ, 674, 329Carpenter, J. M., Hillenbrand, L. A., & Skrutskie, M. F. 2001, AJ, 121, 3160Chabrier, G., Gallardo, J., & Baraffe, I. 2007, A&A, 472, L17Covino, E., Catalano, S., Frasca, A., et al. 2000, A&A, 361, L49Covino, E., Frasca, A., Alcala, J. M., Paladino, R., & Sterzik, M. F. 2004, A&A,
427, 637Covino, E., Melo, C., Alcala, J. M., et al. 2001, A&A, 375, 130D’Antona, F., & Mazzitelli, I. 1997, Mem. Soc. Astron. Ital., 68, 807Darwin, G. H. 1879, Phil. Trans. R. Soc., 170, 447 (reprint Scientific Papers,
Cambridge, Vol. II, 1908)Darwin, G. H. 1880, Phil. Trans. R. Soc. I, 171, 713Duval, V. G., Irace, W. R., Mainzer, A. K., & Wright, E. L. 2004, Proc. SPIE,
5487, 101Ferraz-Mello, S., Rodrıguez, A., & Hussmann, H. 2008, Celest. Mech. Dyn.
Astron., 101, 171Goldreich, P. 1966, AJ, 71, 1Goldreich, P., & Soter, S. 1966, Icarus, 5, 375Gomez Maqueo Chew, Y., Stassun, K. G., Prsa, A., & Mathieu, R. D. 2009, ApJ,
699, 1196Greenberg, R. 2009, ApJ, 698, L42Hauschildt, P. H., Allard, F., & Baron, E. 1999, ApJ, 512, 377Hebb, L., Stempels, H. C., Aigrain, S., et al. 2010, A&A, 522, A37Heller, R., Jackson, B., Barnes, R., Greenberg, R., & Homeier, D. 2010, A&A,
514, A22Heller, R., Leconte, J., & Barnes, R. 2011, A&A, 528, A27Hillenbrand, L. A. 1997, AJ, 113, 1733Honeycutt, R. K. 1992, PASP, 104, 435Horne, J. H., & Baliunas, S. L. 1986, ApJ, 302, 757Hut, P. 1981, A&A, 99, 126Irwin, J., Aigrain, S., Hodgkin, S., et al. 2007, MNRAS, 380, 541Jackson, B., Barnes, R., & Greenberg, R. 2009, ApJ, 698, 1357Kallrath, J., & Milone, E. F. 2009, in Eclipsing Binary Stars: Modeling and
Analysis, ed. J. Kallrath & E. F. Milone (New York: Springer), 82Khaliullin, K. F., & Khaliullina, A. I. 2011, MNRAS, 411, 2804Kirkpatrick, J. D., Henry, T. J., & McCarthy, D. W., Jr. 1991, ApJS, 77, 417Leconte, J., Chabrier, G., Baraffe, I., & Levrard, B. 2010, A&A, 516, A64Lin, D. N. C., Bodenheimer, P., & Richardson, D. C. 1996, Nature, 380, 606Lopez-Morales, M. 2007, ApJ, 660, 732Luhman, K. L. 1999, ApJ, 525, 466Mathieu, R. D., Baraffe, I., Simon, M., Stassun, K. G., & White, R. 2007, in
Protostars and Planets V, ed. B. Reipurth, D. Jewitt, & K. Keil (Tucson, AZ:Univ. Arizona Press), 411
Mazeh, T. 2008, in Tidal Effects in Stars, Planets and Disks, EAS PublicationsSeries, Vol. 29, ed. M.-J. Goupil & J.-P. Zahn (Les Ulis, France: EDPSciences), 1
Murray, C. D., & Dermott, S. F. 1999, in Solar System Dynamics, ed. C. D.Murray & S. F. Dermott (Cambridge, UK: Cambridge Univ. Press), 189
O’Dell, C. R., & Henney, W. J. 2008, AJ, 136, 1566Palla, F., & Stahler, S. W. 1999, ApJ, 525, 772Prsa, A., & Zwitter, T. 2005, ApJ, 628, 426Scargle, J. D. 1982, ApJ, 263, 835Schwarzenberg-Czerny, A. 1991, MNRAS, 253, 198Siess, L., Dufour, E., & Forestini, M. 2000, A&A, 358, 593Simon, M., & Obbie, R. C. 2009, AJ, 137, 3442Stassun, K. G., Mathieu, R. D., Cargile, P. A., et al. 2008, Nature, 453, 1079Stassun, K. G., Mathieu, R. D., Mazeh, T., & Vrba, F. J. 1999, AJ, 117, 2941Stassun, K. G., Mathieu, R. D., & Valenti, J. A. 2006, Nature, 440, 311Stassun, K. G., Mathieu, R. D., & Valenti, J. A. 2007, ApJ, 664, 1154Stassun, K. G., Mathieu, R. D., Vaz, L. P. R., Stroud, N., & Vrba, F. J. 2004, ApJS,
151, 357Stassun, K. G., van den Berg, M., Mathieu, R. D., & Verbunt, F. 2002, A&A,
382, 899Stempels, H. C., Hebb, L., Stassun, K. G., et al. 2008, A&A, 481, 747Stempels, H. C., & Piskunov, N. 2003, A&A, 408, 693Torres, G., & Ribas, I. 2002, ApJ, 567, 1140Whitney, B. A., Wood, K., Bjorkman, J. E., & Cohen, M. 2003, ApJ, 598,
1079Zahn, J.-P. 2008, in Tidal Effects in Stars, Planets and Disks, EAS Publications
Series, Vol. 29, ed. M.-J. Goupil & J.-P. Zahn (Les Ulis, France: EDPSciences), 67
Zahn, J.-P., & Bouchet, L. 1989, A&A, 223, 112
22