lyit institute (.«ulf c*»n«lon of technology · hplc method development & chemomelric...
TRANSCRIPT

lyiti n s t i t l ü ld T e i c n e o U io c h t i (.«Ulf C*»n«lon
i c t t e r k c n n y institute of T echno logy
High p e r fo r m a n c e liquid c h ro m a to g ra p h y method deve lopm ent and c hem om etr ic analys is o f ecstasy and cocaine
K im M cFadden
SupervisorsDr. B. F. Carney, Letterkenny Institute of Technology
Dr. D. O'Driscoll, Forensic Science Laboratory, Dublin
Submitted to Higher bducation and Training Awards Council (HETAC) in fulfilment for the requirements for the degree of Doctor o f Philosophy

HPLC method development & chemomelric analysis of ecstasy & cocaine
Declaration
I hereby declare that the work herein, submitted for Ph.D. in Analytical Science at
Letterkenny Institute of Technology, is the result of my own investigation, except
where reference is made to published literature. I also certify that the material
submitted in this thesis has not been previously submitted for any other qualification.
Kim McFadden
1

HPLC method development & chemometric analysis of ecstasy & cocaine
Table of Contents
Declaration 1
Abstract 5
List of Abbreviations 7
List of Figures 10
List of Tables 14
List of Presentations and Publications 16
Acknowledgments 18
Chapter 1: Literature review. 19
1.1. Introduction. 20
1.2. Drugs of abuse. 21
1.2.1. Narcotics. 22
1.2.2. Depressants. 24
1.2.3. Stimulants. 24
1.2.4. Hallucinogens. 25
1.2.5. Ecstasy. 26
1.2.6. Cocaine. 31
1.3. Current analytical techniques for forensic drug analysis. 34
1.3.1. Spectrometric methods. 34
1.3.2. Chromatographic methods. 36
1.4. Fundamentals of High Performance Liquid Chromatography. 40
1.4.1. Chromatographic interactions. 40
1.4.2. Mobile phase. 41
1.4.3. The column. 42
1.4.4. Applications of monolithic columns in the area of forensic
drug analysis. 45
1.5. Chemometrics and statistical profiling. 50
1.5.1. Experimental design. 50
1.5.2. Drug classification. 52
1.5.3 Application of chemometrics to illicit drug profiling. 57
1.6. Legislation and control efforts in Ireland. 61
1.7. Aims and objectives. 63
2

HPLC method development & chemometric analysis of ecstasy & cocaine
Chapter 2: Materials and methods. 66
2.1. General materials and instrumentation. 67
2.1.1. Chemicals and reagents. 67
2.1.2. Liquid chromatography system. 67
2.1.3. Atomic absorption spectrometry. 68
2.1.4. Miscellaneous instruments. 68
2.1.5. Computer software. 68
2.2. Univariate HPLC method development for the analysis of ecstasy. 69
2.2.1. Ecstasy standards and sample preparation. 69
2.2.2. Univariate method development for analysis of ecstasy. 71
2.2.3. Validation of univariate method-developed. 73
2.3. Multivariate HPLC method development for the analysis
of cocaine. 74
2.3.1. Cocaine standards and sample preparation. 74
2.3.2. Multivariate method development for analysis of cocaine. 75
2.3.3. Validation of multivariate method developed. 79
2.4. Sugar analysis. 79
2.5. Metal analysis. 79
2.6. Data analysis and chemometric procedures. 81
2.6.1. Ecstasy data and pre-treatments. 81
2.6.2. Ecstasy data pattern recognition. 82
Chapter 3: HPLC method development. 85
3.1. Univariate HPLC method development for the analysis of ecstasy. 86
3.1.1. Chromatographic factors. 86
3.1.2. Selection of optimal HPLC conditions for ecstasy
sample analysis. 92
3.1.3. Comparison of particulate and monolithic columns. 98
3.1.4. Validation of univariate method developed. 101
3.1.5. Conclusions. 105
3.2. Multivariate HPLC method development for the analysis
of cocaine. 106
3.2.1. Multivariate method development. 106
3.2.2. Response surfaces. 113
3

HPLC method development & chemometric analysis of ecstasy & cocaine
3.2.3. Validation of multivariate method developed. 116
3.2.4. Conclusions. 118
Chapter 4: Physical and chemical analysis of illicit drug samples. 119
4.1. Ecstasy analysis. 120
4.1.1. Physical profile of ecstasy. 120
4.1.2. Chemical analysis of ecstasy. 124
4.1.3. General profiling of ecstasy. 128
4.1.4. Discussion. 132
4.2. Chemical analysis o f cocaine. 136
4.2.1. Discussion. 139
4.3. Conclusions. 141
Chapter 5: Chemometrics and statistical profiling of ecstasy tablets. 143
5.1. Introduction. 144
5.2. Ecstasy data pre-treatment methods. 144
5.3. Ecstasy data pattern recognition methods. 149
5.3.1. Principal component analysis. 149
5.3.2. Hierarchal cluster analysis. 153
5.3.3. Pearson’s correlation coefficient. 159
5.4. Supervised pattern recognition methods. 165
5.5. Conclusions. 171
Chapter 6: Conclusions and future work. 173
6.1. Method development. 174
6.2. Analysis of illicit drug samples. 175
6.3. Chemometrics and statistical profiling of ecstasy samples. 176
6.4. Establishing a profiling protocol in a forensic laboratory. 177
6.5. Future studies on the current major drugs in Ireland. 178
References 181
Appendices 209
4

HPLC method development & chemometric analysis of ecstasy & cocaine
AbstractConsumption of illegal drugs of abuse remains a major social issue aligned with a
global law-enforcement priority. Forensic analysts are faced with the challenge of
continually developing sophisticated methods of analysis to combat the increasing
variability that occurs in illicit drug samples. Research work for this thesis has
focused on the development of High Performance Liquid Chromatography (HPLC)
methods for the analysis of major drug constituents associated with ecstasy and
cocaine illicit drug samples. Emphasis has been placed on method development with
strategies of univariate or multivariate experimental approaches used in the selection
and optimisation of procedures. Considerations with regard to the choice of
chromatographic factors, solutes under investigation and the provision of quality
assurance data throughout the research work have been the main criteria in methods
developed. Two HPLC methods were developed to qualitatively and quantitatively
assay for the major drug components and analogue derivatives found in ecstasy and
cocaine. Methods developed have undergone validation studies including intra- and
inter- reproducibility, accuracy, and linearity of calibration, limit of detection (LOD)
and limit of quantification (LOQ) and the use of internal standards. Applications of
methods to ecstasy and cocaine samples seized in Ireland ensured their suitability for
routine analysis of illicit drug samples.
As part of this study, chemical profiling of 183 ecstasy tablets seized in Ireland during
2002-2004 were recorded as discrete data sets. Chemical data sets include both the
quantification and occurrence in individual tablets of the major amphetamine
components (i.e. MDA, MDMA, MDEA, MBDB methamphetamine and
amphetamine), adulterant components (i.e. caffeine, phenacetin, acetaminophen and
acetylsalicylic acid), excipients components (i.e. sucrose, glucose, lactose, fructose,
mannitol, sorbitol and inositol) and inorganic components (i.e. Al, Zn, Fe, Mg, Ca, Cr,
Pb, Na and K ). Chemometrics, including unsupervised methods of principal
component analysis (PCA), hierarchical cluster analysis (HCA) and Pearson’s
correlation coefficient, as well as supervised methods of linear discriminant analysis
(LDA) and artificial neural networks (ANN) was applied to the chemical data sets to
demonstrate the ability of the statistical approach to linking sample seizures. HCA
and ANN were the numerical methods that most efficiently distinguished between
5

HPLC method development & chemometric analysis of ecstasy & cocaine
linked and unlinked seizures. Eleven groups were identified from the chemical data
sets with group classification dependant on the main amphetamine, adulterant and
excipient components present. The benefits from this study can provide strategic
intelligence and an understanding of the operational level on the Irish ecstasy market
and help evaluate the changing profile or dynamics associated with this illegal market
supply.
6

HPLC method development & chemometric analysis of ecstasy & cocaine
List of Abbreviations
2C-B 4-bromo-2, 5-dimethoxyphenethylamine
A Amphetamine
AA Atomic absorption
ACN Acetonitrile
ADRU Alcohol and drug research unit
ANN Artificial neural networks
ASA Acetylsalicylic acid
ATS Amphetamine - type - stimulants
BZP 1 - Benzylpiperazine
CE Capillary electrophoresis
CV Coefficient of variation
DAD Diode array detection
DAP Drug awareness programmme
DEA Drug enforcement agency
DIMS Drugs information monitoring system
DOB 4-bromo-2, 5-dimethoxyamphetamine
DOM 4-Methyl-2, 5-dimethoxyamphetamine
ECD Electron capture detector
ELSD Evaporative light scattering detection
EMCDDA European monitoring centre for drugs and drug addiction
ENFS1 European network of forensic science institutes
FID Flame ionization detector
GBL Gamma - butyrolactone
GC Gas chromatography
GC-MS Gas chromatography-mass spectrometry
GHB Gamma hyrdoxybutyric acid
HCA Hierarchal cluster analysis
HPLC High performance liquid chromatography
HETP Height equivalent to theoretical plate
HRB Health research board
ICH International conference on harmonisation
IEC Ion-exchange chromatography
7

HPLC method development & chemometric analysis of ecstasy & cocaine
INCB International narcotics control board
INEF Irish needle exchange forum
IR Infra red
k’ Retention factor
k’ave? Average retention factor
KNN K-nearest neighbour
LC Liquid chromatography
LC-MS Liquid chromatography-mass spectrometry
LDA Linear discriminant analysis
LLE Liquid-liquid extraction
LOD Limit of detection
LOQ Limit of quantification
LSD Lysergic acid diethylamide
MAOC-N Maritime analysis and operations centre - narcotics
MDA 3, 4-Methylenedioxyamphetamine
MDEA 3, 4-Methylenedioxy-N-ethylamphetamine
MDMA 3 ,4-Methylenedioxymethamphetamine
MBDB N-methyl-1 -1 -(1, 3-benzdioxoI-5-yl)-2-butanamine
mCPP (1 -(3 -chlorophenyl) piperazine)
MEKC Micellar electrokinetic chromatography
MLP Multilayer perceptron
MS Mass spectrometer
N Efficiency
Nave Average efficiency
NACD National advisory committee on drugs
NIR Near Infra Red
NDST National drugs strategy team
NPD Nitrogen-phosphorus detector
NMR Nuclear magnetic resonance
ODS Octadecyl-bonded silica
PC A Principal component analysis
PC? Phenylcyclohexylpiperidine
PLS Partial least squares
8

HPLC method development & chemometric analysis of ecstasy & cocaine
PMMA /7-methoxymethamphetamine
R Resolution
Rave Average resolution
RBF Radial base functions
RI Refractive index
RP Reversed phase
Rt Retention time
RSD Relative standard deviation
SEC Size exclusion chromatography
SPE Solid-phase extraction
SD Standard deviation
SSRI Selective serotonin reuptake inhibitors
THC T etrahydrocannabinol
TLC Thin-layer chromatography
UN United Nations
UNODC United Nations Office of Drugs and Crime
UV Ultraviolet
WCO World Customs Organization
WHO World Health Organisation
9

HPLC method development & chemometric analysis of ecstasy & cocaine
List of Figures
Figure 1.1. Number of seizures of cocaine, ecstasy, heroin, amphetamine 21and cannabis in Ireland, years 1995 - 2009.
Figure 1.2. Chemical structures of narcotics, depressants, stimulants and 23hallucinogens.
Figure 1.3, The reductive animation route for the synthesis of MDMA. 27
Figure 1.4, The synthesis of 3, 4 - (Methylenedioxy) phenyl - 2 - propanone 28using safrole as a precursor.
Figure 1.5. The safrole bromination route for the synthesis of MDMA. 28
Figure 1.6, The Leuckart reaction route for the synthesis of MDMA. 29
Figure 1.7. Chemical structures of the typical adulterants associated with 30
ecstasy tablets.
Figure 1.8. A selection of seized ecstasy tablets with different logo imprints. 31
Figure 1.9. Chemical structures of the typical adulterants associated with 32cocaine.
Figure 1.10. Flow diagram of each step involved in the clandestine 33manufacture of cocaine.
Figure 1.11. Monomeric vs. polymeric Cl 8 bonding 44
Figure 1.12. SEM - image of the porous structure of a typical monolithic 46 silica column.
Figure 1.13. A typical Van Deemter plot for a 5 fim particle size column, a 463.5 ^m particle size column and a monolithic column.
Figure 1.14. A typical neural network consisting of two input variables, one 51layer of six units and one output variable.
Figure 1.15. Simple HCA dendogram. 55
Figure 1.16. Score plot of first two principal components. 56
Figure 2.1. Distribution and percentage of ecstasy batch seizures used in this 70study.
Figure 2.2. Schematic representation of the stages involved in the 78multivariate HPLC method development for cocaine analysis.
Figure 3.1. Chromatogram of the six ecstasy standard mixture resolved with 87the XTerra RP18 column at 5% and 15% acetonitrile solvent concentration.
10

HPLC method development & chemometric analysis of ecstasy & cocaine
Figure 3.2.
Figure 3.3.
Figure 3.4.
Figure 3.5.
Figure 3.6.
Figure 3.7.
Figure 3.8.
Figure 3.9.
Figure 3.10.
Figure 3.11.
Figure 3.12.
Figure 3.13.
Chromatogram of the six ecstasy standard solution resolved with 88the Phenosphere C l8 column under gradient elution and isocratic elution conditions.
Chromatogram of the six ecstasy standard solution resolved on 89the Luna C18 at five temperatures: 25°C, 30°C, 35°C, 40°C and 45°C.
Chromatogram of the six ecstasy standard solution separated on 90the Phenosphere C l8 column at five flow rates: 1, 1.25, 1.5, 1.75 and 2 mL min'1.
Chromatogram of the six ecstasy standard solution resolved on 93Luna C8. Final chromatographic conditions were 90% buffer:10% acetonitrile, 0.4 mL min*1, pH 3, 30°C,
Chromatograms of the six standard solution resolved on the 93Phenosphere C l8. Final chromatographic conditions were T0 90% buffer: 10% acetonitrile going to T10 60% buffer: 40% acetonitrile B, 1.75 mL min*1, pH 3, 35°C.
Chromatogram of six ecstasy standard solution resolved on Luna 94Cl 8. Final conditions were 87% buffer: 13% acetonitrile, 0.4 mL min1, pH 3, 35°C,
Chromatogram of the six ecstasy standard solution resolved on 94Xterra RP18. Final chromatographic conditions were 95% buffer: 5% acetonitrile, 0.3mL min1, pH 3, 30°C,
Chromatogram of the six ecstasy standard solution resolved on 95Chromolith Performance RP18, 100 x 4.6 mm. Finalchromatographic conditions were 97% buffer: 3% acetonitrile,8.5 mL min1, pH 2.5, 30°C.
Chromatogram of the six ecstasy standard solution resolved on 95Chromolith SpeedROD, RP18, 50 x 4.6 mm. Finalchromatographic conditions were 97% buffer: 3% acetonitrile,4.5 mL min1, pH 2.5, 30°C.
Chromatogram of the six ecstasy standard solution resolved on 96the Chromolith Flash RP18, 25 x 4.6 mm. Final chromatographic conditions were 97% buffer: 3% acetonitrile, 1.5 mL min'1, pH2.5, 30°C.
Chromatogram of the six standard solution resolved on the 99Chromolith SpeedROD, RP-18, 50 x 4.6 mm column at nine flow rates.
Comparison of column backpressure as a function of flow rate 100for the XTerra RP18 particulate column and the three Chromolith RP18 monolithic columns.
11

HPLC method development & chemometric analysis of ecstasy & cocaine
Figure 3.14.
Figure 3.15.
Figure 3.16.
Figure 3.17.
Figure 3.18.
Figure 3.19.
Figure 3.20.
Figure 3.21.
Figure 4.1.
Figure 4.2.
Figure 4.3.
Figure 4.4.
Figure 4.5.
Figure 4.6.
Figure 4.7.
Fitted van Deemter curves of the plate height (H) vs. Flow rate 100for the XTerra RP18 particulate column and three Chromolith RP-18 columns.
Selectivity tests showing the separation of amphetamines, 102adulterants and internal standard on the Chromolith SpeedROD,RP18, 50 mm x 4.6 mm. The chromatographic conditions were phosphate buffer/acetonitrile (97/3, v/v) maintained in an isocratic mode with pH at 2.5, temperature at 30 °C. The top chromatogram is at a flow rate of 4.5 mL min-1 and the bottom chromatogram is at 3 mL min-1.
Linear regression of predicted versus observed values for k’avc 112data set using the ANN of RBF 4:4-2-l:l.
Illustration of the ANN RBF 4:4-2-1:1. 112
Response surface of Rave values with acetonitrile and pH using 113the ANN of RBF 4:4-2-l:l.
Response surface of Ravc values with acetonitrile and temperature 113using the ANN of RBF 4:4-2-l :1.
Response surface of Ravc values with acetonitrile and ionic 113strength using the ANN of RBF 4:4-2-1:1.
Chromatogram of the eight analytes including the internal 115standard, metoclopramide using the optimised chromatographic conditions. The mobile phase was phosphate buffer/acetonitrile (85/15, v/v) and flow rate was 1 mL min-1. Temperature was maintained at 35°C, pH 3, and detection was at 200 nm.
An image of all 21 logo types with the corresponding seizure 122batch numbers for ecstasy samples used in this study.
Distribution of weights within the 183 tablets analysed. 123
Distribution of tablet diameters within the 183 tablets analysed. 123
Distribution of tablet thickness within the 183 tablets analysed. 124
Examples of ecstasy tablet colour types reported in this study. 124
Components of a sample ecstasy tablet resolved on the 125Chromolith SpeedROD, RP18, 50 x 4.6 mm. Thechromatographic conditions were phosphate buffer/acetonitrile (97/3 v/v) maintained in an isocratic mode, pH 2.5, temperature 30°C and flow rate of 3 mL min'1. Detection was recorded at 200 nm.
Sugar components of an ecstasy tablet resolved on the 128Phenomenex Luna NH2 column, 250 x 4.6 mm. Conditions were acetonitrile/water (70/30), temperature of 30 °C.
12

HPLC method development & chemometric analysis of ecstasy & cocaine
Figure 4,8»
Figure 4,9.
Figure 5.1,
Figure 5,2,
Figure 5.3,
Figure 5,4,
Figure 5.5,
Figure 5.6,
Figure 5.7.
Figure 5.8,
A digital image and properties of tablets from seizure 37 and 131 seizure 35.
Components of a cocaine sample resolved on the Waters 139XBridge C18 50 x 4.6 mm, particle size 3.5 \im column, The chromatographic conditions were phosphate buffer/acetonitrile (85/15 v/v) maintained in an isocratic mode, pH 3, temperature 35 °C and flow rate of 1 mL min'1. Detection was recorded at 200 nm,
PCA score plots for normalised data pre-treatment methods. (A) 149normalised data, (B) normalized & logarithm data and (C) normalised & 4th square root data.
PCA score plots for standardised data pre-treatment methods. 150(A) standardised data, (B) standardised & logarithm data and (C) standardised & 4lh square root data.
PCA score plot of the first two components using the AS data 152set,
PCA score plot of the first two components using the MD data 153set.
PCA score plot of the first two components using the DC data 154set,
HCA dendogram using Between Groups with Squared Euclidean 156for eight selected seizures. The number of clusters formed was dependent on the Euclidean distance measure employed.
Dendogram for AS data set illustrating four clusters A, B, C, and 159D with eleven discrete HCA groups. Expanded section highlights the region for HCA groups IV and IX and illustrates the linkage of the two ecstasy sample outliers 49.3 and 53.3 at Euclidean distance 1, 2 or 6.
Relative distribution of ecstasy seizures examined in this study 171by HCA and MLP 6:6-10-11:1 neural network group classification.
13

HPLC method development & chemometric analysis of ecstasy & cocaine
Table 1.1.
Table 2.1.
Table 2.2,
Table 2,3.
Table 2.4.
Table 2.5.
Table 3.1.
Table 3.2.
Table 3.3.
Table 3.4.
Table 3.5.
Table 3.6.
Table 3.7.
Table 3.8.
Table 4.1.
Table 4.2.
Table 4.3.
List of Tables
Chemical characteristics of typical HPLC solvent mobile phases. 41
Physical characteristics of stationary phase columns examined for 72univariate HPLC method development analysis of ecstasy.
A 25'1 fractional factorial experimental design for multivariate 76method development generated using Minitab software. Chromatographic factors examined included, A: % Acetonitrile;B: pH; C: Temperature (°C); D: Ionic strength (mM) and E: Flow rate (mL min~l),
Optimum conditions for graphite furnace Atomic Absorption 80spectrometer.
Optimum conditions for flame Atomic Absorption spectrometer. 80
Chemical composition of the eight selected ecstasy seizures used 82in pre-treatment studies.
Performance indicators for each column for the separation of 92ecstasy compounds.
Linearity studies for the Chromolith SpeedROD, RP18, 50 x 4.6 103mm.
Validation studies for the Chromolith SpeedROD, RP18, 50 x 4.6 104mm. Six amphetamine standards were tested for intra-day precision, inter-day precision, accuracy, limit of detection (LOD) and limit of quantification (LOQ) under ICH guidelines.
Experimental retention factor (k*) values and k’ave values obtained 108for eight cocaine analytes in sixteen'discrete experiments,
Experimental resolution (R) values and Rave values obtained for 109eight cocaine analytes in sixteen discrete experiments.
Experimental efficiency (N) values and Nave values obtained for 110eight cocaine analytes in sixteen discrete experiments.
The best performing ANN for each of the experimental data sets. 111
Validation studies for the Waters XBridge Cl 8 50 x 4.6 mm. 117
Major drug components present in 183 samples of ecstasy 126tablets from Ireland.
Sugars present in 183 samples of ecstasy seized in Ireland. 129
Concentration (ppm) of inorganic elements and occurrence in 130ecstasy tablet samples.
14

HPLC method development & chemometric analysis of ecstasy & cocaine
Table 4.4,
Table 5.1.
Table 5,2,
Table 5.3.
Table 5.4.
Table 5.5.
Table 5.6.
Table 5.7.
Table 5.8.
Major drug, sugar and adulterant components (mg/50mg of 140sample) detected in 28 cocaine seizures used in this study,
HCA outcomes of data pre-treatment methods for eight selected 151ecstasy seizures.
Number of clusters for eight discrete seizures determined by 155different HCA clustering methods.
Number of clusters for eight discrete seizures determined by 156different HCA interval methods.
Summary of the active ingredients and sugar components (mg/g) 160for HCA classification of ecstasy seizures used in this study.HCA cluster groups and seizure batch numbers are described in Figure 5.1 and Table 5.6, respectively.
Pearson correlation coefficients sample matrix for the three 162replicates of each sample seizure 13 and 14. Minimum threshold values (highlighted in red) for seizure 13 and 14 are 97.97 and 98.31, respectively. Shaded section indicates poor correlation between sample replicates of seizure 13 and 14 due to low threshold values. Pre-treated AS data set was used in this example.
Seizure numbers for groups identified using unsupervised pattern 165recognition methods of PC A, HCA or Pearson’s correlation for active drug and sugar (AS) data sets.
Linear discriminant analysis percentage correct classification rates 166for the number of groups identified by Principal component, Hierarchal cluster and Pearson’s correlation pattern recognition methods,
Optimal artificial neural networks selected for HCA and Pearson’s 168group classification of AS data set.
15

HPLC method development & chemometric analysis of ecstasy & cocaine
List of Presentations and Publications
Publications
McFadden K,, Gillespie E. (2011). The identification of abused counterfeit drugs.
(In prep).
McFadden, KL, Carney, B., O’Driscoll, D. (2011). An optimised method using
experimental design and response surfaces for the chemical analysis of cocaine using
high-performance liquid chromatography. Journal of Chromatography A (In prep).
McFadden, K., Carney, B., O’Driscoll, D. (2011). The statistical analysis of ecstasy
tablets. Forensic Science International (In prep).
McFadden, K,, Carney B. (2010). The use of monolithic columns for the analysis of
drugs of abuse. In: Monolithic chromatography and its modern applications. (Wang
P., ed). ILM publications, UK, pp 521 - 537,
McFadden, K., Gillespie, J., Carney, B,, O’Driscoll, D. (2006). Development and
application of a High Performance Liquid Chromatography method using monolithic
columns for the analysis of Ecstasy tablets. Journal of Chromatography A, 1120
(2006) 54-60
Conference Presentations
McFadden, K. (2011). The use of monolithic columns in the analysis of drugs of
abuse. Presented at Pittcon International Analytical Chemistry Conference 2011, 13th-
18th March 2011, Georgia World Congress Center, Atlanta, Georgia, USA.
McFadden, K., Gillespie, J., Carney, B., O ’Driscoll, D. (2005). The analysis of
ecstasy tablets in Ireland by HPLC-DAD. The 29th International Symposium on High
Performance Liquid Phase Separations and Related Techniques (June 2005),
Stockholm, Sweden.
16

HPLC method development & chemometric analysis of ecstasy & cocaine
McFadden, K, (2004). Forensic analysis of ecstasy using liquid chromatography.
Presented at the Institutes of Technology Science and Computing Research
Colloquium, Waterford Institute o f Technology, 26th - 28th May 2004.
McFadden, K. (2004). Forensic analysis of ecstasy using liquid chromatography:
Investigation into the variation of MDMA tablets. Presented at the Irish Research
Council for Science, Engineering and Technology symposium, Dublin November
2004.
McFadden, K, (2003). An investigation into the variation of MDMA in ecstasy
tablets. Presented at the Irish Research Council for Science, Engineering and
Technology symposium, Dublin November 2003,
17

HPLC method development & chemometric analysis of ecstasy & cocaine
Acknowledgements
I would like to express my sincere gratitude to my supervisors Dr. Brian Carney,
Science Department, Letterkenny Institute of Technology and Dr. Dan O’Driscoll,
Drug Section, Forensic Science Laboratory, Dublin, for their advice and their
instruction over the course of study. I would like to express my gratitude to the Garda
Forensic Science Laboratory, Dublin, for the provision of ecstasy and cocaine samples
used in this study.
I would like to thank everyone at Letterkenny Institute of Technology for their help
and friendliness throughout the research and in particular Mr. John Gillespie, for his
guidance and assistance with all matters chromatography related and beyond. Thanks
to Mr. Ken McIntyre for the cups of coffee, banter and unlimited bottles of methanol,
and of course his invaluable technical support. A special thanks to my travel partner,
Dr. Eoin Gillespie, your assistance in the final stages of my research is gratefully
acknowledged. To all my friends and colleagues at CAMBio that I have had the
pleasure of getting to know since starting this project.
Thanks to Dr. David Kennedy and Dr. Jonathan Campbell (RIP) at Letterkenny
Institute of Technology and Dr. Niamh Nic Daeid, University of Strathcylde, Glasgow
for all their assistance with statistics
I would also like to acknowledge the financial support for this project that was
provided by the Irish Research Council for Science, Engineering and Technology
(IRCSET) funded under the National Development Plan 2000 - 2006.
Special thanks to my family for their encouragement and support. Finally to Rory,
Daniel and Niall, thank you for everything.
18

HPLC method development & chemometric analysis of ecstasy & cocaine
Chapter 1: Literature review
19

HPLC method development & chemometric analysis of ecstasy & cocaine
1.1. Introduction.
Illegal drugs remain a dominant social issue. Drug related deaths are on the rise,
crime levels are escalating and seizures of drugs are at record levels. It is a major
concern globally for all law enforcement agencies. To conquer this ever growing
drug problem, efforts have been made at government level, both nationally and
internationally, to curtail the production, trafficking and distribution of illegal drugs.
Tighter controls at ports and borders, reduction of cultivation fields in Columbia and
Afghanistan and establishing international drug intelligence agencies are a few
measures made to control the drug situation.
One key area identified was the importance of background intelligence concerning
drug seizures. Drug characterisation studies have shown that it is possible to link
samples, to classify material from different seizures into groups of related samples
and to identify the origin of such samples (United Nations International Drug Control
Programme, 2001). In 1996, the Commission on Narcotic Drugs (United Nations)
acknowledged the need for united international policy in the field of drug
characterisation and impurity profiling. At European level, the European council
launched a strategic plan, the EU Drugs Strategy (2005-2012) on how to ‘solve5 the
drug problem (Council for the European Union, 2004). Within this, they recognised
that the reduction of the supply of drugs was a key factor. Central to this was the
proposal to “adopt and implement and EU wide system for the forensic profiling of
drugs”. In Ireland, policy makers had a more general view on this and it is
documented in the ‘National Drugs Strategy 2009 - 20165 (Department of
Community, Rural and Gaeltacht Affairs, 2009). In this, one of the five strategic aims
is “To create a safer society through the reduction of the supply and availability of
drugs for illicit use”, in which an objective is “To disrupt the activities of organised
criminal networks involved in the illicit drugs trade in Ireland and internationally and
to undermine the structures supporting such networks”. One other strategic aim is
“To ensure the availability of accurate, timely, relevant and comparable data on the
extent and nature of problem substance use in Ireland” and within this, an objective is
“To ensure the availability of data to accurately inform decisions on initiatives to
tackle problem substance use”. In order to meet these objectives, research on the drug
situation in this country is essential.
iI20

HPLC method development & chemometric analysis of ecstasy & cocaine
1.2. Drugs of abuse.
The variety of illegal drugs currently available in the fmarket p lace’ can be
categorized into four major pharmacological groupings. Narcotics include opiates
such as opium, morphine and heroin. Depressants are sedatives that provide
relaxation from anxiety and include barbiturates and benzodiazepines. Stimulants
such as cocaine and amphetamines increase the actions within the central nervous
system resulting in intoxication and often aggressive behaviour. Finally,
hallucinogenic agents provide a sense of euphoria to users and include LSD (lysergic
acid diethylamide), amphetamines (ecstasy) and cannabis. Regardless, all categories
are considered illegal when sold on the ‘street market’ and are totally unregulated and
have limited medical benefit. Forensic analysts are therefore faced with the challenge
of continually developing sophisticated methods of analysis to struggle with the
increasing variability that occurs in ‘street samples \
-•-Cocaine -»-Ecstasy Heroin Amphetamine »-Cannabis
Year
Figure 1.1. Number of seizures of cocaine, ecstasy, heroin, amphetamine and cannabis in Ireland, years 1995 - 2009. (Source: EMCDDA Annual Report, 2010).
21

HPLC metliod development & chemometric analysis of ecstasy & cocaine
Cannabis has been long established as the most popular drug of abuse among young
adults. Until recently amphetamine and its relative designer drugs, such as ecstasy,
were the most widespread after cannabis in European and Irish illegal market (Figure
1.1). Since 2000, cocaine and heroin have overtaken ecstasy as the second most
abused illicit drug which is a trend confirmed by the European Monitoring Center for
Drugs and Drugs Addiction (EMCDDA Annual Report, 2008). National surveys by
the National Advisory Committee on Drugs (NACD Annual Report, 2007) indicate
that drug use is on the increase in Ireland. Illegal drug use during this time period
increased from 18.5% to 24%. The prevalence of cocaine has risen from 3% to 5.3%
and ecstasy from 3.7% to 5.4%. These figures are higher that the European average,
with 3.6% for cocaine and 2.8% for ecstasy abuse.
1.2.1, Narcotics.
A narcotic is a term that describes a drug that produces narcosis, unconsciousness or
sleep. Included in this group of drugs are opiates or any opiate derivative. The opiates
are a large group of compounds that are produced from opium, which is found in the
poppy Papaver somniferum. Opium itself contains morphine, thebaine, codeine and
papaverine, from which heroin and hydrocodone can be synthesised.
First synthesised in 1874, heroin is the 3,6-diacetyl ester o f morphine, and is
chemically known as ‘Diacetylmorphine’ (Figure 1.2). Most commonly injected,
heroin is a painkiller and produces euphoria. Street heroin is typically a brown
powder, less commonly white, and likely to be produced in Afghanistan. In 2006,
purity levels ranged from 15% to 25% for the brown powder and 45% to 70% for the
white powder (EMCDDA Annual Report, 2008). Hydrocodone (Figure 1.2) was first
produced in Germany in 1920 from codeine and thebaine, It is a narcotic analgesic
and has a high abuse risk. It is usually found in combination with acetaminophen or
ibuprofen in tablet or syrup form. Commercially it has many trade names, eg.
‘Vicodin’. Oxycodone is another semi-synthetic opioid with high abuse potential,
which is derived from codeine.

HPLC method development & chemometric analysis o f ecstasy & cocaine
Narcotics
Hydrocodone
Depressants
Barbituric Acid
Stimulants
Caffeine Cocaine
Hallucinogens
MDA MDMA
MDEA
Figure 1.2. Chemical structures of narcotics, depressants, stimulants and hallucinogens.
23

HPLC method development & chemometric analysis o f ecstasy & cocaine
1.2.2. Depressants.
Depressants are drugs that act as a sedative on the central nervous system. They
reduce an individual’s capabilities by increasing the activity o f gamma-aminobutyric
acid (GABA). The most common legal depressant is alcohol. Alcohol is one of the
most common drugs of abuse. Ethanol is the active drug, which is classified as
“psychoactive”, meaning it acts on the central nervous system, altering brain function.
The category of alcohol can be divided into beers, wines and spirits. Alcohol content
ranges from 4% to upwards of 40% and production of alcohol is not limited by
geography.
Common illegal depressants include barbiturates and benzodiazepines (Figure 1.2).
Barbiturates are a group of depressants derived from barbituric acid. They are mostly
used as a hypnotic and an anticonvulsant. Recently they have been largely replaced
by benzodiazepines owing to the less potential of a lethal overdose. Benzodiazepines
are a group of drugs that are similar to barbiturates in medical use (hypnotic,
anticonvulsant, sedative) and they have also been used for withdrawal from alcohol
and other drugs. They are produced most commonly as tablets and capsules. The
most popular benzodiazepine is diazepam or ‘Valium’. More recently, sexual assaults
have been reported to use flunitrazepam or ‘RohypnoF as a sedative before the
assaults. Fluoxetine hydrochloride, or ‘Prozac’ is the third most commonly prescribed
antidepressant in the United States, after sertraline or ‘Zoloft’ and escitalopram or
‘Lexapro’. These are known as ‘selective serotonin reuptake inhibitors’ (SSRIs) and
are the standard drugs prescribed for depression. Because of their effects, these
antidepressants are commonly abused.
1.2.3. Stimulants.
Stimulants increase activity in the central nervous system. They boost consciousness,
produce euphoria, and raise alertness. The more common legal stimulants include
nicotine and caffeine. Nicotine is a chemical found in tobacco, the average cigarette
contains 1 mg nicotine. This highly addictive drug is thought to combat anxiety and
stress, help concentration and reduce appetite. Caffeine is a psychoactive drug and
chemically is a bitter white crystalline xanthine alkaloid (Figure 1.2). It is naturally
24

1IPLC method development & chemometnc analysis o i ecstasy & cocaine
occurring in many plants, but primarily found in the cocoa bean. It is both legal and
unregulated.
Cocaine is a semi-synthetic drug derived from the leaves of the cocoa plant and is the
more popular illegal stimulant. Its chemical name is benzoylmethyl ecgonine (Figure
1.2) and it is a crystalline tropane alkaloid. It is categorised as a stimulant; more
specifically it is a dopamine reuptake inhibitor, a noradrenalin reuptake inhibitor and a
serotonin reuptake inhibitor. Due to its addictive nature, cocaine has always been a
popular street drug and has overtaken ecstasy as the second most popular drug of
abuse in Europe (EMCDDA Annual Report, 2008).
1.2.4. Hallucinogens.
Hallucinogens are a group of drugs that change the state of mind of the user to such an
extent that reality is altered. Common members include cannabis and Lysergic Acid
Diethylamide (LSD). Cannabis is the most common illegal drug in Europe today.
Unlike the opiates and cocaine where production is concentrated in the one
geographical area. Cannabis saliva L. can be grown in many environments. The
principal active ingredient in cannabis is A*'- tetrahydrocannabinol. It exists in three
different physical forms; cannabis resin, herbal cannabis and the less common
cannabis oil. In many countries, cannabis is seen as a ‘soft' drug, and legal
prosecutions can vary from fines to cautions. Lysergic Acid Diethylamide (LSD) is a
semi synthetic hallucinogen. Produced as a sheet of absorbent paper, users tear off
tiny squares for their dose. This drug is not as popular as it was in the 1960’s and
I970‘s, and the Drug Enforcement Administration (DEA) reported seizures had
declined 100% from 2000 to 2005.
Amphetamine - Type - Stimulants (ATS) is a large group of synthetic compounds of
which amphetamine is the chief drug. ATS can be categorised as either stimulant or
hallucinogen due to their wide and varied psychological effects, and their ultimate
classification is dependent on the scientist. In total, this group comprises
amphetamine, methamphetamine and all ring-substituted analogues (Figure 1.2),
however, new members arc frequently being synthesized. These drugs act by
increasing levels of norepinephrine, serotonin, and dopamine in the brain.
25

HPLC method development & chemometric analysis of ecstasy & cocaine
Amphetamine was first synthesized in 1887 in Germany, Its chemical name is 7V,a-
methylbenzeneethanamine. It is a white or off-white powder but can appear in tablet
form. Purity levels range from 2% to 47% in powders and up to 40 mg in tablets
(EMCDDA). It is legally used in the treatment o f attention-deficit disorder (ADD) and
attention-deficit hyperactivity disorder (ADHD). Brand names of the drugs that
contain amphetamine include ‘Adderall’, ‘Vyvanse’, and ‘Dexedrine’,
Methamphetamine was first produced in Japan in 1919. Its chemical name is N,a-
dimethylbenzeneethanamine, Like amphetamine, it is found as a white powder or in
tablet form. Purity levels range from 20% to 55% in powders and up to 40 mg in
tablets. It has also been used as an adulterant in ecstasy tablets and has some limited
medical use.
The most common member of the ATS group is 3,4 -methylenedioxy- N -
methylamphetamine (MDMA), or ‘Ecstasy5, and is categorized as a stimulant and is
mildly hallucinogenic, Initially produced by Merck in 1912 it did not become popular
until the 1970’s. Other analogues found in tablets are MDA (3,4-
methylenedioxyamphetamine), MDEA (3,4-methylenedioxy-N-ethylamphetamine)
and MBDB (A^-methyl-l-(l,3-benzodioxoI-5-yl)-2-butanamine). Among the newer
members of this ATS group are DOB (4-bromo-2, 5-dimethoxyamphetamine), 2C-B
(4-bromo-2,5-dimethoxyphenethylamine) and DOM (4-Methyl-2,5-
dimethoxyamphetamine), knowledge of whom are limited and research is ongoing.
1.2.5. Ecstasy.
Ecstasy is the generic name given to 3, 4 methylenedioxymethamphetamine (MDMA)
by the World Health Organisation (WHO, 1997). MDMA is a ring substituted
phenylethylamine with a methamphetamine backbone (Figure 1.2). The
stereochemistry of MDMA is very important pharmacologically. The synthetic
production of these compounds yield racemic mixtures. The (+) enantiomer is more
stimulating and more neurotoxic than the (-) enantiomer. The difference in potency of
the two isomers may vary three to ten fold (Nichols & Glennon, 1984). Pure MDMA
is a white crystalline solid with a bitter taste. As a salt, the compound is chemically
stable and does not decompose in heat, air or light, MDMA is usually taken orally as
a tablet or capsule but may be found in powder or liquid form. It is readily absorbed
26

I
HPLC method development & chemometric analysis of ecstasy & cocaine
from the gastrointestinal tract into the bloodstream, More rarely, the drug is snorted,
smoked or injected.
i! Ecstasy seizures in Ireland were at their peak in 2003 and have since declined (Figure
1.1). In Europe, 2002 was the peak, 2003-2005 seizures were stable and since then,
! they have declined. Ecstasy typically sells for €3 - €15 per tablet (EMCDDA NationaliI Report, 2007).
IiThe production of synthetic drugs is not limited by geography or climate, as it is with
cocaine and heroin, The Netherlands is the main country in which illicit amphetamine
and ecstasy is produced, During the 1960’s, the provinces in Southern Netherlands
| were known for large scale amphetamine production. Since the 1990’s, this region
| continues to be used, though the focus has switched from amphetamine to ecstasy
production. The major production of MDMA is reported in the Czech Republic,
| Estonia, France, Poland, Spain and the UK (EMCDDA Annual Report, 2003).
j However, production facilities have been discovered in South East Asia, China, North
1 America, South Africa and South America (EMCDDA Annual Report, 2003). Over
| twenty recipes for MDMA production have been described in the literature, but only
three are common, the reductive amination route, the safrole bromination route and
the Leuckart reaction (Figures 1,3. to 1.6.),I)
1. The reductive amination route
This involves a reductive amination of a ketone at a higher temperature. Various
reducing agents may be used, such as Al/HgCh, NaBH4 (using low temperatures), and
NaBH3CN.
3t 4-(Methylenedioxy)phenyl-2-propanone MDMA
Figure 1.3. The reductive animation route for the synthesis of MDMA.
27

HPLC method development & chemometric analysis of ecstasy & cocaine
3 , 4 - (Methylenedioxy) phenyl - 2 - propanone is a controlled precursor, so chemists
devised an alternative synthesis process which involved only non-control led
precursors. Safrole is known to be a common precursor in MDMA synthesis and is
typically used to synthesise 3 , 4 - (Methylenedioxy) phenyl - 2 - propanone.
Safrole Isosafrole H20 2 3 ,4-(Methylenedioxy)phenyl-2-propanone
Figure 1.4. The synthesis of 3, 4 - (Methylenedioxy) phenyl - 2 - propanone using safrole as a precursor.
2. The safrole bromination route.
Safrole 3,4-Methylendioxyphenyl MDMA-2-bromopropane
Figure 1.5. The safrole bromination route for the synthesis of MDMA,
Here, the safrole is reacted with hydrobromic acid to form 2 - bromosafrole, which in
turn produces MDMA.
28
HPLC method development & chemometric analysis of ecstasy & cocaine
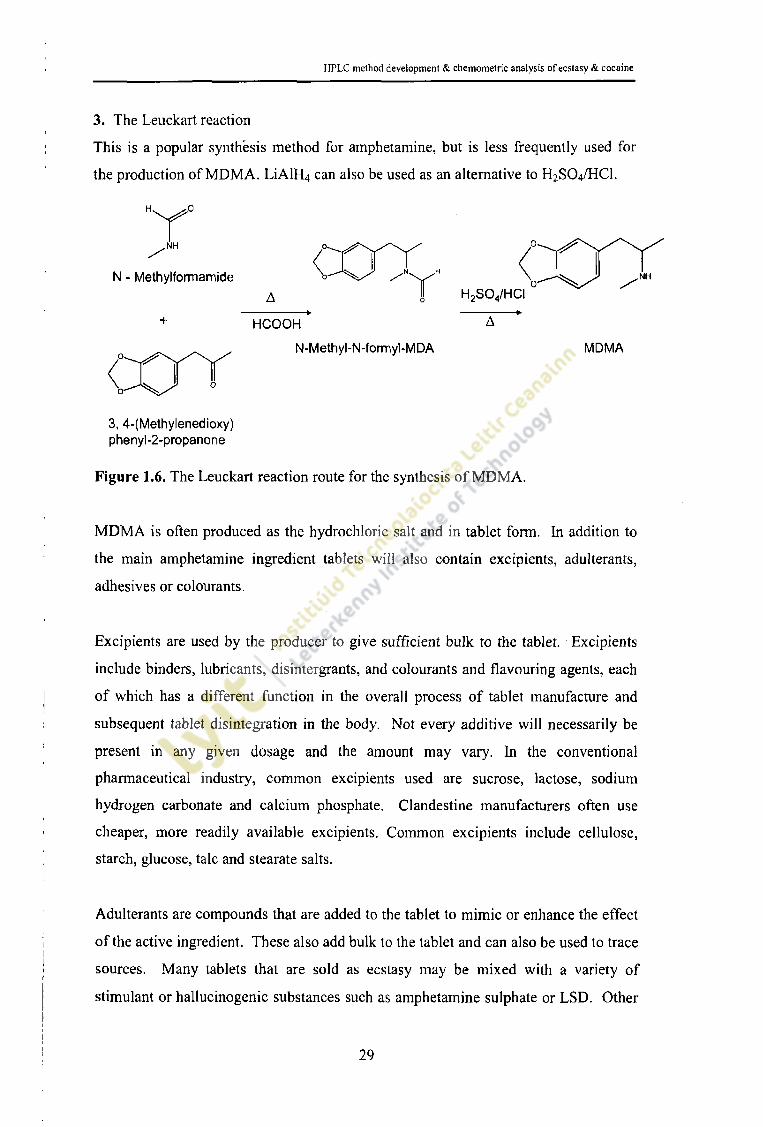
3. The Leuckart reaction
This is a popular synthesis method for amphetamine, but is less frequently used for
the production of MDMA. LiAlH4 can also be used as an alternative to H2SO4/HCI.
Y.NH
N - Methylformamide
N-Methyl-N-formyl-MDA MDMA
3, 4-(Methylenedioxy) phenyl-2-propanone
Figure 1.6. The Leuckart reaction route for the synthesis o f MDMA.
MDMA is often produced as the hydrochloric salt and in tablet form. In addition to
the main amphetamine ingredient tablets will also contain excipients, adulterants,
adhesives or colourants,
Excipients are used by the producer to give sufficient bulk to the tablet. Excipients
include binders, lubricants, disintergrants, and colourants and flavouring agents, each
of which has a different function in the overall process of tablet manufacture and
subsequent tablet disintegration in the body. Not every additive will necessarily be
present in any given dosage and the amount may vary. In the conventional
pharmaceutical industry, common excipients used are sucrose, lactose, sodium
hydrogen carbonate and calcium phosphate. Clandestine manufacturers often use
cheaper, more readily available excipients. Common excipients include cellulose,
starch, glucose, talc and stearate salts.
Adulterants are compounds that are added to the tablet to mimic or enhance the effect
of the active ingredient. These also add bulk to the tablet and can also be used to trace
sources. Many tablets that are sold as ecstasy may be mixed with a variety of
stimulant or hallucinogenic substances such as amphetamine sulphate or LSD. Other
29

HPLC method development & chemometric analysis of ecstasy & cocaine
amphetamine compounds such as MDA, MDEA and MBDB are commonly present.
Examples of adulterants include caffeine, acetaminophen, phenacetin and
acetyl sal icy lie acid (Figure 1.7). Adhesives also referred to as binders, are added to
the powdered ingredients to increase their cohesive strength. These are usually added
in concentrations between 1% and 10%. Formulations of clandestine manufacturers
are likely to contain a natural gum or starch, which in paste form can function as an
adhesive.
Figure 1.7. Chemical structures of the typical adulterants associated with ecstasy
tablets.
Seized tablets are mainly white in colour, some are mottled or coloured. Examples of
reported colours include blue, pink, green and yellow. Reasons for the addition of
colorant are to increase the aesthetic appeal and distinguish product batches from
others. The final colour of MDMA may change from white for the pure compound to
pink or cream/yellow in the presence of by-products associated with the starting
materials. Ecstasy tablets differ at this point from many other drugs o f abuse, As it is
in tablet form, no further excipients can be added at the different stages of trafficking.
This is an essential point for profiling and linking seizures. Only those chemicals
added at manufacture can be present at street level.
Producers want to differentiate their product from others by imprinting the tablets
with logos or symbols, this promotes brand awareness and customer loyalty (Figure
1.8). When one ‘brand’ of tablets gains popularity, other laboratories will utilise the
same logo punch to gain market share. It is reported that some clandestine
laboratories can tailor drug combinations and customise logos for regular customers.
Caffeine Acetaminophen Phenacetin Acetylsalicyftc Acid
30

HPLC method development & chemometric analysis of ecstasy & cocaine
Figure 1.8. A selection of seized ecstasy tablets with different logo imprints.
1.2.6. Cocaine.
Due to its addictive nature, cocaine has always been a popular street drug, but recently
it has overtaken ecstasy as the second most popular drug of abuse in Europe
(EMCDDA Annual Report, 2007). Cocaine is extracted from the leaves of the coca
plant (Erythroxylon coca). It was originally used in South America in the mid-19th
century by natives of the region to relieve fatigue. Pure cocaine (cocaine
hydrochloride) was first used as a local anaesthetic for surgeries in the 1880’s and was
the main stimulant drug used in tonics for treatment of various illnesses in the early
1900’s, The chemical name is benzoylmethyl ecgonine and it is a crystalline tropane
alkaloid. It is catagorised as a stimulant; more specifically it is a dopamine reuptake
inhibitor, a noradrenalin reuptake inhibitor and a serotonin reuptake inhibitor.
Cocaine is a white crystalline solid, hygroscopic in nature, odourless and has a bitter
taste (Figure 1.2). It has a melting point of 197 °C. Cocaine most often appears as a
white crystalline powder or an off-white chunky material Crack cocaine typically is
available in rock form. ‘Street’ cocaine may be contaminated accidentally during the
preparation process or may be adulterated intentionally by a number of compounds in
order to dilute the amount of cocaine used and increase profits. Examples of
adulterants include caffeine, phenacetin, lidocaine, procaine, piracetam, and prilocaine
(Barrio et a l 1997, Bemado, 2003, Lopez-Artiguez et al. 1995, Fucci &
DeGiovanni, 1998)(Figure 1.9). Common excipients detected in cocaine street
samples include starch, sugars, carbonates and bicarbonates (Bemado, 2003, Lopez-
Artiguez et a l 1995).
31

HPLC method development & chemometric analysis of ecstasy & cocaine
H,C0 H*
nh / CH
Lidocaine Procaine Piracetam Prilocaine
Figure 1.9. Chemical structures of the typical adulterants associated with cocaine.
Crack cocaine is derived from powder cocaine. The powder cocaine is dissolved in a
solution of sodium bicarbonate and water. The solution is boiled and a solid
substance separates from the boiling mixture. This solid substance, crack, is removed
and allowed to dry. The crack cocaine is then broken or cut into "rocks,” each
typically weighing from one-tenth to one-half o f a gram. One gram of pure powder
cocaine will convert to approximately 0.89 grams of crack cocaine. It is estimated that
crack rocks are between 75% and 90% pure cocaine.
The bulk of cocaine is produced in Colombia, Bolivia and Peru, with the traditional
clandestine manufacturing process illustrated in Figure 1.10. Colombian drug
organisations are responsible for producing 80% of the world’s cocaine. Trafficking
organisations targeted countries in Eastern and Southern Europe as stopovers for both
sea and air consignments filled with large quantities o f cocaine which were ultimately
destined to Western Europe. The Americas made over 75% of the 2001 cocaine
seizures, Western Europe around 13% and the rest of the world around 12% making
Europe the second-largest cocaine market. Demand is estimated at between 120 and
150 tons per year and is on the increase. The countries of the European Union seized
around 56 tons of cocaine in 2001. Spain seized 33 tons of cocaine in 2001, which is
more than Mexico and almost 60% of the total quantity seized in Western Europe
(EMCDDA Annual Report, 2007).
32

HPLC method development & chemometric analysis of ecstasy & cocaine
Coca leaves + H20 + lime, crush to a pulp
iAdd kerosene, stir mixture
iRecover kerosene, discard coca leaf pulp
Add dilute acid
VRecover aqueous phase, discard kerosene
Add lime
iCollect precipitate + dry
iCrude cocaine
Figure 1.10, Flow diagram of each step involved in the clandestine manufacture of
cocaine,
In Europe, average price for cocaine is €50 - €80 per gram (EMCDDA Annual
Report, 2007). Only anecdotal information is available for the street price of drugs in
Ireland. Cocaine has been sold for €30 - €40 for a half gram and crack for €50 a rock
(NACD Annual Report, 2007). An overall decrease in purity was seen in cocaine in
Europe from 2000-2005, with most countries reporting 30 - 60% purity (EMCDDA
Annual Report, 2007). It is thought that seizures have not affected the price of
cocaine but has affected the purity. Cocaine seizures have been on the rise since 2001
in Ireland, which would comply with the trend in Europe (EMCDDA Annual Report,
2010).

HPLC method development & chemometric analysis of ecstasy & cocaine
1.3. Current analytical techniques for forensic drug analysis.
Various spectrometric and chromatographic methods are available for both routine
and forensic drug analysis. The main objective for the analytical chemist has been to
introduce new, versatile techniques with high efficiency, selectivity and precision. In
this section, analysis of drugs o f abuse using techniques such as Infrared spectroscopy
(IR), Raman spectroscopy, Nuclear Magnetic Resonance (NMR), Thin Layer
Chromatography (TLC), Capillary Electrophoresis (CE), Gas Chromatography (GC)
and High Performance Liquid Chromatography (HPLC) are presented and their
applications in the analysis of illicit drug and biological samples are reviewed.
1.3.1. Spectrometric methods.
IR spectroscopy is a long established method of analysis. The non-destructive nature
of this method added with its economy of time and lack of organic solvent usage
appeals to a wide variety of analysts. Sondermann and Kovar (1999) demonstrated
the potential use of this technique in screening experiments for MDMA, MDEA and
amphetamine in ecstasy street samples, Schneider and Kovar (2003) found IR
analysis in transmission mode to be better than diffuse reflectance when analysing
ecstasy tablets. IR has been used to chemically differentiate between cellulose and
lactose and then applied to a number of ecstasy samples in order to differentiate
between producers (Baer et al. 2007). A portable version of IR spectroscopy has been
developed for onsite identification of ecstasy (Tsujikawa et al. 2008) and the contents
of a clandestine laboratory for cocaine production were analysed using IR (Gostic &
Klemenc, 2007). Infrared spectroscopy has been limited to identification of
adulterants and excipients in cocaine samples (Lopez-Artiguez et a l 1995).
Raman spectroscopy is a simple, non-destructive, semi-quantitative technique that
allows for rapid screening of samples and as such has become a popular technique in
the forensic analysis of drugs o f abuse. Bell et a l (2000a, 2000b and 2003) have
carried out numerous studies using this technique. In 2000, initial studies
demonstrated the rapid drug screening potential of Raman spectroscopy and also
distinguished between geometrical isomers of MDEA and MBDB and different
hydrated forms of the same drug (Bell et al. 2000a). Later in 2000, the group
analysed 400 ecstasy tablets for their active ingredients and excipients and concluded
34

HPLC method development & chemometric analysis of ecstasy & cocaine
that the composition of the seized tablets varied significantly and even batches with
similar physical appearance could not only have different active compounds but also
vary in the nature of the excipients, the drug to excipient ratio and degree of MDMA
hydration (Bell et a l 2000b). Further studies by Bell et al. (2003), demonstrated the
potential of Raman spectroscopy as a rapid technique in the screening of a large
sample number (1,500 ecstasy tablets) in characterising ecstasy tablets according to
Raman composition profiling and concluded that it may be possible to recognise
batch-to-batch variation in the ‘signature’ of tablets prepared by major manufacturers.
Other studies include the use of Raman spectroscopy in the analysis of cocaine and
heroin (Ryder et a l 1999). The technique has also been applied to the detection of
drugs of abuse from different materials and includes: MDMA in clothing (Ali et al.
2008), cocaine in beverages (Eliasson et al. 2008) and codeine, cocaine,
amphetamine, barbital and nitrazepam in fingerprints (Day et a l 2004). Milhazes et
al. (2007) applied the technique in the examination of synthetic precursors associated
with MDMA. One of the newer members of the ‘ecstasy’ group, 4-bromo 2, 5
dimethoxtamphetamine (DOB) was screened using surface enhanced Raman
spectroscopy (Bell et al. 2007). Raman has also been used as a detector for an LC
method for the analysis of cocaine, heroin, amphetamine, papaverine and procaine
(Sagmuller et a l 2003).
A more modem spectroscopic method is nuclear magnetic resonance (NMR), The JH13and C chemical shifts of NMR can provide information on the environment of the
nuclei being analysed. This technique allows for differentiation between geometrical
and positional isomers and also between salts and free bases of drugs. This method is
also non-destructive and can be used quantitatively. However, its lack o f sensitivity
and the initial cost of the instrument limit this method to specific research rather than
routine toxicological analysis. Molecular conformational studies using NMR were
used to characterise cocaine and some of its derivatives (Airaksinen et al. 1999).
Carter et al. (2002) used NMR to demonstrate its potential to study both the
precursors and synthetic pathways of MDMA in order to link common batches of
ecstasy tablets. A method for the analysis of excipients and impurities in ecstasy was
proposed by Lee et a l (2000) who then further developed the method to allow for the
35
HPLC method development & chemometric analysis o f ecstasy & cocaine
quantification of the percentage carbon attributed to MDMA. Billault et al. (2007)
used NMR to study the different synthetic routes of MDMA, A new ecstasy
analogue, 2-chloro-4, 5-methylenedioxymethamphetamine, was identified using the
same NMR technique (Lewis et al. 2000). More recently, Zapata-Torres et a l
(2008) used !H NMR and X-ray diffraction studies to determine different
conformations of MDMA.
1.3.2. Chromatographic methods.
Low cost, speed, simplicity and its capability of simultaneous drug detection are the
main advantages of thin layer chromatography (TLC). Samples are loaded onto a
stationary phase, most frequently silica gel, and then the specific solvent system
(mobile phase) is allowed to move through the stationary phase. The interaction of
the compounds in the sample with the mobile phase allows for the separation of the
sample and subsequent identification. This would be considered an inexpensive and
basic technique and is typically used as a preliminary screening procedure, Within
the last ten years few research articles on drugs of abuse using TLC method have been
reported, Reports include the identification of adulterants in Brazilian cocaine
(Bernardo, 2003) and the separation of opiate alkaloids and its derivatives (Pothier &
Galand 2005). Kochana et al. (2003(a)) studied the markers of the Leukart production
of p-methoxymethamphetamine (PMMA) by solid phase extraction (SPE) followed
by TLC. In 2003, they used SPE-TLC for impurity profiling of intermediates in the
synthesis o f MDMA (Kochana et al. 2003(b)). In 2006, the same technique was
applied to examine agglutinants, excipients and adulterant impurities o f MDMA
(Kochana et al. 2006).
The term ‘capillary electrophoresis’ describes a family of related techniques in which
separations are carried out in narrow bore capillaries under the influence of an electric
field with separation of analytes based on their electrophoretic mobilities. The
exceptional power of separation and resolution, rapid analysis time, low mass
detection limits, economy of reagents, and minimum sample requirements make CE
an attractive methodology for forensic laboratories. The potential of this technique
for forensic analysis was first demonstrated in 1991 by Weinberger and Lurie, who
applied it to the analysis of a wide range of illicit drugs in synthetic mixtures
36

HPLC method development & chemometric analysis of ecstasy & cocaine
(Weinberger & Lurie 1991). Piette and Parmentier (2002) successfully separated
seven amphetamines associated with ecstasy within eight minutes without interference
from adulterants using CE and suggested that the method was an attractive alternative
to GC-MS for the qualitative and quantitative determination o f amphetamine and
related compounds. Similarly, a chemometric approach was employed by Dahlen and
Von Eckardstein (2006) for the development of a CE method to separate
amphetamine and 13 amphetamine analogues. Complete separation was achieved in
23 minutes; however the authors did offer an alternative CE method which allowed
for the separation of the more common amphetamines with cocaine and heroin in less
than seven minutes.
The applicability of capillary electrophoresis (CE) for the purpose of drug
classification was examined in the analysis of methamphetamine impurities (Iwata et
a l 2006). Two possible precursor impurities, namely ephedrine and
pseudoephedrine were detected and quantified allowing for seized drugs to be
classified into three groups based oh the contents of the two impurities. Chiral
separations, i.e. the separation of a racemic mixture into enantiomers, using CE were
accomplished by Huang et a l (2003). In this study the R-(-)-isomers and S-(+)-
isomers of MDA and MDMA were identified in seizures of tablets and urine samples.
Other applications of CE in forensic drug analysis include investigations of
adulterants in street cocaine (Ishii et al. 2001) and impurity profiling of heroin (Lurie
et al. 2001). A method for the separation of cocaine, opiates and amphetamines (10
compounds in total) was developed using a cyano stationary phase with capillary
electrochromatography (Aturki et al. 2009). CE has also been extensively used in
toxicological analysis, including hair (Gottardo et a l 2007), plasma (Boatto et a l
2007) and urine (Lin et a l 2006, Tsai et a l 2006).
Gas chromatography (GC) is one of the more extensively used separation techniques
in the area of drug analysis. High sensitivity and excellent reproducibility has lead to
the popularity of this technique; however the analyte of interest must be volatile and
thermally stable. The variety o f detectors associated with GC is an additional benefit
for this technique. The flame ionization detector (FID) has been used regularly in the
area o f ecstasy profiling (Dayrit and Dumlao, 2004, Kuwayama et a l 2008,
37

HPLC method development & chemometric analysis of ecstasy & cocaine
Mitrevski et al. 2005, Puthaviriyakorin et a l 2002, Rashed et a l 2000). Dujourdy
et a l (2008) used GC-FID to analyse cocaine samples for residual solvents that may
be present and a cross border study between France and Switzerland used GC-FID to
compare cocaine samples (Lociciro et al. 2007). GC in combination with mass
spectrometer (MS) detector is considered one of the more popular tools for analysis.
GC-MS has been used for the general analysis of drugs of abuse (O’Connell et al.
2000, Shin et al. 1996, Whiting et al. 2001) and in impurity profiling of ecstasy
tablets (Cheng et al. 2006, Gimeno et al. 2002, Gimeno et a l 2003, Palhol et a l
2002, Swist et a l 2005). 156 street samples of cocaine in Rome were analysed for
their adulterant content (Fucci et a l 1998). The harmonisation of MDMA profiling
methods is a project undertaken by the European Commission, titled “Collaborative
Harmonisation of Methods for Profiling of Amphetamine Type Stimulants”
(Weyermann et a l 2008). Several researcher groups from different countries
(Switzerland, France, The Netherlands, Finland, Germany, Czech Republic and the
UK) have analysed the physical characteristics, chemical composition and organic
profile of MDMA tablets. The preferred chosen method of analysis by this group for
MDMA organic profiling was GC-MS.
GC lends itself to a wide variety of applications, such as testing the nails of newborns
for monitoring in utero drug exposure (Mari et a l 2008), analysis of blood from
drivers under the influence of drugs for cocaine and cocaine metabolites (Jones et a l
2008), and everyday drug profiling (Dujourdy & Besacier, 2008, Groger et a l 2008,
Dujourdy et a l 2008, Lociciro et a l 2008, Lock et a l 2007). Analysis of the newer
designer drugs have been well documented (Ewald et a l 2007, Ewald et a l 2008,
Theobald et a l 2007, Sauer et a l 2008). The chemical profiling of heroin utilised GC
to classify different heroin samples (Esseiva et a l 2005). A supported liquid-liquid
extraction (LLE) method for ecstasy tablets was developed by De Korompay et a l
(2008). In this study, LLE was used to extract MDMA and was subsequently
analysed by GC-MS and isotope ratio mass spectrometry (IR-MS). Furthermore, the
application of GC in toxicological analysis for drug metabolites in hair (Kikura-
Hanajiri et a l 2007, Wu et a l 2008, Lee et a l 2008), urine (Kim et a l 2008,
Marchei et a l 2008, Brown et al. 2007, Lin et a l 2006), whole blood and serum
(Gunnar et a l 2007, Kankaanpaa et a l 2007, Ishida et a l 2005), meconium (Marin
38

HPLC method development & chemometric analysis of ecstasy & cocaine
et al. 2007, Salem et a l 2001), brain tissue (Stimpfl & Reichel 2007) and sweat
(Huestis et a l 2008, De Martinis et al. 2007, Fucci et al. 2008).
Limitations associated with GC and TLC are overcome by the use of High
Performance Liquid Chromatography (HPLC). HPLC is not limited by volatility or
thermal stability as analysis is performed at room temperature. In addition, HPLC
utilises a liquid mobile phase, which contributes to the separation process, making it
the most widely used separation technique. Also, developments in columns, high-
pressure constant delivery pumps and more sensitive detectors have contributed to its
versatility. As such, HPLC is an integral analytical technique in the area of forensic
drugs analysis.
The use of HPLC for the analysis of street samples has been limited. Makino et a l
(2003) used HPLC to analyse a number of tablets on the Japanese market, more
specifically, they used GC-MS to identify the different components and then LC to
quantify them, Sadeghipor et al. (1997a, b) used LC in combination with UV and
fluorescence for each of the studies. Using HPLC-UV, baseline separation was
achieved for six amphetamines and four adulterants in less than eight minutes. The
method was validated and application was made to eight tablets. Four amphetamines
were separated using HPLC- fluorescence and the sensitivity of the fluorimetric
detector was highlighted by applying the method to serum samples. HPLC-DAD was
used for the study made by Cole et al. (2002). In this study, the chemical components
of 136 ecstasy tablets were identified. Liquid chromatography with diode array
detection has been used for the determination of the major alkaloids such as
noscapine, papaverine, acetylcodeine, codeine, morphine, 6-monoacetylmorphine, 3-
monoacetylmorphine and diacetylmorphine (Collins et al. 2006). In addition, this
technique has been used extensively in toxicological analysis; samples include hair
(Cairns et al. 2004, Kronstrand et a l 2004), urine (Namera et al. 2008) plasma
(Concheiro et al. 2006), oral fluid (Concheiro et al. 2007, Wood et al. 2005) and
whole blood (Cheze et al. 2007).
A newer development associated with both GC and LC is tandem mass spectroscopy
detector. Here the fragments generated by the first MS are broken down further for a
39

HPLC method development & chemometric analysis of ecstasy & cocaine
clearer result of what the initial compound was. LC-MS/MS has been successfully
applied to the separation of 14 abused drugs, including amphetamine and MDMA, in
less than 2.5 minutes (Pihlainen et al. 2003), amphetamine, methamphetamine,
MDMA and MDA in urine (Andersson et al. 2008) and ten amphetamine related
compounds in meconium (Kelly et al. 2008).
1.4. Fundamentals of High Performance Liquid Chromatography,
The goal and purpose of liquid chromatography is to physically resolve the individual
components of a sample from each other so that they may be quantified and/or
identified. A high performance liquid chromatography instrument has a number of
components, including a solvent reservoir, a pump, a sample injection system, a
column and a detection system. The mobile phase (solvent) is a liquid used to carry
the sample through the column (where separation occurs) and on to the detector
(where data is generated). The choice of the mobile phase is dependent on the type of
chromatography to be used and because of this, mobile phase can be used as a tool in
the optimisation process. A high pressure pump is used to push the mobile phase and
sample through the system and is capable of delivering a particular flow rate at high
pressures, e.g. a flow rate of 2 mL min-1 at a pressure of 125 bar. When the sample is
introduced into the system, it is carried by the mobile phase onto the column. It is here
that separation occurs. Columns are typically steel tubes with a variety of length,
diameters and packing materials. Again, the choice of stationary phase is based on
the type of compounds to be separated. Detection systems are located after the
column. When the separated compounds leave the column, they pass through the
detector, where individual signals are recorded for each compound.
1.4.1. Chromatographic interactions.
The type of chromatography dealt with in this study is reversed phase
chromatography. This essentially means a polar mobile phase is used with a non polar
stationary phase and separation of the sample is based on the hydrophobic interaction
of the analyte between each of the phases. The analyte is attracted to the hydrophobic
surface of the particle in the stationary phase. Polar interactions, primarily hydrogen
bonding, are an important secondary retention mechanism. The level of hydrophobic
and polar interaction forces between solute and stationary phase will determine the
40

HPLC method development & chemometric analysis of ecstasy & cocaine
overall analyte retention time. Ion exchange interactions sometimes occur between
ionisable silanols and positively charged basic groups. Some silanols ionise, gaining
a negative charge. Chromatographic retention is a sum of the different interactions in
which the analyte molecule participates. Differential retention results in selectivity
and hence resolution. Compounds, with no hydrophobic or polar groups are affected
by ionic interactions only, which are much stronger interactions and more difficult to
elute and therefore undesirable.
1.4.2. Mobile phase.
The type of mobile phase employed greatly influences solute retention. The mobile
phase can promote or suppress ionisation of the analyte molecules, and can suppress
accessible residual silanol groups or any other active adsorption centers on the
adsorbent surface. The main requirement for the mobile phase is to dissolve analytes
up to the concentration suitable for detection. Table 1.1 lists the most commonly used
reversed phase solvent mobile phases.
Table 1.1. Chemical characteristics of typical HPLC solvent mobile phases.
SolventChemical Characteristics
M.W. B.P.(°C) R.I. UV(nm)
Viscosity(cP)
DipoleMoment
RelativeStrength
Water 18 100 1.333 185 1.00 1.84 0
Acetonitrile 41 82 1.341 195 0.358 3.37 3.1
Methanol 32 65 1.326 205 0.584 1.66 2.6
Tetrahydrofuran 72 66 1.404 215 2.20 1.70 4.4
M.W. = molecular weight, B.P. = boiling point, R.I.= refractive index
The characteristics of an ideal reversed phase solvent should include low viscosity for
maximum efficiency (which increases the diffusion coefficient of the analyte) with
minimum backpressure, limited absorption at low wavelengths (i.e. 200 - 230 nm),
available at a reasonable cost and high purity and be non-toxic and environmentally
friendly for ease of disposal.
Solvent strength is a measure of solvent hydrophobicity, tetrahydrofuran is more
hydrophobic than acetonitrile which is more hydrophobic than methanol, however the

HPLC method development & chemometric analysis of ecstasy & cocaine
three solvents do not differ significantly in their hydrophobic selectivity. Solvents
differ in selectivity primarily based on their polar characteristics. Tetrahydrofuran
can accept protons in hydrogen bonding, but cannot donate. Methanol can both
accept and donate protons during hydrogen bonding. While with acetonitrile, solute
molecules arrange themselves around the solvent molecules and is only a very weak
proton acceptor.
The strength of the solvent can have a major effect on the analyte retention. With a
relatively strong solvent, the equilibrium between the stationary and mobile phase
favours the mobile phase resulting in short retention times and poor resolution. With
a relatively weak solvent the equilibrium favours the stationary phase and results in
longer retention times and maximal resolution. An intermediate solvent is required
for reasonable retention. Solute retention is adjusted by mixing solvent strength -
acetonitrile, methanol, or tetrahydrofuran, with water to obtain a solvent strength
which results in efficient separation.
1.4.3. The column.
HPLC columns physically consist of three parts. Firstly, the matrix which refers to
the chemical characteristics of the particle, secondly, the stationary phase (often added
to particle) and thirdly, the hardware or steel rod housing encasing the material. The
most common matrix available is silica. Others include polystyrene-divinylbenzene,
alumina and zircona, which are stable across the pH range. Silica is the most common
matrix used as it is very physically robust and it tolerates high pressures, It is
chemically stable in virtually all solvents. Silica is versatile and is easily derivatised to
form unique stationary phases through attachment of reactive silanes to surface
silanols. It is available in pore sizes from 60 A to 300 A, choice of which depends on
analyte molecular weight, and is readily available in various particle sizes.
The silica surface is not homogenous and consists of various types of silanol groups.
Surface silanols vary significantly in their reactivity; 15 - 20% of surface silanols are
“highly” reactive. Isolated silanols are the most acidic, geminal silanols are relatively
benign and vicinal silanols form hydrogen bonds with adjacent silanols. Metals on
the silica increase silanol acidity. There are approximately 8 ^moles/m2 of silanols in
42

f-
the silica surface. The type and percentage of silanols in the silica surface affect the
bonding coverage and characteristics. The silica surface area affects the total amount
of phase that can be bonded. The surface determines the amount and reactivity of free
silanols that can produce secondary chromatographic interactions. The silica matrix is
a major factor in the reproducibility of column selectivity.
During the mid - 1970’s? the first silica particles specifically manufactured for HPLC
were spherical in shape which resulted in much higher column efficiency and much
longer column lifetimes. They naturally contain metal ions, making it acidic, which
results in tailing for basic compounds. These types of columns were referred to as
“Type A” columns and examples of this type of column include ‘Hypersif and
‘Spherisorb’. High purity silica particles have been made since the mid 1990’s. They
use high purity silanes as starting materials and are essentially metal free and are
referred to as “Type B” columns. They are considered to be of superior quality to
previous materials. They have less tailing for basic compounds and are more
reproducible. The stationary phase is formed on the surface of the silica by reacting
with a silane containing a reactive group, such as chlorine, the desired phase
molecule, Cs or Ci8 and small side groups such as methyl. Many of the surface
silanols remain unreacted because of the steric hindrance - the large silanes cannot
physically react with every silanol. Only 3/8 is reacted due to steric hindrance. Some
of the available stationary phases include; octadecyl (Cig), octyl (Cg), butyl (C4), phenyl, polar (cyano, nitrile) and internal hydrophilic groups (as discussed later). All
columns used in this research were type B columns.
Carbon load is the amount of carbon present in the stationary phase as a percentage of
the total weight. This is usually measured by thermal gravimetric analysis and the
typical carbon load is 12 - 15%. Retention is a function of carbon load-higher carbon
results in longer retention. The more carbon there is the less likely to have polar
interactions with silanols. The less carbon there is, the more likely to have polar
interactions with silanols.
HPLC method development & chemometric analysis of ecstasy & cocaine
43

HPLC method development & chemometric analysis of ecstasy & cocaine
The best measurement of the hydrophobic phase density is phase coverage, measured9 0as micromoles per meter (pmoles/m ). Maximum coverage for octadecyl'groups on
the surface of silica is around 3 - 4 |xmoles/m2. Many separations are sensitive to
phase coverage.
Di and tri-functional si lanes react not only with the silica surface but also by means of
a water-catalysed reaction with adjacent silanes. This forms a cross-linked silane
surface with increased pH stability and different selectivity than monomerically
bonded stationary phases. Polymeric phases are more commonly available on large
pore silicas because the polymers begin forming in the liquid phases and have
difficulty entering small pores. Monomeric produces oil/liquid on surface whereas
polymeric produces wax/solid surface. Polymeric stationary phases are more rigid
than monomeric bonded phases and exhibit shape selectivity.
<»lca
+ X—Hb-Ci a —• ¿H. ^
; ph,O—S—C18
i H.Cm onom eric C18 sfllca
- S I—O —5h-C18
-S i—C IS—Al—O—5si—C1B ' '
i s N0-------- S i— C18
-4m>- C10i i
polymeric C18 silica
Figure 1.11. Monomeric vs. polymeric C18 bonding. (Source: Grace Vydac
Application Notes)
Hydrophobic phases behave differently in a purely aqueous mobile phase. Normal
Cig phases are solvated in the presence of about 5% or more organic modifier, giving
full access of the analyte molecules to the stationary phase. When the organic solvent
concentration in the mobile phase drops below 5% the Cj8 phases can no longer
interact freely with analyte molecules, thus reducing performance. This is also known
as phase collapse. To prevent stationary phase collapse and enhance analyte
interactions with the stationary phase in highly aqueous mobile phases, polar groups
44

HPLC method development & chemometric analysis of ecstasy & cocaine
such as hydroxyls, carbamates or amides are incorporated into the hydrophobic chain
near the silica surface. These are referred to as “polar embedded” columns. This also
affects analyte selectivity even in mobile phases of higher organic solvent. This is
typically used for hydrophilic compounds and stationary phase collapse does not
occur.
While there are slightly more than 8 |imoles/m2 of silanols on the surface of the silica,
the highest practical phase density of an octadecyl ligand is approximately 4
jimoles/m2. This means that approximately half of the silanols remain unreacted and
available for interactions with solute molecules. Since these silanols can cause
unwanted interactions leading to peak tailing, reversed-phase materials are often
reacted a second time with a small silane molecule to “end-cap” these free silanols.
Small silanes such as trimethylchlorosilane are able to access many unreacted silanols
after the stationary phase has been bonded. This process, known as endcapping,
renders the silanols inaccessible to solute molecules.
1.4.4. Application of monolithic columns in the area of forensic drug analysis.
Maximum resolution with minimum analysis time is the fundamental goal for any
chromatographer. Previously, the chromatographer has reduced analysis time by
using one or several different approaches, including the use of higher flow rates,
higher column temperatures, shorter columns and reduced diameter of particles in the
column. The problem of high back pressure is associated with these approaches to
improve efficiency in conventional particulate columns. The development of
monolithic columns provides an alternative to particulate columns and allows for
faster analysis times without compromising separation efficiency.
Monolithic columns consist of a single rod-like structure containing macropores and
mesopores in its structure (Figure 1.12). The large pores are typically 2 jxm in size
and this gives rise to a low flow resistance which allows for higher flow rates. The
smaller pores are typically 12 nm and this ensures for sufficient surface area for
separation efficiency. Advantages of this novel column are faster analyses without
reducing resolution (Figure 1.13). These monolithic columns have greater
permeability and lower plate height, whilst separation efficiency (i.e. resolution of
i

HPLC method development & chemometric analyst* o f e c su sv & cocaine
analytes) remains unaffected. Silica is not the only material used in monolithic
columns. Other materials include various polymers such as polymethacrylates (Hebb
et al. 2003, Lammerhofer et al. 2001, Peters et al. 1998),
methacryloxypropyltrimethoxysilane (Kato et al. 2002), cationic steary I acrylates
(Bedair et al. 2003), acrylamides (Hoegger et al. 2001) and polystyrene-
divinylbenzene (Huber et al. 2001, Gusev et al. 1999). These columns have been
commercially available since 2002.
Figure 1.12. SEM - image of the porous structure of a typical monolithic silica
column
!♦
♦ 5 nm
■ 3.5 pm
a monolith♦ ■
♦ A
I A AA
Linear Velocity (m m /sec)
Figure 1.13. A typical Van Dcemter plot for a 5 particle size column, a 3.5 nm
particle size column and a monolithic column.
46

HPLC method development & chemometric analysis of ecstasy & cocaine
Much of the research has concentrated on the preparation and testing of the
monolithic columns (Janco et al. 2002, Hayes et al. 2000, Kang et al. 2002, Coufal
et al. 2002). Monolithic columns have been used most extensively in capillary
electrochromatography (CEC) (Komysova et al. 2005, Zhao-Sheng et al. 2004, Yan
et al. 2004, Hilder et al. 2004, Bandilla et al. 2003). Applications of the monolithic
columns include DNA research (Urthaler et al. 2005, Forcic et al. 2005, Branovic et
al. 2004, Lubbad et al. 2002), environmental monitoring (Cledera-Castro et al. 2005,
Sarafraz Yazdi et al. 2005, Asperger et al. 2002) and the analysis of drugs on
biological samples (Albu et al. 2005, Pistos et al. 2004, Yi Fan et al. 2004,
Samanidou et al. 2004).
Monolithic columns have only been recently applied to the analysis of drugs of abuse.
Most studies reported involve transfer of a method from a conventional particulate
column to a monolithic column and the subsequent comparison of the two whilst
using a drug of abuse as the analyte. Schneider and Kovar (2003) demonstrated the
reduction in run times from 11 to 3.5 minutes for the analysis of amphetamines in
ecstasy tablets. Macchia et al. (2004) used a Chromolith RP18 (100 x 4.6mm) to
separate a mixture of nine compounds commonly found in a typical heroin sample in
less than seven minutes. Aboul-Enein and Hefnawy (2005) decreased the run times
by six fold in the analysis of ketamine and its two metabolites, norketamine and
dehydronorketamine in human plasma. A Chromolith Performance RP-18 (100 x
4.6mm) column was used at a flow rate of 3 mL min'1. Limit of quantifications
(LOQs) were 25 ng mL'1 for ketamine and norketamine and 15 ng mL'1 for
dehydronorketamine with run time for complete analysis occurring in less than four
minutes.
Impurity profiling in ecstasy seizures can provide strategic intelligence for the
determination of the synthetic origin, and tactical intelligence for the determination of
whether two or more samples come from an identical source, i.e., same batch from the
same laboratory. The identification of the impurities and the subsequent statistical
analysis is what can link different unrelated seizures. Utilising a monolithic column
Byrska and Zuba (2008) studied the different impurities that were present in ecstasy
tablets. Initial studies examined the extraction process for potential ecstasy tablet
impurities, tested different buffers and volumes of eluent required and optimised

HPLC method development & chemometric analysis of ecstasy & cocaine
HPLC conditions using a simplex method development approach. Using a
Chromolith Performance RP-18e (100 x 4.6 mm) column, a gradient elution mobile
phase and a flow rate of 1 mL min'1, separation of the impurities were achieved in 35
minutes. The method was subsequently applied to ecstasy of known synthetic route
and successfully classified samples based on the areas of 33 selected peaks. However,
the use of the monolithic column under these conditions fails to take advantage of the
monolithic column, i.e. low back pressure with high flow rates. Subsequently, this
analysis could possibly been carried out at 4 mL m in'1 with a run time of 10 minutes.
A noteworthy feature o f monolithic columns is the high-throughput efficiency
achieved particularly for toxicological samples. The simultaneous determination of
48 antidepressants and antipsychotics from human serum was achieved by Kirchherr
and Kuhn-Velten (2006) using HPLC with tandem mass spectrometry. Sample
preparation was limited to protein precipitation and dilution. Samples were separated
using a Chromolith SpeedROD C l8 (50 x 4.6 mm) column with a flow rate of I mL
m in 1. The method was quantitative and had recoveries of 92 - 111% with an average
of 101%. Butalbital, acetaminophen and caffeine were separated by Pistos and
Stewart (2004) from human serum. Solid phase extraction was employed to extract
the analytes from the serum and separation was achieved by HPLC using a
Chromolith Performance RP-18e (100 x 4.6 mm) column. Although flow rate was 9
mL min'1, backpressure was no greater than 177 bar and this allowed for a separation
of the three analytes from serum in less than 10 minutes.
Wu et al. (2001) demonstrated the rapid analysis times of monolith columns in the
separation of four benzodiazepines within one minute from human plasma samples.
In this study tempazepam, tamoxifen, fenfluramine and alprazolam were extracted
from plasma samples by solid phase extraction (SPE) and chromatographic separation
was achieved using a Chromolith SpeedROD (4.6 x 50 mm) monolithic column.
Similarly, Clobazam, an anticonvulsant drug, and its metabolite were separated from
human plasma using a Chromolith Performance RP-18 (100 x 4.6 mm) monolithic
column (Rouini et al. 2005). Cocaine and its metabolites (benzoylecgonine,
norcocaine and cocaethylene) were separated using a Chromolith Performance RP-18
(4.6 x 100 mm) monolithic column with a flow rate of 5 mL min’1 with a run time of
I 48

HPLC method development & chemometric analysis of ecstasy & cocaine
five minutes (Caufiled & Stewart, 2002). Eight benzodiazepines (clonazepam,
desalkylflurazepam, diazepam, flunitrazepam, lorazepam, midazolam, nordiazepam
and oxazepam) commonly encountered in forensic toxicology were separated in less
than four minutes using Chromolith Performance RP-18 (100 x 4.6 mm) (Bugey &
Staub, 2004).
The development of the monolithic column has been a significant milestone in the
history of separation technology. This new generation of columns has allowed for
faster separations at lower backpressures without the loss in efficiency. Other
advantages include the reduction of analysis times for toxicological samples and the
ability to transfer methods developed for conventional particulate columns to
monolithic columns. It can be expected that the monolithic column will have future
applications in forensic drug analysis and be an integral tool for the war against drugs.
Future applications may concentrate on the ever expanding illegal drug market and
adapting analytical methods to separate and detect new chemical compounds with
high abuse potential.
Since the introduction of the monolithic column, column technology has developed in
several ways. Initially, manufacturers concentrated on reducing the particle size of
the traditional particulate column. Particle size was reduced from 5 (xm to 3.5 im,
then 2.5 ^m, 1.7 jim and ultimately 1.5 (im. The efficiency of a column increases as
the size of the particle decreases as the smaller particle size improves the mass
transfer kinetics. However, the small particle size generates more back pressure
because it gives more resistance to solvent flow. With the increase in efficiency
associated with the smaller particle size, a reduction in column length was also made,
from the traditional 250 mm to 150 mm and 50 mm resulting in the same efficiency as
that of a 5 |im, 250 mm particulate column. The reduction in column diameter also
has been used as a tool to improve efficiency. Smaller diameter columns also use less
mobile phase per analysis because a slower flow rate is required to achieve the same
linear velocity through the column. These changes to the physical dimensions of the
particulate column required pumps of higher pressure which in turn, led to the
creation of Ultra-Performance Liquid Chromatography (UPLC). Combining the
advantages o f the monolithic columns with the smaller particle size particulate
49

HPLC mcihod development & chcmomclnc analysis of ecstasy & cocaine
column, a new particle was created. Known as “fused core particle technology”,
"porous shell” or ‘‘core shell” the column consists of small particle, typically 1.7 nm,
to which a 0.5 |im porous diffusion path is bonded. The reduction in diffusion path
serves to increase the mass transfer kinetics, resulting in faster separations. Merck
have since developed the next generation o f monolithic column, named “Chromolith
High Resolution”. They state that the column performance of this new type o f column
is 50% greater than that of the usual Chromolith column, and is comparable to that of
the sub 3 nm particle size columns.
1.5. C h em om etr ics and statistical profiling.
Statistics were employed throughout this study in various forms. Initially,
experimental design combined with Artificial Neural Networks (ANN) were used to
develop a method for the separation of cocaine components routinely detected in
street samples. In addition a range o f sample pre-treatment and pattern recognition
methods were applied to results o f the chemical analyses of ecstasy in order to profile
the drugs and to establish links.
1.5.1. Experim ental design.
There are two approaches that can be made in order to develop an experimental
protocol, the univariate or multivariate approach. Univariate method development
involves studying each factor involved in the experiment individually to assess its
effect on that experiment. This process can be laborious and time consuming
however all levels of each factor would be investigated. The second approach, the
multivariate method, involves simultaneously investigating different factors at
different levels, thus minimising the effort involved in developing the method. One of
the most universal procedures used for this is a ‘full factorial design’. It is based on
varying the most influential chromatographic factors o f the analysis at two levels. A
‘fractional factorial design’ uses only a subset o f the experimental runs that would be
involved in the full factorial design, but results in similar statistical information.
Overall, this approach is more efficient and less time consuming. To illustrate the
effect each chromatographic factors on analyte separation, artificial neural networks
arc used to generate response surfaces. From these, the optimal separation conditions
can be selected.
50

HPLC method development & chcmomclric uiulvsis of ecstasy & cocaine
Artificial Neural Networks is a computer based system derived from the simplified
concept o f the brain in which a number o f nodes, called neurons, are interconnected in
a netlike structure. They are capable o f modeling extremely complex functions.
Figure 1.14 illustrates a simple ANN. There are two input variables, one layer o f six
units and one output variable. The number o f input variables, inner layers and output
variables is dependent on the data set. For the method development, the input
variables are the different levels o f the different chromatographic factors for each
experimental run and the output variables are the performance indicators. For the
tablet classification, the input variables are the pre-treated (as defined on page 51)
peak areas of the chemical components o f the tablets and the output variables are the
different chemical classes. A trained network should be able to model the function
that relates the input variables to the output variables, and can be used to make future
predictions.
Input Layer Hidden Layer Output Layer
►
►
Figure 1.14. A typical neural network consisting of two input variables, one layer of six units and one output variable.
Neural networks tend to be a feed-forward structure, i.e. the signal goes through the
input variables first, then the inner layers and finally the output layers. This may not
always be the case as sometimes the structure may be ‘recurrent’, this is where the
signal flows back again through from the output variable to the input variables. ANN
51

HPLC method development & chemometric analysis of ecstasy & cocaine
operates on the principal of training the data. This involves using input variables with
their known output variables in order to train the network. The weights of each
neuron are continuously adjusted until the errors are minimised. Once the network has
been trained, predictions based on new input variables can be made.
Network architecture is an important aspect of neural networks. Two of the most
common forms include MultiLayer Perceptrons (MLP) and Radial Base Functions
(RBF). For each form, the «-dimensional pattern space is divided up using
hyperplanes (MLP) and hyperspheres (RBF). MLPs are the most common type of
network. RBFs tend to be slower than MLPs to use, but are very quick to train. Both
hyperplanes and hyperspheres work by dividing two classes. For both models, each is
trying to find the lowest point (minimum error) in the «-dimensional space.
1.5.2. Drug classification.
Classification is the arrangement of objects with similar properties together. In order
to achieve this, the properties (i.e. chemical profiles) of the objects (i.e. drug seizures)
must be determined. Once identified, the chemical profiles can be used as the data for
the statistical techniques applied for the classification.
Pre-treatment methods.
Data must be pre-treated so that no one variable (in this case chemical component)
dominates the others. Normalisation, standardisation, 4th square root and logio are the
most commonly used pre-treatment methods (Andersson et al. 2007, Baer & Margot,
2006, Dujourdy et al. 2008, Lociciro et a l 2008).
Normalisation - For each chemical compound, their peak area was divided by the sum
of all peak areas (see Equation 1.1). For metal analysis, the absorbance value for a
particular metal was divided by the sum of all the absorbance values for all the metals.
Nt = ^ r - (Equation 1.1)
Where x, = area of peak /. Although this pre-treatment method will allow all data
points to be on the one scale, it may happen that larger peak areas will still influence
52

HPLC method development & chcmomctrtc analysis o f ecstasy & cocaine
smaller peak areas. For this reason, normalisation in combination with other pre-
treatment methods is recommended.
Standardisation - For each chemical compound, their peak area was divided by the
standard deviation of all peak areas (see Equation 1.2 and 1.3). This method is also
referred to as ‘weighting’.
S, = — ( Equat i on 1.2)SD,
Where SD; = J ^ (Equation 1.3)V n ( w - l )
Where x, - area of peak /, n = number of samples, SD, = standard deviation of peak /.
Logarithm - For each chemical compound, the logiowas calculated (Equation 1.4).
L i = logic x, (Equation 1.4)
Where = area of peak i. A consideration for this method is the presence in the data
set of zeros, as logio of zero cannot be calculated.
4,h Square root - For each chemical compound, the forth square root was calculated
(Equation 1.5). Due to the inability of logio to calculate zeros, this may be used as an
alternative.
R,= ^ (Equation 1.5)
Where x, - area o f peak i.
Pattern recognition m ethods.
The statistical techniques used for classification or pattern recognition can be either
supervised or unsupervised. For some groups of data, prior knowledge of the samples
is not known. In this case, unsupervised methods such as Hierarchal Cluster Analysis
(HCA) or Principal Component Analysis (PCA) are used. Again, these specific
methods may be used when general information on the data is required, e.g. natural
groups or outliers within the data. Supervised methods assign class membership to the
data prior to the statistics being applied. The aim is to ‘train’ a model so that future
53

HPLC method development & chemometric analysis of ecstasy & cocaine
samples can be classified automatically. Examples of supervised methods include
Linear Discriminant Analysis (LDA) and Artificial Neural Networks (ANN).
Pearson Correlation Coefficients - This is a method used to describe the relationship
or correlation between two samples (Equation 1.6). Values are given in the range -1 to
1. The closer to 1 the value is the stronger the correlation, closer to -1, the stronger the
negative correlation. Values at 0 indicate no relationship whatsoever. In the context
of this study, tablets from similar seizures should have a coefficient value close to 1,
whilst tablets from different seizures should have a value near 0. A popular alteration
to this statistic is to multiply the result by 100, as this makes for easier comparison
with other statistical methods. This type of statistical method is very basic in terms of
classification and relatively simple to perform and therefore is quite common in
research studies.
- y ) )r, = —— ------------------- (Equation 1.6)
Z ( * ; - X ) 2»=1
Where r = correlation, x is the mean of x value and y is the value of y value,
Hierarchal Cluster Analysis (HCA) - This is a method for dividing a group of objects
into classes so that similar objects are in the same class or cluster. It searches for
objects which are close together in the variable space. This statistical method
measures the distance between two objects and if the distance is relatively small then
similar linked objects will be clustered. The similarity distance between samples is
calculated by both cluster and interval methods. Typical clustering methods include
Between groups, Within groups, Nearest neighbour, Furthest neighbour, Centroid,
Median, and Wards. Interval methods include Euclidean, Square Euclidean, Cosine,
Pearson, Chebychev, Block and Minkowski. The data variable set will determine the
most appropriate interval and cluster methods. Results of HCA are typically
represented as a dendogram which display the clusters associated with the data set.
Figure 1.15 illustrates six cases clustered to three distinct groups at Euclidean distance
1. Increasing the Euclidean distance to 10 will generate two groups for the same six
cases. The distance or similarity measure can therefore be subjective in determining
the number of clusters present in the dendogram.
54
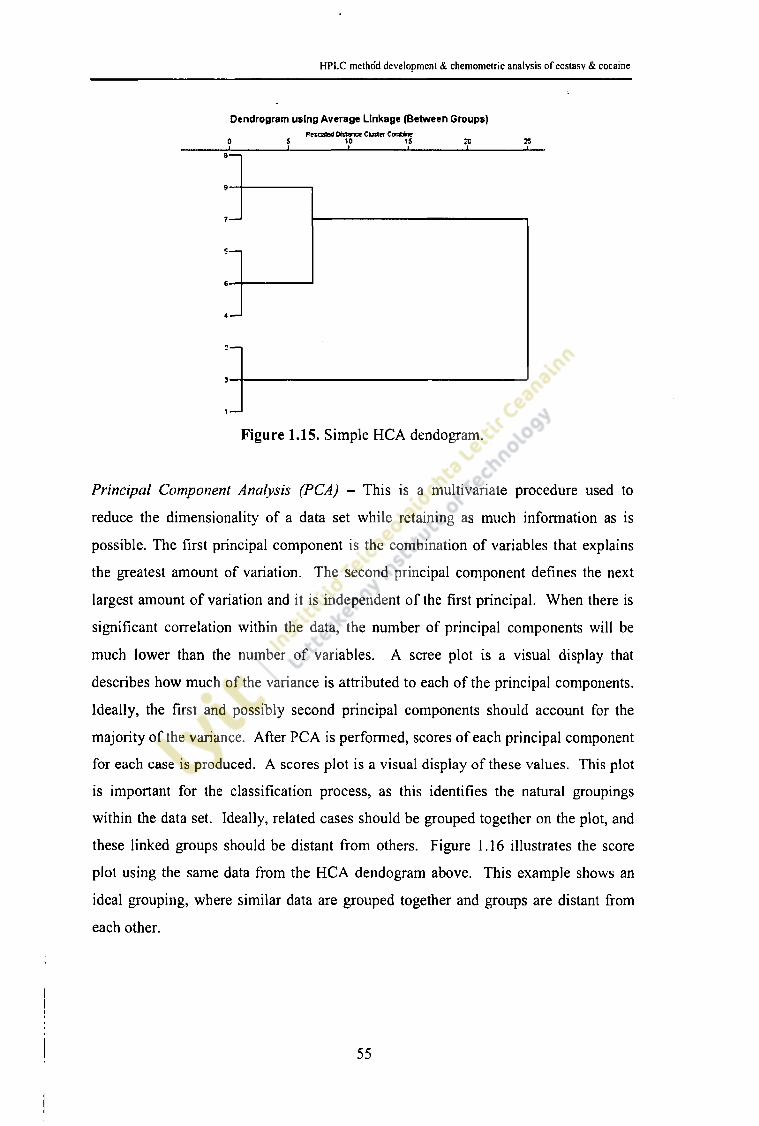
HPLC method development & chemometric analysis of ecstasy & cocaine
Dendrogram using Average Linkage (Between Groups)Fescoted Distance Cluster ComWne 0 5 10 15 35 25_J_______ I________ 1------------- 1_______ I________ L.
8 -----
Figure 1.15. Simple HCA dendogram.
Principal Component Analysis (PCA) - This is a multivariate procedure used to
reduce the dimensionality of a data set while retaining as much information as is
possible. The first principal component is the combination of variables that explains
the greatest amount of variation. The second principal component defines the next
largest amount of variation and it is independent of the first principal. When there is
significant correlation within the data, the number of principal components will be
much lower than the number of variables. A scree plot is a visual display that
describes how much of the variance is attributed to each of the principal components.
Ideally, the first and possibly second principal components should account for the
majority of the variance. After PCA is performed, scores of each principal component
for each case is produced. A scores plot is a visual display of these values. This plot
is important for the classification process, as this identifies the natural groupings
within the data set. Ideally, related cases should be grouped together on the plot, and
these linked groups should be distant from others. Figure 1.16 illustrates the score
plot using the same data from the HCA dendogram above. This example shows an
ideal grouping, where similar data are grouped together and groups are distant from
each other.
55

HPLC method development & chemometric analysis of ecstasy & cocaine
Score Plot
-0.5-
!
-2 0
First Component2
Figure 1.16. Score plot of first two principal components.
Linear Discriminant Analysis - For each seizure, the n data points are reduced from n
dimensions to one dimension. Each dimension is given a coefficient which reflects
the difference between seizures. This statistical approach works by finding the linear
discriminant function (Y) for each class or seizure. This is a combination of the
coefficients (a) o f each variable (X),
The coefficients are assigned so that Y is very different for each class. When new data
is applied, the resulting value of Y will indicate which class or seizure that data set
belongs to by comparison of the Y values for each class.
Artificial Neural Networks (ANN) - The major attribute of neural networks, is that
once established within the laboratory as a classification tool, results of further
chemical analysis can be added to the network and tablets of similar chemical profile
can be highlighted. Over a period of time, this information accumulates into “drug
intelligence” which can lead to dealer networks or even production laboratories being
more easily identified. Artificial neural networks algorithms have the potential to
provide complete solutions in the identification of patterns in data sets (Bishop, 1996).
Individual networks and ensembles of networks can be created and tested using the
Y — ajXi + a2X2+ .. .anXn (Equation 1.7)
56

HPLC method development & chemometric analysis of ecstasy & cocaine
Intelligent Problem Solver (IPS) system function in the Trajan software. The software
randomly assigns individual data sets from each sample into training, selection and
test sets. Multiple networks for each data set can be tested by Multi-Layer Perceptron
(MLP) and Radial Base Functions (RBF) methods. Selection o f the most suitable
network is based on the performance of the selection set and the difference in the error
associated with the selection set and the test set, The optimal network based on
performance, selection and minimum error values should be capable of handling new
data and have the ability to classify new data adequately (Waddell et a l 2004).
1.5.3 Application of chemometrics to illicit drug profiling.
Although there are numerous reports in the literature on statistical profiling of illicit
drug samples there is no clear standard protocol or approach to apply (Andersson et
al. 2007, Baer & Margot 2007, Billault et a i 2007, Byrska and Zuba 2008, Cheng et
al. 2006, Dayrit & Dumlao 2004, Dufey et al. 2006, Dujourdy et al. 2008, Dujourdy
& Besacier, 2008, Esseiva et al. 2005, Gosav et al. 2006, Janhunen & Cole 1999,
Klemenc 2001, Koper et a l 2007, Krawczyk and Parczewski 2001, Kuwayama et al.
2006, Lociciro et al. 2008, Palhol et al. 2002, Puthaviriyakron et al. 2002,
Weyermann et al. 2008). Various pre-treatment methods, unsupervised pattern
recognition methods and supervised pattern recognition methods have been applied to
data sets to determine the most appropriate method. In addition many reports refer to
impurities as the main target to determine patterns in illicit drug samples. Regardless,
the overall aim of statistical profiling methods is to identify synthetic routes, identify
geographical origin or simply highlight seizures of similar chemical profile.
Chemometrics involves the application of statistical protocols to multivariate
chemical data sets. Various statistical protocols have been applied for the analysis of
illicit drug samples. Baer & Margot (2007) evaluated different pre-treatment methods
(i.e. normalisation, standardisation, fourth Square Root, logarithm) and different
comparison methods (i.e. Pearson’s correlation coefficients, Squared cosine,
Similarity index, Canberra index, Euclidean distance and Manhattan distance) for the
statistical profiling of ecstasy tablet samples. Fourteen data variable sets comprised of
sugar and fatty acid content were examined in various combinations of data pre
treatment and comparison methods. The combination of fourth squared root with
57

HPLC method development & chemometric analysis of ecstasy & cocaine
squared cosine function was the most successful at classifying data sets with 109
ecstasy samples categorised into 67 groups. Under the European project for
Collaborative Harmonization of Methods for Profiling Amphetamine Type Stimulants
(CHAMP), Andersson et al. (2007) evaluated statistical protocols for profiling of
amphetamines. Combinations of four different pre-treatment methods with six
different distance methods were examined and normalisation with 4th square root pre
treatment method with Pearson’s correlation coefficients comparison method was
selected as the preferred protocol. Lociciro et al. (2008) examined sixty six statistical
combinations in a cross border study of cocaine samples between France and
Switzerland. Ten different data pre-treatments with six distance measurements were
evaluated and the final combination of Normalisation with Standardisation for data
pre-treatment with either Pearson’s correlation or squared Cosine function was the
most appropriate protocol for the cocaine profiling.
Impurity determination is commonly used for drug classification purposes.
Puthaviriyakron et al. (2002) studied impurities of methamphetamine tablets from
Thailand. GC peak areas of nine impurities were normalised and then analysed by
HCA. At a similarity index of 0.55, five groups were identified. A similar study of
methamphetamine from the Philippines, used HCA to classify the drugs based on
impurities present (Dayrit & Dumlao, 2004). GC peak areas of each compound were
normalised. Thirty, forty and fifty impurity compounds were tested and results
indicated that by increasing the number of impurity data sets the better the resulting
HCA dendogram. Kuwayama et al. (2006) compared different pre-treatment methods
with different clustering methods using impurity data of methamphetamine samples.
A combination of raw data, square root and logarithm with Euclidean, cosine and
correlation coefficient distance methods was used and resulted in logarithm pre
treatment with cosine distance being the most appropriate for this analysis. Thirty-
two samples were classified into nine groups based on eight impurity GC peak areas.
More recently, Weyermann et al. (2008), was able to reduce the number of target
impurities from thirty two to eight. The data was normalised with square root pre
treatment and PCA was applied. No pattern was identified, concluding that the
MDMA tablets seized in Europe for this study were all produced within the same
geographical area.
58

HPLC method development & chemometric analysis o f ecstasy & cocainc
The identification o f synthetic routes can be a key ingredient in the classification
process and has been used by a number o f researchers. Koper el al. (2007) analysed a
large number of ecstasy tablets for their metal content (forty-nine metals analysed)
with the intention o f identifying the synthesis production method. Clustering based on
Pearson’s correlation together with average linkage (between groups) was found to be
the best and most robust clustering technique for this type of data. The production
method could be identified for eighty-nine o f the ninety-seven tablets analysed. Using
the element profile, thirteen links were identified within the ninety-seven MDMA
tablet samples. Billault et al. (2007) synthesised samples of ecstasy using the five
most common methods and samples were analysed by isotope ratio mass
spectrometry. PCA was applied to the values from the precursors and the samples.
Full discrimination was achieved for all but two samples. Byrska and Zuba (2008)
divided MDMA samples into their different synthetic routes by applying HCA. The
chemometric approach involved applying Wards’ clustering with Pearson’s distance
metric was to thirty three impurities associated with samples. PCA was subsequently
applied to verify the HCA findings. Palhol et al. (2002) investigated the most popular
synthesis route for MDMA tablets in France. Within this study, thirty impurities from
fifty two samples were identified. Using HCA, the reductive amination route was
found to be the most popular synthesis route and 3, 4-methylenedioxyphenyl-2-
propanone was the most common precursor. Similarly, Dujourdy et al. (2008)
normalised the peak areas o f forty three impurities from methamphetamine samples
and the application o f HCA and PCA allowed for the identification different synthetic
routes.
The geographical origin o f cocaine was determined using HCA and partial least
squares - discriminant analysis (PLS-DA) for eighteen residues from 2863 cocaine
samples (Dujourdy & Besacier, 2008). Unsupervised pattern recognition methods of
HCA using Wards clustering method and Pearson’s correlation coefficients were
investigated. At a similarity index of 0.5 Colombian, Peruvian and Bolivian samples
were distinguished. PLS-DA was used to confirm HCA results o f the three groupings.
A study by Klemenc (2001) used various statistical methods to observe the influence
of cxcipicnts on heroin street samples. Samples were deliberately cut with the most
common excipients (sucrose, glucose, mannitol, procaine, caffeine, paracetamol, citric
59

HPLC method development & chemometric analysis o f ecstasy & cocaine
acid) in different combinations and concentrations and analysed by GC-MS. The
peak areas were normalised and then standardised. Pattern recognition methods used
were HCA, PCA and K-nearest neighbour. Results indicated that HCA and PCA
were both better at classification than KNN with both having a correct classification
rate of 100%. The conclusion from this study was that diluting the samples with any
of the excipients had no effect on the classification. Five major constituents of heroin
were successfully used to classify samples by Dufey et al. (2006), GC peak areas for
the five targeted compounds were normalised and Pearson’s correlation coefficients
calculated to ascertain the capacity o f the method in determining chemical links
between seizures.
Many studies aim to identify general connections between seizures, without any
concern regarding their synthetic route or geographical origin. In a study by Cheng et
al. (2006), ecstasy tablets in Hong Kong were analysed by GC-MS for their impurity
content. The data was normalised and HCA catagorised the eighty nine samples into
four groups at 0.5 similarity index. One thousand amphetamine samples were
classified into thirty seven groups in a study by Krawczyk and Parczewski, (2001).
Correlation coefficients were calculated to initially classify the tablets, followed by
both PCA and HCA. Linear discriminant analysis was applied to heroin samples
(Janhunen & Cole, 1999). Thirty one samples were classified into eight groups with a
correct classification rate of 91,9%.
The application o f artificial neural networks has been limited. Gosav et al. (2006)
built a search library for a GC-FTIR based on two neural networks for amphetamine
classification. The first neural network could distinguish between amphetamines and
non-amphetamines and the second neural network could distinguish between
stimulant amphetamines, hallucinogenic amphetamines and non-amphetamines. The
choice of neural network was based on the highest correct classification rate. A
correct classification rate of 96% was achieved by Esseiva et al. (2005) for the
classification of heroin samples. The peak areas of six compounds for 3371 samples
were normalised and PCA was applied. This roughly divided the samples into
different classes, from which correlation coefficients were calculated. The correlated > J
I
60
j
i

HPLC method development & chemometric analysis of ecstasy & cocaine
samples were then used to train the networks. Both MLPs and RJBFs were tested. The
network with the highest correct classification rate was an RBF 6:121:20.
1.6. Legislation and control efforts in Ireland.
Three treaties drawn up by the United Nations are the backbone to which drugs are
controlled worldwide; The Single Convention on Narcotic Drugs 1961, The
Convention on Psychotropic Substances 1971 and The Convention against Illicit
Traffic in Narcotic Drugs and Psychotropic Substances 1988.
Legislation in Ireland is determined by The Misuse of Drugs Act, 1977 and 1984 and
the regulations (Irish Statute Book). In 1993, the Misuse of Drugs Regulations was
added to include the control of production, supply, importation, exportation and
possession of precursors. In 1999, the 1977 Act was amended, Section (15A) deals
with the possession of drugs of a street value over €12,700. A person in possession of
drugs of this value or more is deemed to be supplying or selling and court convictions
can result in a ten year minimum prison sentence.
There are five categories of drugs in the national legislation:
I. Substances with no medical use
II. Strictly controlled substances with medical use
III. Strictly controlled medicinal products
IV. Less controlled medicinal products
V. Products containing small quantities of category I-IV compounds
In Ireland, possession of cannabis or cannabis resin for personal use is punishable by a
fíne on first or second conviction but from a third offence onwards it incurs a fine
and/or a term of imprisonment up to one year.
On the 23rd of August 2010, Ireland introduced new laws with regard to the sale of
psychoactive substances that were not previously controlled under existing legislation.
Retail outlets, more commonly known as ‘head shops’ were taking advantage of
; selling drugs that were new to the market and considered legal. Under the ‘Criminal}j Justice (Psychoactive Substances) Act 2010’ psychoactive substances including
!

HPLC method development & chemometric analysis of ecstasy & cocaine
synthetic cannabinoids, mephedrone, piperazine derivatives, flephedrone and
methylenedioxypyrovalerone (MDPV) were made illegal (Irish Statute Book, 2010),
Various groups and organisations have been established in Ireland to address the drug
problem. Reduction in supply of drugs is ultimately the responsibility of the
Department of Justice, Equality and Law Reform, within which An Garda Siochana
(police service), the courts, the Irish Prison Service, the Irish Customs Service and the
Irish Naval Service (Department of Defence) all cooperate. Both the National
Advisory Committee on Drugs (NACD) and the Alcohol and Drug Research Unit
(ADRU) of the Health Research Board (HRB) are the two main bodies which conduct
research on drugs and drug related issues. Drug Task Forces, both local and regional,
are community based groups that assist government agencies to respond quicker and
more efficiently to established and emerging drug problems within their local area.
These groups are managed by the National Drugs Strategy Team (NDST), who liaises
between the local and regional groups and the government. They make policy
recommendations based on the conclusions of the task forces. The NDST along with
the Inter-Departmental Group on the National Drugs Strategy are involved with
monitoring the implementation of the National Drugs Strategy.
In Europe, many agencies have been established whose aim is to disseminate all drug
related data. Each country has one or more such agencies, for example Ireland has the
Drug Awareness Programme (DAP) and the Irish Needle Exchange Forum (INEF).
The EMCDDA is one of the main European organisations responsible for monitoring
drug developments. They work in conjunction with national agencies and Europol to
provide information on the drug situation in Europe. Europol deals with all criminal
intelligence in Europe and has a focus on drug trafficking, Interpol is a worldwide
police organisation that supports all cross boarder activities that could reduce crime.
A major focus is drugs, with an emphasis on identifying new drug trafficking
developments and criminal organisations operating at the international level. The
European Network of Forensic Science Institutes (ENFSI) is another organisation in
which forensic laboratories across Europe collaborate on various issues. Within this
large organisation are 16 ‘expert working groups’, one of which focuses on drugs
alone.
62

HPLC method development & chemometric analysis of ecstasy & cocaine
As the drug situation grows, new organisations are being established, for example the
European Maritime Analysis and Operations Centre - Narcotics (MAOC-N). It is an
international agency set up to coordinate anti-drug trafficking by several European
countries. Based in Lisbon, its objective is to use intelligence on drug smuggling
operations, by air or sea, and apply the most suitable military and/or law enforcement
teams to respond to situations that arise. Ireland is a member and is represented by
An Garda Siochana, the Irish Customs Service and the Irish Naval Service.
Worldwide the main policy maker is the United Nations (UN), or more specifically
the United Nations Office of Drugs and Crime (UNODC). Within the UNDOC, there
are two Commissions that deal directly with drugs, The Commission on Narcotic
Drugs and the Commission on Crime Prevention and Criminal Justice. The former
established all procedures and guidelines pertaining to illicit drugs based on
observations of the world drug situation, whilst the later advises policy makers on all
matters relating to crime prevention and criminal justice. The International Narcotics
Control Board (INCB) implements all policies and recommendations issued by the
UNODC. The World Customs Organization (WCO) provides all information of
custom controls and smuggling.
1.7. Aims and objectives.
The overall aims of this research thesis are to investigate the application of High
Performance Liquid Chromatography (HPLC) for the analysis of major drug
constituents associated with ecstasy and cocaine illicit drug samples. Emphasis is
placed on method development with univariate or multivariate experimental strategies
used in the selection and optimisation of HPLC protocols. Methods developed are
applied to the area of forensic drug analysis and chemical data obtained is analysed by
chemometric methods to determine if statistical profiling can be beneficial in
establishing links between unrelated ecstasy seizures. The research strategy was
divided into following areas:
63

HPLC method development & chemometric analysis of ecstasy & cocaine
1. HPLC method development.
Univariate method development approach was applied to the design of a
HPLC method for the simultaneous detection and quantification of
amphetamine, methamphetamine, MDMA, MDA, MDEA, MBDB and
adulterants commonly found in ecstasy tablets. Considerations with regard to
the choice of chromatographic factors, solutes under investigation and the
provision of quality assurance data throughout the research work are important
in method development, Comparative evaluation of monolithic columns versus
particulate column stationary phase materials in the separation of ecstasy
analytes was performed.
Alternatively the multivariate HPLC method development approach for the
analysis of cocaine samples was also evaluated. Multivariate method
development simultaneously examines all chromatographic separation factors
to determine optimum performance based on mathematical model response
surfaces. This approach has the potential to minimise the number of
chromatographic experiments required and may considerably reduce the time
taken for the selection of the optimal separation conditions.
2. Analysis of seized ecstasy and cocaine samples.
Once established, the HPLC methods developed were applied to ecstasy and
cocaine street samples to qualitatively and quantitatively assay for the major
active ingredients and adulterants associated with street samples. The
identification of sugar excipients and metal impurities is important from an
investigative perspective. Knowledge of such components may provide a
means of establishing the origin or the synthetic routes employed and provide
evidence of a link between seized drug samples. As such, sugar composition
and inorganic metal data analysis was determined to obtain a near complete
chemical profile of ecstasy samples. Physical and chemical profiles were
evaluated for 183 ecstasy samples seized in the Republic of Ireland during
2001-2003.
64

HPLC method development & chemometric analysis of ecstasy & cocaine
3. Chemometrics and statistical profiling of ecstasy tablets.
Recently, the applications of drug profiling methods have demonstrated the
potential o f these statistical techniques in establishing links between illicit
drug samples. Unsupervised pattern recognition methods of PC A, HCA and
Pearson’s correlation coefficients and supervised pattern recognition methods
of LDA and ANN were evaluated in order to determine the applicability of
methods in profiling illicit drug ecstasy samples. Ecstasy chemical data sets of
active ingredients, sugar components and metal composition were investigated
to identifying possible groupings and thereby provide strategic intelligence
and an understanding of drug trafficking in the Irish ecstasy market.
65

HPLC method development & chemometric analysis of ecstasy & cocaine
Chapter 2: Materials and methods.
66

HPLC method development & chemometric analysis of ecstasy & cocaine
2.1. General materials and instrumentation.
2.1.1. Chemicals and reagents.
All reagents used in this study were of HPLC analytical grade. Acetonitrile,
ammonium dihydrogen phosphate, magnesium nitrate, nitric acid and phosphoric acid
were purchased from Lennox Laboratories (Dublin, Ireland). Potassium dihydrogen
phosphate and methanol were purchased from BDH Laboratory Supplies (Poole,
England).
A license to purchase and possess drug standards for research purposes was obtained
from the Irish Medicines Board, formally the Department of Health and Children
(Drugs Section), Ireland. AH amphetamine standards (amphetamine,
methamphetamine, MDA, MDMA, MDEA and MBDB) were purchased from Sigma
(Poole, England). All cocaine standards (cocaine, lidocaine, procaine, prilocaine and
benzocaine) were purchased from Sigma (Poole, England). The Garda Forensic
Science Laboratory Dublin, Ireland supplied all ecstasy and cocaine samples used in
this study.
Acetaminophen, acetylsalicylic acid, caffeine, clomipramine, metoclopramide,
phenacetin, propyl paraben and uracil were also purchased from Sigma (Poole,
England). All sugar standards (fructose, glucose, inositol, lactose, mannitol, sorbitol
and sucrose) were purchased from Sigma (Poole, England). All the metal standards
(aluminium, calcium, chromium, iron, lead, magnesium, potassium, sodium and zinc)
were purchased from Merck (Germany).
2.1.2. Liquid chromatography system.
The chromatography was performed on a Shimazdu HPLC system (Mason
Technology, Dublin, Ireland). This was equipped with an autoinjector (SIL-lOADvp),
a solvent delivery module (LC-lOATvp), a degasser (DGU-14A), a column oven
(CTO-1 OACvp) and a system controller (SCL-lOAvp). A UV/Vis photodiode array
detector (SPD-MlOAvp) was used for the ecstasy and cocaine method development
and a refractive index detector (RID-10A) was used for the sugar analysis. The
Shimazdu ClassVp HPLC software was used for instrument control, data acquisition
and data analysis.
67

HPLC method development & chemometric analysis of ecstasy & cocaine
2.1.3. Atomic Absorption Spectrometry.
A Perkin Elmer Atomic Absorption Spectrometer Model 3300 equipped with a Perkin
Elmer HGA600 graphite furnace, a Perkin Elmer AS-60 Autosampler and a deuterium
lamp background correction was used with hollow cathode lamps (Perkin Elmer) for
the metal analysis.
2.1.4. Miscellaneous instruments.
The ultrasonic bath used was a Cole-Parmer 8890 (VWR, Dublin, Ireland). An Ohaus
AS 120 analytical balance was used to weigh samples and standards. The deioniser
used was a Millipore ‘Direct Q \ ASTM Type 1,18 M il (Mason Technology, Dublin,
Ireland).
2.1.5. Computer software.
Principal component analysis was performed using Minitab statistical software
(Minitab Inc., PA, USA). Hierarchal cluster analysis and linear discriminant analysis
of ecstasy data were performed with the statistical software SPSS Version 13 (SPSS
Inc., Chicago, IL, USA). A Microsoft Excel macros file was provided from the
European Network of Forensic Science Institutes (ENFSI) for the determination of the
Pearson’s correlation coefficient. Neural networks for the classification o f ecstasy
data was generated by Trajan Neural Network software (Trajan Software Ltd.,
Durham, UK).
Minitab statistical software (Minitab Inc., PA, USA) was used to generate fractional
factorial design for the multivariate cocaine method development. In addition, neural
networks and response surface plots were constructed using Trajan Neural Network
software (Trajan Software Ltd., Durham, UK) for the multivariate method
development.

HPLC method development & chemometric analysis of ecstasy & cocaine
2.2. Univariate HPLC method development for the analysis of ecstasy.
2.2.1. Ecstasy standards and sample preparation.
Stock solutions of uracil and the internal standard metoclopramide HC1 were prepared
in methanol at a concentration of 1 jig mL'1. Amphetamine standards for sample
analysis and the ecstasy samples were prepared in the internal standard solution. For
method development a mixed amphetamine standard solution containing;
amphetamine, methamphetamine, MDA, MDMA, MDEA and MBDB was used to
examine method selectivity and resolution. Uracil was used as an unretained
compound. Detection of analytes was at 200 nm.
Application of the developed method was made to 183 ecstasy tablet samples. Ecstasy
tablet samples were representative of the seizures throughout the Republic of Ireland
(Figure 2.1.) in 2001 and 2003. Ecstasy tablets were provided as discrete individual
batches (61 in total) from the Forensic Science Laboratory, Dublin. Batches 1-12 were
from seizures in 2001 while the remaining batches 13-61 were seizures from 2003.
Each batch contained three tablets and each tablet had a specific reference number
assigned, For HPLC analysis ecstasy tablets were individually pulverised into a fine
powder using a mortar and pestle. Three 10 mg aliquots of each tablet sample were
dissolved in 10 ml of the internal standard solution. All solutions were sonicated for
ten minutes and filtered through 0.45 \xm filters (Millipore, MA., USA.) prior to
HPLC injection.
Six physical parameters (weight, logo, colour, shape, thickness and diameter) were
recorded to ascertain the physical characteristics of each ecstasy tablet. All weight
measurements were carried out using a calibrated analytical balance. Callipers were
used to measure diameter and thickness. A representative tablet from each batch was
digitally photographed to record sample physical appearance.

HPLC method development & chemometric analysis o f ecstasy & cocaine
Figure 2.1. Distribution and percentage of ecstasy batch seizures used in this study.

HPLC method development & chemometric analysis of ecstasy & cocaine
2.2.2. Univariate method development for analysis of ecstasy.
The design of the experimental procedure concentrated on a univariate method for the
development of a HPLC method for the analysis of ecstasy tablets. As such, each
chromatographic factor was considered individually, and the effect of the varying
factor evaluated on the performance for method development.
Assessment of column stationary phase materials was evaluated by examining seven
commercially available columns. Columns of different physical and chemical
characteristics were deliberately chosen (Table 2.1). Selected column types included
the Luna C 8 column, 5 fxm, 250 x 2.0 mm, ODS2 (Phenomenex Inc.); Phenosphere, 5
pm, 250 x 4.4 mm ODS2, C18 (Phenomenex Inc.), Luna, 5 pm, 250 x 2.0 mm,
ODS2, C l 8 (Phenomenex Inc.); a newer type ‘Hybrid5 column XTerra, 5 jim, 250 x
2.1 mm RP18 (Waters Corporation) and three monolithic columns, namely,
Chromolith Flash RP-18, 25 x 4.6 mm, Chromolith SpeedROD, RP-18, 50 x 4.6 mm
and Chromolith Performance RP-18, 100 x 4.6 mm (Merck KgaA).
Analyte separation is dependent on interactions between the mobile and stationary
phases. A phosphate buffer (20 mM) was used in the preparation o f the mobile phase
for HPLC and was prepared by adding 2.7 g of potassium dihydrogen phosphate to 1L
deionised water. Acetonitrile was used as the organic solvent within the mobile phase
and its effect on the quality of the separation was determined at different solvent
strengths. Solvent strengths comprising different acetonitrile concentrations ranging
0% to 30% with 20 mM phosphate buffer (pH 3.0) were evaluated. When required,
gradient elution technique was applied to columns with poor chromatographic
separation to enhance solute resolution. The effect of pH was also investigated by
adjusting buffer pH using phosphoric acid over a pH range of 2.5, 3.0 and 3.5 (as
discussed on page 85).
71

HPLC method development & chcmonictric analysis of ecstasy & cocaine
Table 2.1. Physical characteristics of stationary phase columns examined for univariate HPLC method development analysis of ecstasy.
Column
Column physical param eters
Pore Size(A)
SurfaceArea
(m2/g)
CarbonLoad Surface Coverage
(nmoles/m2)Length(mm)
InternalDiameter
(mm)
SizeDistribution
(nm)
Particle size(nm)
Endcapping
Luna C81 100 417 14.40 4.58 250 2.0 1.89 5 Yes
Phenosphere C] 81 80 220 11.00 2.50 250 4.6 1.89 5 Yes
Luna Cl 81 100 417 18.05 3.39 250 2.0 1.89 5 Yes
XTerra RP182 121 190 15.14 2.27 250 2.1 1.61 5 Yes
Performance RP-183 NA 300 17.00 NA 100 4.6 NA NA Yes
SpeedROD RP-183 NA 300 17.00 NA 50 4.6 NA NA Yes
Flash RP-183 NA 300 17.00 NA 25 4.6 NA NA Yes
1. Luna and Phenosphere columns were supplied by Phenomenex Incorporation; 2. XTerra column was supplied by Waters Corporation; 3. Monolith columns were supplied by Merck Kga, NA: not applicable

HPLC method development & chemometric analysis of ecstasy & cocaine
Temperature effects in HPLC are not as significant as in gas chromatography.
However, theory states that increasing the temperature will decrease retention factor
(k5) and thus decrease the retention time. The effect of column temperature was
examined over a range of temperatures. The six standard solution was injected at
25°C to 45°C in 5°C increments and the most appropriate temperature was selected
based on retention times and resolution.
Flow rate is an important criterion in optimising a suitable method. Optimum flow
rates should give a short retention time with good analyte resolution at low pressure.
In addition, optimal flow rates should consider solvent consumption and waste
production, which should be kept to a minimum to reduce costs. Flow rates for the
particulate columns were dependent on the internal diameter and were varied from 0 .1
mL min' 1 to 2 mL min'1. The main factor which differentiates monolithic columns
from the traditional particulate columns is the ability to use higher flow rates without
a high backpressure. The HPLC pump capacity allowed for pump rates up to 9.999
mL min'1. Monolithic columns had a maximum pressure of 200 bar. Preliminary
investigations determined that 200 bar allowed for a flow rate of 9 mL min'1.
Therefore flow rates of 0.5 mL min*1 to 9 mL min ' 1 were assessed in 0.5 mL min ' 1
increments. The backpressure at each increment was recorded for each column.
2.2.3. Validation of univariate method developed.
Method validation is the process used to confirm that the analytical procedure
employed for a specific test is suitable for its intended use. Although there is general
agreement about what type of studies should be assessed, there is great diversity in
how they are performed. The validation was carried out under the guidelines of the
International Conference on Harmonisation of Technical Requirements for
Registration of Pharmaceuticals for Human Use (ICH) (ICH, 1996), including
selectivity, linearity, inter and intra-day precision, accuracy, limit of detection and
limit of quantification.
The ideal internal standard is a compound of known purity that does not cause
interference with the analysis. Clomipramine, metoclopramide and propyl paraben
were all assessed for the most suitable internal standard. The selectivity of the
73

HPLC method development & chemometric analysis of ecstasy & cocaine
method was established for all amphetamine standards and the most common
adulterants found in ecstasy tablets, namely, acetaminophen, acetylsalicylic acid,
caffeine and phenacetin. Precision was expressed as relative standard deviation (%
RSD). For intra-day, ten replicates o f 50, 100 and 250 \ig mL-1 were analysed on the
same day. These standards were analysed in five replicates over five days to establish
inter-day precision.
With no reference materials, the accuracy of the method was determined by analysing
spiked samples at three concentration levels of 50, 100 and 250 \ig mL-1. Results
were calculated as experimental values compared to theoretical values and were
expressed as percentage recovery.
Linearity was evaluated by regression analysis and MandePs test, which compares
linear and quadratic models (Mandel, 1964). Limit of detection and limit of
quantification were established by injection of 0.01 pg mL ' 1 concentrations of each of
the six compounds and the signal to noise ratio was determined. The limit of
detection was calculated by LOD= 33a!S, where o is the standard deviation of the
response of the blank and S is the slope of the calibration curve. The limit of
quantification was calculated by LOQ= 10a/S under the ICH guidelines. The limits
were validated by analysing standards prepared at the concentrations of the LOQs for
each standard and their precision and accuracy were assessed.
2.3. Multivariate HPLC method development for the analysis of cocaine.
2.3.1. Cocaine standards and sample preparation.
Stock solutions of uracil and the internal standard metoclopramide HC1 were prepared
at a concentration of 1 jig mL ' 1 in methanol. Cocaine standards were provided in salt
form and were prepared in the internal standard solution. A mixed standard solution
was prepared containing cocaine, lidocaine, prilocaine, procaine, benzocaine,
acetylsalicylic acid, caffeine and phenacetin. Uracil was used as an unretained
compound and detection of analytes was performed using a diode array detector at
200 nm.
74
HPLC metiitid development & chemometric analysis of ecstasy & cocaine
The Forensic Science Laboratory, Dublin provided twenty eight cocaine samples
seized within the Republic of Ireland during 2004. Cocaine samples were in the form
of a powder, each sample weighing approximately 100 mg and 50 mg of each sample
was dissolved in 10 mL of the internal standard solution. Samples were sonicated for
10 minutes to ensure total dissolution and filtered through 0.45 pm filters (Millipore,
MA., USA.) prior to HPLC injections.
2.3.2. Multivariate method development for the analysis of cocaine.
The design of this experimental procedure was based on a multivariate method
optimisation. As such, each chromatographic factor is assessed in combination with
each other, and their combined effect on the separation is examined. The
chromatographic factors that were considered important for method development
were strength of organic solvent, ionic strength of phosphate buffer, temperature, pH,
and flow rates. The quality of the separation was based on the performance indicators
of resolution (R), retention factor (k5) and efficiency (N) for each analyte. In
describing the relationship between the chromatographic factors and the performance
indicators, regression analysis in the form of Artificial Neural Networks (ANN) was
applied using Trajan Neural Network software. The most successful neural network
is then used to plot response surfaces. Response surfaces are 3D graphs that illustrate
the relationship between any two of the chromatographic factors (e.g. pH and
temperature) and one of the performance indicators (R, k’ or N). Response surface
plots indicate the levels for each chromatographic factor and determine optimal
separation conditions. Although, this approach may appear complex, it produces a
method without experimentally exploring each chromatographic factor at all possible
levels. The combined use of neural networks and response surfaces for selection of
chromatographic factor levels overall leads to a more efficient and less time
consuming method development.
A 25' 1 fractional factorial design was created by Minitab and used as the basis of the
experimental procedure (Table 2.2.). Within this, two levels (low and high) for each
chromatographic factor were assigned. For each experiment, a mixed standard
solution containing five cocaines (cocaine, lidocaine, prilocaine, procaine, and
benzocaine), three adulterants (caffeine, phenacetin and acetylsalicylic acid) was
75

HPLC method development & chemometric analysis of ecstasy & cocaine
injected in triplicate. As part of the method development for the cocaine analysis, the
mobile phase was assessed in detail and for this, potassium dihydrogen phosphate
dissolved in 1 L deionised water was used as the buffer component of the mobile
phase. Buffer pH was adjusted by adding appropriate amounts of phosphoric acid.
The column used was a Waters XBridge C l 8 , 50 x 4.6 mm, particle size 3.5 pm, As
before with the Xterra column, this is a newer type column, using the ‘Hybrid Particle
Technology’. These are columns which combine the properties of both silica and
polymer columns. Essentially, every third silanol is replaced with a methyl group
during synthesis. This results in greater pH stability across the range and also greater
peak symmetry for basic compounds.
Table 2.2. A 25' 1 fractional factorial experimental design for multivariate method development generated using Minitab software, Chromatographic factors examined included, A: % Acetonitrile; B: pH; C: Temperature (°C); D: Ionic strength (mM) and E: Flow rate (mL min-1).
Factorial Chromatographic Factor
Experiment # A B C D E
1 1 0 2.5 40 50 1.5
2 1 0 3.5 40 50 0.5
3 2 0 3.5 40 50 1.5
4 1 0 3.5 40 1 0 1.5
5 1 0 3.5 30 50 1.5
6 1 0 3.5 30 10 0.5
7 1 0 2.5 40 10 0.5
8 2 0 2.5 40 10 1.5
9 2 0 3.5 40 10 0.5
1 0 2 0 3.5 30 50 0.5
11 2 0 2.5 30 50 1.5
1 2 2 0 2.5 40 50 0.5
13 2 0 2.5 30 1 0 0.5
14 1 0 2.5 30 50 0.5
15 2 0 3.5 30 1 0 1.5
16 1 0 2.5 30 1 0 1.5
76

HPLC method development & chemometric analysis of ecstasy & cocaine
The sixteen experiments were carried but in random order to avoid systematic error.
For each experiment, retention factors for each analyte, resolutions between analytes
and efficiencies were calculated by the HPLC software, ClassVp. The average
retention factor, resolution and efficiency (k’aVe> Rave and Nave) for each experiment
were also calculated. The data from the sixteen experiments were used to test
different neural networks (Figure 2.2). The five chromatographic factors at two levels
were used as inputs, and the retention factors for each analyte, resolutions between
analytes, efficiencies for each analyte and their averages were used as outputs, Using
Trajan Neural Networks, one hundred neural networks were examined.
Every network has three layers, an input layer, a hidden layer and an output layer.
The input layer is the five chromatographic factors at the two different levels for each
of the sixteen experiments (Table 2.2). Every network decided whether to take all
these factors or a combination within them, i.e. Acetonitrile + pH + Temperature +
Ionic Strength + Flow rate or pH + Temperature + Ionic Strength, etc. The hidden
layer is made up of both connections and neurons. The maximum number of neurons
tested was set at twenty; the number of connections in the network is dependent on the
number of neurons, The number of neurons within the hidden layer is an important
factor. The greater the number of neurons the more powerful the network. This
however, makes the network time-consuming to run and more complicated to train.
The reverse of this is true for a small number of neurons and the balance between
these two is important. The output layer is the calculated performance indicators. To
test as many networks as possible within minimum time, one hundred networks were
tested for each of the six outputs. Both three layer multilayer perceptron and radial
base function networks were investigated. The training algorithms were a
combination of back propagation and conjugate descent.
For each of the six outputs, the best neural network from the one hundred tested was
selected. The selection was based on a combination of network performance and
error values generated by Trajan, The best network produced high values for
performance and low values for error. Using each of the six networks, the predicted
values generated were plotted against the observed values. The network with the best
correlation indicated that it was that network that best described the separation. This
77

HPLC method development & chemometric analysis o f ecstasy & cocaine
network was then used to illustrate the separation in the form of response surfaces.
Optimal conditions for the separation of the eight analytes were decided based on
these response surfaces (Figure 2. 2)
1 1100 100
nr model oetworiateöed tested
Best \ / Best \oetworic 1 oetworic I
.se lec ted J
1\ selected J
in « K i ( a Pi ed ited
V s V sObserved Observed
Plots Plots
100 8 100Drt\Uïlkl lg oetwotk»
triteJ ijj tfited
Network with highest correlation R: values selected
Response surfaces generated for each analyte
,Optimum HPLC conditions selected
Figure 2.2. Schematic representation of the stages involved in the multivariate HPLC
method development for cocaine analysis. Key for different software packages were
as follows: □ - Minitab; - Class VP; - Trajan; - Microsoft
Excel
78

HPLC method development & chemometric analysis of ecstasy & cocaine
2.3.3. Validation of multivariate method developed.
As described previously, method validation was performed under the guidelines of the
International Conference on Harmonisation of Technical Requirements for
Registration of Pharmaceuticals for Human Use (ICH) (www.ich.org), including
selectivity, linearity, inter and intra-day precision, accuracy, limit of detection and
limit of quantification.
2.4. Sugar analysis.
Previous method development focused on the determination of active ingredients and
adulterant compounds of ecstasy and cocaine. Other compounds within illicit drug
samples include sugar and metal content. Ecstasy and cocaine samples were analysed
for their sugar content in order to obtain a more complete chemical profile.
Ecstasy and cocaine samples were analysed by HPLC for their sugar content.
Chromatography was performed on an NH2 column from the Phenomenex Luna
range, a 250 x 4.6 mm, and particle size of 5 |im. Standards for this study included
fructose, glucose, inositol, lactose, mannitol, sorbitol and sucrose. Conditions for the
separation were a mobile phase of acetonitrile/water (70/30), oven temperature of
30 °C and flow rate was at 0.75 mL min'1. Drug samples for the sugar analysis were
prepared by dissolving 50 mg of each in 20 mL rhamnose internal standard solutionin
water.
2.5. Metal analysis.
Ecstasy samples were analysed for their metal content. Nine metals, aluminium (Al),
calcium (Ca), chromium (Cr), iron (Fe), lead (Pb), magnesium (Mg), potassium (K),
sodium (Na) and zinc (Zn) were detected and quantified by atomic absorption
methods. This data was then assessed alone and in combination with the other
chemical data by means of the chosen statistical procedure in order to verify its
potential as another chemical parameter to aid profiling.
Glassware was soaked overnight in 2% HNO3, and rinsed three times in deionised
water before any solutions were prepared. The tablets were crushed with pestle and
mortar and prepared by direct dissolution. Direct dissolution involved adding 10 ml
of 5% nitric acid (HNO3) to 25 mg of crushed tablet in a polypropylene tube. Each
79

HPLC method development & chemometric analysis of ecstasy & cocaine
mixture was vortexed for 10 seconds and made up to 40 mL with deionised water.
Two forms of AA were used for metal analysis. If the concentration of the metals is
in the range of parts per billion (ppb), graphite furnace is recommended. If the
concentration of the metals is in parts per million (ppm), the standard flame AA can
be used. Preliminary tests provided information as to which metal should be analysed
by which instrument.
For the graphite furnace AA analysis, a specific method for each element was used.
Each method included wavelength, charring temperature and atomisation temperature
specific for the element of interest (Table 2.3). In order to reduce the volatility of the
metals, matrix modifiers were used for the elements analysed by graphite furnace.
0.05 mg Mg (N(>3)2 was used for Al, Cr, Fe and Zn and 0.2 mg NH4H2PO4 was used
for Pb. This was added to the sample during the autosampler run. For the flame AA,
specific wavelengths, slit widths and lamp currents were stated in the manual (Table
2.4). Daily, a calibration curve was prepared and the equation of the line was used for
quantification of each metal in the ecstasy tablets. Blank samples were tested after
every ten samples. Each standard and sample were analysed in triplicate and the mean
absorbance value of each was used. Injection volume was 20 jiL,
Table 2.3. Optimum conditions for graphite furnace Atomic Absorption spectrometer.
Element Wavelength (nm) Charring Temp. (°C) Atomisation Temp. (°C)
Al 309.3 1700 2500
Cr 357.9 1650 2500
Fe 248.3 1400 2400
Pb 283.3 850 1800
Zn 213.8 700 1800
Table 2.4. Optimum conditions for flame Atomic Absorption spectrometer.
Element Wavelength(nm) Slit Width (nm) Lamp Current (mA)
Ca 422.7 0.7 1 0
K 766.5 0.4 8
Mg 285.2 0.7 1 0
Na 589 0 . 2 8
80

HPLC method development & chemometric analysis of ecstasy & cocaine
2.6. Data analysis and chemometric procedures.
Conventional profiling of illicit drugs relies on a combination o f physical, chemical
and statistical techniques to establish links among seizures. In this study various
chemometric procedures were applied to the ecstasy chemical data sets to determine if
seizures could be linked. The chemical data sets used in this study consisted of the
active ingredients plus sugars (AS), metal data (MD) and all data combined (DC) for
the 183 individual ecstasy tablet samples (see Appendix Table A1 & A2). Variables
for AS data included MDMA, MDEA, amphetamine, caffeine lactose and sorbitol and
represent only compounds detected in samples. MD data variables were Al, Zn, Fe,
Mg, Ca, Cr, Pb, Na and K that were similarly detected in ecstasy samples,
2.6.1. Ecstasy data and pre-treatments.
Since all data sets were generated by different analytical techniques data pre-treatment
is required due to the differences in the scales between variables. There are two
standard pre-treatment methods, namely normalisation and standardisation (Miller &
Miller, 2005). Both of these statistical data transformation methods can be applied in
combination with logarithm and 4th square root derivatisation. Data pre-treatment
methods evaluated included the following:
1. Normalisation (N)
2. Normalisation & logarithm (N + Logio)
3. Normalisation & 4th square root (N + 4sqrt)
4. Standardisation (S)
5. Standardisation & logarithm (S + Logio)
6 . Standardisation & 4th square root (S + 4sqrt)
To reduce the complexity and to easily identify the appropriate pre-treatment method,
eight seizures were selected based on their discrete AS chemical data profile (Table
2.5, Table Al). Each seizure consisted of three tablets giving a combined sample set
of twenty-four for pre-treatment analysis. Each pre-treatment method was evaluated
by PCA and HCA methods to determine the most appropriate pre-treatment
method(s). The appropriate pre-treatment method was then applied to the entire
ecstasy data sets.
81

HPLC method development & chemometric analysis of ecstasy & cocaine
Table 2.5. Chemical composition of the eight selected ecstasy seizures used in pretreatment studies.
Seizure Batch No.
Chemical components
MDMA MDEA Amphet Caffeine Lactose Sorbitol
1314 S
15 S S
17 S
2 2 S
26 S
3055 Y
2.6.2. Ecstasy data pattern recognition.
Five different pattern recognition methods were evaluated to determine the suitability
of methods in classifying the various ecstasy tablet data sets. The pattern recognition
methods evaluated were:
1. Principal Component Analysis (PCA)
2. Hierarchal Cluster Analysis (HCA)
3. Pearson’s correlation coefficient
4. Linear Discriminant Analysis (LDA)
5. Artificial Neural Networks (ANN)
Principal Component Analysis (PCA) is a relatively straightforward procedure. The
data is reduced to the smallest number of components which describes the maximum
information of the data. The scores of the first two principal components were plotted
to produce a score plot, from which groupings, if any, are evident.
Hierarchal Cluster Analysis (HCA) is a statistical method that measure the distance
between two objects, if the distance is relatively small then the objects are clustered
together. The method by which the distance is measured can be calculated by
different cluster and interval methods. Seven different HCA cluster methods were
evaluated (Between groups, Within groups, Nearest neighbour, Furthest neighbour,
Centroid, Median and Wards) using the default Squared Euclidean interval setting of
82

HPLC method development & chemometric analysis o f ecstasy & cocaine
the SPSS software package. Interval methods included Euclidean, Square Euclidean,
Cosine, Pearson, Chebychev, Block and Minkowski. Each of these seven interval
methods were evaluated using the default ‘between groups’ cluster method setting of
the SPSS software package. For each test, the data set of the eight seizures used for
data pre-treatment studies (Table 2.5) was applied. Selection of the most appropriate
cluster and interval method was determined by the numbers of clusters formed by
each method. The established combination of cluster and interval methods was then
applied to all ecstasy data sets.
Pearson’s correlation coefficient measures the strength of the linear relationship
between two samples. The stronger this relationship is, the more likely the two
samples are related or linked. Pearson’s correlation coefficient is currently the method
of choice for the European Network of Forensic Science Institutes (ENFSI) for drug
profiling. A Microsoft excel macros file to calculate Pearson’s correlation was
supplied by the ENFSI. In order to use this statistical method to link different seizures
threshold values were assigned to each seizure. Threshold values are a number
assigned to an individual seizure, above which any subsequent tablet with a
coefficient equal to or higher than this value is highly correlated to that seizure and
therefore is strongly linked to that seizure. Tablets that are highly correlated should
have a value close to 100; those with no correlation have values close to zero. To
assign threshold values for each seizure, all three replicates of all three tablets within
each seizure were used. The lowest value that was returned was then used as the
threshold value for that seizure. Once each seizure had a threshold value assigned, all
seizures were correlated against each another. Those seizures with correlation
coefficients greater than the threshold value were considered linked.
Both Linear Discriminant Analysis (LDA) and Artificial Neural Networks (ANN)
require ‘trained’ data sets. In order to achieve this, groups within the data set had to
be identified and seizure membership assigned. Linear Discriminant Analysis (LDA)
was used to identify which data set and which pattern recognition method was the
most suitable. The groups generated by PC A, HCA and Pearson for each of the three
data sets were applied to LDA. The best data set combination and pattern recognition
method should yield a classification rate close to 1 0 0 %.
83

HPLC method development & chemomelric analysis of ecstasy & cocaine
As before when ANN was used for method development, there are three layers to any
network, an input layer, a hidden layer and an output layer. The input layer consisted
of the various quantities for all variables in each tablet while the output layer was the
classification groupings identified by unsupervised pattern recognition methods. As
before, one hundred networks were tested, using both three layer multilayer
perceptron and radial base function networks. The training algorithms were again a
combination of back propagation and conjugate descent. The maximum number of
neurons tested was set at fifty.
The rate at which each of the pattern recognition methods successfully classified the
tablets is reported, the advantages and disadvantages of each method are evaluated
and the final combination of data set, pre-treatment and pattern recognition method
are discussed. The chosen data pre-treatment and pattern recognition method was
applied to the ecstasy tablet data sets. Results from this highlighted possible links
between previously unrelated seizures which in theory could potentially allow for law
enforcement to identify dealer - user networks.

HPLC method development & chemometric analysis of ecstasy & cocaine
Chapter 3: HPLC method development.
85

HPLC method development & chemometric analysis of ecstasy & cocaine
3.1. Univariate HPLC method development for the analysis of ecstasy.
The design of the experimental procedure concentrated on the univariate method for
the development of a HPLC method for the analysis of ecstasy tablets. As such, each
chromatographic factor was considered individually, and the effect of the varying
factor evaluated on the performance for method development. The separation of a
large number of analytes by liquid chromatography is dependent on many variables
including stationary phase, mobile phase (type and quantity of organic solvent, ionic
strength of buffer, buffer pH), temperature and flow rate. For this study, all factors
were assessed for the separation and quantification of amphetamine type stimulants
from ecstasy. The quality of each separation was assessed by comparison of three
performance indicators: resolution (R), retention factor (k’) and height equivalent
theoretical plate (HETP).
3.1.1. Chromatographic factors.
Columns
Analyte separations were examined on the column chemistries associated with seven
different commercially available columns (Table 2.1). The analyte mixture contained
all six amphetamines; amphetamine, MDA, methamphetamine, MDMA, MDEA and
MBDB. The main differences between the columns are their physical dimensions and
the particulate or monolith nature of the stationary phase.
Mobile Phase
Water is a weak solvent and when used alone as the mobile phase, the equilibrium
between the stationary and mobile phase favors the stationary phase. This results in
maximum resolution however it also results in longer retention times (i.e. high
retention factors). To balance resolution with retention times, water tends to be mixed
with a stronger solvent (e.g. methanol or acetonitrile), which shortens the retention
times and reduces the resolution. The ratio o f water to organic solvent is very specific
to the separation required and is an important factor in method development. With
this method development, acetonitrile was the only organic solvent chosen based on
its chemical properties (Table 1.1). The UV cut off value off for acetonitrile is 195
nm, while for methanol it is 205 nm and tetrahydrofuran 215 nm. The selection of a
suitable organic solvent should preferably have a lower UV absorption cut off than the
86

HPLC method development & chemometric analysis of ecstasy & cocaine
analyte UV absorption value. Since sample analysis was performed at 200 nm,
acetonitrile was chosen as the preferable organic solvent due to its lower UV
absorption cut off value.
With each column, 0% acetonitrile produced the greatest retention times. As the
concentration of the acetonitrile increased, the retention times decreased. In addition,
a decrease of retention times lead to a decrease in resolution. With each column a
certain concentration of acetonitrile existed that had minimum retention times but
beyond which peaks were unresolved. For example, Figure 3.1 highlights the effects
of increasing acetonitrile concentration on analyte resolution. At 5% acetonitrile, all
six analytes are resolved in 14.4 minutes and resolution between peak 2 and 3 was
greater than 1, as calculated using the USP equation (see page 92). With increasing
acetonitrile concentration the retention time decreased, however peaks 2 and 3 were
not resolved when acetonitrile concentration was greater than 10%. The broad peaks
that are present at the start of the separation may be due to the use of methanol as the
sample solvent.
Retention time (minutes)
Figure 3.1. Chromatogram of the six ecstasy standard mixture resolved with the XTerra RP18 column at 5% and 15% acetonitrile solvent concentration, pH 3, 30°C, 20 \i\ sample injection, detection at 200 nm. Peak 1 = amphetamine, Peak 2 = MDA, Peak 3 = methamphetamine, Peak 4= MDMA, Peak 5 = MDEA, Peak 6 = MBDB.
87

HPLC method development & chemometric analysis of ecstasy & cocaine
All other columns investigated followed a similar pattern to that of the XTerra RP18
column. With six of the seven columns, analytes were resolved within a minimal time
of approximately 15 minutes. The final organic phase concentration was 3% for the
three monolith columns, 5% for the XTerra RP18, 10% for the Luna C 8 and, 13% for
the Luna C l 8 . There were slightly longer retention times with the Phenosphere C l8
column with the last peak eluting at 19.445 minutes (Figure 3.2.). Due to the
increased retention times for the Phenosphere C l 8 column, gradient elution method
was assessed for this column. Gradient elution involves varying the concentration of
the organic solvent in the mobile phase over the run time. The six ecstasy standard
mixture was injected using varying concentrations of the organic solvent. The most
appropriate gradient was 90% A (phosphate buffer): 10% B (acetonitrile) at T0 to 60%
A (phosphate buffer): 40% B (acetonitrile) at Tio. With this gradient elution, retention
times were reduced by 5.136 minutes and all six analytes were resolved in 14.309
minutes (Figure 3.2.).
R etention tim e (m inutes)
Figure 3.2. Chromatogram of the six ecstasy standard solution resolved with the Phenosphere C l 8 column under gradient elution and isocratic elution conditions, pH 3, 30°C, 20 |il sample injection, detection at 200 nm. Peak 1 = amphetamine, Peak 2 = MDA, Peak 3 = methamphetamine, Peak 4= MDMA, Peak 5 = MDEA, Peak 6 = MBDB,
88

HPLC method development & chemometnt analysis o f ecstasy & cocaine
The pH of a mobile phase is an important factor as it affects the ionisability o f analyte
and therefore greatly influences the selectivity and retention of ionisable compounds.
Phosphate buffer is a suitable buffer if analysis is at a low pH (2-3) as opposed to an
acetate or citrate buffers which are suitable for slightly higher pH levels (4-5).
Adequate buffer concentrations tend to be in the range 10-100 millimolar. Since
silica will dissolve, at or above pH 7 and at or below pH 2, a pH range between 2 and
7 is preferred for analysis. However, pH in the middle range of 3.5 to 8.5 tend to be
avoided, as large changes in retention times can occur with minor adjustments to pH
resulting in difficulties with reproducibility and validation studies. In addition,
analyte retention can be affected if the pH of the mobile phase is one pH unit within
the pKa of the compound being analysed. Since the pKa’s for all the amphetamines
studied were approximately 10 (amphetamine = 9.8, methamphetamine = 10.1,
MDMA = 9.9, MDA = 9.8, MDEA - 9.5, MBDB = 9.8), the phosphate buffer pH
conditions were investigated at pH 2.5, 3 and 3.5. Slight differences in peak shape
(peak symmetry was calculated using the equation As = b/a where a corresponds to
the width of the front of the peak and b the width of the tail of the peak (at 1 0 % peak
height) centred around the peak apex), and a is were observed for the three pH levels
examined, however pH did not affect the quality o f resolution to any great extent.
With the particulate columns, peak symmetry was best at pH 3 and pH 2.5 gave best
peak symmetry with the monolith columns.
Temperature
By increasing the temperature, higher flow rates can be achieved and enhanced
analyte mass transfer can occur, both o f which ultimately would decrease retention
times. Therefore the ideal temperature for each column should give the shortest
retention times without jeopardising resolution. Throughout the method development,
injections were made at 25°C. The effects of temperature were studied in increments
o f 5°C between the range of 25°C and 45°C. Slight decreases in retention times were
observed for each column as temperatures increased. The optimum temperature for
the Luna C8 , XTerra RPI8 and the three monolithic columns was 30°C, based on
peaks 2 and 3. The Phenosphere C l 8 and Luna C l 8 columns were optimal at 35°C.
These final temperature levels were chosen based on the resolution between the
critical peak pair of peaks 2 and 3. Figure 3.3 demonstrates the minimal effect of
8 9

HPLC method dc\clopmenl & chcmomctnc aiu lym of ecstasy & cocaine
temperature on the separation o f the six analytes at 25°C, 30°C, 35°C, 40°C and 45°C
for the Luna C l 8 column. Total analysis time was only reduced by 0.704 minutes
after the 20°C incremental increase.
Retention time (minutes)
Figure 3.3. Chromatogram of the six ecstasy standard solution resolved on the Luna C l 8 at five temperatures: 25°C, 30°C, 35°C, 40°C and 45°C. pH at 3, 20 jil sample injection, detection at 200 nm. Peak 1 = amphetamine, Peak 2 = MDA, Peak 3 = methamphetamine. Peak 4= MDMA, Peak 5 = MDEA, Peak 6 - MBDB.
Flow Rates
Flow rate is an important factor in method development. Solvent consumption should
be kept to a minimum to limit costs. The optimum flow rate should give a short
retention time, good resolution and low pressure. For Phenosphere, flow rates
between 0.5 mL min ' 1 and 2 mL min 1 were assessed and 1.75 mL min' 1 was chosen
(Figure 3.4.). The other particulate columns had internal diameters of 2 mm and 2.1
mm and the flow rates were reduced to prevent high backpressures. The flow rates
most suitable were 0.3 mL min ' 1 for the XTerra RP18 and 0.4 mL min ' 1 for the Luna
90

HPLC method development & chemomclnc analysis of ecstasy & cocaine
C8 and C l 8 . These flow rates were chosen based on optimal resolution with minimal
solvent consumption and column back pressure.
Retention time (minutes)
Figure 3.4. Chromatogram of the six ecstasy standard solution separated on the Phenosphere C l 8 column at five flow rates: 1, 1.25, 1.5, 1.75 and 2 mL m in 1. pH 3, 30°C, 20 il sample injection, detection at 200 nm. Peak 1 = amphetamine, Peak 2 = MDA, Peak 3 = methamphetamine. Peak 4 = MDMA, Peak 5 = MDEA, Peak 6 = MBDB.
The main factor which differentiates monolithic columns from the traditional
particulate columns is the ability to use higher flow rates without the usual
accompanying back pressure. The HPLC pump allowed for pump rates up to 9.999
mL m in 1. The flow rates for the monolithic columns could be increased significantly
due to the lower backpressure. The flow rates for these columns are discussed in
greater detail in Section 3.1.3. The most appropriate flow rates for Chromolith Flash,
Chromolith SpccdROD and Chromolith Performance were 1.5 mL m in 1, 4.5 mL min
1 and 8.5 mL m in 1, respectively.
9 1
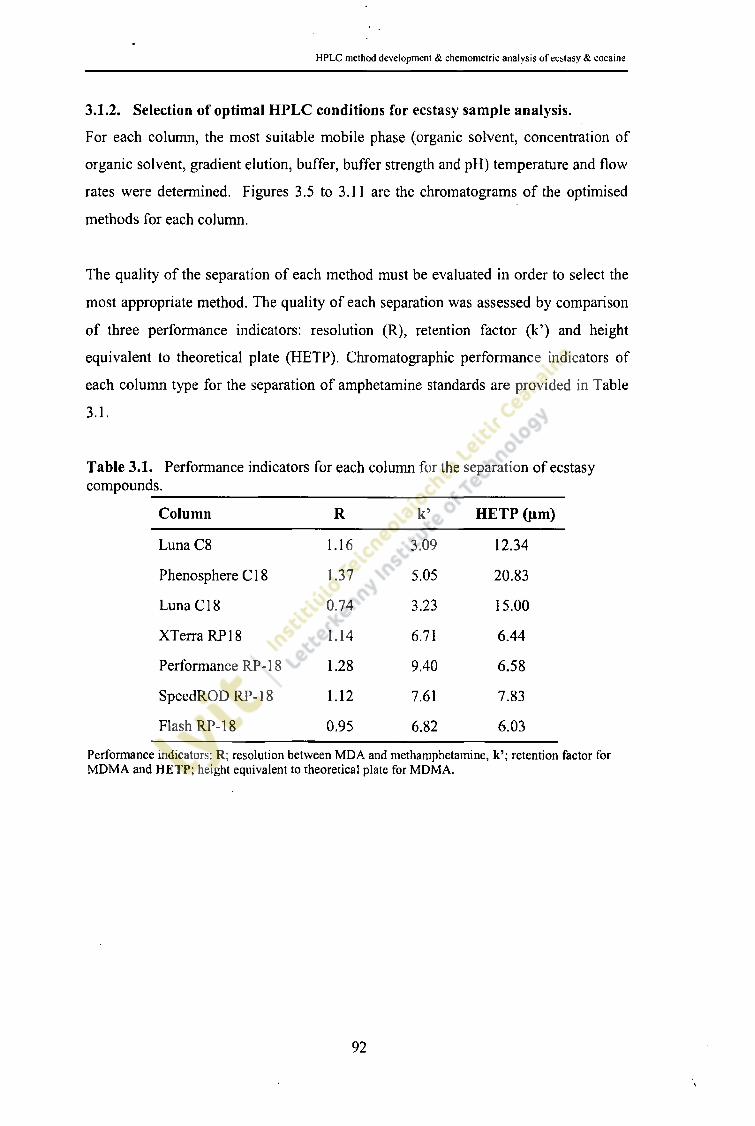
HPLC method development & chemometric analysis of ecstasy & cocaine
3.1.2. Selection of optimal HPLC conditions for ecstasy sample analysis.
For each column, the most suitable mobile phase (organic solvent, concentration of
organic solvent, gradient elution, buffer, buffer strength and pH) temperature and flow
rates were determined. Figures 3.5 to 3.11 are the chromatograms of the optimised
methods for each column.
The quality of the separation of each method must be evaluated in order to select the
most appropriate method. The quality of each separation was assessed by comparison
of three performance indicators: resolution (R), retention factor (k’) and height
equivalent to theoretical plate (HETP). Chromatographic performance indicators of
each column type for the separation o f amphetamine standards are provided in Table
3.1.
Table 3.1. Performance indicators for each column for the separation of ecstasy compounds.
Column R k1 HETP (jim)
Luna C8 1.16 3.09 12.34
Phenosphere C l 8 1.37 5.05 20.83
Luna C 18 0.74 3.23 15.00
XTerra RP18 1.14 6.71 6.44
Performance RP-18 1.28 9.40 6.58
SpeedROD RP-18 1 . 1 2 7.61 7.83
Flash RP-18 0.95 6.82 6.03
Performance indicators; R; resolution between MDA and methamphetamine, k ’; retention factor for MDMA and HETP; height equivalent to theoretical plate for MDMA.
92
\

HPLC method dcvclopmeni & chcmometric analysis o f ecstasy & cocaine
Retention time (minutes)
Figure 3.5. Chromatogram of the six ecstasy standard solution resolved on Luna C8 . Final chromatographic conditions were 90% 20 mM buffer: 10% acetonitrile, 0.4 mL min \ pH 3, 30°C, 20 ¿il sample injection, detection at 200 nm. Peak 1 = amphetamine. Peak 2 = MDA, Peak 3 = methamphetamine. Peak 4= MDMA, Peak 5 = MDEA, Peak 6 = MBDB.
Retention time (minutes)
Figure 3.6. Chromatogram of the six standard solution resolved on the Phenosphere C l 8 . Final chromatographic conditions were To 90% 20 mM buffer: 10% acetonitrile going to Tjo 60% buffer: 40% acetonitrile B, 1.75 mL m in'1, pH 3, 35nC, 20 ^ sample injection, detection at 200 nm. Peak 1 = amphetamine, Peak 2 = MDA, Peak 3 = methamphetamine, Peak 4 - MDMA, Peak 5 * MDEA, Peak 6 ■ MBDB.
93

HPLC method development & chemometric analysis of ecstasy & cocaine
Retention time (minutes)
Figure 3.7. Chromatogram of the six ecstasy standard solution resolved on Luna C l8 . Final chromatographic conditions were 87% 20 mM buffer: 13% acetonitrile, 0.4 mL m in 1, pH 3, 35°C, 20 1 sample injection, detection at 200 nm. Peak 1 = amphetamine, Peak 2 = MDA, Peak 3 = methamphetamine, Peak 4= MDMA, Peak 5 = MDEA, Peak 6 = MBDB.
Retention time (minutes)
Figure 3.8. Chromatogram of the six ecstasy standard solution resolved on Xterra RP18. Final chromatographic conditions were 95% 20 mM buffer: 5% acetonitrile, 0.3 mL min'1, pH 3, 30°C,20 \i\ sample injection, detection at 200 nm. Peak 1 = amphetamine, Peak 2 = MDA, Peak 3 = methamphetamine, Peak 4= MDMA, Peak 5 = MDEA, Peak 6 = MBDB.
94

HPLC method development & chemometric analysis of ecstasy & cocaine
Retention time (minutes)
Figure 3.9. Chromatogram of the six ecstasy standard solution resolved on Chromolith Performance RP18, 100 x 4.6 mm. Final chromatographic conditions were 97% 20 mM buffer: 3% acetonitrile, 8.5 mL min'1, pH 2.5, 30°C, 20 jil sample injection, detection at 200 nm. Peak 1 = amphetamine, Peak 2 = MDA, Peak 3 = methamphetamine, Peak 4= MDMA, Peak 5 = MDEA, Peak 6 = MBDB.
Retention time (minutest
Figure 3.10. Chromatogram of the six ecstasy standard solution resolved on Chromolith SpeedROD, RP18, 50 x 4.6 mm. Final chromatographic conditions were 97% 20 mM buffer: 3% acetonitrile, 4.5 mL min“1, pH 2.5, 30°C, 20 |il sample injection, detection at 200 nm. Peak 1 = amphetamine, Peak 3 = methamphetamine, Peak 2 = MDA, Peak 4 = MDMA, Peak 5 - MDEA, Peak 6 = MBDB.
95

HPLC method development & chemometric analysis of ecstasy & cocaine
Retention time (minutes)
Figure 3.11. Chromatogram of the six ecstasy standard solution resolved on the Chromolith Flash RP18, 25 x 4,6 mm. Final chromatographic conditions were 97% 20 mM buffer: 3% acetonitrile, 1.5 mL min-1, pH 2.5, 30°C, 20 il sample injection, detection at 200 nm, Peak 1 = amphetamine, Peak 3 = methamphetamine, Peak 2 = MDA, Peak 4 = MDMA, Peak 5 = MDEA, Peak 6 = MBDB.
The difference in peak heights in the seven chromatograms is due to standard
solutions of different concentrations being injected. A peak shift was observed with
peaks 2 and 3 when moving from the particulate columns to the monoliths. This can
occur and reasons may be due to silanol activity or endcapping.
For the separation of a large number of analytes, resolution is an important factor in
the analysis. Chromatograms are only useful if there is a good degree of separation
between each peak. Good resolution is defined as being greater than 1. Ideally, all
compounds should have a resolution greater than 1.5. The resolution of each analyte
was calculated by the ClassVp software, based on USP methods, using the following
equation:
R = —— (Equation 3.1)W2 +WX
Where R is the resolution between peak of interest (peak2) and the preceding peak
(peakl), tj and h are the retention times of peak 1 and peak 2; respectively and W\ and
W2 are the widths of the base o f components peak 1 and peak 2 respectively.
96

HPLC method development & chemometric analysis of ecstasy & cocaine
Methamphetamine (peak 3) and MDA (peak 2) were the two analytes that were most
difficult to resolve. Therefore, in order for a column and method to be successful, it is
critical that these two analytes have a resolution > 1 . Table 3.1 reports the resolution
between MDA and methamphetamine. Two columns, the Luna C l 8 and the Flash
RP-18, were unable to resolve these peaks satisfactorily, with resolutions < 1 for both
columns. All other columns had resolutions >1, however no column had an ideal
resolution >1.5. From this, it can be stated that the Luna C l 8 and the Flash RP-18 are
the least suitable columns (and method) for this analysis.
Retention factor (k’) indicates the interaction between the analyte and the stationary
phase, relative to the unretained compound. The optimum retention factor lies within
the range of 2 to 10. The retention factor was calculated using Class Vp software
package, based on USP methods, as follows:
Where k’ is the retention factor, ¿2 is the retention time of the peak of interest and tQ is
retention time of an unretamed compound. The average retention factors for all seven
columns were between 2 and 10. The values reported for the three monoliths and the
XTerra RP18 were higher than those of the three particulates LunaC 8 , Luna Cl 8 and
Phenosphere C l 8 (Table 3.1).
Efficiency, defined as the number of theoretical plates in a column, is the measure of
the sharpness of eluting peaks. The number of theoretical plates is affected by the
size of the particles, the length of the column and the quality of the procedure used to
pack the particles into the columns. The theoretical plates were calculated using
ClassVp software package as follows:
Where N is the theoretical plates, t is the retention time of the component and W is the
width of the base o f the component peak using the tangent method. The higher the
value of N, the more efficient the separation. As stated previously, efficiency is
dependent on column length. In this study, columns of four different lengths were
studied, 25 cm, 50 cm, 100 cm and 250 cm, and comparison based on their efficiency
(Equation 3.2)
N = ] 6 { w ) (Equation 3.3)
97

HPLC method development & chemometric analysis of ecstasy & cocaine
value is not technically correct. Alternatively, Height Equivalent to Theoretical Plate
(HETP)(fxm) can be used to directly compare columns of different lengths. HETP is
calculated as follows:
HETP = — (Equation 3.4)N
Where L is the length of the column and N is the number of theoretical plates. Low
values for HETP are desired for efficient separations. HETP values for the three
monoliths were significantly lower than those of the Luna C 8 , Luna C l8 and
Phenosphere C18 (Table 3.1). Although XTerra RP18 is the same length as the other
particulate columns (250 cm), its efficiency was similar to the three monolithic
columns, which could be explained by the hybrid technology of this column.
When choosing any of the methods developed for the routine analysis in the
laboratory, the quality of the separation is undoubtedly important. But one has to also
take into account the speed of the analysis and the costs incurred. As all columns
were consistent with each other in terms of separation quality, the choice of method
would lean towards one of the monolithic columns, as analyte separation was
achieved in shorter run times (Figure 3,9, 3.10 and 3.11). Within the monoliths, the
50 mm SpeedROD provided good quality separation with minimum solvent
consumption and run time. For these reasons, the method developed using the 50 mm
monolithic column was selected for the analysis of ecstasy samples (Figure 3.10).
3.1.3. Comparison of particulate and monolithic columns.
A comparative analysis of the performances of particulate and monolithic columns
was performed. This involved comparing the performance of the most successful
particulate column, the Waters XTerra, 5^m, 250 x 2.1 mm RP18 column with the
three monolithic columns. Measurement o f column backpressure and the creation of
Van Deemter plots allowed for comparative assessment.
The minimum analysis times for the complete separation of the six analytes using the
XTerra RP18 column was 14.512 minutes. In contrast the minimum analysis times
for the complete separation of the six analytes was 6.763 minutes for the Chromolith
Flash RP18, 25 x 4.6mm (1.5 mL m in'1), 4.160 minutes for the Chromolith
98

HPLC mrthod development & chenKMneinc analvsU of ecsu sv & cocaine
SpeedROD, RP18, 50 x 4.6 mm (4.5 mL m in 1) and 5.536 minutes for the Chromolith
Performance RP18, 100 x 4.6 mm (8.5 mL m in1). The effect o f different flow rates
on resolution was investigated using the Chromolith SpeedROD, RP-18, 50 x 4.6 mm
column. Resolution was not affected and analysis times were decreased from 18.3
minutes to 3.8 minutes when using flow rates from I mL min ' 1 to 5 mL min'1,
respectively (Figure 3.12).
Retention time (minutes)
F igu re 3.12. Chromatogram of the six standard solution resolved on the Chromolith SpeedROD, RP-18, 50 x 4.6 mm column at nine flow rates. The chromatographic conditions and elution order was as described in Figure 3.10.
Column backpressure was measured for each column flow rate up to recommended
pressure limit. Figure 3.13 shows column backpressure as a function o f flow rate for
each column type tested. Maximum flow rate of 3 mL min ' 1 could only be achieved
with the particulate column, while monolithic columns allowed for an increased flow
rate of up to 9 mL min ' with reduced back pressure. In addition the slope of the
monolithic column is much lower than that for the particulate, indicating the ability of
the monolithic to achieve higher flow rates without the backpressure.
9 9

HPLC method dcvelopmcnl & chcmomctric analysis of ecstasy & cocaine
4000
3500
>000
2 , 2500
2000
•aoU
1500
1000 ■ *
»00
I 2 ) 4 5 6 7 S 9
Flow rate (mL miir1)10
Figure 3.13. Comparison of column backpressure as a function o f flow rate for the XTerra RP18 • particulate column and the three Chromolith RP18 monolithic columns. Chromolith columns were o f varying lengths o f 25 mm ♦ , 50 mm ▲ and 1 0 0 mm ■.
140
o . -------- -------- - --------- —■ -0 1 2 ) 4 ) 6 7 1 9 10
Flow rate (mL min *)
Figure 3.14. Fitted van Deemter curves o f the plate height (H) vs. Flow rate for the XTerra RP18 • particulate column and three Chromolith R P-I8 columns. Chromolith columns were of varying lengths of 25 mm ♦ , 50 mm A and 100 mm m.
1 0 0

HPLC method development & chemometric analysis of ecstasy & cocaine
Van Deemter curves were created for the monolithic and particulate columns. Figure
3.14 shows the resulting plots for each column type. The flatter curve for each
monolithic column implies that these columns provide higher efficiency at high flow
rates compared to the particulate column. For example, the plate height for the
Chromolith SpeedROD, RP18, 50 x 4.6 mm at 7 mL min ' 1 is approximately the same
as that for the packed column at 3 mL m in'1. Therefore the monolithic column can be
run twice as fast as the particulate without sacrificing column efficiency.
3.1.4. Validation of univariate method developed.
Due to good separation of the six amphetamine analytes with reasonable analysis
times the Chromolith SpeedROD, RP-18, 50 mm x 4.6 mm was selected for
validation studies. Validation tests were carried out under the guidelines of the
International Conference on Harmonisation (ICH, 1996).
The highest precision for quantitative chromatography is obtained by the use of
internal standards because uncertainties produced by sample injection are avoided.
Here, a compound of known concentration that does not interfere in the analysis is
added to the sample mixture. Clomipramine, metoclopramide and propyl paraben are
pharmaceutical compounds that are of similar chemistry to the analytes of interest, but
have never been reported in any ecstasy sample. Each of the standards were prepared
at concentrations of 100 jag mL ' 1 and analysed by the HPLC method developed.
Metoclopramide was chosen as the most suitable internal standard. It had good
resolution from other analytes and gave a good response at the wavelength chosen,
200 nm.
Selectivity is the ability of the method to accurately measure the analyte response in
the presence of all potential sample components. This was a priority due to the many
possible components that may be present in ecstasy tablets. Acetaminophen,
acetyl salicylic acid, caffeine and phenacetin were possible adulterants tested. Figure
3.15 shows a chromatogram of the amphetamine type compounds, adulterants and
internal standard resolved on the Chromolith SpeedROD, RP>18, 50 x 4.6 mm
column. Peak resolution was calculated to be greater than 1 for all analytes.
1 0 1

HPLC method development & chemometric analysis of ecstasy & cocaine
Retention time (minutes)
Figure 3.15. Selectivity tests showing the separation of amphetamines, adulterants and internal standard on the Chromolith SpeedROD, RP18, 50 mm x 4.6 mm. The chromatographic conditions were phosphate buffer/acetonitrile (97/3, v/v) maintained in an isocratic mode with pH at 2.5, temperature at 30 °C flow rate at 3 mL min-1. The elution order was 7: acetaminophen, 1: amphetamine, 3: methamphetamine, 2: MDA, 4: MDMA, 5: MDEA, 8 : caffeine, 6 : MBDB, 9: acetylsalicylic acid, 10: phenacetin and 11 : metoclopramide
The linearity of an analytical method is its ability to elicit test results that are directly
proportional to the concentration of analyte in samples within a given range, or
proportional by means of a well defined mathematical transformation. A correlation
coefficient of >0.999 is considered acceptable. The y-intercept should be less than a
few percent of the response obtained for the analyte at the target level. Linearity was
evaluated using Mandel’s test comparing linear and quadratic models (Mandel, 1964).
For amphetamine, methamphetamine, MDA, MDMA and MDEA, the quadratic model
was not significantly better than the linear model at the 5% level. For MBDB,
deviation from linearity emerged (Fj, n = 4.91, P = 0.04). Linear regression analysis
was determined on sample concentrations ranging between 10 jig mL* 1 and 250 fig
mL ' 1 for six calibration points. Linear regression analysis indicated correlation
coefficients of >0.986 for each analyte tested (Table 3.2).
1 0 2

HPLC method development & chemometric analysis of ecstasy & cocaine
Table 3.2. Linearity studies for the Chromolith SpeedROD, RP18, 50 x 4.6 mm.
ParameterAmphetamine Standards
Amphetamine Methamphetamine MDA MDMA MDEA MBDB
Correlation coefficient (R2)
0.996 0.994 0.986 0.995 0.986 0.994
y-intercept -1.029 2.32 4.766 2.437 5.128 2.328
Slope 0.005 0.0005 0.00016 0.006 0.00016 0.00017
Residual sum of squares
4.131 5.195 7.791 2.931 7.725 5.034
The precision of a method is defined as the closeness of a number of replicate
measurements to each other and is affected mainly by the random error associated
with the method. Precision was expressed as relative standard deviation (% RSD).
For repeatability, ten replicates of 50, 100 and 250 jag mL_l were analysed on the
same day. These standards were again analysed in five replicates over five days to
establish inter day precision. Repeatabilities were in the range of 0.36-1.09% and
reproducibilities were in the range of 2.05-5.81% for five replicate determinations
over five days (Table 3.3).
Accuracy is defined as the closeness of an analysis, or mean of replicate analysis, to
the true value of the sample. With no reference materials available, the accuracy of
the method was determined by analysing spiked samples at six concentration levels
over the range of 25 and 500 jig mL'1. Results were calculated as experimental values
compared to theoretical values and were expressed as percent recovery. Accuracy of
the experiment results was always within 90.8-101.2% of the theoretical values (Table
3.3).
The limit of detection (LOD) is defined as the lowest concentration that produces a
response three times greater than the background noise and ten times higher for that of
the limit of quantification (LOQ). LODs for all six amphetamines ranged from 0.2-3
fig mL ' 1 and LOQs ranged from 0.6-10 jag mL*1. The limits were validated by
analysing standards prepared at the concentrations of the LOQs for each standard and
their precision and accuracy were reported (Table 3.3).
103

104
HPLC method development & chcmometric analysis of ecstasy & cocaine
Table 3.3. Validation studies for the Chromolith SpeedROD, RP18, 50 x 4.6 mm. Six amphetamine standards were tested for intra-day precision, inter-day precision, accuracy, limit o f detection (LOD) and limit of quantification (LOQ) under ICH guidelines.
P a r a m e te rAmphetamine Standards
Amphetamine Methamphetamine MDA MDMA MDEA MBDB
Intra-day Precision (% RSD)50 fig mL'1 0.65 0.51 0.44 0.36 0.85 0.69
100 p g m L 1 0.89 1.09 0.89 0.81 0.94 1.03
250 pgm L '1 0.85 0.63 0.81 0.74 1.01 0.98
Inter-day Precision (% RSD)50 ngm L '1 2.33 3.67 2.98 4.74 3.15 3.23
100 fig mL'1 2.07 3.74 3.53 2.49 2.05 2.84
250 ngm L '1 3.92 5.81 5.17 4.33 5.39 4.76
Accuracy (% Recovery)
50 pg mL'1 98.2 98.8 99.1 98.9 98.2 99.4
100 ngm L '1 100.3 97.3 97.8 100.6 99.1 97.8
250 ng mL*1 94.3 90.8 97.6 101.2 98.6 98.2
LOD fig mL’1 1 2 3 3 0.2 2
LOQ ME mL'1 3 6 9 10 0.6 6
Precision (% RSD) 1.02 0.93 0.95 0.81 0.86 0.92
Accuracy (% Recovery) 95.6 97.5 98.8 98.5 93.8 97.5

HPLC method development & chemometric analysis of ecstasy & cocaine
3.1.5, Conclusion.
The objective for this study was to develop a HPLC method for the separation of the
major components of ecstasy tablets. A highly selective HPLC method was
developed using the univariate approach. The step by step process examined
chromatographic factors such as column chemistry, type and quantity of organic
solvent, buffer strength, pH, temperature and flow rate. Chromatography
'demonstrated good separation of the amphetamines and typical adulterants. The
mobile phase of a phosphate buffer/acetonitrile satisfactorily separated MDMA and
its related compounds when used in conjunction with various stationary phases. The
final chromatographic conditions were 20 mM phosphate buffer/acetonitrile (97/3 v/v)
maintained in an isocratic mode, pH 2.5, temperature 30°C and flow rate of 3 mL
min ' 1 using the Chromolith SpeedROD, 50 x 4.6 mm column.
Comparisons of column types indicate that monolithic columns are more efficient
than particulate columns without loss of resolution. Column back pressure and van
Deemter plots demonstrated that the monolith columns provide higher efficiency at
higher flow rates when compared to the particulate column without loss of peak
resolution or selectivity. Monolithic columns reduced the retention times from
approximately 18.3 minutes to 3.8 minutes resulting in faster separation without
sacrificing resolution (Figure 3.12). The method developed for the monolith column,
the Chromolith SpeedROD 50 x 4.6 mm was validated to ICH standards. This study
demonstrates the suitability of the method for the routine analysis of ecstasy tablets
and the practicality of the monolith column.
105

HPLC method development & chemometric analysis of ecstasy & cocaine
3.2. M ultivariate HPLC method development for the analysis of cocaine.
Multivariate method development is the application of statistical and mathematical
models to the chemical separation of analytes. The separation of a large number of
analytes by liquid chromatography is dependent on many variables: columns, organic
solvent, pH, gradient elution and solvent strength, flow rates and temperature. The
optimisation of a method could in theory be time consuming. Alternatively,
multivariate method development simultaneously examines all chromatographic
separation factors to determine optimum performance. Data generated by the
multivariate approach can be used to calculate a mathematical model with which to
obtain response surfaces (Baranda et al. 2005, Medenica et al. 2004, Soni et al. 2007,
Wang et al. 2006, Zhang et al. 2005). A response surface is a 3D plot used to
illustrate the data from the optimisation analysis and is created by the use of artificial
neural networks (Boti et al. 2009, Jancic-Stojanovic et al. 2009, Tran et al. 2007,
Webb et a l 2009). By using multivariate analysis, chromatographic experiments may
be designed in order to give maximum information from as few experiments as
possible. With the use of an optimisation strategy, the time taken for method
development may be reduced considerably.
3.2.1. M ultivariate method development.
The chromatographic factors that were studied were strength of organic solvent, ionic
strength of buffer, temperature, pH, and flow rates. These were chosen as the most
influential factors on the analyte separation based on preliminary experiments (data
not shown). A 25' 1 fractional factorial design was created using the Minitab software
and used as the basis of the experimental procedure (Table 2.2.). Resolutions between
each peak and its preceding peak, retention factors and efficiencies and each of their
averages were calculated for each experimental separation and referred to as
‘observed’ data (Table 3.4 - 3.6). Each dataset was then used to construct a neural
network that would best illustrate the relationship between the chromatographic
factors and the performance indicators. An alternative calculation that could be made
is the ‘resolution normalised’ where the product of all the resolution values is divided
by the average resolution value.
106

HPLC method development & chemometric analysis of ecstasy & cocaine
Both Multi Layer Perceptron (MLP) and Radial Base Function (RBF) networks were
investigated. For each of the six outputs, 100 networks were tested and the best
performing networks with the highest performance and lowest associated error were
identified (Table 3.7). From these, the predicted values were plotted against the
observed values. The correlation for each was then calculated. The combination of
data set & network that best describes the separation was chosen based on the
correlation values. That network with the highest correlation values was chosen as
the best illustration of the separation.
107

HPLC method development & chemometric analysis of ccstasv & cocaine
Table 3.4. Experimental retention factor (k’) values and k’avc values obtained for eight components of cocaine in sixteen discrete experiments
Expt. Cocaine analytes AverageNo Procaine Caffeine Lidocaine Prilocaine ASA* Cocaine Phenacetin Benzocaine (k\v,)
1 0.54 1.26 2.05 3.28 5.33 JJ.10 18.44 26.85 8.61 •'
2 1.41 2.28 3.72 5.74 7.13 13.44 20.74 29.95 10.55
~*°*Z 1.29 1.29 1.29 ” " 4.37 11.80 " 3.62 ' i
4 0.56 1.31 2.04 3.12 3-72 6.04 7.09 16.51 5.05
n v " " 0.40 0.88 2.18 3.40 4.24 13.77 19.34 31.51 9.47
6 0.43 0.94 2.35 3.51 4.34 13.89 19.73 32.88 9.76
0.56 1.30 2.09 5.22 6.36 12.30 18.62 27.47 9.24
8 0.32 0.43 0.99 0.99 2.48 3.82 6.50 9.05 3.07
r . 9 _ 0.44 0.44 1.13 1.13 1.43 4.23 7.93 10.96 3.46 |
10 0.19 0.19 0.34 0.34 0.92 1.96 3.62 7.01 1.82
r r z : ;0.21 0.21 0.41 0.41 0.72 2.05 4.08 6.54 1.83
12 0.46 0.46 1.15 1.15 3.05 4.46 7.95 12.10 3.85
0.23 ' 0.44 0.77 0.77 2.23 5.03 7.21 8.74 3.18 I
14 0.97 2.17 2.90 4.12 5.15 17.26 19.93 25.35 9.73
' 0.19 0.42 0.53 0.53 1.59 3.84 5.52 6.64 2.41
16 0.34 0.77 1.73 3.36 4.09 12.53 15.55 20.65 7.38
ASA* = Acetyl salicylic acid

10Q
HPLC method development & cheniometric analysis of ecstasy & cocaine
Expt. Cocaineanalytes AverageNo Procaine Caffeine Lidocaine Prilocaine ASA* Cocaine Phenacetin Benzocaine (R.v.)
i 1 1.87 2.18 2.11 2.68 3.03 2.58 4.43 3.67 2.82 i
2 4.47 2.34 3.18 3.00 1.47 2.90 3.81 3.54 3.09
[L - 3 1.13 0.00 1.13 0.00 0.00 2.96 2.15 4.48
" 148 J4 2.82 2.91 2.45 3.31 1.54 1.28 1.36 7.45 2.89
j 5 1.52 1.42 3.01 1.69 0.63 14.92 5.38 4.59 4.15 !
6 2.26 1.91 4.18 1.95 0.83 3.11 2.22 5.79 2.78r ' i
7 6.01 3.02 4.36 3.94 1.66 4.58 4.36 9.99 4.74 j
8 1.48 0.50 5.28 0.00 8.70 2.25 4.88 2.90 3.25r ” [_ 9 1.75 o;oo 1.59 0,00 0.55 2.76 6.00 2.78 1.93 ;
10 1.28 0.00 0.34 0.00 3.94 0.82 3.20 4.93 1.81
i 11 1.45 0.00 . 1.68 0.00 0.84 2.49 2.85 3.04: i f i !
ri
¡2 1.08 0.00 1.43 0,00 3.69 J.24 4.63 3.23 1.91
13 1.45 1.27 0.82 0.00 2.66 0.93 2.95 1.06 1.39 j
14 3.18 3.21 1.68 1.76 0.83 6.42 1.28 2.29 2.58
ii_ 15 0.98 0.92 . 0.22 0.00 1.28 3.96 6.91 3.47 2.22 "j
16 1.71 1.94 3.80 2.46 0.98 6.25 2.15 2.94 2.78
ASA* = Acetylsalicylic acid

Uli
HPLC method development & chcmometric analysis of ecstasy & cocaine
in sixteen discrete experiments.
Expt. Cocaine analytes Average(N.w)No Procaine Caffeine Lidocaine Pri locarne ASA* Cocaine Phenacetin Benzocaine
L .......... 413 637 955 1068 932 1452 1448 1925 1104 !
2 715 1156 1330 1047 957 1308 1502 1754 1221
104 104 289 289 289 768 162 ] 825 479
4 807 988 1618 2249 1850 1301 1773 1578 1521
u t z : 451 328 809 312 157 957 1543 1620 772 '
6 971 496 1696 439 342 298 2117 2118 1060
1326 1326 2069 2921 1709 2288 2225 1961 1978
s 495 727 856 856 1651 1531 2454 1209 1222
n r . r "412 412 212 212 346 1567 2548 1064 847 j
10 528 528 599 599 688 699 984 1664 786
L 11 355 355 533 533 195 249 285 304. - 2 5J L J
12 149 149 310 310 903 1062 1825 912 703
l Z ì ì t : 295 315 206 206 455 1248 1705 342' 597 ~]
14 481 1073 1075 496 249 1290 1541 1643 981
l x : : : 1112 257 89 89 454 1573 1856 2248 960
16 757 796 1866 636 639 1678 1970 1909 1281
ASA* = Acetylsalicylic acid

HPLC method development & chemometric analysis of ecstasy & cocaine
Table 3.7. The best performing ANN for each of the experimental data sets.
Data A TVT1VT - Performance ErrorSet AJNiN
Training Selection Test Training Selection Test
k’ RBF 5:5-2-8:8 0.854 1.309 0.849 1.329 1.416 4.628
k’* ave RBF 5:5-1 -1:1 0.851 0.828 0.632 0.253 0.230 0.290
R RBF 4:4-1-8:8 0.907 0.677 0.998 0.458 0.443 0.398
Rave RBF 4:4-2-l:l 0.961 0.826 0.831 0.855 0.874 0.509
N RBF 5:5-1 -8 :8 0.989 0.990 0.889 0 . 0 0 2 0 . 0 0 1 0.005
Nave RBF 5:5-l-l: 1 0.997 0.963 0.987 0.003 0.004 0.006k \ Retention factor for each analyte; k \ ve. Average retention factor for all analytes; R. Resolution for each analyte; Rave. Average resolution for all analytes; N. Efficiency value for each analyte; Nave. Average efficiency value for all analytes
Ideally, the best network should be able to predict the values exactly, thus giving a
perfect correlation (i.e. R =1) when plotted against the experimental values. Overall,
resolution as a performance indicator produced the most correlated data. The R data
set resulted in correlation values ranging from 0.8026 to 0.9744 for each analyte and
the Rave data set had a correlation vaiue of 0.9382. The k’ data set had correlation
values ranging from 0.2739 to 0.8263, with the k’ave data set having a correlation
value of 0.38] 9. Similarly, the efficiency performance indicator produced values
ranging from 0.6080 to 0.9270 for the each analyte for N, and 0.8109 for the Nave data
set. Comparison of the correlation values for each of the predicted values versus the
observed values (the experimental data) indicated that the combination of the Rave data
set with its network best describes the analyte separation. When plotted the Rave data
set produced a correlation o f 0.9382 for the network RBF 4:4-2-1:1 (Figure 3.16).
The Rave data set resulted in a neural network constructed as RBF 4:4-2-l:l (Figure
3.17). This means that four of the five inputs (% acetonitrile, pH, Ionic strength,
temperature) were used as inputs, two neurons were in the hidden layer and there was
the one output (the Rave value). The algorithm used to train the network was KM, KN,
PI (K-means, center assignment, K-nearest neighbor, deviation assignment, PI,
pseudo invert7 linear least squares optimisation).
I l l

HPLC method devckjpmcni & chcmomclnc arwlvsi» of ccstaftv & cocaine
i *>
■g »01C- 2
0 0.3 I 1 3 2 2.5 J 3 3 4 4 3 3
Observed R^c values
Figure 3.16. Linear regression of predicted versus observed values for Ravc data set using the ANN of RBF 4:4-2-1:1.
Input Layer Hidden Layer Output Layer
Acetonitrile
pH
Ionic Strength
Temperature
F igu re 3.17. Illustration of the ANN: RBF 4:4-2-1:1.
1 1 2

HPLC method development & chemometnc analysis o f ecstasy & cocaine
3.2 .2 . R esp on se Surfaces.
As the neural network for the Ravc data set was the best performing ANN, it was this
network that was chosen to illustrate the separation in the form o f response surfaces.
Using these response surfaces the final chromatographic conditions were selected for
the separation of the eight analytes (Figures 3.18 - 3.20). The red region of each
response surface signifies the area in which Ra e value is at its highest. As it is a high
Ravc value that is desired, it is in this area in which the optimal separation is achieved.
From each of the response surfaces, there were no precise levels for each of the
factors, a range o f levels were produced. For optimal separation, levels o f acetonitrile
between 12% and 16% and pH values between 2.9 and 3.3 would be suitable (Figure
3.18), along with temperature between 32 and 36 °C (Figure 3.19) and an ionic
strength between 15 and 45 mM (Figure 3.20).
Figure 3 .18 . Response surface o f Rav* values with acctonitrilc and pH using the ANN of RBF 4:4-2-1:1.
1 1 3

HPLC method development & chemometric analysis o f ecstasy & cocaine
F igure 3.19. Response surface of Rave values with acetonitrile and temperature using the ANN of RBF 4:4-2-1:1.
Figure 3.20. Response surface of Ravc values with acetonitrile and ionic strength using the ANN of RBF 4:4-2-1:1.
1 1 4

HPLC method development & chemometric analysis of ecstasy & cocaine
The final chromatographic conditions chosen were a mobile phase consisting of
phosphate buffer/acetonitrile (85/15, v/v), the buffer at 20 mM ionic strength, pH 3,
flow rate at 1 mL min-1 and a column temperature of 35°C. These levels are all
within the desired range for optimal separation. Figure 3.21 is a chromatogram of the
separation of the analytes under the optimised chromatographic conditions.
Retention time (minutes)
Figure 3.21. Chromatogram of the eight analytes including the internal standard, metoclopramide using the optimised chromatographic conditions. The mobile phase was phosphate buffer/acetonitrile (85/15, v/v) and flow rate was 1 mL min-1. Temperature was maintained at 35°C, pH at 3, and detection was at 200 nm, The column used was a Waters XBridge C l8, 50 x 4.6 mm, particle size 3.5 |im. The elution order (retention time in minutes) was: solvent peak (0.33), 1: procaine (0.64) 2: caffeine (0.83), 3: lidocaine (1.08), 4: prilocaine (2.44), 5: acetylsalicylic acid (2.91), 6: metoclopramide (3.27), 7: cocaine (3.61), 8: phenacetin (5.82), and 9: benzocaine (7.22).

HPLC method development & chemometric analysis of ecstasy & cocaine
3.2.3. Validation of multivariate method developed.
Validation was carried out under the guidelines of ICH. Linearity was evaluated
using Mandel’s test, comparing linear and quadratic models. For all the cocaine
analytes tested, the quadratic model was not significantly better than the linear model
at the 5% level, Linear regression analysis was performed between 50 and 500 ig
mL“1 at five calibration points and correlation coefficients of >0.987 for each analyte
were observed (Table 3.8).
Precision was expressed as relative standard deviation (% RSD). For intra-day, ten
replicates o f 100, 250 and 500 jug mL-1 were analysed on the same day. These
standards were analysed in five replicates over five days to establish inter-day
precision (Table 3.8). Intra-day precision values were in the range of 0.27-1.06% and
inter-day values were in the range of 0.83-4.58% for five replicate determinations
over five days (Table 3.3).
The accuracy of the method was determined by analysing spiked samples at three
concentration levels (300, 250 and 500 \ig mL*1), with three replicates of each. Results
were calculated as experimental values compared to theoretical values and were
expressed as percent recovery (Table 3.8). Accuracy of the experiment results was
always within 95.6-100.3% of the theoretical values (Table 3.3).
The limit of detection was calculated by LOD = 3.3a/S, where a is the standard
deviation of the response of the blank and S is the slope of the calibration curve. The
limit of quantification was calculated by LOQ - 10a/S under the ICH guidelines.
LODs for all compounds ranged from 0.2-1.9 \ig mL'1 and LOQs ranged from 0.51-
5.5 \ig mL'1.
1 1 6

11
7
HPLC method developmenl & chcmoroetrìe analysis of ecstasy & cocaine
Table 3.8. Validation studies for the Waters XBridge Cl 8 50 x 4.6 mm. Cocaine and related compounds were tested for repeatability, intermediate precision, accuracy, linearity, limit of detection (LOD) and limit of quantification (LOQ).
ParameterCocaine Standards
Cocaine Lidocaine Prilocaine Procaine Benzocaine Phenacetin Caffeine Acetyl. Acid
Intra-day Precision (% RSD)
100 ng mL'1 0.95 1.05 1.04 1.01 0.92 0.67 0.61 1.91
250 ngmL'1 0.94 0.87 1.06 0.79 0.96 0.36 0.44 0.29
500 figmL0 1.04 1.01 0.98 0.94 1.02 0.77 0.27 0.35
Inter-day Precision (% RSD)
100 ngmL'1 2.69 3.47 2.63 3.65 2.96 2.56 0.83 1.57
250 /JgmL'1 2.22 2,87 3.33 3.41 2.90 3.12 2.40 1.96
500 ngmL'1 3.63 4.41 4.23 3.29 4.25 3.39 4,88 4.58
Accuracy (%Recovery)
100 ngmL'1 98.3 96.2 97.8 99.0 96.5 97.8 98.6 97.6
250 fig mL'1 95.6 98.6 96.4 97.4 99.6 100,3 98.7 96.5
500 jigmL’1 96.6 96.3 97.8 99.4 97.8 97.4 97,6 98.2
Linearity ( R2) 0.998 0.997 0.996 0.997 0.998 0.991 0.987 0.992
LOD jig mL’1 1 1.9 0.7 1.8 2 0.25 0.2 0.5
LOQ pg mL'1 3.3 5.5 1.9 5.2 6 0.77 0.51 1.52

HPLC method development & chemometric analysis of ecstasy & cocaine
3.2.4. Conclusions.
A HPLC method was developed for the separation of the major components of
cocaine samples. This was performed using an alternative multivariate method
development approach. Chromatographic factors such as quantity of organic solvent,
buffer strength, pH, temperature, flow rate were assessed in combination with each
other. A two level factorial design was created and used as the basis of the
experimental procedure (Table 2.2.). The quality of the separation was based on the
performance indicators of resolution (R), retention factor (k5) and efficiency (N) for
each analyte. In describing the relationship between the chromatographic factors and
the performance indicators, regression analysis in the form of Artificial Neural
Networks (ANN) was applied using Trajan Neural Network software. The most
successful neural network was then used to plot response surfaces (Figures 3.18-
3.20). Based on these response surfaces the optimal chromatographic conditions for
the separation of the cocaine analytes were chosen. These conditions selected were a
mobile phase consisting of 20 mM phosphate buffer/acetonitrile (85/15, v/v)
maintained in an isocratic mode, pH at 3, flow rate at 1 mL min-1, column
temperature at 35°C with Waters XBridge C l8 50 x 4.6 mm, particle size 3.5 [im
column and sample detection at 200 nm. All eight analytes under investigation were
separated under ten minutes with good resolution using the optimised
chromatographic conditions developed (Figure 3.21). Validation studies for the
method were carried out under the guidelines of the ICH (Table 3.8).
The application of neural networks and response surfaces to this method development
was an attractive alternative to the laborious step-by-step process that was involved in
univariate method development previously applied to the ecstasy. Although there is
the initial expense of purchasing the Trajan software and the steep learning curve
associated with it, once established within a laboratory, this process of method
development could be applicable to any complex separation.
1 1 8

HPLC method development & chemometric analysis of ecstasy & cocaine
Chapter 4: Physical and chemical analysis of illicit drug samples.
119

HPLC method development & chemometric analysis of ecstasy & cocaine
4.1. Ecstasy analysis.
A definition of drug profiling may be summarised as “the extraction of a drug
sample’s chemical and/or physical profile, to be used in the application o f policies
against the illegal use of drugs” (Esseiva et al. 2007). Drug profiling involves
assembling all information on all aspects of the drug of interest, most notably the
physical and chemical data. Physical data pertains to the visual and measurable
characteristics of the seizure. Visual characteristics include colour, format (i.e.
tablet/powder/plant/capsule) or logo and physical characteristics include weight,
diameter, thickness and height. Chemical data involves analytical techniques and
instrumentation, where the main ingredients of the drug is identified and/or quantified.
Frequently excipients, adulterants, binders and synthetic by-products are also
determined. Profiling drugs enables linkage of previously unrelated seizures, thus
allowing law enforcement personnel to apprehend both dealers and/or clandestine labs
and in turn reduce the supply of drugs (see Chapter 5).
4.1.1. Physical profile of ecstasy.
In this study, 183 ecstasy tablets were analysed for their physical characteristics of
logo, colour, weight, diameter and thickness. Recorded physical data are provided in
Table Al (Appendix). A total of 20 different logos were recorded and three tablets
contained no logo (Figure 4.1). The most frequent logos were ‘Mitsubishi’ logo
(24.6% of tablets analysed), ‘Bird’ logo (9.8% of tablets analysed) and ‘M&M’s’ logo
(8.2% of tablets analysed). Other logos included ‘Euro’, ‘Durex’, ‘Smirnoff,
‘Armani’, ‘Motorola’, ‘Chi’, ‘Rolex’, ‘Dexter’, ‘V2’, ‘Tasmanian Devil’, ‘Red Bull’,
‘Horse’, ‘Smiley’, ‘Rolls Royce’, ‘Superman’, ‘Coca Cola’ and ‘Heart’.
120

HP L i' method development & chemometric analvíi» of ecstasy & cocaine
Mrtwjbtvhi Bird mim'i
B atch * » 1 .* . 21. i 1 . 2 i . i l . M S* » . J7 . » A4 47. SO.S*
MWM
Batch*» S4 SS. 60. H
e*uKNo 4 .7 .1 . Batch*» 71. 24.14. 1*. 12 TV 40 41
Owe« Rod Boll
Batch Ho-14. 42. Batch No 17. 99.41 4$
ÍU40 Crown Saw nod
/ A I r " I
latch Nor JO. J4lM
CociCoU
BatchNo 10. 22. SI
Ho t *
MikNaU».44
Unity
□ □ □B a tch * , 4S 49 Batch No S& 57 Bate h No 11. S IS2
Uvnanun Devi
■ §
Batch No 14
Superman
Batch Nor 90
Roth Royer
Batch No 29
Dexler V2 Motorola
Batch No 11
Armant
m
Batch No; 12
Chi
B atchN o S
Nologo
Batch No 7 Batch No 4 Batch No S
Figure 4 .1 . An image of all 21 logo types and corresponding seizure batch numbers for ecstasy samples used in this study.
1 2 1

HPLC method development & chemometric analysis of ecstasy & cocaine
Weight, diameter and thickness are all measurements that can be reported directly
without any discrepancy. Whilst the weight o f the tablet is always reported, rarely are
diameter and thickness reported. In this study tablet weights ranged from 183 mg to
370.6 mg with an average of 260.9 mg (Figure 4.2). The distribution o f weight of the
tablets may indicate three sub groupings within the sample set. Callipers were used to
determine diameter and thickness. Diameter o f the tablets ranged from 8 mm to 12
mm (Figure 4.3) and thickness ranged from 2.5 mm to 6 mm (Figure 4.4).
Tablet weight (m g)
Figure 4.2. Distribution of weights within the 183 ecstasy tablets analysed.
JO
2i
10IX
i 15 IBsZ 10
I9 10 II
Tablet diametcT(mm)
Figure 4.3. Distribution of tablet diameters within the 183 ecstasy tablets analysed.
1 2 2
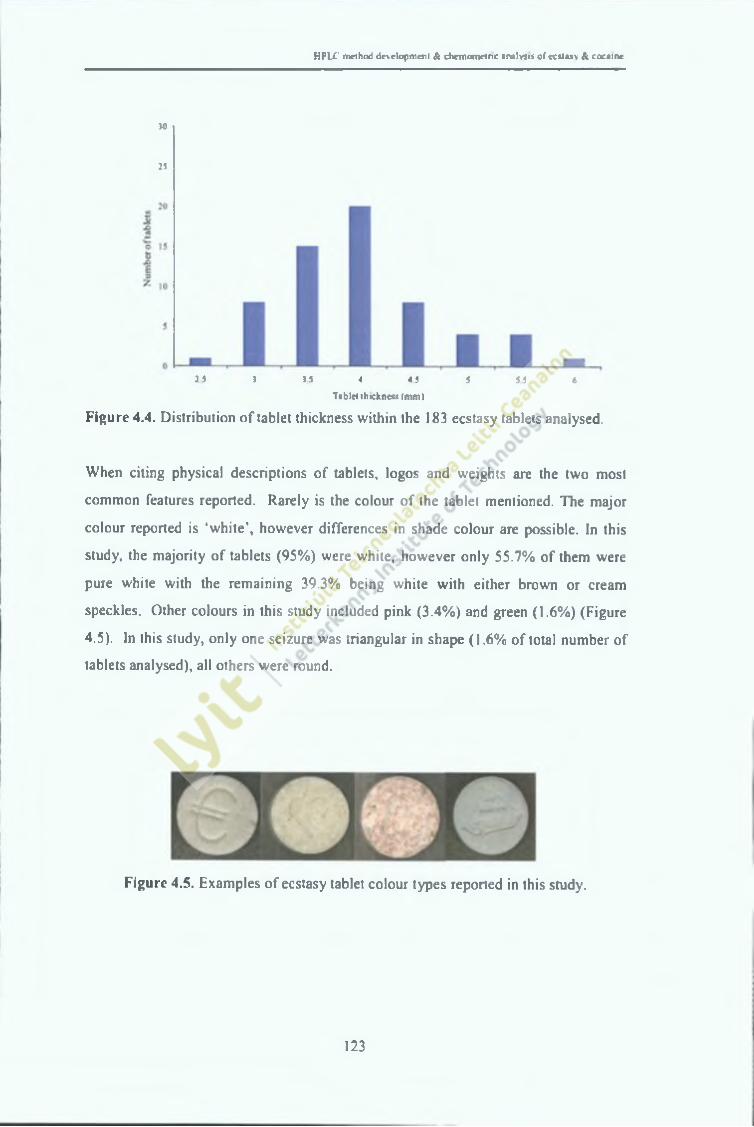
HPLC method development & chcmometnc analysis of ccstasv & cocaine
30
25
2 5 3 3 5 4 4 5 5 5 5 6
Tablet thickness (mm)
Figure 4.4. Distribution o f tablet thickness within the 183 ecstasy tablets analysed.
When citing physical descriptions of tablets, logos and weights are the two most
common features reported. Rarely is the colour of the tablet mentioned. The major
colour reported is ‘white’, however differences in shade colour are possible. In this
study, the majority of tablets (95%) were white, however only 55.7% of them were
pure white with the remaining 39.3% being white with either brown or cream
speckles. Other colours in this study included pink (3.4%) and green (1.6%) (Figure
4.5). In this study, only one seizure was triangular in shape (1.6% of total number of
tablets analysed), all others were round.
Figure 4.5. Examples of ecstasy tablet colour types reported in this study.
123

HPLC method development & chemometric analysis of ecstasy & cocaine
4.1.2. Chemical analysis of ecstasy.
The determination of the active ingredients and adulterants within ecstasy tablet
samples were performed using the validated HPLC method described in section 3.1.
Sugar analysis was carried out by the method by described in section 2.4. Figure 4.6
is a chromatogram from a typical ecstasy sample with MDMA, amphetamine and
caffeine present.
Retention time (minutes)
Figure 4.6. Components of a sample ecstasy tablet resolved on the Chromolith SpeedROD, RP18, 50 x 4.6 mm. The chromatographic conditions were phosphate buffer/acetonitrile (97/3 v/v) maintained in an isocratic mode, pH 2.5, temperature 30°C and flow rate of 3 mL min'1. Detection was recorded at 200 nm. The elution order was 1: amphetamine, 2: MDMA and 3: caffeine.
1 2 4

bei
IÍPLC method development & chemomclric analysis of ecstasy & cocaine
Table 4.1. Major drug components present in 183 samples of ecstasy tablets from the Republic of Ireland seized in 2001 and 2003.
0/ C oncentration of component in ecstasy tablets (mg/tablet)1 aoietPnm nnnpntc
/oO ccurrence MDMA MDEA Caffeine AmphetamineV^UIIl|JUJlCIIl9
Mean ± SD Range Mean ± SD Range Mean ± SD Range Mean ± SD Range
MDMA only 68.8 76.6 ± 16.7 41 .4 -125 .9 - - • - -
MDMA & Caffeine 14.8 64.3 ± 12.3 37.6 - 89.5 - 1.7± 0.8 0.5 -3.5 - -
MDMA & MDEA & Caffeine 6.6 33.7 ±58.3 5.6 - 69.6 5.0 ±4 .5 0 .4-12.7 0.8 ±0.1 0 .4 - 1.1 - *
MDMA & MDEA 6.6 78.8 ± 19.8 47.7 - 125.5 4.1 ±3 .2 0.3 -20.0 - - - -
MDMA & Amphetamine & Caffeine 1.6 27.0± 4.1 23 .7-31 .7 - 0.2 ± 0.04 0.1 -0.2 5.4 ±0.7 4 .9 -6 .3
Amphetamine only 1.6 - - - - * 6.7 ± 1.6 4.9 - 8.2

HPLC method development & chemometric analysis of ecstasy & cocaine
Using the developed method, six possible drug components were identified and
quantified in the samples, along with four commonly used adulterants. MDMA,
MDEA, amphetamine and caffeine were the main components present in the 183
samples analysed, with MDMA occurring in 98.4% of samples tested (Table 4.1),
Three tablets did not contain any MDMA, but amphetamine only. A wide variety of
combinations of each of the four compounds were present in the samples.
Quantification of the components was by the internal standard method. Depending on
the batch sample analysed, MDMA concentration ranged from 5.6 - 125,9 mg/tablet.
Concentrations for other compounds were much less, MDEA ranging from 0.3 - 20
mg/tablet, amphetamine ranging from 4.9 - 8.2 mg/tablet and caffeine ranging from
0.1 - 3.5 mg/tablet.
Sugars are often found in ecstasy tablets and other illegal drugs. They tend to be
inexpensive and are un-controlled and as a consequence are a popular material to add
bulk to the tablet. The chromatographic method used for sugar determination allowed
for the detection and quantification of fructose, glucose, inositol, lactose, mannitol,
sorbitol and sucrose (Section 2.4). Only two sugars, lactose and sorbitol were
detected in the 183 tablets analysed. The majority of the samples (147) contained
lactose only (80.3%). Eighteen samples (9.9%) contained sorbitol only. One batch,
consisting of three tablets, contained both sorbitol and lactose (Figure 4.7) while the
remaining fifteen tablets contained no sugars. A list of the sugars, quantities and
combinations are given in Table 4.2.
126

HPLC method development & chemometric analysis o f ecstasy & cocaine
Retention tim e (m inutes)
Figure 4.7. Sugar components of an ecstasy tablet resolved on the Phenomenex Luna NH2 column, 250 x 4.6 mm. Conditions were acetonitrile/water (70/30), temperature of 30 °C and flow rate was at 0.75 mL min*1. The elution order was 1: internal standard, 2: Lactose, 3: Sorbitol.
In the lactose only samples, concentrations ranged from 33.9 mg/tablet to 230
mg/tablet, with an average concentration of 132 ± 53.3 mg/tablet. Expressed as
percentages, 17.1% was the minimum concentration of lactose in a tablet and 76.3%
was the maximum concentration in a tablet. In the sorbitol only samples, the
minimum concentration quantified was 84.9 mg per tablet (28.8% sorbitol per tablet)
and the maximum was 203.6 mg per tablet (70.4% sorbitol per tablet) with an average
concentration of 129 ± 41.3 mg/tablet. In the case of the three tablets (one batch) that
contained both lactose and sorbitol, the lactose and sorbitol were present in an
approximate ratio of 55% to 45%. Active ingredients, adulterants and sugar
components are provided in Table A1 (Appendix). The chemical analysis performed
accounted for as little as 8.5% of the tablet ingredients to as much as 99.4 % of the
tablet ingredients identified, with an average of 67%. The remaining unidentified
components of the tablets could be pharmacologically inactive chemical compounds
such as starch or carbonates.
127

HPLC method development & chemometric analysis of ecstasy & cocaine
Table 4.2. Sugars present in 183 samples of ecstasy seized in Ireland.
Sugars%
Occurrence
Concentration of components in ecstasy tablets (mg/tablet)
Lactose Sorbitol
Mean ± SD Range Mean ± SD Range
Lactose only 80.3 132.0 ¿53.3 33.9-230.0 - -
Sorbitol only 9.9 - - 129.2 ±41.3 84.9 - 203.6
Lactose & Sorbitol 1.6 95.7 db 10.4 87.3 - 107.4 76.8 ± 8.2 71.9 - 86.3
No Sugars 8.2 - - - -
Inorganic element analysis provided quantitative data on nine different elements
including aluminum, calcium, chromium, iron, lead, magnesium, potassium, sodium
and zinc. Table 4.3 provides a summary of the inorganic elements detected in
samples, the average concentration observed for all samples, the concentration range
for each element and the percentage occurrence within the samples. Aluminum, iron,
magnesium and potassium were present in all samples. The use of carbonates
(CaC0 3 , K2 CO 3 , M gC 0 3 , and N a2C0 3 ) and stearates (Na(CnH 3sCOO),
Ca(CnH35COO)2 , Mg(Ci7H35COO)2) is very common in the tablet production. The
high incidence of aluminum could be an insight on how these tablet samples were
produced, as aluminum is used as a reducing agent in the reductive animation route
for the synthesis of MDMA. It was detected in all the tablets analysed and at
concentrations up to 310.9 ppm. The high rates of zinc and iron in these tablets may
possibly well be from lubricants and dyes used in the production process. A full list
of all the metals present, at both their concentration levels and their combinations
within each tablet, are given in Table A2 (Appendix).
128

HPLC method development & chemometric analysis of ecstasy & cocaine
Table 4.3. Concentration (ppm) of inorganic elements and occurrence in ecstasy
Element % Occurrence Average (ppm) Range (ppm)
A1 100 43.9 1.4-310.9
Ca 97.8 256.7 3.5 -2836
Cr 17.4 0.6 0.03-3.5
Fe 100 52.0 2.3 - 402
K 100 0.16 0.1 -0.86
Mg 100 0.93 0.03 - 4.07
Na 93.4 0.3 0.02-3.1
Pb 23 0.2 0.01 -9.5
Zn 97.8 7.9 0.3 - 92
4.1.3. General profiling of ecstasy.
In this study, the relationship between the chemical profile of ecstasy tablets and their
logo was investigated to ascertain whether users could distinguish tablets based on
logos only. To test the hypothesis, the four tablet logos of ‘Mitsubishi’, ‘Bird’,
‘M&M’s’ and ‘Euro’ were chosen.
‘Mitsubishi' Tablets Group
‘Mitsubishi’ tablet group comprised the largest group of seized samples. Fifteen
different seizures (45 tablets) all bore this particular logo, which is consistent with the
findings as being one of the most common logos seen on the European market
(EMCDDA Annual Report, 2008). All tablets within this group, at first glance, seem
to have the same visual, physical and chemical characteristics. All tablet weights lie
within the narrow range of 277.8 mg to 324.5 mg, thickness ranges from 3.5 mm to
4.5 mm and diameters from 10.5 mm to 12 mm. All samples were the same colour
and shape. All tablets contain MDMA with no other active ingredients. However, on
closer inspection, the purity of the MDMA present in the tablets varies widely from
41.4 mg/tablet to 125.9 mg/tablet, or 16.6% to 39.6%. The sugar content was
determined and those with lactose present had lactose concentrations ranging from
129

66.8 mg/tablet (23.4%) to 214.8 mg/tablet (69.7%). All metals were present at
standard concentration levels.
One seizure was obviously different within the ‘Mitsubishi’ group of tablets. This
particular seizure (seizure 35) had all physical characteristics common to the others,
shape, colour weight etc, and had similar levels of MDMA present (Figure 4.8).
However, when determining sugar content, this particular seizure was found to have
no sugars present. Also, two of the metals, calcium and magnesium, were found in
significantly higher concentrations than the others. This one seizure highlights the
importance of a full chemical analysis (i.e. active ingredients and adulterants with
excipients) o f all samples with the intention of profiling and again emphasises the
importance of quantification of the compounds.
HPLC method development & chemometric analysis of ecstasy & cocaine
Figure 4.8. A digital image and properties of tablets from seizure 37 and seizure 35.
PropertiesSeizure No.
37.1 35.1Weight 300.3 mg 293 mgShape Round RoundColour White WhiteThickness 4 mm 4.5 mmDiameter 11.5 mm 10.5 mmMDMA 107.5 mg (35.8%) 115.6 mg (39.4%)Lactose 188.1 mg (62.6%) 0 mgK 0.04 mg 0.02 mgNa 0.03 mg 0.01 mgCa 0.01 mg 0.17 mgMg 0.01 mg 0.34 mgFe 0.02 mg 0.01 mgA1 0.02 mg 0.01 mg
‘Bird’ Tablets Group
This group was comprised of six seizures, 4, 7, 8, 14, 19 and 32. Despite the lower
number o f seizures, the seizures within the ‘Bird* group are more varied with many
possible sub groups existing. Seizure 7, 8, 19 and 32 all contained MDMA and
lactose. Seizure 4 contained MDMA and sorbitol, while seizure 14 contained low
levels of MDMA, amphetamine and caffeine and no sugar. Seizure 14 also had
1 3 0

HPLC method development & chemometric analysis of ecstasy & cocaine
sodium, calcium and magnesium present in appreciably higher levels than other
seizures. In addition, seizure 14 was pink in colour.
‘M&M V Tablets Group
A total of five seizures comprised this group, 23, 24, 25, 40 and 41. Again, they all
have the same colour, shape, thickness and diameter. They all contain MDMA,
caffeine and lactose. Wide ranges of purity exist with the MDMA and lactose data,
37.6 to 86 mg/tablet for the MDMA and 33.9 to 120.2 mg/tablet for the lactose.
Caffeine alternatively, was present at low levels, 1.6 to 2.6 mg/tablet. Three of the
seizures (23, 25 and 40) had significantly higher levels of magnesium present.
‘Euro’ Tablets Group
This group was comprised of three seizures and is one o f the most interesting. All
tablets had the same physical characteristics, shape, colour, diameter, thickness and
the tablet weights ranged from 285.5 to 305 mg. All tablets contained MDMA at
regular levels. None of the samples contained MDEA, amphetamine or caffeine.
That is where the similarities end. Diluent analysis confirmed that the three seizures
were produced separately. One had lactose as its main diluent, one had sorbitol and
one had no sugar present.
Based on the results of this data, three out of four times, the logo does indicate the
chemical components of the tablet. In other words, the user will be able to tell what is
in the tablet just by looking at its logo, the majority of the time. All the ‘Mitsubishi’
tablets had MDMA only, all ‘M&M’s’ tablets had MDMA, caffeine and lactose, and
all ‘Euro’ tablets had MDMA. However, it must be noted that the logos do not
determine the levels o f those chemical component in the tablets. For those tablets
with the same chemical components, levels ranged significantly.
An alternative approach is to examine the chemical profiles o f tablets as opposed to
their physical profiles. From the view point of the manufacturer, the logo stamp that
gives the tablet the logo would be considered relatively cheap in comparison with the
actual tablet ingredients. Therefore it may be very well possible that the one
manufacturer has several stampers but only the one set of ingredients. This attempted
to discover if one manufacturer could have one set of ingredients and recipes but
131

HPLC method development & chemometric analysis of ecstasy & cocaine
several stampers. The active ingredients and adulterants detected and quantified in the
tablets were MDMA, MDEA, amphetamine and caffeine. There were six
combinations of these compounds.
‘MDMA only ’ Group
The group ‘MDMA only’ had the largest number o f seizures. 42 seizures, or 68.8%
of the total number, had MDMA as their only active ingredient. MDMA purity
ranged from 41.4 to 125.9 mg/tablet (Table 4.1). Within this group however, a wide
variety was observed in other aspects of the tablet composition. Tablet weights varied
from 183.4 mg to 370.6 mg, thickness ranged from 4 mm to 6 mm and diameter from
8 mm to 12 mm. There were 16 different types of logo, the most popular being the
‘Mitsubishi’. One seizure was pink, the others white, and one seizure was triangular
in shape. Lactose was present in 33 seizures ranging from 66.6 to 230 mg/tablet.
Sorbitol was present in only five of the seizures, ranging from 71.9 to 263.1 mg/tablet.
There was one seizure that had both lactose and sorbitol present. These large ranges
and sub groupings due to sugars suggests perhaps that more than one manufacturer
produced these ‘MDMA only’ tablets.
‘MDMA and caffeine ’ Group
The ‘MDMA and caffeine’ group was comprised of nine seizures. The range of tablet
weights was much narrower, 186.7 mg to 208.7 mg. There were only three logos
within the group, ‘M&M’s’ being the most popular. All tablets were white and round,
thickness varied from 3 to 4 mm and diameter from 9 to 10 mm. MDMA
concentration ranged from 37.6 to 89.5 mg/tablet and caffeine ranged from 0.5 to 3.5
mg/tablet. Interestingly, lactose was the only sugar present in this group; however a
large variation existed in its quantities, 33.9 to 130.2 mg/tablet. Again, allowing for
within batch variability, this still would imply one manufacturer for this group.
Overall, similar chemical profiles with different physical profiles does not necessarily
mean the one manufacturer.
132

HPLC method development & chemometric analysis of ecstasy & cocaine
4.1.4. Discussion.
The first published report on ecstasy, profiling was by Renfroe (1986) and research has
continued to present day. Britain, Japan and the United States have the most
published reports describing ecstasy tablets seized in their countries. Italy, the
Netherlands, Israel, China and the Czech Republic have reported one-off studies. The
number of ecstasy samples analysed have ranged from 13 tablets (Milroy et al. 1996)
to 20,000 tablets (Schifano 2000), but usually sample size is in the region of 150
tablets. Results typically include the active ingredients, sometimes adulterants and
very rarely sugar content. These studies also tend to include a vague description of
the tablets, limiting the physical characteristics to logos and weight.
Typically amphetamine, methamphetamine, MDMA and MDA are the main
compounds detected for the tablets. Other compounds that have been detected are
MDEA (Makino et al. 2003, Cole et al. 2002, Teng et al. 2006, Sherlock et al. 1999),
ephedrine (Makino et al. 2003, Teng et a l 2006, Sherlock et a i 1999), and ketamine
(Cheng et al. 2006, Teng et al. 2006, Sherlock et al. 1999). A study based in the US
(Tanner Smith, 2006), analysed for 30 compounds. The most common compounds
detected were MDMA, MDEA, MDA, caffeine, ketamine and dextromethorphan
(DXM). Also detected in small amounts were 2, 5-dimethoxy-4-bromoamphetamine
(DOB), heroin, ketamine, phenylcyclohexylpiperidine (PCP) and
paramethoxyamphetamine (PMA).
Traditionally, ecstasy was predominately MDMA, sometimes MDA, but never any
other drug. Renfroe (1986) analysed 610 ecstasy samples from the years 1972 to
1985. All tablets contained either MDMA or MDA, or a mixture of both compounds.
No other drug or adulterants were detected. Since its rise in popularity, other active
ingredients have been detected in ecstasy tablets. In the Netherlands, a large number
of tablets were analysed between 1993 and 1996 (Spruit, 1999) of which 48-60%
contained MDMA alone, 12-20% contained MDEA alone and 2-5% contained MDA
alone. Each year however, 6-17% contained non-amphetamine type drugs. Detected
were lysergic acid diethylamide (LSD), DOB, ketamine, 4-bromo-2, 5-
dimethoxyphenethylamine (2C-B), atropine, caffeine, acetaminophen and other
unidentified substances. 2, 5-dimethoxy-4-methylamphetamine (DOM), DOB and
2C-B have also been identified in tablets (Kort & Cramer 1999). A report issued by
1 3 3

HPLC method development & chemometric analysis of ecstasy & cocaine
the EMCDDA (EMCDDA Report, 2008) stated that most tablets (70%) contain
MDMA or MDA or MDEA as the only psychoactive substance. Spain and Portugal
were exceptions with amphetamine and methamphetamine the most commonly
detected compound, and often in combination with MDMA or one of its analogues. A
single tablet in the Netherlands was analysed and found to contain 8 mg strychnine
(The Netherlands national drug monitor, 2007).
As the chemical components o f ecstasy tablets changed over the years, consequently
so did the purity of each drug in the tablet. In the UK, average values were 90 to 102
mg/tablet during the years 1991 and 1995 and then fell to 73 to 88 mg/tablet during
the years 1996 and 2000 (Cole et al. 2002). Samples analysed in the Czech Republic
varied from 30 to 100 mg/tablet, also quoting concentrations of 0 mg and 152 mg
(Palenicek et al. 2002). In Italy, between 1995 and 2000, the concentrations of
MDMA ranged from 100 mg to 150 mg/tablet (Schifano 2000). In Taiwan, a study
was carried out on tablets between 2002 and 2005. It was found that the average
MDMA content fell over those years from 126 mg/tablet in 2002 to 73 mg/tablet in
2005 (Teng et al. 2006). EMCDDA reported average MDMA content across Europe
to be between 5 and 72 mg/tablet for 2008. High doses (>130 mg/tablet) have been
reported in Belgium, Denmark, Germany, France, Netherlands and Norway. Purity
levels for this study ranged from 41.5 to 117.5 mg MDMA/tablet for MDMA only
tablets. MDMA levels were at their lowest when in combination with amphetamine
and caffeine (7 to 9.6 mg MDMA/tablet) or MDEA and caffeine (5.6 to 9.6 mg
MDMA/tablet).
Within batch variability also exists. That is, in the one seizure or group of similar
tablets, concentrations of the drugs differ from one another. In this study, four
seizures 20, 37, 43 and 57, had MDMA concentrations ranging from 57.9-98.7
mg/tablet, 61.0-117.5 mg/tablet, 50.0-103.8 mg/tablet and 41.4-99.8 mg/tablet,
respectively. In 2001, Cole et al. (2002) analysed eighty tablets from the one batch.
Concentrations ranged from 73 mg to 89 mg, with a mean of 79 mg/tablet. Limited
reports have been published discussing sugar content of ecstasy tablets. In 2000,
researchers in Northern Ireland identified sorbitol and glucose in a large number of
tablets (Bell et a l 2000) and then in 2003, the same researchers found lactose to be
the most common sugar, and sorbitol the second most common (Bell et al. 2003). In
134

HPLC method development & chemometric analysis of ecstasy & cocaine
England, lactose was identified in the tablets at an average quantity of 37% of the
tablet (Cole et a l 2002). These reports would be consistent with this study, where
lactose and sorbitol were the only sugars detected with lactose being the predominant
sugar.
Europol has a catalogue of logos, (Europol Ecstasy Logo System, EELS). In this
catalogue, tablets are catagorised initially by their logo (e.g. ‘Mitsubishi’, ‘Bird’) and
then numbered according to their generic logo type. To date, the catalogue contains
524 logos with 402 logo type variations. The aim of this is to gather information on
significant seizures and allowing this to match different seizures and further
investigation by local authorities. In this study of Irish ecstasy samples ‘Mitsubishi’
was the most common logo, a feature which also observed by Bell et al. (2003) for
Northern Ireland seizures for the same time period. Bell et a l (2003) reported that
after ‘Mitsubishi’, the most common logos were ‘Euro’, ‘Aladdin’, ‘Clover’, ‘Cupid’,
‘Unicom’, and ‘Teletubby’. Similarly, ‘Mitsubishi’ was the most common logo found
in a study in North West England (Cole et a l 2002). However, for Sherlock et a l
(1999), tablets from midlands England had ‘Dove’ as the most common logo. Outside
of Europe, Levy et a l (2007) studied tablets between 2001 and 2003 in Israel, and
reported fifty-eight different logos, the most common being ‘Bulldog’, ‘Feet’, ‘Flag’,
‘Superman’, and ‘Boss’. Interestingly, studies on the other side of the world, namely
China and Japan have reported various logos but ‘Mitsubishi’ was a common one
(Makino et a l 2003, Katagi et a l 2002, Teng et a l 2006). Whilst a range of logos are
more common than others, ‘Mitsubishi’ remains very popular worldwide.
Unsurprisingly, almost a quarter of the tablets analysed in this study had this logo.
The weights of the tablets analysed in this study lie within the ranges reported in other
studies, 105 mg to 348 mg (Makino et a l 2003), 46 mg to 340 mg (Katagi et a l
2002), 200 mg to 390 mg (Cheng et a l 2006), 300 mg to 400 mg (Lueng 2002) and
148 mg to 693 mg (Sherlock et al. 1999).
Tablets seized in England have been reported to be white, off-white or beige (Cole et
a l 2002). Numerous other colours have been reported, particularly in Japan,
including blue, brown, yellow, grey, orange, green, purple, red, pink and rose (Katagi
et a l 2002, Makino et a l 2003). The majority of research published have analysed
1 3 5

HPLC method development & chemometric analysis o f ecstasy & cocaine
tablets that are round in shape. Tablets may be slightly damaged when seized, but the
original shape of the tablet can usually be evident. Only one study analysed tablets
that were not all round. Teng et al. 2006, analysed three tablets (1.6% of total number
of tablets analysed) that were square with rounded edges.
Metals which may be found in ecstasy tablets include Na, Ba, Ca (sulphate, phosphate
salts) from excipients, Mg, Zn, Al, Li, B from lubricants, Pd, Pt, Ni from catalyst,
LiAlH4 , NaBH3CN, Al/HgCh from reduction of intermediate ketones, Fe/HCl, SnCb,
Pb(OAc)2 , PdCh/CuCl from the preparation of intermediate ketones, and I , Fe and
Cu from dyes (Comment et al. 2001). Inorganic analysis of drugs other than ecstasy
has become popular, such as amphetamine (Muratsu et al. 2002), methamphetamine
(Marumo et al. 1994), heroin (Bermejo-Barrera et al. 1996, Bermejo-Barrera et al.
1997, Bora et al. 2002, Infante et a l 1999, Myors et al. 1998) and cocaine (Bermejo-
Barrera et al. 1996, Bermejo-Barrera et al. 1997, Bermejo-Barrera et al. 1999).
The metal analysis of drugs may be valuable for linking seizures. Metals in tablets
may occur from various sources, either the synthetic pathway (by - products) or the
tableting process (excipients, colourants, etc). During the chemical process of
MDMA synthesis, catalysts or reducing agents are used, each being very specific to
each synthetic process. Knowledge of which were used would lead to information on
the production of the tablets, which in turn would lead to linkage of seizures. The
most common method of production of MDMA is the reductive amination route.
With this method three variations of it exists. First is the high pressure method which
uses platinum as a catalyst. Second is the low temperature method which uses sodium
borohydride as a reducing agent. The third is known as the ‘aluminum amalgam
reduction’ method which uses aluminum and mercury chloride as reducing agents.
The safrole bromination route uses hydrobromic acid (HBr) and the less common
Leukart reaction uses LiAlKU. Therefore the metals that would distinguish between
each synthetic route are platinum (Pt), boron (B), mercury (Hg) and lithium (Li). The
determination o f these metals was problematic. For mercury analysis, a hydride
generator is required. This generates mercury fumes which are then analysed, which
in turn creates obvious safety issues. Other specific equipment was needed for the
other metals, which were not available.
136

HPLC method development & chemometric analysis of ecstasy & cocaine
4.2. Chemical analysis of cocaine.
Cocaine samples are different to ecstasy tablets and therefore profiling of cocaine
samples relies on a complete chemical analysis. Ecstasy tablets generally remain
intact from the production lab, through to the dealer and finally to the user on the
street. This is in contrast with cocaine samples, which are in powder form and can be
“cut” or diluted many times between the production lab and the user on the street.
These alterations to cocaine samples from its original source can complicate profiling
and makes identifying dealer networks very difficult. In addition, with ecstasy
seizures, preliminary connections can automatically be based on physical
characteristics, such as logos or tablet colours, linking cocaine seizures proves more
difficult as most seizures show the same physical characteristics, i.e. white powders.
With a view to ascertaining if cocaine samples could be profiled, a chemical analysis
of the active ingredients, adulterants and sugars was performed. The determination of
active ingredients and adulterants within the cocaine sample were performed using the
validated HPLC method described in Section 3.2. and sugar analysis was carried out
by the method by described in Section 2.4. A number of cocaine samples (28) were
analysed to determine their active ingredients and adulterants. Figure 4.8 is a
chromatogram from the analysis of a cocaine sample separated under the conditions
described in Section 3.2.
Using the developed method, eight possible components, five active ingredients and
three adulterants, were identified and quantified in the samples. The major active
drug ingredients present in the samples analysed were cocaine, lidocaine and
prilocaine (Table 4.4). Samples varied with the level of drug constituent present and
the combinations in which they occurred in samples. Cocaine occurred in 100% of
samples (n = 28) and levels of concentration ranged from 0.21 to 22.1 mg/50mg
sample (0.42 to 44.2% purity) with an average value of 7.6 mg/50mg sample (15.2%
purity). Lidocaine was present in 53.5% (n = 15) of samples tested and levels of
concentration ranging from 1.42 to 31.5 mg/50mg sample with an average of 21.7
mg/50mg sample. Prilocaine occurred in 42.8% of samples (n = 12) and levels ranged
from 0.15 to 3.3 mg/50mg sample with a mean of 1.69 mg/50mg sample. Procaine
was detected in 3.5% samples (n = 1) at a concentration of 0.02mg/50 mg sample and
benzocaine was only present in 3.5% samples (n = 1) and at a concentration of 0.5
mg/50 mg sample.
137

HPLC method development & chemometric analysis o f ecstasy & cocaine
Retention time(minutes)
Figure 4.9. Components of a cocaine sample resolved on the Waters XBridge Cl 8 50 x 4.6 mm, particle size 3.5 ¡im column. The chromatographic conditions were phosphate buffer/acetonitrile (85/15 v/v) maintained in an isocratic mode, pH 3, temperature 35 °C and flow rate of 1. mL min'1. Detection was recorded at 200 nm. The elution order (retention time in min) was 1: metoclopramide (3.275), 2: cocaine (3.616) and 3: phenacetin (5.824).
Adulterants present in samples included phenacetin (53.6% of samples), caffeine
(46.4% of samples) and acetylsalicylic acid (3.5% of samples). As observed with the
main drug ingredients, adulterants occurred in different combinations with drug
components and at different levels. Phenacetin ranged from 0.07 - 2.2 mg/50mg
sample with an average value of 0.81 mg /sample. Caffeine concentrations ranged
from 0.06 - 2.1 mg /50mg sample with an average value of 0.80 mg/50mg sample.
Acetylsalicylic acid was only observed in one cocaine sample and at a low level, 0.63
mg/50mg sample. All concentrations and combinations of each compound are given
in Table 4.3.
1 3 8

HPLC method development & chemometric analysis of ecstasy & cocaine
Table 4.4. Major drug, sugar and adulterant components (mg/50mg of sample) detected in 28 cocaine seizures used in this study
M ain drug Sugars Adulterants
Sample #
Coc
aine
Lid
ocai
ne
Prilo
cain
e
Man
nito
l
Sucr
ose
Lac
tose
Phen
acet
in
Caf
fein
e
1 15.0 - - 6.4 - - - O.t20 8.5 - - 2.9 - - 1.1 -11 6.6 - - 4.4 - - 0.5 -13 7.3 - - 5.7 - - 0.6 -8 12.0 13.9 - 1.4 - - 1.0 -17 22.1 23.5 - 3.1 - - ■ 1.5 -18 0.2 29.2 - 5.2 - - - -16 15.1 14.4 - 1.5 - - 0.1 0.112 0.4 30.6 - 1.9 - - - 1.97 0.4 28.7 0.4 4.3 - - - 0.69 19.3 1.4 - 5.0 - 17.7 - 0.1
28 5.4 - 1.0 2.6 - 13.2 0.7 -14fl 5.1 4.5 1.6 - 14.1 - 0.1 0.125* 0.2 31.5 1.4 - 7.6 - - -21 3.1 26.2 2.3 - 12.7 - o oo -24 10.4 18.0 2.3 - 10.8 - - 1.15 6.6 - 2.5 - 16.4 - 0.7 -
26 5.1 - 1.2 - 14.5 - 0.6 -6 18.3 - 1.2 - 1.2 12.8 2.2 0.1
27 13.9 - 3.3 - 16.1 - - -3 12.8 - 2.9 - 17.0 - - -4 13.5 - 0.1 - - 20.3 - -
22 c 0.7 28.5 - - - 11.4 - 1.823 0.3 27.1 - - - 8.1 - 0.610rf 0.3 - - - - - 0.2 0.415* 10.4 - - - - - 1.4 -2 0.9 22.7 - - - - - 2.119 0.5 25.8 - - - - 0.7 1.6n 28 15 12 12 9 6 15 13
Min 0.2 1.4 0.2 1.4 1.2 8.1 0.8 0.1Max 22.1 31.5 3.3 6.4 17.0 20.3 2.2 2.1
Mean 7.7 21.8 1.7 3.7 12.3 13.9 0.8 0.8Stdev 6.7 9.4 1.0 1.7 5.1 4.4 0.6 0.8
= not detected in samples. Other compounds present included: a = Procaine (0.02mg/50mg sample 14); b = Acetylsalicylic acid (0.63 mg/50mg sample 25); c = Benzocaine (0.57 mg/50 mg sample 22); d - Sorbitol (1.57 mg/50mg sample 10) and e = Inositol (9.36 mg/50mg sample 15).
139

HPLC method development & chemometric analysis o f ecstasy & cocaine
Sugars have been detected previously in street cocaine samples, namely glucose, sucrose,
lactose and fructose (Bernardo 2003, King 1997). Mannitol, sucrose, lactose, sorbitol and
inositol were the sugar components identified in cocaine samples (Table 4.4). Glucose was
not detected and two cocaine samples did not contain any sugars under test conditions. Sugar
components occurred as single entities for the most part in cocaine samples with only three
samples having mixed sugar combinations of mannitol with lactose or sucrose with lactose.
Mannitol was the main sugar component identified and it occurred as a single sugar in 35.7%
of samples. Mannitol levels ranged from 1.3 - 6.3 mg/50 mg sample with an average value
of 3.6 mg/50 mg sample. Sucrose was the second most common sugar occurring as a single
sugar in 28.5% of samples and ranged from 1.17 - 17 mg/50 mg sample with an average
value of 12.2 mg/50 mg sample. Lactose when present was at elevated levels compared to
other sugar components. Lactose occurred as a single sugar in 10.7% of samples and levels
ranged from 8.1 - 20.2 mg/50 mg sample with an average value of 13.9 mg/50 mg sample.
Sorbitol and inositol occurred in two separate cocaine samples at levels of 1.5 mg/50 mg
sample and 9.3 mg/50 mg sample, respectively.
4.2.1. Discussion.
As with the ecstasy tablets, comparisons of the results of the cocaine samples in Ireland were
made with other published data. Published data includes one-off studies in Australia, UK,
Spain, Italy and Brazil and comprehensive studies on cocaine purity worldwide (UNDOC),
Europe (EMCDDA) and America (DEA). Data includes % purity, geographical variations in
purity, temporal variations in purity, identification and/or quantification of adulterants,
sugars, impurities and residual solvents. A point to note is a physical profile of these samples
is limited to “white” and “powder” form. With cocaine, greater emphasis is needed for the
chemical profile, i.e., the main ingredients and their quantities.
As stated previously, purity levels have been reported without any reference to the original
seizure weight. However, using these reported values, the samples in this study had a lower
purity level than the majority of the studies. Most European countries have reported mean
values between 24% - 80% purity, with an overall average o f 40% - 60% for the year 2004
(EMCDDA Report, 2006). This figure is similar for America (DEA) and Worldwide
(UNDOC World Drug report 2006). In Europe, there has been a downward trend in cocaine
purity from 2003 to 2008, values ranging from 13% to 62% (EMCDDA Report, 2010). This
140

HPLC method development & chemometric analysis of ecstasy & cocaine
may coincide with the increase in demand for this drug, as consumption and seizures rose
over this time period.
One aspect of reporting purity values which may cause a bias is the sample weight. Seizures
of a significant weight (e.g. seizures from a dealer) may be more ‘pure’ than seizures of a
smaller weight (e.g. seizures from a drug user), which are most probably already ‘cut5 a
number of times, thus lowering the purity value. One study (Barrio et al. 1997) addressed
this issue by dividing the samples into two weight categories, >5 g and <5 g. Results did
indicate a difference in the mean values for purity between the two categories. A study by
Bernardo (2003) analysed samples of weights >5 g. Purity levels in this study ranged from
4.3 and 87.1% (mean ± S.D. = 28.1 ± 28.4). Fucci & De Giovanni (1998) analysed 156
cocaine samples, 24% of which had weights ranging from 100 to 1000 g. Purity of these
samples ranged from 23 to 98% and no adulterants were detected. Seizures of smaller
weights may not always be low purity. Fucci & De Giovanni (1998) analysed two samples of
small weights (1.7 and 5.2 g) and both had high purity levels, 90% and 99% respectively.
Therefore, it would seem to be a necessity when stating purity levels, to categorise the
samples into different weights or to simply state the weight of the analysed sample. Other
published data did not take this factor into consideration. Darke et al. (2002) reported purity
levels ranging from 50% to 64% from 1996 to 2000, with a peak in purity during 1997/1998.
The EMCDDA Report 2010, the World Drug Report from the UNDOC, Interpol documents
and DEA documents all report purities without stating or categorising the weights of the
original seizures.
In this study, samples from small seizures, <5 g, were analysed. This may infer that the
samples were seized from users as opposed to dealers; that the purity level would be low and
the number and quantity of adulterants/sugars present would be high. Indeed, this was the
case. Purity levels ranged from 0.4% to 44% with a mean of 15.3%. Seven different
combinations of active ingredients and adulterants were detected in the samples, individually
and in different combinations. Five sugars were detected, again individually and in different
combinations (sucrose & lactose in one sample, mannitol and lactose in one sample and
mannitol & sucrose in one sample) and quantities (Table 4.4).
Lidocaine is the most common adulterant detected in samples from other studies, closely
followed by caffeine (Barrio et al, 1997, Bernardo, 2003, Fucci & De Giovanni, 1998, King

HPLC method development & chemometric analysis of ecstasy & cocaine
1997). Other adulterants detected include procaine, prilocaine, benzocaine and piracetam. In
one study (Fucci & De Giovanni, 1998), fourteen different adulterants were detected.
Phenacetin was also another adulterant identified along with cocaine (Fucci 2004).
Pharmacologically inactive chemical compounds that may be found in samples include starch
and carbonates (Lopez - Artiguez et al. 1995).
For classification purposes, the sample size (twenty eight) was too small to make any definite
links between samples; however there are some general observations. When all the data is
combined (i.e. drugs/sugars/aduItérants) the twenty eight samples could only be reduced to
twenty three groups. This would suggest that the samples are street cut samples due to the
variations and combinations within the samples. The common samples were (11, 13 & 20);
(8 & 17); (5 & 26) and (3 & 27) the remainder are all unique or have a unique combination of
all data.
4.3. Conclusions.
The overall aim of this study was the application of HPLC methods developed for the
chemical profiling of ecstasy and cocaine samples that were seized from the Irish market.
MDMA was the main active ingredient detected in the majority of ecstasy tablets with 62.3 %
of samples containing only this active ingredient. MDEA was also identified in combination
with MDMA, and 3.2% of the tablets had a greater quantity of MDEA than MDMA.
Amphetamine was also found, alone and in combination with MDMA and caffeine. Caffeine
was the only adulterant detected. Sugars are another major component of ecstasy tablets.
Only two sugars were detected in the tablets, lactose and sorbitol which were found alone and
in combination with each other. No sugars were detected in 8.2%. All detectable active
ingredients, adulterants and sugars were identified and quantified for a large sample of
ecstasy tablets. Upon combination of all the results, these analytes comprised of 8.5% to
99.6% of the total weight of the tablets. This study confirmed that the tablets seized in
Ireland are similar to those seized elsewhere in Europe and Worldwide. This would then lead
to the conclusion that these tablets are not produced in Ireland, but in other countries, most
probably in the UK, Netherlands or Belgium.
142

HPLC method development & chemometric analysis of ecstasy & cocaine
The chemical components of street cocaine samples were also detected and quantified.
Predictably cocaine was present in 100% of the powders analysed. The important detail to
note though was the purity levels, 0.4 to 44.2%, which is considerably less than results from
other research (EMCDDA report, 2006). A large number o f both adulterants and sugars were
detected in the samples. As each seizure was originally from a small weight of sample, one
could suggest that the seizures were already “cut” a number o f times, before confiscation.
In order to curtail production and sale of cocaine and indeed other drugs, efforts have been
made at government level to ban the production or sale of the chemical precursors that are
used in the production process these drugs, e.g. safrole for MDMA production. Whilst this is
admirable, the large scale production and sale of the most common adulterants and excipients
should also be prohibited. Clearly, sugars will not be made illegal, but other compounds,
such as lidocaine— both of which is still legal in Ireland today - should be monitored for sales
in large quantities. The onus is on the policy makers, both in Ireland and worldwide, to align
themselves and ban, or restrict such compounds.
143

HPLC method development & chemometric analysis of ecstasy & cocaine
Chapter 5: Chemometrics and statistical profiling of ecstasy tablets.

HPLC method development & chemometric analysis of ecstasy & cocaine
5.1. Introduction.
Chemometrics can be described as the application of statistical methods to multivariate
chemical data sets allowing for the statistical profiling of illicit drug seizures (Nic Daeid &
Waddell 2005). Profiling of illicit drug seizures can potentially be used to monitor the extent
of drug trafficking (Nic Daeid & Waddell 2005), determine the geographical origin of
samples (Johnston & King 1998) and identify novel trends or developments in illicit drug
samples (Jonson & Stromberg 1993). The method and types of statistical techniques
commonly applied to drug profiling include specifically the use of unsupervised pattern
recognition methods of PCA, HCA and Pearson’s correlation and more recently supervised
methods of LDA and ANN.
Unsupervised pattern recognition methods require no knowledge as to the origin of samples
but can provide clusters or groupings from the data sets. PCA ascribes loadings to the
classification based on the main components present in the data set. HCA gives no indication
of the variables used for classification but does present all the variation in the data set in the
form of a dendogram. Pearson’s correlation coefficient measures the relationship between
variables or samples and is currently recommended by the European Network of Forensic
Science Institutes (ENFSI) as a method of choice in profiling drug samples. Discriminant
analysis techniques such as LDA are parametric supervised techniques and are applied in
cases where data sets are known to be normally distributed (Nic Daeid & Waddell 2005).
Artificial neural networks (ANN) have the potential to provide the complete solution in
identifying recognition patterns in data and new seizure data could be applied to the
established neural networks to monitor developments in drug trafficking or identify new
trends in illicit drug seizures. The following sections deal with the application of PCA, HCA,
Pearson’s correlation, LDA and ANN to determine the suitability of classification methods in
identifying possible groupings within the ecstasy chemical data sets generated in this study.
5.2 Ecstasy data pre-treatm ent methods.
The chemical data sets used in this study consisted of the active ingredients plus sugars (AS),
metal data (MD) and all data combined (DC) for the 183 individual ecstasy tablet samples
(see Appendix Table A1 & A2). Variables for AS data included MDMA, MDEA,
amphetamine, caffeine lactose and sorbitol and represent only compounds detected in
samples. MD data variables were Al, Zn, Fe, Mg, Ca, Cr, Pb, Na and K that were similarly
detected in ecstasy samples. The data sets for statistical analysis were comprised of
145

HPLC method development & chemometric analysis o f ecstasy & cocaine
chromatogram peak areas (AS data) or absorbance values (MD data) for each compound
detected by HPLC or atomic absorption methods, respectively. Not all compounds were
detected in all individual tablet samples and the presence of zeros in data sets can pose
problems in particular statistical treatment of samples. In order to overcome this possible
difficulty zero values were replaced with a value corresponding to half the lowest detection
limit for variables of each data set (Lociciro et al. 2008). In addition, various pre-treatment
methods were explored to determine the most appropriate method prior to applying the
statistical protocol to the entire data sets.
Since all data sets were generated by different analytical techniques data pre-treatment is
required due to the differences in the scales between variables. To reduce the complexity and
to easily identify the appropriate pre-treatment method, eight seizures were selected based on
their discrete AS chemical data profile (Table 2.5, Table Al). Each seizure consisted of three
tablets with six variables giving a combined sample set of 144 data points for pre-treatment
analysis. Each pre-treatment method was evaluated by PCA and HCA methods to determine
the most appropriate pre-treatment method(s). Data pre-treatment methods evaluated
included the following:
1. Normalisation (N)
2. Normalisation & logarithm (N + Logio)
3. Normalisation & 4th square root (N + 4sqrt)
4. Standardisation (S)
5. Standardisation & logarithm (S + Logio)
6. Standardisation & 4th square root (S + 4sqrt)
The calculations for each pre-treatment method are as described in Section 1.5.2. PCA
allows for the visual inspection by use of score plots and the eight selected seizures should be
present as discrete individual groups but distant from other seizures. Based on PCA score
plots (Figure 5.1 & 5.2) the optimal pre-treatment methods of choice were normalisation &
logarithm and standardisation & logarithm. Within these score plots all three data points for
each seizure are cluster together while all eight seizures are distant from one another. As
PCA is subjective, the same data sets using same pre-treatment methods were assessed by
HCA. Pre-treatment methods should generate eight HCA clusters for the selected data set
and the three tablets for each seizure should be cluster together at a Euclidean distance of 1.
146

HPLC method development & chemometric analysis of ecstasy & cocaine
Normalisation & logarithm, standardisation & logarithm and standardisation & 4th square
root were suitable pre-treatment methods for identifying the eight discrete HCA clusters
(Table 5.1).
Pre-treatment of data by normalisation reduces the order of magnitude for each component
within a tablet to a fraction of the total concentration of all chemical components within each
individual tablet. Data pre-treatment by standardisation reduces the order of magnitude for
each individual chemical component in all tablets to a fraction of the total concentration for
that chemical component in all tablets. Since chemical data sets were generated by different
analytical techniques (i.e. HPLC peak areas and AA absorbance units) and are not in the
same numerical category, data pre-treatment by normalisation is not recommended.
Conversely, data pre-treatment by standardisation is suitable as it allows for the comparison
of variables within each chemical data set for all tablets. As such, standardisation &
logarithm was chosen as the more suitable data pre-treatment method for application to the
entire 180 ecstasy tablet samples for profiling analysis. All data sets for the three ecstasy
tablets from seizure 10 were excluded.
Exclusion of seizure 10 was based on the HPLC data for the active ingredients which had a
reduced peak area for the internal standard suggesting a less than 2 0 j j .1 sample inject volume
for these samples compared to other samples. Calculation of the concentration of
components in these samples is not affected as concentrations are determined by reference to
the internal peak area standard. Since standardisation & logarithm data pre-treatment method
reduces the order o f magnitude for each individual chemical component in all tablets the
inclusion of this data set could potentially be misclassified. Seizure 10 was therefore
excluded from all subsequent statistical analysis.
147

HPLC method development & chemometric analysis o f ecstasy & cocaine
Figure 5.1. PCA score plots for normalised data pre-treatment methods. (A) normalised data, (B) normalized & logarithm data and (C) normalised & 4,h square root data.
148

HPLC method development & chemometric analysis of ecstasy A cocaine
Figure 5.2. PCA score plots for standardised data pre-treatment methods. (A) standardised data, (B) standardised & logarithm data and (C) standardised & 4,h square root data.
149

HPLC method development & chemometric analysis of ecstasy & cocaine
Table 5.1. HCA outcomes of data pre-treatment methods for eight selected ecstasy seizures.
Pre-treatm ent method No. of clusters at a Euclidean distance of 1
Normalisation (N) 6
Normalisation & logarithm (N + Logi0) 8
Normalisation & 4th square root (N + 4sqrt) 7
Standardisation (S) 7 + 1 outlier
Standardisation & logarithm (S + Logio) 8
Standardisation & 4th square root (S + 4sqrt) 8
5.3. Ecstasy data pattern recognition methods.
Three different unsupervised pattern recognition methods o f PCA, HCA and Pearson’s
correlation coefficients were evaluated for all three pre-treated data sets of AS, MD and DC.
Unsupervised pattern recognition methods require no prior knowledge as to the origin of
samples but can provide clusters or groupings from the data sets. Groupings or clusters
generated can be tested by supervised LDA to determine the percentage correct classification
rate for each unsupervised pattern recognition method using each of the respective data sets.
5.3.1. Principal component analysis
PCA score plots for standardisation & logarithm pre-treated AS, MD and DC data sets are
presented in Figures 5.3, 5.4 & 5.5, respectively. The score plot for the first two principal
components for AS data (Figure 5.3) account for 57.1% of the total data variance and
illustrated that the active ingredients & sugar variables were classified into 6 discrete
groupings. Table 5.6 lists the seizure groupings for AS data identified by PCA. Individual
ecstasy tablets were all clustered to discrete seizures and no outliers were detected,
confirming that ecstasy tablets were linked to their original seizure number. The first two
principal components for MD and DC data sets accounted for 38.7% and 29.2% of the total
data variance, respectively. No distinct groups of samples were observed for the MD data
(Figure 5.4). Five groups were observed for the DC data set and individual ecstasy tablets
were all clustered to their original seizure numbers (Figure 5.5). In this instant, principal
component analysis suggest that AS data is more important for classification purpose.
150

itru 0 i o i k I t i k o u m , m t f y n a t cv *u*v A m m m t
F ig u re 5.3. PC A score plot o f the firsl tw o com ponents using the AS data set.

Score Plot of 180 Tablets, M etals Only (Standardisation & LogrHhm)
First Corrponent
F ig u re 5.4. PC A score p lot o f ihe first tw o com ponents using ihe MD data set
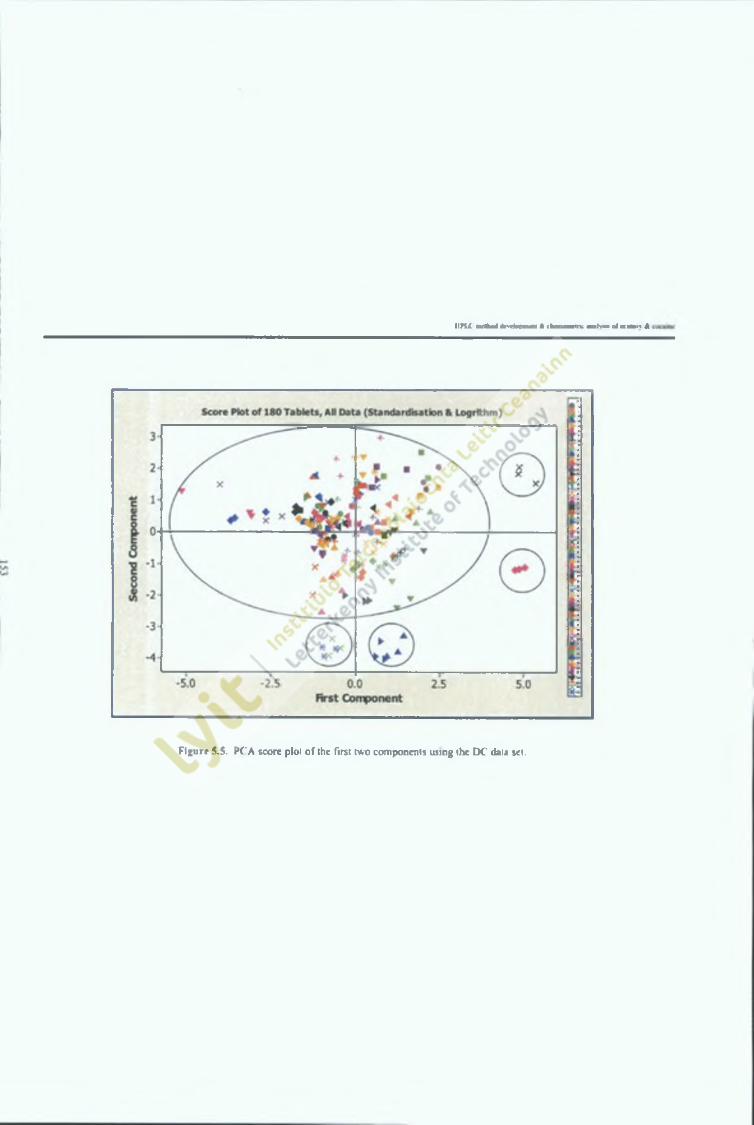
I i r u axtimi 4r>t4omm & ckcnmKlrx » K u u(cv«U.N *
F ig u re 5.5. PC'A scorc plot o f the first tw o com ponents using the DC' data set.

HPLC method development & chemometric analysis of ecstasy & cocaine
5.3.2. Hierarchal cluster analysis
This statistical method measures the distance between two objects and if the distance
is relatively small then similar linked objects will be clustered. The similarity
distance between samples is calculated by both cluster and interval methods. In order
to determine the most appropriate HCA cluster and interval method the AS data set
for the eight seizures used in pre-treatment studies (Section 5.2) was evaluated prior
to applying the method to the entire data sets.
Seven different HCA cluster methods were evaluated (Between groups, Within
groups, Nearest neighbour, Furthest neighbour, Centroid, Median and Wards) using
the default Squared Euclidean interval setting of the SPSS software package.
Selection of the most appropriate cluster method was determined by the numbers of
clusters formed by each method (Table 5.2). All clustering methods at a Euclidean
distance of 1 generated 8 discrete clusters for the eight selected seizures and all three
tablets were clustered to their respective seizure (Figure 5.6). At Euclidean distance 5
the number of clusters observed reduced from 8 to 7 or 6 regardless of clustering
method employed (Table 5.2). Between groups was selected as the cluster method of
choice as this is the default cluster method associated with the SPSS software for
HCA. In addition, since 8 correct discrete clusters were observed at the Euclidean
distance 1 this was selected as the most appropriate distance to determine group
classifications for all subsequent analysis.
Table 5.2. Number o f clusters for eight discrete seizures determined by different HCA clustering methods.
Cluster M ethod No. of clusters at distance 1
No. of clusters at distance 5
Between groups 8 7
Within groups 8 7
Nearest neighbour 8 7
Furthest neighbour 8 6
Centroid 8 7
Median 8 7
Wards 8 7
154

HPLC method development & chemo metric analysis o f ecstasy & cocaine
Table 5.3. Number of clusters for eight discrete seizures determined by different HCA interval methods.
Cluster Method No. of clusters at distance 1
No. of clusters at distance 5
Euclidean 4 8
Squared Euclidean 8 7
Cosine 8 7
Pearson 8 7
Chebychev 4 8
Block 4 8
Minkowski 4 8
E u c lid ean d is ta n c e
Figure 5.6. HCA dcndogram using Between Groups with Squared Euclidean for eight selected seizures. The number o f clusters formed was dependent on the Euclidean distance measure employed.
1 5 5

HPLC method development & chemometric analysis of ecstasy & cocaine
Using Between groups cluster method, seven interval methods were assessed (Table
5.3). Squared Euclidean, Cosine and Pearson interval methods correctly cluster all
eight seizures at distance measure of 1. All other interval methods failed to correctly
cluster the eight seizures. The number of clusters formed at distance 5 was reduced
from 8 to 7 clusters for Squared Euclidean, Cosine and Pearson interval methods with
two seizures (i.e. seizures 13 & 15) clustering as one group (Figure 5.6). As such,
Between group and Squared Euclidean at distance measure of 1 were chosen as the
HCA cluster and interval methods for application to the entire data sets of AS, MD
and DC.
Standardisation & logarithm pre-treated AS, MD and DC data sets were analysed by
HCA. The number of clusters formed, varied dependent on the data sets and
Euclidean distance measured employed. Dendograms for AS, MD and DC data sets
generated 11, 23 and 32 HCA cluster groups at Euclidean distance 1, respectively.
MD and DC data sets did not form discrete clusters with numerous individual tablet
samples distance from other corresponding members of the same seizure suggesting
that these samples were incorrectly classified and represent HCA outliers. Analysis of
MD and DC HCA dendograms at Euclidean distance 5 reduced the number of clusters
to 7 and 19, respectively; however outliers were still present suggesting that MD and
DC data sets were unreliable for HCA classification purposes.
Conversely, AS data generated 11 discrete HCA groups with all individual tablet
samples linked to corresponding members from the same seizures with only two
exceptions. Due to the large number of samples considered, the ‘dendogram became
complex when each sample was labelled. A simplified dendogram is illustrated in
Figure 5.7 which demonstrates group linkages for AS data set, with members of each
cluster identified, listed in Table 5.6. Individual ecstasy tablet samples 49.3 and 53.3
were not linked to members of the same seizure at euclidean distance 1, but could be
linked with group IX and IV if measured at euclidean distance 2 and 6, respectively
(Figure 5.7).
156

HPLC method development & chemometric analysis of ecstasy & cocaine
HCA identified four clustering groups of A, B, C and D with clusters further
differentiated into eleven HCA groups (Figure 5.7). Clusters were differentiated
based on active ingredients and sugar components present and group subdivision was
based on the combination and concentration of components (Table 5.4). Cluster A
was defined by two main components of MDMA and lactose. HCA groups I, VII,
and XI were separated based on the presence of caffeine or sorbitol. Cluster B was
comprised of groups IV, VIII, IX and X and were differentiated based on the presence
of MDMA, lactose and MDEA. These groups were primarily separated based on the
combination and concentration of MDMA and MDEA present (Table 5.4). Cluster C
was distinguished by the absence of lactose in all samples with groups n, III, and IV
separated based on the presence of caffeine, sorbitol or amphetamine. Cluster group
D was comprised of the single seizure 30 and was distinguished by the lack of
MDMA in either of the three tablet samples.
157

HPLC method development & chemometric analysis of ecstasy & cocaine
Figure 5.7. Dendogram for AS data set illustrating four clusters A, B, C, and D with eleven discrete HCA groups. Expanded section highlights the region for HCA groups IV and IX and illustrates the linkage of the two ecstasy sample outliers 49.3 and 53.3 at Euclidean distance 1, 2 or 6.
158
530706000002010248020102000500020201015300020100020002010223020002000100010101065302

I1PLC method development & chenicimetric analysis of ecstasy & cocaine
Table 5.4. Summary of the active ingredients and sugar components (mg/g) for HCA classification of ecstasy seizures used in this study. HCA cluster groups and seizure batch numbers are described in Figure 5.7 and Table 5.6, respectively.
MDMA Lactose MDEA Caffeine Sorbitol Amphetamineciusier i»roup
Mean ± SD Mean ± SD Mean ± SD Mean ± SD Mean SD Mean ± SD
A I (96) 282.1 ± 78.3 566.1 103.2 - * * -
VII (27) 331.0 66.7 374.4 ± 183.3 - 9.1 ± 3.9 - -
XI (3) 252.2 ± 46.2 345.6 ± 34.4 - - 277.1 ± 24.8 -
B VIII (9) 288.4 ± 75.1 566.2 ± 38.7 14.1 ± 1.7 - - -
X (3) 369.5 ± 16.5 681.8 ± 7.4 1.7 ± 0.5 - - -
IX (6) 311.9 44.2 422.7 ± 31.1 4.6 ■± 0.3 5.1 ± 0.6 - -
IV (6) 27.5 ± 5.7 481.5 ± 86.6 46.6 ± 9.0 2.8 ± 0.5 - -
C 11 (12) 279.8 ± 42,8 - - - 550.4 209.4 -
V (3) 81.5 ± 14.2 * 0.6 ± 0.1 - 16.0 ± 2.4
III (12) 282.9 ± 60.8 - - - - -
D VI (3) - 688.6 ± 59.7 - . 29.5 ± 8.6

HPLC method development & chemometric analysis of ecstasy & cocaine
5.3.3. Pearson’s correlation coefficients.
Pearson’s correlation coefficients determine the linear relationship between two
samples. The more correlated the relationship the more likely two samples are linked.
A Microsoft Excel macros file provided by European Network of Forensic Science
Institutes (ENFSI) was used to examine Pearson’s correlation matrices for the
standardisation & logarithm pre-treated AS, MD and DC data sets. Application of
this method for classification purposes is determined by the minimum acceptable
threshold value assigned.
Threshold values between two samples are arbitrary and coefficient values equal to or
greater than the minimum set value will imply a high degree of correlation between
linked samples. In this study threshold values were initially determined by examining
all three replicates for each of the three samples from the same seizure. Since samples
are similar the minimum value obtained is considered the threshold value to link
replicates of the same sample (Table 5.5). In this example, the minimum threshold
values for seizure 13 and 14 were 97.97 and 98.31, respectively and both seizures are
unlinked. The minimum threshold values obtained using this approach for all AS data
samples ranged from 92.7 (seizure 3) to 99.9 (seizures 2 & 12) with an average value
of 98.6 for all seizures. This average value of 98.6 was selected as the acceptable
minimum threshold value to give a high degree o f confidence between correlated AS
data samples. Using the same approach the minimum average acceptable threshold
values identified for MD and DC data set samples were 79.2 and 88.2, respectively.
Correlation matrices values that fall below these minimum average threshold values
for each of the respective data sets would imply samples were not linked while values
equal to or above the value would be considered correlated.
Due to the relatively lower threshold values assigned for DC and MD data sets the
number of groups identified were high (Table 5.7). The DC data set generated 35
Pearson’s groups which were comprised of 10 groups and 25 unlinked seizures using
the minimum acceptable threshold value of 79.2. The increased threshold value of
88.2 identified 29 groups for the MD data set, comprising 7 groups and 22 unlinked
seizures. As previously observed with PCA and HCA methods the inclusion of metal
data proved unreliable at differentiating unique groups from the data sets.
1 6 0

HPLC method development & chemometric analysis of ecstasy & cocainc
Table 5.5. Pearson correlation coefficients sample matrix for the three replicates of each sample seizure 13 and 14. Minimum threshold values (highlighted in red) for seizure 13 and 14 are 97.97 and 98.31, respectively. Shaded section indicates poor correlation between sample replicates of seizure 13 and 14 due to low threshold values. Pre-treated AS data set was used in this example.
1311 1312 1313 1321 1322 1323 1331 1332 1333 1411 1412 1413 1421 1422 1423 1431 1432 1433
1311 100
1312 99.98 100
1313 99.99 99.98 100
1321 99.13 99.17 99.16 100
1322 99.14 99.18 99.16 99.99 100
1323 99.09 99.11 99.11 99.99 99.97 100
1331 99.28 99.24 99.25 98.13 98.09 98.09 100
1332 99.26 99.22 99.23 98.21 98.17 98.18 99.99 100
1333 99.17 99.13 99.14 98.02 97.99 97.97 99.98 99.98 100
1411 56.30 56.56 56.53 53.61 53.64 53.36 58.18 58.13 58.26 100
1412 56.42 56.68 56.65 53.68 53.71 53.43 58.34 58.30 58,43 99.99 100
1413 56.76 57.03 57.00 54.23 54.26 53.98 58.52 58.48 58.59 99.98 99.96 100
1421 56.78 57.08 57.04 54.30 54.35 54.04 58.46 58.42 58.54 99.91 99.90 99.94 100
1422 56.90 57.20 57.15 54.47 54.52 54.22 58.53 58.50 58,62 99.88 99.87 99.92 99.99 100
1423 56.74 57.04 57.00 54.31 54.35 54.06 58.39 58.36 58.48 99.89 99.88 99.92 99.99 99.99 100
1431 55.28 55.61 55.46 53.43 53.43 53.20 57.45 57.55 57.67 98.39 98.35 98.45 98.32 98.37 98.31 100
1432 55.56 55.89 55.74 53.81 53.82 53.59 57.62 57.72 57.83 98.41 98.38 98.49 98.38 98.44 98.38 99.98 100
1433 55.53 55.86 55.71 53.78 53.79 53.55 57.57 57.68 57.79 98.36 98.32 98.44 98.35 98.40 98.34 99.98 99.99 100

HPLC method development & chcmomctric analy*i* of ecstasy & cocaine
Pearson’s correlation for the AS data set generated 13 discrete highly correlated
groups (threshold value > 98.6) with all individual tablet samples linked to
corresponding members from the same seizures. Linked seizure numbers for each
group are provided in Table 5.6. Pearson’s groups for the AS data set were similar to
HCA groups. The two additional groups (i.e. Group XII & XIII) are considered
subsets of the HCA groups VII & I while all other groups were identical. Pearson’s
group XIII is unexplained as this subset did not appear significantly different from
other members o f Group I. Group XII can be explained based on the concentration
levels o f lactose in samples. Pearson's group VII had mean lactose levels of
523.19±94.3 mg/g of sample while group XII contained 188.46±12.3mg/g of sample.
Overall unsupervised pattern recognition methods of PCA, HCA and Pearson’s
correlation were successful at identifying groups within the 180 individual ecstasy
tablet samples. From a scientific perspective, linking seizures is useful as an
operational or strategic tool for law enforcement investigators. In this study, seizures
could be linked based on groups formed, however the number of groups identified
varied with the method applied and the sample data set utilised. The ability of PCA,
Pearson’s correlation and to some extent HCA to classify tablets according to seizure
was clearly limited by significant variation in the metals present within each tablet
and seizure (Appendix Table A2). Such variation may always be present in tablets
that are produced in clandestine laboratories and will consequently limit attempts to
link tablets and seizures to common batches o f illicit substances.
The most successful data set for classification purposes was the active ingredients and
sugar components (AS data). All three pattern recognition methods identified various
groups dependent on whether PCA, HCA or Pearson’s correlation was applied to the
data set (Table 5.6). PCA classified the 180 ecstasy tablet samples into 6 groups
based on the chemical constituents present. HCA and Pearson’s correlation identified
11 and 13 groups, respectively, and were further able to classify these groups based
on the concentration and combination of constituents present in samples (Table 5.4).
Pearson’s correlation distinguished groups based on similarity between samples while
HCA provide clustcr linkages of samples. Regardless, the application of these
statistical methods linked seizures suggesting that the different groups may represent
discrete suppliers or manufacturing processes.
1 6 2

HPLC method development & chemometric analysis of ecstasy & cocaine
There are many advantages and disadvantages with each of the three pattern
recognition methods. PCA and HCA require the use of special software package such
as SPSS, while Pearson’s correlation is performed using a simple Microsoft excel
macros file. PCA is simple and produces visual score plots of potential groups formed
but are subject to the analyst’s interpretation. HCA and Pearson’s correlation are
more informative and provide similarity linkage between samples but require a more
in-depth knowledge of the statistical protocol to apply.
163

HPLC method development & chemomctric analysis of ecstasy & cocainc
Table 5.6. Seizure num bers for groups identified using unsupervised pattern recognition m ethods o f PCA, HCA or P earson’s correlation for active drug and sugar (A S) data sets.
Pattern recognition methodGroup # — — —
PCA HCA Pearson’s
Group 1 1 2 3 5 6 7 8 9 1 2 3 5 6 7 8 9 1 5 6 7 8 9 11 1211 12 13 15 17 19 20 21 11 12 15 19 20 21 27 28 15 19 20 21 27 28 29 3123 24 25 27 28 29 31 32 29 31 32 33 34 37 38 44 32 33 34 37 38 44 46 4733 34 36 37 38 39 40 41 46 47 50 51 54 56 57 59 50 51 54 56 57 5942 43 44 45 46 47 48 4950 51 52 54 56 57 59
Group 11 4 26 60 61 4 26 60 61 4 26 60 61
Group 111 16 18 35 55 58 16 18 35 58 16 18 35 58
Group IV 22 53 22 53 22 53
Group V 14 14 14
Group VI 30 30 30
Group Vll 1739
2340
2441
2545 52
17 25 39 45
Group VIII 36 42 43 36 42 43
Group IX 48 49 48 49
Group X 13 13
Group XI 55 55
Group XII 23 24 40 41
Group XIII 2 3
52

HPLC method development & chcmometric analysis of ecstasy & cocaine
Table 5.7. Linear discriminant analysis percentage correct classification rates for the number of groups identified by Principal component, Hierarchal cluster and Pearson’s correlation pattern recognition methods.
Number of Variables
Pattern recognition method
Data Sets Principal Component Analysis Hierarchal Cluster Analysis Pearson’s Correlation Coefficient
No. of groups % Correct No. of groups % Correct No. of groups % Correct
DC 15 5 98.4% 19 96.7% 35a 80.6%
MD 9 I ND 7 93.9% 29b 76.8%
AS 6 6 93.4% 11 99.5% 13c 99.5%
DC = all data combined; MD = metal data only; AS = active ingredients & sugar data. Minimum threshold values differed for each data set; a = 88.2, b = 79.2 and c = 98.6. ND = not determined

HPLC method development & chemometric analysis of ecstasy & cocaine
5.4 Supervised pattern recognition methods.
Both LDA and ANN were applied to the chemical data sets of the 180 individual
ecstasy tablet samples to determine both the correct classification rate and possible
linked networks in samples. LDA was applied to all groups identified by
unsupervised pattern recognition methods to confirm percentage correct classification
rates (Table 5.7). LDA percentage correct classifications ranged from 76.8% to
99.5% depending on the pattern recognition method and data group set tested
suggesting that the data groupings were reasonably assigned, As observed previously
LDA classification rates were poorest for MD data set regardless of pattern
recognition method employed. When MD and AS were combined classification rates
improved suggesting that AS data variables were more important in determining
group classifications. Both HCA and Pearson’s correlation groups for the AS data set
provided the best classification rates of 99.5%. The 0.5% error was associated with
the single ecstasy sample 49.3 which was classified with samples from Group IV.
Since HCA and Pearson’s correlation AS data groups had similar LDA classification
profiles both groupings were further tested by ANN. Neural networks were applied to
samples in order to determine the correct classification rate of pattern recognition
method and also to establish a neural network that could be beneficial in classifying
new drug seizures.
Artificial neural networks algorithms have the potential to provide complete solutions
in the identification of patterns in data sets (Bishop, 1996). In this study, individual
networks and ensembles of networks were created and tested using the Intelligent
Problem Solver (IPS) system function in the Trajan software. AS data was inputted
into the software as individual sets o f data coded according to group seizure numbers
identified by HCA or Pearson’s correlation methods. The software randomly
assigned individual data sets from each sample into training, selection and test sets.
One hundred networks for each of the six chemical variables were tested for the three
layers (input, hidden and output layers) by Multi-Layer Perceptron (MLP) and Radial
Base Functions (RBF) methods. The training algorithms were a combination of back
propagation and conjugate descent. Selection of the most suitable network was based
on the performance of the selection set and the difference in the error associated with
the selection set and the test set. The errors associated with the selection and test sets
should be relatively small to ensure the network is capable of generalising new data.
166

HPLC method development & chemometric analysis of ecstasy & cocaine
The performance of the training and selection tests should be similar and close to 1 to
indicate that the model does not suffer over-learning. The performance of the test
should also be close to 1 to indicate that the network can classify new data adequately
(Waddell et al. 2004). The final neural networks selected for the HCA and Pearson’s
group classification of AS data set are provided in Table 5.8.
Table 5.8. Optimal artificial neural networks selected for HCA and Pearson’s group classification of AS data set._________________________________________________
ANN Criteria HCA Pearson’s
Network Profile MLP 6:6-10-11:1 RBF 6:6-46-13:1
Training Performance 1 0.9139
Selection Performance 1 0.8880
Test Performance 1 0.9555
Training Error 0.0002 0.0067
Selection Error 0.0003 0.0681
Test Error 0.0188 0.0665
Correct Classification Rate 100% 85.7%
Training BP 100, CG20, CG41b KM, KN, PI
The optimal network selected was based on the best performing network of the 100
networks tested for both groups. In the case of the Pearson’s AS data groupings the
optimal network was an RBF 6:6-46-13:1. This is a radial base function network
architecture with six input chemical variables, forty six neurons in the hidden layer
and thirteen output groups. Classification rate for this network was 85.7% with a
selection performance of 0.888 suggesting mis-classification within the Pearson’s
group structure. The optimal neural network for the HCA AS data groupings was an
MLP 6:6-10-11:1 and yielded a perfect 100% correct classification. This is a
multilayer perceptron network architecture with six input chemical variables, ten
neurons in the hidden layer and eleven output groups. Error values were low and
training, selection and test performance values were the ideal value of 1. This neural
network structured according to the HCA AS data groupings is more than capable of
handling, generalising and classifying new data. Future chemical data based on the
combination and concentrations of MDMA, MDEA, amphetamine, caffeine lactose or
sorbitol applied to this trained neural network could potentially serve as a model to
monitor trends and developments for ecstasy drug trafficking in Ireland.
167

HPLC method development & chemometric analysis o f ecstasy & cocaine
The particular advantage of chemometrics is that it allows for the statistical analysis
of multivariate chemical data into discrete reliable groups for profiling illicit drug
samples from clandestine manufacturing processes. In this study, ecstasy seizures
were linked based on HCA clustering groups and confirmed by the MLP 6:6-10-11:1
artificial neural network. Group classification was based on the combination and
concentration of active ingredients and sugar components present in samples.
Physical data and seizure location data can be combined with these linked groups to
investigate whether any patterns exist in ecstasy drug trafficking in Ireland during the
period 2001-2003.
Group I contained the greatest number of seizures, 32 of the 60 seizures analysed.
This group was distinguished based on the MDMA and lactose content. It is more
than likely that ecstasy tablets within all 32 seizures from different regions were
prepared by the same manufacture. This group contained numerous different logo
types and included; ‘Mitsubishi’ (14 seizures), ‘Bird’ (4 seizures), ‘Horse’ (2
seizures), ‘Smirnoff (2 seizures) and the remaining ten seizures all had unique logos
of ‘Armani’, ‘Chi’, ‘Dextran’, ‘Euro’, ‘Heart’, ‘Motorola’, ‘Rolls Royce’, ‘Smiley’,
‘V2’ and no logo (Figure 4.1) suggesting that the manufacturer was applying logo’s
randomly. The wide diversity o f logo types imply that this group could not be
classified based on logos but required chemical profiling. The majority of Group I
was seized in the Dublin metropolitan area (21 seizures) however the same samples
were seized in other regions (Cork, Kildare, Kilkenny, Sligo, Waterford and Wexford)
strongly suggesting that Dublin is the main port of entry with distribution regionally
via the main North Western, South Western and Southern transport routes (Figure
5.8).
Group II was similar to Group I in chemical composition but contained sorbitol
instead of lactose as the main adulterant. This group was seized in Dublin (3 seizures)
and Donegal (1 seizure) and could not be distinguished based on physical
characteristics or brand logos. Logos recorded for this group include ‘Heart’ (2
seizures), ‘Bird’ (1 seizure) and ‘Euro’ (1 seizure). This group represents a possible
network between Dublin and Donegal. Bell et al (2003) reported MDMA/sorbitol
ecstasy tablets seized within Northern Ireland during the same period suggesting
cross-border activity between the two jurisdictions.
1 6 8

HPLC method development & chemometric analysis of ecstasy & cocaine
Group III was comprised of 4 seizures, three seized in the Dublin area and the fourth
seized in Galway. All four seizures had four different logos of ‘Mitsubishi’, ‘Euro’,
‘Smiley’ and ‘Tasmanian Devil’. This group was unique since it only contained
MDMA with no adulterants present. Group IV contained
MDMA/MDEA/caffeine/lactose and all contained a ‘Crown’ logo. In addition all
samples were white in colour and had the same physical dimensions supporting the
argument that these seizures were produced from the same manufacturing process.
This group was seized in Louth and Wicklow and may possible be a distribution
network along the East coast corridor from Northern Ireland as these samples were
not present in other seizures from the Republic of Ireland,
Group V was a single seizure from Dublin, containing MDMA/caffeine/amphetamine
with a ‘Bird’ logo and was pink in colour. This group may represent a transient
seizure since it was not present in other regions of Ireland (Figure 5.8). Group VI was
a single seizure from Cavan and was distinctly unique based on the Superman brand
logo, green colour and contained amphetamine and lactose. The uniqueness of this
seizure may suggest the introduction of a new manufacturing process as amphetamine
is rarely seen as the only active ingredient in ecstasy tablets.
Group VII was the second largest group of linked seizures and samples were seized in
Cork (3 seizures), Kildare (2 seizures), Offaly (2 seizures) and one seizure each from
Dublin and Mayo (Figure 5.8). This group was similar to Group I but contained
caffeine in addition to MDMA/lactose and had various logo types. Brand logo’s
included ‘M&M’s’ (5 seizures), ‘Red Bull’ (3 seizures) and ‘Coca-Cola’ (1 seizure).
Group VIII was comprised of three seizures and all seizures contained a Durex brand
logo with the main chemical components of MDMA/MDEA/lactose. Samples were
seized from Cork (2 seizures) and Kilkenny (1 seizure). Group IX was similar to
Group VIII but contained caffeine in addition to MDMA/MDEA/lactose and the two
seizures were seized in Cork and Waterford. Both seizures contained the ‘Coca-Cola’
brand logo. Since the majority o f Groups VII, VIII and IX were seized in Cork the
possibility exists that Cork is the importation port with distribution regionally via the
northern, north eastern and eastern transportation routes,
169

HPLC method development & chemometric analysis of ecstasy & cocaine
Group X and XI were single seizures seized in Waterford and Clare. Group X
contained MDMA/MDEA/lactose with a ‘Smirnoff logo while Group XI contained
MDMA/lactose/sorbitol with a ‘Heart’ logo and was pink in colour. It is possible that
both these seizure are not part of a major network but represent samples for personal
consumption obtained abroad.
170

IV U « « h ad dn « l« c n n A <hmomc#x u M a of c o u r i A
K*y
• -Oroapl
• -oro«*>n
• -Gr«t>ni• • Orotp IV
• - Oroqj V
- Cnovp VI
• - Gro<y> VD
• - oro«4> v m
• • Gro«f> DC
• - O t o ^ X
• ■ Oro«4) XI
Figure 5.8 Relative distribution of ecstasy seizures examined in this study by HCA and MLP 6:6-10-11:1 neural network group classification

liPLC method development & chemometnc analysis of ecstasy &. cocaine
5.5. C onclusions.
Recently, the application o f drug profiling methods have demonstrated the potential
of these techniques in establishing links between illicit drug samples and thereby are
advantageous in drug intelligence (Locicero et al. 2008, Weyermann et al. 2008,
Andersson et al. 2007, NicDaeid & Waddell 2005). Physical and chemical data can
provide useful information however no clear structure can be identified regarding the
manufacturing process involved. Chemometrics allows for the statistical comparison
of samples to determine if patterns exist within the population sample. Difficulties
can arises in directly comparing ecstasy seizures produced by different synthetic
routes (Section 1.2.5) from unregulated clandestine laboratories. To overcome these
barriers data sets generated must be pre-treated to allow for statistical comparisons
(Miller & Miller, 2005) and an appropriate pattern recognition method must be
selected (Nic Daeid & Waddell 2005).
In this study, the recommended chemometric protocol involved the generation of
validated HPLC ecstasy data for the main active ingredients and sugar components
(Sections 2.2 & 2. 4) followed by standardisation & logarithm pre-treatment of HPLC
peak areas. Data sets for the six chemical variables for all 180 individual ecstasy
samples were grouped by HCA unsupcrvised pattern recognition method using SPSS
software. Artificial neural networks using Trajan software were applied to determine
classification rates and establish a neural network pattern linking unrelated ecstasy
seizures. The neural network MLP 6:6-10-11:1 was more than capable o f handling
new data and has the potential to monitor future trends in the Irish ecstasy market.
Metal data set, alone or in combination with AS data, was on unreliable at classifying
tablets according to seizure and was clearly limited by significant variation in the
metals present within each tablet and seizure (Appendix Table A2).
Although the number o f seizures examined was limited to those supplied by the Garda
Forensic Laboratory, the application of chemometrics demonstrated the potential of
this approach in establishing links between unrelated illicit ecstasy drug seizures in
Ireland. The neural network MLP 6:6-10-11:1 identified eleven discrete groups for
the 60 seizures analysed suggesting eleven different manufacturing processes.
Alternatively, HCA provided four cluster linkages o f samples (Figure 5.7) with
1 7 2

HPLC method development & chemometric analysis o f ecstasy & cocaine
groups identified within clusters (Table 5.4) being possible random batch variations in
a standard manufacturing method. With more extensive data it may be possible to
recognize the signature of tablets prepared by major manufacturers.
Seizure locations illustrated a random geographical network distribution primarily
based on the major Irish traffic routes and linked seizures were not specifically
confined to a particular region. Since ecstasy clandestine laboratories have not been
reported in Ireland the drug trafficking source is presumably Europe with U.K.,
Belgium or Holland the more than likely sources. Since Dublin and Cork contained
the greatest number of seizures it is assumed that these sites are the main ports of
entry to the island of Ireland. A possible alternative entry route, suggested by linked
seizures in this study, is via the neighbouring Northern Ireland jurisdiction and as
such future profiling studies should examine the whole of Ireland. The advantage of
the established neural network MLP 6:6-10-11:1 would allow for the addition on new
data to build on the database to monitor developments and trends in the Irish ecstasy
market.
173

HPLC method development & chemometric analysis of ecstasy & cocaine
Chapter 6: Conclusions and future work.
174

HPLC method development & chemometric analysis of ecstasy & cocaine
Forensic analysts are faced with the challenge of continually developing sophisticated
methods of analysis to combat the increasing variability that occurs in illicit drug
samples. The main objective for the analytical chemist has been to introduce new,
versatile techniques with high efficiency, selectivity and precision. Research work for
this thesis has focused on the development of the analytical method HPLC (High
Performance Liquid Chromatography) for the analysis of major drug constituents
associated with ecstasy and cocaine illicit drug samples.
6.1. Method development.
Emphasis in this thesis has been placed on method development with univariate or
multivariate experimental strategies used in the selection and optimisation of
procedures. Considerations with regard to the choice of chromatographic factors,
solutes under investigation and the provision of quality assurance data throughout the
research work have been the main criteria in methods developed. Methods developed
have undergone validation studies including, intra- and inter- reproducibility,
accuracy, linearity of calibration, limit of detection (LOD) and limit of quantification
(LOQ) and the use o f internal standards. Two HPLC methods have been developed
and these methods have been successfully applied to the analysis of ecstasy and
cocaine samples seized from Ireland during the period 2001 to 2004.
The univariate experimental approach was applied to the development and validation
of a HPLC method that could be used to qualitatively and quantitatively assay for
MDMA and its analogues in ecstasy tablets. Chromatography performance was based
on resolution, retention factor and efficiency. A highly selective HPLC protocol with
DAD using the Chromolith SpeedROD, RP-18, 50 x 4.6 mm was developed to
quantify MDMA and its analogue derivatives found in ecstasy tablets.
Chromatography, using monolithic columns, demonstrated good separation of the
amphetamines and the typical adulterants (Figure 3.15). Comparisons of column
types indicate that monolithic columns are more efficient than particulate columns
without loss of resolution. Monolithic columns reduced the retention time from
approximately 18.3 to 3.8 minutes resulting in faster separation without sacrificing
column efficiency (Figure 3.12). A single system that could successfully separate
MDMA and its related compounds, MDA, MDEA and MBDB, is highly desirable as
175

HPLC method development & chemometric analysis o f ecstasy & cocaine
these related compounds are increasingly found in combination with the illicit drug.
The application of the method to a large number of ecstasy tablets demonstrated the
suitability of the method for the routine analysis of ecstasy tablets and the practicality
of monolithic columns (McFadden et al. 2006).
Cocaine analysis was performed using the alternative multivariate method
development approach. The group of analytes under investigation comprised cocaine
and it’s more commonly occurring components present in street samples. This group
included cocaine, lidocaine, prilocaine, procaine, benzocaine caffeine, phenacetin and
acetylsalicylic acid. A two level fractional factorial design was created and used as
the basis of the experimental procedure. Performance indicators such as resolutions,
retention factors and efficiencies were calculated for each experimental run. Artificial
neural networks were applied to create response surfaces illustrating the relationship
between the chromatographic factors and the performance indicators.
The optimal chromatographic conditions selected for cocaine analysis using this
experimental approach were a mobile phase consisting of 20 mM phosphate
buffer/acetonitrile (85/15, v/v) maintained in an isocratic mode, pH at 3, flow rate at
1.0 mL min“1, column temperature at 35°C with Waters XBridge C l8 50 x 4.6 mm,
particle size 3.5 ^m column and sample detection at 200 nm. All eight analytes under
investigation were separated under ten minutes with good resolution using the
optimised chromatographic conditions developed (Figure 3.21). The method
developed was applied to seized cocaine samples and major drug constituents and
adulterants were identified (McFadden et. al. In preparation).
6.2. Analysis of illicit drug samples.
Ecstasy differs from many other drugs of abuse in that it is in tablet form and no
further excipients can be added at the different stages of trafficking. This is an
essential point for profiling and linking seizures as only those chemicals added at
manufacture can be present at street level. Linking seizures of ecstasy tablets is
primarily based on the similarity between seizures of visual, chemical and physical
data. Physical data includes colour, logo, shape, weight, diameter and thickness of the
tablet. Chemical profiling investigates the major amphetamine components, possible
176

HPLC method development & chemometric analysis of ecstasy & cocaine
adulterants and excipients used in the manufacture of tablets. The levels of chemical
components present in samples will vary in composition and quantities present.
As part of this study, physical and chemical data sets for 183 ecstasy tablets seized
from Ireland during the period 2002 to 2003 have been recorded as discrete data sets.
Physical characteristics recorded include tablet shape, colour, presence or absence of
brand logos, tablet weight, diameter and thickness. Chemical data sets include both
the quantification and occurrence in individual tablets of the major amphetamine
components (i.e. MDMA, MDA, MDMA, MDEA, MBDB and amphetamine),
adulterant components (i.e. caffeine, paracetamol, phenacetin and aspirin), diluent
components (i.e. sucrose, glucose, lactose, fructose, mannitol, sorbitol and inositol)
and inorganic components (i.e. Al, Ca, Cr, Fe, K, Mg, Na, Pb and Zn).
With a view to investigative purposes, a detailed chemical analysis of cocaine was
conducted. Whereas with ecstasy seizures, preliminary connections can automatically
be based on physical characteristics, such as logos or tablet colours, linking cocaine
seizures proves more difficult. All samples were analysed for active ingredients,
adulterants and sugars. The occurrence of drug ingredients, adulterants and sugar
components present in street samples were as follows; cocaine (100%), prilocaine
(42.8%), lidocaine (53.5%), benzocaine (3.5%), procaine (3.5%) , caffeine (57.1%),
phenacetin (64.2%), acetylsalicylic acid (3.5%), mannitol (42.9%), sucrose (35.7%),
lactose (17.9%o), sorbitol (3.6%) and inositol (3.6%). Samples varied with the level of
constituents present and in the combinations in which they occurred in each sample.
Due to the complexity of the chemical profiles associated with cocaine samples and
the small sample size, statistical analysis was not performed.
6.3. Chemometrics and statistical profiling of ecstasy samples.
Chemometrics, including unsupervised methods o f PCA, HCA and Pearson’s
correlation, as well as supervised methods of LDA and artificial neural networks was
applied to the chemical data sets from ecstasy samples to demonstrate the ability of
the statistical approach to linking seizures with samples (Chapter 5). HCA and ANN
were the statistical methods that most efficiently distinguished between linked and
unlinked seizures. Eleven groups were identified from the chemical data sets with
177

HPLC method development & chemometric analysis of ecstasy & cocaine
group classification dependant on the main amphetamine, adulterant and diluent
present. Further analysis with increased sample size is required to assure the
statistical reliability of this approach. Nevertheless profiling results by chemometrics
has the potential to classify drug seizures and to provide links between seized samples
or between materials found at the crime scene. The benefits from this study will
provide strategic intelligence and an understanding of the operational level in the Irish
ecstasy market and help evaluate the changing profile or dynamics associated with
this illegal market supply.
6.4. Establishing a profiling protocol in a forensic laboratory.
This study used ecstasy as the sample for chemically and statistically profiling
seizures. However, the protocols developed could lend themselves easily to other
types of drug seizures. The equipment required for profiling studies is minimal, as
most forensic laboratories would have a basic LC system. A HPLC with a diode array
detector proved to be an adequate instrument for the chemical analysis of ecstasy and
cocaine (qualitative and quantitative data). The data generated was sufficient for
classification purposes. More sophisticated instruments are available, such as an LC-
MS/MS. This would provide the same data and have the added advantage of being
able to detect impurities at very low concentration levels that might be present in the
sample. Impurity analysis is popular with researchers whose aim is to classify the
drugs. However, as proven in this study, determination o f impurities is not essential
for classification purposes. Therefore, a simple LC system with a UV detector is
sufficient for forensic laboratories establishing a drug profiling protocol. The actual
sample preparation and chromatographic analysis could be adopted into the routine
drug analysis already established in the laboratory which would minimise any
additional time required. Creating the statistical protocol may involve training;
however, as discussed previously in Chapter 5, once established in the laboratory, the
neural network software will be of major advantage for classification purposes.
Future methods of analysis should focus on developing a single LC system for the
simultaneous determination of all the major drug components commonly detected in
street samples. By using the multivariate approach for the method development, this
would ensure minimal experiments with maximum results. Also, the use of a
178

HPLC method development & chemometric analysis of ecstasy & cocaine
monolithic column would allow for a large number of analytes to be separated in
minimal time.
Metals are popular components of drug samples used for classification purposes
(Waddell et al. 2004, Koper et ol, 2007). In this study, metal data was unsuitable for
classification. The key to metal analysis is the choice of metals, those which identify
the synthetic pathways in which the ecstasy tablets were produced. These important
metals are platinum, boron, mercury and lithium. Any future profiling studies should
include these metals.
6.5. Future studies on the current major drugs in Ireland.
A temporal analysis of the major drugs from year to year would provide valuable
information on purity levels, types and levels o f adulterants and also provide
information on physical characteristics of the tablets such as trends in logos. An in-
depth geographical comparative analysis, either by county or by province, of each of
the major drugs could offer additional evidence to support investigations by providing
insights into dealer networks.
Considering Ireland is an island, one of the most important law enforcement agencies
is the Irish Customs service. Most of the synthetic and semi-synthetic drugs seized in
Ireland are produced outside of Ireland, so therefore the points of entry to this country
are essential to control. An interesting study would be to monitor the drug seizures at
each customs point for both physical and chemical profiling of all drug types.
Comparisons between each port and airport would be beneficial. Such a study should
also include points of entry in Northern Ireland. Cross border cooperation to identify
points of entry and dealer networks is imperative for both the Garda Siochana and the
Police Service of Northern Ireland (PSNI). Data gathered could be used to generate a
drug intelligence data bank which would be beneficial to national and international
law enforcement agencies.
The general trend in drug seizures in Ireland has changed in recent years. In 2003
ecstasy was the most seized drug in Ireland after cannabis, hence the reason for
choosing ecstasy as the drug to study in this thesis. After 2004, cocaine overtook
179

HPLC method development & chemometric analysis of ecstasy & cocaine
ecstasy as the most seized drug, after cannabis. Currently ecstasy is no longer one of
the most common illegal drugs seized. As reported in the Annual Garda Report 2010,
seizures of ecstasy have plummeted to 398 tablets, a decline of 95% since its height in
2000 (Figure 1.1). Cocaine quantities seized still remains very high in comparison
with other drugs, 94,804 grams of cocaine versus 26,462 grams of amphetamine and
30,158 grams of heroin (Annual Garda Report 2010). Recently there has been a
significant change in the types of drugs seized due to new legislation in March 2009,
when benzylpiperazine (BZP) was made illegal. In 2010, 351,536 tablets, 3,271 grams
and 371 capsules of this drug were seized. Also, there has been an increase in
seizures of abused prescription drugs. For example, Alprazolam or ‘Xanax’ as it is
more commonly known, is a benzodiazepine and is listed as a Schedule IV medicine
under the Misuse of Drugs Act 1984. Over seventy thousand tablets of this drug were
seized in 2010 alone. Equally, nearly 146000 tablets of diazepam, or Valium as it is
known as, were seized. Other abused prescription drugs that have been seized include
Clonazepam, Flunitrazepam (Rohypnol), Lorazepam, Prazepam, Temazepam,
Triazolam. Future studies on drugs in Ireland should reflect this shift in drug use.
At European level, the current major concern is the new psychoactive substances or
‘legal highs’ as they are known as. The EMCDDA received reports on forty one new
drugs in 2010, a huge increase from twenty four substances in 2009 and thirteen in
2008. The three main categories of emerging drugs include pipazerines, synthetic
cathinones and synthetic cannabinoids. They are all slightly modified versions of
existing illegal drugs. The piperazines include BZP, CPP (chlorophenylpiperazine),
TFMPP (l-(3-trifluoromethylphenyl) piperazine) and DBZP (1, 4-dibenzylpiperaine).
Synthetic cathinones derived from Khat (Catha edulis Forsk), are closely related to
the phenethylamine family and the most common types are mephedrone and
methylone. Synthetic cannabinoids are compounds that have the same effect as
cannabis but are not structurally similar to A9-THC, the active ingredient in cannabis.
This group of compounds include ‘Spice’ and twenty six other similar compounds.
The major concern regarding these products is the ease at which they can be
purchased and the escalating rate of their popularity. As they are new to the market,
in-depth and long term studies have not yet been performed on their possible health
effects.
1 8 0

HPLC method development & chemometric analysis of ecstasy & cocaine
Given the rise in seizures of BZP pills and prescription drugs, illegal drug purchases
may not be conducted by traditional street deals but are more likely internet
purchases. This poses problems for the law enforcement agencies, as identifying
dealer networks and apprehending the main dealers is much more complex. Ghost IP
addresses can be created easily by a computer enthusiast thus hiding the location of
the dealer. The dealer network may be more intricate and more global. Efforts must be
made not only by the analytical chemist but also the computer forensic scientist to
assist the law enforcement agencies in the crackdown in internet sales of illegal drugs.
In summary this research project, has been undertaken with the support and co
operation of the Garda Forensic Science Laboratory and provided an excellent
opportunity for the development and application of a liquid chromatographic method
for the chemical profiling of ecstasy and cocaine drugs of abuse. From an
investigative point of view linking drug seizures with chemical profiles provide a
means of determining the synthetic or natural origins o f the sample and provide
evidence of links between seized samples or between materials found at illegal
laboratories.
1 8 1

HPLC method development & chemometric analysis of ecstasy & cocaine
References
Aboul-Enein, H.Y., Hefnawy, M.M. 2005. Liquid chromatographic high throughput
analysis of Ketamine and its metabolites in human plasma using a monolithic silica
column and solid phase extraction. Talanta 65, 67-73.
Airaksinen, A.J., Tuppurainen, K.A., Lotjónen, S.E., Niemitz, M., Yu, M.,
Vepsáláinen, J.J., Laatikainen, R., Hiltunen, J., Bergstrom, K.A. 1999. Nuclear
magnetic resonance and molecular orbital study of some cocaine analogues.
Tetrahedron 55, 10537-10546.
Albu, F., Georgia, C,, David, V., Medvedovici, A. 2005. Liquid chromatography-
electrospray tandem mass spectrometry method for determination of indapamide in
serum for single/multiple dose bioequivalence studies of sustained release
formulations. Journal o f Chromatography B 816, 35-40.
Ali, H.R.H., Edwards, H.G.M., Hargreaves, M.D., Munshi, T., Scowen, I.J., Telford,
R.J. 2008. Vibrational spectroscopic characterisation of salmeterol xinafoate
polymorphs and a preliminary investigation of their transformation using
simultaneous in situ portable Raman spectroscopy and differential scanning
calorimetry. Analytica Chimica Acta 620, 103-112.
Andersson, K.s Lock, E., Jalava, K , Huizer, H., Jonson, S., Kaa, E., Lopes, A.,
Poortman-van der Meer, A., Sippola, E., Dujourdy, L., Dahlén, J. 2007,
Development o f a harmonised method for the profiling of amphetamines VI:
Evaluation of methods for comparison of amphetamine. Forensic Science
International 169, 86-99.
Andersson, K., Jalava, K., Lock, E., Finnon, Y., Huizer, H., Kaa, E., Lopes, A.,
Poortman-van der Meer, A., Cole, M.D., Dahlén, J., Sippola, E. 2007. Development
of a harmonised method for the profiling of amphetamines: III. Development o f the
gas chromatographic method. Forensic Science International 169, 50-63.
182

HPLC method development & chemometric analysis of ecstasy & cocaine
Andersson, K., Jalava, K., Lock, E., Huizer, H., Kaa, E., Lopes, A., Poortman-van
der Meer, A., Cole, M.D., Dahlen, J., Sippola, E. 2007. Development of a
harmonised method for the profiling of amphetamines: IV. Optimisation of sample
preparation. Forensic Science International 169, 64-76.
Andersson, M., Gustavsson, E., Stephanson, N., Beck, 0 . 2008. Direct injection LC-
MS/MS method for identification and quantification o f amphetamine,
methamphetamine, 3, 4-methyl enedioxyamphetamine and 3, 4-
methylenedioxymethamphetamine in urine drug testing. Journal o f Chromatography
B 861, 22-28.
Annual Garda Report. 2010. The annual report of an garda Siochana 2010.
Retrieved from
http://www.garda.ie/Documents/User/2Copy%20of%20Garda_English_2010_FL_LO
WRES.pdf on 17 October 2011.
Asperger, A., Efer, J., Koal, T., Engewald, W. 2002. Trace determination of priority
pesticides in water by means of high-speed on-line solid-phase extraction-liquid
chromatography-tandem mass spectrometry using turbulent-flow chromatography
columns for enrichment and a short monolithic column for fast liquid
chromatographic separation. Journal o f Chromatography A 960, 109-119.
Aturki, Z., D’Orazio, G.s Fanali, S., Rocco, A., Bortolotti, F., Gottardo, R., Tagliaro,
F. 2009. Capillary electrochromatographic separation of illicit drugs employing a
cyano stationary phase. Journal o f Chromatography A 1216, 3652-3659.
Baer, I., Gumy, R., Margot, P. 2007. NIR analysis of cellulose and lactose —
Application to ecstasy tablet analysis. Forensic Science International 167, 234-241.
Baer, L, Margot, P. 2007. Sugar and fatty acid analysis in ecstasy tablets. Forensic
Science International 167, 229-233.
183

HPLC method development & chemometric analysis of ecstasy & cocaine
Bandilla, D., Skinner, C.D. 2003. Protein separation by monolithic capillary
electrochromatography. Journal o f Chromatography A, 1004, 167-179.
Baranda, A.B., Berasaluce. O., Jimenez, R.M., Alonso, R.m. 2005. LC-DAD
determination of calcium channel blockers by using an experimental design approach.
Chromatographia 61,447-453.
Barrio, G., Saavedra, P., De La Fuente, L. 1997. Purity if cocaine seized, 1985-1993:
variations by weight, province and year of seizure. Forensic Science International,
85, 15-28.
Bedair, M., Rassai, Z.E. 2003. Capillary electrochromatography with monolithic
stationary phases: II. Preparation of cationic stearyl-acrylate monoliths and their
electrochromatographic characterization. Journal o f Chromatography A, 1013, 35-56.
Bell, S.E.J., Fido, L.A., Sirimuthu, N., Speers, S.J., Peters, K., Cosbey, S. 2007.
Screening Tablets for DOB Using Surface-Enhanced Raman Spectroscopy. Journal o f
Forensic Sciences 52, 1063-1067.
Bell, S.E.J., Thorbum Bums, D., Dennis, A.C., Matchett, L.J., Speers, J.S. 2000.
Composition profiling of seized ecstasy tablets by Raman spectroscopy. Analyst 125,
1811-1815.
Bell, S.E.J., Thorbum Bums, D., Dennis, AC., Matchett, L.J., Speers, J.S. 2003.
Tracking the distribution of “ ecstasy" tablets by Raman composition profiling: A
large scale feasibility study. Analyst 118, 1331-1335.
Bell, S.E.J., Thorbum Bums, D., Dennis, A.C., Speers, J.S. 2000. Rapid analysis of
ecstasy and related phenethylamines in seized tablets by Raman spectroscopy.
Analyst 125, 541-544.
1 8 4

HPLC method development & chemometric analysis of ecstasy & cocaine
Bermejo-Barrera, P., Moreda-Pineiro, A., Moreda-Pineiro, J., Bermejo-Barrera, A.
1996. Determination of traces of chromium in cocaine and heroin by flameless
atomic absorption spectrometry. Talanta 43, 77-87.
BermejorBarrera, P., Moreda-Pineiro, A., Moreda-Pineiro, J., Bermejo-Barrera, A.
1997. Application of rapid electrothermal atomic absorption spectrometric methods
to the determination o f Ag, Al, Cd and Mn in cocaine and heroin samples. Freseniust
Journal o f Analytical Chemistry 358, 844-847.
Bermejo-Barrera, P., Moreda-Pineiro, A., Moreda-Pineiro, J., Bermejo-Barrera, A.,
Bermejo-Barrera, A, 1999. A study of illicit cocaine seizure classification by pattern
recognition techniques applied to metal data. Journal o f Forensic Sciences 44, 1-6.
Bernardo, N.P. 2003. Caffeine and other adulterants in seizures of street cocaine in
Brazil. International Journal o f Drug Policy 14, 331-334.
Billault, I., Courant, F., Pasquereau, L., Derrien, S., Robins R.J., Naulet, N. 2007.
Correlation between the synthetic origin of methamphetamine samples and their 15N
and 13C stable isotope ratios. Analytica Chimica Acta 593, 20-29.
Bishop, C.M. 1996. Neural networks for pattern recognition. Oxford University
Press, England.
Boatto, G., Nieddu, M., Dessi, G., Manconi, P., Cerri R. J. 2007. Determination of
four thiophenethylamine designer drugs (2C-T series) in human plasma by capillary
electrophoresis with mass spectrometry detection. Journal o f Chromatography A
1159, 198-202.
Bora, T., Merdivan, M., Hamamci, C. 2002. Levels of trace and major elements in
illicit heroin’. Journal o f Forensic Science 47, 1-5.
185

HPLC method development & chemometric analysis of ecstasy & cocaine
Boti, V.I., Sakkas, V.A., Albanis, T.A. 2009. An experimental sedign approach
employing artificial neural networks for the determination of potential endocrine
disruptors inn food using matrix solid-phase dispersion. Journal o f Chromatography
A 1216, 1296-1304.
Brachet, A., Christen, P., Gauvrit, J.Y., Longeray, R., Lanteri, P., Veuthey, J.L. 2000.
Experimental design in supercritical fluid extraction of cocaine from coca leaves.
Journal o f Biochemical and Biophysical Methods 43, 353-366.
Branovic, K., Forcic, D., Ivancic, J., Strancar, A., Barut, M., Kosutic Gulija, T.,
Zgorelec, R., Mazuran, R. 2004. Application of short monolithic columns for fast
purification of plasmid DNA. Journal o f Chromatography B 801, 331-337.
Brown, S.D., Rhodes, D.J., Pritchard, B. 2007. A validated SPME-GC-MS method
for simultaneous quantification of club drugs in human urine. Forensic Science
International 171, 142-150.
Bugey, A., Staub, C. 2004. Rapid analysis of benzodiazepines in whole blood by
high performance liquid chromatography: use of monolithic column. Journal o f
Pharmaceutical and Biomedical Analysis 35, 555-562.
Byrska, B., Zuba, D. 2008. Profiling o f 3, 4-methylenedioxymethamphetamine by
means of high-performance liquid chromatography. Analytical and Bioanalytical
Chemistry 390, 715-722.
Cairns, T., Hill, V., Schaffer, M., Thistle, W. 2004. Amphetamines in washed hair of
demonstrated users and workplace subjects. Forensic Science International 145, 137-
142.
Carter, J.F., Titterton, E.L., Murray, M., Sleeman, R. 2002. Isotopic characterisation
of 3, 4-methylenedioxyamphetamine and 3, 4-methylenedioxymethylamphetamine
(ecstasy). Analyst 127, 830-833.
1 8 6

HPLC method development & chemometric analysis of ecstasy & cocaine
Casale, J., Ehleringer, J., Morello, D., Lott, M. 2005. Isotopic fractionation of carbon
and nitrogen during the illicit processing of cocaine and heroin in South America.
Journal o f Forensic Science 50, 1315-1321.
Caufiled W.V., Stewart J.T. 2002. Rapid determination of selected drugs of abuse in
human plasma using a monolithic silica HPLC column and solid phase extraction.
Journal o f Liquid Chromatography and Related Technologies 25, 2977-2998.
Cheng, J.Y.K., Chan, M.F., Chan, T.W., Hung, M.Y. 2006. Impurity profiling of
ecstasy tablets seized in Hong Kong by gas chromatography-mass spectrometry.
Forensic Science International 162, 87-94.
Chéze, M., Deveaux, M., Martin, C., Lhermitte, M., Pépin, G. 2007. Simultaneous
analysis of six amphetamines and analogues in hair, blood and urine by LC-ESI-
MS/MS: Application to the determination of MDMA after low Ecstasy intake.
Forensic Science International 170, 100-104.
Cledera-Castro, M., Santos-Montes, A., Izquierdo-Hornillos, R. 2005. Comparison
of the performance of conventional microparticulates and monolithic reversed-phase
columns for liquid chromatography separation of eleven pollutant phenols. Journal o f
Chromatography A 1087, 57-63.
Cole, J.C., Bailey, M., Sumnall, H.R., Wagstaff, G.F., King, L.A. 2002. The content
of ecstasy tablets: implications for the study of their long term effects. Addiction 97,
1531-1536.
Collins, M., Casale, E., Hibbert, D.B., Panicker, S., Robertson, J., Vujic, S. 2006.
Chemical profiling of heroin recovered from the North Korean merchant vessel Pong
Su. Journal o f Forensic Science 51, 597-602.
Comment S., Lock, E., Zingg, C., Jakob, A. 2001. The analysis of ecstasy tablets by
ICP/MS and ICP/AES. Problems o f Forensic Sciences 46, 131-146.
187

HPLC method development & chemometric analysis of ecstasy & cocaine
Concheiro, M., De Castro, A., Quintela, O,, Lopez-Rivadulla, M., Cruz, A. 2006,
Determination of drugs of abuse and their metabolites in human plasma by liquid
chromatography-mass spectrometry: An application to 156 road fatalities. Journal o f
Chromatography B 832, 81-89,
Concheiro, M., de Castro, A., Quintela, O., Cruz, A., Lopez-Rivadulla, M. 2007.
Confirmation by LC-MS of drugs in oral fluid obtained from roadside testing.
Forensic Science International 170, 156-162.
Coufal, P. 2002. Methacrylate monolithic columns of 320|im I.D. for capillary liquid
chromatography. Journal o f Chromatography A 946, 99-106.
Council for the European Union. 2004. EU Drugs Strategy (2005-2012). Council for
the European Union, Retrieved from
http://emcdda.europa.eu/attachements.cfm/att_10375_EN_EU%20Drugs%20Strategy
_EN.pdf on 17 October 2011.
Dahlen, J., Von Eckardstein, S. 2006. Development of a capillary zone
electrophoresis method including a factorial design and simplex optimisation for
analysis of amphetamine, amphetamine analogues, cocaine, and heroin. Forensic
Science International 157, 93-105.
Darke, S., Kaye, S., Topp, L. 2002. Cocaine use in New South Wales, Australia,
1996-2000: 5 year monitoring of trends in price, purity, availability and use from the
illicit drug reporting system. Drug and Alcohol Dependence 67, 81-88.
Day, J.S., Edwards, H.G.M., Dobrowski, S.A., Voice, A.M. 2004. The detection of
drugs of abuse in fingerprints using Raman spectroscopy I: latent fingerprints.
Spectrochimica Acta Part A: Molecular and Biomolecular Spectroscopy 60, 563-568.
Dayrit, F., Dumlao. M. 2004. Impurity profiling of methamphetamine hydrochloride
drugs seized in the Philippines. Forensic Science International 144, 29-36.
1 8 8

HPLC method development & chemometric analysis o f ecstasy & cocaine
De Korompay, A., Hill, J.C., Carter, J.F., NicDaeid, N., Sleeman, R. 2008.
Supported liquid-liquid extraction of the active ingredients (3,4-
methylenedioxymethamphetamine) from ecstasy tablets for isotopic analysis. Journal
o f Chromatography A 1178, 1-8.
Department of Community, Rural and Gaeltacht Affairs. 2009. National Drugs
Strategy (Interim) 2009 - 2016. Department of Community, Rural and Gaeltacht
Affairs. Retrieved from
http ://www.drugsandalcohol.ie/123 88/1/DCRGA_S trategy_2009-2016.pdf on 17
October 2011.
De Martinis, B.S., Barnes, A.J., Scheidweiler, K.B., Huestis, M.A. 2007.
Development and validation of a disk solid phase extraction and gas chromatography-
mass spectrometry method for MDMA, MDA, HMMA, HMA, MDEA,
methamphetamine and amphetamine in sweat. Journal o f Chromatography B 852,
450-458.
Dufey, V., Dujourdy, L., Besacier, F., Chaudron, H. 2007. A quick and automated
method for profiling heroin samples for tactical intelligence purposes. Forensic
Science International 169, 108-117.
Dujourdy, L., Besacier, F. 2008. Headspace profiling of cocaine samples for
intelligence purposes. Forensic Science International 179, 111-122.
Dujourdy, L., Dufey, V., Besacier, F., Miano, N., Marquis, R., Lock, E., Aalberg, L.,
Dieckmann, S., Zrcek, F., Bozenko Jr. J.S. 2008. Drug intelligence based on organic
impurities in illicit MA samples. Forensic Science International 111, 153-161.
Eliasson, C., Macleod, N.A., Matousek, P. 2008. Non-invasive detection of cocaine
dissolved in beverages using displaced Raman spectroscopy. Analytica Chimica Acta
607, 50-53.
189

HPLC method development & chemometric analysis of ecstasy & cocaine
European Monitoring Centre for Drug and Drug Addiction. 2003. The state of the
drugs problem in Europe, Annual Report 2003. European Monitoring Centre for Drug
and Drug Addiction. Retrieved from
http://candidates.emcdda.europa.eu/download/candidates_ar2003-en.pdf on 17
October 2011.
European Monitoring Centre for Drug and Drug Addiction. 2007. The state of the
drugs problem in Europe, Annual Report 2007. European Monitoring Centre for Drug
and Drug Addiction. Retrieved from
http://www.emcdda.europa.eu/attachements.cfm/att_44705_EN_TDAC07001ENC.pd
fon 17 October 2011.
European Monitoring Centre for Drug and Drug Addiction. 2008. The state of the
drugs problem in Europe, Annual Report 2008. European Monitoring Centre for Drug
and Drug Addiction. Retrieved from
http://www.emcdda.europa.eu/attachements.cfm/att_64227_EN_EMCDDA_AR08_E
N.pdf on 17 October 2011.
European Monitoring Centre for Drug and Drug Addiction. 2010. The state of the
drugs problem in Europe, Annual Report 2010. European Monitoring Centre for Drug
and Drug Addiction. Retrieved from
http://www.emcdda.europa.eu/attachements.cfm/att_120104_EN_EMCDDA_AR201
0_EN.pdf on 17 October 2011.
Esseiva, P., Anglada, F., Dujourdy, L., Taroni, F., Margot, P., Du Pasquier, E.,
Dawson, M., Roux, C., Doble, P. 2005. Chemical profiling and classification of
illicit heroin by principal component analysis, calculation o f inter sample correlation
and artificial neural networks. Talanta 67, 360-367.
Esseiva, P., Ioset, S., Anglada, F., Gaste, L., Ribaux, O., Margot, P., Gallusser, A.,
Biedermann, A., Specht, Y., Ottinger, E. 2007. Forensic drug Intelligence: An
important tool in law enforcement. Forensic Science International 167, 247-254.
190

HPLC method development & chemometric analysis of ecstasy & cocaine
Ewald, A.H., Fritschi, G,, Maurer, H.H. 2007. Metabolism and toxicological
detection of the designer drug 4-iodo-2,5-dimethoxy-amphetamine (DOI) in rat urine
using gas chromatography-mass spectrometry. Journal o f Chromatography B 857,
170-174.
Ewald, A.H., Puetz, M., Maurer, H.H. 2008. Designer drug 2,5-dimethoxy-4-methyl-
amphetamine (DOM, STP): Involvement of the cytochrome P450 isoenzymes in
formation of its main metabolite and detection o f the latter in rat urine as proof of a
drug intake using gas chromatography-mass spectrometry. Journal o f
Chromatography B 862, 252-256.
Forcic, D., Branovic-Cakanic, K., Ivancic, J., Jug, R,, Barut, M., Strancar, A. 2005.
Purification of genomic DNA by short monolithic columns. Journal o f
Chromatography A 1065, 115-120.
Fucci, N. 2004. Phenacetin and cocaine in a body packer. Forensic Science
International 141, 59-61.
Fucci, N., De Giovanni, N. 1998. Adulterants encountered in the illicit cocaine
market’. Forensic Science International 95, 247-252.
Fucci, N., De Giovanni, N., Scarlata S. 2008. Sweat testing in addicts under
methadone treatment: An Italian experience. Forensic Science International 174, 107-
110.
Gimeno, P., Besacier, F., Chaudron-Thozet, H., Girard J., Lamotte, A. 2002. A
contribution to the chemical profiling of 3, 4-methylenedioxymethamphetamine
(MDMA) tablets. Forensic Science International 127, 1-44.
Gimeno, P., Besacier, F., Chaudron-Thozet, H., Girard, J., Lamotte, A. 2003.
Optimization of extraction parameters for the chemical profiling of 3,
4 methylenedioxymethamphetamine (MDMA) tablets. Forensic Science
International 132, 182-194.
191

HPLC method development & chemometric analysis of ecstasy & cocame
Gosav, S., Praisler, M., Van Bocxlaer, J., De Leenheer, A.P., Massart, D.L. 2006.
Class identity assignment for amphetamines using neural networks and GC-FT1R
data*. Spec troc hi mica Acta Part A: Molecular and Biomolecular Spectroscopy 64,
1110-1117.
Gostic, T., Klemenc, S. 2007. Evidence on unusual way of cocaine smuggling:
Cocaine-polymethyl methacrylate (PMMA) solid solution—study of clandestine
laboratory samples. Forensic Science International 169, 210-219.
Gottardo, R., Bortolotti, F., De Paoli, G., Pascali, J.P., MikSik, I., Tagliaro F. 2007.
Hair analysis of illicit drugs by using capillary zone electrophoresis-electrospray
ionisation-ion trap mass spectrometry. Journal o f Chromatography A 1159, 185-189.
Grûger, T., Schaffer, M., Pütz, M., Ahrens, B., Drew, K., Eschner, M., Zimmermann,
R. 2008. Application of two-dimensional gas chromatography combined with pixel-
based chemometric processing for the chemical profiling illicit drug samples. Journal
o f Chromatography A 1200, 8-16.
Guiochon, G. 2007. Monolithic columns in high-performance liquid
chromatography. Journal o f Chromatography A 1168. 101 -168.
Gunnar, T., Engblom, C., Ariniemi, K. 2007. Pressure-adjusted continual flow heart-
cutting from the high throughput determination o f amphetamine-type-stimulant drugs
in whole blood by fast multidimensional gas chromatography-mass spectrometry.
Journal o f Chromatography A 1166, 171-180.
Gusev, I., Haung, X., Horvath, C. 1999. Capillary columns with in situ formed
porous monolithic packing for micro high-performance liquid chromatography and
capillary electrochromatography. Journal o f Chromatography A 855, 273-290.
Hayes, J.D., Malik, A. 2000. Sol-Gel Monolithic Columns with Reversed
Elcctroosmotic Flow for Capillary fclcctrochromatography. Analytical Chemistry 72,
4090-4099.
192
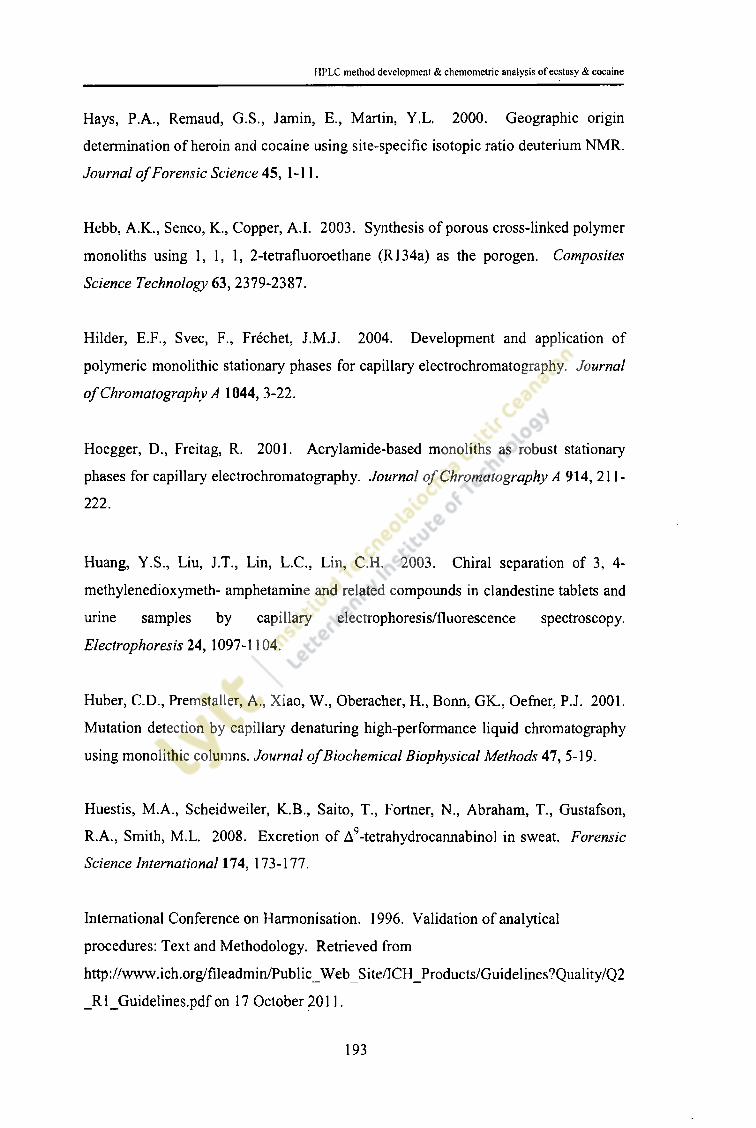
HPLC method development & chemometric analysis of ecstasy & cocaine
Hays, P.A., Remaud, G.S., Jamin, E., Martin, Y.L. 2000. Geographic origin
determination of heroin and cocaine using site-specific isotopic ratio deuterium NMR.
Journal o f Forensic Science 45, 1-11.
Hebb, A.K., Senco, K., Copper, A.I. 2003. Synthesis of porous cross-linked polymer
monoliths using 1, 1, 1, 2-tetrafluoroethane (R134a) as the porogen. Composites
Science Technology 63, 2379-2387.
Hilder, E.F., Svec, F.} Frechet, J.M.J. 2004. Development and application of
polymeric monolithic stationary phases for capillary electrochromatography. Journal
o f Chromatography A 1044, 3-22.
Hoegger, D., Freitag, R. 2001. Aery 1 amide-based monoliths as robust stationary
phases for capillary electrochromatography. Journal o f Chromatography A 914, 211-
222.
Huang, Y.S., Liu, J.T., Lin, L.C,, Lin, C.H. 2003. Chiral separation of 3, 4-
methylenedioxymeth- amphetamine and related compounds in clandestine tablets and
urine samples by capillary electrophoresis/fluorescence spectroscopy.
Electrophoresis 24, 1097-1104.
Huber, C.D., Premstaller, A., Xiao, W., Oberacher, H., Bonn, GK., Oefner, P.J. 2001.
Mutation detection by capillary denaturing high-performance liquid chromatography
using monolithic columns. Journal o f Biochemical Biophysical Methods 47, 5-19.
Huestis, M.A., Scheidweiler, K.B., Saito, T., Fortner, N., Abraham, T., Gustafson,
R.A., Smith, M.L. 2008. Excretion of A9-tetrahydrocannabinol in sweat. Forensic
Science International 174, 173-177.
International Conference on Harmonisation. 1996. Validation of analytical
procedures: Text and Methodology. Retrieved from
http://www.ich.org/fileadmin/Public_Web_Site/ICH_Products/Guidelines7Quality/Q2
_Rl_Guidelines.pdf on 17 October 2011.
193

HPLC method development & chemometric analysis of ecstasy & cocaine
Infante, F., Domiguez, E., Trujillo, D., Luna, A. 1999. Metal contamination in illicit
samples of heroin. Journal o f Forensic Sciences 44, 1-4.
Irish Statute Book. 2010. Criminal Justice (Psychoactive Substances) Act 2010.
Retrieved from www.attomeygeneral.ie/eAct/2010/a2210.pdf on 17 October 2011.
Ishida, T., Kudo, K , Kiyoshima, A., Inoue, H., Tsuji, A., Ikeda N. 2005. Sensitive
determination of alpha-methyltryptamine (AMT) and 5-methoxy-N,N-
diisopropyltryptamine (5MeO-DIPT) in whole blood and urine using gas
chromatography-mass spectrometry. Journal o f Chromatography B 823, 47-52.
Ishii, H., Morishita, M., Yamad, H., Iawasa, S., and Yajima, T. 2001. Simultaneous
analysis of cocaalkaloids and sugars in illicit cocaine using capillary electrophoresis.
Journal o f Forensic Science 46, 490-495.
Iwata, Y.T., Inouea, H., Kuwayamaa, K Kanamoria, T., Tsujikawaa, K , Miyaguchia
H,, Kishia T. 2006. Forensic application of chiral separation of amphetamine-type
stimulants to impurity analysis of seized methamphetamine by capillary
electrophoresis. Forensic Science International 161, 92-96.
Iwata, Y.T., Kanamori, T., Ohmae, Y., Tsujikawa, K., Inoue, H., Kishi, T. 2003.
Chiral analysis of amphetamine-type stimulants using reversed-polarity capillary
electrophoresis/positive ion electrospray ionization tandem mass spectrometry.
Electrophoresis 24, 1770-1776.
Jancic-Stojanovic, B.} Ivanovic, D.} Malenovic, A., Medenica, M. 2009. Artificial
neural networks in analysis of indinavir and its degradation products retention.
Talanta 78, 107-112.
Janco, M., Xie, S.F., Peterson, D.S., Allington, R.W., Svec, F., Frechet, J.M.J. 2002.
Effect of porosity and surface chemistry on the characterization of synthetic polymers
by HPLC using porous polymer monolithic columns. Journal o f Separation Science
25, 909-916.
1 9 4

HPLC method development & chemometric analysis o f ecstasy & cocaine
Janhunen, K., Cole, M.D. 1999. Development of a predictive model for batch
membership of street samples of heroin. Forensic Science International 102, 1-11.
Johnston A., King, L.A. 1998. Heroin profiling: Predicting the country o f origin of
seized heroin. Forensic Science International 95, 47-55.
Jones, A.W., Holmgren, A., Kugelberg, F.C. 2008. Concentrations of cocaine and its
major metabolite benzoylecgonine in blood samples from apprehended drivers in
Sweden. Forensic Science International 177, 133-139,
Jonson C.S.L., Stromberg, J. 1993. Computer aided retrieval of common-batch
members in Leuckart amphetamine profiling. Journal o f Forensic Science 38, 1475-
1477.
Kang, J.W., Wistuba, D., Schurig, W, 2002. A silica monolithic column prepared by
the sol-gel process for enantiomeric separation by capillary electrochromatography.
Electrophoresis 23, 1116-1120.
Kankaanpaa, A., Liukkonen, R., Ariniemi, K. 2007, Determination of y-
hydroxybutyrate (GHB) and its precursors in blood and urine samples: A salting out
approach. Forensic Science International 170, 133-138.
Katagi, M., Tsuchihashi, H. 2002. Update on clandestine amphetamines and their
analogues recently seen in Japan. Journal o f Health Science 48, 14-21.
Kato, M., Sakai-Kato, K., Toyooka, T., Dulay, M.T. 2002. Effect o f preparatory
conditions on the performance of photopolymerized sol-gel monoliths for capillary
electrochromatography. Journal o f Chromatography A 961, 45-51.
Kelly, T., Gray, T.R., Huestis M.A. 2008. Development and validation o f a liquid
chromatography-atmospheric pressure chemical ionization-tandem mass spectrometry
method for simultaneous analysis of 10 amphetamine-, methamphetamine- and 3, 4-
methylenedioxymethamphetamine-related (MDMA) analytes in human meconium.
Journal o f Chromatography B 867, 194-204.
195

HPLC method development & chemometric analysis of ecstasy & cocaine
Kikura-Hanajiri, R., Kawamura, M., Saisho, K., Kodama, Y., Goda, Y. 2007. The
disposition into hair of new designer drugs; methylone, MBDB and methcathinone.
Journal o f Chromatography B 855, 121 -126.
Kim, E.M., Lee, J.S., Choi, S.K., Lim, M.A., Chung, U.S. 2008. Analysis of
Ketamine and norketamine in urine by automatic solid-phase extraction (SPE) and
positive ion chemical ionization-gas chromatography-mass spectrometry (PCI-GC-
MS). Forensic Science International 174, 197-202.
King, L.A. 1997. Drug content of powders and other illicit preparations in the UK.
Forensic Science International 85, 135-147.
Kirchherr, H., Klihn-Velten, W.N. 2006. Quantitative determination of forty-eight
antidepressants and antipsychotics in human serum by HPLC tandem mass
spectrometry: A multi level, single sample approach. Journal o f Chromatography B
843, 100-113.
Klemenc, S. 2001. In common batch searching of illicit heroin samples — evaluation
of data by chemometrics methods. Forensic Science International 115, 43-52.
Kochana, J., Parczewski, A., Wilamowski, J. 2006. SPE/TLC Profiling of the
impurities of MDMA: the influence of an agglutinant, excipients and adulterants.
Journal o f Liquid Chromatography & Related Technologies 29, 1247-1256.
Kochana, J., Wilamowski, J., Parczewski, A., Surma, M. 2003(a). Synthesis of
standards of the most important markers of Leuckart p-methoxymethamphetamine
(PMMA), examination of the influence of experimental conditions and a drug diluent
of SPE/TLC profiling. Forensic Science International 134, 207-213.
Kochana, J., Wilamowski, J., Parczewski, A., Surma, M. 2003(b). Profiling of
impurities in p-methoxymethamphetamine (PMMA) by means o f SPE/TLC method,
examination of the influence of experimental condition according to 24 factorial.
Forensic Science International 134, 214-218.
196

HPLC method development & chemometric analysis of ecstasy & cocaine
Köper, C., Van den Boom, C., Wiarda, W., Schrader, M., De Joode, P., Van der Peijl,
G., Bolck, A. 2007. Elemental analysis of 3, 4-methylenedioxymethamphetamine
(MDMA): A tool to determine the synthesis method and trace links. Forensic Science
International 171, 171-179.
Komysova, O., MaruSka, A., Owens, P.K., Erickson, M. 2005. Non-particulate
(continuous bed or monolithic) acrylate-based capillary columns for reversed-phase
liquid chromatography and electrochromatography. Journal o f Chromatography A
1071, 171-178.
Kort, M., Cramer, T. 1999. Pragmatism versus ideology: Dutch drug policy
continued. Journal o f Drug Issues 29, 473-492.
Krawczyk, W., Parczewski, A. 2001. Application o f chemometric methods in
searching for illicit Leuckart amphetamine sources. Analytica Chimica Acta 446,
107-114.
Kronstrand, R., Ny ström, I., Strandberg, J., Druid, H. 2004. Screening for drugs of
abuse in hair with ion spray LC-MS-MS. Forensic Science International 145, 183-
190.
Kuwayama, K., Inoue, H., Phorachata, J., Kongpatnitiroj, K., Puthaviriyakom, V.,
Tsujikawa, K., Miyaguchi, H., Kanamori, T., Iwata, Y., Kamo, N., Kishi, T. 2008
Comparison and classification of methamphetamine seized in Japan and Thailand
using gas chromatography with liquid-liquid extraction and solid-phase
microextraction. Forensic Science International 175, 85-92.
Kuwayama, K., Tsujikawa, K., Miyaguchi, H., Kanamori, T., Iwata, Y., Inoue, H.,
Saitoh, S., Kishi, T. 2006. Identification of impurities and the statistical classification
of methamphetamine using headspace solid phase microextraction and gas
chromatography-mass spectrometry. Forensic Science International 160, 44-52.
197

HPLC method development & chemometric analysis of ecstasy & cocaine
Lammerhofer, M., Svec, F., Frechet, J.M.J., Linder, W. 2001. Capillary
electrochromatography in anion-exchange and normal-phase mode using monolithic
stationary phases. Journal o f Chromatography A 925, 265-277.
Lee, S., Park, Y., Han, E., Choe, S., Lim, M., Chung, H. 2008. Preparation and
application of a fortified hair reference material for the determination of
methamphetamine and amphetamine. Forensic Science International 178, 207-212.
Lee, G.S.H., Taylor, R.C., Dawson, M., Kannangara, G.S.K., Wilson, M.A. 2000.
High-resolution solid state I3C nuclear magnetic resonance spectra o f 3, 4-
methylenedioxyamphetamine hydrochloride and related compounds and their
mixtures with lactose. Solid State Nuclear Magnetic Resonance 16, 225-237.
Levy, R., Zelkowicz, A., Abu, E., Ravreby, M. 2007. “Life expectancy” of “ecstasy”
tablets in Israel in the years 2001-2003. Forensic Science International 167, 22-29.
Lewis, R.J., Reed, D., Service, A.G., Langford, A.M. 2000. The identification of 2-
chloro-4, 5-methylenedioxymethylamphetamine in an illicit drug seizure. Journal o f
Forensic Science 45, 1-7.
Lin, Y.H., Li, J.H., Ko, W.K.,Wu, S.M. 2006. Direct and sensitive analysis of
methamphetamine, Ketamine, morphine and codeine in human urine by cation-
selective exhaustive injection and sweeping micellar electrokinetic chromatography.
Journal o f Chromatography A 130, 281 -286.
Lociciro, S., Esseiva, P., Hayoz, P., Dujourdy, L., Besacier, F., Margot, P. 2008.
Cocaine profiling for strategic intelligence, a cross-border project between France and
Switzerland: Part II. Validation of the statistical methodology for the profiling of
cocaine. Forensic Science International 177, 199-206.
198

HPLC method development & chemometric analysis of ecstasy & cocaine
Lociciro, S., Hayoz, P., Esseiva, P., Dujourdy, L., Besacier, F., Margot, P. 2007.
Cocaine profiling for strategic intelligence purposes, a cross-border project between
France and Switzerland: Part I. Optimisation and harmonisation of the profiling
method. Forensic Science International 167, 220-228.
Lock, E., Aalberg, L., Andersson, K,, Dahlen, J., Cole, M.D., Finnon, Y., Huizer, H.,
Jalava, K., Kaa, E., Lopes, A., Poortman-van der Meer, A., Sippola E. 2007.
Development of a harmonized method for the profiling of amphetamines V:
determination of the variability of the optimised method. Forensic Science
International 169, 77-85.
Lopez Artiguez, M., Camean, A., Repetto, M. 1995. Unequivocal identification of
several common adulterants and excipients in street samples of cocaine by infrared
spectroscopy. Journal o f Forensic Science 40, 602-611.
Lubbad, S., Mayr, B., Huber, C.G., Buchmeiser, M.R. 2002. Micropreparative
fractionation of DNA fragments on metathesis-based monoliths: influence of
stoichiometry on separation. Journal o f Chromatography A 959, 121-129.
Lueng, S.C. 2002. Facts and Myths of Common Drugs Abused in Hong Kong’.
Hong Kong Journal o f Psychiatry 12, 13-19.
Lurie, I.S., Anex, D.S., Fintschenko, Y., Choi, W.Y. 2001. Profiling of impurities in
heroin by capillary electrochromatography and laser-induced fluorescence detection.
Journal o f Chromatography A 924, 421 -427.
Macchia, M.s Bertini, S., Mori, C., Orlando, C., Papi, C., Placanica, G. 2004.
Efficient application of monolithic silica column to determination of illicit heroin
street sample by HPLC. II Farmaco 59, 237-239.
Makino, Y., Kurobane, S., Miyasaka, K., Nagano, K. (2003) ‘Profiling of ecstasy
tablets seized in Japan’. Microgram Journal. Retrieved from
199

HPLC method development & chemometric analysis of ecstasy & cocaine
http://www.justice.gov/dea/programs/forensicsci/microgram/joumal071203/mj071203
_pg3.html on 22 February 2010.
Mandel, J. 1964. The Statistical Analysis of Experimental Data, Interscience Publ., J.
Wiley & Sons, New York.
Marchei, E., Colone, P., Nastasi, G.G., Calabro, C,, Pellegrini, M., Pacifici, R.,
Zuccaro, P., Pichini S. 2008. On-site screening and GC-MS analysis of cocaine and
heroin metabolites in body packers urine. Journal o f Pharmaceutical and Biomedical
Analysis 48, 383-387.
Mari, F., Politi, L., Bertol, E. 2008. Nails of newborns in monitoring drug exposure
during pregnancy. Forensic Science International 179, 176-180.
Marin, S.J., Coles, R., Urry, F.M., McMillin, G.A. 2007. Confirmation of
cannabinoids using two-dimensional gas chromatography with mass spectrometry
detection. Journal o f Chromatography B 858, 59-64.
Marumo Y., Inoue, T., Seta, S. 1994. Analysis of inorganic impurities in seized
methamphetamine samples. Forensic Science International 69, 89-95.
McFadden, K., Gillespie, J., Carney, B., O’Driscoll, D. 2006. Development and
application of a high-performance liquid chromatography method using monolithic
columns for the analysis of ecstasy. Journal o f Chromatography A 1120, 54-60.
Medenica, M., Jancic, B., Ivanovic, D., Malenovic A. 2004. Experimental design in
reversed phase high performance liquid chromatographic analysis of imatinib
mesylate and its impurity. Journal o f Chromatography A 1031, 243-248.
Milhazes, M., Martins, P., Uriarte, E., Garrido, J., Calheiros, R., Paula M., Marques
M., Borges F. 2007. Electrochemical and spectroscopic characterisation of
amphetamine-like drugs: Application to the screening of 3, 4-
2 0 0

HPLC method development & chemometric analysis of ecstasy & cocaine
methylenedioxymethamphetamine (MDMA) and its synthetic precursors. Analytica
Chimica Acta 596, 231-241.
Miller, J.N., Miller, J.C. 2005. Statistics and chemometrics for analytical chemistry.
Pearson Education Limited, Harlow, England.
Milroy, C.M., Clark, J.C., Forrest, A.R.W. (1996) ‘Pathology of deaths associated
with “ecstasy” and “eve”’. Journal of Clinical Pathology, 49:149-153.
Mitrevski, B., Zdravkovski, Z. 2005, Rapid and simple method for direct
determination o f several amphetamines in seized tablets by GC-FID’. Forensic
Science International 152, 199-203.
Muratsu, S., Ninomiya, T., Kagoshima, Y., Matsui, J. 2002. Trace elemental analysis
of drugs of abuse using synchrotron radiation total reflection X-ray fluorescence
analysis (SR-TXRF). Journal o f Forensic Science 47, 1-6.
Myors, R., Wells, R.J., Skopec, S.V., Crisp, P., Skopec, Z,, Ekangaki, A., Robertson,
J. 1998. Preliminary investigation of heroin fingerprinting using trace element
concentrations. Analytical Communications 35, 403-407.
Namera, A., Nakamoto, A., Nishida, M., Saito, T., Kishiyama, I., Miyazaki, S.,
Yahata, M., Yashiki, M., Nagao M. 2008. Extraction of amphetamines and
methylenedioxyamphetamines from urine using a monolithic silica disk-packed spin
column and high-performance liquid chromatography-diode array detection. Journal
o f Chromatography A 1208, 71-75.
National Advisory Committee on Drugs. 2007. Annual Report 2007. National
Advisory Committee on Drugs. Retrieved from
http://www.nacd.ie/publications/anrep07/NACD_AR07_EN.pdf on 17 October 2011.
Nic Daeid, N., Waddell, R.J.H. 2005. The analytical and chemometric procedures
used to profile illicit drug seizures. Talanta 67, 280-285.
2 0 1
HPLC method development & chemometric analysis o f ecstasy & cocaine
Nichols, D.E., Glennon, RA. 1984. Medicinal chemistry and structure activity
relationships of hallucinogens in: Jacobs, BL (Ed) Hallucinogens: neurochemical,
behavioral and clinical perspectives, pages 9 5 - 142 (New York, Raven Press)
Novotna, K., Havlis, J., Havel, J. 2002. Optimisation of high performance liquid
chromatography separation of neuroprotective peptides: Fractional experimental
designs combined with artificial neural networks. Journal o f Chromatography A
1096, 50-57.
O’Connell, D., Heffron, J. 2000. Rapid analysis if illicit drugs by mass spectrometry:
Results from seizures in Ireland. Analyst 125, 119-121.
Orlandini, S., Fanali, S., Furlanetto, S., Marras, A.M., Pinzauti, S. 2004. Micellar
electrokinetic chromatography for the simultaneous determination of ketorolac
tromethamine and its impurities: Multivariate optimization and validation. Journal o f
Chromatography 1032, 253-263.
Palenicek, T., Fiserova, M., Kubu, P. 2002. Test of ecstasy tablets in Czech republic-
quantitative analysis. Adiktologie 1, 70-71.
Palhol, F., Boyer, S., Naulet, N., Chabrillat, M. 2002. Impurity profiling of seized
MDMA tablets by capillary gas chromatography. Analytical Bioanalytical Chemistry
374,274-281.
Peters, E.C., Petro, M., Svec, F., Frechet, J.M.J. 1998. Molded Rigid Polymer
Monoliths as Separation Media for Capillary Electrochromatography. 2. Effect of
Chromatographic Conditions on the Separation. Analytical Chemistry 70, 2296-2302.
Piette, V., Parmentier, F. 2002. Analysis of illicit amphetamine seizures by capillary
zone electrophoresis. Journal o f Chromatography A 979, 345-352.
2 0 2

HPLC method development & chemometric analysis of ecstasy & cocaine
Pihlainen, K., Sippola, E,, Kostiainen, R, 2003. Rapid identification and quantitation
o f compounds with forensic interest using fast liquid chromatography-ion trap mass
spectrometry and library searching. Journal o f Chromatography A 994, 93-102.
Pistos, C., Stewart, J.T. 2004. Assay for the simultaneous determination of
acetaminophen-caffeine-butalbital in human serum using a monolithic column.
Journal o f Pharmaceutical and Biomedical Analysis 36, 737-741.
Pothier, J., Galand, N., Viel, C. 1993. Determination of some narcotic and toxic
alkaloidal compounds by overpressured thin-layer chromatography with ethyl acetate
as eluent. Journal o f Chromatography A 634, 356-35
Puthaviriyakom, V., Siriviriyasomboon, N., Phorachata, J., Pan-ox, W., Sasaki, T.,
Tanaka, K.. 2002. Identification of impurities and statistical classification of
methamphetamine tablets (Ya-Ba) seized in Thailand. Forensic Science International
126, 105-113.
Rashed, A.M., Anderson, R.A., King, L.A. 2000. Solid Phase extraction for profiling
of ecstasy tablets. Journal o f Forensic Science 45, 413-418.
Renfroe, C.L. 1986. MDMA on the street: analysis anonymous. Journal o f
Psychoactive Drugs 18, 291-304.
Rodil, R., Carro, A.M., Lorenzo, R.A., Cela, R. 2007. Multi criteria optimisation of a
simultaneous supercritical fluid extraction and clean-up procedure for the
determination of persistent organohalogenated pollutants in aquaculture samples.
Chemosphere 67, 1453-1462.
Rouini, M.R., Ardakani,Y.H., Hakemi, L., Mokhberi, M., Badri, G. 2005.
Simultaneous determination of clobazam and its major metabolite in human plasma
by a rapid HPLC method. Journal o f Chromatography B 823, 167-171.
2 0 3

HPLC method development & chemometric analysis o f ecstasy & cocaine
Ryder, A., O’Conner, G.M., Glynn, T.J. 1999. Identifications and quantitative
measurements of narcotics in solid mixtures using near IR Raman spectroscopy and
multivariate analysis. Journal o f Forensic Science 44, 1013-1020.
Sadeghipour, F., Veuthey, J.L., Giroud, C., Rivier, L. 1997(a). Rapid determination
of amphetamines by high performance liquid chromatography with UV detection.
Journal o f Chromatography A 761, 71-78.
Sadeghipour, F., Veuthey, J.L. 1997(b). Sensitive and selective determination of
methylenedioxylated amphetamines by high performance liquid chromatography with
fluorimetrie detection. Journal o f Chromatography A 787, 137-143.
Sagmtiller, B., Schwarze, B., Brehm, G., Trachta, G., Schneider S. 2003.
Identification of illicit drugs by a combination of liquid chromatography and surface-
enhanced Raman scattering spectroscopy. Journal o f Molecular Structure 661, 279-
290.
Salem, M.Y., Ross, S.A., Murphy, T.P., Elsohly, M.A. 2001. GC-MS determination
of heroin metabolites in meconium: Evaluation of four solid phase extraction
cartridges. Journal o f Analytical Toxicology 25, 93-98.
Samanidou, V.F., Ioannou, A.S., Papadoyannis, I.N. 2004. The use of a monolithic
column to improve the simultaneous determination of four cephalosporin antibiotics
in pharmaceuticals and body fluids by HPLC after solid phase extraction—a
comparison with a conventional reversed-phase silica-based column. Journal o f
Chromatography B 809, 175-182.
Sarafraz Yazdi, A., Es’haghi, Z. 2005. Liquid-liquid-liquid phase microextraction of
aromatic amines in water using crown ethers by high-performance liquid
chromatography with monolithic column. Talanta 66, 664-669.
Sauer, C., Staack F., Fritschi, G., Maurer, H.H. 2008. Metabolism and toxicological
detection of a new designer drug, N-(l-phenylcyclohexyl)propanamine, in rat urine
204
HPLC method development & chemometric analysis of ecstasy & cocaine
using gas chromatography-mass spectrometry. Journal o f Chromatography A 1186,
380-390.
Schifano, F. 2000. Potential human neurotoxicity of MDMA (’’ecstasy”): subjective
self reports, evidence from an Italian drug addiction centre and clinical case studies.
Neuropsychobiology 42, 25-33.
Schneider, R.C., Kovar, KA. 2003. Analysis of ecstasy with a monolithic reversed
phase column. Chromatographia 57, 287-291.
Sherlock, K., Wolff, K , Hay, A., Conner, M. 1999. Analysis if illicit ecstasy tablets:
implications for clinical management in the accident and emergency department.
Journal o f Accident and Emergency Medicine 16, 194-197.
Shin, H.S., Donike, M. 1996. Stereospecific derivatisation of amphetamines, phenol
alkylamines, and hydroxyamines and quantification of the enantiomers by capillary
GC/MS. Analytical Chemistry 68, 3015-3020.
Sondermann, N., Kovar, KA. 1999. Screening experiments of ecstasy street samples
using near infrared spectroscopy. Forensic Science International 106, 147-156.
Soni, P., Singh, M., Kamble, A.L., Banerjee, U.C. 2007. Response surface
optimisation of the critical medium components for carbonyl reductase production by
Candida viswanathii MTCC 5158. Bioresource Technology 98, 829-833.
Spruit, I.P. 1999. Ecstasy use and policy responses in the Netherlands. Journal o f
Drug Issues 29, 653-678.
Stimpfl, T., Reichel S. 2007. Distribution of drugs of abuse within specific regions
of the human brain. Forensic Science International 170, 179-182.
Swist, M., Wilamowski, J., Parczewski, A. 2005. Basic and neutral route specific
impurities in MDMA prepared by different synthesis methods: Comparison of
impurity profiles. Forensic Science International 155, 100-111.
205

HPLC method development & chemometric analysis of ecstasy & cocaine
Tanner-Smith, E. 2006. Pharmacological content of tablets sold as “ecstasy”: Results
from an online testing service. Drug and Alcohol Dependence 83, 247-254.
Teng, S.F., Wu, S.C., Liu, C., Li, J.H., Chien, C.S. 2006. Characteristics and trends
of 3, 4-methylenedioxymethamphetamine (MDMA) tablets found in Taiwan from
2002 to February 2005. Forensic Science International 161, 202-208.
The Netherlands national drug monitor. 2007. NDM annual report 2007. Trimbos
Institutute. Utrecht, The Netherlands.
Theobald, D.S., Fritschi, G., Maurer, H.H. 2007. Studies of the toxicological
detection of the designer drug 4-bromo-2,5-dimethoxy-P-phenylamine (2C-B) in rat
urine using gas chromatography-mass spectrometry. Journal o f Chromatography B
846, 374-377.
Tran, A.T.K., Hyne, R.V., Pablo, F., Day, W.R., Doble, P. 2007. Optimisation of the
separation of herbicides by linear gradient high performance liquid chromatography
utilising artificial neural networks. Talanta 71, 1268-1275.
Tsai, C.C., Liu, J.T., Shu, Y.R., Chan, P.H., Lin, C.H. 2006. Optimization of the
separation and on-line sample concentration of phenethylamine designer drugs with
capillary electrophoresis-fluorescence detection. Journal o f Chromatography A
1101,319-323.
Tsujikawa, K., Kuwayama, K., Miyaguchi, H., Kanamori, T., Iwata, Y.T., Yoshida,
T., Inoue, H. 2008. Development of an on-site screening system for amphetamine-
type stimulant tablets with a portable attenuated total reflection Fourier transform
infrared spectrometer. Analytica Chimica Acta 608, 95-103.
United Nations International Drug Control Programme. 2001. Drug
characterisation/impurity profiling. United Nations. Retrieved from
http://www.unodc.org/pdf/publications/st-nar-32-revl.pdf on 17 October 2011.
206

HPLC method development & chemometric analysis of ecstasy & cocaine
Urthaler, J., Schlegl, R., Podgomik, A, Strancar, A, Jungbauer, A., Necina, R. 2005.
Application of monoliths for plasmid DNA purification: Development and transfer to
production. Journal o f Chromatography A 1065, 93-106,
Waddell, R., NicDaeid, N., Littlejohn, D. 2004. Classification of ecstasy tablets
using trace metal analysis with the application of chemometric procedures and
artificial neural network algorithms. Analyst 129, 235-240.
Wang, Y., Harrison, M., Clark, B.J. 2006. Optimising reversed phase liquid
chromatographic separation of an acidic mixture on a monolithic stationary phase
with the aid of response surface methodology and experimental design. Journal o f
Chromatography A 1105, 199-207.
Webb, R., Doble, P., Dawson, M. 2009. Optimisation of HPLC gradient separations
using artificial neural networks (ANNs): Application to benzodiazepines in post
mortem samples. Journal o f Chromatography B 877, 615-620.
Weinberger, R., Lurie, I.S. 1991. Micellar electrokinetic capillary chromatography
of illicit drug substances. Analytical Chemistry 63, 823-827.
Weyermann, C., Marquis, R., Delaporte, C., Esseiva, P., Lock, E., Aalberg, L.,
Bozenko JS., Dieckmann, S., Dujourdy, L., Zrcek, F. 2008. Drug intelligence based
on MDMA tablets data: I. Organic impurities profiling. Forensic Science International
177, 11-16.
Whiting, T.C., Liu, R.H., Chang, W.T., Bodapati, M.R. 2001. Isotopic analogues as
internal standards for quantitative analyses of drugs and metabolites by GC-MS—
nonlinear calibration approaches. Journal o f Analytical Toxicology 25, 179-189.
World Health Organisation. 1997. Amphetamine -type Stimulants, A report from the
WHO Meeting on Amphetamines, MDMA and other psychostimulants. World Health
Organisation. Retrieved from
http://whqlibdoc.who.int/hq/! 997/WHO_MSA_PSA_97.5.pdf on 17 October 2011.
207

HPLC method development & chemometric analysis of ecstasy & cocaine
Wood, M., Laloup, M., Del Mar Ramirez Fernandez, M., Jenkins, K.M., Young,
M.S., Ramaekers, J.G., De Boeck, G., Samyn, N. 2005. Quantitative analysis of
multiple illicit drugs in preserved oral fluid by solid-phase extraction and liquid
chromatography-tandem mass spectrometry. Forensic Science International 150,
227-238.
Wu, J.T., Zeng, H., Deng, Y., Unger, S.E. 2001. High-speed liquid
chromatography/tandem mass spectrometry using a monolithic column for high-
throughput bioanalysis. Rapid Communications in Mass Spectrometry 15, 1113-1119.
Wu, Y.H., Lin, K.L., Chen, S.C., Chang, Y.Z. 2008. Integration of GC/EI-MS and
GC/NCI-MS for simultaneous quantitative determination of opiates, amphetamines,
MDMA, Ketamine, and metabolites in human hair. Journal o f Chromatography B
870,192-202.
Yan, L., Zhang, O., Zhang, J, Zhang, L., Li, T., Feng, Y., Zhang, L., Zhang, W.,
Zhang, Y. 2004. Hybrid organic-inorganic monolithic stationary phase for acidic
compounds separation by capillary electrochromatography. Journal o f
Chromatography A 1046, 255-261.
Yi Fan, Y., Feng, Y.O., Da, S.H., Shi, Z.G. 2004. Poly (methacrylic acid-ethylene
glycol dimethacrylate) monolithic capillary for in-tube solid phase microextraction
coupled to high performance liquid chromatography and its application to
determination of basic drugs in human serum. Analytica Chimica Acta 523, 251-258.
Zapata-Torres, G., Cassels, B.K., Parra-Mouchet, J., Mascarenhas, Y.P., Ellena, J., De
Araujo, A.S. 2008. Quantum-chemical, NMR and X-ray diffraction studies on (±)-l-
[3,4-(methylenedioxy)phenyl]-2-methylaminopropane. Journal o f Molecular
Graphics and Modelling 26, 1296-1305.
Zawilla, N.H., Diana, J., Hoogmartens, J., Adams E. 2006. Analysis of neomycin
using an improved liquid chromatographic method combined with pulsed
electrochemical detection. Journal o f Chromatography B 833, 191-198.
2 0 8

HPLC method development & chemometric analysis of ecstasy & cocaine
Zhang, Y.P., Zhang, Y.J,, Gong, W.J., Gopalan, A.I., Lee, K.P. 2005. Rapid
separation of Sudan dyes by reverse phase high performance liquid chromatography
through statistically designed experiments. Journal o f Chromatography A 1098, 183-
187.
Zhao Sheng, L., Xu, Y.L., Yan, C., Gao, R.Y. 2004. Preparation and characterization
of molecularly imprinted monolithic column based on 4-hydroxybenzoic acid for the
molecular recognition in capillary electrochromatography. Analytica Chimica Acta
523, 243-250.
209

209
ÎIPLC method development & chemometric analysis o f ecstasy & cocaine
Appendix: Table A1. Physical and chem ical data (i.e. active & sugar com ponents) for the 183 ecstasy tablet sam ples used in this study
Sample Physical characteristics Chemical data (mg/g)
# Logo Colour Weight(mg)
Thickness(mm)
Diameter(mm) MDMA MDEA Amp Caffeine Lactose Sorbitol
i Mitsubishi White 302.3 4.5 11.5 285.1 0.0 ' 0.0 0.0 291.8 0.0
! >■* Mitsubishi White 285.2 4.5 11.5 337.3 0.0 0.0 0.0 234.2 0.0
: u ....... Mitsubishi White 309.7 4.5 11.5 222.1 0.0 0.0 0.0 407.7 0.0 j
2.1 Armani White 313.8 4.5 10.5 259.4 0.0 0.0 0.0 430.1 0.0
2.2 Armani White 323.2 4.5 10.5 232.9 0.0 0.0 0.0 534.6 0.0
2.3 Armani White 327.4 4.5 10.5 182.3 0.0 0.0 0.0 444.5 0.0
3.1 Motorola White 183.5 3.5 10.0 433.4 ~ 0 .0 0.0 0.0 528.7 0.0 j3.2 Motorola White 206.9 3.5 10.0 394.5 0.0 0.0 0.0 567.0 0.0 1
3.3 Motorola White 210.2 3.5 10.0 410.0 0.0 0.0 0.0 574.7 0.0 ¡4.1 Bird White 246.2 ■ 4.0 12.0 259.9 0.0 0.0 0.0 0.0 668.1
4.2 Bird White 256.3 4.0 12.0 281.5 0.0 0.0 0.0 0.0 586.9
4.3 Bird White 255.2 4.0 12.0 337.7 0.0 0.0 0.0 0.0 654.0
C T i No logo White 243.3 4.0 10.5 421. i 0.0 0.0 0.0~ 357.9 0.0
1 5.2 No logo White 246.1 4.0 10.5 423.0 0.0 0.0 0.0 404.8 0.0!
c*i 1
vv [1 No logo White 244.0 4.0 10.5 351.6 0.0 0.0 0.0 408.3 0.0
6.1 Chi White 314.9 3.0 10.0 285.2 0.0 0.0 0.0 576.4 0.06.2 Chi White 324.9 3.0 10.0 301.1 0.0 0.0 0.0 588.3 0.06.3 Chi White 319.9 3.0 10.0 260.5 0.0 0.0 0.0 560.8 0.0
! 7JBird White 256.4 4.0 1ÏÏ5 334.8 0.0 0.0 0.0 641.2 0.0 j
! 7.2 Bird White 250.6 4.0 11.5 272.1 0.0 0.0 0.0 629.9 o.o 1! 7.3 Bird White 253.7 4.0 11.5 271.7 0.0 0.0 0.0 668.2 o.o !

210
HPLC method development & cheniometric analysis of ecstasy & cocaine
Table Al (contd.)
S a m p le # Logo Colour Weight(mg)
Thickness(mm)
Diameter(mm)
MDMA MDEA A m p Caffeine Lactose Sorbitol
i *A Bird White 260.6 3.0 10.0 286.6 0.0 0.0 0.0 732.8 • 0.0
; 8.2L
Bird White 264.5 3.0 10.0 266.7 0.0 0.0 0.0 696.3 0.0
? . f L Bird White 253.4 3.0 !0.0 291.6 0.0 0.0 0.0 722.8 0.0
9.1 Mitsubishi White (BS) 302.4 3.5 9.5 380.2 0.0 0.0 0.0 575.4 0.0
9.2 Mitsubishi White (BS) 317.3 3.5 9.5 396.7 0.0 0.0 0.0 583.6 0.0
9.3 Mitsubishi White (BS) 311.2 3.5 9.5 289.8 0.0 0.0 0.0 601.4 0.0
Í 10.1 Crown White ~ 322.6 5.5 10.0 312.7 0.0 a o 0.0 610.2 0.0
I 10.2I
Crown White 298.9 5.5 10.0 326.4 0.0 0.0 0.0 625.3 0.0
[ 10.3 Crown White 313.3 5.5 10.0 328.4 0.0 0.0 0.0 622.9 0.0
I I .1 Dexter White 370.6 4.0 10.0 297.1 0.0 0.0 0.0 589.6 0.0
11.2 Dexter White 349.6 4.0 10.0 316.5 0.0 0.0 0.0 574.8 0,0
11.3 Dexter White 338.7 4.0 10,0 271.6 0.0 0.0 0.0 596.3 0.0
j 12.1 V2 White .288.4 4.5 10.5 324.3 0.0 0.0 0.0 610.1 0.0
1 12.2i
V2 White 296.9 4.5 10.5 355.4 0.0 0.0 0.0 624.3 0.0
t 12.3 V2 White 285.9 4.5 10.5 295.2 0.0 0.0 0.0 622.7 0.0
13.1 Smirnoff White (BS) 194.4 4.0 9.0 365.3 2.1 0.0 0.0 686.7 0.0
13.2 Smirnoff . White (BS) 195.2 4.0 9.0 355,4 1.9 0.0 0.0 685.4 0.0
13.3 Smirnoff White (BS) 183.0 4.0 9.0 3S7.7 Î.1 0.0 0.0 673.2 0.0
r i4-] Bird Pink 336.2
ii1 o
i ^i
9.0 70,8 0.0 14.2 0.5 0.0 0.0
1 14.2 Bird Pink 328.0 5.0 9.0 97.7 0.0 18.7 0.7 0.0 0.0
i 14.3 Bird Pink 336.0 5.0 9.0 76.1 0.0 15.1 0.5 0.0 0.0

HPLC method development & chcmometTÎc analysis of ecstasy & cocaine
Table Al (contd.)
Sample U Logo Colour Weight(mg)
Thickness(mm)
Diameter(mm) MDMA MDEA Amp Caffeine Lactose Sorbitol
Í 15.1 Smirnoff White (BS) 193.2- 3.5 10,0 302.3 0.0 0.0 0.0 594.7 0.0 ¡
1 15.2 Smirnoff White (BS) 193.8 3.5 10.0 339.4 0.0 0.0 0.0 461.3 0.0 ¡
L . Smirnoff White (BS) 183.4 3.5 10.0 357.3 0.0 0.0 0.0 483.1 o.o ;
16.1 Taz Devi) White (BS) ’ 243.5 3.5 11.5 257.0 0.0 0.0 0.0 0.0 0.0
16.2 Taz Devil White (BS) 247.6 3.5 *11.5 321.1 0.0 0.0 0.0 0.0 0.016.3 Taz Devil White (BS) 246.5 3.5 11.5 306.7 0.0 0.0 0.0 0.0 0.0
r nj Red Bull White ~194~Z 4.0 10.0 331.7 ~0.0 0.0 6.2 369.1 OS) }, 7 , Red Bull White 200.5 4.0 10.0 419.1 0.0 0.0 7.6 366.5 0.0
L 173 Red Bull White 196.5 4.0 10.0 359.8 0.0 0.0 7.5 355.2 0.0 !
18.1 Smiley White (BS) 275.8 4.0 11.0 278.5 0.0 0.0 0.0 0.0 0.018.2 Smiley White (BS) 288.3 4.0 11.0 278.3 0.0 0.0 0.0 0.0 0.018.3 Smiley White (BS) 279.1 4.0 11.0 336.4 0.0 0.0 0.0 0.0 0.0
1 19.1 Bird White 305.4 4.0 ; 12.0 253.0 0.0 0.0 0.0 715.4 0.0 !j 19.2 Bird White 304.5 4.0 12.0 217.3 0.0 0.0 0.0 655.1 0.0 !
[ 19.3 Bird White 305.8 4.0 12.0 283.3 0.0 0.0 0.0 637.6 0.0 I20.1 Euro White 301.5 3.5 11.0 192.2 0.0 0.0 0.0 762.8 0.020.2 Euro White 305.0 3.5 11.0 240.2 0.0 0.0 0.0 696.3 0.020.3 Euro White 298.7 3.5 11.0 330.6 0.0 0.0 0.0 722.8 0.0
¡ 21.1 Mitsubishi White 309.3 4.0 11.0~ 244.2 0.0 0.0 0.0 576.4 0.0 1j 21.2 Mitsubishi White 297.8 4.0 II.O 216.0 0.0 0.0 0.0 5S8.3 0.0 f
j 21.3 Mitsubishi White 297.4 4.0 11.0 166.2 0.0 0.0 0.0 560.8 0.0 !

HPLC method development & chcmonictric analysis o f ecstasy & cocaine
Table Al (contd.)
Sample # Logo Colour Weight(mg)
Thickness(mm)
Diameter(mm) MDMA MDEA Amp Caffeine Lactose Sorbitol
i 22.1 Crown White 242.9 4.5 10.0 37.4 58.7 0.0 3.0 652.1 o.o ;
22.2 Crown White ■ 245.2 4.5 10.0 26.6 52.1 0.0 2.8 457.5 0.0 1
22.3 Crown White 260.6 4.5 io:o 21.8 52.2 0.0 2.1 486.1 0.0 ‘
23.1 ' m&m’s White (BS) 186.7 3.5 10.0 297.2 0.0 0.0 10.7 189.0 0.0
23.2 m&m’s White (BS) 195.6 3.5 10.0 315.9 0.0 0.0 10.2 206.0 0.0
23.3 m&m’s White (BS) 188.7 3.5 10.0 259.5 0.0 0.0 11,4 205.0 0.0
j 24.1 m&m’s White (BS) 193.8 4;0 10.0 316.0 0.0 0.0 10.5 200.2 o.o :1 24.2 m&m’s White (BS) 197.1 4.0 10.0 342.4 0.0 0.0 11.6 184.1
oo
[ 24.3- m&m’s White (BS) 196.7 4.0 10.0 285.1 0.0 0.0 10.9 185.0 0.0 ,25.1 m&m’s White (BS) 192.6 3.5 10.0 291.8 0.0 0.0 9.5 624.0 0.025.2 m&m’s White (BS) 195.9 3.5 10.0 234.2 0.0 0.0 8.8 550.2 0.0
25.3 m&m’s White (BS) 191.2 3.5 10.0 407.7 0.0 0.0 8.5 573.2 0.0
|~~ 26.1 Euro White 285.5 4.0 I z o 280.5 0.0 0.0 0.0 0.0~ 737.6 !
j 26.2 Euro White 287.2 4.0 12.0 239.3 0.0 0.0 0.0 0.0 916.0 j
L 26,3 Euro White 289.3 4.0 12.0 208.3 0.0 0.0 0.0 0.0 807.4 1
27.1 Mitsubishi White 311.9 3.5 10.5 221.2 0.0 0.0 0.0 648.2 0.0
27.2 Mitsubishi White 309.6 3.5 10.5 173.8 0.0 0.0 0.0 666.0 0.0
27.3 Mitsubishi White 311.0 3.5 Î0.5 180.1 0.0 0.0 0.0 615.7 0.028.1 Mitsubishi White 301.1 3.5 11.0 ~ 229.1 ~~o.o 0.0 0.0 6ÏÏ.Q ~~~0-°“ i28.2 Mitsubishi White . 292.0 3.5 11.0 240.2 0.0 0.0 0.0 588.3 0.0 j
28.3 Mitsubishi White 304.2 3.5 11.0 . 187.1 0.0 0.0 0.0 567.0 0.0 j
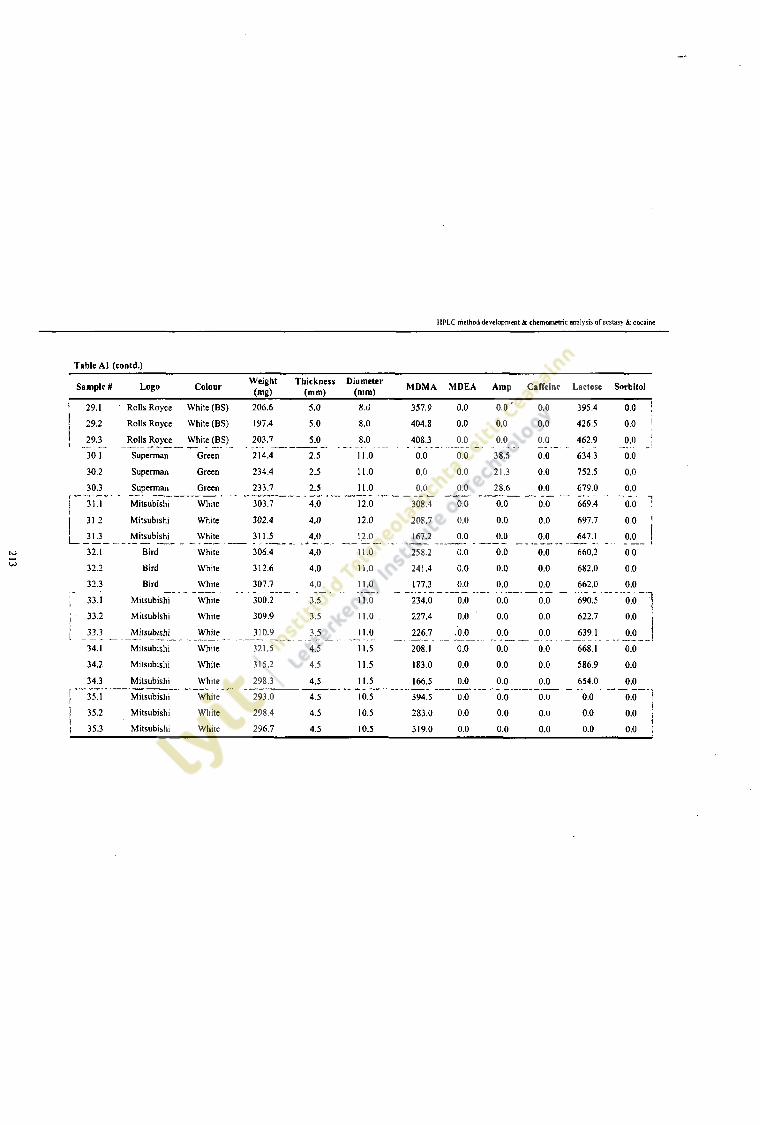
HPLC method development & chemometric analysis of ecstasy & cocaine
Table Al (contd.)
Sample # Logo Colour Weight(mg)
Thickness(mm)
Diameter(mm) MDMA MDEA Amp Caffeine Lactose Sorbitol
* 29.1 1 Rolls Royce White (BS) 206.6 5.0 8:0 357.9 0.0 0.0 ' 0.0 395.4 o.o 129.2 Rolls Royce White (BS) 197.4 5.0 8.0 404.8 0.0. 0.0 0.0 426.5 o.o 1
* 29.3 Rolls Royce White (BS) 203.7 5.0 8.0 408.3 0.0 0.0 0.0 462.9 o.o !30.1 Superman Green 214.4 2.5 11.0 0.0 0.0 38.5 0.0 634.3 0.0
30.2 Superman Green 234.4 2.5 11.0 0.0 0.0 21.3 0.0 752.5 0.0
30.3 Superman Green 233.7 2.5 11.0 0.0 0.0 28.6 0.0 679.0 0.0. .Mitsubishi White 303.7 4.0 12.0 308.4 0.0 0.0 0.0 669.4 0.0 1
I 31.2 Mitsubishi White 302.4 4.0 12.0 208.7 0.0 0.0 0.0 697.7 0.0 j
L j l l _Mitsubishi White 311.5 4.0 12.0 167:2 0.0 0.0 0.0 647.1 0.0 J
32.1 Bird White 306.4 4.0 11.0 258.2 0.0 0.0 0.0 660.2 0.0
32.2 Bird White 312.6 4.0 11.0 241.4 0.0 0.0 0.0 682.0 0.0
32.3 Bird White 307.7 4.0 11.0 177.3 0.0 0.0 0.0 662.0 0.0
: 33.1 Mitsubishi White 300.2 3.5 11.0 234.0 0.0 0.0 0.0 690.5i (
o 1
Ö ; j
; • 33.2 Mitsubishi White 309.9 3.5 11.0 227.4 0.0 0.0 0.0 622.7 0.0 j
Mitsubishi White 3 J 0.9 3.5 11.0 226.7 .0.0 0.0 0.0 639.1 0;0 1
34.1 Mitsubishi White 321.5 4.5 11.5 208.1 0.0 0.0 0.0 668.1 0.0
34.2 Mitsubishi White 315.2 4.5 11.5 183.0 0.0 0.0 0.0 586.9 0.0
34.3 Mitsubishi White 298.3 4.5 11.5 166.5 0.0 0.0 0.0 654.0 0.0
I 35.1 Mitsubishi White 293.0 4.5 10.5 394.5 0.0 0.0 0.0 0.0 o.o 11j 35.2 Mitsubishi White 298.4 4.5 10.5 283.0 0.0 0.0 0.0 0.0 0.0
1 35.3 Mitsubishi White 296.7 4.5 10.5 319.0 0.0 0.0 0.0 0.0 0.0

214
UPLC method development & chemometric analysis o f ecstasy & cocaine
Table Al (contd.)
Sample # Logo Colour Weight(mg)
Thickness(mm)
Diameter(mm) MDMA MDEA Amp Caffeine Lactose Sorbitol
i 36.1 Durex White (BS) 245.9 4.0 10.5 249.4 11.6 0.0 0.0 633.5 o.o 1
j 36.2 Durex White (BS) 248.6 4.0 10.5 323.8 13.3 0.0 0.0 617.8 0.0 i
I 36.3 Darex White (BS) 248.9 4.0 10.5 204.3 12.9 0.0 0.0 584.9 . ;37.1 Mitsubishi White 300.3 4.0 1J.5 39).2 0.0 0.0 0.0 ~ 659.6 0.0
37.2 Mitsubishi White 297.3 4.0 11.5 205.4 0.0 0.0 0.0 643.4 0.0
37.3 Mitsubishi White 300.3 4.0 11.5 229.1 0.0 0.0 0.0 634.7 0.0
j 38.] Mitsubishi White (BS) 295.1 4.0 11.0 253.6 0.0 0.0 * 0.0 616.0 0.0 1
1 38.2 Mitsubishi White (BS) 290.7 4.0 11.0 221.9 0.0 0.0 0.0 642.9 0.0 !1 38.3 Mitsubishi White (BS) 299.0 4.0 11.0 203.5 0.0 0.0 0.0 640.1 0.0 j
39.1 Red Bull White (BS) 199.0 3.0 9.0 325.1 0.0 0.0 3.9 654.2 0.0
39.2 Red Bull White (BS) 199.5 3.0 9.0 448.7 0.0 0.0 3.6 610.0 0.0
39.3 Red Bull White (BS) 189.3 3.0 9.0 297.3 0.0 0.0 4.2 567.3 0.0
[ 40.1 m&nvs White (BS) ~"~200Y 3.5 10.0' 317.9 0.0 0.0 11.2 171.2 0.0
j 40.2 m&m's White (BS) 205.2 3.5 10.0 282.5 0.0 0.0 8.3 194.9 o.o !1! 40.3 m&m’s White (BS) 190.9 3.5 10.0 197.0 0.0 0.0 8.8 183.3 0.0 1
41.1 m&m’s White (BS) 199.3 3.5 10.0 431.7 0.0 0.0 13.5 171.6 0.0
41.2 m&m’s White (BS) 197.3 3.5 10.0 327.7 0.0 0.0 11.9 196.6 0.0
41.3 m&m’s White (BS) 194.1 3.5 10.0 443.3 0.0 0.0 13.1 174.6 0.042.]' Durex White 248. r ‘ 4ÄT 11.5 ^336.3 13.4 Io 0.0 .138.0 0.0 "Î42.2 Durex White 247.2 4.0 11.5 306.1 13.2 0.0 0.0 559.8 0.0 j
42.3 Durex White 246.8 4.0 11.5. ' 193.1 14.8 0.0 0.0 555.9 0.0 ¡

HPLC method development & chcmometric analysis o f ecstasy & cocaine
Table Al (contd.)
Sample # Logo Colour Weight(mg)
Thickness(mm)
Diameter(mm) MDMA MDEA Amp Caffeine Lactose Sorbitol
; « , Durex White <BS) 246,0 3.5 10.5 422.3 16.9 0.0 0.0 519.5 0.0 -
! 43.2 Durex White (BS) 241.7 3.5 10.5 332.7 14.5 0.0 0.0 531.2 o.o ;! 43.3 Durex White (BS) 241.7 3.5 10.5 227.7 16.2 0.0 0.0 555.2 0.0
44.1 Mitsubishi White 304.8 5.0 11.o' 247.4 0.0 0.0 0.0 578.7 0.0
44.2 Mitsubishi White 301.5 5.0 11.0 252.7 0.0 0.0 0.0 591.7 0.0
44.3 Mitsubishi White 291.6 5.0 11.0 184.9 0.0 0.0 0.0 551.7 0.0
Ì 45.1 Red Bull. White (BS) 195.9 3.0 10.0 2637 0.0 0.0 3.6 573.2 oTo ,; 45, Red Bull White (BS) 187.3 3.0 10.0 326.6 0.0 0.0 3.3 547.7 0.0 '
L 453 Red Bull White (BS) 190.8 3.0 10.0 269.5 0.0 0.0 2.8 571.8 0.0
46.1 Smirnoff White (BS) 195.7 3.0 10.0 408.4 0.0 0.0 0.0 482.8 0.0
46.2 Smirnoff White (BS) 192.9 3.0 10.0 264.9 0.0 0.0 0.0 469.6 0.0
46.3 Smirnoff White (BS) 191.8 3.0 10.0 327.1 0.0 0.0 0.0 507.8 0.0
1 47.1 Mitsubishi White 303.4 4.0 11.5 1985 Ò.0 0.0 0.0 652.6 0.0 j
47.2 Mitsubishi White 287.3 4.0 11.5 294.3 0.0 0.0 0.0 635.0 0.0 1
L 4.7'3 Mitsubishi White 295.5 4.0 11.5 176.2 0.0 0.0 0.0 633.5 0.0 ;48.1 Coca-Cola White (BS) 202.9 3.0 10.0 294.1 4.8 0.0 5.0 413.5 0.0
48.2 Coca-Cola White (BS) 193.4 3.0 10.0 359.9 4.9 0.0 5.8 453.9 0.0
48.3 Coca-Cola White (BS) 208.7 3.0 10.0 238.1 4.4 0.0 5.9 448.0 0.0
|~~ 49.1 Coca-Cola White (BS) 186:8 3.5 9.5 ~ 15275 4.9 0.0 4.6 367.2 0.0 "I
1 49.2 Coca-Cola White (BS) 191.5 3.5 9.5 318.2 4.2 0.0 4.6 430.2 0.0 !
1 49.3 • Coca-Cola White (BS) 185.8 3.5 9.5 308.5 4.3 0.0 4.6 423.5 o.o !

216
H PLC method development & chemometric analysis o f ecstasy & cocaine
Table Al (contd.)
Sample # Logo Colour Weight(mg)
Thickness(mm)
Diameter(mm) MDMA MDEA Amp Caffeine Lactose Sorbitol
Î 50.1 Mitsubishi White 295.8 4.0 11.5 268.7 0.0 0.0 0.0 528.7 0.0 i
1 50.2 Mitsubishi White 296.8 4.0 11.5 265.3 0.0 0.0 0.0 • 567.0 0.0 1 1
; . Mitsubishi White 287.8 4.0 11.5 235.8 ■ 0.0 0.0 0.0 574.7 0.0 i
51.1 Smiley White m.4 4.5 8.5 455.9 0.0 0.0 0.0 418.3 0.0
51.2 Smiley White 196.8 4.5 8.5 410.2 0.0 0.0 0.0 436.4 0.0
51.3 Smiley White 200.7 4.5 8.5 529.9 0.0 0.0 0.0 415.5 0.0
1 52.1 Coca-Cola White <BS) 199 0 3.0 10.0 385.4 0.0 0.0 11.4 ~503.5 0.0 J
j 52.2 Coca-Cola White,(BS) 196.6 3.0 10.0 439.5 0.0 0.0 18.9 490.8 0.0 1
[ 52.3 Coca-Cola White (BS) 203.0 3.0 10.0 321.6 0.0 0.0 13.2 491.1 0.0 1
53.1 Crown White 253.6 5.0 10.0 29.1 36.2 0.0 3.5 421.1 0.0
53.2 Crown White 256.7 5.0 10.0 27.9 42.1 0.0 2.5 434.7 0.0
53.3 Crown White 253.8 5.0 10.0 22.3 38.1 0.0 3.0 437.3 0.0
Í 54.1 Heart White (BS) 279.2 6.0 10.0 306.3 0.0 0.0 0.0 " 469.2 0.0 1
1 54.2 Heart White (BS) 273.5 6.0 10.0 289.2 0.0 0.0 0.0 410.0 o.o !
1 54.3 Heart White (BS) 289.9 6.0 10.0 362.2 0.0 0.0 0.0 468.7 0.0__ 1
55.1 Heart Pink 269.2 5.5 10.0 209.9 0.0 0.0 0.0 324.2 268.2
55.2 Heart Pink 278.7 5.5 . 10.0 301.5 0.0 0.0 0.0 385.3 257.9
55.3 Heart Pink 282.8 5.5 10.0 245.3 0.0 0.0 0.0 327.4 305.1
56.1 Horse White (BS) 251.0 4.0 10.0 261.4 0.0 0.0 0.0 454.5 0.0 156.2 Horse White (BS) 249.8 4.0 10.0 278.4 0.0 0.0 0.0 430.3 0.0 156.3 Horse White (BS) 253.1 4.0 10.0 235.8 0.0 0.0 0.0 459.1 0.0 !

217
HPLC method development & chcmometric analysis o f ecstasy & cocaine
Table A1 (contd.)
Sample # Logo Colour Weight(mg)
Thickness(mm)
Diameter(mm) MDMA MDEA Amp Ca frei ne Lactose Sorbitol
; 57.1 Horse White 248.3 4.5 10.5 383.7 0.0 0.0 0.0 430.1 0.0 Í
! 57.2 Horse White 242.6 4.5 10.5 170.9 0.0 0.0 0.0 534.6 0.0 '
57.3 Horse White 245.2 4.5 10.5 407.2 0.0 0.0 0.0 444.5 0.0
58.1 Euro White (BS) 290.9 3.5 12.0 216.6 0.0 0.0 0.0 0.0 0.0
58.2 Euro White (BS) 294.1 3.5 12.0 158.6 0.0 0.0 0.0 0.0 0.0
58.3 Euro White (BS) 286.1 3.5 12.0 244.7 0.0 0.0 0.0 0.0 0.0
j 59.1 Mitsubishi White 296.0 3.0 9:0 304.1 0.0 0.0 0.0 568.5 0.0 <i’ 59.2 Mitsubishi White 304.0 3:0 9.0 246.1 0.0 0.0 0.0 577.6
Oo
¡ 59.3 Mitsubishi White 277.9 3.0 9.0 205.9 0.0 0.0 0.0 517.0 o.o !60.1 Heart White (BS) 294.1 5.5 8.0 255.4 0.0 0.0 0.0 0.0 351.1
60.2 Heart While (BS) 257.8 5.5 8.0 265.9 0.0 0.0 0.0 0.0 372.1
60.3 Heart White (BS) 257.1 !i 8.0 252.1 0.0 0.0 0.0 0.0 515.7
¡ 611 Heart While (BS) 294.9 5.5 8.0 344.4 0.0 0.0 0.0 0.0 287.9 j
! 6 , , Heart White (BS) 273.9 5.5 8.0 291.0 0.0 0.0 0.0 0.0 316.2 j
j 61.3 Heart White (BS) 295.7 5.5 8.0 341.5 0.0 0.0 0.0 0.0 391.6 1
Mean - - 260.39 3.98 10.4 280.42 18.28 22.73 7.01 525.49 495.72
Min - - 183 2.5 8.0 21.8 1.1 14.2 0.5 171.2 257.9
Max - - 370.6 6 12.0 529.9 58.7 38.5 18.9 762.8 916.0
SD - - 47.40 0.74 0.98 89.54 17.87 9.29 4.29 141.44 217.59
% Occur. - - - - - 98.36 13.11 3.28 22.95 85.24 8.19White (BS) = white with brown speckles

HPIX m ethod development & chemometric nnnlvsis o f ccstas) & cocaine
Appendix: Table A2. Metal data for the 183 ecstasy samples used in this study.
Sample #Metal concentration (Mg/g)
Al Zn Fe Mg Ca Cr Pb Na K
1.1 17.739 5.757 23.313 0.209 43.350 0.000 0.000 0.080 0.055
1.2 22.120 8 875 24.094 0.803 78.339 0.000 0.000 0.019 0.032
1.3 24.175 6.611 18.474 0.329 54.640 0.000 0.000 0.054 0.044
2.1 44 141 40.672 79.253 2.957 189.602 0.000 0.000 0.131 0.113
2.2 47.524 45.939 89.699 1.563 198.492 0.000 0.000 0.118 0.156
2.3 41.713 26.653 81.044 4.080 211.196 0.000 0.000 0.125 0 125
3.1 70.508 3.060 36.377 1.497 353.774 0.446 0.000 0.000 0.091
3.2 58.984 2.229 27.119 1.170 397.924 0.330 0.000 0.000 0.086
3.3 74.896 1.694 37.159 1.203 409.574 0.803 0.000 0.000 0.056
4.1 185.045 12.304 25.000 1.092 287.169 0.000 0.000 0.113 0.160
4.2 204.036 18.213 29.848 1.199 354.354 0.000 0.000 0.182 0.128
4.3 174.969 21.559 40.295 1.281 293.900 0.000 0.000 0.127 0.194
5.1 14.963 18.019 67.943 0.533 214.765 0.000 0.000 0.131 0.135
5.2 12.421 24.649 60.663 0.492 189.785 0.000 0.000 0.118 0.109
5.3 13.129 32.474 64.203 0.858 143.235 0.000 0.000 0.125 0.128
6.1 25.708 2.455 55.328 0669 252.174 0.000 1.241 0.127 0.206
6.2 43.350 2.803 62.763 0.463 287.169 0.000 1.083 0 092 0.176
6.3 25.140 2.739 61.163 0.395 330.827 0.000 0.430 0.046 0.190
7.1 47.814 1.186 6.901 1.322 79.253 0.000 0.000 0.099 0.197
7.2 43.587 1.110 10.763 1.241 89.699 0.000 0.000 0.129 0.183
7.3 28.659 1.170 4.576 1.204 63.409 0.000 0.000 0.118 0.229
8.1 78.339 16.960 30.208 1.694 174.969 0.621 0.000 0.140 0.220
8.2 54.260 18.694 28.022 1.556 245.739 0.571 0.000 0.155 0.206
8.3 54.640 15.159 48.593 1.766 185.045 1.886 0.000 0.242 0.176
9.1 29.236 9.736 4.435 0.755 89.699 0.000 0.000 0.040 0.148
9.2 30.349 8.289 7.196 0.803 70.508 0.000 0.000 0.078 0.162
9.3 20.833 8.333 6.894 0.501 56.398 0.000 0.000 0.098 0.142
10.1 2.572 4.580 5.068 0.162 121.615 0.000 0.000 0.073 0.127
10.2 4 065 4.435 4.576 0.250 109.307 0.000 0.000 0.096 0.142
10.3 2079 3.740 2.337 0.305 150.187 0.000 0.000 0.114 0.150
11.1 39.441 16.527 22.241 0.190 98.908 0.572 0.000 1.700 0.164
11.2 62.948 23.318 28.571 0.140 105.981 0.195 0.000 1.556 0.107
11.3 40.295 25.140 41.763 0.155 140.533 0.670 0.000 1.856 0.187
2 1 8

HPLC method development & chemometric analysis o f ecstasy & cocaine
T ab le A2 (contcL)
S am p le # A1 Zn F e M g C a C r P b Na K
12.1 13.875 40.672 61.399 0.319 170.257 0.000 0.000 0.236 0.114
\ 12.2 16.041 45.939 58.273 0.233 220.414 . 0.000 0.000 0.180 0.160 •
12.3 17.601 26.653 71.674 0.252 234.198 0.000 0.000 0.223 0.194 :
13.1 44.141 9.974 121.615 1.224 122.715 0.276 9.571 0.169 0.156
13.2 79.253 6.057 402.062 2.139 153.191 0.756 6.955 0.232 0.156
13.3 47.524 8.939 49.764 1.262 141.161 0.211 3.641 0.189 0.142
j 14.1 71.009 78.756 18.662 1.948 24.739 0.000 0.433 3.052 0.141 ;
| 14.2 74.074 92.063 30.952 1.958 21.264 0.000 0.177 3.188 0.146
14.3 89.699 80.324 28.935 1.933 24.063 0.000 0.615 3.067 0.116
15.1 41.713 7.196 30.387 1.478 205.374 0.000 0.271 0.207 0.180
15.2 30.208 6.273 18.750 0.891 142.066 0.000 0.242 0.220 0.162
15.3 67.720 7.239 83.791 1,566 216.319 0.000 0.356 0.234 0.165
j 16.1i 28.022 7.706 19.918 1,277 165.775 0.000 0.000 0.137 0.110 ,
! 16.2J 81.044 7.940 24.863 1.250 157.439 0.000 0.000 0.206 0.124 ’
[ 16.3 55.288 8.113 19.231 1.262 155.556 0.000 0.000 0.240 0.096 1_ j17.1 48.593 6.894 109.307 0.974 141.287 0.064 0.864 0.173 0.162
17.2 36.099 6.207 45.905 1.034 166.667 0.067 0.648 0.280 0.162
17.3 74.500 12.150 52.833 1.083 89.163 0.130 0.755 0.383 0.250
[ 18.1 70.508 12.168 26.367 0.898 73.836 1.242 0.000 0.176 0.215 |
i 18.2i 32.309 5.932 71.186 1.081 182.143 1.471 0.000 0.148 0.127 j
j 18.3 56.398 9.348 33.175 1.090 116.603 3.506 0.000 0.190 0.142 j
19.1 58.984 10.176 30.078 0.430 42.226 0.000 0.000 0.098 0.215
19.2 22.120 6.901 4.804 0.438 63.439 0.000 0.000 0.035 0.150
19.3 74.896 6.100 16.701 0.456 74.830 0.000 0.000 0.093 0.124
| 20.1 245.739 15,341 57.528 1.932 125.926 0.000 0.000 0.057 0.142 !
j 20.2 237.854 5.051 62.652 1.447 286.573 0.000 0.000 0.051 0.132 1ij 20.3 310.976 9.736 64.837 2.622 269.311 0.000 0.000 0.142 0.305 j
21.1 72.932 8.289 30.827 0.432 52.154 0.000 0.000 0.094 0.150
21.2 47.842 12.788 40.647 0.432 33.755 0.000 0.000 0.108 0.126
21.3 185.045 15.893 62.277 0.491 30.899 0.000 0.000 0.156 0.201
22.1 36.094 12.031 43.906 1.844 153.247 0.000 0.306 1.688 0.141 j
22,2 > 63.667 8.333 49,167 1.017 122.000 0.000 0.000 2.467 0.133 i
22.3 ' 51.796 9.296 . 36.377 2.201 . 236.715 0.000 0.000 2.335 0.135 |
219
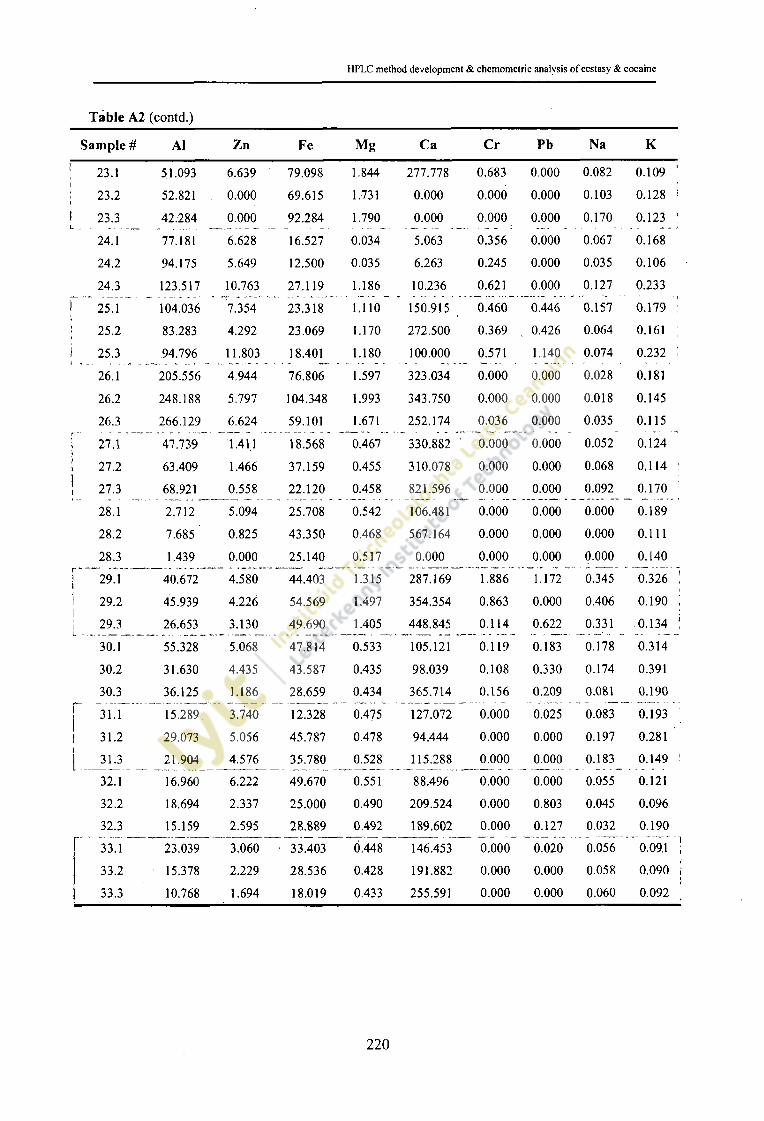
HPLC method development & chemometric analysis of ecstasy & cocaine
T ab le A2 (contd.)
S am p le # A1 Z n Fe M g C a C r P b N a K
23.1 51.093 6.639 79.098 1.844 277.778 0.683 0.000 0.082 0.109 '
23.2 52.821 . 0.000 69.615 1,731 0.000 0.000 0.000 0.103 0.128 !
23.3L . - - - . * _______
42.284 0.000 92.284 1.790 0.000 0.000 0.000 0.170 0.123 !
24.1 77.181 6.628 16.527 0.034 5.063 0.356 0.000 0.067 0.168
24.2 94.175 5.649 12.500 0.035 6.263 0.245 0.000 0.035 0.106
24.3 123.517 10.763 27.119 1.186 10.236 0.621 0.000 0.127 0.233
' 25.1 104.036 7.354 23.318 1.110 150.915 0.460 0.446 0.157 0.179 :
! 25.2 83.283 4.292 23.069 1.170 272.500 0.369 0.426 0.064 o .i6 i :
| 25-3 94.796 11.803 18.401 1.180 100.000 0.571 1.140 0.074 0.232 :
26.1 205.556 4,944 76.806 1.597 323.034 0.000 0.000 0.028 0.181
26.2 248.188 5.797 104.348 1.993 343.750 0.000 0.000 0.018 0.145
26.3 266.129 6.624 59.101 1.671 252.174 0,036 0.000 0.035 0.115
i 27.1 47.739 1411 18.568 0.467 330.882 ‘ 0.000 0.000 0.052 0.124
j 27.2 63.409 1.466 37.159 0.455 310.078 0.000 0.000 0.068 0.114 1
! 27.3 68.921 0.558 22.120 0.458 821,596 0.000 0.000 0.092 0.170
28.1 2.712 5.094 25.708 0.542 106.481 0.000 0.000 0.000 0.189
28.2 7.685 ' 0.825 43.350 0.468 567.164 0.000 0.000 0.000 0.111
28.3 1.439 0.000 25.140 0.517 0.000 0.000 0.000 0.000 0.140
| 29.1 40.672 4.580 44.403 1.315 287.169 1.886 1.172 0.345 0.326 !
1 29.21 45.939 4.226 54.569 1.497 354.354 0.863 0.000 0.406 0.190 ;
L 29-3 26.653 3.130 49.690 1.405 448.845 0.114 0.622 0.331 0.134 :
30.1 55.328 5.068 47.814 0.533 105.121 0.119 0.183 0.178 0.314
30.2 31.630 4.435 43.587 0.435 98.039 0.108 0.330 0.174 0.391
30.3 36.125 1.186 28.659 0.434 365.714 0.156 0.209 0.081 0.190
31.1 15.289 3.740 12.328 0.475 127.072 0.000 0.025 0.083 0.193
31.2 29.073 5.056 45.787 0.478 94.444 0.000 0.000 0.197 0.281
31.3 21.904 4.576 35.780 0.528 115.288 0.000 0.000 0.183 0.149 1
32.1 16.960 6.222 49.670 0.551 88.496 0.000 0.000 0.055 0.121
32.2 18.694 2.337 25.000 0.490 209.524 0.000 0.803 0.045 0.096
32.3 15.159 2.595 28.889 0.492 189.602 0.000 0.127 0.032 0.190
33.1 23.039 3.060 33.403 0.448 146.453 0.000 0.020 0.056 0.091 ~j
33.2 15.378 2.229 28.536 0.428 191.882 0.000 0.000 0.058 0.090 [j33.3 10.768 1.694 18.019 0.433 255.591 0.000 0.000 0.060 0.092 ;
2 2 0

HPLC method development & chemometric analysis o f ecstasy & cocaine
T ab le A2 (contd.)
S am ple # A1 Z n Fe M g C a C r P b N a K
34.1 14.912 3.000 24.649 0.439 146.199 0.000 0.000 0.044 0.132
34.2 14.820 2.249 32.474 0.432 191.977 0.000 0.000 0.039 0.097 ;
34.3 10.575 1.920 22.241 0.483 251.497 0.000 0.000 0.040 0.103 j
35.1 12.234 3.537 32.979 1.170 330.827 0.000 0.000 0.594 0.080
35.2 16.823 4.164 28.571 1.203 288.939 0.000 0.000 0.536 0.019
35.3 17.176 3.975 24.910 1.196 300.905 0.000 0.000 0.755 0.054
! 36.1 29.789 5.757 48.659 1.140 198.003 0.000 0.000 0.546 0.000 f
36.2 22.448 8.875 41.763 0.969 109.150 0.000 0.329 0.122 0.116 ;
| 36.3 30.095 6.611 67.417 1.173 177.419 0.000 0.000 0.166 0.320 ;
37.1 62.763 4.287 66.517 0.511 119.089 0.000 0.041 0.113 0.143
37.2 53.416 2.605 45.419 0.517 198.492 0.000 0.000 0.111 0.131
37.3 43.115 15.082 151.639 0.533 35.326 0.000 0.501 0.156 0.131
[ 38.1 12.304 2.572 38.613 0.543 211.196 0.000 0.000 0.098 0.1 18 ;
! 38.2 18.213 4.065 29.848 0.533 131.175 0.000 0.000 0.125 0.125
| 38.3 21.559 2.079 30.829 0.527 253.378 0.000 0.000 0.091 0.316 ■
39.1 32.463 3.750 150.187 0.858 228.856 0.000 0.000 0.121 0.140
39.2 46.455 3.945 165.455 0.900 228.111 0.000 0.573 0.136 0.155
39.3 59.662 5.145 99.034 1.486 288.732 0.000 0.000 0.229 0.242
40.1 25.278 5.889 65.972 2.139 363.208 0.000 0.000 0.125 0.319 !
40.2 15.855 1.556 80.517 0.885 568.690 0.000 0.000 0.055 0.065 !
40.3 30.037 4.304 140.110 1.511 351.064 0.000 0.819 0.046 0.128 !
41.1 29.656 6.457 63.462 0.030 4.702 0.000 4.816 0.192 0.121
41.2 25.268 3.795 64.375 0.036 9.412 0.000 2.069 0.161 0.732
41.3 29.911 16.815 81.845 0.060 3.540 0.000 2.999 0.327 0.134
4 ? : r 24.007 6.570 78.339 1.155 175.. 824 0.000 0.000 0.099 0.063 |
42.2 23.071 7.974 54.260 1.166 146.169 0.000 0.000 0.129 0.105 Ij42.3 20.914 5.042 54.640 0.963 190;934 0.000 0.000 0.118 0.111 i
43.1 19.788 6.384 16.694 1.148 179.847 0.000 1.202 0.114 0.122
43.2 31.579 9.487 102.895 1.908 201.110 0.000 3.087 0.197 0.184
43.3 18.536 4.914 45.249 1.114 226.624 0.000 1.332 0.086 0.164
44.1 8.761 1.766 49.217 0.506 286.290 0.000 0.000 0.028 0.107 |
• 44.2 6.460 1.510 55.769 0.534 353.774 0.000 0.224 0.036 0.064 !
44.3 7.078 1.813 29.063 0.555 306.034 0.000 0.000 0.031 0.188 )
2 2 1

HPLC method development & chemometric analysis of ecstasy & cocaine
T ab le A2 (contd.)
S am ple # Al Zn Fe M g C a C r P b N a K
45.1 13.846 1.853 98.718 0.737 397.924 0.000 0.000 0.032 0.077 !
45.2 10.505 2.093 131.107 1.050 501.946 0.000 0.000 0.024 0.187
45.3 9.595 2.482 98.908 1.092 439.716 0.000 0.000 0.044 . 0.220 :
46.1 14.963 2.835 105.981 1.199 422.951 0.000 0.807 0,056 0.260
46.2 12.421 1.714 140.533 1.281 747.706 0.000 0.000 0.063 0.181
46.3 13.129 3.255 58.273 1,322 406.077 0.000 0.000 0.081 0.189
| 47.1 8.798 3.176 71.674 0.494 155.405 0.000 0.000 0.236 0.376
47.2 7:765 1.259 49.811 0.464 368.421 0.000 0.000 0,180 0.862 !
47.31 6.781 3.724 65.411 0.916 245.977 0.000 0.000 0.223 0.214 ;
48.1 18.426 3.307 36.853 1.285 388.554 0.000 0.000 0.966 0.319
48.2 10.310 2,298 48.450 0.964 419.355 0.000 0.000 0.276 0.263
48.3 12.135 3.659 93.978 1.241 339.152 0.000 0.000 0.447 0.319
j 49.1 8.488 1.728 49.614 1.204 696.429 0.000 0.772 0.448 0.370 ;
! 49.2i 5.870 1.883 68.927 1.083 575.269 0.000 0.000 0.294 0.233 ;
!_ 493 27.606 0.344 56.270 0.977 2836.879 0.000 0.000 0.326 0.252
50.1 63.012 0.730 85.041 0.430 589.888 0.000 0.000 0.000 0.143
50.2 29.288 0.836 53,779 0.480 573.913 0.000 0.000 0.000 0.073
50.3 12.410 0.000 209.532 0.432 0.000 0.000 0.000 0.000 0.099
j 51.1 19.206 2.017 68.348 0.826 409.574 0.000 0.000 0.086 0.204 ;I* 51.2 13.011 1.465 39.441 0.572 390.698 0.000 0.000 0.061 0.102 i
L 5 U ...... 25.326 6.270 62.948 0.806 128.571 0.000 0.000 0.090 0.138 j
52.1 40.823 2.215 40.295 1.350 609.524 0.000 0,000 0.232 0.570
52.2 30.825 2.597 98.908 1.468 565.421 0.000 0.000 0.303 0.279
52.3 41.627 2.225 105.981 1.220 548.387 0.000 0.000 0.311 0.251
f 53.1 37.796 2.959 140.533 1.324 447.500 0.000 0.000 1.324 0.111 ;
| 53.2 45.741 5.009 56.759 1.472 293.900 0.000 0.000 1.370 0.093 ;
[ 53.3 4.437 4.340 22.565 1.028 236.908 0.000 0.000 1.315 0.070 [
54.1 5.125 0.569 13.875 0.400 702.525 0.000 0.000 0.000 0.056
54.2 4.794 1.241 16.041 0.333 268.293 0,000 0.000 0.000 0.073
54.3 13.407 2.263 51.814 0.670 296.167 0.000 0.000 0.000 0.103
55.1 29.639. 1.045 94.459 0.799 764.488 0.000 0.000 0,876 0.155 !
55.2 12.885 0.959 19-1.176 0.973 1014.599 0.000 0.000 1.085 0.112 ;
55.3 16.507 . 3.050 67.943 0.766 250.980 0.000 0.000 2.022 0.203 |
2 2 2

HPLC method development & chemometric analysis of ecstasy & cocaine
T a b le A2 (contd.)
S am p le # A1 Zn F e M g C a C r P b N a K
56.1 12.896 1.960 60.663 0.706 360.294 0 . 0 0 0 0 . 0 0 0 0.029 0.115
56.2 13.841 4.609 64.203 0.725 '157.233 0 . 0 0 0 0 . 0 0 0 0.043 0.109 ;
56.3 15.644 t 1.700 38.531 0.669 393.491 0 . 0 0 0 0 . 0 0 0 0.040 0.096 ,
57.1 23.313 3.036 19.578 0.536 176.587 0 . 0 0 0 0 . 0 0 0 0.078 0.114
57.2 15.564 1.556 21.201 0.551 354.331 0 . 0 0 0 0 . 0 0 0 0.098 0.092
57.3 24.110 1.856 39.110 0.598 322.314 0.000 0 . 0 0 0 0.107 0.123
! 58.1| 14.236 2.813 29.236 1.229 437.037 0 . 0 0 0 0 . 0 0 0 0.160 0.479 j
| 58.2 61.163 4.419 30.349 1.698 384.211 0 . 0 0 0 0 . 0 0 0 0.198 0.558
| 58.3 12.639 3.028 20.833 1.257 415.138 0.000 0 . 0 0 0 0.125 0.486 .j59.1 24.094 1.775 9.894 0.491 276.596 0.000 0 . 0 0 0 0.128 0.113
59.2 39.806 4.005 18.689 0.534 133.333 0 . 0 0 0 0 . 0 0 0 0.194 0.182
59.3 21.866 2.455 8.507 0.463 188.450 0 . 0 0 0 0 . 0 0 0 0.142 0.127
i 60.1i 18.618 2.803 18.618 0.355 126.761 0.000 0 . 0 0 0 1.158 0.092 ;
! 60.2 18.474 2.739 28.952 0:588 214.765 0 . 0 0 0 0 . 0 0 0 1.994 0.046 ;
[ 60.3 31.818 1.188 30.861 0.395 332.326 0 . 0 0 0 0 . 0 0 0 2.285 0.084
61.1 23.295 0.795 21.429 0,292 367.722 0 . 0 0 0 0 . 0 0 0 1.047 0.057
61.2 33.556 0.691 35.333 0.311 450.161 0.000 0 . 0 0 0 2.167 0.067
61.3 14.603 0.901 9.675 0.325 360,000 0 . 0 0 0 0 . 0 0 0 0.980 0.030
Mean 43.945 8.204 52.013 0.932 262.473 0.636 1.225 0.360 0.168 I
Min 1.439 0.344 2.337 0.030 3.540 0.036 0.020 0.018 0.019 ;
J ' Max 310.976 92.063 402.062 4.080 2836.879 3.506 9.571 3.188 0.862 j
| SD 50.5.31 • 12.609 44.253 0.591 . 258.889 0.714 1.892 0.617 0 . 1 1 0 ijj % Occur. 100 97.8 100 100 98.4 17.5 23 93.4 99.5 |
2 2 3