lyxor newcits irl ii plc
TRANSCRIPT

LYXOR NEWCITS IRL II PLC (An umbrella fund with variable capital and segregated liability between sub-funds)
UNAUDITED INTERIM FINANCIAL STATEMENTS
For the period from 1 January 2021 to 30 June 2021
Registration number: 520397
LYXOR NEWCITS IRL II PLC
1
TABLE OF CONTENTS PAGE
COMPANY INFORMATION 2-3
INVESTMENT MANAGER’S REPORT 4-16
STATEMENT OF FINANCIAL POSITION 17-24
STATEMENT OF COMPREHENSIVE INCOME 25-28
STATEMENT OF CHANGES IN NET ASSETS ATTRIBUTABLE TO HOLDERS OF
REDEEMABLE PARTICIPATING SHARES 29-30
STATEMENT OF CASH FLOWS 31-38
NOTES TO THE FINANCIAL STATEMENTS 39-93
CONDENSED SCHEDULE OF INVESTMENTS 94-123
APPENDIX A: SCHEDULE OF PURCHASES AND SALES OF INVESTMENTS 124-131
APPENDIX B: TOTAL EXPENSE RATIO 132-133
LYXOR NEWCITS IRL II PLC
2
COMPANY INFORMATION
Directors Administrator
Mr. Vincent Dodd* (Irish) SS&C Financial Services (Ireland) Limited
Mr. Bryan Tiernan* (Irish) La Touche House
Mr. Moez Bousarsar (French) Custom House Dock
Mr. Olivier Germain (French) IFSC
Dublin 1
Ireland
*Independent Director
All Directors are non-executive Directors Investment Manager
Lyxor International Asset Management S.A.S.
Registered Office 17, Cours Valmy 70 Sir John Rogerson’s Quay 92800 Puteaux
Dublin 2 France
Ireland
Registrar and Transfer Agent
Manager, Promoter and Global Distributor Société Générale Securities Services, SGSS (Ireland) Limited
Lyxor Asset Management S.A.S. 3rd Floor
17, Cours Valmy IFSC House
92800 Puteaux IFSC
France Dublin 1
Ireland
Depositary
Société Générale S.A. (Head Office) Legal Adviser 29 Boulevard Haussmann Matheson
75009 Paris 70 Sir John Rogerson’s Quay
France Dublin 2
Ireland
Société Générale S.A. (Dublin Branch)
3rd Floor Independent Auditors
IFSC House PricewaterhouseCoopers
IFSC Chartered Accountants and Statutory Audit Firm
Dublin 1 One Spencer Dock
Ireland North Wall Quay
Dublin 1 Company Secretary Ireland
Matsack Trust Limited
70 Sir John Rogerson’s Quay
Dublin 2
Ireland

LYXOR NEWCITS IRL II PLC
3
COMPANY INFORMATION (continued)
The following abbreviated names for the Company’s sub-funds were used in the Statement of Financial Position,
Statement of Comprehensive Income, Statement of Changes in Net Assets Attributable to Holders of Redeemable
Participating Shares, Statement of Cash Flows and on the tables in the Notes to the Financial Statements and other disclosure sections of the financial statements:
Sub-Fund Sub-Investment Manager
Lyxor/WNT Fund Winton Capital Management Limited
Lyxor/Chenavari Credit Fund Chenavari Credit Partners LLP
Kingdon Global Long-Short Equity Fund Kingdon Capital Management, L.L.C.
Lyxor/Wells Capital Financial Credit Fund ECM Asset Management Limited
Lyxor/Academy Quantitative Global UCITS Fund Academy Investment Management LLC
Lyxor/Marathon Emerging Markets Bond Fund Marathon Asset Management, L.P.
Lyxor/Bluescale Global Equity Alpha Fund The Putnam Advisory Company, LLC
Sub-Fund Full Name Abbreviated Name
Lyxor/WNT Fund WNT
Lyxor/Chenavari Credit Fund CHENAVARI
Lyxor Evolution Fixed Income Fund EVOLUTION
Kingdon Global Long-Short Equity Fund KINGDON
Lyxor/Wells Capital Financial Credit Fund WELLS
Lyxor/Academy Quantitative Global UCITS Fund ACADEMY
Lyxor/Marathon Emerging Markets Bond Fund MARATHON
Lyxor/Bluescale Global Equity Alpha Fund BLUESCALE
LYXOR NEWCITS IRL II PLC
4
INVESTMENT MANAGER’S REPORT
For the period from 1 January 2021 to 30 June 2021
Lyxor/WNT Fund
The Fund started the year with a negative performance, drove by long positions in fixed income and non-USD
currencies. Losses accrued in fixed income, where long positions in longer-dated US Treasuries were the largest
detractors from returns. In currencies, meanwhile, long euro and Australian dollar positions outpaced profits from a short position in the Japanese yen. Long exposure to stock indices proved more beneficial for performance, with
MSCI Emerging Market and Russell 2000 futures among the largest individual contributors over the month.
Trend-following systems in stocks indices and currencies drove the Fund’s positive performance in February.
Further profits accrued from other systems, notably seasonality, while carry detracted overall, due to negative
performance in fixed income. Market reversals led to losses in the final week of February, yet the Fund still ended
the month in positive territory. Stock indices were the top contributor to performance, as energy and financials
stocks lifted global equities to new all-time highs in the middle of the month. The Fund benefited from its long
positions in the sector, particularly in Japanese indices, which climbed to their highest levels since 1990. Positioning
in currencies also proved favorable, with both trend-following and carry systems generating profits. A short
Japanese yen position and long exposure to the British pound and Australian dollar were among the Fund’s top individual contributors. While other systems, particularly seasonality, generated profits in fixed income, the Fund
lost money in the sector overall due to trend-following and carry systems.
The Fund’s positive return in March was driven by trend-following systems, with profits also accruing from non-
trend systems, most notably currency carry. Stock indices and currencies drove the Fund’s positive performance
over the month. Trend-following systems remain long stock indices, as global equity markets climbed to new record
highs. Profits in currencies, meanwhile, were driven by both carry and trend-following systems, with a short position
in the Japanese yen representing the top contributor. The US dollar, which weakened over much of 2020, continued
to strengthen against most major currencies in March. Elsewhere, performance in fixed income was broadly flat,
with losses from long short-term interest rate positions cancelling out profits from short government bond positions.
Equity markets had another strong month in April, as the S&P500 ended 5.3% higher with growth stocks
outperforming value stocks. U.S. 10-year Treasury yields fell back from their March peak of 1.75% to 1.53%, before
ending the month at 1.63%. Positioning in stock indices and currencies drove the strategy’s gain. Trend-following
systems reduced the stock indices exposure but benefited from an allocation that remained long. Currencies profits
were also driven by trend-following systems with the long position in the Australian dollar and the short position in
Japanese yen representing the top individual contributors. Elsewhere, performance in fixed income was broadly flat,
with losses from short government bond positions cancelling out profits from long short-term interest rate positions.
In May, Trend following on currencies and stock indices accounted for most of the Fund’s gains while multi-asset
carry systems also made a positive contribution. Currencies was the largest performance driver over the month, with
the US dollar trending downwards against most major currencies and profits from both trend-following and carry
systems. Long British pound and Canadian dollar positions were the top contributors to performance in the sector, along with short exposure to the Japanese yen. Equities benefited from the momentum signals but suffered from
proprietary ones. The fixed income book added a minor contribution, thanks to its remaining long front end rates
allocation.
The Fund ended June down. Losses from trend following and proprietary strategies impacted the performance, while
the carry component ended slightly up. Positioning in currencies and fixed income, led to losses, after US
policymakers signaled an increase in interest rates in 2023, one year earlier than previously expected. Long positions
in non-USD currencies and eurodollar futures were the top detractors, with trend-following systems accounting for
most of the negative performance in the two sectors. On the positive side, equity allocation posted a profit thanks to
the North American exposure where markets reached new highs.
The Fund is still holding a larger allocation to trend following strategies since end of last year. Positioning as end of
June was long equity, long fixed income and short U.S. dollar against other currencies.
Winton Capital Management Limited
Lyxor International Asset Management S.A.S.
30 June 2021

LYXOR NEWCITS IRL II PLC
5
INVESTMENT MANAGER’S REPORT (continued)
For the period from 1 January 2021 to 30 June 20211
Lyxor/Chenavari Credit Fund
January
The year started with a positive tone with the prevalent themes in Q4 2020 continuing to develop in January,
namely the tightening of spreads in the ongoing search for yield, compression between low and high beta
credits, decline of volatility in credit and equity and some underperformance of credit vs. equity. Across the
Atlantic, the U.S. economic outlook seemingly improved in January on the back of a Democratic sweep, leading
to expectations of a larger stimulus and a rapid decline in COVID-19 cases and hospitalizations. This led to a
sharp steepening in the Treasury curve with the 10-yr Treasury yield rising by 15bps over the month. However,
the situation in Europe regarding the pandemic was still worrying, with news of more infectious virus strains
and vaccination delays which started to weigh on risk sentiment towards the second half of the month. In
addition, the government crisis in Italy, triggered by the standoff between Prime Minister Conte and the small
coalition party Italia Viva headed by former Prime Minister Renzi, led to a meaningful underperformance of
Italian high beta risk, i.e. mainly AT1s issued by the national champions Intesa and Unicredit. Finally, the fear of a “bubble” in financial markets, fueled by U.S. retail frenzy buying on GameStop stock, led to a sharp
correction in global equities towards the last week of the month, with the S&P 500 and EUROSTOXX 50
retracing their gains to close the month down by 1.1% and 2% respectively. Given the above, credit was not
spared although cash outperformed synthetic indices and performance was much more muted in January vs. the
last two months of 2020. iTraxx Europe (S34) 5Y and iTraxx Senior Financial (S34) 5Y widened 8.8% and
7.2% respectively, while Markit iBoxx EUR AT1 (-0.01%) underperformed Markit iBoxx EUR High Yield
(+0.35%).
Despite the weakness in the credit market, the strategy was about flat for the month. Top performance
contributors include Swiss sensor manufacturer AMS, EDF in France and Burger King. During January, the
Fund took advantage of the market weakness to find attractive entry points for some of its positions and increased its deployment of capital to close to its capital allocation. For example, the Fund participated in the
primary issue of AA, leader in road breakdown assistance, who issued at 6.5% coupon. Its bonds went up to 102
quickly after the issue. The Fund also increased its exposure to National Express’ perpetual bonds at 4.25%.
Given Europe is much more behind than the U.K. in terms of the roll out of vaccines, we believe COVID-
resilient companies in the U.K. still offer attractive yields with lower volatility. In terms of performance drag,
the Fund’s long in Adler Group, Abertis Perp and DIY retailer Maxeda were the laggards. We will continue to
position the Fund to focus on four key themes: (1) businesses with low cyclicality and that are high cash flow
generative, (2) COVID-19 turnarounds/balance sheet repair story, (3) cyclical recovery, and (4) levered
companies with high cashflow generation.
Overall, the Financials strategy posted a small loss in January, mainly driven by the underperformance of
Deutsche Bank and Intesa AT1 bonds. These mark-to-market losses were offset by profits made on hedges in credit indices, primarily on iTraxx Crossover (S24) 5Y, and from short positions on low coupons/longer call $
AT1s, which traded softer during the month due to rising rates. The Fund’s exposure on legacy Tier 1s (HSBC,
Natwest) and BNP discounted bonds continued to act as a stabilizer of the strategy's volatility with bonds in
general slightly up. BNP's intention to call its USD600 million 6.5% fixed-for-life legacy Tier 1 also acted as a
reminder of the positive technical surrounding legacy perpetual debts.
Importantly, it must be again highlighted the EBA guidance on legacy instruments published in October 2020,
which urges banks to clean up their legacy instruments via tender or outright calls, is a strong tailwind for
valuations.
February
Markets started the month on a strong footing, the brief sell-off experienced in the last few days of January was
short lived and prices quickly recovered in February, peaking around mid-month. Since then, the positive tone
was somehow derailed by the rapid increase in rates seen globally as market participants focused on the reflation
theme, on the back of a rapidly improving COVID-19 situation in the U.S. and prospects of another stimulus
package being approved in the U.S. (around USD1.9 trillion to be spent mostly in 2021). 10-yr U.S. treasuries
yield soared to 1.4% (+34bps) while 10-yr German Bunds yield gained 26bps to -0.3%. Bank equities were the
big winners with the EURO STOXX Banks Index posting a 19% monthly gain, while the Markit iBoxx EUR
AT1 Index gave up all of its gains to finish only +0.5% up, losing almost 2% from its peak.

LYXOR NEWCITS IRL II PLC
6
INVESTMENT MANAGER’S REPORT (continued)
For the period from 1 January 2021 to 30 June 20211
Lyxor/Chenavari Credit Fund (continued)
February (continued)
Although the ECB has shown discomfort with the repricing of the European yield curve, it has yet to show
concrete measures to contain the recent move. In the U.S., the reaction was the opposite with many Federal
Reserve board members including Chairman Powell saying that the rate increase merely reflects the improved
outlook for the economic activity and therefore didn’t warrant action to control the move at this stage. In
European credit, indices ended the month relatively flat when taking the larger intra-month moves into account, nonetheless the European Investment Grade Index (iTraxx Europe (S34) 5Y), the European Senior Financials
Index (iTraxx Senior Financials (S34) 5Y), and the European High Yield Index (iTraxx Crossover (S34) 5Y)
tightened -2%, -1.2%, and -1.6%, respectively for the month.
Despite the market volatility, the strategy posted +0.56% return as we continue to focus on alpha creation. Since
early January, the strategy is running fully hedged for interest rates sensitivity and more recently, the sub-
investment manager has decided to reduce the exposure to long duration bonds and increase shorts on Coporate
Hybrid securities that can be vulnerable to further increase in interest rates. We believe that the High Yield
cyclical theme is still in vogue in Europe and should continue to perform well as the European economies
accelerate while long duration, tight BB rated bonds are the most vulnerable to the current volatility. Amongst
the top alpha names are Asda (a business with low cyclicality and high cash flow generation), PureGym and National Express (turnaround story and balance sheet repair). Performance was partially offset by Wintershall
and the Fund’s short exposure on ZF Friedrichshafen, a German auto supplier. With the UK leading the rate of
vaccination and its economy opening up earlier than Europe, we continue to favor UK risk with names like
Stonegate and PureGym expected to benefit. It should be noted that steepening of the yield curve is also a sign
of improving economic activity which is positive for the credit asset class as EBITDA will grow and leverage
for corporates should come down. Nonetheless, the pace of rate rise will be a source of market volatility and we
have been very focused on monitoring the Fund’s sensitivity to rates, reduced the Fund’s exposure to the hybrid
market and bought some downside protection.
In the Financials market, the month started on a strong foot with the outperformance of Italian banks as Mario
Draghi's mandate in Italy was greeted with enthusiasm. Low resets in € AT1s issued by Intesa and UniCredit
(e.g ISPIM 3.75% c 25 and UCGIM 3.875% c 27) rose by circa 5 points over the first half of the month (vs. +1.6 points at the ICE BofA CoCo index level) and this strong momentum was further spurred by solid Q4
results released by the two Italian champions. Indeed, Intesa posted an eye-popping fall in its NPE from 7% to
4.4%, thanks mainly to the deployment of UBI acquisition badwill while software and RWA management
boosted the MDA buffer close to 700bps (similar to UniCredit). It is important to note that bank earnings have
generally surprised to the upside, capitalization has strengthened and most of the banks remained profitable in
FY-2020. Aside from the macro background, it is worth noting that technical factors for capital instruments
remained supportive with less than €5bn of capital instruments (AT1/T2) issued during the month. Also, in the
legacy space, Bank Austria called at par two old CMS which was not fully expected at this moment of the year
given that the bonds were trading at 95%. This had another positive read-across for other legacy bonds sharing
similar features. Overall, the Financials strategy posted a strong performance, thanks to efficient bond picking
which largely outperformed the shorts on USD iBoxx AT1 and iTraxx Crossover indices. Largest contributors were the Fund’s overweight positions on Italian banks, such as Intesa and UniCredit AT1s, but also Banco BPM
3.25% 2031-26 Tier 2 and DB AT1s +3 points). The sub-investment manager made a decision at the beginning
of the month to tactically over-hedge the dollar rate exposure which was a clear source of alpha during the
month.
March
March finished on a fairly constructive tone despite the volatility coming from U.S. treasuries. The yield on 10-
yr U.S. treasuries continued to climb to 1.74% (i.e. +34bps), driven by the optimism on the U.S. growth outlook
and President Biden’s fiscal plan. The steepening of the U.S. yield curve created a lot of volatility in the U.S.
equity markets. Despite this, U.S. equities managed to end the month higher with the S&P 500 closing up 4.2%
and the Nasdaq-100 closing up 1.4%. Europe was the big winner as investors sought refuge on this side of the Atlantic, pushing the EURO STOXX 50 Index up by 7.8%.

LYXOR NEWCITS IRL II PLC
7
INVESTMENT MANAGER’S REPORT (continued)
For the period from 1 January 2021 to 30 June 20211
Lyxor/Chenavari Credit Fund (continued)
March (continued)
We also witnessed another dovish stance reiterated at the ECB monthly meeting, with the announcement that
purchases under the Pandemic Emergency Purchase Programme (PEPP) would be accelerated over the coming
quarter. Credit was also well supported, with iTraxx Crossover (S34) 5Y outperforming, tightening by 16.8% to
221bps and the index roll had a positive impact on the synthetic market. The Markit iBoxx EUR High Yield
Index climbed 0.45%, whilst higher rated names with longer dated maturities felt the pressure as investors avoided interest rate exposure.
The Corporate strategy did well in March, posting a +0.33% return to the Fund. Positive performance was
driven by the Fund’s long position on iTraxx Crossover as we play the index roll technical. Other contributors
include the Fund’s long positions on Cirsa (Spanish casino operator) and Marks & Spencer (UK retailer), the
latter aims at capturing the good momentum on the UK vaccine rollout. The biggest drags on performance were
the Fund’s short positions on Volkswagen’s perpetual bonds and ZFF’s senior debt, as the cyclical tone of the
market continued to drive the prices of these bonds higher. We remain constructive on the European High Yield
market as the COVID-19 vaccine rollout finally accelerates, translating to a very strong H2 2021. As we remain
concerned about the interest rate volatility, since December 2020, we have decided to fully hedge the Fund’s
exposure and avoid ultra long-dated bonds. Indeed, the Fund even has some short exposure on some very tight hybrid securities that could be subject to selling pressure if investors decide to de-risk.
In the Financials market, bank equities continued their march higher with the EURO STOXX Banks Index
closing the month up by 5% after rising 19% in February, despite European rates being in check with the 10-yr
Bunds yield decreasing 3bps to -0.29%. Bank equities were helped by a speech from ECB Supervisory Chair
Andrea Enria at a conference, where he reiterated the ECB’s aim to lift dividend restrictions at the end of Q3
2021 “in the absence of unexpected, materially adverse developments”. Regarding AT1s, the key highlight was
the clear outperformance of the Markit iBoxx EUR CoCo Index (+1.7%) vs. the Markit iBoxx USD CoCo Index
(up only +0.2%), as the latter was negatively impacted by a further 10-yr U.S. treasury sell-off as well as
idiosyncratic stories affecting some of its components. The first story was the collapse of the supply chain
financing company Greensill Capital. This put Credit Suisse in the spotlight when the bank’s asset management
arm announced the winding down of its supply chain finance Funds to protect the interest of its investors. Another story involved Archegos Capital, whose failure to cover margin calls forced several of its prime brokers
including Goldman Sachs, Morgan Stanley, Nomura, UBS and Credit Suisse to liquidate Archegos’ equity
positions at a loss. Notably, Credit Suisse remained particularly affected and a potential loss between $3bn and
$4bn was initially reported in the press. After a widening of 20bps in its senior debt and 5 points down in its
AT1s, S&P and Moody's revised outlook for Credit Suisse to “only” negative helped spreads to stabilise. Other
names such as UBS and Deutsche Bank showed some signs of weakness on suspicion of exposure to Archegos
as well. The Fund had no exposure to Credit Suisse when the debacles of Greensill and Archegos broke out and
it actually took advantage of these events, thanks to its short-risk position on the $ iBoxx CoCo Index, as Credit
Suisse AT1s account for 14% of the basket. In addition, the Fund’s core long-risk AT1 trades on Intesa, Banco
BPM and Sabadell once again outperformed with notably Moody’s revising their outlook on both the Spanish
and Italian banking systems from negative to stable. Overall, the Financials strategy contributed +0.46% return to the Fund.
April
April was another strong month for risky assets, supported by strong economic data and a standstill on monetary
policy both in Europe and the U.S. In the U.S., Federal Reserve Chair Powell adopted a dovish tone highlighting
no imminent intention of withdrawing stimulus despite faster than expected U.S. economic recovery. Powell
also noted that inflation metrics will likely be higher but should be largely “transitory”. These developments
boosted the S&P500 +5.24% higher for the month outperforming the EURO STOXX 50, which trailed with
only a +1.42% gain for April. The U.S. 10-yr treasury was one of the most volatile asset classes, reversing the
upward trend and finishing the month 12bps tighter to yield 1.63%. The retracement of rates was probably the
main factor driving risk appetite higher again in April. Credit indices also reacted positively, although for the first time this year, there was some decompression taking place between iTraxx Crossover (S35) 5Y and iTraxx
Europe (S35) 5Y as the former tightened by only 3.7bps vs. 2.3bps tighter for the latter.

LYXOR NEWCITS IRL II PLC
8
INVESTMENT MANAGER’S REPORT (continued)
For the period from 1 January 2021 to 30 June 20211
Lyxor/Chenavari Credit Fund (continued)
April (continued)
In the European Corporate HY market, the new issue pipeline was very strong with a combination of
refinancing deals, leveraged buyouts and loan-to-bond transactions. Even though new issues are still providing
some premium, the absolute yields are much lower than last year, reflecting the current state of the market. As
valuations have recently tightened, we started to reduce the Fund’s long bias as we wait for better entry points to
add risk again. We have also started to reduce the cyclicality of the portfolio in light of the beta exposure reduction. Having said that, fundamentals remain strong, and we see little catalyst for any meaningful set back
in the asset class. The Corporate strategy performed well in April, posting +0.22% to the Fund. Positive
performance was led by the Fund’s long positions in the Spanish gaming company Cirsa alongside the Spanish
retailer Tendam. We believe these trades should continue to perform well as Europe rebounds. Other
contributors include the German real estate entity Adler Group and UK retailer Next, offset by the Fund’s short
positions in the German retailer Douglas, German auto supplier ZF Friedrichshafen and British chemicals
company Ineos. On the long side, Austrian semi-conductor manufacturer AMS’ bonds dropped as the market
feared AMS would lose its iPhone face recognition contract with Apple. Overall, we remain constructive of the
market but are more focused on alpha contribution and less so on beta.
In the Financials market, April was the Q1 2021 earnings season. Bank results pointed to a solid start for the year and have been so far marked by lower loan loss provisions and generally strong trading revenues across the
Investment Banking Divisions (IB), especially in equities. We believe the cost of risk should further decrease
over 2021 given that European governments are steadily lifting COVID-19 restrictions, while momentum in the
IB from Q1 is expected to slow down in Q2. Key highlights include Nordic banks confirming their safe-haven
status in this pandemic with outstanding asset quality metrics, while Spain’s 4th largest bank, Sabadell (one of
the Fund's key conviction trades) posted good results with net income coming in at €73m with a positive, albeit
small, contribution from its UK subsidiary TSB and steady asset quality, as well as capital position. Credit
Suisse’s Q1 2021 results were obviously scrutinized after the Greensill and Archegos debacles, with the latter
finally translating to a loss of CHF 4.4bn for the first quarter. However, Credit Suisse’s results reassured
investors with an overall loss of “only” CHF 757m due to impressive underlying revenues for the quarter (+31%
year-on-year). Most importantly, the placement of mandatory convertible notes, equivalent to CHF 1.7bn (~55-
60bps of CET1), allowed the bank to post a 12.2% CET1 ratio (vs. a minimum of 12% pre-announced), as well as a CET1 leverage ratio of 3.8% (vs. “at least” 3.7% guided), therefore easing market concerns about the
distant possibility of an AT1 coupon skip. Finally, Deutsche Bank's results were very strong with €1bn net
income, the largest net profit the bank has reported since Q1 2017 with all core divisions’ results beat consensus
estimates. Capital remained solid at 13.7%, leaving an MDA buffer of 330bps. Credit quality was also
impressive, with only 6bps cost of credit during the quarter. The strategy generated a positive contribution of
+1.42% (gross, on the strategy level) vs. +0.9% for the Markit iBoxx EUR AT1 Index. The strategy benefitted
from its overweight position on Deutsche Bank AT1s (+3 points during the month) and Tier 2s, one of the
Fund’s key conviction trades since mid-2020. The other important driver was the outperformance of the long-
risk AT1 positions on peripheral issuers such as Sabadell, Abanca, Banco BPM and Intesa, which largely
outperformed short-risk AT1 exposures on 'core' names such as UBS, Standard Chartered or ING. Importantly,
significant alpha was generated from the legacy trades on BNP and DNB discounted bonds, which gained respectively 7.5 points and 5 points amidst positive developments in the legacy space. We decided to take some
profits on the Fund’s positions after these significant price actions.
May
May was a fairly volatile month marked by the resurgence of the ‘fear of inflation’ theme and its likely
implication on the tapering of monetary policy as well as higher interest rates. In the first trading days that led to
the above-consensus U.S. Consumer Price Index (CPI) report, which showed a +0.8% month-on-month increase
vs. +0.2% expected, equity markets sold-off sharply, with the NASDAQ Composite showing a 6.7% decline at
the lows before paring part of its loses to end the month down 1.5%. In credit, any intra-month fears of a
widening quickly dissipated, with iTraxx Crossover (S35) 5Y tightening by 1.1% and iTraxx Europe (S35) 5Y
closing nearly flat on the month after widening by as much as 12bps and 2.5bps respectively intra-month. Benefitting from inflationary expectations as well as the continuation of the above-consensus Q1 2021 results,
mostly on lower provisions and strong trading/Investment Banking (IB) revenues, banks outperformed the
market. The EURO STOXX Banks advanced by 6.7% vs. only 1.6% for the EURO STOXX 50, while the
Markit iBoxx EUR AT1 Index gained 0.29% vs. 0.23% for the Markit iBoxx EUR High Yield Index,
highlighting a resilient cash market overall.

LYXOR NEWCITS IRL II PLC
9
INVESTMENT MANAGER’S REPORT (continued)
For the period from 1 January 2021 to 30 June 20211
Lyxor/Chenavari Credit Fund (continued)
May (continued)
In the European Corporate High Yield market, the new issue pipeline continued to be very strong, but in our
view, some bond valuations are becoming too stretched. For example, the Fund did not participate in the €350m
5Y senior secured bonds of Marcolin, an Italian glasses frame designer. With its 7x leverage offered at 500+bps,
we do not view this as an attractive risk for the Fund. In the current environment where investors continue to
chase yield, we would prefer to focus on identifying idiosyncratic short candidates e.g., companies whose margin could be squeezed in 2020/2021 due to inflationary raw material costs. In addition, the Fund’s short
positions through liquid indices generated significant alpha for the month. The main contributors to performance
this month include Tullow Oil that took advantage of the rise in oil prices to place $1.8bn in bonds to refinance
their upcoming maturities; Cirsa, the Spanish gaming company that posted strong liquidity and low cash flow
burn despite the difficult trading environment as lockdown is still affecting their business; Alain Afflelou, the
French optician that placed an attractive new issue; and the UK debt collector Lowell, that continues to benefit
from an attractive market to ramp up their non-performing loan (NPL) portfolio. On the negative side, the main
drags of performance were the Fund’s shorts on Douglas, the German cosmetic retailer, and Klöckner
Pentaplast, the package plastic manufacturer. In terms of Fund positioning, as we are cognizant of the potential
reversal of spread compression when monetary policies normalize, combined with currently tight valuations, we
have positioned the Fund to be fairly flat to allow us to re-enter the market at attractive entry points.
The Financials market was busy with idiosyncratic news and new issues this month. In Germany, Moody’s
placed Deutsche Bank (DB) ratings, including the ba1 Baseline Credit Assessment (BCA), on review for
upgrade. This is likely to further support DB’s spreads and we aim to stay long-risk via mainly its AT1s.
Commerzbank also reported a net profit for Q1 2021 of €133m vs. loss expectations, driven by a much better
revenue performance and low impairments. Given that valuations remained cheap across the board with the €
AT1s trading around 4.3% YTC and the callable Tier 2 around MS+200bps, this issuer is attractive. In Italy,
UniCredit surprisingly decided to skip the coupon on its CASHES (Convertible and Subordinated Hybrid
Equity-Linked Securities), triggering a sharp drop in the security price (~-12 points). Whilst the skip had no
implication for AT1 coupon payment, it has provided some interesting entry points with its AT1 and T2
widening by ~30bps in the month. In terms of M&A, Unipol announced its intention to increase its stake in
Banca Popolare di Sondrio from 2.9% to 9.5%, fueling speculation of a potential merger between BPER (in which Unipol is the largest shareholder) and Sondrio, which would imply a higher probability of a merger
between UniCredit and Banco BPM. These developments are positive for the Italian banking sector with more
consolidation expected in H2 2021 and the Fund is well positioned to benefit from this trend. Finally, in Spain,
the much awaited new strategic plan for Sabadell was mostly neutral for credit and its guidance for >12% Fully
Loaded CET1 (MDA >350bps) provided some comfort to investors, especially AT1 holders. In terms of
issuance, the market has seen an uptick in supply with five new AT1 deals which the Fund participated, and we
closed the month between +0.5 and +3points for these investments. However, the top performer was Cajamar
(Spain's sixth largest bank) which issued a €600m 10 NC 5 Tier 2 bond at 5.25%, rated B by S&P, and the
launch of a parallel cash tender on €100m 9% Nov-26 T2 (call Nov-21) and €300m 7.75% Jun-27 (call Jun-22)
at 2 points premium vs. market close. The Fund invested in the 7.75% Tier 2 expecting a tender and therefore
generated an important source of alpha. We think that there remains further upside on Cajamar given that its credit spreads are still trading close to CCC-rated Alpha Bank.
June
June was marked by a further decrease in dollar interest rates in a bull flattening manner with the 10-year
Treasury yield dropping from 1.63% to 1.47% mainly on weaker than expected jobs creation in April and May.
Lower interest rate volatility provided a tailwind for risk assets with an outperformance of U.S. stocks over EUR
stocks (S&P 500 +2.2% vs. EURO STOXX 50 +0.6%). Credit markets also traded in a risk-on mood with
iTraxx Crossover (S35) 5Y spread tightened by 14bps to 232bps and iTraxx Europe (S35) 5Y by 3.18bps to
46.80bps. On the cash side, the Markit iBoxx EUR AT1 index advanced by 1% outperforming the Markit iBoxx
EUR High Yield Index which only increased by 0.53%. We expect the environment to remain globally
supportive for credit markets over the summer as economies are reopening and Central Banks remain accommodative. However, the next U.S. CPI release on July 13th will be key in assessing inflation risks after a
higher than expected May CPI print at 5%. Indeed, inflation worries are likely to contribute to bouts of volatility
in the short term but it appears that it will take a lot of bad news to shift policy makers’ attitude towards a rapid
withdrawal of easy money.

LYXOR NEWCITS IRL II PLC
10
INVESTMENT MANAGER’S REPORT (continued)
For the period from 1 January 2021 to 30 June 20211
Lyxor/Chenavari Credit Fund (continued)
June (continued)
In the European Corporate High Yield market, new issue pipeline remained quite strong and was running twice
the pace of the previous years. Bonds are still well absorbed by the market but failing to perform on the break as
most of the new issue premium is being taken away by the syndicate. The volatility in the asset class remains
remarkably low despite a more two-way market in the Government bonds and Commodity markets. The
volatility of the former is probably being led by a generalised stop loss of trades betting on further increase of the U.S. Treasury yields while that of the latter is probably explained by a combination of China talking down
prices and overcrowded positions. While equities on both sides of the Atlantic performed well this month, the
sector rotation away from value towards growth has been intense, a phenomenon that was not observed in credit.
Even though the Fund’s long portfolio performed quite well, most of its return was consumed by its hedges both
in credit spread and interest rate terms. Our decision to run the portfolio with lower risk and a flatter risk profile
has detracted quite a bit of performance from the strategy. The strategy’s positive return was driven mostly by
the re-opening trades including Tendam, Cirsa Gaming, Tullow Oil and Rolls Royce. On the negative side, both
Boparan and Adler Real Estate face negative headline risk this month. Overall, our view remains the same,
strong tailwinds translating to better fundamentals but with valuations broadly reflecting that. We continue to
explore alpha opportunities both on the long and short side while keeping a low Beta exposure.
European Financials outperfomed in June amidst positive actions from S&P which changed its outlooks on
numerous European banks from negative to stable, largely driven by improving macroeconomic outlook and
moderate impact on the asset quality. The only shadow was the one notch downgrade of Banco Sabadell to
BBB- (with a stable outlook) but price action was limited to the senior non-preferred bonds which fell to HY
and closed the month about 12bps wider. Another positive development came from Andrea Enria, Chair of the
ECB's supervisory board, who voiced intentions to lift distribution restrictions on banks which should reinforce
confidence in the sector. The next important event will be the publication of 2021 EU-wide Stress Test results
on 30 July.
For the Financial strategy, the best performing trade was Unipol 3.25% 2030 Senior Green bond which the Fund
invested since September 2020, not only to play compression (the bond priced at mid-swaps+350bps) compared
to its peers but also with a view to position for a potential upgrade back to investment grade since its issuer’s downgrade by Fitch to BB+ from BBB- in May 2020. On 10 June, Fitch upgraded Unipol group to BBB
(outlook stable) and the senior unsecured bonds back to BBB- and the latter jumped by 6 points on the news or
about 70bps of spread tightening. The Fund decided to take some profit on the exposure but we see further
upside as the bonds are now eligible for the ECB CSSP program given their investment grade status.
The other outperformers were the AT1s holdings on Commerzbank, Unicredit and Sabadell as well as the
position on Cajamar 5.25% 2031-26 Tier 2 bonds issued in May which the Fund decided to increase its
exposure during the month. June proved to be a somewhat busy month for new issuance with around €30bn of
supply accross Senior, Tier 2, AT1 and insurance and the Fund was mainly active in new issues launched by
Natwest (new AT1 in USD) and Macif.
Overall the strategy's gross performance was postive despite credit and interest rate hedges.
Chenavari Credit Partners LLP
Lyxor International Asset Management S.A.S.
30 June 2021

LYXOR NEWCITS IRL II PLC
11
INVESTMENT MANAGER’S REPORT (continued)
For the period from 1 January 2021 to 30 June 20211
Lyxor/Wells Capital Financial Credit Fund
2021 S1 Performance:
The Lyxor Wells Capital Financial Credit Fund returned 0.19% during January 2021.
The Fund’s strategic Bank AT 1 Coco and Subordinated insurance positions produced positive returns during
the month, while Lower Tier 2 positions produced slightly negative returns. During the month, the Fund
Manager slightly increased exposure to Cocos by 3.6% of NAV, and increased hedges anticipating a period of weakness in markets (Senior Financials CDS index 8.6% of NAV, Crossover CDS index 4.7% of NAV).
The Lyxor / Wells Capital Financial Credit Fund returned +0.24% during February 2021.
The Fund’s strategic Bank AT 1 Coco positions produced positive returns during the month, while Lower Tier 2
and subordinated insurance positions produced slightly negative returns. During early February, the Fund
Manager increased exposure to Cocos by 6.7% of NAV as banks are expected to post strong results for 2020.
The fund manager also eliminated hedges (Senior Financials CDS index 8.6% of NAV, Xover CDS index 4.7%
of NAV) in early February, as it was unclear when risk asset would start reacting to higher Treasury yields.
The Lyxor Wells Capital Financial Credit Fund returned 1.1% during March 2021.
The Fund’s strategic Bank AT 1 Coco and subordinated insurance positions produced most of the positive
returns during the month, while other sub sectors also made an incremental contribution to the return.
During March, the Fund Manager reduced exposure to Cocos by 4% of NAV to 69% and LT 2 bonds by 3% to
8% The Fund Manager increased exposure to subordinated insurance bonds by 4% of NAV to 11% and senior
bank bonds by 2% to 2%. The Fund had low exposure to Credit Suisse, at 1.4% of NAV compared to 7% for the
Coco index and that exposure was in one relatively safer low trigger, high coupon, short duration coco.
The Lyxor Wells Capital Financial Credit Fund returned 1.1% during April 2021.
Since the beginning of the year, Euro cocos have outperformed USD cocos according to JP Morgan analytics –
the Fund is significantly overweight Euro cocos and underweight USD cocos. The Fund maintained a very low USD exposure under 0.8 years vs 2.2 years for the coco index, replaced with EUR and GBP risk, including
duration. During the month, the exposure has been reduced, adding to cash, waiting for a small pull back in
sentiment to buy bonds.
The Lyxor / Wells Capital Financial Credit Fund returned 0.3% during May 2021.
The Fund’s strategic Bank AT1 Coco produced most of the positive returns during the month, other sub-sectors
also made a modest incremental contribution to the return, while the XoverCDS index hedge protection
detracted modestly from performance (less than 0.1%). During May, the Fund Manager reduced exposure to
Cocos by 2% of NAV to 65% and increased Lower Tier 2 and senior bank bonds by 4% each. The Fund also
added XoverCDS index hedge protection up to 14% of NAV.
The Lyxor / Wells Capital Financial Credit Fund returned 0.73% during June 2021.
The Fund’s strategic Bank AT1 Coco and subordinated insurance holdings produced most of the positive returns
during the month, while other sub-sectors also made an incremental contribution to the return, while the
XoverCDS index hedge protection detracted modestly from performance (less than 0.1%). The broader market’s
positive returns (Coco index 1%, Euro Stoxx600 index 1.4%) did not offset the impact of falling bond yields
which dented bank equity sentiment (Euro Stoxxbanks index was down 4%). During June, the Fund Manager
reduced exposure to Cocos and senior bonds by 3% of NAV each, and increased Lower Tier 2 by 3% and
subordinated insurance by 2% of NAV.
ECM Asset Management Limited
Lyxor International Asset Management S.A.S.
30 June 2021

LYXOR NEWCITS IRL II PLC
12
INVESTMENT MANAGER’S REPORT (continued)
For the period from 1 January 2021 to 30 June 20211
Lyxor/Marathon Emerging Markets Bond Fund
YTD as of 30/06/2021, Lyxor/ Marathon Emerging Markets Bond Fund is underperforming its index on a net basis,
returning -1.6% (F USD share class) versus -0.7% for the JPM EMBI Global Diversified Index.
Q1 -2021
In the first three months of 2021, Lyxor/Marathon Emerging Markets Bond Fund has returned -5.5%, compared to -
4.5% for the EMBIGD Index. Performance that has contributed positively includes the results of conservative
positioning in liquid, ten-year regions of sovereign curves in Qatar, Turkey, Uruguay and Oman (~+30 bps Alpha
combined), where negative total returns were recorded by those countries within the EMBIGD. Detractors have
predominantly been high quality instruments that were sourced recently in primary markets, enjoying high liquidity
and low bid-ask trading costs and therefore being prime candidates for market participants to express views; such
sovereign-related credits include Israel, Peru, Panama and Morocco (~-60 bps Alpha combined). As a result of
bountiful issuance from index-eligible sovereigns and quasi-sovereigns that have been a part of the strategy since
inception, the PMs trace a growing segment of liquid securities in the portfolio that comprised ~60% of the portfolio as the year began. Such positioning has been advantageous in allowing for nimble positioning that enables efficient
turnover of assets. A preference for on-the-run quality debt has also been key in reducing trading costs, where we
note diligent rotation into new benchmarks.
Q2-2021
Over Q2, both the Fund and the index strongly rebounded, with the Fund slightly outperforming the index – the JPM
EMBI GD Index, returning + 4.2% and +4.1% respectively, reducing its gap versus the index. The balanced
approach to risk taking enabled Alpha generation across all major credit buckets in the following regions: Africa
~+18 bps of Alpha, Middle East ~+10 bps and Latin America ~+4 bps. Best relative contributors came from Israel
(~+17 bps), followed by Mexico (~+9 bps), South Africa and Egypt (~+6 bps each) whilst, worst relative contributors came from China and Uruguay (~-6 bps each) and Qatar (~-4 bps).
Marathon Asset Management, L.P.
Lyxor International Asset Management S.A.S.
30 June 2021

LYXOR NEWCITS IRL II PLC
13
INVESTMENT MANAGER’S REPORT (continued)
For the period from 1 January 2021 to 30 June 20211
Lyxor/Bluescale Global Equity Alpha Fund
The Lyxor Bluescale Global Equity Alpha Fund was down -7.86% (Class I USD) for the first semester of 2021.
The Fund had a difficult month in January, ending down -2.62%. This, despite markets going off with a strong start
in January as global vaccine rollouts took shape and were paired with increased expectations of monetary stimulus
in the US. This strong momentum was interrupted during the last week of the month as a technically driven sell-off
was sparked by a group of retail investors combatively buying-up well-publicized hedge fund short positions. This
led to several hedge funds covering their short positions and selling down longs at the same time. In the context of these aggressive short-squeezes and subsequent rapid de-grossing, Bluescale's small gains from the long book in
January were offset by losses from the portfolio’s short exposure. Long Gaming and short Telecom names resulted
in positive overall attribution from these two sectors, while IT Services and Software were the largest detractors
driven by the shorts and to a lesser extent longs.
The Fund posted a positive performance, up +1.47% in February as equity markets recovered. The S&P 500 gained
2.76% to bring YTD performance back into positive territory at +1.72%. The MSCI World Info Tech Index gained
1.20% and the Nasdaq added another 1.01% in the month. Treasury yields rose in February with the 10-Year closing
at 1.46% (after surging above 1.6%) and the 30-Year ending the month at 2.11%. The spike in rates weighed on
growth stocks in the second half of the month as market participants rotated into value stocks and the Nasdaq gave
back 6.4% from Feb 12th through month-end after gaining 7.8% in the first 12 days of the month. Performance came from the long book while the short book detracted from performance. In a reversal from last month, IT Services and
Software were the largest contributors for February. Gaming and Semiconductors also contributed to performance.
March started off strong due to solid economic reports, positive vaccine news, decreasing Treasury bond yields, the
signing of the $1.9 trillion stimulus package, and the Fed's affirmation of its monetary policy. However, markets
reversed in the latter half of the month and the increase in treasury yields pushed technology and other high-growth
stocks lower. The S&P 500 gained 4.38% to bring YTD performance to 6.18%. The MSCI World Info Tech Index
gained 0.73% and the Nasdaq added just 0.48% in the month, as fears of continued rising rates and the rotation from
growth into value suppressed returns. In this challenging environment, the fund suffered, ending the month down -
6.25%. small losses spread across Bluescale’s long book drove the bulk of the performance. Gains from the
portfolio’s short book during were offset by small losses coupled with idiosyncratic M&A activity. Both long and
short exposure to IT Services and Media sectors led the portfolio’s negative contribution while short Semiconductors and Tech Hardware exposure contributed positively during the period.
The Fund rebounded in April, up +2.44%. The long book drove returns, offsetting a detraction from short exposure
and resulting in positive alpha from both sides of the portfolio. Equity markets were led higher by strong economic
data, continued vaccination progress and resilient corporate earnings, sending certain indices to all-time highs. The
S&P 500 gained 5.3% to bring YTD performance to 11.8%. Despite strong inflationary evidence continuing to
emerge during the month, 10-year yields fell back from March highs, which provided support for growth stocks. The
MSCI World Info Tech Index gained 5.5% and the Nasdaq added 5.4% in the month. From an industry perspective,
all groups contributed to positive performance for the month except for Semiconductors, Telecommunications, and
Real Estate. The majority of detraction from these industry groups was spread across the Semiconductors long book
and Telecommunications short book. The largest contribution to performance came from Media & Entertainment and Software, both driven by long positions.
The Fund had another difficult month in May, ending down -3.24%. The long book was the primary detractor of
returns, while the short book a positive contribution. Equity markets were mixed as strong corporate earnings were
countered by accelerating inflation and mixed economic signals, which hampered investor optimism. The S&P 500
gained just 0.55% in May with 77% of companies that comprise the index having reported positive revenue
surprises (99% of companies reporting). This disconnect between fundamentals and stock price movements was
pronounced in the TMT space despite record prints and forward guidance by companies. The MSCI World Info
Tech Index detracted 1.0% and the Nasdaq dropped 1.5% in the month. The yield curve in the U.S. was mostly
unchanged to slightly lower across the curve in May, as the 10-year Treasury fell by 3 basis points to end the period
yielding just under 1.60%. From an industry perspective, Consumer Durables, Auto and Real Estate were
contributors in May while all others were detractors. Most of the detraction came from the Software & Services long book, followed by Retail, Diversified Financials and Media.
LYXOR NEWCITS IRL II PLC
14
INVESTMENT MANAGER’S REPORT (continued)
For the period from 1 January 2021 to 30 June 20211
Lyxor/Bluescale Global Equity Alpha Fund (continued)
Bluescale’s long book was the primary contributor for June, while the short book provided the majority of detraction
for the month. The S&P 500 gained 2.2% in June, the MSCI World Info Tech Index rose 6.8%, and the Nasdaq
increased 5.5% in the month. Although generally anticipated, government regulation continued to drive headlines
for Chinese TMT companies, however, there are some that believe the largest headwinds are now behind us.
From an industry perspective, Internet, Payments, Software, Hardware, and Telecom were contributors in June,
while Gaming, Media, Semiconductors, and IT Services were detractors. The largest contributors came from the
Internet and Software long book while the largest detractors came from the IT Services and Semiconductors short book.
Kakao, Shopify, Lightspeed, Dynatrace, and Twilio were the top contributing long positions in June. The top
detractors for the month were Evolution AB, and four short positions, two IT Services companies, a semiconductors
company, and an Internet company. For the contributors, June gains were generally a result of strong performance in
the prior quarter, in addition to continued benefits from consumer spending and travel. Recent performance from
certain short positions resulted in the largest detraction for the month, although we continue to believe these
companies are overvalued and face company-specific headwinds.
Geographically, North America drove both the largest contribution and detraction for the month, with the short book
detraction slightly overshadowing the performance of the long book. The Emerging Markets long book substantially outperformed the short book, while Asia Pacific (x-EM) and Europe were relatively flat for the month.
Average exposure during the month of June remained steady with gross of 144% and an average net exposure of
19%. Emerging Markets remained the largest geographic net exposure in the portfolio, followed by North America
and Asia Pacific (ex-EM).
Outlook:
After a challenging first semester facing at the same time macro driven equity moves and reflation trades
particularly damaging for TMT stocks and hurting growth as a factor, as well as a retail frenzy on meme stocks the
manager sticked to its process. Every position was revisited, and the PM team took the opportunity to add and
reinforce its high conviction positions holdings. Especially as we are entering the Q2 earnings season which looks promising
The Putnam Advisory Company, LLC
Lyxor International Asset Management S.A.S.
30 June 2021

LYXOR NEWCITS IRL II PLC
15
INVESTMENT MANAGER’S REPORT (continued)
For the period from 1 January 2021 to 30 June 20211
Securities Financing Transactions Regulation Disclosure
Lyxor Newcits IRL II plc (the “Company”) is subject to the Securities Financing Transactions Regulation (the
“SFTR”) as at 30 June 2021. The SFTR introduces mandatory reporting for securities financing transactions
(“SFTs”) and sets minimum disclosure and consent requirements on the re-use of collateral, with the aim of
reforming shadow banking and improving transparency in the SFT market. The SFTR was formally adopted by the
EU on 25 November 2015 and came into force on 13 January 2017. An SFT consists of any transaction that uses
assets belonging to a counterparty to generate financing means and is comprised of the following:
• repurchase transactions;
• securities or commodities lending, securities or commodities borrowing;
• any transaction having an equivalent economic effect, in particular a buy/sell-back or sell/buy-back
transaction; and
• margin lending transaction.
The SFTR also covers Total Return Swap (“TRS”) transactions.
Article 2 of the SFTR covers the following entities:
• Counterparties to an SFT that are established: - in the EU, including all of its branches irrespective of where they are located (i.e., non-EU branches);
or
- outside the EU if the SFT is concluded in the course of the operations of an EU branch of that
counterparty.
• UCITS funds and their management companies irrespective of where they are established;
• AIFMs authorised or registered in accordance under AIFMD irrespective of where their AIFs are
established; and
• in relation to the Re-use Obligation only, counterparties established outside the EU, in either of the
following circumstances:
- the re-use is effected in the course of the operations of an EU branch; or
- the re-use concerns financial instruments provided as collateral by a counterparty established in the EU or an EU branch of a third country entity (i.e. a non-EU entity re-uses an EU entity’s collateral).
Global data
The following table reflects the amount of SFT, expressed as an absolute amount and as a proportion of total
lendable assets (excluding cash and cash equivalents) of the Sub-Fund, as at 30 June 2021:
Sub-Fund
SFT
Total lendable assets
(excluding cash and
cash equivalents)
USD
Fair value
of SFT
USD
% of Total
lendable
assets
CHENAVARI TRS 300,618,911 579,029 0.19%
The following table reflects the amount of assets engaged in each type of SFT, expressed as an absolute amount and as a percentage of the Sub-Fund’s Net Asset Value (“NAV”), as at 30 June 2020:
Sub-Fund
SFT
NAV
USD
Fair value
of SFT
USD % of NAV
CHENAVARI TRS 157,100,219 339,662 0.22%

LYXOR NEWCITS IRL II PLC
16
INVESTMENT MANAGER’S REPORT (continued)
For the period from 1 January 2021 to 30 June 20211
Securities Financing Transactions Regulation Disclosure (continued)
Data on re-use of collateral and Safekeeping of collateral received by the Sub-Fund as part of the SFT
Information on amount of collateral reused, compared with maximum amount disclosed to investors or specified in
the Prospectus and Supplement, and the cash collateral reinvestment returns to the Sub-Fund.
No collateral was received nor granted by the Sub-Fund in relation to the TRS transactions during the period ended
30 June 2021.
Concentration data
The following table reflects all the counterparties of each type of SFT and the value (volume) of outstanding
transactions as at 30 June 2021 (SFTR requires to disclose the top 10 counterparties):
Sub-Fund
SFT
Name of counterparty
Fair value of SFT
USD
CHENAVARI TRS BNP Paribas 351,885
CHENAVARI TRS
Goldman Sachs
International 227,144
Aggregate transaction data for each type of SFT
The following table reflects the maturity tenor of SFT as at 30 June 2021:
Sub-Fund
SFT
Name of
counterparty
Counterparty
domicile
Fair value of
SFT
Maturity tenor of
the SFT
CHENAVARI TRS
BNP Paribas
London, United
Kingdom 351,885 Above one year
CHENAVARI TRS
Goldman Sachs
International
New York,
United States 227,144 Less than one year
Data on return and cost for each type of SFTs for the period ended 30 June 2021:
Returns and costs incurred from TRS transactions during the period ended 30 June 2021 are included in the
valuation of the swap and in the realised gain/(loss) on swaps included in the Statement of Comprehensive Income.
LYXOR NEWCITS IRL II PLC
See accompanying notes to the financial statements
17
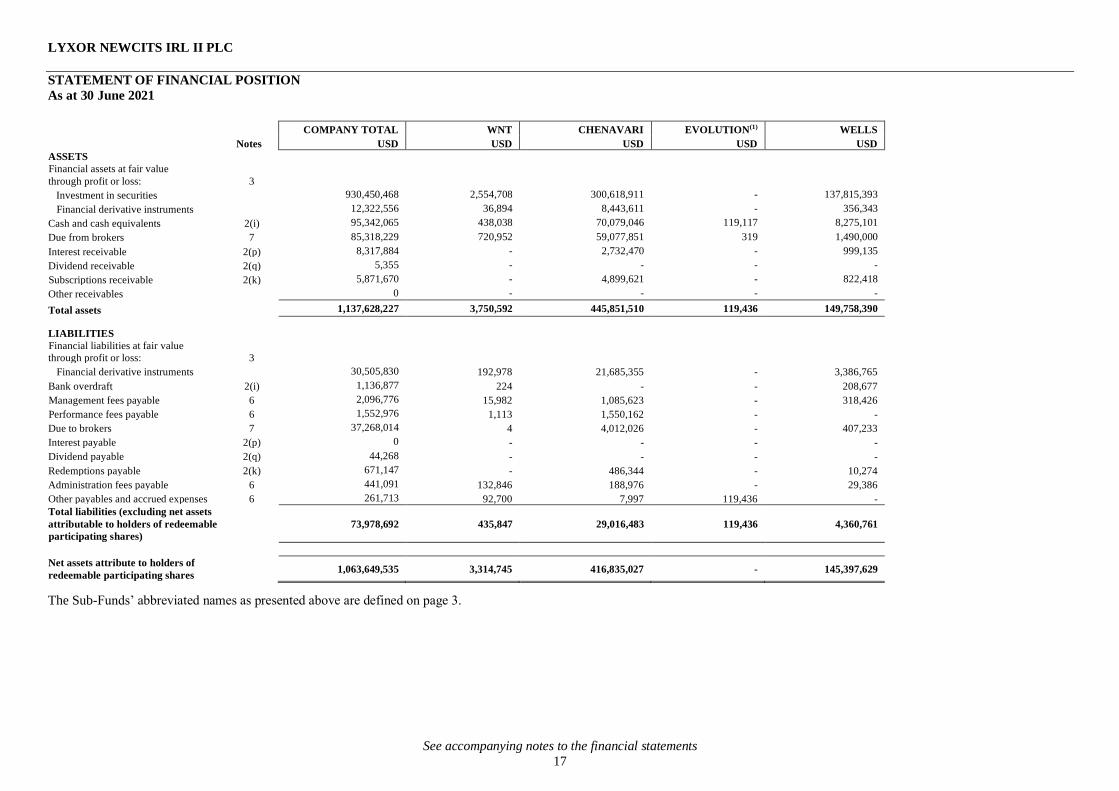
STATEMENT OF FINANCIAL POSITION
As at 30 June 2021
The Sub-Funds’ abbreviated names as presented above are defined on page 3.
COMPANY TOTAL WNT CHENAVARI EVOLUTION(1) WELLS
Notes USD USD USD USD USD
ASSETS
Financial assets at fair value
through profit or loss: 3
Investment in securities 930,450,468 2,554,708 300,618,911 - 137,815,393
Financial derivative instruments 12,322,556 36,894 8,443,611 - 356,343
Cash and cash equivalents 2(i) 95,342,065 438,038 70,079,046 119,117 8,275,101
Due from brokers 7 85,318,229 720,952 59,077,851 319 1,490,000
Interest receivable 2(p) 8,317,884 - 2,732,470 - 999,135
Dividend receivable 2(q) 5,355 - - - -
Subscriptions receivable 2(k) 5,871,670 - 4,899,621 - 822,418
Other receivables 0 - - - -
Total assets 1,137,628,227 3,750,592 445,851,510 119,436 149,758,390
LIABILITIES
Financial liabilities at fair value
through profit or loss: 3
Financial derivative instruments 30,505,830 192,978 21,685,355 - 3,386,765
Bank overdraft 2(i) 1,136,877 224 - - 208,677
Management fees payable 6 2,096,776 15,982 1,085,623 - 318,426
Performance fees payable 6 1,552,976 1,113 1,550,162 - -
Due to brokers 7 37,268,014 4 4,012,026 - 407,233
Interest payable 2(p) 0 - - - -
Dividend payable 2(q) 44,268 - - - -
Redemptions payable 2(k) 671,147 - 486,344 - 10,274
Administration fees payable 6 441,091 132,846 188,976 - 29,386
Other payables and accrued expenses 6 261,713 92,700 7,997 119,436 -
Total liabilities (excluding net assets
attributable to holders of redeemable
participating shares)
73,978,692 435,847 29,016,483 119,436 4,360,761
Net assets attribute to holders of
redeemable participating shares 1,063,649,535 3,314,745 416,835,027 - 145,397,629

LYXOR NEWCITS IRL II PLC
See accompanying notes to the financial statements
18
STATEMENT OF FINANCIAL POSITION (continued)
As at 30 June 2021
The Sub-Funds’ abbreviated names as presented above are defined on page 3.
ACADEMY(2) MARATHON BLUESCALE
Notes USD USD USD
ASSETS
Financial assets at fair value
through profit or loss: 3
Investment in securities - 434,319,979 55,141,477
Financial derivative instruments - 15,867 3,469,841
Cash and cash equivalents 2(i) 41,580 11,325,064 5,064,119
Due from brokers 7 - 22,019,789 2,009,318
Interest receivable 2(p) - 4,586,279 -
Dividend receivable 2(q) - - 5,355
Subscriptions receivable 2(k) - 149,631 -
Other receivables - - -
Total assets 41,580 472,416,609 65,690,110
LIABILITIES
Financial liabilities at fair value
through profit or loss: 3
Financial derivative instruments - 3,099,908 2,140,824
Bank overdraft 2(i) - 927,921 55
Management fees payable 6 - 613,330 63,415
Performance fees payable 6 - - 1,701
Due to brokers 7 - 32,717,562 131,189
Interest payable 2(p) - - -
Dividend payable 2(q) - - 44,268
Redemptions payable 2(k) - 174,529 -
Administration fees payable 6 - 71,601 18,282
Other payables and accrued expenses 6 41,580 - -
Total liabilities (excluding net assets
attributable to holders of redeemable
participating shares)
41,580 37,604,851 2,399,734
Net assets attribute to holders of
redeemable participating shares - 434,811,758 63,290,376

LYXOR NEWCITS IRL II PLC
See accompanying notes to the financial statements
19
STATEMENT OF FINANCIAL POSITION (continued)
As at 30 June 2021
WNT CHENAVARI EVOLUTION(1) WELLS
USD USD USD USD
Share Class
No. of shares
outstanding
NAV per
share
No. of shares
outstanding
NAV per
share
No. of shares
outstanding
NAV per
share
No. of shares
outstanding
NAV per
share
Class I (USD) 3,042.33 115.5269 52,848.92 123.7155 - - 127,132.22 138.2267
Hedged Class EB (EUR) - - - - - - - -
Hedged Class EB (GBP) - - - - - - - -
Hedged Class A (EUR) 1,983.90 102.3887 277,209.29 112.7901 - - 168,625.04 119.7752
Hedged Class I (EUR) 15,085.23 102.7969 798,631.86 112.7135 - - 644,525.46 124.0113
Hedged Class A (CHF) 500.00 88.6352 - - - - - -
Hedged Class I (GBP) 4,510.72 106.4527 - - - - - -
Class SI (USD) - - 260,273.42 125.9134 - - 39,571.63 122.4100
Hedged Class SI (GBP) - - 74,425.00 101.1135 - - - -
Hedged Class S (EUR) - - - - - - - -
Class A (USD) 1,757.00 97.5906 61,675.19 118.8422 - - 33,588.16 126.4334
Hedged Class SIP (EUR) - - 80,000.00 117.8118 - - - -
Hedged Class SI (EUR) - - 528,382.86 113.2232 - - - -
Class O (USD) - - 32,580.75 126.9733 - - - -
Hedged Class O (EUR) - - 52,993.32 118.7390 - - - -
Class IA (USD) - - 1,000.00 117.2327 - - - -
Class AA (USD) - - 100.00 116.0445 - - - -
Hedged Class SSI (EUR) - - 957,108.14 107.5923 - - - -
The Sub-Funds’ abbreviated names as presented above are defined on page 3.

LYXOR NEWCITS IRL II PLC
See accompanying notes to the financial statements
20
STATEMENT OF FINANCIAL POSITION (continued)
As at 30 June 2021
ACADEMY(2)
USD
MARATHON BLUESCALE
USD USD
Share Class
No. of shares
outstanding
NAV per
share
No. of shares
outstanding
NAV per
share
No. of shares
outstanding
NAV per
share
Class I (USD) - - 292,001.63 112.7215 10.00 104.7102
Class EB (USD) - - - - 156290.8674 104.9822
Hedged Class A (EUR) - - 129,122.15 106.0419 13992.00 93.3397
Hedged Class I (EUR) - - 391,043.78 107.7075 - -
Class A (USD) - - 14,834.16 111.4279 12,505.00 93.3127
Hedged Class I (GBP) - - 4,115.00 108.5694 - -
Class F (USD) - - 1,453,821.08 113.9158 406099.68 108.7564
Class SI (USD) - - 856,854.11 109.1270 - -
Class SID (CHF) - - 101,220.21 103.0837 - -
Class SID (EUR) - - 42,258.53 103.2270 - -
Class SID (GBP) - - 266,989.00 103.3944 - -
Class SID (USD) - - 190,221.42 103.5336 - -
The Sub-Funds’ abbreviated names as presented above are defined on page 3.
The hedged redeemable participating share classes held by each Sub-Fund are identified in the statement above and throughout these financial statements.
(1)Lyxor Evolution Fixed Income Fund: Terminated on 28 December 2018. Balances reflected relate to amounts outstanding as at 30 June 2021.
(2)Lyxor/Academy Quantitative Global UCITS Fund: Terminated on 13 January 2020. Balances reflected relate to amounts outstanding as at 30 June 2021.

LYXOR NEWCITS IRL II PLC
See accompanying notes to the financial statements
21
STATEMENT OF FINANCIAL POSITION
As at 31 December 2020
The Sub-Funds’ abbreviated names as presented above are defined on page 3.
COMPANY TOTAL WNT CHENAVARI EVOLUTION(1) WELLS
Notes USD USD USD USD USD
ASSETS
Financial assets at fair value
through profit or loss: 3
Investment in securities 740,208,483 4,937,211 166,980,084 - 127,435,366
Financial derivative instruments 11,296,292 760,321 3,489,988 - 1,422,355
Cash and cash equivalents 2(i) 67,255,029 1,344,827 42,803,098 118,822 10,799,942
Due from brokers 7 55,712,960 13,971,245 31,217,146 612 5,918,388
Interest receivable 2(p) 7,855,009 - 2,241,934 - 1,690,404
Dividend receivable 2(q) 6,791 - - - -
Subscriptions receivable 2(k) 871,100 - - - 370,485
Other receivables 0 - - - -
Total assets 883,205,664 21,013,604 246,732,250 119,434 147,636,940
LIABILITIES
Financial liabilities at fair value
through profit or loss: 3
Financial derivative instruments 15,352,726 67,154 9,284,049 - 2,499,100
Bank overdraft 2(i) 4,803 - 4,473 - 330
Management fees payable 6 1,807,402 26,482 794,432 - 339,175
Performance fees payable 6 3,797,354 213,437 3,244,397 - -
Due to brokers 7 1,740,900 404,881 3,076 - -
Interest payable 2(p) 0 - - - -
Dividend payable 2(q) 105,201 - - - -
Redemptions payable 2(k) 2,531,244 124,580 152,999 - 1,700,053
Administration fees payable 6 1,025,221 230,936 290,797 - 128,376
Other payables and accrued expenses 6 256,453 95,492 - 119,434 -
Total liabilities (excluding net assets
attributable to holders of redeemable
participating shares)
26,621,304 1,162,962 13,774,223 119,434 4,667,034
Net assets attribute to holders of
redeemable participating shares 856,584,360 19,850,642 232,958,027 - 142,969,906

LYXOR NEWCITS IRL II PLC
See accompanying notes to the financial statements
22
STATEMENT OF FINANCIAL POSITION (continued)
As at 31 December 2020
The Sub-Funds’ abbreviated names as presented above are defined on page 3.
ACADEMY(2) MARATHON BLUESCALE
Notes USD USD USD
ASSETS
Financial assets at fair value
through profit or loss: 3
Investment in securities - 370,718,197 70,137,625
Financial derivative instruments - 573,171 5,050,457
Cash and cash equivalents 2(i) 41,527 3,064,251 9,082,562
Due from brokers 7 - - 4,605,569
Interest receivable 2(p) - 3,922,671 -
Dividend receivable 2(q) - - 6,791
Subscriptions receivable 2(k) - 100,615 400,000
Other receivables - - -
Total assets 41,527 378,378,905 89,283,004
LIABILITIES
Financial liabilities at fair value
through profit or loss: 3
Financial derivative instruments - 9,706 3,492,717
Bank overdraft 2(i) - - -
Management fees payable 6 - 574,784 72,529
Performance fees payable 6 - - 339,520
Due to brokers 7 - - 1,332,943
Interest payable 2(p) - - -
Dividend payable 2(q) - - 105,201
Redemptions payable 2(k) - 553,612 -
Administration fees payable 6 - 284,510 90,602
Other payables and accrued expenses 6 41,527 - -
Total liabilities (excluding net assets
attributable to holders of redeemable
participating shares) 41,527 1,422,612 5,433,512
Net assets attribute to holders of
redeemable participating shares - 376,956,293 83,849,492

LYXOR NEWCITS IRL II PLC
See accompanying notes to the financial statements
23
STATEMENT OF FINANCIAL POSITION (continued)
As at 31 December 2020
WNT CHENAVARI EVOLUTION(1) KINGDON(3) WELLS
USD USD USD USD USD
Share Class
No. of shares
outstanding
NAV per
share
No. of shares
outstanding
NAV per
share
No. of shares
outstanding
NAV per
share
No. of shares
outstanding
NAV per
share
No. of shares
outstanding
NAV per
share
Class I (USD) 11,440.33 115.3299 21,852.61 120.7790 - - - - 134,735.74 133.2466
Hedged Class A (EUR) 7,306.93 103.1844 280,773.39 110.7722 - - - - 159,184.12 116.2861
Hedged Class I (EUR) 102,240.85 103.1755 322,081.77 110.3656 - - - - 643,649.26 119.9523
Hedged Class A (CHF) 500.00 89.4195 - - - - - - - -
Hedged Class I (GBP) 30,760.07 106.4781 - - - - - - - -
Class SI (USD) - - 267,458.57 122.8260 - - - - 39,164.03 117.9417
Class A (USD) 2,032.00 97.8336 20,234.28 116.3660 - - - - 28,392.16 122.3301
Hedged Class SIP (EUR) - - 80,000.00 115.2661 - - - - - -
Hedged Class SI (EUR) - - 355,456.09 110.7761 - - - - - -
Class O (USD) - - 81,535.51 122.5507 - - - - - -
Hedged Class O (EUR) - - 21,500.52 115.0436 - - - - - -
Class IA (USD) - - 1,000.00 114.5911 - - - - - -
Class AA (USD) - - 100.00 113.6948 - - - - - -
Hedged Class SSI (EUR) - - 320,632.60 105.1783 - - - - - -
The Sub-Funds’ abbreviated names as presented above are defined on page 3.

LYXOR NEWCITS IRL II PLC
See accompanying notes to the financial statements
24
STATEMENT OF FINANCIAL POSITION (continued)
As at 31 December 2020
ACADEMY(2) MARATHON BLUESCALE
USD USD USD
Share Class
No. of shares
outstanding
NAV per
share
No. of shares
outstanding
NAV per
share
No. of shares
outstanding
NAV per
share
Class I (USD) - - 541,415.84 114.6813 10.00 113.6461
Class EB (USD) - - - - 196,758.37 113.7126
Hedged Class A (EUR) - - 158,039.69 108.6668 14,340.00 102.0933
Hedged Class I (EUR) - - 199,279.24 110.0254 - -
Class A (USD) - - 24,162.15 113.7557 10,090.00 101.7066
Hedged Class I (GBP) - - 4,616.00 110.4622 - -
Class F (USD) - - 1,571,764.54 115.7236 498,700.51 117.6254
Class SI (USD) - - 736,854.11 110.9688 - -
The Sub-Funds’ abbreviated names as presented above are defined on page 3.
The hedged redeemable participating share classes held by each Sub-Fund are identified in the statement above and throughout these financial statements.
(1) Lyxor Evolution Fixed Income Fund: Terminated on 28 December 2018. Balances reflected relate to amounts outstanding as at 31 December 2020. (2) Lyxor/Academy Quantitative Global UCITS Fund: Terminated on 13 January 2020. Balances reflected relate to amounts outstanding as at 31 December 2020. (3) Lyxor/Kingdon Global Long-Short Equity Fund: Terminated on 30 March 2020.

LYXOR NEWCITS IRL II PLC
See accompanying notes to the Financial Statements
25
STATEMENT OF COMPREHENSIVE INCOME
For the period from 1 January 2021 to 30 June 2021
COMPANY TOTAL WNT CHENAVARI EVOLUTION(1) WELLS
Notes USD USD USD USD USD
Investment income
Net gain/(loss) on financial assets and liabilities
at fair value through profit or loss
5 (20,544,176) (121,613) (2,234,208) - (1,226,748)
Net gain/(loss) on foreign exchange 5 938,465 (20,579) 552,196 - 185,667
Interest income on cash and cash equivalents 2(p) 53,075 3,845 32,167 - 1,635
Interest on financial assets at fair value
through profit or loss 2(p) 16,713,160 775 5,339,005 - 3,285,741
Dividend income 2(q) 99,628 - - - -
Total investment income/(loss) (2,739,848) (137,572) 3,689,160 - 2,246,295
Expenses
Management fees 6 3,969,644 42,377 1,997,910 - 631,226
Performance fees 6 1,432,889 15 1,479,523 - -
Administration fees 6 1,175,133 15,266 510,164 - 177,768
Transaction costs 2(r) 181,451 12,528 161,180 - 127
Dividend expense 2(q) 312,692 - - - -
Other expenses 302,405 18,389 159,020 - 51,448
Total operating expenses 7,374,214 88,575 4,307,797 - 860,569
Operating profit/(oss) (10,114,062) (226,147) (618,637) - 1,385,726
Finance cost
Interest expense on cash and cash equivalents 2(p) 137,661 9,130 95,838 - 10,529
Interest on financial liabilities at fair value through profit or loss 2(p) 1,321,094 - 1,220,159 - 100,935
Profit/(Loss) before tax (11,572,817) (235,277) (1,934,634) - 1,274,262
Withholding taxes 60,570 - - - -
Increase/(Decrease) in net assets attributable to holders of
redeemable participating shares
from operations (11,633,387) (235,277) (1,934,634) - 1,274,262
The Sub-Funds’ abbreviated names as presented above are defined on page 3.

LYXOR NEWCITS IRL II PLC
See accompanying notes to the financial statements
26
STATEMENT OF COMPREHENSIVE INCOME (continued)
For the period from 1 January 2021 to 30 June 2021
ACADEMY(2) MARATHON BLUESCALE
Notes USD USD USD
Investment income
Net gain/(loss) on financial assets and liabilities
at fair value through profit or loss
5 - (11,088,624) (5,872,983)
Net gain/(loss) on foreign exchange 5 - 210,336 10,845
Interest income on cash and cash equivalents 2(p) - 6,760 8,668
Interest on financial assets at fair value
through profit or loss 2(p) - 8,061,139 26,500
Dividend income 2(q) - - 99,628
Total investment income/(loss) - (2,810,389) (5,727,342)
Expenses
Management fees 6 - 1,106,179 191,952
Performance fees 6 - - (46,649)
Administration fees 6 - 349,878 122,057
Transaction costs 2(r) - - 7,616
Dividend expense 2(q) - - 312,692
Other expenses - 38,835 34,713
Total operating expenses - 1,494,892 622,381
Operating profit/(loss) - (4,305,281) (6,349,723)
Finance cost
Interest expense on cash and cash equivalents 2(p) - 13,179 8,985
Interest on financial liabilities at fair value
through profit or loss 2(p) - - -
Profit/(Loss) before tax - (4,318,460) (6,358,708)
Withholding taxes - 60,570 -
Increase/(Decrease) in net assets attributable to holders
of redeemable participating shares from operations - (4,379,030) (6,358,708)
The Sub-Funds’ abbreviated names as presented above are defined on page 3.
All amounts arose solely from continuing operations. There are no gains or losses other than those dealt within the Statement of Comprehensive Income.
(1)Lyxor Evolution Fixed Income Fund: Terminated on 28 December 2018. (2)Lyxor/Academy Quantitative Global UCITS Fund: Terminated on 13 January 2020.

LYXOR NEWCITS IRL II PLC
See accompanying notes to the Financial Statements
27
STATEMENT OF COMPREHENSIVE INCOME (continued)
For the period from 1 January 2020 to 30 June 2020
COMPANY
TOTAL WNT CHENAVARI EVOLUTION(1) KINGDON(3) WELLS
Notes USD USD USD USD USD USD
Investment income
Net gain/(loss) on financial assets and liabilities
at fair value through profit or loss
5 (29,460,772) (11,468,505) 6,790,547 - (8,287,322) (11,758,646)
Net gain/(loss) on foreign exchange 5 (3,651,918) (2,481,326) (106,746) - 3,767 (1,008,965)
Interest income on cash and cash equivalents 2(p) 756,591 350,931 170,389 1,950 10,408 66,451
Interest on financial assets at fair value
through profit or loss 2(p) 9,785,841 271,922 1,721,060 - 5,052 3,081,346
Dividend income 2(q) 88,285 1,666 - - 15,077 -
Other income 31,338 - - 1,632 7,167 -
Total investment income/(loss) (22,450,635) (13,325,312) 8,575,250 3,582 (8,245,851) (9,619,814)
Expenses
Management fees 6 3,160,379 710,287 1,053,872 - 83,204 624,045
Performance fees 6 1,563,350 696,551 866,793 - - -
Administration fees 6 939,318 208,025 262,210 - 19,600 179,578
Transaction costs 2(r) 451,576 150,819 20,461 - 84,422 66
Dividend expense 2(q) 227,586 - - - 29,888 -
Other expenses 450,924 281,171 90,738 3,582 1,162 59,046
Total operating expenses 6,793,133 2,046,853 2,294,074 3,582 218,276 862,735
Foreign exchange gain/(loss) on translation - - - - - -
Operating profit/(oss) (29,243,768) (15,372,165) 6,281,176 - (8,464,127) (10,482,549)
Finance cost
Interest expense on cash and cash equivalents 2(p) (274,727) (45,916) (50,846) - (20,017) (14,406)
Interest on financial liabilities at fair value through
profit or loss 2(p) (1,237,307) - (1,080,866) - - (156,441)
Profit/(Loss) before tax (30,755,802) (15,418,081) 5,149,464 - (8,484,144) (10,653,396)
Withholding taxes (48,839) - (32,680) - (2,228) -
Increase/(Decrease) in net assets attributable to
holders of redeemable participating shares
from operations (30,804,641) (15,418,081) 5,116,784 - (8,486,372) (10,653,396)
The Sub-Funds’ abbreviated names as presented above are defined on page 3.

LYXOR NEWCITS IRL II PLC
See accompanying notes to the financial statements
28
STATEMENT OF COMPREHENSIVE INCOME (continued)
For the period from 1 January 2020 to 30 June 2020 (continued)
ACADEMY(2) MARATHON BLUESCALE
Notes USD USD USD
Investment income
Net gain/(loss) on financial assets and liabilities
at fair value through profit or loss
5 (2,159) (6,815,132) 2,080,445
Net gain/(loss) on foreign exchange 5 (1,968) (80,312) 23,632
Interest income on cash and cash equivalents 2(p) 45,536 71,475 39,451
Interest on financial assets at fair value
through profit or loss 2(p) - 4,701,209 5,252
Dividend income 2(q) 3,873 - 67,669
Other income 22,539 - -
Total investment income/(loss) 67,821 (2,122,760) 2,216,449
Expenses
Management fees 6 301 628,553 60,117
Performance fees 6 - - 6
Administration fees 6 121 186,225 83,559
Transaction costs 2(r) 91 80 195,637
Dividend expense 2(q) - - 197,698
Other expenses 3,481 11,148 596
Total operating expenses 3,994 826,006 537,613
Foreign exchange gain/(loss) on translation - - -
Operating profit/(loss) 63,827 (2,948,766) 1,678,836
Finance cost
Interest expense on cash and cash equivalents 2(p) (53,327) (83,285) (6,930)
Interest on financial liabilities at fair value
through profit or loss 2(p) - - -
Profit/(Loss) before tax 10,500 (3,032,051) 1,671,906
Withholding taxes (193) - (13,738)
Increase/(Decrease) in net assets attributable to holders
of redeemable participating shares from operations 10,307 (3,032,051) 1,658,168
The Sub-Funds’ abbreviated names as presented above are defined on page 3.
All amounts arose solely from continuing operations. There are no gains or losses other than those dealt within the Statement of Comprehensive Income.
(1)Lyxor Evolution Fixed Income Fund: Terminated on 28 December 2018. Gains and losses relate to cash and cash equivalents and other assets and liabilities held by the Sub-Fund during the period. (2)Lyxor/Academy Quantitative Global UCITS Fund: For the period from 1 January 2020 to 13 January 2020 (termination of operations). (3)Lyxor/Kingdon Global Long-Short Equity Fund: For the period from 1 January 2020 to 30 March 2020 (termination of operations).

LYXOR NEWCITS IRL II PLC
See accompanying notes to the Financial Statements
29
STATEMENT OF CHANGES IN NET ASSETS ATTRIBUTABLE
TO HOLDERS OF REDEEMABLE PARTICIPATING SHARES
For the period from 1 January 2021 to 30 June 2021
COMPANY TOTAL WNT CHENAVARI EVOLUTION(1) WELLS ACADEMY(2) MARATHON BLUESCALE
USD USD USD USD USD USD USD USD
Balance as at the beginning
of the period 856,584,360 19,850,642 232,958,027 -
142,969,906 - 376,956,293 83,849,492
Increase/(Decrease) in net assets
attributable to holders of redeemable
participating shares from operations (11,633,387) (235,277) (1,934,634) -
1,274,262 - (4,379,030) (6,358,708)
Issuance of redeemable participating
shares 444,356,044 1,265,540 280,214,230 -
13,216,161 - 148,079,506 1,580,607
Redemption of redeemable participating
shares (225,657,482) (17,566,160) (94,402,596) -
(12,062,700) - (85,845,011) (15,781,015)
Balance as at the end of the period 1,063,649,535 3,314,745 416,835,027 - 145,397,629 - 434,811,758 63,290,376
The Sub-Funds’ abbreviated names as presented above are defined on page 3.
(1)Lyxor Evolution Fixed Income Fund: Terminated on 28 December 2018. (2)Lyxor/Academy Quantitative Global UCITS Fund: Terminated on 13 January 2020.
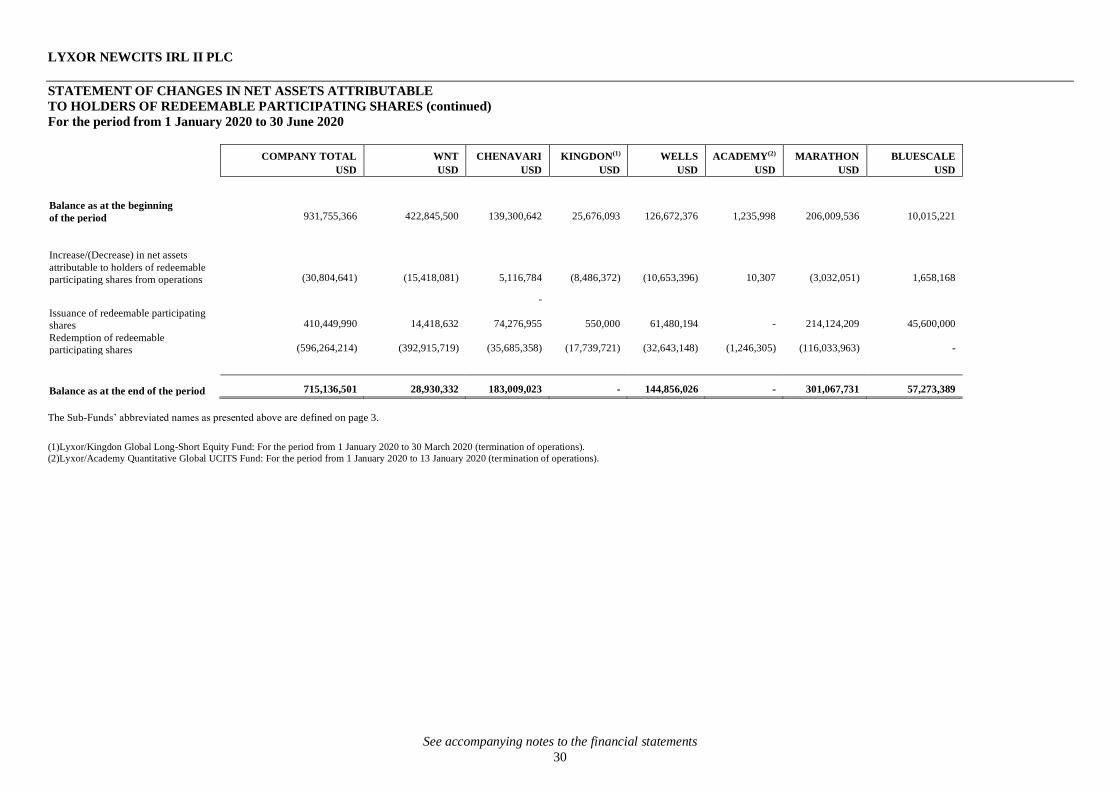
LYXOR NEWCITS IRL II PLC
See accompanying notes to the financial statements
30
STATEMENT OF CHANGES IN NET ASSETS ATTRIBUTABLE
TO HOLDERS OF REDEEMABLE PARTICIPATING SHARES (continued)
For the period from 1 January 2020 to 30 June 2020
COMPANY TOTAL WNT CHENAVARI KINGDON(1) WELLS ACADEMY(2) MARATHON BLUESCALE
USD USD USD USD USD USD USD USD
Balance as at the beginning
of the period 931,755,366 422,845,500 139,300,642 25,676,093 126,672,376 1,235,998 206,009,536 10,015,221
Increase/(Decrease) in net assets
attributable to holders of redeemable
participating shares from operations (30,804,641) (15,418,081) 5,116,784 (8,486,372) (10,653,396) 10,307 (3,032,051) 1,658,168
-
Issuance of redeemable participating
shares 410,449,990 14,418,632 74,276,955 550,000 61,480,194 - 214,124,209 45,600,000
Redemption of redeemable
participating shares (596,264,214) (392,915,719) (35,685,358) (17,739,721) (32,643,148) (1,246,305) (116,033,963) -
Balance as at the end of the period 715,136,501 28,930,332 183,009,023 - 144,856,026 - 301,067,731 57,273,389
The Sub-Funds’ abbreviated names as presented above are defined on page 3.
(1)Lyxor/Kingdon Global Long-Short Equity Fund: For the period from 1 January 2020 to 30 March 2020 (termination of operations).
(2)Lyxor/Academy Quantitative Global UCITS Fund: For the period from 1 January 2020 to 13 January 2020 (termination of operations).
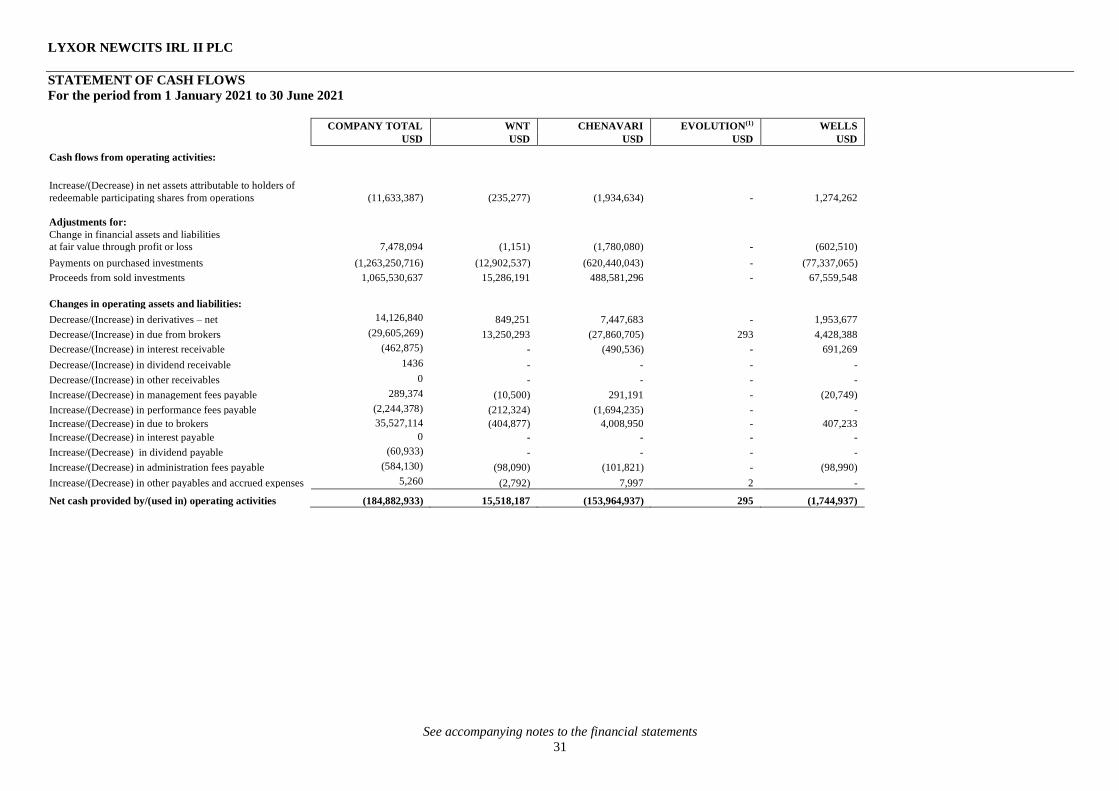
LYXOR NEWCITS IRL II PLC
See accompanying notes to the financial statements
31
STATEMENT OF CASH FLOWS
For the period from 1 January 2021 to 30 June 2021
COMPANY TOTAL WNT CHENAVARI EVOLUTION(1) WELLS USD USD USD USD USD
Cash flows from operating activities:
Increase/(Decrease) in net assets attributable to holders of
redeemable participating shares from operations (11,633,387) (235,277) (1,934,634) - 1,274,262
Adjustments for:
Change in financial assets and liabilities
at fair value through profit or loss 7,478,094 (1,151) (1,780,080) - (602,510)
Payments on purchased investments (1,263,250,716) (12,902,537) (620,440,043) - (77,337,065)
Proceeds from sold investments 1,065,530,637 15,286,191 488,581,296 - 67,559,548
Changes in operating assets and liabilities:
Decrease/(Increase) in derivatives – net 14,126,840 849,251 7,447,683 - 1,953,677
Decrease/(Increase) in due from brokers (29,605,269) 13,250,293 (27,860,705) 293 4,428,388
Decrease/(Increase) in interest receivable (462,875) - (490,536) - 691,269
Decrease/(Increase) in dividend receivable 1436 - - - -
Decrease/(Increase) in other receivables 0 - - - -
Increase/(Decrease) in management fees payable 289,374 (10,500) 291,191 - (20,749)
Increase/(Decrease) in performance fees payable (2,244,378) (212,324) (1,694,235) - -
Increase/(Decrease) in due to brokers 35,527,114 (404,877) 4,008,950 - 407,233
Increase/(Decrease) in interest payable 0 - - - -
Increase/(Decrease) in dividend payable (60,933) - - - -
Increase/(Decrease) in administration fees payable (584,130) (98,090) (101,821) - (98,990)
Increase/(Decrease) in other payables and accrued expenses 5,260 (2,792) 7,997 2 -
Net cash provided by/(used in) operating activities (184,882,933) 15,518,187 (153,964,937) 295 (1,744,937)
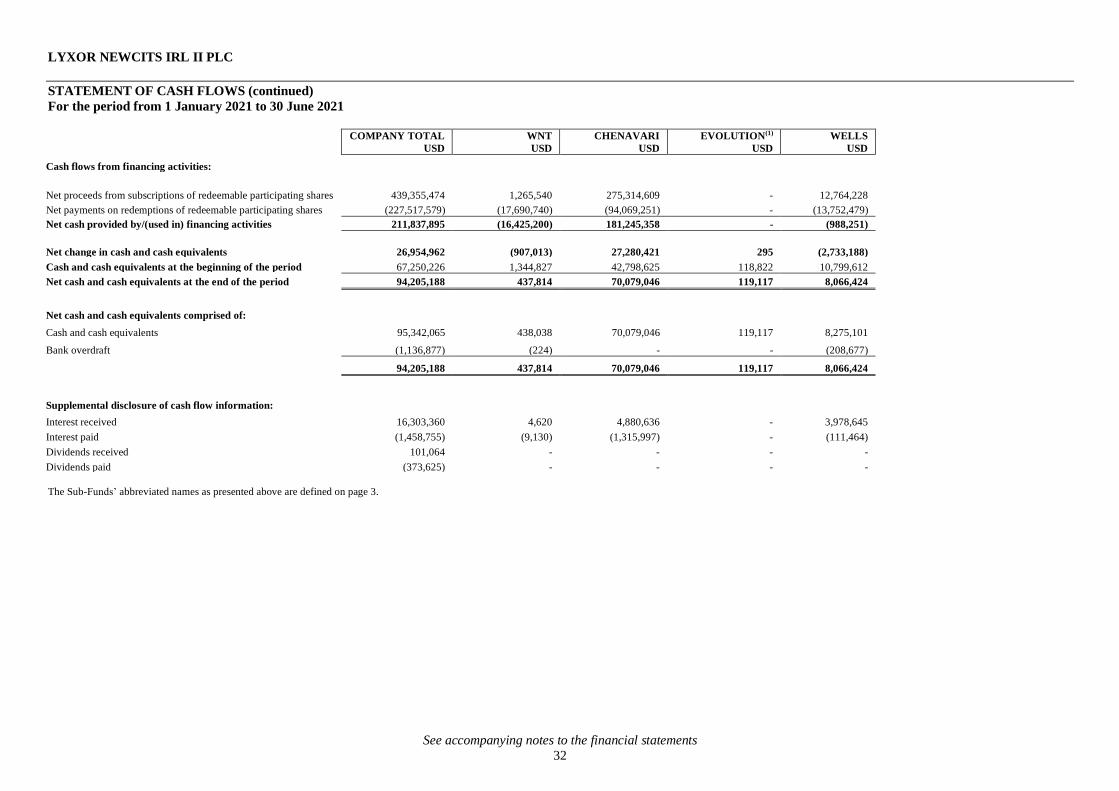
LYXOR NEWCITS IRL II PLC
See accompanying notes to the financial statements
32
STATEMENT OF CASH FLOWS (continued)
For the period from 1 January 2021 to 30 June 2021
COMPANY TOTAL WNT CHENAVARI EVOLUTION(1) WELLS USD USD USD USD USD
Cash flows from financing activities:
Net proceeds from subscriptions of redeemable participating shares 439,355,474 1,265,540 275,314,609 - 12,764,228
Net payments on redemptions of redeemable participating shares (227,517,579) (17,690,740) (94,069,251) - (13,752,479)
Net cash provided by/(used in) financing activities 211,837,895 (16,425,200) 181,245,358 - (988,251)
Net change in cash and cash equivalents 26,954,962 (907,013) 27,280,421 295 (2,733,188)
Cash and cash equivalents at the beginning of the period 67,250,226 1,344,827 42,798,625 118,822 10,799,612
Net cash and cash equivalents at the end of the period 94,205,188 437,814 70,079,046 119,117 8,066,424
Net cash and cash equivalents comprised of:
Cash and cash equivalents 95,342,065 438,038 70,079,046 119,117 8,275,101
Bank overdraft (1,136,877) (224) - - (208,677)
94,205,188 437,814 70,079,046 119,117 8,066,424
Supplemental disclosure of cash flow information:
Interest received 16,303,360 4,620 4,880,636 - 3,978,645
Interest paid (1,458,755) (9,130) (1,315,997) - (111,464)
Dividends received 101,064 - - - -
Dividends paid (373,625) - - - -
The Sub-Funds’ abbreviated names as presented above are defined on page 3.

LYXOR NEWCITS IRL II PLC
See accompanying notes to the financial statements
33
STATEMENT OF CASH FLOWS (continued)
For the period from 1 January 2021 to 30 June 2021
ACADEMY(2) MARATHON BLUESCALE
USD USD USD
Cash flows from operating activities:
Increase/(Decrease) in net assets attributable to holders of
redeemable participating shares from operations - (4,379,030) (6,358,708)
Adjustments for:
Change in financial assets and liabilities
at fair value through profit or loss - 10,048,116 (186,281)
Payments on purchased investments - (474,103,018) (78,468,053)
Proceeds from sold investments - 400,453,120 93,650,482
Changes in operating assets and liabilities:
Decrease/(Increase) in derivatives – net - 3,647,506 228,723
Decrease/(Increase) in due from brokers - (22,019,789) 2,596,251
Decrease/(Increase) in interest receivable - (663,608) -
Decrease/(Increase) in dividend receivable - - 1,436
Decrease/(Increase) in other receivables - - -
Increase/(Decrease) in management fees payable - 38,546 (9,114)
Increase/(Decrease) in performance fees payable - - (337,819)
Increase/(Decrease) in due to brokers - 32,717,562 (1,201,754)
Increase/(Decrease) in interest payable - - -
Increase/(Decrease) in dividend payable - - (60,933)
Increase/(Decrease) in administration fees payable - (212,909) (72,320)
Increase/(Decrease) in other payables and accrued expenses 53 - -
Net cash provided by/(used in) operating activities 53 (54,473,504) 9,781,910
(1)Lyxor Evolution Fixed Income Fund: Terminated on 28 December 2018. (2) Lyxor/Academy Quantitative Global UCITS Fund: Terminated on 13 January 2020.

LYXOR NEWCITS IRL II PLC
See accompanying notes to the financial statements
34
STATEMENT OF CASH FLOWS (continued)
For the period from 1 January 2021 to 30 June 2021
The Sub-Funds’ abbreviated names as presented above are defined on page 3.
(1)Lyxor Evolution Fixed Income Fund: Terminated on 28 December 2018. (2)Lyxor/Academy Quantitative Global UCITS Fund: For the period from 1 January 2020 to 13 January 2020 (termination of operations). (3)Lyxor/Kingdon Global Long-Short Equity Fund: For the period from 1 January 2020 to 30 March 2020 (termination of operations).
ACADEMY(2) MARATHON BLUESCALE
USD USD USD
Cash flows from financing activities:
Net proceeds from subscriptions of redeemable participating
shares - 148,030,490 1,980,607
Net payments on redemptions of redeemable participating
shares - (86,224,094) (15,781,015)
Net cash provided by/(used in) financing activities - 61,806,396 (13,800,408)
Net change in cash and cash equivalents 53 7,332,892 (4,018,498)
Cash and cash equivalents at the beginning of the period 41,527 3,064,251 9,082,562
Cash and cash equivalents at the end of the period 41,580 10,397,143 5,064,064
Net cash and cash equivalents comprised of:
Cash and cash equivalents 41,580 11,325,064 5,064,119
Bank overdraft - (927,921) (55)
41,580 10,397,143 5,064,064
Supplemental disclosure of cash flow information:
Interest received - 7,404,291 35,168
Interest paid - (13,179) (8,985)
Dividend received - - 101,064
Dividend paid - - (373,625)
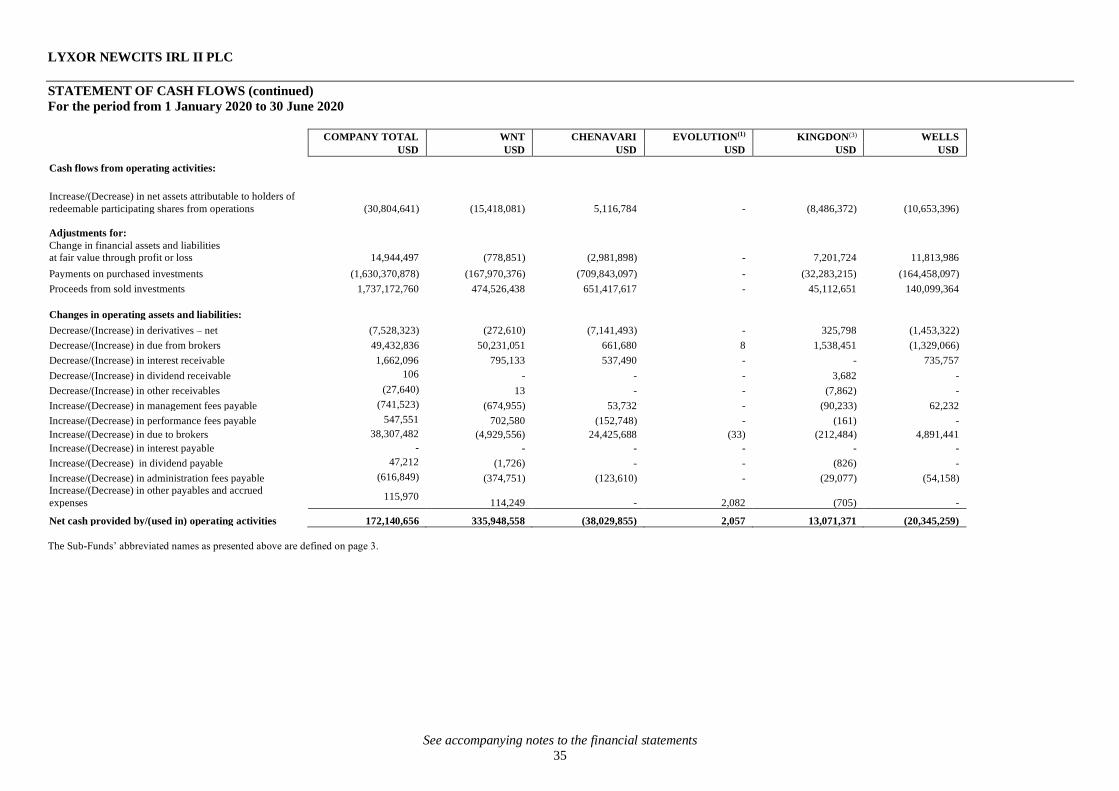
LYXOR NEWCITS IRL II PLC
See accompanying notes to the financial statements
35
STATEMENT OF CASH FLOWS (continued)
For the period from 1 January 2020 to 30 June 2020
COMPANY TOTAL WNT CHENAVARI EVOLUTION(1) KINGDON(3) WELLS USD USD USD USD USD USD
Cash flows from operating activities:
Increase/(Decrease) in net assets attributable to holders of
redeemable participating shares from operations (30,804,641) (15,418,081) 5,116,784 - (8,486,372) (10,653,396)
Adjustments for:
Change in financial assets and liabilities
at fair value through profit or loss 14,944,497 (778,851) (2,981,898) - 7,201,724 11,813,986
Payments on purchased investments (1,630,370,878) (167,970,376) (709,843,097) - (32,283,215) (164,458,097)
Proceeds from sold investments 1,737,172,760 474,526,438 651,417,617 - 45,112,651 140,099,364
Changes in operating assets and liabilities:
Decrease/(Increase) in derivatives – net (7,528,323) (272,610) (7,141,493) - 325,798 (1,453,322)
Decrease/(Increase) in due from brokers 49,432,836 50,231,051 661,680 8 1,538,451 (1,329,066)
Decrease/(Increase) in interest receivable 1,662,096 795,133 537,490 - - 735,757
Decrease/(Increase) in dividend receivable 106 - - - 3,682 -
Decrease/(Increase) in other receivables (27,640) 13 - - (7,862) -
Increase/(Decrease) in management fees payable (741,523) (674,955) 53,732 - (90,233) 62,232
Increase/(Decrease) in performance fees payable 547,551 702,580 (152,748) - (161) -
Increase/(Decrease) in due to brokers 38,307,482 (4,929,556) 24,425,688 (33) (212,484) 4,891,441
Increase/(Decrease) in interest payable - - - - - -
Increase/(Decrease) in dividend payable 47,212 (1,726) - - (826) -
Increase/(Decrease) in administration fees payable (616,849) (374,751) (123,610) - (29,077) (54,158)
Increase/(Decrease) in other payables and accrued
expenses 115,970
114,249 - 2,082 (705) -
Net cash provided by/(used in) operating activities 172,140,656 335,948,558 (38,029,855) 2,057 13,071,371 (20,345,259)
The Sub-Funds’ abbreviated names as presented above are defined on page 3.

LYXOR NEWCITS IRL II PLC
See accompanying notes to the financial statements
36
STATEMENT OF CASH FLOWS (continued)
For the period from 1 January 2020 to 30 June 2020
COMPANY TOTAL WNT CHENAVARI EVOLUTION(1) KINGDON(3) WELLS USD USD USD USD USD USD
Cash flows from financing activities:
Net proceeds from subscriptions of redeemable
participating shares 434,243,306
36,842,292 74,358,857 - 550,000 61,949,691
Net payments on redemptions of redeemable participating
shares (599,924,885)
(395,491,570) (36,302,293) - (17,739,721) (32,809,071)
Net cash provided by/(used in) financing activities (165,681,579) (358,649,278) 38,056,564 - (17,189,721) 29,140,620
Net change in cash and cash equivalents 6,459,077 (22,700,720) 26,709 2,057 (4,118,350) 8,795,361
Cash and cash equivalents at the beginning of the
period 74,230,459
30,639,488 32,082,282 107,119 4,110,488 4,195,546
Net cash and cash equivalents at the end of the period 80,689,536 7,938,768 32,108,991 109,176 (7,862) 12,990,907
Net cash and cash equivalents comprised of:
Cash and cash equivalents 83,518,108 7,952,330 32,108,991 109,176 - 12,990,907
Bank overdraft (2,828,572) (13,562) - - (7,862) -
80,689,536 7,938,768 32,108,991 109,176 (7,862) 12,990,907
Supplemental disclosure of cash flow information:
Interest received 12,204,528 1,417,986 2,428,939 1,950 15,460 3,883,554
Interest paid (1,512,034) (45,916) (1,131,712) - (20,017) (170,847)
Dividends received 88,391 1,666 - - 18,759 -
Dividends paid (180,374) (1,726) - - (30,714) -
The Sub-Funds’ abbreviated names as presented above are defined on page 3.
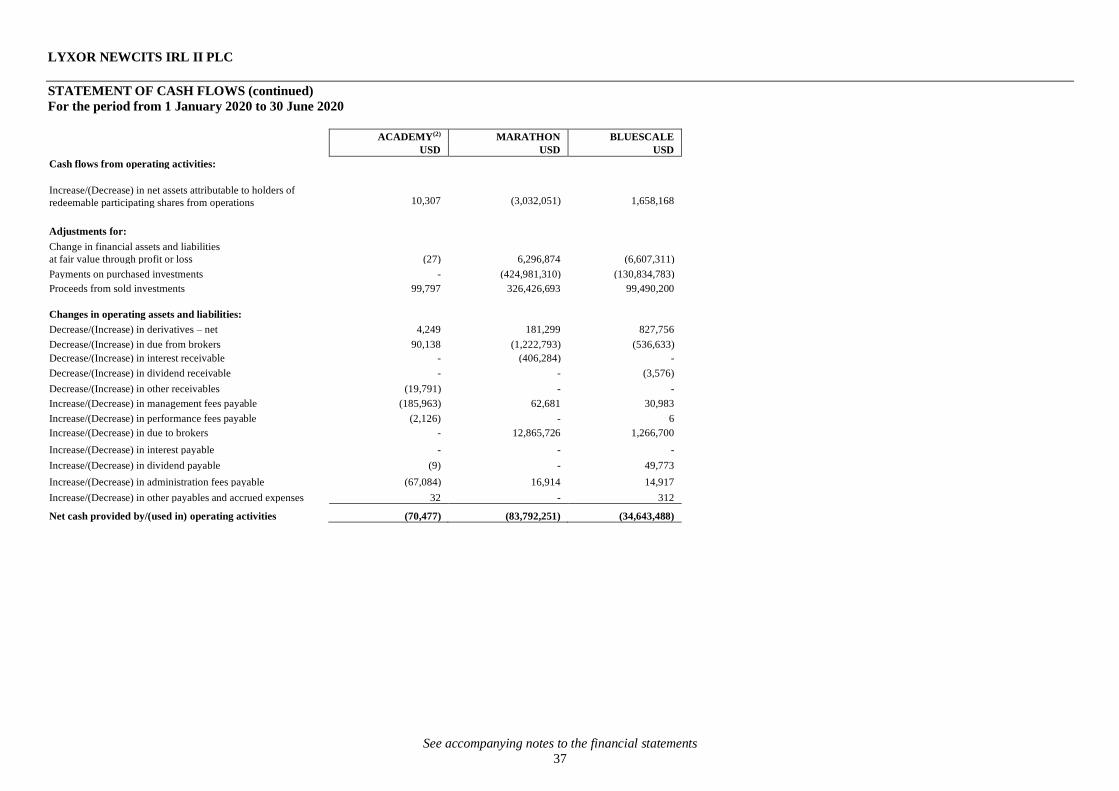
LYXOR NEWCITS IRL II PLC
See accompanying notes to the financial statements
37
STATEMENT OF CASH FLOWS (continued)
For the period from 1 January 2020 to 30 June 2020
ACADEMY(2) MARATHON BLUESCALE
USD USD USD
Cash flows from operating activities:
Increase/(Decrease) in net assets attributable to holders of
redeemable participating shares from operations 10,307 (3,032,051) 1,658,168
Adjustments for:
Change in financial assets and liabilities
at fair value through profit or loss (27) 6,296,874 (6,607,311)
Payments on purchased investments - (424,981,310) (130,834,783)
Proceeds from sold investments 99,797 326,426,693 99,490,200
Changes in operating assets and liabilities:
Decrease/(Increase) in derivatives – net 4,249 181,299 827,756
Decrease/(Increase) in due from brokers 90,138 (1,222,793) (536,633)
Decrease/(Increase) in interest receivable - (406,284) -
Decrease/(Increase) in dividend receivable - - (3,576)
Decrease/(Increase) in other receivables (19,791) - -
Increase/(Decrease) in management fees payable (185,963) 62,681 30,983
Increase/(Decrease) in performance fees payable (2,126) - 6
Increase/(Decrease) in due to brokers - 12,865,726 1,266,700
Increase/(Decrease) in interest payable - - -
Increase/(Decrease) in dividend payable (9) - 49,773
Increase/(Decrease) in administration fees payable (67,084) 16,914 14,917
Increase/(Decrease) in other payables and accrued expenses 32 - 312
Net cash provided by/(used in) operating activities (70,477) (83,792,251) (34,643,488)

LYXOR NEWCITS IRL II PLC
See accompanying notes to the financial statements
38
STATEMENT OF CASH FLOWS (continued)
For the period from 1 January 2020 to 30 June 2020
The Sub-Funds’ abbreviated names as presented above are defined on page 3.
(1)Lyxor Evolution Fixed Income Fund: Terminated on 28 December 2018.
(2) Lyxor/Academy Quantitative Global UCITS Fund: Terminated on 13 January 2020.
(3)Lyxor/Kingdon Global Long-Short Equity Fund: Terminated on 30 March 2020.
ACADEMY(2) MARATHON BLUESCALE
USD USD USD
Cash flows from financing activities:
Net proceeds from subscriptions of redeemable participating shares - 214,942,466 45,600,000
Net payments on redemptions of redeemable participating shares (1,246,305) (116,335,925) -
Net cash provided by/(used in) financing activities (1,246,305) 98,606,541 45,600,000
Net change in cash and cash equivalents (1,316,782) 14,814,290 10,956,512
Cash and cash equivalents at the beginning of the period 1,337,008 452,068 1,306,460
Cash and cash equivalents at the end of the period 20,226 15,266,358 12,262,972
Net cash and cash equivalents comprised of:
Cash and cash equivalents 30,033 15,266,358 15,060,313
Bank overdraft (9,807) - (2,797,341)
20,226 15,266,358 12,262,972
Supplemental disclosure of cash flow information:
Interest received 45,536 4,366,400 44,703
Interest paid (53,327) (83,285) (6,930)
Dividend received 3,873 - 64,093
Dividend paid (9) - (147,925)
LYXOR NEWCITS IRL II PLC
39
NOTES TO THE FINANCIAL STATEMENTS
For the period from 1 January 2021 to 30 June 2021
1. GENERAL INFORMATION
Lyxor Newcits IRL II plc (the “Company”) was incorporated under the laws of Ireland, pursuant to the Companies
Act 2014, on 21 November 2012 with registration number 520397. It was registered as an umbrella investment
company with variable capital and segregated liability between sub-funds and is authorised by the Central Bank of
Ireland (“Central Bank”) as an Undertaking for Collective Investment in Transferable Securities pursuant to the European Communities (Undertakings for Collective Investment in Transferable Securities) (“UCITS”) Regulations,
2011 (as amended) and the Central Bank (Supervision and Enforcement) Act 2013 (Section 48(1)) (UCITS)
Regulations 2019 (the “Central Bank UCITS Regulations” or collectively the “UCITS Regulations”). The Directors
may establish additional sub-funds, subject to the prior approval of the Central Bank.
As at 30 June 2021, the Company has 9 Sub-Funds: 5 active, 4 terminated (31 December 2020: 9 Sub-Funds: 5 active,
4 terminated). The terminated Sub-Funds remained authorised by the Central Bank as at period end.
The Sub-Funds above are referred to as “Sub-Fund” or collectively “Sub-Funds” in throughout these financial
statements. The investment objectives of the active Sub-Funds are set out below:
Lyxor/WNT Fund
The investment objective of the Sub-Fund is to seek capital appreciation over the medium to long term. The Sub-Fund
seeks to achieve this objective by pursuing a diversified investment strategy (i) that does not necessarily rely upon
favourable conditions in any market, or on market direction and (ii) that trades in a number of different instruments
including debt, equity, interest rates and foreign exchange instruments. The Sub-Fund does not have any specific
geographic or industry focus.
Lyxor/Chenavari Credit Fund
The investment objective of the Sub-Fund is to (i) seek medium term capital appreciation by analysing trading and/or
investment opportunities (such as market inefficiencies where current prices do not reflect fair valuation, arbitrage situations to benefit from temporary unjustified valuation difference between maturities predominantly in credit
markets) and (ii) benefit from trends, price movements and price volatilities where the current market valuation does
not reflect the embedded value (fundamental and structural) as perceived by the sub-investment manager.
Lyxor/Wells Capital Financial Credit Fund
The investment objective of the Sub-Fund is to seek capital appreciation with superior returns over EURIBOR.
EURIBOR is based on average interest rates established by a panel of around 50 European banks that lend and
borrow from each other.
Sub-Fund Launch date Termination date
Lyxor/WNT Fund 23 January 2013 -
Lyxor/Chenavari Credit Fund 18 June 2015 -
Lyxor Evolution Fixed Income Fund 26 July 2016 28 December 2018
Kingdon Global Long-Short Equity Fund 8 August 2016 30 March 2020
Lyxor/Wells Capital Financial Credit Fund 15 September 2016 -
Lyxor/Academy Quantitative Global UCITS Fund 20 March 2019 13 January 2020
Lyxor/Marathon Emerging Markets Bond Fund 28 March 2019 -
Lyxor/Bluescale Global Equity Alpha Fund 18 December 2019 -

LYXOR NEWCITS IRL II PLC
40
NOTES TO THE FINANCIAL STATEMENTS (continued)
For the period from 1 January 2021 to 30 June 2021
1. GENERAL INFORMATION (continued)
Lyxor/Marathon Emerging Markets Bond Fund
The Sub-Fund’s investment objective is to outperform the J.P. Morgan EMBI Global Diversified Index,
the benchmark index over the medium to long term.
Lyxor/Bluescale Global Equity Alpha Fund
The Sub-Fund’s investment objective is to seek capital appreciation over the medium to long term.
All of the Sub-Funds may achieve their investment objectives by investing in financial derivative instruments
(“FDI”), which may be complex and sophisticated in nature. The detailed investment strategies of the Sub-Funds are
discussed in their respective Supplements. There can be no assurance that the Sub-Funds will achieve their investment
objectives.
2. SIGNIFICANT ACCOUNTING POLICIES
(a) Basis of preparation
These financial statements are prepared in accordance with International Financial Reporting Standards (“IFRS”) as
adopted by the European Union (“EU”), issued by the International Accounting Standards Board (IASB), and
interpretations issued by the International Financial Reporting Interpretations Committee of the IASB. Specifically,
these financial statements have been prepared in accordance with International Accounting Standard (“IAS”) 34:
Interim Financial Reporting. These financial statements are also prepared in accordance with the UCITS Regulations
and those parts of the Companies Act 2014 applicable to companies reporting under IFRS.
The comparative figures for the Statement of Financial Position relate to the year ended 31 December 2020. The
comparatives figures for the Statement of Comprehensive Income, Statement of Changes in Net Assets Attributable to Holders of Redeemable Participating Shares and Statement of Cash Flows relate to the period from 1 January 2020 to
30 June 2020.
The accounting polices applied in these financial statements are the same as those applied in the Company’s financial
statements as at and for the year ended 31 December 2020. These financial statements should be read in conjunction
with the year end financial statements. These financial statements have been prepared on a going concern basis except
for the terminated Sub-Funds, as discussed below. The Company has the resources to continue in business for the
foreseeable future.
As at 30 June 2021, following the termination of the Lyxor/Academy Quantitative Global UCITS Fund and Kingdon
Global Long-Short Equity Fund during the period and the termination of the Lyxor/Portland Hill Fund, Lyxor/Dymon Asia Macro Fund and Lyxor Evolution Fixed Income Fund in the prior years; the assets of these closed Sub-Funds
were classified as current and were stated at estimated recoverable amounts and all liabilities were classified as falling
due within one year and were stated at net settlement value, which approximated the fair value of the assets and
liabilities.
(b) Basis of aggregation
The financial statements include the aggregated assets, liabilities, revenues and expenses of the Company and its Sub-
Funds. The financial statements of the Company as a whole are presented in United States Dollar (“USD”)
(Note 2(g)(i)).
(c) Basis of measurement
The financial statements have been prepared on a historical cost basis, except for financial assets and liabilities
classified at fair value through profit or loss that have been measured at fair value.
LYXOR NEWCITS IRL II PLC
41
NOTES TO THE FINANCIAL STATEMENTS (continued)
For the period from 1 January 2021 to 30 June 2021
2. SIGNIFICANT ACCOUNTING POLICIES (continued)
(d) Use of judgment and estimates
The preparation of financial statements in conformity with IFRS as adopted by the EU, requires the use of certain
critical accounting judgment and estimates. It also requires the Board of Directors (the “Board”), based on the advice of the Investment Manager, to exercise its judgement and make estimates and assumptions that affect the application
of accounting policies and the reported amounts of assets, liabilities, income and expenses in the financial statements
and accompanying notes. Actual results could differ from those estimates. Estimates and underlying assumptions are
reviewed on an ongoing basis. Revisions to accounting estimates are recognised in the period in which the estimates
are revised and in future periods affected.
Changes in the economic environment, financial markets and any other parameters used in determining these
estimates could cause actual results to differ from those estimates materially. Key estimate relates to the
determination of fair values (Note 4).
(e) Standards, amendments and interpretations that are effective 1 January 2021 and have been adopted
by the Company
There are no standards, interpretations or amendments to existing standards that are effective that is expected to have
a significant impact on the Company.
(f) Standards, amendments and interpretations in issue that are not yet effective and have not been early
adopted by the Company
There are no standards, interpretations or amendments to existing standards that are not yet effective that is expected
to have a significant impact on the Company.
(g) Foreign currencies
(i) Functional and presentation currency
Items included in the Sub-Funds’ financial statements are measured using the currency of the primary economic
environment in which they operate (the “functional currency”). If indicators of the primary economic environment are
mixed, management uses its judgment to determine the functional currency that most faithfully represents the
economic effect of the underlying transactions, events and conditions. The USD is the functional and presentation
currency of the Sub-Funds except for the Lyxor/Portland Hill Fund which functional and presentation currency is the
Euro (“EUR”). The USD is the presentation currency of the Company.
The investment transactions are primarily denominated in the Sub-Funds’ functional currency. The expenses (including management fees, performance fees and administration fees) are denominated and paid mostly in the Sub-
Funds’ functional currency.
For the purpose of aggregating the financial statements of the Sub-Funds, the Statement of Financial Position figures
for the Lyxor/Portland Hill Fund have been translated to USD at the exchange rate ruling at the period end, while the
Statement of Comprehensive Income, Statement of Changes in Net Assets Attributable to Holders of Redeemable
Participating Shares and Statement of Cash Flows have been translated at the average exchange rate for the period.
The resulting gain or loss on translation that arises at the Company level has been presented as foreign exchange gain
or loss on translation on the Statement of Comprehensive Income and has no effect on the NAV per share attributable
to the individual Sub-Funds.
LYXOR NEWCITS IRL II PLC
42
NOTES TO THE FINANCIAL STATEMENTS (continued)
For the period from 1 January 2021 to 30 June 2021
2. SIGNIFICANT ACCOUNTING POLICIES (continued)
(g) Foreign currencies (continued)
(ii) Foreign currency transactions
Monetary assets and liabilities denominated in currencies other than the Sub-Funds’ functional currencies are
translated into their functional currencies at the closing rates of exchange at each period end. Transactions during the
period, including purchases and sales of securities, income and expenses, are translated at the rate of exchange
prevailing on the date of the transaction. Foreign currency translation gains and losses on investments are included in
net gain/(loss) on financial assets and liabilities at fair value through profit or loss in the Statement of Comprehensive
Income. Other foreign exchange differences on cash and cash equivalents, if any, are included within net gain/(loss)
on foreign exchange in the Statement of Comprehensive Income.
Non-monetary items that are measured in terms of historical cost in a foreign currency are translated in the Sub-
Funds’ functional currencies using the exchange rates as at the dates of the initial transactions. Non-monetary items
measured at fair value in a foreign currency are translated using the exchange rates at the date when the fair value was determined.
(h) Financial instruments
(i) Classification
In accordance with IFRS 9, Financial Instruments, (“IFRS 9”) the Company classifies its financial assets and financial
liabilities at initial recognition into the categories of financial assets and financial liabilities discussed below.
Financial assets
The Company classifies its financial assets as subsequently measured at fair value through profit or loss (“FVTPL”)
or measured at amortised cost on the basis of both:
(a) The Company’s business model for managing the financial assets
(b) The contractual cash flow characteristics of the financial asset
Financial assets measured at FVTPL
A financial asset is measured at FVTPL if any of the following is met:
(a) Its contractual terms do not give rise to cash flows on specified dates that are solely payments of principal
and interest (SPPI) on the principal amount outstanding
(b) It is not held within a business model whose objective is either to collect contractual cash flows, or to both
collect contractual cash flows and sell
(c) At initial recognition, it is irrevocably designated as measured at FVTPL when doing so eliminates or
significantly reduces a measurement or recognition inconsistency that would otherwise arise from measuring
assets or liabilities or recognising the gains and losses on them on different bases.
The Company includes in this category equity securities and debt securities which are acquired principally for the
purpose of generating a profit from short-term fluctuations in price. Debt securities include investments that are held
under a business model to manage them on a fair value basis for investment income and fair value gains. The
collection of contractual cash flows from debt securities is only incidental to achieving the Company’s business model’s objective. This category also includes derivative contracts in an asset position. The equity securities, debt
securities and derivative contracts are held for trading and therefore classified mandatorily at FVTPL.
LYXOR NEWCITS IRL II PLC
43
NOTES TO THE FINANCIAL STATEMENTS (continued)
For the period from 1 January 2021 to 30 June 2021
2. SIGNIFICANT ACCOUNTING POLICIES (continued)
(h) Financial instruments (continued)
(i) Classification (continued)
Financial assets measured at amortised cost
A financial asset is measured at amortised cost if it is held within a business model whose objective is to hold
financial assets in order to collect contractual cash flows and its contractual terms give rise on specified dates to cash
flows that are solely payments of principal and interest on the principal amount outstanding.
The Company includes in this category cash and cash equivalents, due from brokers and other short-term receivables.
Their carrying value, measured at amortised cost less any expected loss, is an approximation of fair value given their
short-term nature.
Financial liabilities
Financial liabilities measured at FVTPL
A financial liability is measured at FVTPL if it meets the definition of held for trading. The Company includes in this
category, equity securities and debt securities sold short, if any, and derivative contracts in a liability position as they
are classified as held for trading. The Company also includes its redeemable participating shares in this category. The Company’s accounting policy regarding the redeemable participating shares is described in Note 2(m).
Financial liabilities measured at amortised cost
This category includes all financial liabilities other than those measured at fair value through profit or loss. The
Company includes in this category bank overdraft, due to brokers and other short-term payables. Their carrying value,
measured at amortised cost, is an approximation of fair value given their short-term nature.
(ii) Recognition and initial measurement
Financial assets and liabilities at fair value through profit and loss are recognised initially on the trade date at which
the Company becomes a party to contracted provisions of the instruments. Other financial assets and liabilities are recognised on the date they originated.
Financial assets and liabilities at fair value though profit or loss are measured initially at fair value, with transaction
costs recognised in the profit and loss. Financial assets or financial liabilities not at fair value through profit and loss
are measured initially at fair value plus transaction costs that are directly attributable to its acquisition or issue.
(iii) Subsequent measurement
After initial measurement, the Company measures financial instruments which are classified as at fair value through
profit or loss at fair value (Note 4).
Subsequent changes in the fair value of those financial instruments are recorded in net gain or loss on financial assets
and liabilities at FVTPL in the Statement of Comprehensive Income. Dividend income or expense and interest income
or expense on financial assets and liabilities at FVTPL are presented separately in the Statement of Comprehensive
Income.
(iv) Derecognition
A financial asset is derecognised when the Company no longer has control over the contractual rights that comprise
that asset. This occurs when the contractual rights to the cash flow from the asset expire or when it transfers the rights
to receive the contractual cash flows in a transaction in which substantially all of the risks and rewards of ownership
of the financial asset are transferred or in which the Company neither transfers nor retains substantially all of the risks
and rewards of ownership and does not retain control of the financial asset. A financial liability is derecognised when it is extinguished or when the obligation specified in the contract is discharged, cancelled or expired.
LYXOR NEWCITS IRL II PLC
44
NOTES TO THE FINANCIAL STATEMENTS (continued)
For the period from 1 January 2021 to 30 June 2021
2. SIGNIFICANT ACCOUNTING POLICIES (continued)
(h) Financial instruments (continued)
(v) Impairment of financial assets measured at amortised cost
The Company holds financial assets at amortised cost, with no financing component and which have maturities of less
than 12 months and as such, has chosen to apply the simplified approach for expected credit losses (ECLs) under
IFRS 9 to all its financial assets at amortised cost. Therefore, the Company does not track changes in credit risk, but instead, recognises a loss allowance based on lifetime ECLs at each reporting date.
The Company’s approach to ECLs reflects a probability-weighted outcome, the time value of money and reasonable
and supportable information that is available without undue cost or effort at the reporting date about past events,
current conditions and forecasts of future economic conditions. The Company assesses the ECLs of groups of
financial assets based on days past due and similar loss patterns. Any historical observed loss rates are adjusted for
forward-looking estimates and applied over the expected life of the financial assets (Refer to Note 10, Credit risk
section).
(i) Cash and cash equivalents/Bank overdrafts
Cash comprises cash deposits on demand. Cash equivalents are short term, highly liquid investments that are readily
convertible to known amounts of cash and which are subject to insignificant changes in value, and are held for the
purpose of meeting short-term cash commitments rather than for investments or other purposes, with original
maturities of three months or less. Bank overdrafts are shown as liabilities in the Statement of Financial Position.
(j) Due from/to brokers
Due from brokers include margin accounts and receivables for securities sold (in a regular way transaction) that have
been contracted for but not yet delivered on the Statement of Financial Position date. Margin accounts represent cash
deposits held with brokers as collateral against open derivative contracts.
Due to brokers include margin accounts and payables for securities purchased (in a regular way transaction) that have been contracted for but not yet settled on the Statement of Financial Position date. Margin accounts represent cash
from brokers for derivative contracts.
These amounts are recognised initially at fair value and subsequently measured at amortised cost less impairment for
due from brokers account, if any, at period end.
(k) Subscriptions receivable and redemptions payable
Subscriptions receivable represents subscriptions where shares have been issued but cash has yet been received from
the investor. Redemptions payable represents redemptions where shares have been redeemed but cash has yet been
paid to investor. Subscriptions receivable and redemptions payable are presented in the Statement of Financial Position.
(l) Net asset value per redeemable participating share
The net asset value (“NAV”) per share disclosed on the Statement of Financial Position is calculated, in accordance
with IFRS as adopted by the EU and the Company’s Prospectus and Supplements, by dividing the net assets
attributable to each share class by the number of redeemable participating shares outstanding at period end.
Subscriber shares do not have a residual interest in the net assets of the Company and therefore do not affect the
calculation of the NAV per redeemable participating share of the Sub-Funds.

LYXOR NEWCITS IRL II PLC
45
NOTES TO THE FINANCIAL STATEMENTS (continued)
For the period from 1 January 2021 to 30 June 2021
2. SIGNIFICANT ACCOUNTING POLICIES (continued)
(m) Redeemable participating shares
Redeemable participating shares are redeemable at the shareholder’s option and are classified as financial liabilities in
accordance with IAS 32, Financial Instruments: Presentation. Redeemable participating shares are issued and redeemed at prices based on the Sub-Funds’ NAV per redeemable participating share at the time of issue or
redemption.
Redeemable participating shares are redeemable daily for the Lyxor/WNT Fund, Kingdon Global Long-Short Equity
Fund, Lyxor/Wells Capital Financial Credit Fund, Lyxor/Academy Quantitative Global UCITS Fund,
Lyxor/Marathon Emerging Markets Bond Fund and Lyxor/Bluescale Global Equity Alpha Fund and weekly for
Lyxor/Chenavari Credit Fund.
(n) Distribution to shareholders
Dividend distribution to the shareholders is recognised as a liability in the financial statements in the period in which the dividends are declared.
It is not intended to declare any dividends in respect of any issued share classes of the Sub-Funds.
(o) Realised and unrealised gains and losses
All realised and unrealised gains and losses from fair value changes and foreign exchange differences on investments
are recognised on a first-in-first-out basis and included within net gain/(loss) on financial assets and liabilities at fair
value through profit or loss in the Statement of Comprehensive Income.
(p) Interest income and expense, and interest on financial assets and liabilities at fair value through profit
or loss
Interest is recognised on a time-proportionate basis using the effective interest method.
Interest income and expense include interest from cash and cash equivalents. Interest on financial assets and liabilities
at fair value through profit or loss includes interest from debt securities and derivatives.
(q) Dividend income and expense Dividend income is recognised when the right to receive payment is established and presented in the Statement of
Comprehensive Income on the dates on which the relevant securities are listed as “ex-dividend”. Dividend income is
shown gross of any withholding taxes, which are disclosed separately in the Statement of Comprehensive Income.
Dividend expense on equity derivatives is disclosed separately in the Statement of Comprehensive Income.
(r) Transaction costs
Transaction costs are costs incurred to acquire financial assets and liabilities at fair value through profit or loss. These
include broker charges and commission. Transaction costs, when incurred, are immediately recognised in profit or loss as an expense. Transaction costs relating to certain derivatives are impracticable to identify and are included in
the cost of derivatives.
LYXOR NEWCITS IRL II PLC
46
NOTES TO THE FINANCIAL STATEMENTS (continued)
For the period from 1 January 2021 to 30 June 2021
2. SIGNIFICANT ACCOUNTING POLICIES (continued)
(s) Offsetting financial instruments
Financial assets and liabilities are offset and the net amount reported in the Statement of Financial Position when
there is a legally enforceable right to set off the recognised amounts and there is an intention to settle on a net basis, or realise the asset and settle the liability simultaneously. The legally enforceable right must not be contingent on
future events and must be enforceable in the normal course of business and in the event of default, insolvency or
bankruptcy of the company or the counterparty.
(t) Taxation
Under current law and practice, the Company qualifies as an investment undertaking as defined in Section 739B of
the Taxes Consolidation Act 1997, as amended. On that basis, it is not chargeable to Irish tax on its income or gains.
However, Irish tax may arise on the happening of a “chargeable event”. A chargeable event includes any distribution
payments to shareholder or any encashment, redemption, cancellation or transfer of shares and the holding of shares at the end of each eight year period beginning with the acquisition of such shares.
No Irish tax will arise on the Company in respect of chargeable events in respect of:
• A shareholder who is neither Irish resident and not ordinarily resident in Ireland for tax purposes, at the time
of the chargeable event, provided appropriate valid declarations in accordance with the provisions of the
Taxes Consolidation Act 1997, as amended, are held by the Company; or the Company has been authorised
by the Irish Revenue to make gross payments in the absence of appropriate declarations and;
• Certain exempted Irish tax resident shareholders who have provided the Company with the necessary signed
statutory declarations.
Dividends, interest and capital gains (if any) received on investments made by the Company may be subject to taxes
imposed by the country from which the investment income/gains are received and such taxes may not be recoverable
by the Company or its shareholders.
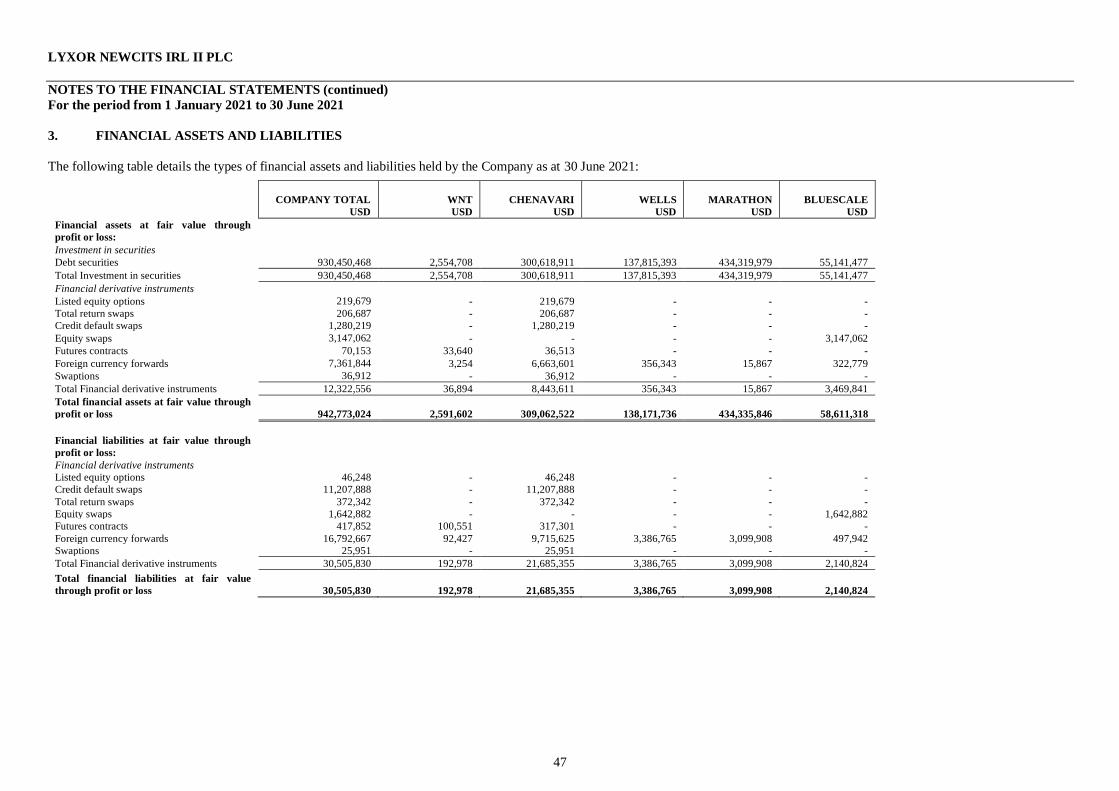
LYXOR NEWCITS IRL II PLC
47
NOTES TO THE FINANCIAL STATEMENTS (continued)
For the period from 1 January 2021 to 30 June 2021
3. FINANCIAL ASSETS AND LIABILITIES
The following table details the types of financial assets and liabilities held by the Company as at 30 June 2021:
COMPANY TOTAL
USD
WNT
USD
CHENAVARI
USD
WELLS
USD
MARATHON
USD
BLUESCALE
USD
Financial assets at fair value through
profit or loss:
Investment in securities
Debt securities 930,450,468 2,554,708 300,618,911 137,815,393 434,319,979 55,141,477
Total Investment in securities 930,450,468 2,554,708 300,618,911 137,815,393 434,319,979 55,141,477
Financial derivative instruments
Listed equity options 219,679 - 219,679 - - -
Total return swaps 206,687 - 206,687 - - -
Credit default swaps 1,280,219 - 1,280,219 - - -
Equity swaps 3,147,062 - - - - 3,147,062
Futures contracts 70,153 33,640 36,513 - - -
Foreign currency forwards 7,361,844 3,254 6,663,601 356,343 15,867 322,779
Swaptions 36,912 - 36,912 - - -
Total Financial derivative instruments 12,322,556 36,894 8,443,611 356,343 15,867 3,469,841
Total financial assets at fair value through
profit or loss 942,773,024 2,591,602 309,062,522 138,171,736 434,335,846 58,611,318
Financial liabilities at fair value through
profit or loss:
Financial derivative instruments
Listed equity options 46,248 - 46,248 - - -
Credit default swaps 11,207,888 - 11,207,888 - - -
Total return swaps 372,342 - 372,342 - - -
Equity swaps 1,642,882 - - - - 1,642,882
Futures contracts 417,852 100,551 317,301 - - -
Foreign currency forwards 16,792,667 92,427 9,715,625 3,386,765 3,099,908 497,942
Swaptions 25,951 - 25,951 - - -
Total Financial derivative instruments 30,505,830 192,978 21,685,355 3,386,765 3,099,908 2,140,824
Total financial liabilities at fair value
through profit or loss 30,505,830 192,978 21,685,355 3,386,765 3,099,908 2,140,824
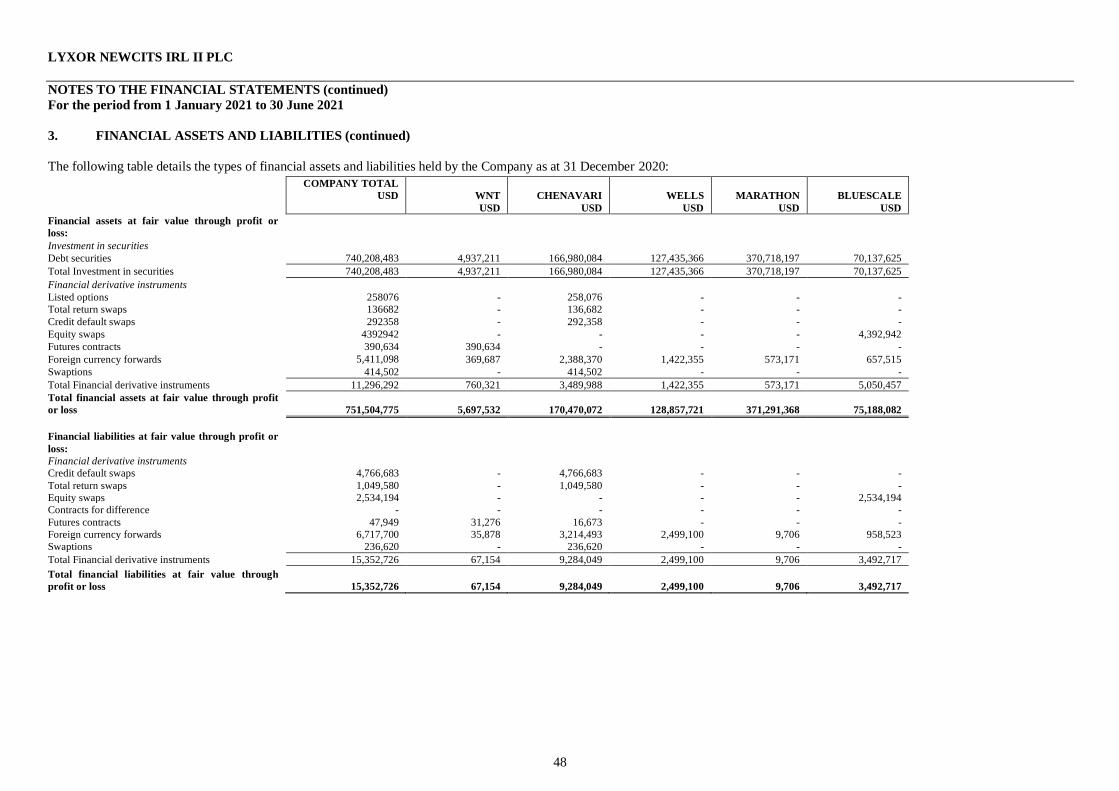
LYXOR NEWCITS IRL II PLC
48
NOTES TO THE FINANCIAL STATEMENTS (continued)
For the period from 1 January 2021 to 30 June 2021
3. FINANCIAL ASSETS AND LIABILITIES (continued)
The following table details the types of financial assets and liabilities held by the Company as at 31 December 2020: COMPANY TOTAL
USD WNT
USD
CHENAVARI
USD
WELLS
USD
MARATHON
USD
BLUESCALE
USD
Financial assets at fair value through profit or
loss:
Investment in securities
Debt securities 740,208,483 4,937,211 166,980,084 127,435,366 370,718,197 70,137,625
Total Investment in securities 740,208,483 4,937,211 166,980,084 127,435,366 370,718,197 70,137,625
Financial derivative instruments
Listed options 258076 - 258,076 - - -
Total return swaps 136682 - 136,682 - - -
Credit default swaps 292358 - 292,358 - - -
Equity swaps 4392942 - - - - 4,392,942
Futures contracts 390,634 390,634 - - - -
Foreign currency forwards 5,411,098 369,687 2,388,370 1,422,355 573,171 657,515
Swaptions 414,502 - 414,502 - - -
Total Financial derivative instruments 11,296,292 760,321 3,489,988 1,422,355 573,171 5,050,457
Total financial assets at fair value through profit
or loss 751,504,775 5,697,532 170,470,072 128,857,721 371,291,368 75,188,082
Financial liabilities at fair value through profit or
loss:
Financial derivative instruments
Credit default swaps 4,766,683 - 4,766,683 - - -
Total return swaps 1,049,580 - 1,049,580 - - -
Equity swaps 2,534,194 - - - - 2,534,194
Contracts for difference - - - - - -
Futures contracts 47,949 31,276 16,673 - - -
Foreign currency forwards 6,717,700 35,878 3,214,493 2,499,100 9,706 958,523
Swaptions 236,620 - 236,620 - - -
Total Financial derivative instruments 15,352,726 67,154 9,284,049 2,499,100 9,706 3,492,717
Total financial liabilities at fair value through
profit or loss 15,352,726 67,154 9,284,049 2,499,100 9,706 3,492,717
LYXOR NEWCITS IRL II PLC
49
NOTES TO THE FINANCIAL STATEMENTS (continued)
For the period from 1 January 2021 to 30 June 2021
4. FAIR VALUE ESTIMATION
The Company adopted a hierarchical disclosure framework which prioritises and ranks the level of market price
observability used in measuring investments at fair value. Market price observability is impacted by a number of
factors, including the type of investment and the characteristics specific to the investment. Investments with readily
available active quoted prices or for which fair value can be measured from actively quoted prices generally will have a higher degree of market price observability and a lesser degree of judgment used in measuring fair value.
The fair value hierarchy has the following levels as defined by IFRS 13, Fair Value Measurement:
Level 1 - Quoted market price
Quoted prices are available in active markets for identical investments from market sources as of the reporting date.
When fair values of listed equity and debt securities as well as publicly traded derivatives at 31 December 2019 and
31 December 2018 are based on quoted market prices or binding dealer price quotations, without any deduction for
transaction costs, the instruments are included in Level 1 of the hierarchy.
Level 2 - Valuation technique using observable inputs
Inputs other than quoted prices included within Level 1 that are observable for the asset or liability, either directly
(that is, as prices) or indirectly (that is derived from prices).
Level 3 - Valuation technique with significant unobservable inputs
Pricing inputs are unobservable for the investment and includes situations where there is little, if any, market activity
for the investment. The inputs into the determination of fair value require significant judgment or estimation.
For all other financial instruments, fair value is determined using valuation techniques including the models
developed internally by the independent Administrator and broker quotes. In instances where the Administrator, in the opinion of the Sub-Fund’s portfolio manager, has been unable to obtain a fair value price, the Investment Manager
determines the fair value of such financial instruments.
In certain cases, the inputs used to measure fair value may fall into different levels of the fair value hierarchy. In such
cases, an investment’s level within the fair value hierarchy is based on the lowest level of input that is significant to
the fair value measurement. The assessment of the significance of a particular input to the fair value measurement in
its entirety requires judgment, and considers factors specific to the investment. Changes in the observability of
valuation inputs may result in a reclassification for certain financial assets or liabilities.
The Company invests in debt securities for which transactions may not occur on a regular basis. Investments in the
debt securities are valued based on quoted market prices or binding dealer price quotations without any deduction for transaction costs.
Transfers between different levels of the fair value hierarchy are deemed to have occurred as of the beginning of the
reporting period.

LYXOR NEWCITS IRL II PLC
50
NOTES TO THE FINANCIAL STATEMENTS (continued)
For the period from 1 January 2021 to 30 June 2021
4. FAIR VALUE ESTIMATION (continued)
The following tables analyse within the fair value hierarchy the Sub-Funds’ financial assets and liabilities measured at
fair value as at period end:
Lyxor/WNT Fund
30 June 2021 Level 1 Level 2 Level 3 Total
USD USD USD USD
Financial assets at fair value through
profit or loss: Investment in securities
Debt securities 2,554,708 - - 2,554,708
Financial derivative instruments
Futures contracts 33,640 - - 33,640
Foreign currency forwards - 3,254 - 3,254
Total financial assets at fair value
through profit or loss 2,588,348 3,254 - 2,591,602
Financial liabilities at fair value
through profit or loss:
Financial derivative instruments
Futures contracts 100,551 - - 100,551
Foreign currency forwards - 92,427 - 92,427
Total financial liabilities at fair value
through profit or loss 100,551 92,427 - 192,978
31 December 2020 Level 1 Level 2 Level 3 Total
USD USD USD USD
Financial assets at fair value through
profit or loss: Investment in securities
Debt securities 4,937,211 - - 4,937,211
Financial derivative instruments
Futures contracts 390,634 - - 390,634
Foreign currency forwards - 369,687 - 369,687
Total financial assets at fair value
through profit or loss 5,327,845 369,687 - 5,697,532
Financial liabilities at fair value
through profit or loss:
Financial derivative instruments
Futures contracts 31,276 - - 31,276
Foreign currency forwards - 35,878 - 35,878
Total financial liabilities at fair value
through profit or loss 31,276 35,878 - 67,154
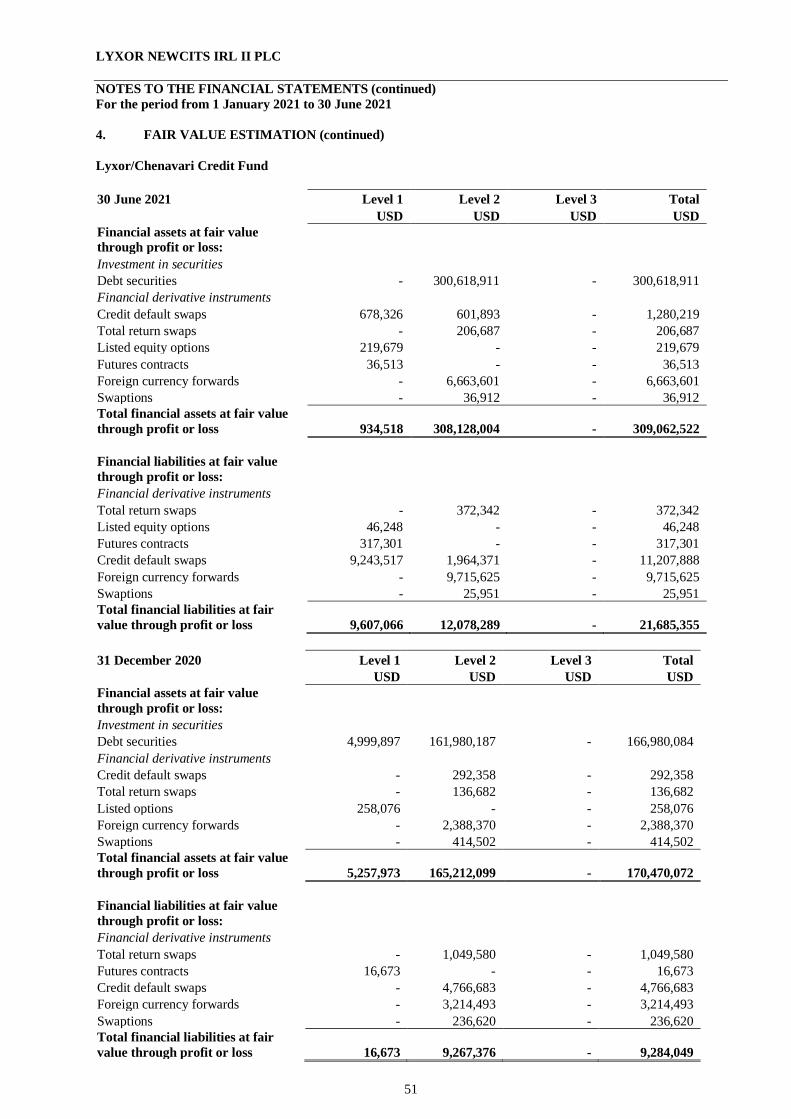
LYXOR NEWCITS IRL II PLC
51
NOTES TO THE FINANCIAL STATEMENTS (continued)
For the period from 1 January 2021 to 30 June 2021
4. FAIR VALUE ESTIMATION (continued)
Lyxor/Chenavari Credit Fund
30 June 2021 Level 1 Level 2 Level 3 Total
USD USD USD USD
Financial assets at fair value
through profit or loss: Investment in securities
Debt securities - 300,618,911 - 300,618,911
Financial derivative instruments
Credit default swaps 678,326 601,893 - 1,280,219
Total return swaps - 206,687 - 206,687
Listed equity options 219,679 - - 219,679
Futures contracts 36,513 - - 36,513
Foreign currency forwards - 6,663,601 - 6,663,601
Swaptions - 36,912 - 36,912
Total financial assets at fair value
through profit or loss 934,518 308,128,004 - 309,062,522
Financial liabilities at fair value
through profit or loss:
Financial derivative instruments
Total return swaps - 372,342 - 372,342
Listed equity options 46,248 - - 46,248
Futures contracts 317,301 - - 317,301
Credit default swaps 9,243,517 1,964,371 - 11,207,888
Foreign currency forwards - 9,715,625 - 9,715,625
Swaptions - 25,951 - 25,951
Total financial liabilities at fair
value through profit or loss 9,607,066 12,078,289 - 21,685,355
31 December 2020 Level 1 Level 2 Level 3 Total
USD USD USD USD
Financial assets at fair value
through profit or loss: Investment in securities
Debt securities 4,999,897 161,980,187 - 166,980,084
Financial derivative instruments
Credit default swaps - 292,358 - 292,358
Total return swaps - 136,682 - 136,682
Listed options 258,076 - - 258,076
Foreign currency forwards - 2,388,370 - 2,388,370
Swaptions - 414,502 - 414,502
Total financial assets at fair value
through profit or loss 5,257,973 165,212,099 - 170,470,072
Financial liabilities at fair value
through profit or loss:
Financial derivative instruments
Total return swaps - 1,049,580 - 1,049,580
Futures contracts 16,673 - - 16,673
Credit default swaps - 4,766,683 - 4,766,683
Foreign currency forwards - 3,214,493 - 3,214,493
Swaptions - 236,620 - 236,620
Total financial liabilities at fair
value through profit or loss 16,673 9,267,376 - 9,284,049

LYXOR NEWCITS IRL II PLC
52
NOTES TO THE FINANCIAL STATEMENTS (continued)
For the period from 1 January 2021 to 30 June 2021
4. FAIR VALUE ESTIMATION (continued)
NOTES TO THE FINANCIAL STATEMENTS (continued)
For the period from 1 January 2021 to 30 June 2021
4. FAIR VALUE ESTIMATION (continued)
Lyxor/Wells Capital Financial Credit Fund
30 June 2021 Level 1 Level 2 Level 3 Total
USD USD USD USD
Financial assets at fair value
through profit or loss: Investment in securities
Debt securities - 137,815,393 - 137,815,393
Financial derivative instruments
Foreign currency forwards - 356,343 - 356,343
Total financial assets at fair value
through profit or loss - 138,171,736 - 138,171,736
Financial liabilities at fair value
through profit or loss:
Financial derivative instruments
Foreign currency forwards - 3,386,765 - 3,386,765
Total financial liabilities at fair
value through profit or loss - 3,386,765 - 3,386,765
31 December 2020 Level 1 Level 2 Level 3 Total
USD USD USD USD
Financial assets at fair value
through profit or loss: Investment in securities
Debt securities - 127,435,366 - 127,435,366
Financial derivative instruments
Foreign currency forwards - 1,422,355 - 1,422,355
Total financial assets at fair value
through profit or loss - 128,857,721 - 128,857,721
Financial liabilities at fair value
through profit or loss:
Financial derivative instruments
Foreign currency forwards - 2,499,100 - 2,499,100
Total financial liabilities at fair
value through profit or loss - 2,499,100 - 2,499,100
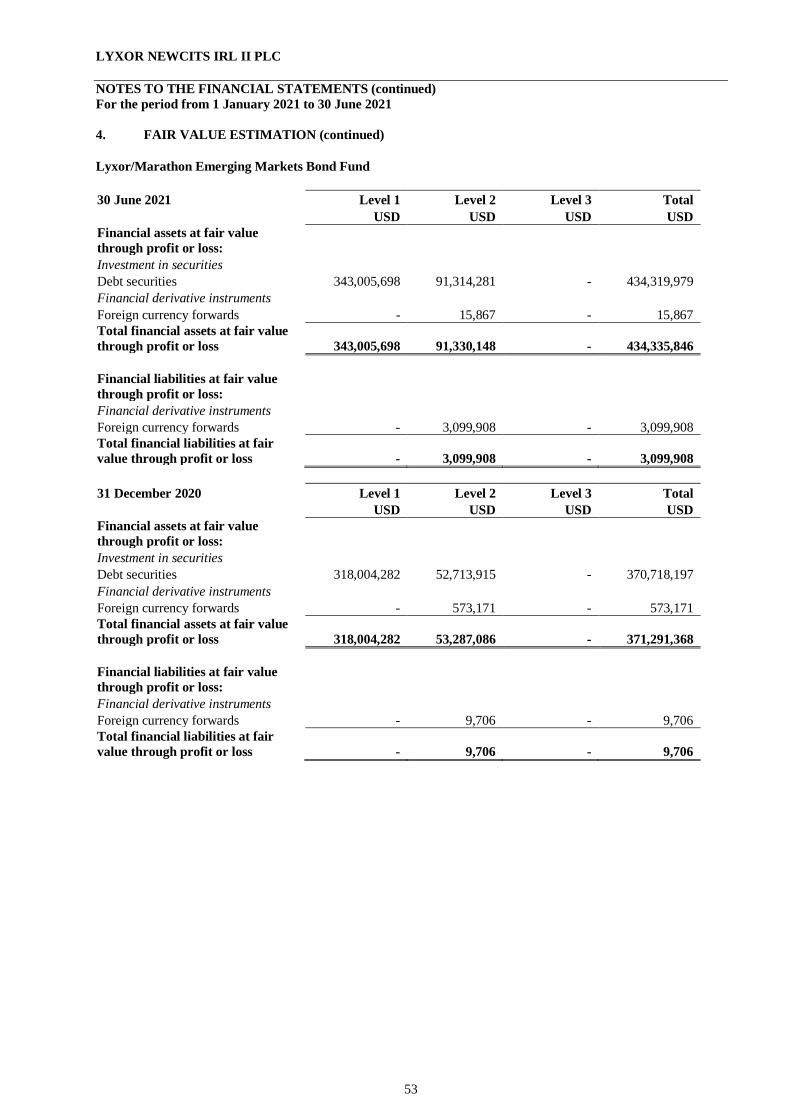
LYXOR NEWCITS IRL II PLC
53
NOTES TO THE FINANCIAL STATEMENTS (continued)
For the period from 1 January 2021 to 30 June 2021
4. FAIR VALUE ESTIMATION (continued)
Lyxor/Marathon Emerging Markets Bond Fund
30 June 2021 Level 1 Level 2 Level 3 Total
USD USD USD USD
Financial assets at fair value
through profit or loss: Investment in securities
Debt securities 343,005,698 91,314,281 - 434,319,979
Financial derivative instruments
Foreign currency forwards - 15,867 - 15,867
Total financial assets at fair value
through profit or loss 343,005,698 91,330,148 - 434,335,846
Financial liabilities at fair value
through profit or loss:
Financial derivative instruments
Foreign currency forwards - 3,099,908 - 3,099,908
Total financial liabilities at fair
value through profit or loss - 3,099,908 - 3,099,908
31 December 2020 Level 1 Level 2 Level 3 Total
USD USD USD USD
Financial assets at fair value
through profit or loss: Investment in securities
Debt securities 318,004,282 52,713,915 - 370,718,197
Financial derivative instruments
Foreign currency forwards - 573,171 - 573,171
Total financial assets at fair value
through profit or loss 318,004,282 53,287,086 - 371,291,368
Financial liabilities at fair value
through profit or loss:
Financial derivative instruments
Foreign currency forwards - 9,706 - 9,706
Total financial liabilities at fair
value through profit or loss - 9,706 - 9,706

LYXOR NEWCITS IRL II PLC
54
NOTES TO THE FINANCIAL STATEMENTS (continued)
For the period from 1 January 2021 to 30 June 2021
4. FAIR VALUE ESTIMATION (continued)
Lyxor/Bluescale Global Equity Alpha Fund
30 June 2021 Level 1 Level 2 Level 3 Total
USD USD USD USD
Financial assets at fair value
through profit or loss: Investment in securities
Debt securities 55,141,477 - - 55,141,477
Financial derivative instruments
Equity swaps - 3,147,062 - 3,147,062
Foreign currency forwards - 322,779 - 322,779
Total financial assets at fair value
through profit or loss 55,141,477 3,469,841 - 58,611,318
Financial liabilities at fair value
through profit or loss:
Financial derivative instruments
Equity swaps - 1,642,882 - 1,642,882
Foreign currency forwards - 497,942 - 497,942
Total financial liabilities at fair
value through profit or loss - 2,140,824 - 2,140,824
31 December 2020 Level 1 Level 2 Level 3 Total
USD USD USD USD
Financial assets at fair value
through profit or loss: Investment in securities
Debt securities 70,137,625 - - 70,137,625
Financial derivative instruments
Equity swaps - 4,392,942 - 4,392,942
Foreign currency forwards - 657,515 - 657,515
Total financial assets at fair value
through profit or loss 70,137,625 5,050,457 - 75,188,082
Financial liabilities at fair value
through profit or loss:
Financial derivative instruments
Equity swaps - 2,534,194 - 2,534,194
Foreign currency forwards - 958,523 - 958,523
Total financial liabilities at fair
value through profit or loss - 3,492,717 - 3,492,717

LYXOR NEWCITS IRL II PLC
55
NOTES TO THE FINANCIAL STATEMENTS (continued)
For the period from 1 January 2021 to 30 June 2021
5. GAINS AND LOSSES ON FINANCIAL ASSETS AND LIABILITIES
The following table details the gains and losses on financial assets and liabilities for the period ended 30 June 2021:
COMPANY
TOTAL WNT CHENAVARI EVOLUTION(1)
USD USD USD USD
Net realised gain/(loss) on investments in securities
14,703,006
13,152
10,953,045 -
Net change in unrealised gain/(loss) on investments in
securities
(22,052,667)
(512)
(9,114,074) -
Net realised gain/(loss) on financial derivative
instruments
(6,419,813)
513,832
(1,048,156) -
Net change in unrealised gain/(loss) on financial
derivative instruments
98,597
(421,265)
882,835 -
Net realised gain/(loss) on forward currency contracts* 1,250,921
196,161 (1,681,957) -
Net change in unrealised gain/(loss) on forward currency
contracts*
(8,124,220)
(422,981)
(2,225,901) -
Net gain/(loss) on financial assets and liabilities
at fair value through profit or loss
(20,544,176)
(121,613)
(2,234,208) -
Net realised gain/(loss) on foreign exchange
1,049,341
(63,230)
726,042 -
Net change in unrealised gain/(loss) on foreign exchange (110,876)
42,651 (173,846) -
Net gain/(loss) on foreign exchange
938,465
(20,579)
552,196 -
WELLS ACADEMY(2) MARATHON BLUESCALE
USD USD USD USD
Net realised gain/(loss) on investments in securities 3,022,435 - 542,552 171,822
Net change in unrealised gain/(loss) on investments in
securities (2,434,183) - (10,499,300) (4,598)
Net realised gain/(loss) on financial derivative
instruments (279,389) - - (5,606,100)
Net change in unrealised gain/(loss) on financial
derivative instruments - - - (362,973)
Net realised gain/(loss) on forward currency contracts* 418,067 - 2,515,631 (196,981)
Net change in unrealised gain/(loss) on forward currency
contracts* (1,953,678) - (3,647,507) 125,847
Net gain/(loss) on financial assets and liabilities
at fair value through profit or loss (1,226,748) - (11,088,624) (5,872,983)
Net realised gain/(loss) on foreign exchange 173,277 - 202,948 10,304
Net change in unrealised gain/(loss) on foreign exchange 12,390 - 7,388 541
Net gain/(loss) on foreign exchange 185,667 - 210,336 10,845
*The above gains/(losses) on forward currency contracts includes those related to foreign exchange contracts placed for share class hedging purposes.
(1) Lyxor Evolution Fixed Income Fund: Terminated on 28 December 2018. (2) Lyxor/Academy Quantitative Global UCITS Fund: Terminated on 13 January 2020.

LYXOR NEWCITS IRL II PLC
56
NOTES TO THE FINANCIAL STATEMENTS (continued)
For the period from 1 January 2021 to 30 June 2021
5. GAINS AND LOSSES ON FINANCIAL ASSETS AND LIABILITIES (continued)
The following table details the gains and losses on financial assets and liabilities for the period ended 30 June 2020:
COMPANY
TOTAL WNT CHENAVARI EVOLUTION(1) KINGDON(3)
USD USD USD USD USD
Net realised gain/(loss) on investments in securities
(1,497,030) 2,355,159 4,966,278 - (4,773,960)
Net change in unrealised gain/(loss) on investments in
securities
(12,556,921) (1,427,215) (1,632,154) - (2,432,815)
Net realised gain/(loss) on financial derivative
instruments
(5,088,949) (5,408,360) 5,929,726 - (883,355)
Net change in unrealised gain/(loss) on financial
derivative instruments
1,614,603 4,592,540 (1,492,549) - (266,496)
Net realised gain/(loss) on forward currency contracts*
(7,201,266) (7,313,575) (764,556) - 53,537
Net change in unrealised gain/(loss) on forward
currency contracts*
(4,731,209) (4,267,054) (216,198) - 15,767
Net gain/(loss) on financial assets and liabilities
at fair value through profit or loss
(29,460,772)
(11,468,505) 6,790,547 - (8,287,322)
-
Net realised gain/(loss) on foreign exchange
(3,416,899) (2,357,090) 3,618 - 2,834
Net change in unrealised gain/(loss) on foreign
exchange
(235,019) (124,236) (110,364) - 933
Net gain/(loss) on foreign exchange
(3,651,918) (2,481,326) (106,746) - 3,767
WELLS ACADEMY(2) MARATHON BLUESCALE
USD USD USD USD
Net realised gain/(loss) on investments in securities (4,003,189) 99,797 (4,099,206) 3,958,091
Net change in unrealised gain/(loss) on investments in
securities (7,698,791) (99,771) (2,105,779) 2,839,604
Net realised gain/(loss) on financial derivative
instruments (1,127,659) 11 - (3,599,312)
Net change in unrealised gain/(loss) on financial
derivative instruments (1,882) - - (1,217,010)
Net realised gain/(loss) on forward currency contracts* 949,564 2,053 (428,848) 300,559
Net change in unrealised gain/(loss) on forward
currency contracts* 123,311 (4,249) (181,299) (201,487)
Net gain/(loss) on financial assets and liabilities
at fair value through profit or loss (11,758,646) (2,159) (6,815,132) 2,080,445
Net realised gain/(loss) on foreign exchange (1,008,240) (454) (81,131) 23,564
Net change in unrealised gain/(loss) on foreign
exchange (725) (1,514) 819 68
Net gain/(loss) on foreign exchange (1,008,965) (1,968) (80,312) 23,632
*The above gains/(losses) on forward currency contracts includes those related to foreign exchange contracts placed for share class hedging purposes.
(1)Lyxor Evolution Fixed Income Fund: Terminated on 28 December 2018. (2)Lyxor/Academy Quantitative Global UCITS Fund: Terminated on 13 January 2020. Includes gains and losses post termination
(3)Lyxor/Kingdon Global Long-Short Equity Fund: Terminated on 30 March 2020.

LYXOR NEWCITS IRL II PLC
57
NOTES TO THE FINANCIAL STATEMENTS (continued)
For the period from 1 January 2021 to 30 June 2021
6. FEES AND EXPENSES PAYABLE
The following table details the fees and expenses payable as at 30 June 2021:
COMPANY
TOTAL WNT CHENAVARI EVOLUTION WELLS
USD USD USD USD USD
Administration fees payable 441,091 132,846 188,976 - 29,386
Management fees payable 2,096,776 15,982 1,085,623 - 318,426
Performance fees payable 1,552,976 1,113 1,550,162 - -
Other payables and accrued
expenses 261,713 92,700 7,997 119,436 -
Total 4,352,556 242,641 2,832,758 119,436 347,812
ACADEMY MARATHON BLUESCALE
USD USD USD
Administration fees payable - 71,601 18,282
Management fees payable - 613,330 63,415
Performance fees payable - - 1,701
Other payables and accrued
expenses 41,580 - -
Total 41,580 684,931 83,398
The following table details the fees and expenses payable as at 31 December 2020:
COMPANY
TOTAL WNT CHENAVARI EVOLUTION WELLS
USD USD USD USD USD
Administration fees payable 1,025,221 230,936 290,797 - 128,376
Management fees payable 1,807,402 26,482 794,432 - 339,175
Performance fees payable 3,797,354 213,437 3,244,397 - -
Other payables and accrued
expenses 256,453 95,492 - 119,434 -
Total 6,886,430 566,347 4,329,626 119,434 467,551
ACADEMY MARATHON BLUESCALE
USD USD USD
Administration fees payable - 284,510 90,602
Management fees payable - 574,784 72,529
Performance fees payable - - 339,520
Other payables and accrued
expenses 41,527 - -
Total 41,527 859,294 502,651
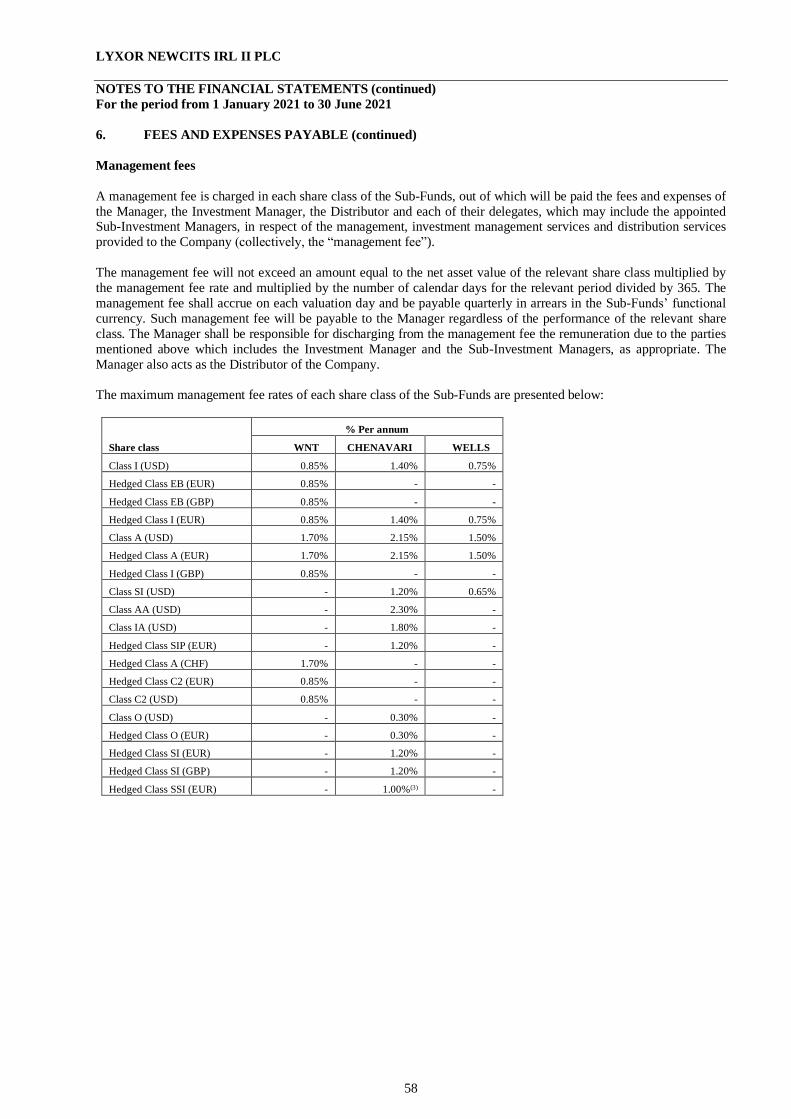
LYXOR NEWCITS IRL II PLC
58
NOTES TO THE FINANCIAL STATEMENTS (continued)
For the period from 1 January 2021 to 30 June 2021
6. FEES AND EXPENSES PAYABLE (continued)
Management fees
A management fee is charged in each share class of the Sub-Funds, out of which will be paid the fees and expenses of
the Manager, the Investment Manager, the Distributor and each of their delegates, which may include the appointed Sub-Investment Managers, in respect of the management, investment management services and distribution services
provided to the Company (collectively, the “management fee”).
The management fee will not exceed an amount equal to the net asset value of the relevant share class multiplied by
the management fee rate and multiplied by the number of calendar days for the relevant period divided by 365. The
management fee shall accrue on each valuation day and be payable quarterly in arrears in the Sub-Funds’ functional
currency. Such management fee will be payable to the Manager regardless of the performance of the relevant share
class. The Manager shall be responsible for discharging from the management fee the remuneration due to the parties
mentioned above which includes the Investment Manager and the Sub-Investment Managers, as appropriate. The
Manager also acts as the Distributor of the Company.
The maximum management fee rates of each share class of the Sub-Funds are presented below:
Share class
% Per annum
WNT CHENAVARI WELLS
Class I (USD) 0.85% 1.40% 0.75%
Hedged Class EB (EUR) 0.85% - -
Hedged Class EB (GBP) 0.85% - -
Hedged Class I (EUR) 0.85% 1.40% 0.75%
Class A (USD) 1.70% 2.15% 1.50%
Hedged Class A (EUR) 1.70% 2.15% 1.50%
Hedged Class I (GBP) 0.85% - -
Class SI (USD) - 1.20% 0.65%
Class AA (USD) - 2.30% -
Class IA (USD) - 1.80% -
Hedged Class SIP (EUR) - 1.20% -
Hedged Class A (CHF) 1.70% - -
Hedged Class C2 (EUR) 0.85% - -
Class C2 (USD) 0.85% - -
Class O (USD) - 0.30% -
Hedged Class O (EUR) - 0.30% -
Hedged Class SI (EUR) - 1.20% -
Hedged Class SI (GBP) - 1.20% -
Hedged Class SSI (EUR) - 1.00%(3) -
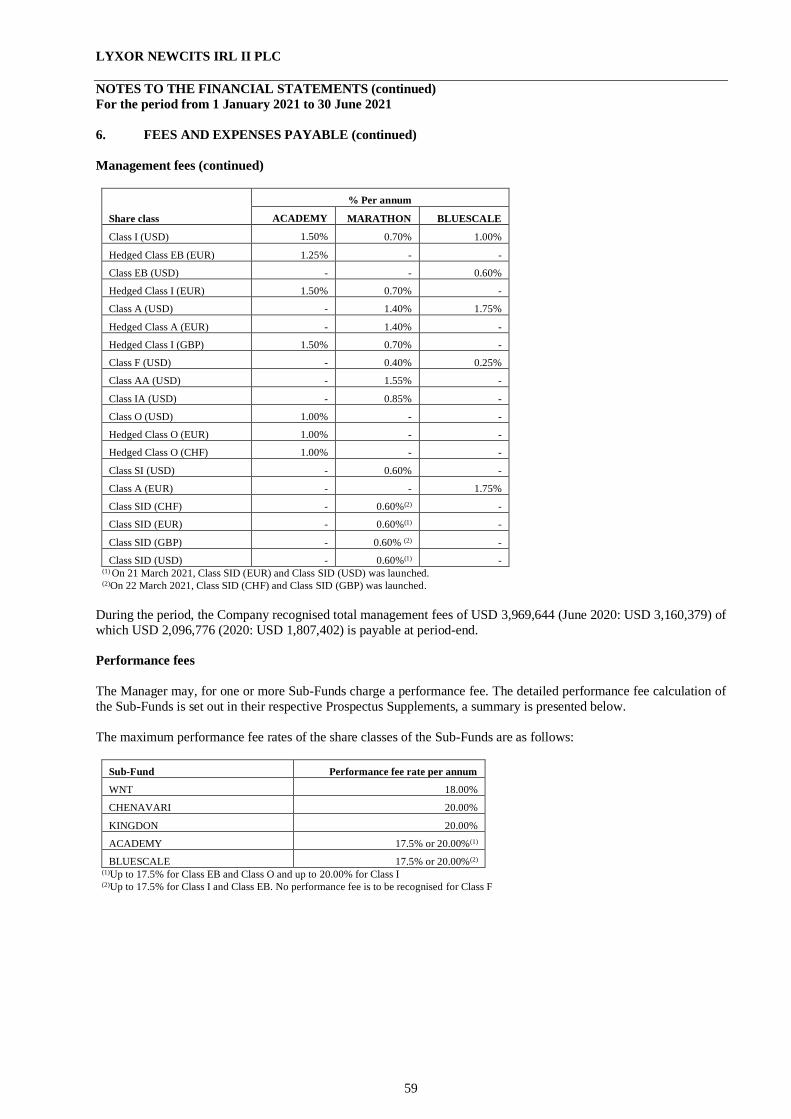
LYXOR NEWCITS IRL II PLC
59
NOTES TO THE FINANCIAL STATEMENTS (continued)
For the period from 1 January 2021 to 30 June 2021
6. FEES AND EXPENSES PAYABLE (continued)
Management fees (continued)
Share class
% Per annum
ACADEMY MARATHON BLUESCALE
Class I (USD) 1.50% 0.70% 1.00%
Hedged Class EB (EUR) 1.25% - -
Class EB (USD) - - 0.60%
Hedged Class I (EUR) 1.50% 0.70% -
Class A (USD) - 1.40% 1.75%
Hedged Class A (EUR) - 1.40% -
Hedged Class I (GBP) 1.50% 0.70% -
Class F (USD) - 0.40% 0.25%
Class AA (USD) - 1.55% -
Class IA (USD) - 0.85% -
Class O (USD) 1.00% - -
Hedged Class O (EUR) 1.00% - -
Hedged Class O (CHF) 1.00% - -
Class SI (USD) - 0.60% -
Class A (EUR) - - 1.75%
Class SID (CHF) - 0.60%(2) -
Class SID (EUR) - 0.60%(1) -
Class SID (GBP) - 0.60% (2) -
Class SID (USD) - 0.60%(1) - (1) On 21 March 2021, Class SID (EUR) and Class SID (USD) was launched. (2)On 22 March 2021, Class SID (CHF) and Class SID (GBP) was launched.
During the period, the Company recognised total management fees of USD 3,969,644 (June 2020: USD 3,160,379) of
which USD 2,096,776 (2020: USD 1,807,402) is payable at period-end.
Performance fees
The Manager may, for one or more Sub-Funds charge a performance fee. The detailed performance fee calculation of
the Sub-Funds is set out in their respective Prospectus Supplements, a summary is presented below.
The maximum performance fee rates of the share classes of the Sub-Funds are as follows:
Sub-Fund Performance fee rate per annum
WNT 18.00%
CHENAVARI 20.00%
KINGDON 20.00%
ACADEMY 17.5% or 20.00%(1)
BLUESCALE 17.5% or 20.00%(2) (1)Up to 17.5% for Class EB and Class O and up to 20.00% for Class I (2)Up to 17.5% for Class I and Class EB. No performance fee is to be recognised for Class F

LYXOR NEWCITS IRL II PLC
60
NOTES TO THE FINANCIAL STATEMENTS (continued)
For the period from 1 January 2021 to 30 June 2021
6. FEES AND EXPENSES PAYABLE (continued)
Performance fees (continued)
Performance fee for the Sub-Funds is equal to the relevant performance fee rate per annum multiplied by the net
realised and unrealised appreciation of the net asset value of the relevant share (but before accrual for performance fee; referred herein as the “Gross NAV”) shall be calculated in the relevant currency of each share class and payable
in USD (or EUR in the case of Lyxor/Portland Hill Fund) at the end of each fee period (as defined below). The
performance fee should be calculated subject to the high water mark mechanism.
The performance fee is calculated on each valuation day and paid only on new net gains with respect to the relevant
share class, i.e., a high water mark will be employed so that no performance fee will be paid until any decline in the
Gross NAV of the relevant share class below the highest Gross NAV of the relevant share class as of the end of any
fee period, adjusted for any subsequent subscriptions and redemption, is offset by subsequent net increases in such
Gross NAV of the relevant share class has been reached again and is only payable on the gains in excess of the high-
water mark. For the initial fee period, the Gross NAV shall initially be equal to the initial offer price of the relevant
share class multiplied by the number of shares issued in that share class at the end of the initial offer period.
The performance fee is payable to the Manager: quarterly for the Lyxor/WNT Fund and Lyxor/Academy Quantitative
Global UCITS Fund and yearly for all the other Sub-Funds. The Manager is responsible for discharging from this fee
the remuneration due to the Sub-Investment Manager.
The Sub-Funds do not perform equalisation for the purposes of determining the performance fee. The current
methodology for calculating the performance fee involves accruing the performance fee on each valuation day.
No performance fee is to be recognised for any of the share classes of the Lyxor/Wells Capital Financial Credit Fund
and Lyxor/Marathon Emerging Markets Bond Fund.
During the period, the Company recognised total performance fees of USD 1,432,889 (June 2020: USD 1,563,350) of which USD 1,552,976 (2020: USD 3,797,354) is payable as at period end.
Fee periods for the Sub-Funds are defined as follows:
Lyxor/WNT Fund
Each quarter ending the last valuation day of March, June, September and December.
Lyxor/Chenavari Credit Fund
Each calendar year ending on the last valuation day of December.
Kingdon Global Long-Short Equity Fund
The period beginning on the first valuation day, at the start of each calendar year, and ending on the last valuation day
of December.
Lyxor/Academy Quantitative Global UCITS Fund and Lyxor/Bluescale Global Equity Alpha Fund
Each year ending on the last valuation day of December with the initial fee period starting at the end of the initial
offer period and ending on the last valuation day of the relevant calendar year.
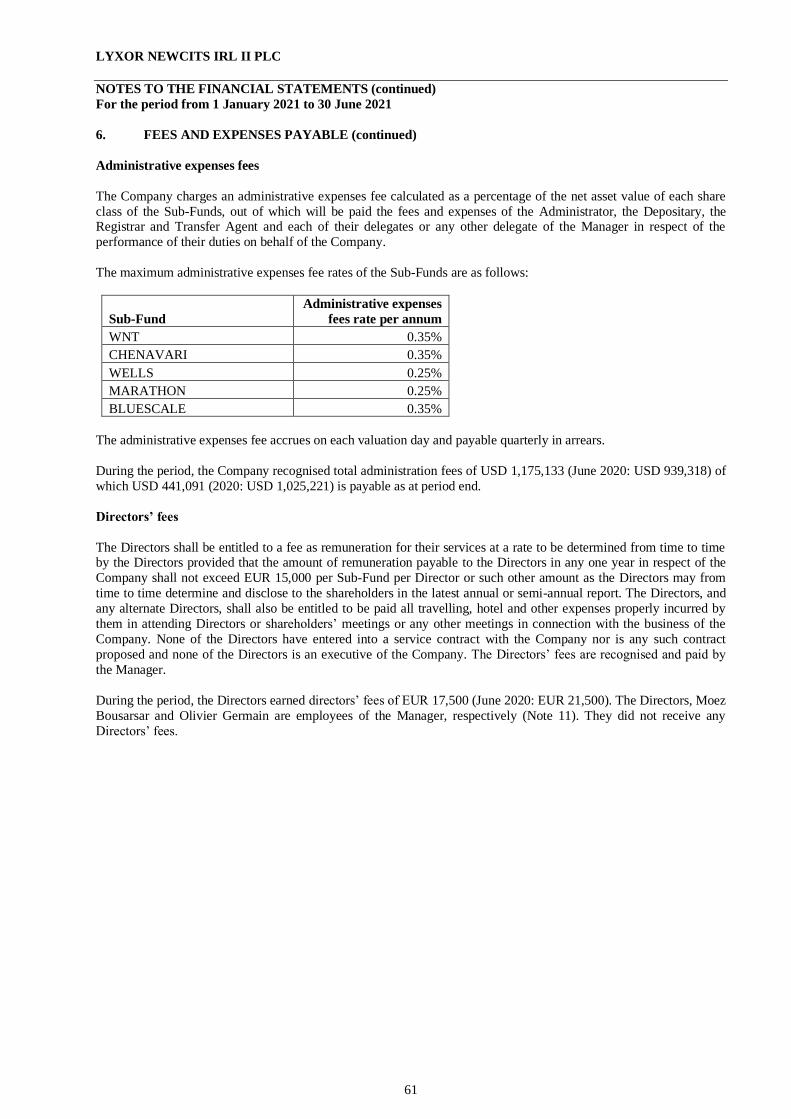
LYXOR NEWCITS IRL II PLC
61
NOTES TO THE FINANCIAL STATEMENTS (continued)
For the period from 1 January 2021 to 30 June 2021
6. FEES AND EXPENSES PAYABLE (continued)
Administrative expenses fees
The Company charges an administrative expenses fee calculated as a percentage of the net asset value of each share
class of the Sub-Funds, out of which will be paid the fees and expenses of the Administrator, the Depositary, the Registrar and Transfer Agent and each of their delegates or any other delegate of the Manager in respect of the
performance of their duties on behalf of the Company.
The maximum administrative expenses fee rates of the Sub-Funds are as follows:
Sub-Fund
Administrative expenses
fees rate per annum
WNT 0.35%
CHENAVARI 0.35%
WELLS 0.25%
MARATHON 0.25%
BLUESCALE 0.35%
The administrative expenses fee accrues on each valuation day and payable quarterly in arrears.
During the period, the Company recognised total administration fees of USD 1,175,133 (June 2020: USD 939,318) of
which USD 441,091 (2020: USD 1,025,221) is payable as at period end.
Directors’ fees
The Directors shall be entitled to a fee as remuneration for their services at a rate to be determined from time to time by the Directors provided that the amount of remuneration payable to the Directors in any one year in respect of the
Company shall not exceed EUR 15,000 per Sub-Fund per Director or such other amount as the Directors may from
time to time determine and disclose to the shareholders in the latest annual or semi-annual report. The Directors, and
any alternate Directors, shall also be entitled to be paid all travelling, hotel and other expenses properly incurred by
them in attending Directors or shareholders’ meetings or any other meetings in connection with the business of the
Company. None of the Directors have entered into a service contract with the Company nor is any such contract
proposed and none of the Directors is an executive of the Company. The Directors’ fees are recognised and paid by
the Manager.
During the period, the Directors earned directors’ fees of EUR 17,500 (June 2020: EUR 21,500). The Directors, Moez
Bousarsar and Olivier Germain are employees of the Manager, respectively (Note 11). They did not receive any
Directors’ fees.
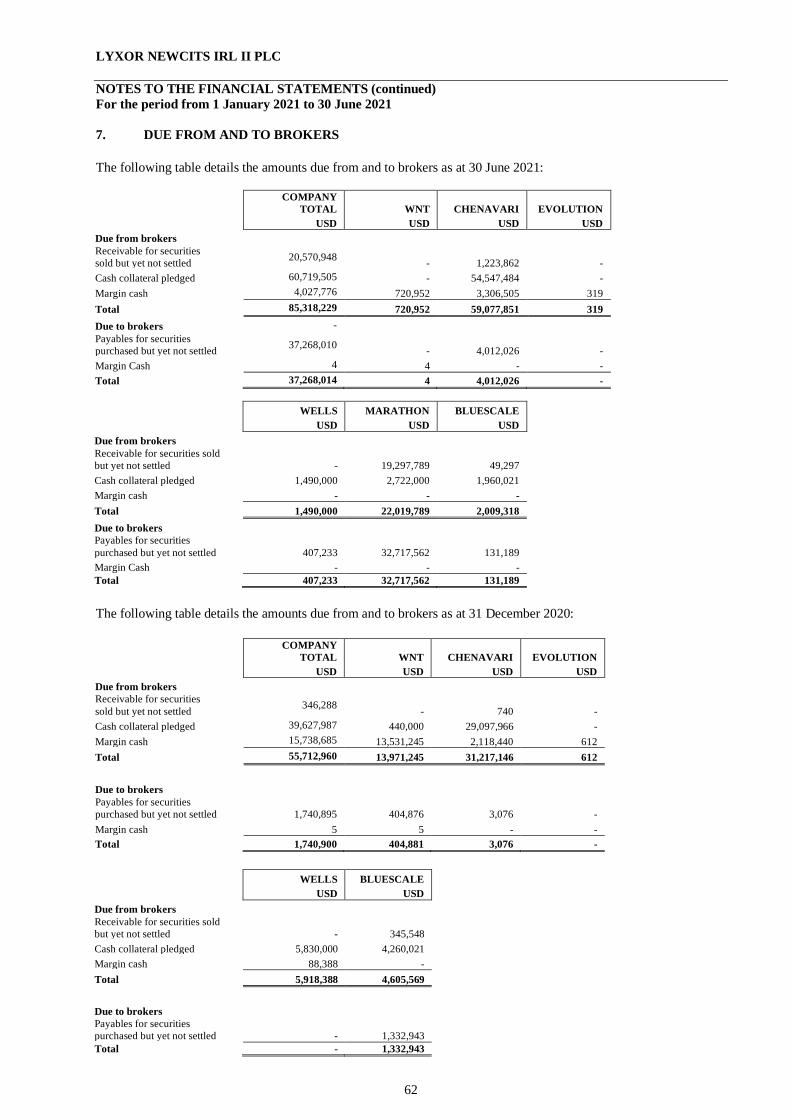
LYXOR NEWCITS IRL II PLC
62
NOTES TO THE FINANCIAL STATEMENTS (continued)
For the period from 1 January 2021 to 30 June 2021
7. DUE FROM AND TO BROKERS
The following table details the amounts due from and to brokers as at 30 June 2021:
COMPANY
TOTAL WNT CHENAVARI EVOLUTION
USD USD USD USD
Due from brokers
Receivable for securities
sold but yet not settled 20,570,948
- 1,223,862 -
Cash collateral pledged 60,719,505 - 54,547,484 -
Margin cash 4,027,776 720,952 3,306,505 319
Total 85,318,229 720,952 59,077,851 319
Due to brokers -
Payables for securities
purchased but yet not settled 37,268,010
- 4,012,026 -
Margin Cash 4 4 - -
Total 37,268,014 4 4,012,026 -
WELLS MARATHON BLUESCALE
USD USD USD
Due from brokers
Receivable for securities sold
but yet not settled - 19,297,789 49,297
Cash collateral pledged 1,490,000 2,722,000 1,960,021
Margin cash - - -
Total 1,490,000 22,019,789 2,009,318
Due to brokers
Payables for securities
purchased but yet not settled 407,233 32,717,562 131,189
Margin Cash - - -
Total 407,233 32,717,562 131,189
The following table details the amounts due from and to brokers as at 31 December 2020:
COMPANY
TOTAL WNT CHENAVARI EVOLUTION
USD USD USD USD
Due from brokers
Receivable for securities
sold but yet not settled 346,288
- 740 -
Cash collateral pledged 39,627,987 440,000 29,097,966 -
Margin cash 15,738,685 13,531,245 2,118,440 612
Total 55,712,960 13,971,245 31,217,146 612
Due to brokers
Payables for securities
purchased but yet not settled 1,740,895 404,876 3,076 -
Margin cash 5 5 - -
Total 1,740,900 404,881 3,076 -
WELLS BLUESCALE
USD USD
Due from brokers
Receivable for securities sold
but yet not settled - 345,548
Cash collateral pledged 5,830,000 4,260,021
Margin cash 88,388 -
Total 5,918,388 4,605,569
Due to brokers
Payables for securities
purchased but yet not settled - 1,332,943
Total - 1,332,943

LYXOR NEWCITS IRL II PLC
63
NOTES TO THE FINANCIAL STATEMENTS (continued)
For the period from 1 January 2021 to 30 June 2021
8. SHARE CAPITAL
The authorised capital of the Company is 500,000,000,002 is divided into 500,000,000,000 redeemable participating
shares of no par value and two subscriber shares at no par value. As only the redeemable participating shares can
represent an interest in the Sub-Funds, the subscriber shares are non-participating and have no entitlement or interest
in any of the Sub-Funds.
The subscriber shares entitle the holders to attend and vote at general meetings of the Company but do not entitle the
holders to participate in the profits or assets of the Company except for a return of capital on a winding-up.
The redeemable participating shares entitle the holders to attend and vote at general meetings of the Company and to
participate equally (subject to any differences between fees, charges and expenses applicable to different share
classes) in the profits and assets of the Sub-Funds to which the redeemable participating shares relate.
The Company’s objective is managing the redeemable participating share capital to ensure a stable and strong base to
maximise returns to all investors, and to manage liquidity risk arising from redemptions. The Company is a UCITS
company and the minimum capital requirement is met by taking into account the participating and non-participating shares.
At 30 June 2021, none of the Directors or employees had interest in the shares of the Company.
The movement in the number of redeemable participating shares for the period ended 30 June 2021 is as follows:
At
1 January 2021
Shares
Issued
Shares
Redeemed
At
30 June 2021
Lyxor/WNT Fund
Class I (USD) 11,440 - (8,398) 3,042
Hedged Class A (EUR) 7,307 - (5,323) 1,984
Hedged Class I (EUR) 102,241 9,941 (97,097) 15,085
Hedged Class A (CHF) 500 - - 500
Hedged Class I (GBP) 30,760 4 (26,253) 4,511
Class A (USD) 2,032 - (275) 1,757
Lyxor/Chenavari Credit Fund
Class I (USD) 21,853 34,222 (3,226) 52,849
Hedged Class I (EUR) 322,082 604,777 (128,227) 798,632
Hedged Class A (EUR) 280,773 134,168 (137,732) 277,209
Class SI (USD) 267,459 27,055 (34,241) 260,273
Class A (USD) 20,234 45,598 (4,157) 61,675
Hedged Class SIP (EUR) 80,000 - - 80,000
Hedged Class SI (EUR) 355,456 314,114 (141,187) 528,383
Hedged Class SI (GBP) - 75,750 (1,325) 74,425
Class O (USD) 81,536 - (48,955) 32,581
Hedged Class O (EUR) 21,501 48,742 (17,250) 52,993
Class AA (USD) 100 - - 100
Class IA (USD) 1,000 - - 1,000
Hedged Class SSI (EUR) 320,633 696,985 (60,510) 957,108
Lyxor/Wells Capital Financial Credit Fund
Class A (USD) 28,392 7,923 (2,727) 33,588
Class I (USD) 134,736 8,107 (15,711) 127,132
Hedged Class I (EUR) 643,649 36,750 (35,874) 644,525
Hedged Class A (EUR) 159,184 31,277 (21,836) 168,625
Class SI (USD) 39,164 408 - 39,572
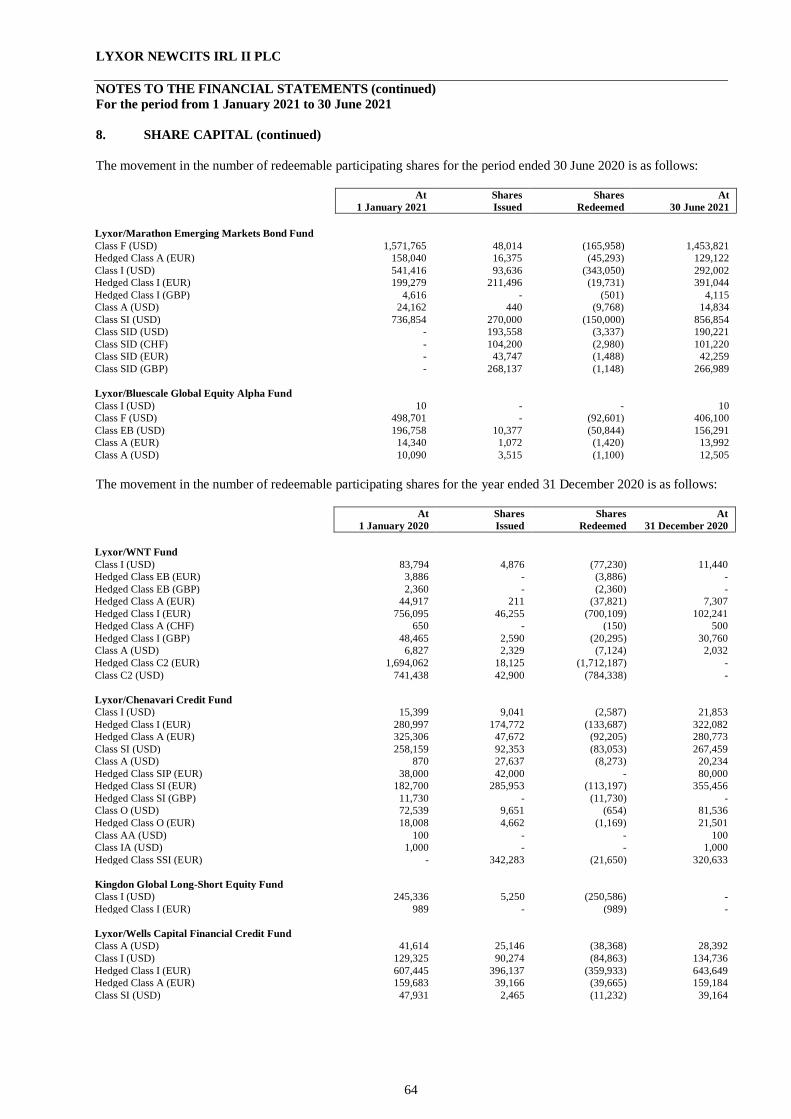
LYXOR NEWCITS IRL II PLC
64
NOTES TO THE FINANCIAL STATEMENTS (continued)
For the period from 1 January 2021 to 30 June 2021
8. SHARE CAPITAL (continued)
The movement in the number of redeemable participating shares for the period ended 30 June 2020 is as follows:
At
1 January 2021
Shares
Issued
Shares
Redeemed
At
30 June 2021
Lyxor/Marathon Emerging Markets Bond Fund
Class F (USD) 1,571,765 48,014 (165,958) 1,453,821
Hedged Class A (EUR) 158,040 16,375 (45,293) 129,122
Class I (USD) 541,416 93,636 (343,050) 292,002
Hedged Class I (EUR) 199,279 211,496 (19,731) 391,044
Hedged Class I (GBP) 4,616 - (501) 4,115
Class A (USD) 24,162 440 (9,768) 14,834
Class SI (USD) 736,854 270,000 (150,000) 856,854
Class SID (USD) - 193,558 (3,337) 190,221
Class SID (CHF) - 104,200 (2,980) 101,220
Class SID (EUR) - 43,747 (1,488) 42,259
Class SID (GBP) - 268,137 (1,148) 266,989
Lyxor/Bluescale Global Equity Alpha Fund
Class I (USD) 10 - - 10
Class F (USD) 498,701 - (92,601) 406,100
Class EB (USD) 196,758 10,377 (50,844) 156,291
Class A (EUR) 14,340 1,072 (1,420) 13,992
Class A (USD) 10,090 3,515 (1,100) 12,505
The movement in the number of redeemable participating shares for the year ended 31 December 2020 is as follows:
At
1 January 2020
Shares
Issued
Shares
Redeemed
At
31 December 2020
Lyxor/WNT Fund
Class I (USD) 83,794 4,876 (77,230) 11,440
Hedged Class EB (EUR) 3,886 - (3,886) -
Hedged Class EB (GBP) 2,360 - (2,360) -
Hedged Class A (EUR) 44,917 211 (37,821) 7,307
Hedged Class I (EUR) 756,095 46,255 (700,109) 102,241
Hedged Class A (CHF) 650 - (150) 500
Hedged Class I (GBP) 48,465 2,590 (20,295) 30,760
Class A (USD) 6,827 2,329 (7,124) 2,032
Hedged Class C2 (EUR) 1,694,062 18,125 (1,712,187) -
Class C2 (USD) 741,438 42,900 (784,338) -
Lyxor/Chenavari Credit Fund
Class I (USD) 15,399 9,041 (2,587) 21,853
Hedged Class I (EUR) 280,997 174,772 (133,687) 322,082
Hedged Class A (EUR) 325,306 47,672 (92,205) 280,773
Class SI (USD) 258,159 92,353 (83,053) 267,459
Class A (USD) 870 27,637 (8,273) 20,234
Hedged Class SIP (EUR) 38,000 42,000 - 80,000
Hedged Class SI (EUR) 182,700 285,953 (113,197) 355,456
Hedged Class SI (GBP) 11,730 - (11,730) -
Class O (USD) 72,539 9,651 (654) 81,536
Hedged Class O (EUR) 18,008 4,662 (1,169) 21,501
Class AA (USD) 100 - - 100
Class IA (USD) 1,000 - - 1,000
Hedged Class SSI (EUR) - 342,283 (21,650) 320,633
Kingdon Global Long-Short Equity Fund
Class I (USD) 245,336 5,250 (250,586) -
Hedged Class I (EUR) 989 - (989) -
Lyxor/Wells Capital Financial Credit Fund
Class A (USD) 41,614 25,146 (38,368) 28,392
Class I (USD) 129,325 90,274 (84,863) 134,736
Hedged Class I (EUR) 607,445 396,137 (359,933) 643,649
Hedged Class A (EUR) 159,683 39,166 (39,665) 159,184
Class SI (USD) 47,931 2,465 (11,232) 39,164
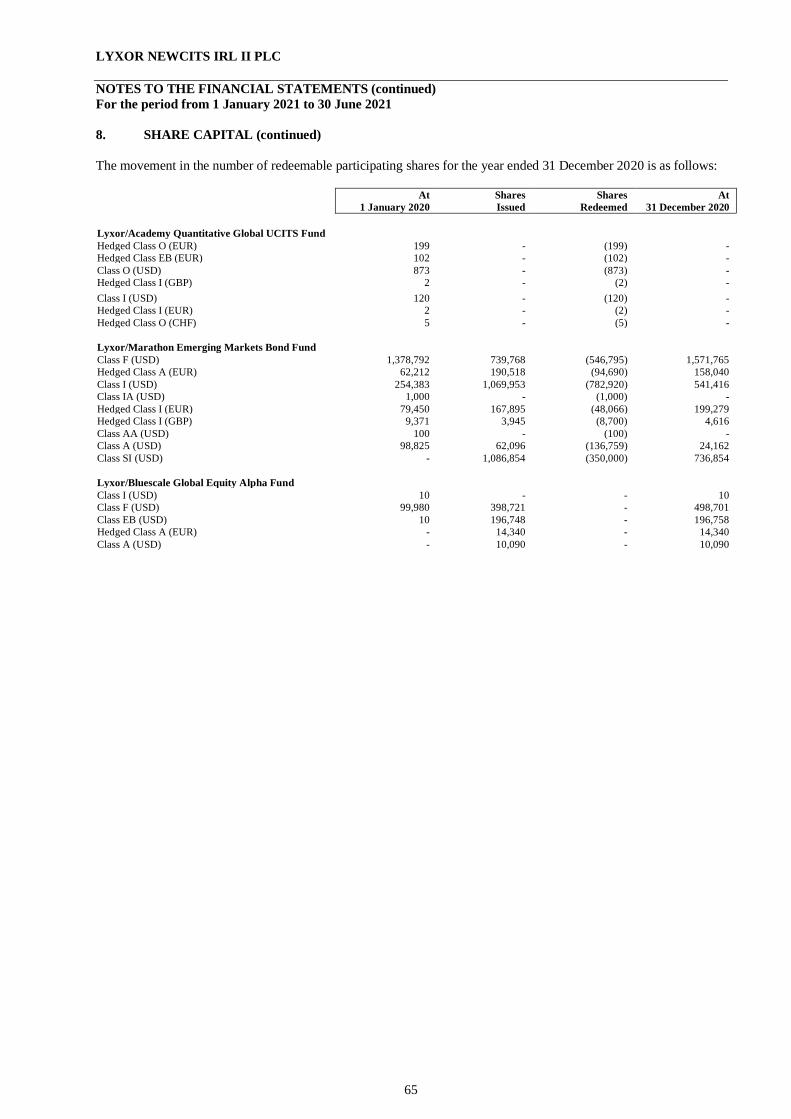
LYXOR NEWCITS IRL II PLC
65
NOTES TO THE FINANCIAL STATEMENTS (continued)
For the period from 1 January 2021 to 30 June 2021
8. SHARE CAPITAL (continued)
The movement in the number of redeemable participating shares for the year ended 31 December 2020 is as follows:
At
1 January 2020
Shares
Issued
Shares
Redeemed
At
31 December 2020
Lyxor/Academy Quantitative Global UCITS Fund
Hedged Class O (EUR) 199 - (199) -
Hedged Class EB (EUR) 102 - (102) -
Class O (USD) 873 - (873) -
Hedged Class I (GBP) 2 - (2) -
Class I (USD) 120 - (120) -
Hedged Class I (EUR) 2 - (2) -
Hedged Class O (CHF) 5 - (5) -
Lyxor/Marathon Emerging Markets Bond Fund
Class F (USD) 1,378,792 739,768 (546,795) 1,571,765
Hedged Class A (EUR) 62,212 190,518 (94,690) 158,040
Class I (USD) 254,383 1,069,953 (782,920) 541,416
Class IA (USD) 1,000 - (1,000) -
Hedged Class I (EUR) 79,450 167,895 (48,066) 199,279
Hedged Class I (GBP) 9,371 3,945 (8,700) 4,616
Class AA (USD) 100 - (100) -
Class A (USD) 98,825 62,096 (136,759) 24,162
Class SI (USD) - 1,086,854 (350,000) 736,854
Lyxor/Bluescale Global Equity Alpha Fund
Class I (USD) 10 - - 10
Class F (USD) 99,980 398,721 - 498,701
Class EB (USD) 10 196,748 - 196,758
Hedged Class A (EUR) - 14,340 - 14,340
Class A (USD) - 10,090 - 10,090

LYXOR NEWCITS IRL II PLC
66
NOTES TO THE FINANCIAL STATEMENTS (continued)
For the period from 1 January 2021 to 30 June 2021
9. DERIVATIVE CONTRACTS
To the extent permitted by the investment objectives and policies of the Sub-Funds of the Company and subject to the
limits set down by the Central Bank from time to time and to the provisions of the Prospectus and Supplements,
utilisation of financial derivative instruments and investment techniques shall be employed for efficient portfolio
management purposes by the Sub-Funds. Each Sub-Fund may use these financial derivative instruments and investment techniques to hedge against changes in interest rates, non-functional currency exchange rates or securities
prices or as part of their overall investment strategies. The financial derivative instruments held at period/year end and
the Company’s derivative counterparties are disclosed below. The realised gains and losses on financial instruments
used for efficient portfolio management purposes are disclosed in Note 5.
The following financial derivative instruments were included in the Company’s Statement of Financial Position at fair
value through profit or loss as at 30 June 2021:
WNT CHENAVARI
USD USD
Assets Liabilities Assets Liabilities
Financial derivative
instruments
Listed equity options - - 219,679 46,248
Total return swaps - - 206,687 372,342
Credit default swaps - - 1,280,219 11,207,888
Contracts for difference - - - -
Futures contracts 33,640 100,551 36,513 317,301
Foreign currency forwards 3,254 92,427 6,663,601 9,715,625
Swaptions - - 36,912 25,951
Total 36,894 192,978 8,443,611 21,685,355
WELLS MARATHON BLUESCALE
USD USD USD
Assets Liabilities Assets Liabilities Assets Liabilities
Financial derivative
instruments
Equity swaps - - - - 3,147,062 1,642,882
Foreign currency forwards 356,343 3,386,765 15,867 3,099,908 322,779 497,942
Total 356,343 3,386,765 15,867 3,099,908 3,469,841 2,140,824

LYXOR NEWCITS IRL II PLC
67
NOTES TO THE FINANCIAL STATEMENTS (continued)
For the period from 1 January 2021 to 30 June 2021
9. DERIVATIVE CONTRACTS (continued)
The following financial derivative instruments were included in the Company’s Statement of Financial Position at fair
value through profit or loss as at 31 December 2020:
WNT CHENAVARI
USD USD
Assets Liabilities Assets Liabilities
Financial derivative
instruments
Listed options - - 258,076 -
Total return swaps - - 136,682 1,049,580
Credit default swaps - - 292,358 4,766,683
Contracts for difference - - - -
Futures contracts 390,634 31,276 - 16,673
Foreign currency forwards 369,687 35,878 2,388,370 3,214,493
Swaptions - - 414,502 236,620
Total 760,321 67,154 3,489,988 9,284,049
WELLS MARATHON BLUESCALE
USD USD USD
Assets Liabilities Assets Liabilities Assets Liabilities
Financial derivative
instruments
Equity swaps - - - - 4,392,942 2,534,194
Futures contracts - - - - - -
Foreign currency
forwards 1,422,355 2,499,100 573,171 9,706 657,515 958,523
Total 1,422,355 2,499,100 573,171 9,706 5,050,457 3,492,717
Futures contracts
Future contracts are exchange traded derivative contracts whereby the seller agrees to make delivery at a specified
future date of the respective asset or liability (e.g. a commodity or instrument) at a specified price.
During a period in which future contracts are open, changes in the value of the contracts are recognised as unrealised
gains or losses by marking-to-market on a daily basis to reflect the value of the contracts at the end of each day’s
trading. Futures contracts are valued at the settlement price established each day by the exchange on which they are
traded. Gains and losses are recognised in the Statement of Comprehensive Income and the unrealised gains or losses on open positions are included in the Statement of Financial Position. Upon expiry or settlement of the obligation
under the contracts, realised gains or losses are recorded in the Statement of Comprehensive Income. Commission
charges to open such contracts are expensed at the time that the contracts are opened.
Foreign currency forwards
Foreign currency forwards are over the counter derivative contracts whereby the seller agrees to make delivery at a
specified future date certain currency at a specified rate. Foreign currency forwards are fair valued by reference to the
forward price at which a new forward contract of the same size and maturity could be undertaken at the valuation
date. The unrealised gain or loss on open foreign currency forwards is calculated as the difference between the
forward rate for the transaction specified in the contract and the forward rate on the valuation date as reported in published sources, multiplied by the face amount of the forward contract. The unrealised gains or losses on open
foreign currency forwards are included in the Statement of Financial Position with the related change during the
period included in the Statement of Comprehensive Income. Upon expiry or settlement of the obligation under the
contracts, realised gains or losses are recorded in the Statement of Comprehensive Income.
LYXOR NEWCITS IRL II PLC
68
NOTES TO THE FINANCIAL STATEMENTS (continued)
For the period from 1 January 2021 to 30 June 2021
9. DERIVATIVE CONTRACTS (continued)
Contracts for difference
Contracts for difference is a contract between two parties, typically described as "buyer" and "seller", stipulating that
the seller will pay to the buyer the difference between the current value of an asset and its value at contract time. Contracts for difference are valued on the date of valuation by reference to the underlying instrument. The unrealised
gains or losses on open contracts for difference are included in the Statement of Financial Position with the related
change during the period included in the Statement of Comprehensive Income. Upon expiry or settlement of the
obligation under the contracts, realised gains or losses are recorded in the Statement of Comprehensive Income.
Options
When the Sub-Funds write or purchase put or call options, an amount equal to the premium received or paid is
recorded as an asset or liability and is subsequently re-measured at fair value in the Statement of Financial Position.
Premiums received or paid from writing or purchasing put or call options that expire or were unexercised are
recognised on the expiration date as realised gains or losses in the Statement of Comprehensive Income. If an option is exercised, the premium received or paid is included with the proceeds or the cost of the transaction to determine
whether the Sub-Funds have realised a gain or loss on the related investment transaction in the Statement of
Comprehensive Income. When the Sub-Funds enter into a closing transaction, the Sub-Funds will realise a gain or
loss in the Statement of Comprehensive Income depending upon whether the amount from the closing transaction is
greater or less than the premium received or paid. The resulting unrealised gains and losses on open options are
included in the Statement of Financial Position and the change in unrealised gains and losses for the period are
included in the Statement of Comprehensive Income.
The Investment Manager considered the option positions held by the Sub-Funds to be covered option positions.
Credit default swaps
Credit default swaps may be centrally cleared or traded on the Over-the-counter (“OTC”) market. The fair value of
credit default swaps is determined using prices from one or more pricing services, recently executed transactions,
quotations (where observable) provided by one or more dealers, or an income or market approach that considers
multiple inputs including specific contract terms, interest rate yield curves, interest rates, credit curves, recovery rates,
current credit spreads, and the counterparty's creditworthiness. Many inputs into the model do not require material
subjectivity as they are observable in the marketplace or set per the contract. Other than the contract terms, valuation
is affected by the difference between the contract spread and the current market spread. The contract spread (or rate)
is generally fixed and the market spread is determined by the credit risk of the underlying debt or reference entity.
The unrealised gains or losses on open credit default swaps are included in the Statement of Financial Position with
the related change during the period included in the Statement of Comprehensive Income. Upon expiry or settlement
of the obligation under the contracts, realised gains or losses are recorded in the Statement of Comprehensive Income.
Interest rate swaps
An interest rate swap is a forward contract in which one stream of future interest payments is exchanged for another
based on a specified principal amount. Interest rate swaps usually involve the exchange of a fixed interest rate for a
floating rate, or vice versa, to reduce or increase exposure to fluctuations in interest rates or to obtain a marginally
lower interest rate than would have been possible without the swap. Gains and losses are recognised in the Statement
of Comprehensive Income and the unrealised gains or losses on open positions are included in the Statement of
Financial Position. Upon expiry or settlement of the obligation under the contracts, realised gains or losses are
recorded in the Statement of Comprehensive Income.
LYXOR NEWCITS IRL II PLC
69
NOTES TO THE FINANCIAL STATEMENTS (continued)
For the period from 1 January 2021 to 30 June 2021
9. DERIVATIVE CONTRACTS (continued)
Equity swaps
An equity swap is an exchange of future cash flows between two parties that allows each party to diversify its income
for a specified period of time while still holding its original assets. An equity swap is similar to an interest rate swap, but rather than one leg being the "fixed" side, it is based on the return of an equity index. The two sets of
nominally equal cash flows are exchanged as per the terms of the swap, which may involve an equity-based cash flow
(such as from a stock asset, called the reference equity) that is traded for fixed-income cash flow (such as a
benchmark interest rate). Equity swaps are valued on the date of valuation by reference to the underlying instrument.
The unrealised gains or losses on open equity swaps are included in the Statement of Financial Position with the
related change during the period included in the Statement of Comprehensive Income. Upon expiry or settlement of
the obligation under the contracts, realised gains or losses are recorded in the Statement of Comprehensive Income.
Swaptions
A swaption, also known as a swap option, refers to an option to enter into an interest rate swap or some other type of swap. In exchange for an options premium, the buyer gains the right but not the obligation to enter into a specified
swap agreement with the issuer on a specified future date. The Sub-Funds value swaptions using a model that
considers the terms of the contract (including the notional amount, strike price, and contract maturity) and multiple
inputs, including interest rates, currency exchange rates, and volatility. The unrealised gains or losses on open
swaptions are included in the Statement of Financial Position with the related change during the period included in
the Statement of Comprehensive Income. Upon expiry or settlement of the obligation under the contracts, realised
gains or losses are recorded in the Statement of Comprehensive Income.
Total return swaps
Total return swap contracts involve an agreement to exchange cash flows based on the change in the value or total
return on individual stocks or other financial instruments. The Sub-Funds enter into total return swaps either to manage its exposure to the market or certain sectors of the market, or to create exposure to certain equity securities to
which it is otherwise not exposed. In some cases, entering into a total return swap is a more effective financing
alternative than purchasing the actual underlying position outright. The unrealised gains or losses on open total return
swaps are included in the Statement of Financial Position with the related change during the period included in the
Statement of Comprehensive Income. Upon expiry or settlement of the obligation under the contracts, realised gains
or losses are recorded in the Statement of Comprehensive Income.
As discussed, gains and losses on the above derivative instruments are recorded by the Company based upon market
fluctuations and are recorded as net gain/(loss) on financial assets and liabilities at fair value through profit or loss in
the Statement of Comprehensive Income. The Company uses financial derivative instruments to economically hedge
its risks associated, primarily, with foreign currency, equity prices and interest rate fluctuations. The Company maintains positions in a variety of derivative and non-derivative financial instruments in accordance with the
investment strategy of the Sub-Funds.
All positions are valued according to the pricing policy and compared to prime broker and Manager valuation. For the
OTC positions, the Administrator prices the positions using its own model and reconciles the price with
counterparties and Manager prices.
Collateral pledged
A pledged account is used by the Lyxor/Bluescale Global Equity Alpha Fund where US Government T-Bills are
pledged as collateral in case of default with a certain counterparty. This pledged account is opened in favour of the
counterparty as segregated account at the Depositary. At 31 June 2021, USD Nil (31 December 2020: USD 8,996,387) in US Government T-Bills was pledged to Goldman Sachs International. When the US Government T-
Bills come close to maturity, they are rolled by the Investment Manager to avoid any cash settlement.

LYXOR NEWCITS IRL II PLC
70
NOTES TO THE FINANCIAL STATEMENTS (continued)
For the period from 1 January 2021 to 30 June 2021
9. DERIVATIVE CONTRACTS (continued)
The counterparties to the OTC financial derivative instruments as at 30 June 2021 are as follows:
WNT CHENAVARI
USD USD
Total return swaps
BNP Paribas - 61,456
Goldman Sachs International (227,111)
Credit default swaps
Citigroup Global Markets Inc - (33,314)
Goldman Sachs International - 200,275
JP Morgan Chase Bank - 100,137
JPM FCM - (10,194,767)
Contracts for difference
Société Générale Securities Services - -
Foreign currency forwards
Barclays Capital Inc. (25) -
BNP Paribas (265) -
Deutsche Bank AG (2,252) -
Goldman Sachs International 11 (47,729)
HSBC (1,087) -
JP Morgan - New York 57 -
JP Morgan Chase Bank (77,735) 6,593,877
Morgan Stanley Capital Services Inc. (8,257) -
Morgan Stanley Inc. (9,598,172)
UBS Limited 380 -
Credit Agricole Cib - -
Swaptions
Morgan Stanley Capital Services Inc. - 10,961
Total (89,173) (13,134,387)
WELLS MARATHON BLUESCALE
USD USD USD
Equity swaps
Citigroup Global Markets Inc. - - 1,193,921
Goldman Sachs International - - 310,259
Foreign currency forwards
BNP Paribas 322,493 - -
Credit Agricole Cib (3,324,223) - 664
Goldman Sachs International (34,642) (156) (90,718)
JP Morgan Chase Bank 5,950 (7,932) -
Morgan Stanley Inc. - (3,075,953) (40,403)
Citigroup Global Markets Inc. - - (44,706)
Total (3,030,422) (3,084,041) 1,329,017

LYXOR NEWCITS IRL II PLC
71
NOTES TO THE FINANCIAL STATEMENTS (continued)
For the period from 1 January 2021 to 30 June 2021
9. DERIVATIVE CONTRACTS (continued)
The counterparties to the OTC financial derivative instruments as at 31 December 2020 are as follows:
WNT CHENAVARI
USD USD
Total return swaps
BNP Paribas - 49,801
Goldman Sachs International - (847,160)
JP Morgan Chase Bank - (115,539)
Credit default swaps
BNP Paribas - (88,007)
Citigroup Global Markets Inc. - (188,463)
JPM FCM - (4,197,855)
Contracts for difference
Société Générale Securities Services - -
Foreign currency forwards
Barclays Capital Inc. 16,368 -
BNP Paribas 10,892 -
Deutsche Bank AG (7,092) -
Goldman Sachs International 272,578 (234,355)
HSBC 17,038 -
JP Morgan - New York 15,023 (2,706,126)
JP Morgan Chase Bank (4,189) -
Morgan Stanley Capital Services Inc. 12,360 -
Morgan Stanley Inc. - 2,171,188
UBS Limited 831 -
Bank of America Merrill Lynch - (56,830)
Credit Agricole CIB - -
Société Générale Securities Services - -
Swaptions
Bank of America Merrill Lynch - 164,440
BNP Paribas - 7,393
Citigroup Global Markets Inc - 6,049
Total 333,809 (6,035,464)
WELLS MARATHON BLUESCALE
USD USD USD
Equity swaps
Citigroup Global Markets Inc. - - 960,959
Goldman Sachs International - - 897,789
Foreign currency forwards
CSFB International 55,135
Goldman Sachs International (2,466,584) 23,773 (108,964)
JP Morgan Chase Bank (265) 29 -
Morgan Stanley Inc. - 539,663 936
Morgan Stanley Capital Services Inc. - - 18,581
Citigroup Global Markets Inc. - - (211,538)
Credit Agricole Cib 1,336,126 - (23)
JP Morgan - New York (1,157) - -
Total (1,076,745) 563,465 1,557,740
LYXOR NEWCITS IRL II PLC
72
NOTES TO THE FINANCIAL STATEMENTS (continued)
For the period from 1 January 2021 to 30 June 2021
10. FINANCIAL INSTRUMENTS AND ASSOCIATED RISKS
Risk is inherent in the Company’s activities, but it is managed through a process of ongoing identification,
measurement and monitoring, subject to risks limits and other controls. The Sub-Funds are exposed to market risk
(which can include interest rate risk, currency risk and price risk), credit risk and liquidity risk arising from the
financial instruments they hold.
Risk mitigation
The Company and the Sub-Funds are subject to a process for assessing, controlling and periodically re-evaluating the
adequacy and efficiency of the risk management policy. Investments guidelines are set up at the launch of each sub-
fund to frame each risk factor in accordance with the Investment Manager’s strategy, the liquidity of the fund and the
global fund risk level. Prior to any investment, the Investment Manager shall ensure the compliance with investment
guidelines as agreed and is accountable for performing a pre-trade monitoring when allocating. Using the
transparency of the Lyxor Managed Account Platform, Lyxor Risk Management also realises post trade a full second
level control. A comprehensive range of portfolio limits are monitored on a daily or weekly basis including stress
tests, volatility, leverage, diversification and liquidity. In case of breach, a procedure is in place to notify the Investment Manager and find a solution in the best interests of investors (cure request, one-off agreement).
Investment strategy
The detailed investment strategies of the Sub-Funds are documented in their respective Prospectus Supplements.
Market risk
Market risk embodies the potential for both gains and losses and includes interest rate risk, currency risk and price
risk. Each Sub-Fund’s market risk is managed on a daily basis by the Investment Manager subject to the investment
objective and investment policies set out in each Sub-Fund’s Prospectus Supplement.
Price risk
Price risk is the risk that value of the instrument will fluctuate as a result of changes in market prices (other than those
arising from interest rate risk or currency risk), whether caused by factors specific to an individual investment, its
issuer or all factors affecting all instruments traded in the market.
As the majority of the Company’s financial instruments are carried at fair value with fair value changes recognised in
the Statement of Comprehensive Income, all changes in market conditions will directly affect change in net assets
attributable to holders of redeemable participating shares.
The Investment Manager manages price risk in accordance with the investment objectives and policies set out in the Sub-Funds’ Prospectus Supplements. This risk is managed by ensuring appropriate processes and procedures are in
place to effectively manage the Sub-Funds’ risks.
Value at risk (VaR)
Global exposure for each Sub-Fund is calculated using a Value at Risk (VaR) model. VaR will be monitored in terms
of absolute VaR, as defined below:
• Absolute VaR is defined as percentage of NAV, the VaR of the Sub-Fund is limited as a percentage of NAV.
The absolute VaR of each Sub-Fund cannot be greater than 20% of the NAV.
• The market risks of each Sub-Fund’s financial asset and liability positions are monitored by the Investment Manager on a daily basis. VaR analysis represents the interdependencies between risk variables, unlike a
traditional sensitivity analysis. VaR represents a statistical estimate of the potential losses from adverse
changes in market factors for a specified time period and confidence level.

LYXOR NEWCITS IRL II PLC
73
NOTES TO THE FINANCIAL STATEMENTS (continued)
For the period from 1 January 2021 to 30 June 2021
10. FINANCIAL INSTRUMENTS AND ASSOCIATED RISKS (continued)
Market risk (continued)
Price risk (continued)
Limitation of VaR calculation
Whilst in the opinion of the Investment Manager VaR is a good general risk measure, it is acknowledged that it does
have certain limitations, including:
• The measure is a point-in-time calculation, reflecting positions as recorded at that date, which do not
necessarily reflect the risk positions held at any other time.
• If a 99% confidence interval is applied, losses are not expected to exceed the calculated VaR on 99% of
occasions, but on the other 1%, losses are expected to be greater and may substantially exceed the calculated
VaR. VaR is a statistical estimation and therefore it is possible that there could be, in any period, a greater number of days in which losses could exceed the calculated VaR.
VaR analysis (historical simulation) 30 June 2021
Sub-Fund
Absolute
VaR%
Average
VaR%
Minimum
VaR%
Maximum
VaR%
VaR% Limit
Leverage employed
during the period ended
30 June 2020
(%) (% of NAV)
(Limit
utilisation)
(Limit
utilisation)
(Limit
utilisation)
WNT 5.69% 55.46% 27.60% 96.71% 20.00% 2,249.13%
CHENAVARI 0.87% 15.93% 3.18% 39.51% 20.00% 578.06%
WELLS 1.04% 28.74% 3.67% 71.07% 20.00% 381.20%
BLUESCALE 5.69% 55.46% 27.60% 96.71% 20.00% 146.93%
VaR analysis (historical simulation) 31 December 2020
Sub-Fund
Absolute
VaR%
Average
VaR%
Minimum
VaR%
Maximum
VaR%
VaR% Limit
Leverage employed
during the year ended
31 December 2020
(%) (% of NAV)
(Limit
utilisation)
(Limit
utilisation)
(Limit
utilisation)
WNT 17.14% 30.86% 9.35% 85.70% 20.00% 3,115.09%
CHENAVARI 5.57% 17.64% 5.21% 34.85% 20.00% 532.83%
WELLS 12.97% 57.28% 6.69% 90.00% 20.00% 349.94%
BLUESCALE 14.64% 65.80% 14.74% 111.06% 20.00% 316.51%
The Lyxor/Academy Quantitative Global UCITS Fund and Lyxor/Kingdon Global Long-Short Equity Fund were terminated on 13 January 2020
and 30 March 2020, respectively, no leverage percentage was calculated during the period..
It is not envisaged that the Lyxor/Marathon Emerging Markets Bond Fund will employ leverage, except as part of its
currency hedging strategy for share classes that are not in the Sub-Fund’s functional currency.
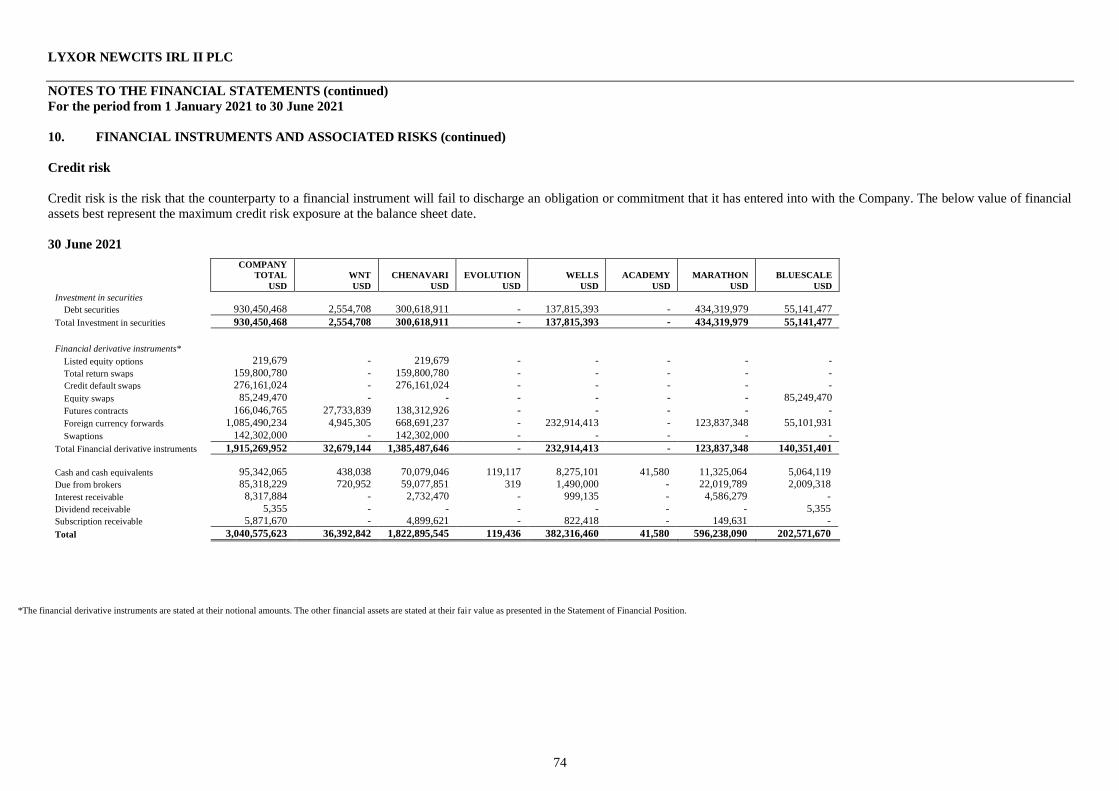
LYXOR NEWCITS IRL II PLC
74
NOTES TO THE FINANCIAL STATEMENTS (continued)
For the period from 1 January 2021 to 30 June 2021
10. FINANCIAL INSTRUMENTS AND ASSOCIATED RISKS (continued)
Credit risk
Credit risk is the risk that the counterparty to a financial instrument will fail to discharge an obligation or commitment that it has entered into with the Company. The below value of financial
assets best represent the maximum credit risk exposure at the balance sheet date.
30 June 2021
*The financial derivative instruments are stated at their notional amounts. The other financial assets are stated at their fair value as presented in the Statement of Financial Position.
COMPANY
TOTAL
USD
WNT
USD
CHENAVARI
USD
EVOLUTION
USD
WELLS
USD
ACADEMY
USD
MARATHON
USD
BLUESCALE
USD
Investment in securities
Debt securities 930,450,468 2,554,708 300,618,911 - 137,815,393 - 434,319,979 55,141,477
Total Investment in securities 930,450,468 2,554,708 300,618,911 - 137,815,393 - 434,319,979 55,141,477
Financial derivative instruments*
Listed equity options 219,679 - 219,679 - - - - -
Total return swaps 159,800,780 - 159,800,780 - - - - -
Credit default swaps 276,161,024 - 276,161,024 - - - - -
Equity swaps 85,249,470 - - - - - - 85,249,470
Futures contracts 166,046,765 27,733,839 138,312,926 - - - - -
Foreign currency forwards 1,085,490,234 4,945,305 668,691,237 - 232,914,413 - 123,837,348 55,101,931
Swaptions 142,302,000 - 142,302,000 - - - - -
Total Financial derivative instruments 1,915,269,952 32,679,144 1,385,487,646 - 232,914,413 - 123,837,348 140,351,401
Cash and cash equivalents 95,342,065 438,038 70,079,046 119,117 8,275,101 41,580 11,325,064 5,064,119
Due from brokers 85,318,229 720,952 59,077,851 319 1,490,000 - 22,019,789 2,009,318
Interest receivable 8,317,884 - 2,732,470 - 999,135 - 4,586,279 -
Dividend receivable 5,355 - - - - - - 5,355
Subscription receivable 5,871,670 - 4,899,621 - 822,418 - 149,631 -
Total 3,040,575,623 36,392,842 1,822,895,545 119,436 382,316,460 41,580 596,238,090 202,571,670
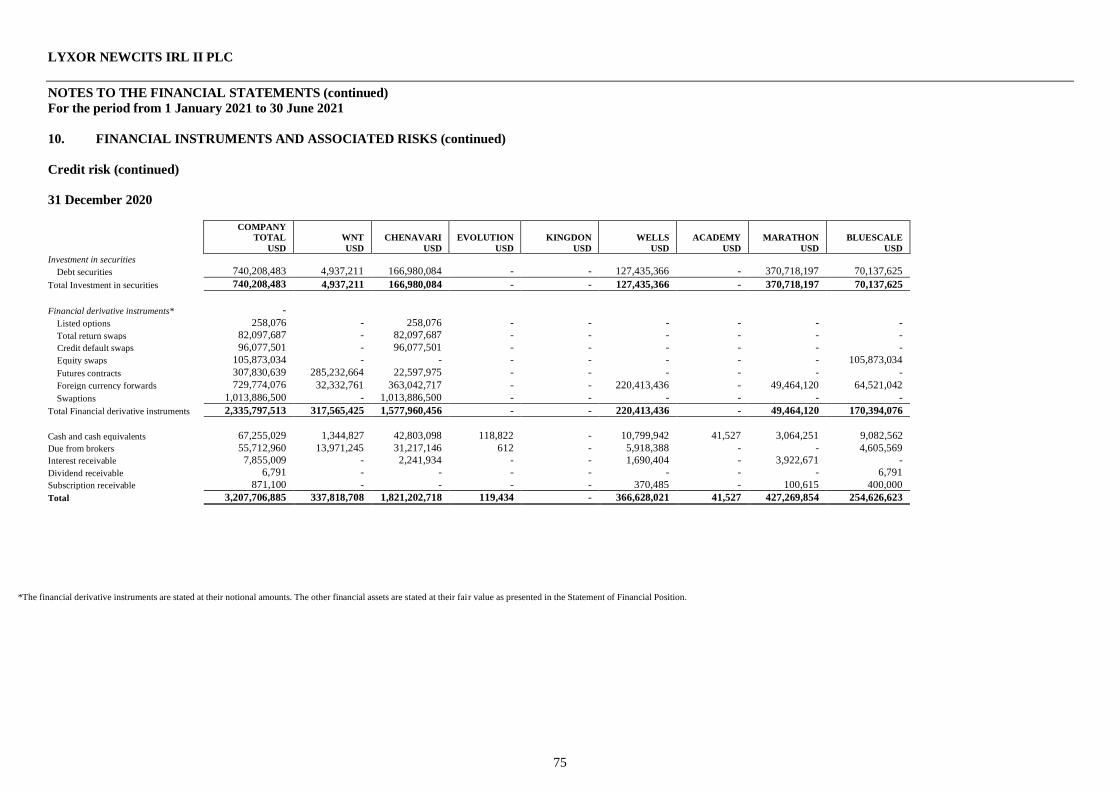
LYXOR NEWCITS IRL II PLC
75
NOTES TO THE FINANCIAL STATEMENTS (continued)
For the period from 1 January 2021 to 30 June 2021
10. FINANCIAL INSTRUMENTS AND ASSOCIATED RISKS (continued)
Credit risk (continued)
31 December 2020
*The financial derivative instruments are stated at their notional amounts. The other financial assets are stated at their fair value as presented in the Statement of Financial Position.
COMPANY
TOTAL
USD
WNT
USD
CHENAVARI
USD
EVOLUTION
USD
KINGDON
USD
WELLS
USD
ACADEMY
USD
MARATHON
USD
BLUESCALE
USD
Investment in securities
Debt securities 740,208,483 4,937,211 166,980,084 - - 127,435,366 - 370,718,197 70,137,625
Total Investment in securities 740,208,483 4,937,211 166,980,084 - - 127,435,366 - 370,718,197 70,137,625
Financial derivative instruments* -
Listed options 258,076 - 258,076 - - - - - -
Total return swaps 82,097,687 - 82,097,687 - - - - - -
Credit default swaps 96,077,501 - 96,077,501 - - - - - -
Equity swaps 105,873,034 - - - - - - - 105,873,034
Futures contracts 307,830,639 285,232,664 22,597,975 - - - - - -
Foreign currency forwards 729,774,076 32,332,761 363,042,717 - - 220,413,436 - 49,464,120 64,521,042
Swaptions 1,013,886,500 - 1,013,886,500 - - - - - -
Total Financial derivative instruments 2,335,797,513 317,565,425 1,577,960,456 - - 220,413,436 - 49,464,120 170,394,076
Cash and cash equivalents 67,255,029 1,344,827 42,803,098 118,822 - 10,799,942 41,527 3,064,251 9,082,562
Due from brokers 55,712,960 13,971,245 31,217,146 612 - 5,918,388 - - 4,605,569
Interest receivable 7,855,009 - 2,241,934 - - 1,690,404 - 3,922,671 -
Dividend receivable 6,791 - - - - - - - 6,791
Subscription receivable 871,100 - - - - 370,485 - 100,615 400,000
Total 3,207,706,885 337,818,708 1,821,202,718 119,434 - 366,628,021 41,527 427,269,854 254,626,623

LYXOR NEWCITS IRL II PLC
76
NOTES TO THE FINANCIAL STATEMENTS (continued)
For the period from 1 January 2021 to 30 June 2021
10. FINANCIAL INSTRUMENTS AND ASSOCIATED RISKS (continued)
Credit risk (continued)
The following table details the name and credit rating of the financial institutions holding the net cash and cash equivalents of each Sub-Fund.
30 June 2021
31 December 2020
CREDIT
RATING
COMPANY
TOTAL
USD
WNT
USD
CHENAVARI
USD
EVOLUTION
USD
WELLS
USD
ACADEMY
USD
MARATHON
USD
BLUESCALE
USD
Goldman Sachs & Co. A+ 4,369,629 - - - - - - 4,369,629
JP Morgan Chase A+ 18,483,176 - 18,483,176 - - - - -
Société Générale A+ 5,505,281 437,814 5,517,942 119,117 (116,690) 2 (575,727) 122,823
Société Générale
Securities Services A+ 65,847,102 - 46,077,928 - 8,183,114 41,578 10,972,870 571,612
Total 94,205,188 437,814 70,079,046 119,117 8,066,424 41,580 10,397,143 5,064,064
CREDIT
RATING
COMPANY
TOTAL
USD
WNT
USD
CHENAVARI
USD
EVOLUTION
USD
WELLS
USD
ACADEMY
USD
MARATHON
USD
BLUESCALE
USD
Goldman Sachs & Co. A+ 2,669,215 - - - - - - 2,669,215
JP Morgan Chase A+ 10,098,993 - 10,098,993 - - - - -
Société Générale A+ 7,771,820 1,344,827 3,748,278 118,823 349,165 - 584,620 1,626,107
Société Générale
Securities Services
A+ 46,710,198 - 28,951,354 (1) 10,450,447 41,527 2,479,631 4,787,240
Total 67,250,226 1,344,827 42,798,625 118,822 10,799,612 41,527 3,064,251 9,082,562

LYXOR NEWCITS IRL II PLC
77
NOTES TO THE FINANCIAL STATEMENTS (continued)
For the period from 1 January 2021 to 30 June 2021
10. FINANCIAL INSTRUMENTS AND ASSOCIATED RISKS (continued)
Credit risk (continued)
The following table details the name and credit rating of the financial institutions holding the net due from/to balances of each Sub-Fund.
30 June 2021
31 December 2020
CREDIT
RATING
COMPANY
TOTAL
USD
WNT
USD
CHENAVARI
USD
EVOLUTION
USD
WELLS
USD
MARATHON
USD
BLUESCALE
USD
UBS AG AA- 296,853 296,853 - - - - -
Goldman Sachs & Co. A+ 6,063,503 - 4,103,483 - - - 1,960,020
JP Morgan Chase A+ 11,526,505 - 11,526,505 - - - -
Société Générale A+ (2,587,311) - (2,211,109) - (407,233) 31,031 -
Société Générale Securities Services A+ (14,109,749) - (577,054) - - (13,450,804) (81,891)
NewEdge A+ 424,414 424,095 - 319 - - -
BNP Paribas A+ 16,716,000 - 15,226,000 - 1,490,000 - -
Morgan Stanley & Co A+ 29,120,000 - 26,398,000 - - 2,722,000 -
Citigroup Global Markets Limited A+ 600,000 - 600,000 - - - -
Total 48,050,215 720,948 55,065,825 319 1,082,767 (10,697,773) 1,878,129
CREDIT
RATING
COMPANY
TOTAL
USD
WNT
USD
CHENAVARI
USD
EVOLUTION
USD
WELLS
USD
BLUESCALE
USD
UBS AG AA- 11,026,015 11,026,015 - - - -
Goldman Sachs & Co. A+ 13,263,504 440,000 2,893,483 - 5,670,000 4,260,021
JP Morgan Chase A+ 11,848,440 - 11,848,440 - - -
Société Générale A+ (1,504,592) (404,876) - - - (1,099,716)
Citibank N.A. A+ 1,350,000 - 1,350,000 - - -
Société Générale Securities Services A+ 109,985 - (2,336) - - 112,321
Société Générale Internaltional Limited A+ 2,594,225 2,505,225 - 612 88,388 -
Bank of America Merill Lynch A+ 143,483 - 143,483 - - -
BNP Paribas AA- 8,616,000 - 8,616,000 - - -
Morgan Stanley & Co A+ 5,845,000 - 5,845,000 - - -
Credit Suisse AG A+ 680,000 - 520,000 - 160,000 -
Total 53,972,060 13,566,364 31,214,070 612 5,918,388 3,272,626
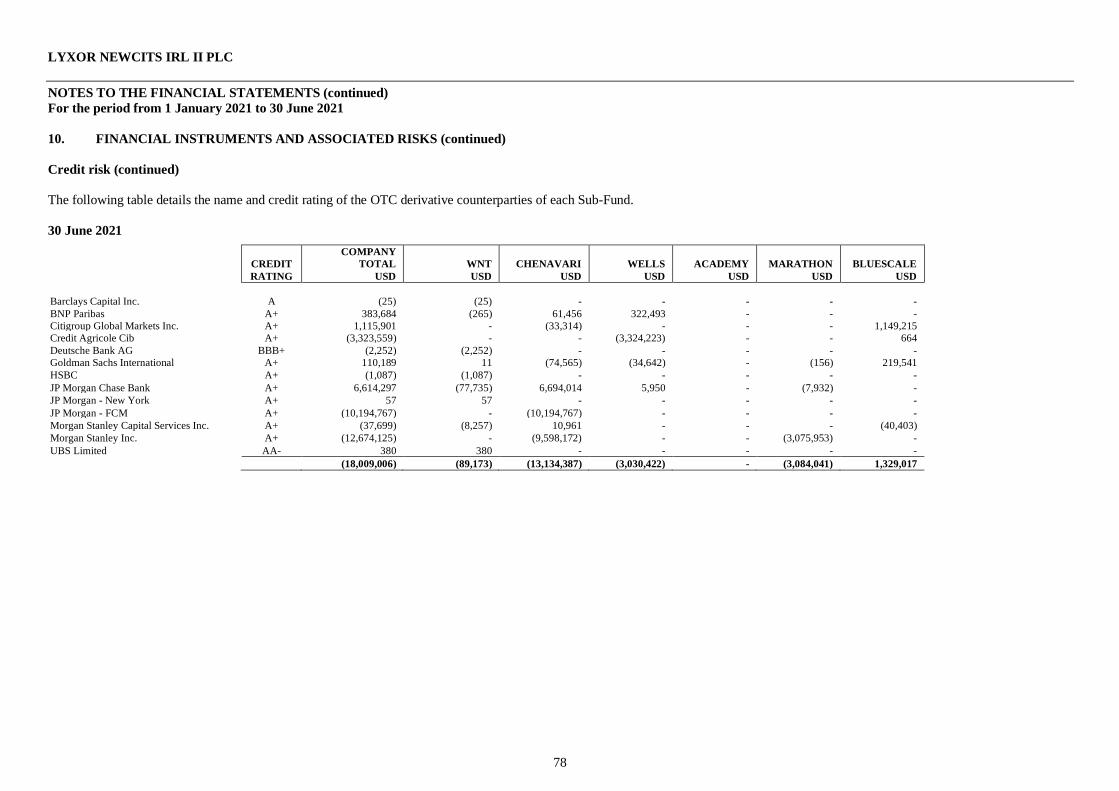
LYXOR NEWCITS IRL II PLC
78
NOTES TO THE FINANCIAL STATEMENTS (continued)
For the period from 1 January 2021 to 30 June 2021
10. FINANCIAL INSTRUMENTS AND ASSOCIATED RISKS (continued)
Credit risk (continued)
The following table details the name and credit rating of the OTC derivative counterparties of each Sub-Fund.
30 June 2021
CREDIT
RATING
COMPANY
TOTAL
USD
WNT
USD
CHENAVARI
USD
WELLS
USD
ACADEMY
USD
MARATHON
USD
BLUESCALE
USD
Barclays Capital Inc. A (25) (25) - - - - -
BNP Paribas A+ 383,684 (265) 61,456 322,493 - - -
Citigroup Global Markets Inc. A+ 1,115,901 - (33,314) - - - 1,149,215
Credit Agricole Cib A+ (3,323,559) - - (3,324,223) - - 664
Deutsche Bank AG BBB+ (2,252) (2,252) - - - - -
Goldman Sachs International A+ 110,189 11 (74,565) (34,642) - (156) 219,541
HSBC A+ (1,087) (1,087) - - - - -
JP Morgan Chase Bank A+ 6,614,297 (77,735) 6,694,014 5,950 - (7,932) -
JP Morgan - New York A+ 57 57 - - - - -
JP Morgan - FCM A+ (10,194,767) - (10,194,767) - - - -
Morgan Stanley Capital Services Inc. A+ (37,699) (8,257) 10,961 - - - (40,403)
Morgan Stanley Inc. A+ (12,674,125) - (9,598,172) - - (3,075,953) -
UBS Limited AA- 380 380 - - - - -
(18,009,006) (89,173) (13,134,387) (3,030,422) - (3,084,041) 1,329,017
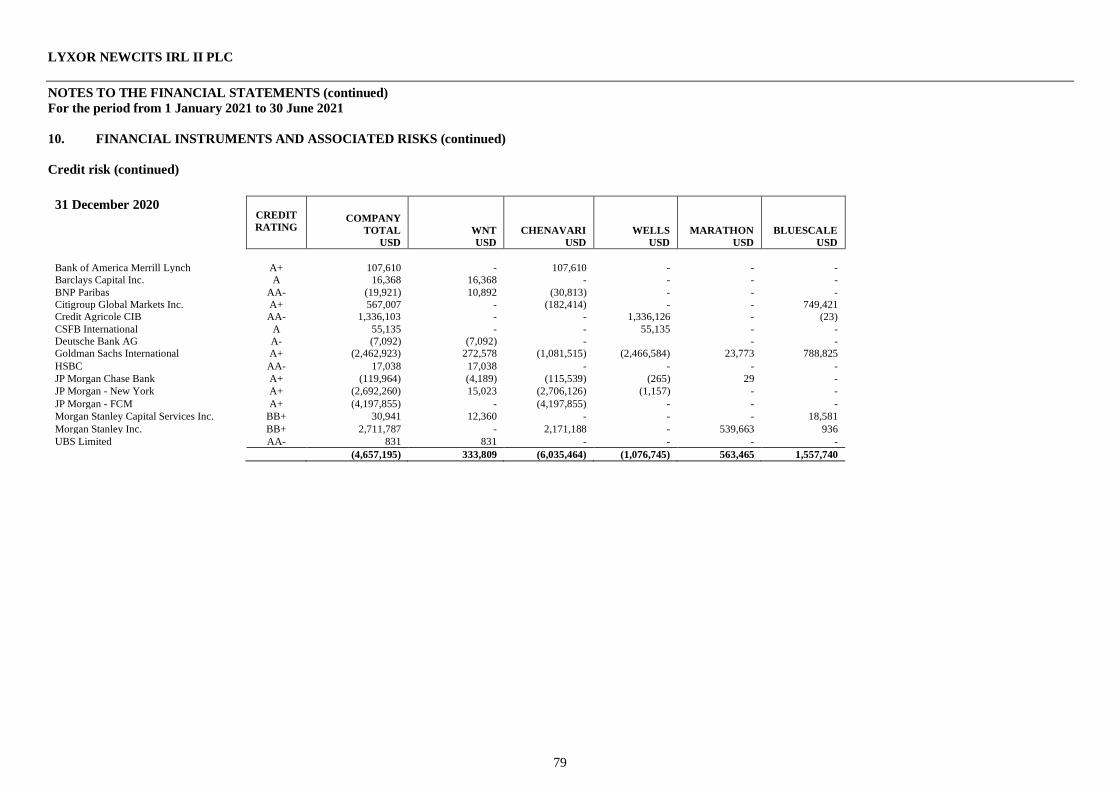
LYXOR NEWCITS IRL II PLC
79
NOTES TO THE FINANCIAL STATEMENTS (continued)
For the period from 1 January 2021 to 30 June 2021
10. FINANCIAL INSTRUMENTS AND ASSOCIATED RISKS (continued)
Credit risk (continued)
31 December 2020
CREDIT
RATING COMPANY
TOTAL
USD
WNT
USD
CHENAVARI
USD
WELLS
USD
MARATHON
USD
BLUESCALE
USD
Bank of America Merrill Lynch A+ 107,610 - 107,610 - - -
Barclays Capital Inc. A 16,368 16,368 - - - -
BNP Paribas AA- (19,921) 10,892 (30,813) - - -
Citigroup Global Markets Inc. A+ 567,007 - (182,414) - - 749,421
Credit Agricole CIB AA- 1,336,103 - - 1,336,126 - (23)
CSFB International A 55,135 - - 55,135 - -
Deutsche Bank AG A- (7,092) (7,092) - - -
Goldman Sachs International A+ (2,462,923) 272,578 (1,081,515) (2,466,584) 23,773 788,825
HSBC AA- 17,038 17,038 - - - -
JP Morgan Chase Bank A+ (119,964) (4,189) (115,539) (265) 29 -
JP Morgan - New York A+ (2,692,260) 15,023 (2,706,126) (1,157) - -
JP Morgan - FCM A+ (4,197,855) - (4,197,855) - - -
Morgan Stanley Capital Services Inc. BB+ 30,941 12,360 - - - 18,581
Morgan Stanley Inc. BB+ 2,711,787 - 2,171,188 - 539,663 936
UBS Limited AA- 831 831 - - - -
(4,657,195) 333,809 (6,035,464) (1,076,745) 563,465 1,557,740
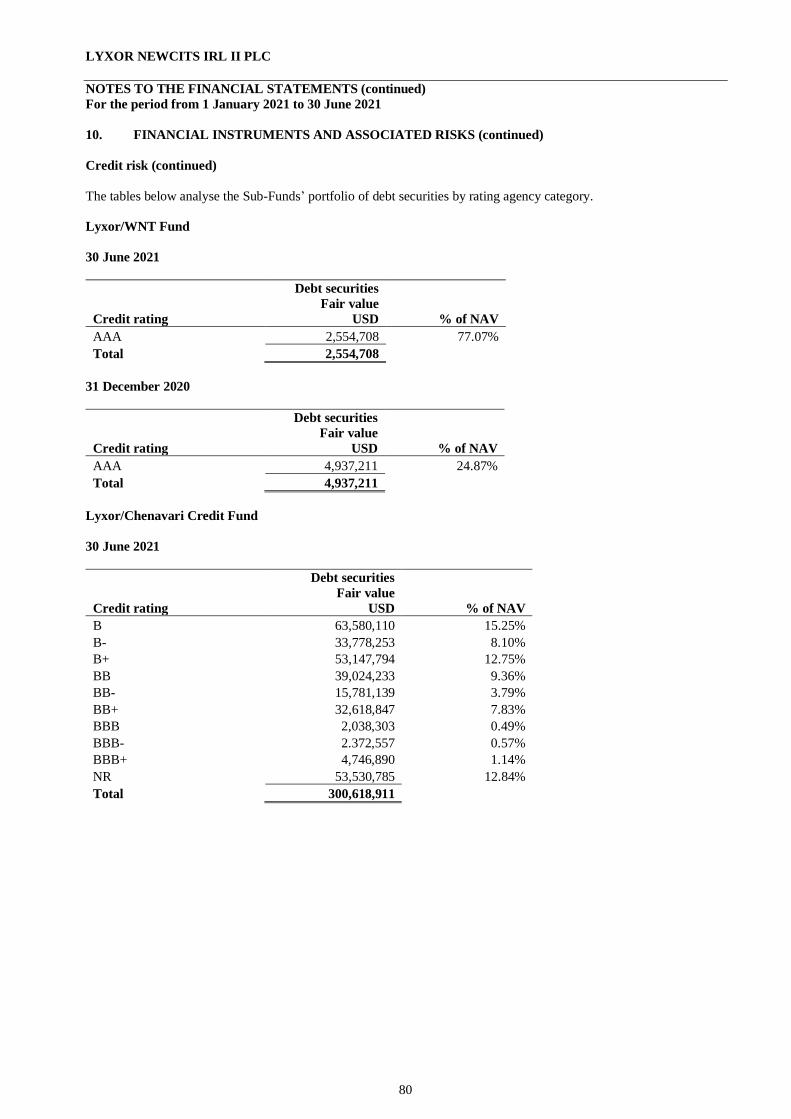
LYXOR NEWCITS IRL II PLC
80
NOTES TO THE FINANCIAL STATEMENTS (continued)
For the period from 1 January 2021 to 30 June 2021
10. FINANCIAL INSTRUMENTS AND ASSOCIATED RISKS (continued)
Credit risk (continued)
The tables below analyse the Sub-Funds’ portfolio of debt securities by rating agency category.
Lyxor/WNT Fund
30 June 2021
Credit rating
Debt securities
Fair value
USD % of NAV
AAA 2,554,708 77.07%
Total 2,554,708
31 December 2020
Credit rating
Debt securities
Fair value
USD % of NAV
AAA 4,937,211 24.87%
Total 4,937,211
Lyxor/Chenavari Credit Fund
30 June 2021
Credit rating
Debt securities
Fair value
USD % of NAV
B 63,580,110 15.25%
B- 33,778,253 8.10%
B+ 53,147,794 12.75%
BB 39,024,233 9.36%
BB- 15,781,139 3.79%
BB+ 32,618,847 7.83%
BBB 2,038,303 0.49%
BBB- 2.372,557 0.57%
BBB+ 4,746,890 1.14%
NR 53,530,785 12.84%
Total 300,618,911
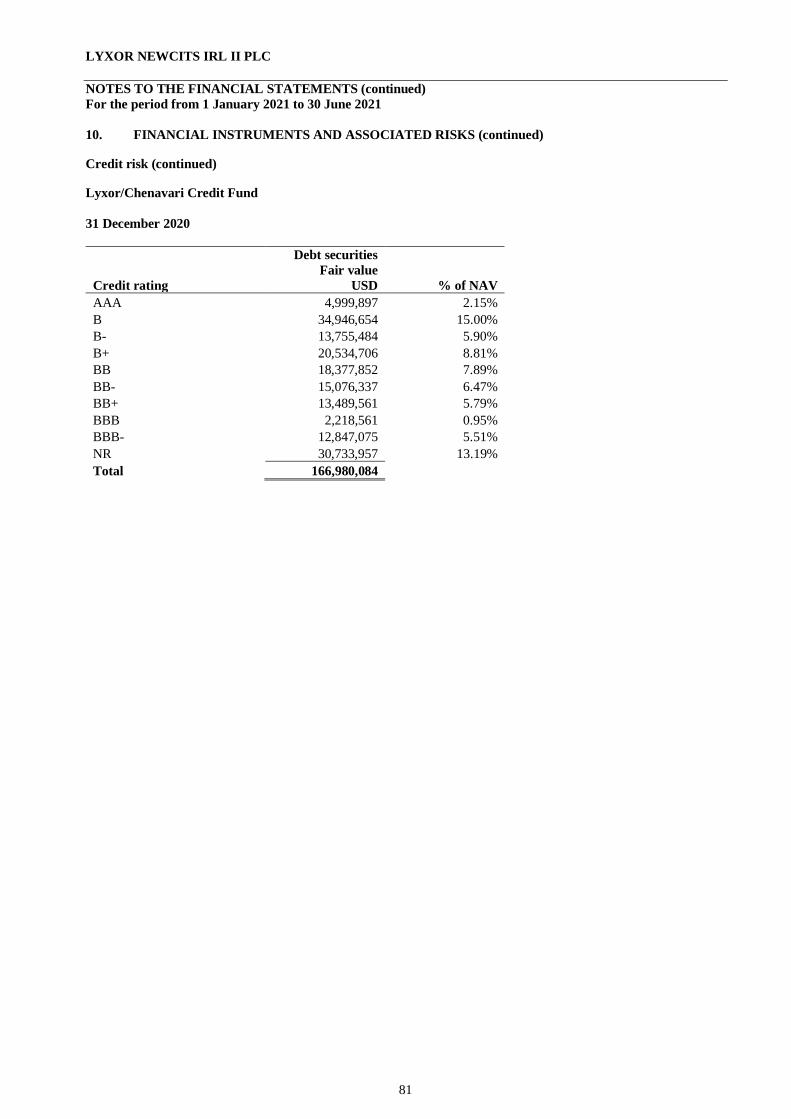
LYXOR NEWCITS IRL II PLC
81
NOTES TO THE FINANCIAL STATEMENTS (continued)
For the period from 1 January 2021 to 30 June 2021
10. FINANCIAL INSTRUMENTS AND ASSOCIATED RISKS (continued)
Credit risk (continued)
Lyxor/Chenavari Credit Fund
31 December 2020
Credit rating
Debt securities
Fair value
USD % of NAV
AAA 4,999,897 2.15%
B 34,946,654 15.00%
B- 13,755,484 5.90%
B+ 20,534,706 8.81%
BB 18,377,852 7.89%
BB- 15,076,337 6.47%
BB+ 13,489,561 5.79%
BBB 2,218,561 0.95%
BBB- 12,847,075 5.51%
NR 30,733,957 13.19%
Total 166,980,084
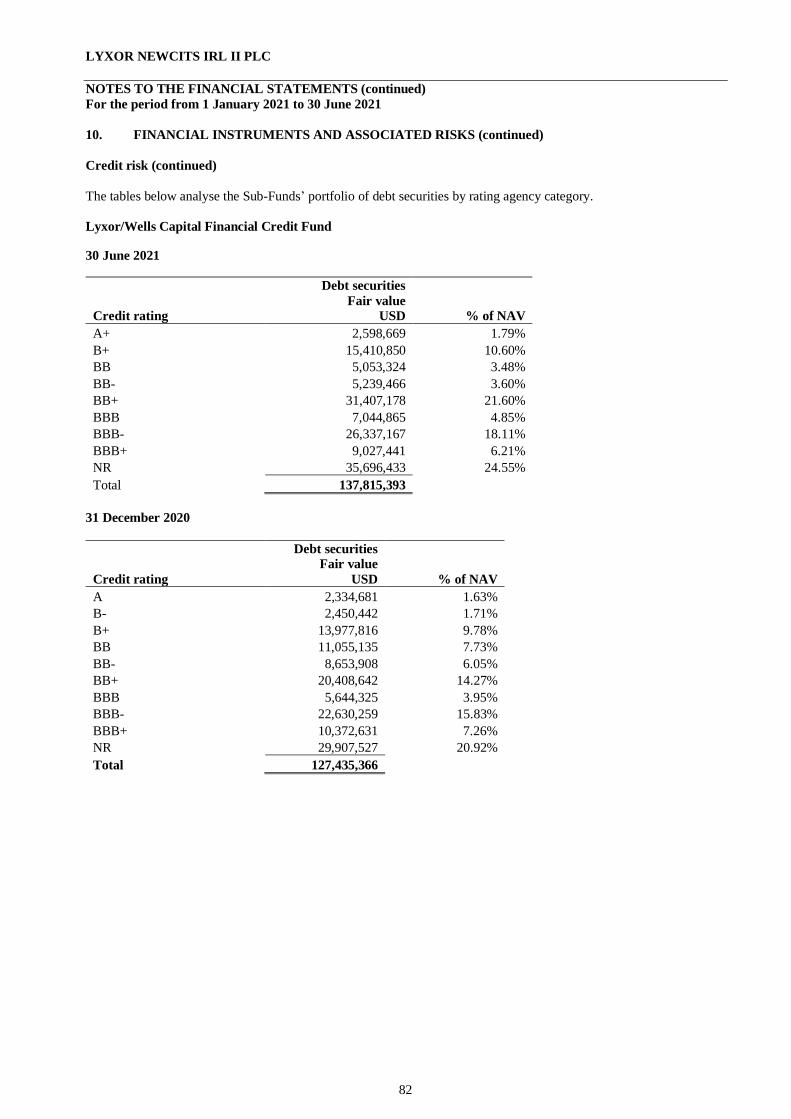
LYXOR NEWCITS IRL II PLC
82
NOTES TO THE FINANCIAL STATEMENTS (continued)
For the period from 1 January 2021 to 30 June 2021
10. FINANCIAL INSTRUMENTS AND ASSOCIATED RISKS (continued)
Credit risk (continued)
The tables below analyse the Sub-Funds’ portfolio of debt securities by rating agency category.
Lyxor/Wells Capital Financial Credit Fund
30 June 2021
Credit rating
Debt securities
Fair value
USD % of NAV
A+ 2,598,669 1.79%
B+ 15,410,850 10.60%
BB 5,053,324 3.48%
BB- 5,239,466 3.60%
BB+ 31,407,178 21.60%
BBB 7,044,865 4.85%
BBB- 26,337,167 18.11%
BBB+ 9,027,441 6.21%
NR 35,696,433 24.55%
Total 137,815,393
31 December 2020
Credit rating
Debt securities
Fair value
USD % of NAV
A 2,334,681 1.63%
B- 2,450,442 1.71%
B+ 13,977,816 9.78%
BB 11,055,135 7.73%
BB- 8,653,908 6.05%
BB+ 20,408,642 14.27%
BBB 5,644,325 3.95%
BBB- 22,630,259 15.83%
BBB+ 10,372,631 7.26%
NR 29,907,527 20.92%
Total 127,435,366
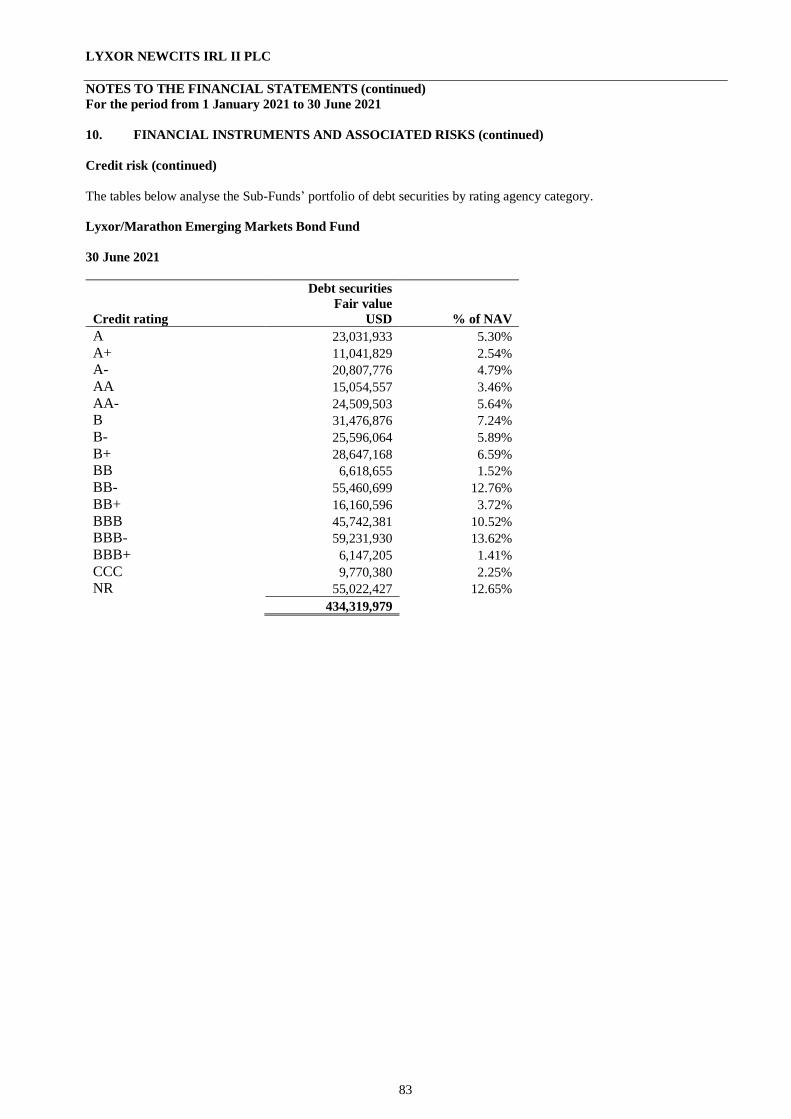
LYXOR NEWCITS IRL II PLC
83
NOTES TO THE FINANCIAL STATEMENTS (continued)
For the period from 1 January 2021 to 30 June 2021
10. FINANCIAL INSTRUMENTS AND ASSOCIATED RISKS (continued)
Credit risk (continued)
The tables below analyse the Sub-Funds’ portfolio of debt securities by rating agency category.
Lyxor/Marathon Emerging Markets Bond Fund
30 June 2021
Credit rating
Debt securities
Fair value
USD % of NAV
A 23,031,933 5.30%
A+ 11,041,829 2.54%
A- 20,807,776 4.79%
AA 15,054,557 3.46%
AA- 24,509,503 5.64%
B 31,476,876 7.24%
B- 25,596,064 5.89%
B+ 28,647,168 6.59%
BB 6,618,655 1.52%
BB- 55,460,699 12.76%
BB+ 16,160,596 3.72%
BBB 45,742,381 10.52%
BBB- 59,231,930 13.62%
BBB+ 6,147,205 1.41%
CCC 9,770,380 2.25%
NR 55,022,427 12.65%
434,319,979

LYXOR NEWCITS IRL II PLC
84
NOTES TO THE FINANCIAL STATEMENTS (continued)
For the period from 1 January 2021 to 30 June 2021
10. FINANCIAL INSTRUMENTS AND ASSOCIATED RISKS (continued)
Credit risk (continued)
Lyxor/Marathon Emerging Markets Bond Fund (continued)
31 December 2020
Credit rating
Debt securities
Fair value
USD % of NAV
A 27,516,716 7.30%
A+ 11,432,878 3.03%
A- 14,128,270 3.75%
AA 10,138,493 2.69%
AA- 16,247,219 4.31%
B 30,619,091 8.12%
B- 21,968,526 5.83%
B+ 26,064,206 6.91%
BB 14,148,230 3.75%
BB- 41,506,116 11.01%
BB+ 9,048,338 2.40%
BBB 48,688,151 12.92%
BBB- 40,278,767 10.69%
BBB+ 12,052,944 3.20%
CCC 3,848,750 1.02%
CCC+ 1,352,343 0.36%
NR 41,679,159 11.06%
370,718,197
Lyxor/Bluescale Global Equity Alpha Fund
30 June 2021
Credit rating
Debt securities
Fair value
USD % of NAV
AAA 55,141,477 87.12%
55,141,477
31 December 2020
Credit rating
Debt securities
Fair value
USD % of NAV
AAA 70,137,625 83.65%
70,137,625

LYXOR NEWCITS IRL II PLC
85
NOTES TO THE FINANCIAL STATEMENTS (continued)
For the period from 1 January 2021 to 30 June 2021
10. FINANCIAL INSTRUMENTS AND ASSOCIATED RISKS (continued)
Credit risk (continued)
The Depositary network holds securities (i.e. bonds), cash, and/or collateral for the Company. Bankruptcy, insolvency
or other credit default events of the Depositary or its Sub-Depositary network (“Institution”) may cause the Company’s rights with respect to securities and other assets (including collateral) held by the Depositary to be delayed or limited. In
the event of the insolvency or bankruptcy of the Institution, the Company will be treated as a general creditor with
respect to cash. The maximum exposure to this risk at the 30 June 2021 and 31 December 2020 is the carrying value of
the relevant assets other than derivatives.
The Sub-Funds monitor their risk by periodically reviewing the credit quality of the Depositary and its parent company,
Société Générale S.A. At 30 June 2021, the long term senior debt credit rating of Société Générale S.A. from Standard
& Poor’s was A+ (2020: A+). In respect of the cash held with any institution, including the Depositary, the Company
will be exposed to the credit risk of that institution.
The Company is required to disclose the impact of offsetting assets and liabilities represented in the Statement of Financial Position to enable users of the financial statements to evaluate the effect or potential effect of netting
arrangements on its financial position for recognised assets and liabilities. These recognised assets and liabilities are
financial instruments and derivative instruments that are either subject to an enforceable master netting agreement or
similar agreement or meet the following right of set off criteria: if the Company currently has a legally enforceable right
to set off the recognised amounts; and if it intends either to settle on a net basis, or to realise the asset and settle the
liability simultaneously.
As of 30 June 2021 and 31 December 2020, the Company does not hold financial instruments and derivative
instruments that are eligible for offset in the Statement of Financial Position but does hold those which are subject to a
master netting arrangement or similar arrangements. The rights of setoff under these agreements with respect to the
Company’s recognised financial assets and recognised financial liabilities included in the below table under the heading
‘Gross amounts not offset in the Statement of Financial Position’ are as below:
• If on any date identical amounts are payable by each party to the other in the same currency and in respect of
the same transaction then, on such date, each party's obligation to make payment of any such amount will be
automatically satisfied and discharged. However, if the aggregate amount payable by one party exceeds the
payable by the other, then the party liable to larger amount will pay the excess amount to other party.
• In respect of two or more transactions, the parties may elect that a net amount will be determined in respect of
all amounts payable on the same date and in the same currency. This election may be made separately for
different groups of transactions, usually except for FX transactions and currency options.
• In case of early termination (such as in the case of default), the amounts payable will be subject to set off. The net amount payable or receivable will be the sum of the settlement amount in respect of the terminated
transactions and the termination currency equivalent of the unpaid amounts payable to the other party less the
termination currency equivalent of the unpaid amounts receivable from the other party.
Expected credit losses
As of 30 June 2021 and 31 December 2020, the cash and cash equivalents, due from brokers and other short-term
receivables are held with most counterparties with a credit rating of A+ or higher and are due to be settled within one
week. Management considers the probability of default to be close to zero as the counterparties have a strong capacity
to meet their contractual obligations in the near term. As a result, no loss allowance has been recognised based on 12-
month expected credit losses as any such impairment would be wholly insignificant to the Company.

LYXOR NEWCITS IRL II PLC
86
NOTES TO THE FINANCIAL STATEMENTS (continued)
For the period from 1 January 2021 to 30 June 2021
11. RELATED PARTY DISCLOSURES
IAS 24, Related Party Disclosures – Parties are considered to be related if one party has the ability to control the other
party or exercise significant influence over the other party in making financial or operational decisions.
Directors and dependents thereof
Mr. Moez Bousarsar and Mr. Olivier Germain are employees of Lyxor Asset Management S.A.S., the Manager.
The Directors’ fees are recognised and paid by the Manager (Note 6).
None of the Directors hold shares in any of the Company’s Sub-Funds during the period ended 30 June 2021
(December 2020: Nil).
Significant shareholders
The number of significant shareholders and the percentage of their shareholdings per Sub-Fund at the financial period end date follow:
Manager, Distributor and Investment Manager
Lyxor Asset Management S.A.S., the Manager, is a wholly-owned subsidiary of Société Générale S.A.. The Manager
is responsible for the day to day management, administration and investment management of the Company. The
Manager provides or procures the provision of management, administration, accounting, registration, transfer agency,
distribution, investment management or advisory and shareholder services to or for the benefit of the Company.
The Manager also acts as the Distributor of the Company.
The Manager appointed Lyxor International Asset Management S.A.S. to act as Investment Manager to provide such
investment management and advisory services to the Company as the Manager may from time to time require. The Investment Manager is owned by the Manager (95.06%) and by Société Générale S.A. (4.94%).
The Investment Management Agreement appoints the Investment Manager to provide cash management services to
certain Sub-Funds and to provide such other services as may be agreed between the Manager and the Investment
Manager from time to time.
The management fees recognised during the period were disclosed in Note 6.
Sub-Fund
No. of
shareholders Holdings %
Lyxor/WNT Fund - N/A
Lyxor/Chenavari Credit Fund - N/A
Lyxor/Marathon Emerging Markets Bond Fund 1 23.87%
Lyxor/Bluescale Global Equity Alpha Fund 1 72.62%
Lyxor/Wells Capital Financial Credit Fund 1 39.30%
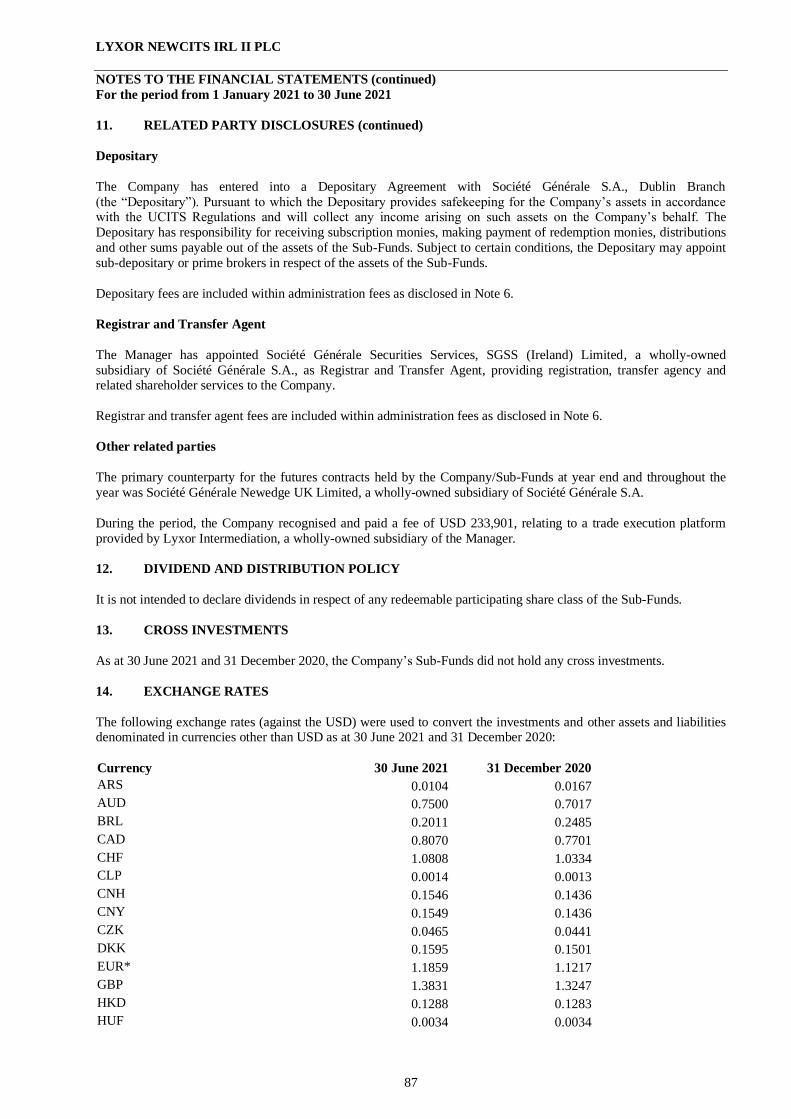
LYXOR NEWCITS IRL II PLC
87
NOTES TO THE FINANCIAL STATEMENTS (continued)
For the period from 1 January 2021 to 30 June 2021
11. RELATED PARTY DISCLOSURES (continued)
Depositary
The Company has entered into a Depositary Agreement with Société Générale S.A., Dublin Branch
(the “Depositary”). Pursuant to which the Depositary provides safekeeping for the Company’s assets in accordance with the UCITS Regulations and will collect any income arising on such assets on the Company’s behalf. The
Depositary has responsibility for receiving subscription monies, making payment of redemption monies, distributions
and other sums payable out of the assets of the Sub-Funds. Subject to certain conditions, the Depositary may appoint
sub-depositary or prime brokers in respect of the assets of the Sub-Funds.
Depositary fees are included within administration fees as disclosed in Note 6.
Registrar and Transfer Agent
The Manager has appointed Société Générale Securities Services, SGSS (Ireland) Limited, a wholly-owned
subsidiary of Société Générale S.A., as Registrar and Transfer Agent, providing registration, transfer agency and related shareholder services to the Company.
Registrar and transfer agent fees are included within administration fees as disclosed in Note 6.
Other related parties
The primary counterparty for the futures contracts held by the Company/Sub-Funds at year end and throughout the
year was Société Générale Newedge UK Limited, a wholly-owned subsidiary of Société Générale S.A.
During the period, the Company recognised and paid a fee of USD 233,901, relating to a trade execution platform
provided by Lyxor Intermediation, a wholly-owned subsidiary of the Manager.
12. DIVIDEND AND DISTRIBUTION POLICY
It is not intended to declare dividends in respect of any redeemable participating share class of the Sub-Funds.
13. CROSS INVESTMENTS
As at 30 June 2021 and 31 December 2020, the Company’s Sub-Funds did not hold any cross investments.
14. EXCHANGE RATES
The following exchange rates (against the USD) were used to convert the investments and other assets and liabilities denominated in currencies other than USD as at 30 June 2021 and 31 December 2020:
Currency 30 June 2021 31 December 2020
ARS 0.0104 0.0167
AUD 0.7500 0.7017
BRL 0.2011 0.2485
CAD 0.8070 0.7701
CHF 1.0808 1.0334
CLP 0.0014 0.0013
CNH 0.1546 0.1436
CNY 0.1549 0.1436
CZK 0.0465 0.0441
DKK 0.1595 0.1501
EUR* 1.1859 1.1217
GBP 1.3831 1.3247
HKD 0.1288 0.1283
HUF 0.0034 0.0034

LYXOR NEWCITS IRL II PLC
88
NOTES TO THE FINANCIAL STATEMENTS (continued)
For the period from 1 January 2021 to 30 June 2021
14. EXCHANGE RATES (continued)
Currency 30 June 2021 31 December 2019
IDR 0.0001 0.0001
ILS 0.3066 0.2896
INR 0.0134 0.014
JPY 0.0090 0.0092
KRW 0.0009 0.0009
MXN 0.0502 0.0529
MYR 0.2410 0.2444
NOK 0.1161 0.1139
NZD 0.6990 0.6732
PEN 0.2587 0.3019
PHP 0.0205 0.0197
PLN 0.2623 0.2636
RUB 0.0137 0.0161
SEK 0.1169 0.1068 SGD 0.7436 0.7435
TRY 0.1149 0.1681
TWD 0.0359 0.0333
ZAR 0.0701 0.0714
15. SOFT COMMISSION ARRANGEMENTS AND RESEARCH FEES
Soft commission arrangements
The following table details the soft commission arrangements that are in place for each Sub-Fund at period/year end.
30 June 2021 31 December 2020
Sub-Funds Sub-Investment Manager USD USD
Kingdon Global Long-Short Equity Fund Kingdon Capital Management LLC - 1,707
Lyxor/Bluescale Global Equity Alpha Fund The Putnam Advisory Company LLC 2,346 75,588
Research fees
For the Lyxor/Chenavari Credit Fund , the Sub-Investment Manager, Chenavari Credit Partners LLP , is entitled to
receive a research and data Fee of up to 0.10% ofthe net asset value of each class of the Sub-Fund per annum, which
will be exclusively used by theSub-Investment Manager to pay the fees incurred by the Sub-Investment Manager in
getting access tomarket research and data including but not limited to ESG research, analyst research, news
andquotation equipment and services (including fees for data and software providers), expenses related to all market
and ESG data and related software used by the Sub-Investment Manager. Any research and data costs in excess of
0.10% of the net asset value of a class per annum will be borne by the Manager or the Sub-Investment Manager and
will not be charged to the Sub-Fund.
During the period, research fees of USD 7,997 were recognised and included within other expenses in the Statement
of Comprehensive Income (2020: USD Nil).
For the Lyxor/Academy Quantitative Global UCITS Fund, the Sub-Investment Manager, Academy Investment Management LLC, was entitled to receive a research and data fee of up to 0.10% of the NAV of each share class of the Sub-
Fund per annum, which was exclusively used by the Sub-Investment Manager to pay the fees incurred by it in getting access to market research and data including but not limited to analyst research, news and quotation equipment, and services
(including fees for data and software providers), expenses related to all market data and related software.
On 13 January 2020, the Lyxor/Academy Quantitative Global UCITS Fund was liquidated.
During the period, research fees of USD Nil (2020: USD 32) were recognised and included within other expenses in the Statement of Comprehensive Income.
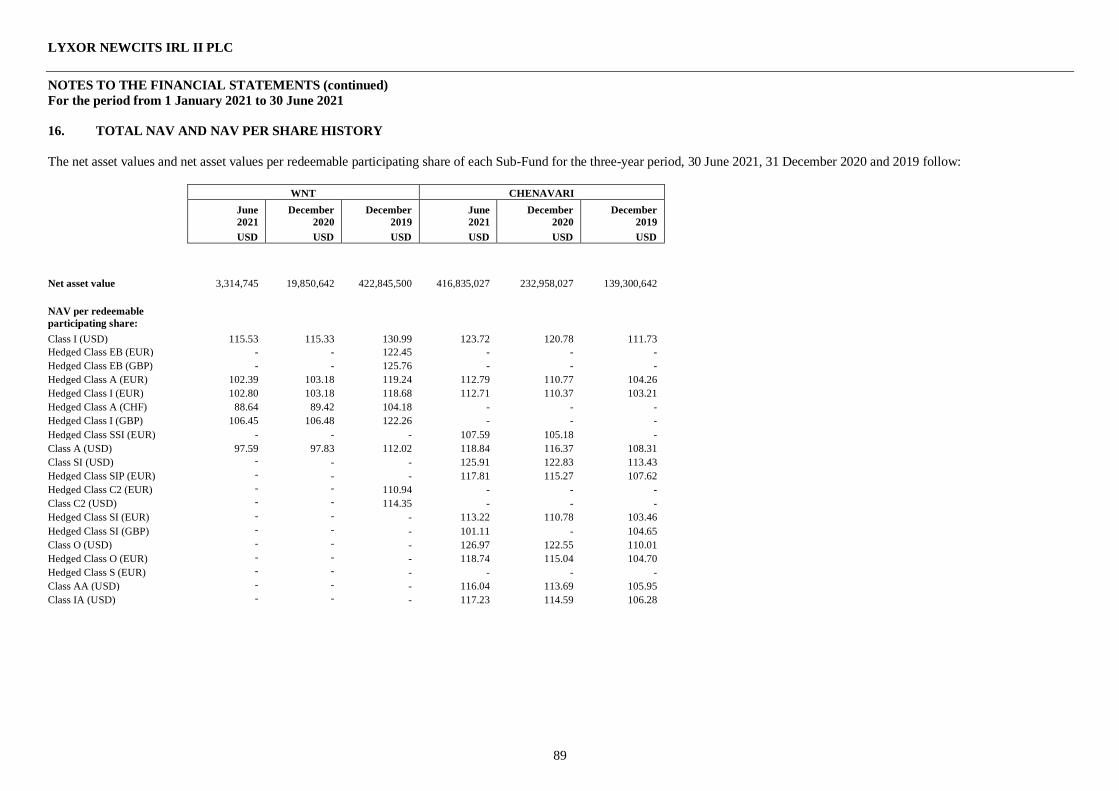
LYXOR NEWCITS IRL II PLC
89
NOTES TO THE FINANCIAL STATEMENTS (continued)
For the period from 1 January 2021 to 30 June 2021
16. TOTAL NAV AND NAV PER SHARE HISTORY
The net asset values and net asset values per redeemable participating share of each Sub-Fund for the three-year period, 30 June 2021, 31 December 2020 and 2019 follow:
WNT CHENAVARI
June
2021
December
2020
December
2019
June
2021
December
2020
December
2019
USD USD USD USD USD USD
Net asset value
3,314,745 19,850,642 422,845,500
416,835,027 232,958,027 139,300,642
NAV per redeemable
participating share:
Class I (USD) 115.53 115.33 130.99 123.72 120.78 111.73
Hedged Class EB (EUR) - - 122.45 - - -
Hedged Class EB (GBP) - - 125.76 - - -
Hedged Class A (EUR) 102.39 103.18 119.24 112.79 110.77 104.26
Hedged Class I (EUR) 102.80 103.18 118.68 112.71 110.37 103.21
Hedged Class A (CHF) 88.64 89.42 104.18 - - -
Hedged Class I (GBP) 106.45 106.48 122.26 - - -
Hedged Class SSI (EUR) - - - 107.59 105.18 -
Class A (USD) 97.59 97.83 112.02 118.84 116.37 108.31
Class SI (USD) - - - 125.91 122.83 113.43
Hedged Class SIP (EUR) - - - 117.81 115.27 107.62
Hedged Class C2 (EUR) - - 110.94 - - -
Class C2 (USD) - - 114.35 - - -
Hedged Class SI (EUR) - - - 113.22 110.78 103.46
Hedged Class SI (GBP) - - - 101.11 - 104.65
Class O (USD) - - - 126.97 122.55 110.01
Hedged Class O (EUR) - - - 118.74 115.04 104.70
Hedged Class S (EUR) - - - - - -
Class AA (USD) - - - 116.04 113.69 105.95
Class IA (USD) - - - 117.23 114.59 106.28

LYXOR NEWCITS IRL II PLC
90
NOTES TO THE FINANCIAL STATEMENTS (continued)
For the period from 1 January 2021 to 30 June 2021
16. TOTAL NAV AND NAV PER SHARE HISTORY (continued)
KINGDON WELLS ACADEMY
December
2019
June
2021
December
2020
December
2019
December
2019
USD USD USD USD USD
Net asset value 25,676,093 145,397,629 142,969,906 126,672,376 1,235,998
NAV per redeemable
participating share:
Class SI (USD) - 122.41 117.94 112.44 -
Class I (USD) 104.22 138.23 133.25 127.15 100.79
Hedged Class EB (EUR) - - - - 1,041.99
Class EB (USD) - - - - -
Hedged Class A (EUR) - 119.78 116.29 114.00 -
Hedged Class I (EUR) 95.82 124.01 119.95 116.71 106.29
Class A (USD) - 126.43 122.33 117.62 -
Hedged Class SI (EUR) - - - - -
Hedged Class I (GBP) - - - - 114.07
Hedged Class O (EUR) - - - - 1,057.73
Class O (USD) - - - - 988.97
Hedged Class O (CHF) - - - - 954.90

LYXOR NEWCITS IRL II PLC
91
NOTES TO THE FINANCIAL STATEMENTS (continued)
For the period from 1 January 2021 to 30 June 2021
16. TOTAL NAV AND NAV PER SHARE HISTORY (continued)
MARATHON BLUESCALE
June
2021 December
2020
December
2019
June
2021 December
2020
December
2019
USD USD USD USD USD USD
Net asset value 434,811,758 376,956,293 206,009,536 63,290,376 83,849,492 10,015,221
NAV per redeemable
participating share:
Class I (USD) 112.72 114.68 107.92 104.71 113.65 100.12
Hedged Class EB (EUR) - - - - - -
Hedged Class I (EUR) 107.71 110.03 105.68 - - -
Hedged Class I (GBP) 108.57 110.46 106.53 - - -
Class F (USD) 113.92 115.72 108.58 108.76 117.63 100.15
Hedged Class A (EUR) 106.04 108.67 105.18 93.34 102.09 -
Class IA (USD) - - 107.93 - - -
Class AA (USD) - - 107.38 - - -
Class A (USD) 111.43 113.76 107.78 93.31 101.71 -
Class EB (USD) - - - 104.98 113.71 100.10
Class SI (USD) 109.13 110.97 - - - -
Hedged Class SID (CHF) 103.08 - - - - -
Hedged Class SID (EUR) 103.23 - - - - -
Hedged Class SID (GBP) 103.39 - - - - -
Class SID (USD) 103.53 - - - - -
LYXOR NEWCITS IRL II PLC
92
NOTES TO THE FINANCIAL STATEMENTS (continued)
For the period from 1 January 2021 to 30 June 2021
17. PROSPECTUS CHANGES
The details of changes in the Prospectus and Supplements during the period are disclosed in Note 20, significant events
during the period.
18. CHARGES OVER ASSETS
There are no liens or encumbrances on the Company’s assets other than:
(i) standard general liens that the Company, in relation to the Sub-Funds, has provided to the Depositary under the
terms of the market standard agreement for the provision of certain depositary services in respect of any fees
and expenses or credit exposures incurred in the performance of services under such agreement and;
(ii) standard security interests over assets of certain Sub-Funds of the Company that the Company has provided to
relevant counterparties pursuant to the standard market terms of the relevant trading agreements in place for
such Sub-Funds.
Refer to Note 7 for collateral and margin posted by each of the Sub-Funds against financial derivative instruments.
19. COMMITMENT AND CONTINGENCIES
The Company and the Sub-Funds did not have commitments and contingencies as at 30 June 2021.
20. SIGNIFICANT EVENTS DURING THE PERIOD
On 1 March 2021, the Company issued a revised Prospectus and Supplements for the Sub-Funds in order to comply with
Regulation (EU) 2019/2088 of the European Parliament and of the Council on sustainability-related disclosures in the financial services sector (“SFDR”) that applies from 10 March 2021.
The United Kingdom (“UK”) left the European Union (“EU”) on 31 January 2020 pursuant to the terms of a withdrawal
agreement between the UK and the EU. Since 1 January 2021, the UK is now qualified as a “third party-country” from the EU.
As a result, the UK financial services firms have lost their EU passport rights in the EU. Further details on the impact of Brexit can be found in the Investment Manager’s Report.
On 1 March 2021, the Company issued a new Supplement for below Sub-Funds:
• Lyxor/Marathon Emerging Markets Bond Fund
• Lyxor/Bluescale Global Equity Alpha Fund
• Lyxor/Wells Capital Financial Credit Fund
• Lyxor/Chenavari Credit Fund During the period, the following share classes were launched:
During the period, we have seen the development of the coronavirus Covid-19 outbreak initially in China and now reaching almost all continents. At present, it is not possible to assess the detailed impact of this risk on the companies in our portfolio but
there is growing concern about the impact on the world economy. There has been a significant correction in the financial markets in the last few months. The Board of Directors and the Manager continue to watch the efforts of governments to
contain the spread of the virus and monitor the economic impact, if any, on the companies in our portfolio.
Sub-Fund Date
Lyxor/Marathon Emerging Markets Bond Fund Hedged Class SID (EUR) Launched on 19 March 2021
Hedged Class SID (CHF) Launched on 22 March 2021
Hedged Class SID (GBP) Launched on 22 March 2021
Class SID (USD) Launched on 19 March 2021
LYXOR NEWCITS IRL II PLC
93
NOTES TO THE FINANCIAL STATEMENTS (continued)
For the period from 1 January 2021 to 30 June 2021
20. SIGNIFICANT EVENTS DURING THE PERIOD (continued)
On June 2021, Société Générale and Amundi Asset Management have agreed on the sale of Lyxor Group’s activities, together
with the commercial and support functions dedicated to them. Although a small portion will remain at Société Générale and the whole acquisition is subject to regulatory clearances, it will lead to a change of 100% of shareholding of the Lyxor Group from
Société Générale to Amundi Asset Management.
There have been no other significant events during the period.
21. SUBSEQUENT EVENTS
Subsequent to year end, management decided to terminate Lyxor/WNT Fund Ltd on 19 July 2021.
The Board of Directors, the Manager and the Investment Manager continue to monitor central banks’ measures, local financial
regulators actions on financial markets and governments' efforts to contain the spread of the Covid-19 virus and their impacts
on the economy and the securities held in the Sub-Funds’ portfolio. There have been no other significant events subsequent to period end.
22. APPROVAL OF THE FINANCIAL STATEMENTS
The financial statements were approved by the Board of Directors on 19 August 2021.
LYXOR NEWCITS IRL II PLC
94
CONDENSED SCHEDULE OF INVESTMENTS
As at 30 June 2021
Lyxor/WNT Fund
No. of
shares/
Nominal
value/ No. of
contracts
Fair Value
USD
% of
Net
Assets
Financial assets
Transferrable securities traded on a regulated market
Debt securities
United States of America
United States of America , 0.00% , 26 August, 2021 265,000 264,983 7.99%
United States of America , 0.00% , 16 September, 2021 450,000 449,960 13.57%
United States of America , 0.00% , 30 September, 2021 450,000 449,951 13.57%
United States of America , 0.00% , 07 October, 2021 200,000 199,977 6.03%
United States of America , 0.00% , 21 October, 2021 450,000 449,946 13.58%
United States of America , 0.00% , 28 October, 2021 290,000 289,959 8.75%
United States of America , 0.00% , 04 November, 2021 450,000 449,932 13.58%
Total Debt securities (31 December 2020: USD 4,937,211 – 24.88%) 2,554,708 77.07%
Total Transferrable securities traded on a regulated market
(31 December 2020: USD 4,937,211 – 24.88%) 2,554,708 77.07%
Financial derivative instruments (Assets)
Financial derivative instruments – Dealt in on a regulated market (Assets)
Futures contracts
Australia 2 74 0.00%
Germany (1) 1,518 0.05%
Hong Kong Special Administrative,Region of China (1) 200 0.01%
Singapore 2 1,066 0.04%
South Africa (1) 1,224 0.04%
United States of America (14) 29,558 0.87%
Total Futures contracts (31 December 2020: USD 390,634 – 1.92%) 33,640 1.01%
Total Financial derivative instruments – Dealt in on a regulated market (Assets)
(31 December 2020: USD 390,634 – 1.92%) 33,640 1.01%
LYXOR NEWCITS IRL II PLC
95
CONDENSED SCHEDULE OF INVESTMENTS (continued)
As at 30 June 2021
Lyxor/WNT Fund (continued)
No. of
shares/
Nominal
value/ No. of
contracts
Fair Value
USD
% of
Net
Assets
Financial assets (continued)
Financial derivative instruments - Over-the-counter (OTC) (Assets)
Foreign currency forwards
Bought
Currency Amount
Bought
Sold
Currency
Amount
Sold
Settlement
Date
Unrealised
Gain
% of
Net
Assets
BRL 505,614 USD 100,000 3 August, 2021 1,315 0.05%
INR 7,467,000 USD 100,000 29 July, 2021 102 0.00%
KRW 113,801,080 USD 100,000 30 July, 2021 687 0.02%
USD 1,599 CHF 1,472 9 July, 2021 7 0.00%
USD 77,397 CNH 500,000 2 July, 2021 24 0.00%
USD 189,116 EUR 158,533 9 July, 2021 1,092 0.03%
USD 8,782 GBP 6,330 9 July, 2021 27 0.00%
Total Foreign currency forwards (31 December 2020: USD 369,687 – 1.86%) 3,254 0.10%
Total Financial derivative instruments - Over-the-counter (OTC) (Assets)
(31 December 2020: USD 369,687 – 1.86%) 3,254 0.10%
Total Financial derivative instruments (Assets) (31 December 2020: USD 760,321 – 3.78%) 36,894 1.11%
Total Financial Assets at Fair Value Through Profit or Loss
(31 December 2020: USD 5,697,532 – 28.66%) 2,591602 78.18%

LYXOR NEWCITS IRL II PLC
96
CONDENSED SCHEDULE OF INVESTMENTS (continued)
As at 30 June 2021
Lyxor/WNT Fund (continued)
No. of
shares/
Nominal
value/ No. of
contracts
Fair Value
USD
% of
Net
Assets
Financial liabilities
Financial derivative instruments (Liabilities)
Financial derivative instruments – Dealt in on a regulated market (Liabilities)
Futures contracts
Australia 18 (3,903) (0.13)%
Canada 2 (793) (0.02)%
Germany 2 (1,020) (0.03)%
Japan 1 (1,485) (0.04)%
Singapore 2 (762) (0.02)%
Sweden 3 (692) (0.02)%
United Kingdom 9 (3,624) (0.11)%
United States of America 83 (88,272) (2.66)%
Total Futures contracts (31 December 2020: USD (31,276) - (0.15)%) (100,551) (3.03)%
Total Financial derivative instruments – Dealt in on a regulated market
(Liabilities) (31 December 2020: USD (31,276) - (0.15)%) (100,551) (3.03)%

LYXOR NEWCITS IRL II PLC
97
CONDENSED SCHEDULE OF INVESTMENTS (continued)
As at 30 June 2021
Lyxor/WNT Fund (continued)
No. of
shares/ Nominal
value/ No. of
contracts
Fair Value
USD
% of
Net
Assets
Financial liabilities (continued)
Financial derivative instruments (Liabilities) (continued)
Financial derivative instruments - Over-the-counter (OTC) (Liabilities)
Foreign currency forwards
Bought
Currency
Amount
Bought
Sold
Currency
Amount
Sold
Settlement
Date
Unrealised
Loss
% of
Net
Assets
CHF 46,180 USD 51,248 9 July, 2021 (1,327) (0.04)%
CNH 500,000 USD 77,398 2 July, 2021 (25) (0.00)%
CNH 2,000,000 USD 310,416 15 September, 2021 (2,726) (0.09)%
EUR 97,645 NOK 1,000,000 15 September, 2021 (217) (0.01)%
EUR 97,774 SEK 1,000,000 15 September, 2021 (832) (0.03)%
EUR 1,955,183 USD 2,381,362 9 July, 2021 (62,464) (1.89)%
GBP 500,237 USD 706,893 9 July, 2021 (15,026) (0.45)%
NOK 2,000,000 EUR 198,257 15 September, 2021 (3,089) (0.09)%
RUB 7,262,920 USD 100,000 30 July, 2021 (1,087) (0.03)%
SEK 2,000,000 EUR 198,759 15 September, 2021 (2,148) (0.06)%
USD 41,379 EUR 34,893 9 July, 2021 (5) (0.00)%
USD 12,992 GBP 9,413 9 July, 2021 (28) (0.00)%
ZAR 1,000,000 USD 72,872 15 September, 2021 (3,453) (0.10)%
Total Foreign currency forwards (31 December 2020: USD (35,878) - (0.15)%) (92,427) (2.79)%
Total Financial derivative instruments - Over-the-counter (OTC) (Liabilities)
(31 December 2020: USD (35,878) - (0.15)%) (92,427) (2.79)%
Total Financial derivative instruments (Liabilities)
(31 December 2020: USD (67,154) - (0.30)%) (192,978) (5.82)%

LYXOR NEWCITS IRL II PLC
98
CONDENSED SCHEDULE OF INVESTMENTS (continued)
As at 30 June 2021
Lyxor/WNT Fund (continued)
No. of
shares/
Nominal
value/ No. of
contracts
Fair Value
USD
% of
Net
Assets
Total Financial Liabilities at Fair Value Through Profit or Loss
(31 December 2020: USD (67,154) - (0.30)%) (192,978) (5.82)%
Cash and cash equivalents and Other assets and liabilities – net
(31 December 2020: USD 14,220,264 - 74.64%) 916,121 27.64%
Net assets attributable to holders of redeemable participating shares
(31 December 2020: USD 19,850,642 - 100.00%) 3,314,745 100.00%
Analysis of Total Assets
Fair Value
USD
% of
Total
Assets
Transferrable securities traded on a regulated market 2,554,708 68.11%
Financial derivative instruments – Dealt in on a regulated market (Assets) 33,640 0.90%
Financial derivative instruments - Over-the-counter (OTC) (Assets) 3,254 0.09%
Cash and cash equivalents 438,038 11.68%
Other assets 720,952 19.22%
Total Assets 3,750,592 100.00%
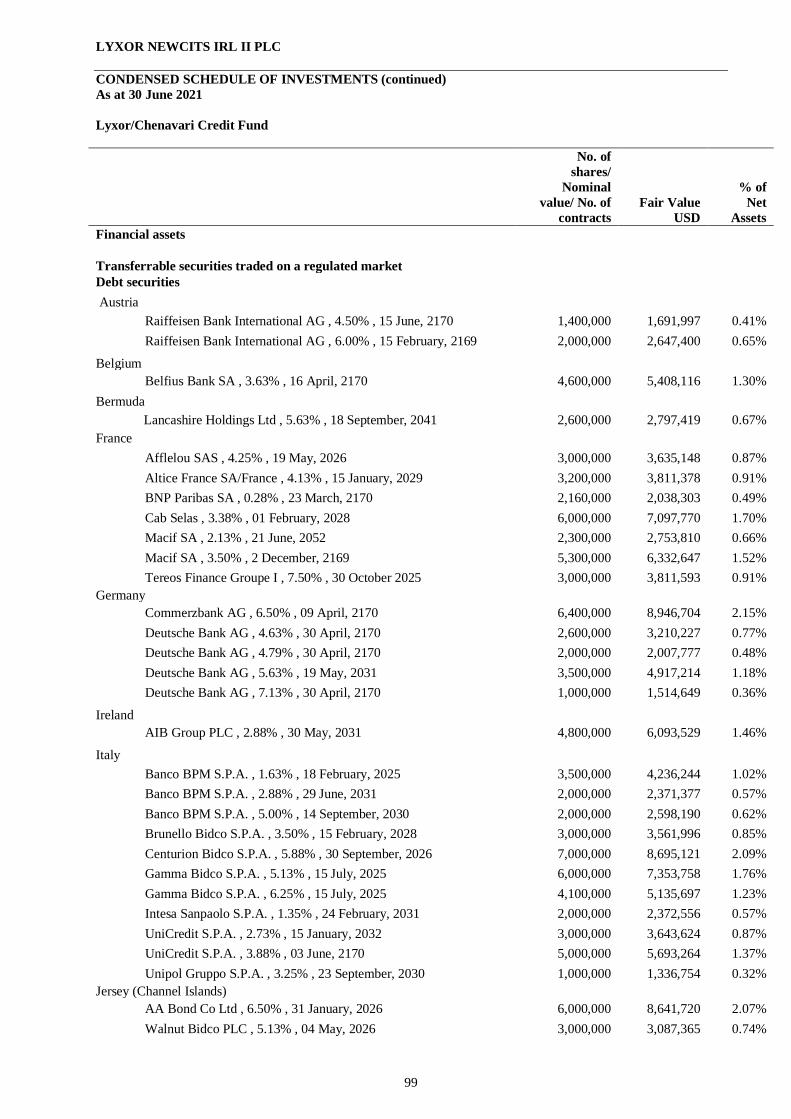
LYXOR NEWCITS IRL II PLC
99
CONDENSED SCHEDULE OF INVESTMENTS (continued)
As at 30 June 2021
Lyxor/Chenavari Credit Fund
No. of
shares/
Nominal
value/ No. of
contracts
Fair Value
USD
% of
Net
Assets
Financial assets
Transferrable securities traded on a regulated market
Debt securities
Austria
Raiffeisen Bank International AG , 4.50% , 15 June, 2170 1,400,000 1,691,997 0.41%
Raiffeisen Bank International AG , 6.00% , 15 February, 2169 2,000,000 2,647,400 0.65%
Belgium
Belfius Bank SA , 3.63% , 16 April, 2170 4,600,000 5,408,116 1.30%
Bermuda
Lancashire Holdings Ltd , 5.63% , 18 September, 2041 2,600,000 2,797,419 0.67%
France
Afflelou SAS , 4.25% , 19 May, 2026 3,000,000 3,635,148 0.87%
Altice France SA/France , 4.13% , 15 January, 2029 3,200,000 3,811,378 0.91%
BNP Paribas SA , 0.28% , 23 March, 2170 2,160,000 2,038,303 0.49%
Cab Selas , 3.38% , 01 February, 2028 6,000,000 7,097,770 1.70%
Macif SA , 2.13% , 21 June, 2052 2,300,000 2,753,810 0.66%
Macif SA , 3.50% , 2 December, 2169 5,300,000 6,332,647 1.52%
Tereos Finance Groupe I , 7.50% , 30 October 2025 3,000,000 3,811,593 0.91%
Germany
Commerzbank AG , 6.50% , 09 April, 2170 6,400,000 8,946,704 2.15%
Deutsche Bank AG , 4.63% , 30 April, 2170 2,600,000 3,210,227 0.77%
Deutsche Bank AG , 4.79% , 30 April, 2170 2,000,000 2,007,777 0.48%
Deutsche Bank AG , 5.63% , 19 May, 2031 3,500,000 4,917,214 1.18%
Deutsche Bank AG , 7.13% , 30 April, 2170 1,000,000 1,514,649 0.36%
Ireland
AIB Group PLC , 2.88% , 30 May, 2031 4,800,000 6,093,529 1.46%
Italy
Banco BPM S.P.A. , 1.63% , 18 February, 2025 3,500,000 4,236,244 1.02%
Banco BPM S.P.A. , 2.88% , 29 June, 2031 2,000,000 2,371,377 0.57%
Banco BPM S.P.A. , 5.00% , 14 September, 2030 2,000,000 2,598,190 0.62%
Brunello Bidco S.P.A. , 3.50% , 15 February, 2028 3,000,000 3,561,996 0.85%
Centurion Bidco S.P.A. , 5.88% , 30 September, 2026 7,000,000 8,695,121 2.09%
Gamma Bidco S.P.A. , 5.13% , 15 July, 2025 6,000,000 7,353,758 1.76%
Gamma Bidco S.P.A. , 6.25% , 15 July, 2025 4,100,000 5,135,697 1.23%
Intesa Sanpaolo S.P.A. , 1.35% , 24 February, 2031 2,000,000 2,372,556 0.57%
UniCredit S.P.A. , 2.73% , 15 January, 2032 3,000,000 3,643,624 0.87%
UniCredit S.P.A. , 3.88% , 03 June, 2170 5,000,000 5,693,264 1.37%
Unipol Gruppo S.P.A. , 3.25% , 23 September, 2030 1,000,000 1,336,754 0.32%
Jersey (Channel Islands)
AA Bond Co Ltd , 6.50% , 31 January, 2026 6,000,000 8,641,720 2.07%
Walnut Bidco PLC , 5.13% , 04 May, 2026 3,000,000 3,087,365 0.74%
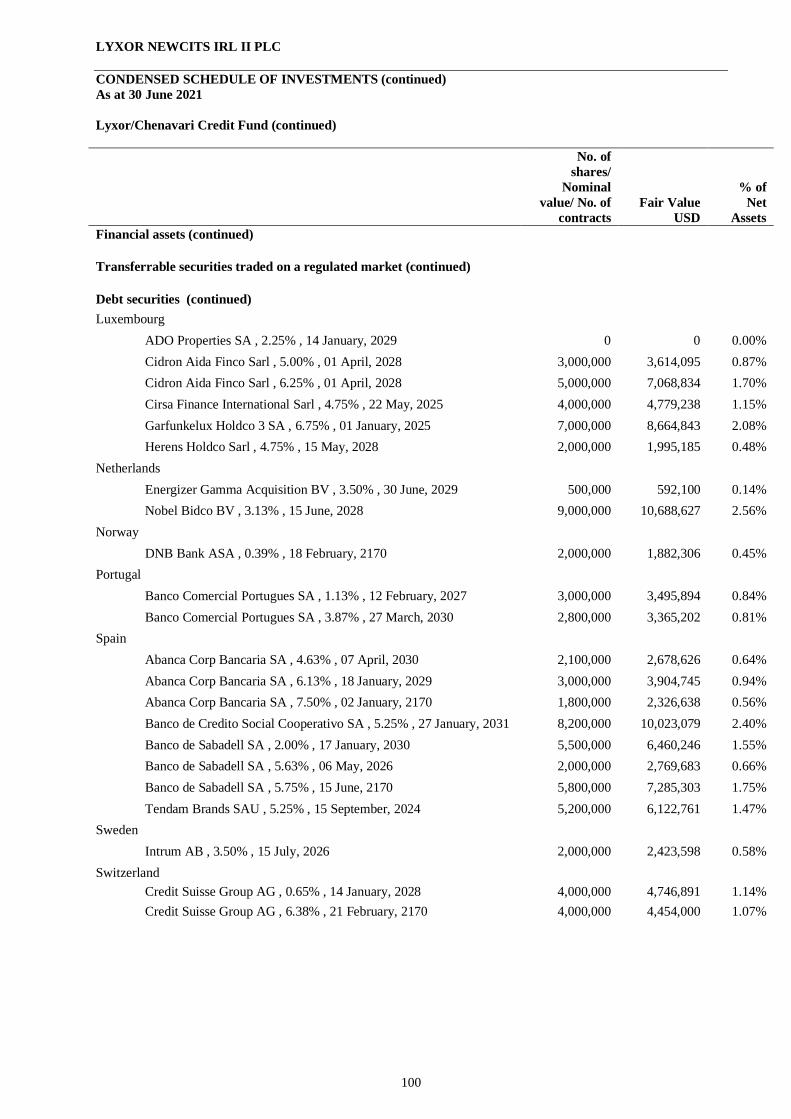
LYXOR NEWCITS IRL II PLC
100
CONDENSED SCHEDULE OF INVESTMENTS (continued)
As at 30 June 2021
Lyxor/Chenavari Credit Fund (continued)
No. of
shares/
Nominal
value/ No. of
contracts
Fair Value
USD
% of
Net
Assets
Financial assets (continued)
Transferrable securities traded on a regulated market (continued)
Debt securities (continued)
Luxembourg
ADO Properties SA , 2.25% , 14 January, 2029 0 0 0.00%
Cidron Aida Finco Sarl , 5.00% , 01 April, 2028 3,000,000 3,614,095 0.87%
Cidron Aida Finco Sarl , 6.25% , 01 April, 2028 5,000,000 7,068,834 1.70%
Cirsa Finance International Sarl , 4.75% , 22 May, 2025 4,000,000 4,779,238 1.15%
Garfunkelux Holdco 3 SA , 6.75% , 01 January, 2025 7,000,000 8,664,843 2.08%
Herens Holdco Sarl , 4.75% , 15 May, 2028 2,000,000 1,995,185 0.48%
Netherlands
Energizer Gamma Acquisition BV , 3.50% , 30 June, 2029 500,000 592,100 0.14%
Nobel Bidco BV , 3.13% , 15 June, 2028 9,000,000 10,688,627 2.56%
Norway
DNB Bank ASA , 0.39% , 18 February, 2170 2,000,000 1,882,306 0.45%
Portugal
Banco Comercial Portugues SA , 1.13% , 12 February, 2027 3,000,000 3,495,894 0.84%
Banco Comercial Portugues SA , 3.87% , 27 March, 2030 2,800,000 3,365,202 0.81%
Spain
Abanca Corp Bancaria SA , 4.63% , 07 April, 2030 2,100,000 2,678,626 0.64%
Abanca Corp Bancaria SA , 6.13% , 18 January, 2029 3,000,000 3,904,745 0.94%
Abanca Corp Bancaria SA , 7.50% , 02 January, 2170 1,800,000 2,326,638 0.56%
Banco de Credito Social Cooperativo SA , 5.25% , 27 January, 2031 8,200,000 10,023,079 2.40%
Banco de Sabadell SA , 2.00% , 17 January, 2030 5,500,000 6,460,246 1.55%
Banco de Sabadell SA , 5.63% , 06 May, 2026 2,000,000 2,769,683 0.66%
Banco de Sabadell SA , 5.75% , 15 June, 2170 5,800,000 7,285,303 1.75%
Tendam Brands SAU , 5.25% , 15 September, 2024 5,200,000 6,122,761 1.47%
Sweden
Intrum AB , 3.50% , 15 July, 2026 2,000,000 2,423,598 0.58%
Switzerland
Credit Suisse Group AG , 0.65% , 14 January, 2028 4,000,000 4,746,891 1.14%
Credit Suisse Group AG , 6.38% , 21 February, 2170 4,000,000 4,454,000 1.07%
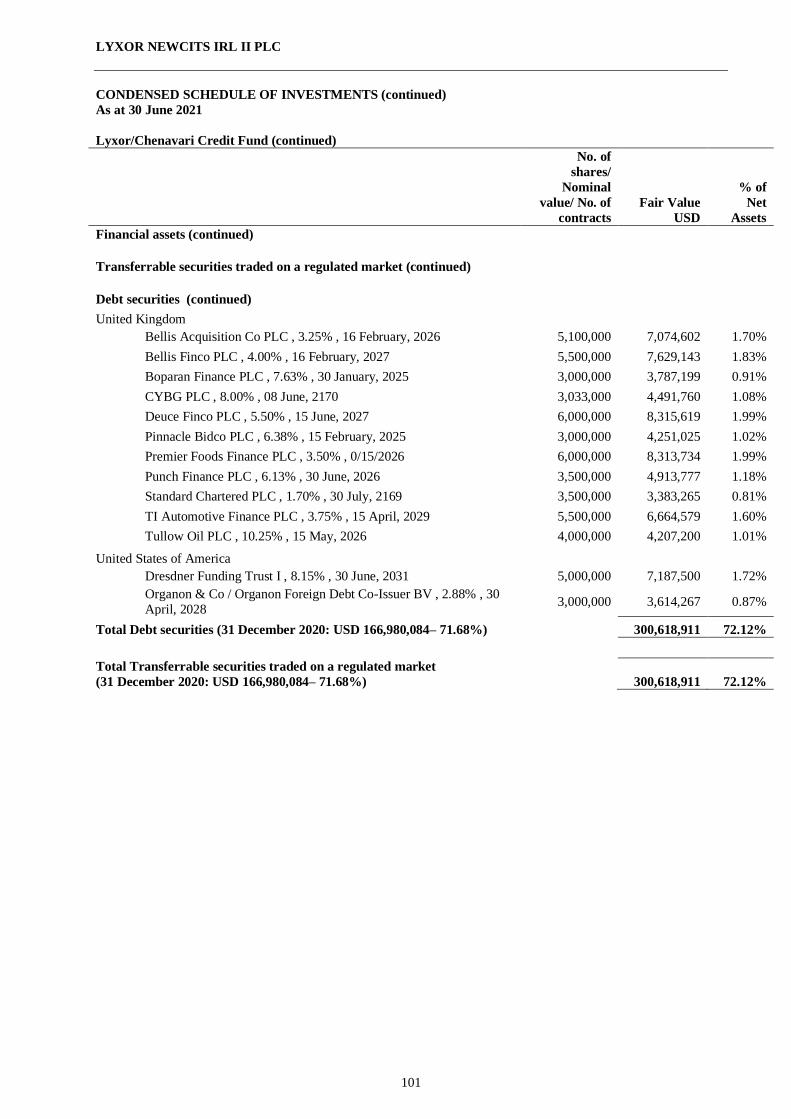
LYXOR NEWCITS IRL II PLC
101
CONDENSED SCHEDULE OF INVESTMENTS (continued)
As at 30 June 2021
Lyxor/Chenavari Credit Fund (continued)
No. of
shares/
Nominal
value/ No. of
contracts
Fair Value
USD
% of
Net
Assets
Financial assets (continued)
Transferrable securities traded on a regulated market (continued)
Debt securities (continued)
United Kingdom
Bellis Acquisition Co PLC , 3.25% , 16 February, 2026 5,100,000 7,074,602 1.70%
Bellis Finco PLC , 4.00% , 16 February, 2027 5,500,000 7,629,143 1.83%
Boparan Finance PLC , 7.63% , 30 January, 2025 3,000,000 3,787,199 0.91%
CYBG PLC , 8.00% , 08 June, 2170 3,033,000 4,491,760 1.08%
Deuce Finco PLC , 5.50% , 15 June, 2027 6,000,000 8,315,619 1.99%
Pinnacle Bidco PLC , 6.38% , 15 February, 2025 3,000,000 4,251,025 1.02%
Premier Foods Finance PLC , 3.50% , 0/15/2026 6,000,000 8,313,734 1.99%
Punch Finance PLC , 6.13% , 30 June, 2026 3,500,000 4,913,777 1.18%
Standard Chartered PLC , 1.70% , 30 July, 2169 3,500,000 3,383,265 0.81%
TI Automotive Finance PLC , 3.75% , 15 April, 2029 5,500,000 6,664,579 1.60%
Tullow Oil PLC , 10.25% , 15 May, 2026 4,000,000 4,207,200 1.01%
United States of America
Dresdner Funding Trust I , 8.15% , 30 June, 2031 5,000,000 7,187,500 1.72%
Organon & Co / Organon Foreign Debt Co-Issuer BV , 2.88% , 30
April, 2028 3,000,000 3,614,267 0.87%
Total Debt securities (31 December 2020: USD 166,980,084– 71.68%) 300,618,911 72.12%
Total Transferrable securities traded on a regulated market
(31 December 2020: USD 166,980,084– 71.68%) 300,618,911 72.12%

LYXOR NEWCITS IRL II PLC
102
CONDENSED SCHEDULE OF INVESTMENTS (continued)
As at 30 June 2021
Lyxor/Chenavari Credit Fund (continued)
No. of
shares/
Nominal
value/ No. of
contracts
Fair Value
USD
% of
Net
Assets
Financial assets (continued)
Financial derivative instruments (Assets)
Financial derivative instruments – Dealt in on a regulated market (Assets)
Futures contracts
Germany (21) 1,245 0.00%
United Kingdom 60 35,268 0.01%
Total Futures contracts (31 December 2020: USD Nil – Nil %) 36,513 0.01%
Listed equity options
Germany 3,900 219,679 0.05%
Total Listed equity options (31 December 2020: USD 258,076 – 0.11 %) 219,679 0.05%
Total Financial derivative instruments – Dealt in on a regulated market (Assets)
(31 December 2020: USD 258,076 – 0.11 %) 256,192 0.06%
Financial derivative instruments - Over-the-counter (OTC) (Assets)
Credit Default Swaps
Germany 1 678,326 0.16%
Luxembourg 3 300,417 0.07%
United Kingdom 1 301,476 0.08%
Total Credit default swaps (31 December 2020: USD 292,358 – 0.13%) 1,280,219 0.31%

LYXOR NEWCITS IRL II PLC
103
CONDENSED SCHEDULE OF INVESTMENTS (continued)
As at 30 June 2021
Lyxor/Chenavari Credit Fund (continued)
No. of
shares/ Nominal
value/ No. of
contracts
Fair Value
USD
% of
Net
Assets
Financial assets (continued)
Financial derivative instruments (Assets) (continued)
Financial derivative instruments - Over-the-counter (OTC) (Assets) (continued)
Swaptions
European Union 60,000,000 36,912 0.01%
Total Swaptions (31 December 2020: USD 414,502 – 0.18%)
36,912 0.01%
Total return swaps
European Union 33 206,410 0.05%
United Kingdom 1 104 0.00%
United States of America 2 173 0.00%
Total Total return swaps (31 December 2020: USD 136,682 – 0.06%) 206,687 0.05%
Foreign currency forwards
Bought
Currency
Amount
Bought
Sold
Currency
Amount
Sold
Settlement
Date
Unrealised
Gain
% of
Net
Assets
USD 344,737 EUR 289,603 1 July, 2021 1,348 0.00%
USD 1,791,492 EUR 1,506,291 2 July, 2021 5,257 0.00%
USD 10,497,965 EUR 8,768,973 9 July, 2021 97,742 0.02%
USD 19,578,966 EUR 16,000,000 30 July, 2021 594,423 0.14%
USD 187,698,789 EUR 154,180,000 19 August, 2021 4,686,168 1.12%
USD 56,577 GBP 40,102 9 July, 2021 1,112 0.00%
USD 72,651,188 GBP 51,600,000 19 August, 2021 1,277,551 0.32%
Total Foreign currency forwards (31 December 2020: USD 2,388,370 – 1.02%) 6,663,601 1.60%
Total Financial derivative instruments - Over-the-counter (OTC) (Assets)
(31 December 2020: USD USD 3,231,912 – 0.39%) 8,187,419 1.97%
Total Financial derivative instruments (Assets) (31 December 2020: USD 3,489,988 -
1.50%) 8,443,611 2.03%
Total Financial Assets at Fair Value Through Profit or Loss (31 December 2020: USD
170,470,072 – 73.18%)
309,062,522
74.15%

LYXOR NEWCITS IRL II PLC
104
CONDENSED SCHEDULE OF INVESTMENTS (continued)
As at 30 June 2021
Lyxor/Chenavari Credit Fund (continued)
No. of
shares/
Nominal
value/ No. of
contracts
Fair Value
USD
% of
Net
Assets
Financial liabilities
Financial derivative instruments (Liabilities)
Financial derivative instruments – Dealt in on a regulated market
(Liabilities)
Futures contracts
Germany 480 (100,390) (0.03)%
United Kingdom (12) (7,468) 0.00%
United States of America (517) (209,443) (0.05)%
Total Futures contracts (31 December 2020: USD (16,673) – (0.01)%) (317,301) (0.08)%
Listed equity options
Germany (3,900) (46,248) (0.01)%
Total Listed equity options (31 December 2020: USD (Nil) – (Nil)%) (46,248) (0.01)%
Total Financial derivative instruments – Dealt in on a regulated market
(Liabilities) (31 December 2020: USD (16,673) – (0.01)%)
(363,549) (0.09)%
Financial derivative instruments - Over-the-counter (OTC) (Liabilities)
Credit default swaps
Belgium 1 (321,888) (0.08)%
France 1 (67,289) (0.02)%
Germany 2 (6,647,673) (1.59%)
Italy 1 (33,314) (0.01)%
Spain 1 (138,129) (0.03)%
United Kingdom 4 (1,593,609) (0.38%)
United States of America 2 (2,405,986) (0.58%)
Total Credit default swaps (31 December 2020: USD (4,766,683) – (2.05) %) (11,207,888) (2.69)%
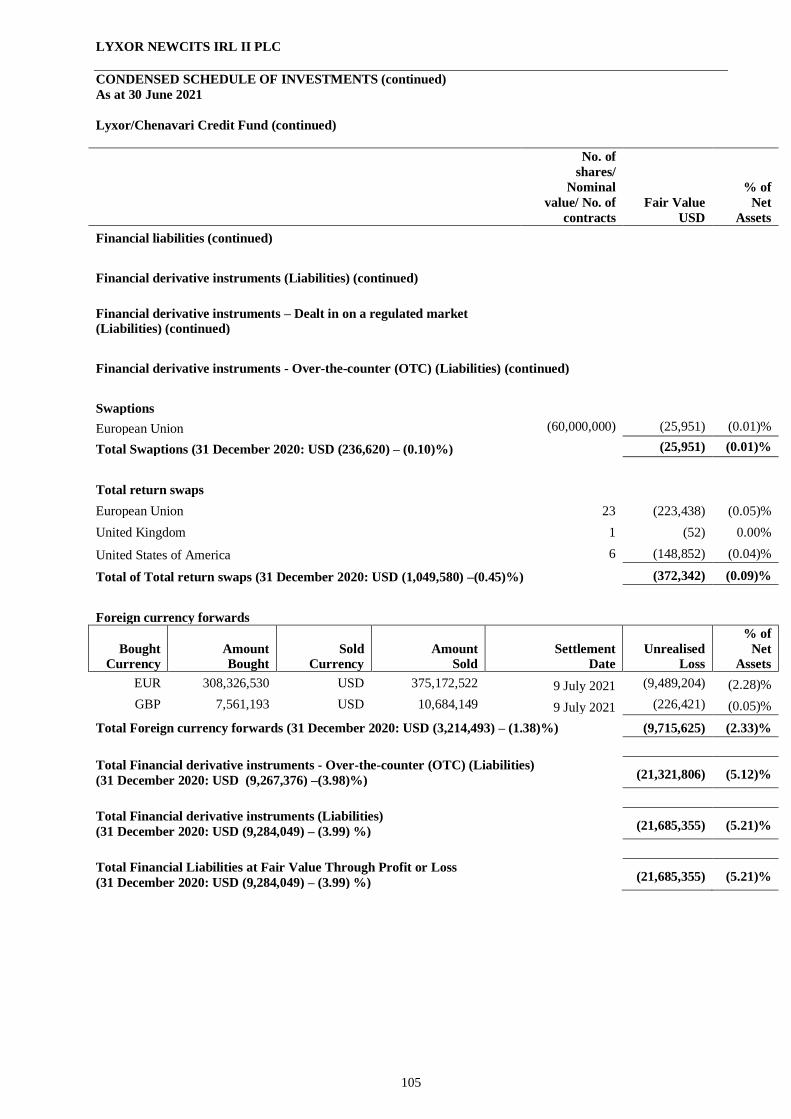
LYXOR NEWCITS IRL II PLC
105
CONDENSED SCHEDULE OF INVESTMENTS (continued)
As at 30 June 2021
Lyxor/Chenavari Credit Fund (continued)
No. of
shares/
Nominal
value/ No. of
contracts
Fair Value
USD
% of
Net
Assets
Financial liabilities (continued)
Financial derivative instruments (Liabilities) (continued)
Financial derivative instruments – Dealt in on a regulated market
(Liabilities) (continued)
Financial derivative instruments - Over-the-counter (OTC) (Liabilities) (continued)
Swaptions
European Union (60,000,000) (25,951) (0.01)%
Total Swaptions (31 December 2020: USD (236,620) – (0.10)%) (25,951) (0.01)%
Total return swaps
European Union 23 (223,438) (0.05)%
United Kingdom 1 (52) 0.00%
United States of America 6 (148,852) (0.04)%
Total of Total return swaps (31 December 2020: USD (1,049,580) –(0.45)%) (372,342) (0.09)%
Foreign currency forwards
Bought
Currency
Amount
Bought
Sold
Currency
Amount
Sold
Settlement
Date
Unrealised
Loss
% of
Net
Assets
EUR 308,326,530 USD 375,172,522 9 July 2021 (9,489,204) (2.28)%
GBP 7,561,193 USD 10,684,149 9 July 2021 (226,421) (0.05)%
Total Foreign currency forwards (31 December 2020: USD (3,214,493) – (1.38)%) (9,715,625) (2.33)%
Total Financial derivative instruments - Over-the-counter (OTC) (Liabilities)
(31 December 2020: USD (9,267,376) –(3.98)%) (21,321,806) (5.12)%
Total Financial derivative instruments (Liabilities)
(31 December 2020: USD (9,284,049) – (3.99) %) (21,685,355) (5.21)%
Total Financial Liabilities at Fair Value Through Profit or Loss
(31 December 2020: USD (9,284,049) – (3.99) %) (21,685,355) (5.21)%
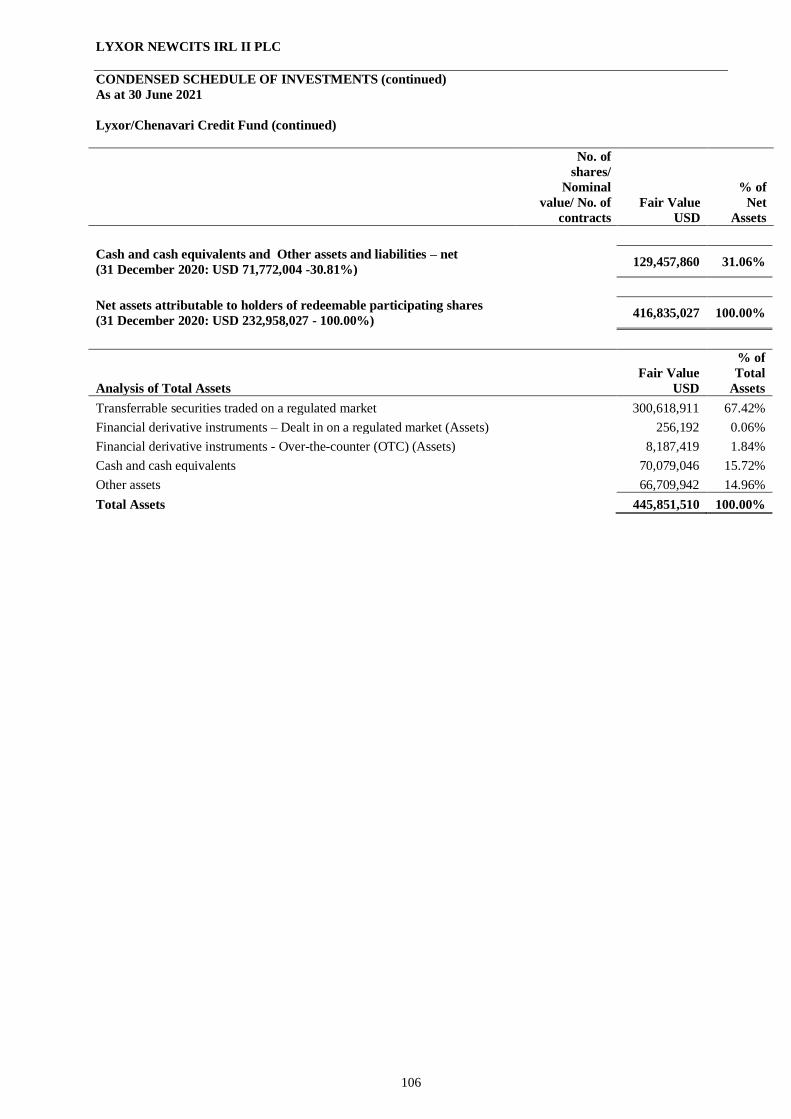
LYXOR NEWCITS IRL II PLC
106
CONDENSED SCHEDULE OF INVESTMENTS (continued)
As at 30 June 2021
Lyxor/Chenavari Credit Fund (continued)
No. of
shares/
Nominal
value/ No. of
contracts
Fair Value
USD
% of
Net
Assets
Cash and cash equivalents and Other assets and liabilities – net
(31 December 2020: USD 71,772,004 -30.81%) 129,457,860 31.06%
Net assets attributable to holders of redeemable participating shares
(31 December 2020: USD 232,958,027 - 100.00%) 416,835,027 100.00%
Analysis of Total Assets
Fair Value
USD
% of
Total
Assets
Transferrable securities traded on a regulated market 300,618,911 67.42%
Financial derivative instruments – Dealt in on a regulated market (Assets) 256,192 0.06%
Financial derivative instruments - Over-the-counter (OTC) (Assets) 8,187,419 1.84%
Cash and cash equivalents 70,079,046 15.72%
Other assets 66,709,942 14.96%
Total Assets 445,851,510 100.00%

LYXOR NEWCITS IRL II PLC
107
CONDENSED SCHEDULE OF INVESTMENTS (continued)
As at 30 June 2021
Lyxor/Wells Capital Financial Credit Fund
No. of
shares/
Nominal
value/ No. of
contracts
Fair Value
USD
% of
Net
Assets
Financial assets
Transferrable securities traded on a regulated market
Debt securities
Austria
BAWAG Group AG , 5.00% , 14 January, 2169 3,000,000 3,873,357 2.66%
Erste Group Bank AG , 6.50% , 15 October, 2169 3,400,000 4,531,066 3.12%
Belgium
KBC Group NV , 4.75% , 05 September, 2169 5,000,000 6,363,233 4.38%
Bermuda
Lancashire Holdings Ltd , 5.63% , 18 September, 2041 4,000,000 4,303,722 2.96%
Denmark
Nykredit Realkredit A/S , 4.13% , 15 April, 2170 5,000,000 6,365,108 4.38%
Finland
Nordea Bank Abp , 6.63% , 26 September, 2169 3,000,000 3,451,591 2.37%
France
BNP Paribas SA , 2.00% , 24 May, 2031 1,300,000 1,814,075 1.25%
BNP Paribas SA , 6.63% , 25 September, 2169 2,000,000 2,195,059 1.51%
CNP Assurances , 4.88% , 0/07/2169 4,000,000 4,207,396 2.89%
Credit Agricole SA , 7.50% , 23 June, 2170 2,000,000 3,296,517 2.27%
Credit Agricole SA , 7.88% , 23 March, 2167 2,000,000 2,266,271 1.56%
Macif SA , 2.13% , 21 June, 2052 3,000,000 3,591,926 2.47%
Germany
Commerzbank AG , 6.13% , 09 April, 2170 4,000,000 5,239,465 3.60%
Deutsche Pfandbriefbank AG , 5.75% , 28 April, 2170 4,400,000 5,446,593 3.75%
Ireland
Bank of Ireland Group PLC , 7.50% , 19 January, 2169 3,400,000 4,773,186 3.28%
Permanent TSB Group Holdings PLC , 3.00% , 19 August, 2031 2,750,000 3,325,990 2.29%
Italy
Banco BPM SpA , 2.88% , 29 June, 2031 3,000,000 3,557,066 2.45%
Intesa Sanpaolo SpA , 5.50% , 01 March, 2170 2,500,000 3,268,277 2.25%
UniCredit SpA , 2.73% , 15 January, 2032 1,500,000 1,821,812 1.25%
Netherlands
ASR Nederland NV , 4.63% , 19 April, 2170 500,000 655,281 0.45%
Cooperatieve Rabobank UA , 4.63% , 29 December, 2169 3,000,000 3,915,528 2.69%
ING Groep NV , 6.88% , 16 April, 2170 2,800,000 2,918,629 2.01%
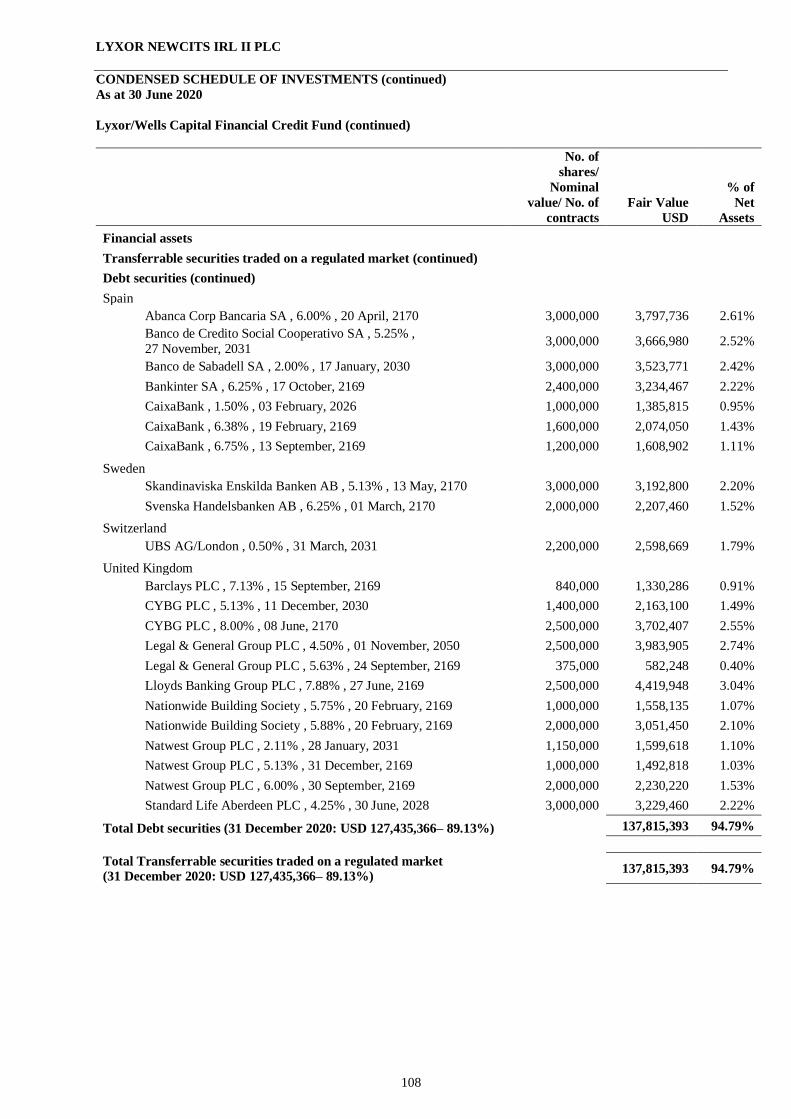
LYXOR NEWCITS IRL II PLC
108
CONDENSED SCHEDULE OF INVESTMENTS (continued)
As at 30 June 2020
Lyxor/Wells Capital Financial Credit Fund (continued)
No. of
shares/
Nominal
value/ No. of
contracts
Fair Value
USD
% of
Net
Assets
Financial assets
Transferrable securities traded on a regulated market (continued)
Debt securities (continued)
Spain
Abanca Corp Bancaria SA , 6.00% , 20 April, 2170 3,000,000 3,797,736 2.61%
Banco de Credito Social Cooperativo SA , 5.25% ,
27 November, 2031 3,000,000 3,666,980 2.52%
Banco de Sabadell SA , 2.00% , 17 January, 2030 3,000,000 3,523,771 2.42%
Bankinter SA , 6.25% , 17 October, 2169 2,400,000 3,234,467 2.22%
CaixaBank , 1.50% , 03 February, 2026 1,000,000 1,385,815 0.95%
CaixaBank , 6.38% , 19 February, 2169 1,600,000 2,074,050 1.43%
CaixaBank , 6.75% , 13 September, 2169 1,200,000 1,608,902 1.11%
Sweden
Skandinaviska Enskilda Banken AB , 5.13% , 13 May, 2170 3,000,000 3,192,800 2.20%
Svenska Handelsbanken AB , 6.25% , 01 March, 2170 2,000,000 2,207,460 1.52%
Switzerland
UBS AG/London , 0.50% , 31 March, 2031 2,200,000 2,598,669 1.79%
United Kingdom
Barclays PLC , 7.13% , 15 September, 2169 840,000 1,330,286 0.91%
CYBG PLC , 5.13% , 11 December, 2030 1,400,000 2,163,100 1.49%
CYBG PLC , 8.00% , 08 June, 2170 2,500,000 3,702,407 2.55%
Legal & General Group PLC , 4.50% , 01 November, 2050 2,500,000 3,983,905 2.74%
Legal & General Group PLC , 5.63% , 24 September, 2169 375,000 582,248 0.40%
Lloyds Banking Group PLC , 7.88% , 27 June, 2169 2,500,000 4,419,948 3.04%
Nationwide Building Society , 5.75% , 20 February, 2169 1,000,000 1,558,135 1.07%
Nationwide Building Society , 5.88% , 20 February, 2169 2,000,000 3,051,450 2.10%
Natwest Group PLC , 2.11% , 28 January, 2031 1,150,000 1,599,618 1.10%
Natwest Group PLC , 5.13% , 31 December, 2169 1,000,000 1,492,818 1.03%
Natwest Group PLC , 6.00% , 30 September, 2169 2,000,000 2,230,220 1.53%
Standard Life Aberdeen PLC , 4.25% , 30 June, 2028 3,000,000 3,229,460 2.22%
Total Debt securities (31 December 2020: USD 127,435,366– 89.13%) 137,815,393 94.79%
Total Transferrable securities traded on a regulated market
(31 December 2020: USD 127,435,366– 89.13%) 137,815,393 94.79%
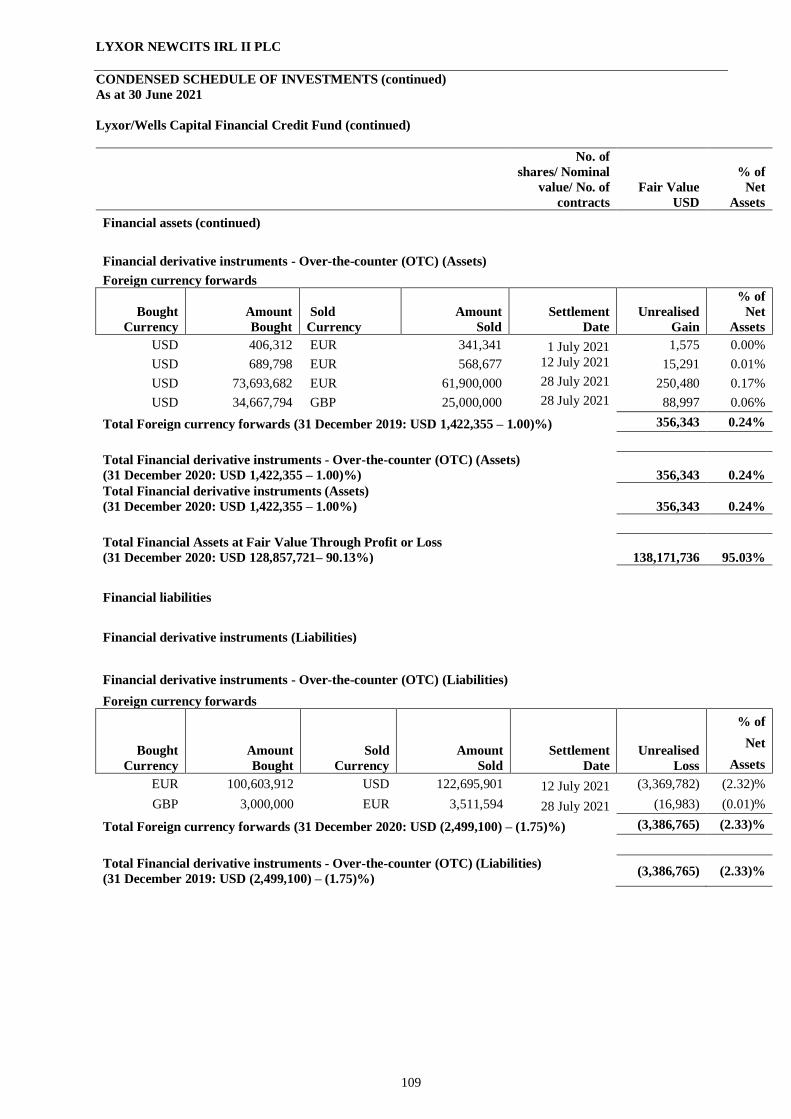
LYXOR NEWCITS IRL II PLC
109
CONDENSED SCHEDULE OF INVESTMENTS (continued)
As at 30 June 2021
Lyxor/Wells Capital Financial Credit Fund (continued)
No. of
shares/ Nominal
value/ No. of
contracts
Fair Value
USD
% of
Net
Assets
Financial assets (continued)
Financial derivative instruments - Over-the-counter (OTC) (Assets)
Foreign currency forwards
Bought
Currency
Amount
Bought
Sold
Currency
Amount
Sold
Settlement
Date
Unrealised
Gain
% of
Net
Assets
USD 406,312 EUR 341,341 1 July 2021 1,575 0.00%
USD 689,798 EUR 568,677 12 July 2021 15,291 0.01%
USD 73,693,682 EUR 61,900,000 28 July 2021 250,480 0.17%
USD 34,667,794 GBP 25,000,000 28 July 2021 88,997 0.06%
Total Foreign currency forwards (31 December 2019: USD 1,422,355 – 1.00)%) 356,343 0.24%
Total Financial derivative instruments - Over-the-counter (OTC) (Assets)
(31 December 2020: USD 1,422,355 – 1.00)%) 356,343 0.24%
Total Financial derivative instruments (Assets)
(31 December 2020: USD 1,422,355 – 1.00%) 356,343 0.24%
Total Financial Assets at Fair Value Through Profit or Loss
(31 December 2020: USD 128,857,721– 90.13%) 138,171,736 95.03%
Financial liabilities
Financial derivative instruments (Liabilities)
Financial derivative instruments - Over-the-counter (OTC) (Liabilities)
Foreign currency forwards
Bought
Currency
Amount
Bought
Sold
Currency
Amount
Sold
Settlement
Date
Unrealised
Loss
% of
Net
Assets
EUR 100,603,912 USD 122,695,901 12 July 2021 (3,369,782) (2.32)%
GBP 3,000,000 EUR 3,511,594 28 July 2021 (16,983) (0.01)%
Total Foreign currency forwards (31 December 2020: USD (2,499,100) – (1.75)%) (3,386,765) (2.33)%
Total Financial derivative instruments - Over-the-counter (OTC) (Liabilities)
(31 December 2019: USD (2,499,100) – (1.75)%) (3,386,765) (2.33)%

LYXOR NEWCITS IRL II PLC
110
CONDENSED SCHEDULE OF INVESTMENTS (continued)
As at 30 June 2021
Lyxor/Wells Capital Financial Credit Fund (continued)
No. of
shares/ Nominal
value/ No. of
contracts
Fair Value
USD
% of
Net
Assets
Total Financial derivative instruments (Liabilities) (31 December 2020: USD (2,499,100)
– (1.75) %) (3,386,765) (2.33)%
Total Financial Liabilities at Fair Value Through Profit or Loss
(31 December 2020:USD (2,499,100) – (1.75) %) (3,386,765) (2.33)%
Cash and cash equivalents and Other assets and liabilities – net
(31 December 2020: USD 16,611,285 – 11.62%) 10,612,658 7.30%
Net assets attributable to holders of redeemable participating shares (31 December 2020:
USD 142,969,906 – 100%) 145,397,629 100.00%
Analysis of Total Assets Fair Value
% of
Total
Assets
Transferrable securities traded on a regulated market 137,815,393 92.02%
Financial derivative instruments - Over-the-counter (OTC) (Assets) 356,343 0.24%
Cash and cash equivalents 8,275,101 5.53%
Other assets 3,311,553 2.21%
Total Assets 149,758,390 100.00%
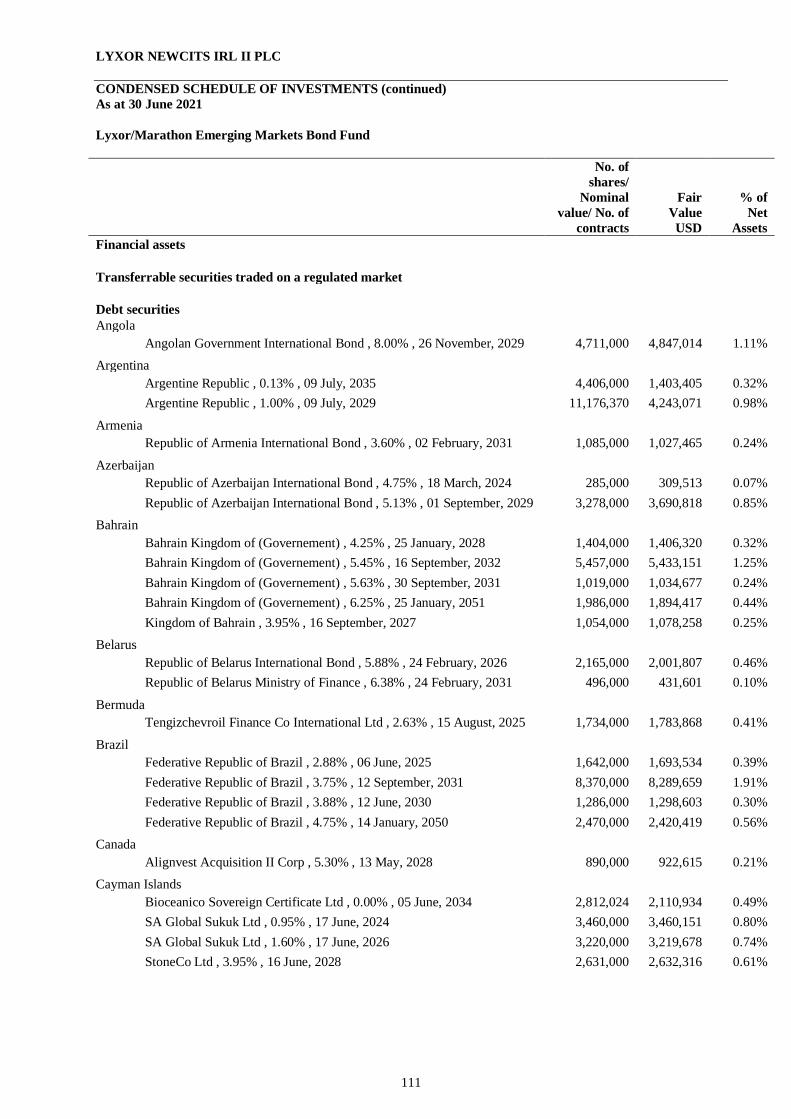
LYXOR NEWCITS IRL II PLC
111
CONDENSED SCHEDULE OF INVESTMENTS (continued)
As at 30 June 2021
Lyxor/Marathon Emerging Markets Bond Fund
No. of
shares/
Nominal
value/ No. of
contracts
Fair
Value
USD
% of
Net
Assets
Financial assets
Transferrable securities traded on a regulated market
Debt securities
Angola
Angolan Government International Bond , 8.00% , 26 November, 2029 4,711,000 4,847,014 1.11%
Argentina
Argentine Republic , 0.13% , 09 July, 2035 4,406,000 1,403,405 0.32%
Argentine Republic , 1.00% , 09 July, 2029 11,176,370 4,243,071 0.98%
Armenia
Republic of Armenia International Bond , 3.60% , 02 February, 2031 1,085,000 1,027,465 0.24%
Azerbaijan
Republic of Azerbaijan International Bond , 4.75% , 18 March, 2024 285,000 309,513 0.07%
Republic of Azerbaijan International Bond , 5.13% , 01 September, 2029 3,278,000 3,690,818 0.85%
Bahrain
Bahrain Kingdom of (Governement) , 4.25% , 25 January, 2028 1,404,000 1,406,320 0.32%
Bahrain Kingdom of (Governement) , 5.45% , 16 September, 2032 5,457,000 5,433,151 1.25%
Bahrain Kingdom of (Governement) , 5.63% , 30 September, 2031 1,019,000 1,034,677 0.24%
Bahrain Kingdom of (Governement) , 6.25% , 25 January, 2051 1,986,000 1,894,417 0.44%
Kingdom of Bahrain , 3.95% , 16 September, 2027 1,054,000 1,078,258 0.25%
Belarus
Republic of Belarus International Bond , 5.88% , 24 February, 2026 2,165,000 2,001,807 0.46%
Republic of Belarus Ministry of Finance , 6.38% , 24 February, 2031 496,000 431,601 0.10%
Bermuda
Tengizchevroil Finance Co International Ltd , 2.63% , 15 August, 2025 1,734,000 1,783,868 0.41%
Brazil
Federative Republic of Brazil , 2.88% , 06 June, 2025 1,642,000 1,693,534 0.39%
Federative Republic of Brazil , 3.75% , 12 September, 2031 8,370,000 8,289,659 1.91%
Federative Republic of Brazil , 3.88% , 12 June, 2030 1,286,000 1,298,603 0.30%
Federative Republic of Brazil , 4.75% , 14 January, 2050 2,470,000 2,420,419 0.56%
Canada
Alignvest Acquisition II Corp , 5.30% , 13 May, 2028 890,000 922,615 0.21%
Cayman Islands
Bioceanico Sovereign Certificate Ltd , 0.00% , 05 June, 2034 2,812,024 2,110,934 0.49%
SA Global Sukuk Ltd , 0.95% , 17 June, 2024 3,460,000 3,460,151 0.80%
SA Global Sukuk Ltd , 1.60% , 17 June, 2026 3,220,000 3,219,678 0.74%
StoneCo Ltd , 3.95% , 16 June, 2028 2,631,000 2,632,316 0.61%

LYXOR NEWCITS IRL II PLC
112
CONDENSED SCHEDULE OF INVESTMENTS (continued)
As at 30 June 2021
Lyxor/Marathon Emerging Markets Bond Fund (continued)
No. of
shares/
Nominal
value/ No. of
contracts
Fair
Value
USD
% of
Net
Assets
Financial assets
Transferrable securities traded on a regulated market (continued)
Debt securities (continued)
Chile
Republic of Chile , 2.45% , 31 January, 2031 7,635,000 7,787,140 1.79%
Republic of Chile , 2.55% , 27 January, 2032 1,767,000 1,808,754 0.42%
Republic of Chile , 3.10% , 07 May, 2041 2,514,000 2,528,930 0.58%
China
China Peoples Republic Of (Government) , 0.40% , 21 October, 2023 4,490,000 4,487,609 1.03%
China Peoples Republic Of (Government) , 0.55% , 21 October, 2025 3,233,000 3,178,672 0.73%
China Peoples Republic Of (Government) , 1.88% , 03 December, 2022 1,411,000 1,441,169 0.33%
China Peoples Republic Of (Government) , 3.25% , 19 October, 2023 659,000 701,443 0.16%
Colombia
Colombia Republic Of (Government) , 3.13% , 15 April, 2031 676,000 662,086 0.15%
Colombia Republic Of (Government) , 3.25% , 22 April, 2032 6,730,000 6,593,209 1.52%
Colombia Republic Of (Government) , 4.13% , 22 February, 2042 5,522,000 5,374,173 1.24%
Costa Rica
Costa Rica Government International Bond , 6.13% , 19 February, 2031 2,630,000 2,797,213 0.64%
Costa Rica Government International Bond , 7.16% , 12 March, 2045 1,268,000 1,325,891 0.30%
Cote d'Ivoire
Cote Divoire Republic Of (Government) , 5.75% , 31 December 2032 1,718,310 1,726,418 0.40%
Dominican Republic
Dominican Republic International Bond , 4.50% , 30 January, 2030 6,420,000 6,561,283 1.51%
Dominican Republic International Bond , 5.30% , 21 January, 2041 8,009,000 8,013,864 1.84%
Ecuador
Republic OF Ecuador , 0.00% , 31 July, 2030 1,388,545 772,710 0.18%
Republic OF Ecuador, 0.50% , 31 July, 2035 5,656,054 3,885,737 0.89%
Republic OF Ecuador, 0.50% , 31 July, 2040 2,812,799 1,744,889 0.40%
Egypt
Egypt Arab Republic Of (Government) , 7.50% , 16 February, 2061 828,000 778,637 0.18%
Egypt Arab Republic Of (Government) , 7.63% , 29 May, 2032 8,588,000 9,128,691 2.10%
Egypt Arab Republic Of (Government) , 7.90% , 21 February, 2048 1,873,000 1,859,353 0.43%
El Salvador
Republic of El Salvador , 5.88% , 30 January, 2025 2,519,000 2,343,751 0.54%
Republic of El Salvador , 9.50% , 15 July, 2052 1,449,000 1,437,338 0.33%

LYXOR NEWCITS IRL II PLC
113
CONDENSED SCHEDULE OF INVESTMENTS (continued)
As at 30 June 2021
Lyxor/Marathon Emerging Markets Bond Fund (continued)
No. of
shares/
Nominal
value/ No. of
contracts
Fair
Value
USD
% of
Net
Assets
Financial assets
Transferrable securities traded on a regulated market (continued)
Debt securities (continued)
Gabon
Gabon Government International Bond , 6.38% , 12 December, 2024 1,401,000 1,495,268 0.34%
Georgia
Georgia Government International Bond , 2.75% , 22 April, 2026 808,000 825,056 0.19%
Ghana
Ghana Government International Bond , 6.38% , 11 February, 2027 1,610,000 1,621,035 0.37%
Ghana Government International Bond , 7.88% , 11 February, 2035 2,799,000 2,762,040 0.64%
Ghana Government International Bond , 8.63% , 07 April, 2034 3,092,000 3,195,914 0.74%
Guatemala
Guatemala Government Bond , 4.90% , 01 June, 2030 2,508,000 2,823,266 0.65%
Guatemala Government Bond , 5.38% , 24 April, 2032 367,000 425,778 0.10%
Hungary
Hungary , 5.38% , 21 February, 2023 1,374,000 1,486,103 0.34%
Hungary , 5.75% , 22 November, 2023 104,000 116,879 0.03%
India
Export-Import Bank of India , 2.25% , 13 January, 2031 2,349,000 2,186,255 0.50%
Export-Import Bank of India , 3.25% , 15 January, 2030 958,000 975,449 0.22%
Indonesia
Indonesia Republic Of (Government) , 4.33% , 28 May 2025 2,408,000 2,692,587 0.62%
Pertamina Persero PT , 1.40% , 09 February, 2026 1,180,000 1,156,400 0.27%
Republic OF Indonesia , 2.85% , 14 February, 2030 8,114,000 8,434,507 1.94%
Republic OF Indonesia, 3.50% , 11 January, 2028 3,053,000 3,339,394 0.77%
Republic OF Indonesia, 4.63% , 15 April, 2043 1,864,000 2,162,292 0.50%
Israel
State of Israel , 4.50% , 03 April, 2120 8,718,000 11,041,829 2.54%
Jersey (Channel Islands)
Galaxy Pipeline Assets Bidco Ltd , 2.16% , 31 March, 2034 2,654,000 2,613,312 0.60%
Galaxy Pipeline Assets Bidco Ltd , 2.63% , 31 March, 2036 298,000 293,286 0.07%
Galaxy Pipeline Assets Bidco Ltd , 2.94% , 30 September, 2040 7,126,000 7,072,871 1.63%
Jordan
Jordan Government International Bond , 4.95% , 07 July, 2025 1,590,000 1,657,187 0.38%
Jordan Government International Bond , 7.38% , 10 October, 2047 400,000 421,313 0.10%
Kazakhstan
Development Bank of Kazakhstan JSC , 2.95% , 06 May, 2031 200,000 199,354 0.05%
KazMunayGas National Co JSC , 3.50% , 14 April, 2033 2,416,000 2,508,707 0.58%
KazTransGas JSC , 4.38% , 26 September, 2027 3,348,000 3,722,059 0.86%
Kazakhstan Government International Bond , 4.88% , 14 October, 2044 2,203,000 2,769,438 0.64%

LYXOR NEWCITS IRL II PLC
114
CONDENSED SCHEDULE OF INVESTMENTS (continued)
As at 30 June 2021
Lyxor/Marathon Emerging Markets Bond Fund (continued)
No. of
shares/
Nominal
value/ No. of
contracts
Fair
Value
USD
% of
Net
Assets
Financial assets
Transferrable securities traded on a regulated market (continued)
Debt securities (continued)
Kenya
Republic of Kenya , 6.30% , 23 January, 2034 4,449,000 4,462,530 1.03%
Republic of Kenya , 7.00% , 22 May, 2027 1,833,000 2,013,776 0.46%
Lebanon
Lebanon Republic Of (Government) , 0.00% , 20 March, 2028 1,111,000 144,125 0.03%
Lebanon Republic Of (Government) , 0.00% , 04 October, 2022 5,731,000 749,427 0.17%
Lebanon Republic Of (Government) , 0.00% , 27 November, 2026 2,380,000 311,167 0.07%
Malaysia
1MDB Global Investments Ltd , 4.40% , 09 March, 2023 1,200,000 1,209,240 0.28%
Malaysia Wakala Sukuk Bhd , 2.07% , 28 April, 2031 2,481,000 2,508,038 0.58%
Petronas Capital Ltd , 2.48% , 28 January, 2032 5,120,000 5,140,480 1.18%
Petronas Capital Ltd , 3.50% , 21 April, 2030 5,340,000 5,847,300 1.34%
Petronas Capital Ltd , 4.55% , 21 April, 2050 3,471,000 4,284,776 0.99%
Mexico
Petroleos Mexicanos , 5.95% , 28 January, 2031 4,039,000 3,923,889 0.90%
Petroleos Mexicanos , 6.50% , 02 June, 2041 391,000 352,011 0.08%
Petroleos Mexicanos , 6.75% , 21 September, 2047 6,521,000 5,761,304 1.33%
Petroleos Mexicanos , 6.88% , 16 October, 2025 407,000 450,549 0.10%
United Mexican States , 2.66% , 24 May, 2031 7,413,000 7,255,297 1.67%
United Mexican States , 4.28% , 14 August, 2041 2,121,000 2,232,428 0.51%
Mongolia
Mongolia Government International Bond , 3.50% , 07 July, 2027 798,000 783,147 0.18%
Mongolia Government International Bond , 4.45% , 07 July, 2031 798,000 782,805 0.18%
Morocco
Morocco Kingdom of (Government) , 2.38% , 15 December, 2027 1,358,000 1,335,314 0.31%
Morocco Kingdom of (Government), 3.00% , 15 December, 2032 1,651,000 1,596,288 0.37%
Morocco Kingdom of (Government), 4.00% , 15 December, 2050 1,866,000 1,734,248 0.40%
Mozambique
Mozambique International Bond , 5.00% , 15 September, 2031 600,000 510,728 0.12%
Nigeria
Nigeria Government International Bond , 7.14% , 23 February, 2030 1,736,000 1,833,465 0.42%
Nigeria Government International Bond , 7.88% , 16 February, 2032 1,864,000 2,011,361 0.46%
Nigeria Government International Bond , 8.75% , 21 January, 2031 2,218,000 2,522,321 0.58%
Oman
Sultanate of Oman , 4.88% , 15 June, 2030 2,360,000 2,423,812 0.56%
Sultanate of Oman , 6.25% , 25 January, 2031 1,970,000 2,119,981 0.49%
Sultanate of Oman , 6.75% , 28 October, 2027 6,503,000 7,298,729 1.68%

LYXOR NEWCITS IRL II PLC
115
CONDENSED SCHEDULE OF INVESTMENTS (continued)
As at 30 June 2021
Lyxor/Marathon Emerging Markets Bond Fund (continued)
No. of
shares/
Nominal
value/ No. of
contracts
Fair
Value
USD
% of
Net
Assets
Financial assets
Transferrable securities traded on a regulated market (continued)
Debt securities (continued)
Pakistan
Pakistan Islamic Republic of (Government), 6.00% , 08 April, 2026 1,671,000 1,696,593 0.39%
Pakistan Islamic Republic of (Government), 7.38% , 08 April, 2031 2,223,000 2,291,231 0.53%
Panama
Panama Republic of (Government), 2.25% , 29 September, 2032 6,694,000 6,437,656 1.48%
Panama Republic of (Government), 3.75% , 16 March, 2025 1,606,000 1,748,655 0.40%
Panama Republic of (Government), 4.50% , 16 April, 2050 3,453,000 3,934,978 0.90%
Panama Bonos del Tesoro , 3.36% , 30 June, 2031 3,508,000 3,521,436 0.81%
Paraguay
Paraguay Republic of (Government) , 2.74% , 29 January, 2033 2,077,000 2,023,401 0.47%
Peru
Petroleos del Peru SA , 5.63% , 19 June, 2047 5,488,000 5,831,000 1.34%
Republic of Peru , 2.78% , 23 January, 2031 2,814,000 2,868,559 0.66%
Republic of Peru , 3.23% , 28 July, 2121 3,715,000 3,278,646 0.75%
Philippines
Republic of the Philippines , 1.65% , 10 June, 2031 3,158,000 3,053,502 0.70%
Republic of the Philippines , 1.95% , 06 January, 2032 3,032,000 2,992,189 0.69%
Republic of the Philippines , 2.46% , 05 May, 2030 1,293,000 1,347,943 0.31%
Republic of the Philippines , 2.65% , 10 December, 2045 508,000 470,748 0.11%
Republic of the Philippines , 3.20% , 06 July, 2046 2,060,000 2,067,331 0.48%
Republic of the Philippines , 3.75% , 14 January, 2029 2,382,000 2,706,764 0.62%
Poland
Republic of Poland Government International Bond , 5.00% , 23 March,
2022 5,348,000 5,535,220 1.27%
Qatar
Qatar Petroleum , 1.38% , 12 September, 2026 4,700,000 4,695,535 1.08%
Qatar Petroleum , 2.25% , 12 July, 2031 4,520,000 4,471,952 1.03%
Qatar Petroleum , 3.13% , 12 July, 2041 1,700,000 1,693,727 0.39%
Qatar Petroleum , 3.30% , 12 July, 2051 4,260,000 4,260,000 0.98%
State of Qatar , 3.40% , 16 April, 2025 0 0 0.00%
State of Qatar , 3.75% , 16 April, 2030 5,610,000 6,354,696 1.46%
State of Qatar , 4.40% , 16 April, 2050 1,177,000 1,434,993 0.33%
Republic of Korea
Korea Expressway Corp , 1.13% , 17 May, 2026 729,000 725,898 0.17%
Republic of Korea , 1.00% , 16 September, 2030 1,686,000 1,598,600 0.37%
Romania
Romania , 3.00% , 14 February, 2031 2,732,000 2,833,211 0.65%
Romania , 6.75% , 07 February, 2022 2,032,000 2,111,143 0.49%

LYXOR NEWCITS IRL II PLC
116
CONDENSED SCHEDULE OF INVESTMENTS (continued)
As at 30 June 2021
Lyxor/Marathon Emerging Markets Bond Fund (continued)
No. of
shares/
Nominal
value/ No. of
contracts
Fair Value
USD
% of
Net
Assets
Financial assets
Transferrable securities traded on a regulated market (continued)
Debt securities (continued)
Russian Federation
Russian Federation , 4.38% , 21 March, 2029 7,800,000 8,791,961 2.02%
Russian Federation , 5.10% , 28 March, 2035 3,000,000 3,567,691 0.82%
SNAT (Dummy Country)
Africa Finance Corp , 2.88% , 28 April, 2028 2,184,000 2,194,606 0.50%
Saudi Arabia
Kingdom Of Saudi Arabia , 3.25% , 22 October, 2030 3,921,000 4,227,280 0.97%
Senegal
Senegal Government International Bond , 6.75% , 13 March, 2048 1,048,000 1,060,545 0.24%
Serbia
Serbia International Bond , 2.13% , 01 December, 2030 776,000 736,649 0.17%
South Africa
Republic of South Africa , 4.85% , 30 September, 2029 4,253,000 4,519,578 1.04%
Republic of South Africa , 5.75% , 30 September, 2049 3,808,000 3,898,520 0.90%
Sri Lanka
Sri Lanka Government International Bond , 5.75% , 18 April, 2023 1,216,000 917,709 0.21%
Sri Lanka Government International Bond , 6.75% , 18 April, 2028 6,304,000 4,005,657 0.92%
Turkey
Republic of Tuekey, 4.75% , 26 January, 2026 5,292,000 5,212,279 1.20%
Republic of Tuekey, 4.88% , 09 October, 2026 1,962,000 1,924,117 0.44%
Republic of Tuekey, 5.95% , 15 January, 2031 4,674,000 4,588,312 1.06%
Turkey Republic of (Government) , 5.13% , 22 June, 2026 2,881,000 2,882,649 0.66%
Ulker Biskuvi Sanayi AS , 6.95% , 30 October, 2025 1,757,000 1,909,127 0.44%
Ukraine
State Agency of Roads of Ukraine , 6.25% , 24 June, 2028 3,903,000 3,907,879 0.90%
Ukraine (Government) , 6.88% , 21 May, 2029 3,542,000 3,681,340 0.85%
Ukraine (Government), 7.25% , 15 March, 2033 582,000 606,724 0.14%
Ukraine (Government), 7.75% , 01 September, 2027 769,000 847,606 0.19%
Ukraine (Government), 8.99% , 01 February, 2024 1,727,000 1,917,579 0.44%
United Arab Emirates
Emirate of Abu Dhabi United Arab Emirates , 1.63% , 02 June, 2028 4,363,000 4,349,190 1.00%
United States of America
MercadoLibre Inc , 3.13% , 14 January, 2031 1,024,000 1,006,993 0.23%
Uruguay
Uruguay Oriental Republic of (Government) , 4.38% , 23 January,
2031 8,792,871 10,267,271 2.36%

LYXOR NEWCITS IRL II PLC
117
CONDENSED SCHEDULE OF INVESTMENTS (continued)
As at 30 June 2021
Lyxor/Marathon Emerging Markets Bond Fund (continued)
No. of
shares/
Nominal
value/ No. of
contracts
Fair Value
USD
% of
Net
Assets
Financial assets
Transferrable securities traded on a regulated market (continued)
Debt securities (continued)
Uzbekistan
Republic of Uzbekistan Bond , 3.70% , 25 November, 2030 1,042,000 1,041,357 0.24%
Zambia
Zambia Government International Bond , 5.38% , 20 September, 2022 1,738,000 1,103,384 0.21%
Total Debt securities (31 December 2020: USD 370,718,197– 98.35%) 434,319,979 99.89%
Total Transferrable securities traded on a regulated market
(31 December 2020: USD 370,718,197– 98.35%) 434,319,979 99.89%
Financial derivative instruments - Over-the-counter (OTC) (Assets)
Foreign currency forwards
Bought
Currency
Amount
Bought
Sold
Currency
Amount
Sold
Settlement
Date
Unrealised
Gain
% of
Net
Assets
USD 21,457 CHF 19,794 2 July 2021 64 0.00%
USD 115,880 CHF 105,253 9 July 2021 2,102 0.00%
USD 40,396 EUR 33,935 1 July 2021 158 0.00%
USD 760,968 EUR 631,940 9 July 2021 11,472 0.00%
USD 4,834 GBP 3,493 1 July 2021 4 0.00%
USD 106,882 GBP 75,783 9 July 2021 2,067 0.00%
Total Foreign currency forwards (31 December 2020: USD 573,171 – 0.15%) 15,867 0.00%
Total Financial derivative instruments - Over-the-counter (OTC) (Assets)
(31 December 2020: USD 573,171 – 0.15%)
15,867 0.00%
Total Financial derivative instruments (Assets)
(31 December 2020: USD 573,171 – 0.15%)
15,867 0.00%
Total Financial Assets at Fair Value Through Profit or Loss
(31 December 2020: USD 371,291,368– 98.50%)
434,335,846 99.89%

LYXOR NEWCITS IRL II PLC
118
CONDENSED SCHEDULE OF INVESTMENTS (continued)
As at 30 June 2021
Lyxor/Marathon Emerging Markets Bond Fund (continued)
No. of
shares/
Nominal
value/ No. of
contracts
Fair Value
USD
% of
Net
Assets
Financial liabilities
Financial derivative instruments (Liabilities)
Financial derivative instruments - Over-the-counter (OTC) (Liabilities)
Foreign currency forwards
Bought
Currency
Amount
Bought
Sold
Currency
Amount
Sold
Settlement
Date
Unrealised
Loss
% of
Net
Assets
CHF 36,814 USD 39,971 1 July, 2021 (186) (0.00)%
CHF 10,581,175 USD 11,745,027 9 July, 2021 (306,858) (0.07)%
EUR 18,026 USD 21,438 2 July, 2021 (62) (0.00)%
EUR 60,864,484 USD 74,127,400 9 July, 2021 (1,940,527) (0.44)%
GBP 12,038 USD 16,653 2 July, 2021 (3) (0.00)%
GBP 28,262,088 USD 39,940,972 9 July, 2021 (852,272) (0.20)%
Total Foreign currency forwards (2020: USD (9,706) – (0.00)%) (3,099,908) (0.71)%
Total Financial derivative instruments - Over-the-counter (OTC) (Liabilities)
(31 December 2020: USD (9,706) – (0.00)%) (3,099,908) (0.71)%
Total Financial derivative instruments (Liabilities) (2020: USD (2,567,317) – (2.03) %) (3,099,908) (0.71)%
Total Financial Liabilities at Fair Value Through Profit or Loss
(31 December 2020: USD (9,706) – (0.00)%) (3,099,908) (0.71)%
Cash and cash equivalents and Other assets and liabilities – net
(31 December 2020: USD 5,674,631 – 1.50%) 3,575,820 0.82%
Net assets attributable to holders of redeemable participating shares
(31 December 2020: USD 376,956,293– 100%) 434,811,758 100.00%
Analysis of Total Assets
Fair Value
USD
% of
Total
Assets
Transferrable securities traded on a regulated market 434,319,979 91.98%
Financial derivative instruments - Over-the-counter (OTC) (Assets) 15,867 0.00%
Cash and cash equivalents 11,200,037 2.37%
Other assets 26,677,877 5.65%
Total Assets 472,213,760 100.00%

LYXOR NEWCITS IRL II PLC
119
CONDENSED SCHEDULE OF INVESTMENTS (continued)
As at 30 June 2021
Lyxor/Bluescale Global Equity Alpha Fund
No. of
shares/
Nominal
value/ No. of
contracts
Fair Value
USD
% of
Net
Assets
Financial assets
Transferrable securities traded on a regulated market
Debt securities
United States of America
United States of America , 0.00% , 27 January, 2022 4,000,000 3,998,943 6.32%
United States of America , 0.00% , 24 February, 2022 2,500,000 2,499,233 3.95%
United States of America , 0.00% , 24 March, 2022 2,950,000 2,949,041 4.66%
United States of America , 0.00% , 19 May, 2022 2,500,000 2,498,618 3.95%
United States of America , 0.00% , 08 July, 2021 2,500,000 2,499,981 3.95%
United States of America , 0.00% , 15 July, 2021 3,500,000 3,499,946 5.53%
United States of America , 0.00% , 05 August, 2021 2,200,000 2,199,919 3.48%
United States of America , 0.00% , 12 August, 2021 5,000,000 4,999,737 7.90%
United States of America , 0.00% , 19 August, 2021 4,000,000 3,999,769 6.32%
United States of America , 0.00% , 09 September, 2021 2,000,000 1,999,832 3.16%
United States of America , 0.00% , 16 September, 2021 2,000,000 1,999,821 3.16%
United States of America , 0.00% , 07 October, 2021 7,500,000 7,499,148 11.85%
United States of America , 0.00% , 14 October, 2021 2,500,000 2,499,700 3.95%
United States of America , 0.00% , 21 October, 2021 2,500,000 2,499,702 3.95%
United States of America , 0.00% , 04 January, 2021 2,500,000 2,499,614 3.95%
United States of America , 0.00% , 02 February, 2021 2,500,000 2,499,512 3.95%
United States of America , 0.00% , 09 February, 2021 2,000,000 1,999,591 3.16%
United States of America , 0.00% , 30 December, 2021 2,500,000 2,499,370 3.93%
Total Debt securities (31 December 2020: USD 70,137,625 –83.65 %) 55,141,477 87.12%
Total Transferrable securities traded on a regulated market
(31 December 2020: USD 70,137,625 –83.65 %) 55,141,477 87.12%
Financial derivative instruments - Over-the-counter (OTC) (Assets)
Equity swaps Canada 7,477 495,478 0.78%
Cayman Islands 261,503 732,717 1.16%
China (22,596) 19,241 0.03% Germany (39,974) 39,623 0.06%
Guernsy (9,097) 29,977 0.05%
Italy 73,984 53,414 0.08%
Japan 600 48,421 0.08%
Jersey (Channel Islands) 34,938 53,796 0.08%
Mexico (88,684) 92,022 0.15%
Republic of Korea 14,347 219,918 0.35%
Singapore 6,713 95,007 0.15%
Switzerland (5,665) 29,257 0.05%
Taiwan Province of China (769,311) 21,298 0.03%
United States of America 28,464 1,216,893 1.92%
Total Equity swaps (31 December 2020: USD 4,392,942– 5.24%) 3,147,062 4.97%
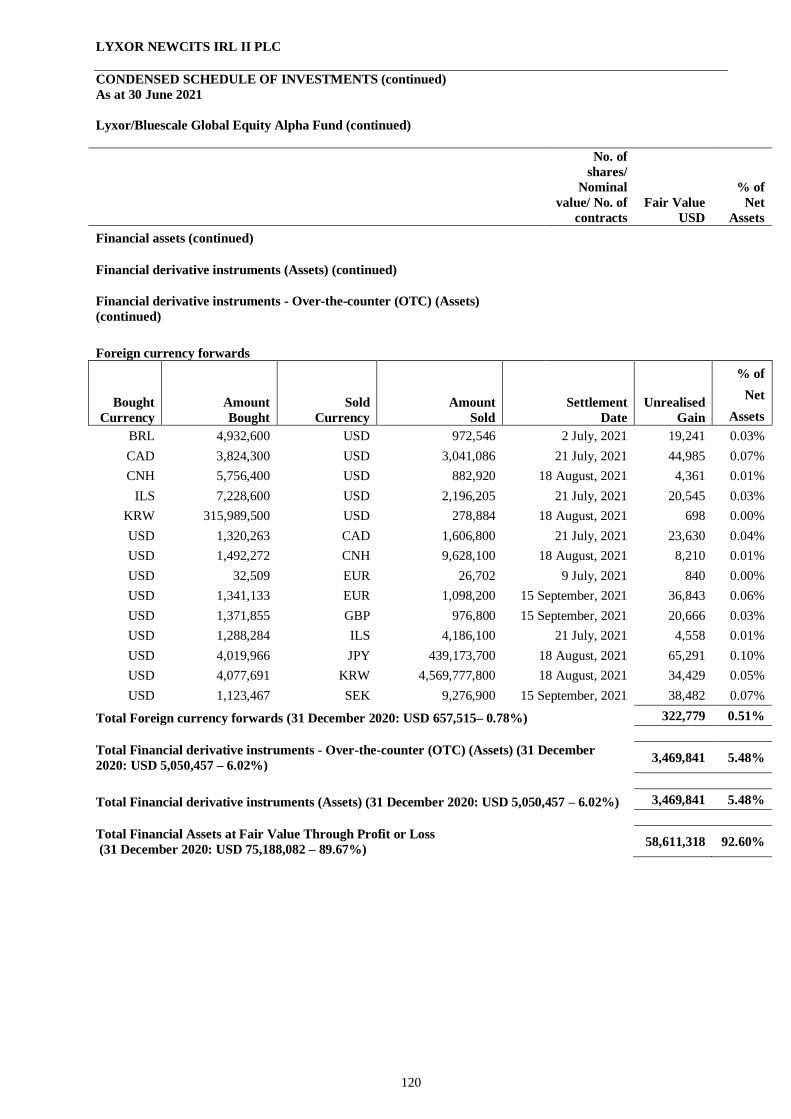
LYXOR NEWCITS IRL II PLC
120
CONDENSED SCHEDULE OF INVESTMENTS (continued)
As at 30 June 2021
Lyxor/Bluescale Global Equity Alpha Fund (continued)
No. of
shares/
Nominal
value/ No. of
contracts
Fair Value
USD
% of
Net
Assets
Financial assets (continued)
Financial derivative instruments (Assets) (continued)
Financial derivative instruments - Over-the-counter (OTC) (Assets)
(continued)
Foreign currency forwards
Bought
Currency
Amount
Bought
Sold
Currency
Amount
Sold
Settlement
Date
Unrealised
Gain
% of
Net
Assets
BRL 4,932,600 USD 972,546 2 July, 2021 19,241 0.03%
CAD 3,824,300 USD 3,041,086 21 July, 2021 44,985 0.07%
CNH 5,756,400 USD 882,920 18 August, 2021 4,361 0.01%
ILS 7,228,600 USD 2,196,205 21 July, 2021 20,545 0.03%
KRW 315,989,500 USD 278,884 18 August, 2021 698 0.00%
USD 1,320,263 CAD 1,606,800 21 July, 2021 23,630 0.04%
USD 1,492,272 CNH 9,628,100 18 August, 2021 8,210 0.01%
USD 32,509 EUR 26,702 9 July, 2021 840 0.00%
USD 1,341,133 EUR 1,098,200 15 September, 2021 36,843 0.06%
USD 1,371,855 GBP 976,800 15 September, 2021 20,666 0.03%
USD 1,288,284 ILS 4,186,100 21 July, 2021 4,558 0.01%
USD 4,019,966 JPY 439,173,700 18 August, 2021 65,291 0.10%
USD 4,077,691 KRW 4,569,777,800 18 August, 2021 34,429 0.05%
USD 1,123,467 SEK 9,276,900 15 September, 2021 38,482 0.07%
Total Foreign currency forwards (31 December 2020: USD 657,515– 0.78%) 322,779 0.51%
Total Financial derivative instruments - Over-the-counter (OTC) (Assets) (31 December
2020: USD 5,050,457 – 6.02%) 3,469,841 5.48%
Total Financial derivative instruments (Assets) (31 December 2020: USD 5,050,457 – 6.02%) 3,469,841 5.48%
Total Financial Assets at Fair Value Through Profit or Loss
(31 December 2020: USD 75,188,082 – 89.67%) 58,611,318 92.60%
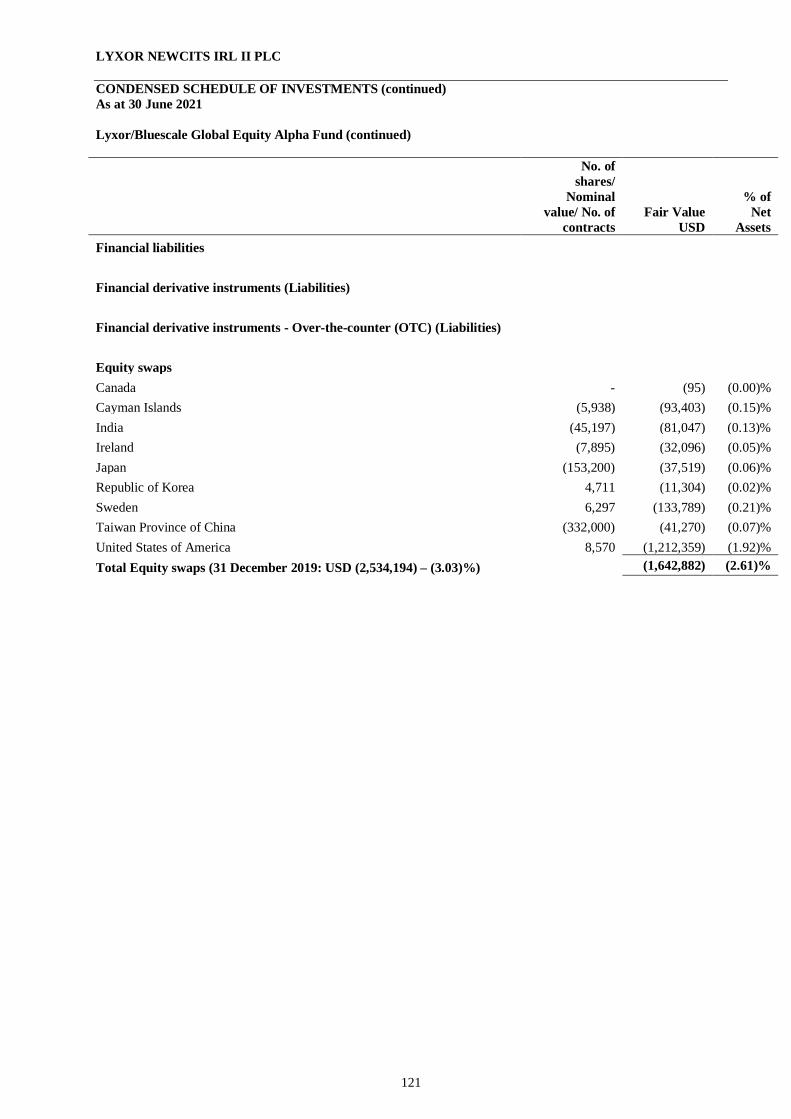
LYXOR NEWCITS IRL II PLC
121
CONDENSED SCHEDULE OF INVESTMENTS (continued)
As at 30 June 2021
Lyxor/Bluescale Global Equity Alpha Fund (continued)
No. of
shares/
Nominal
value/ No. of
contracts
Fair Value
USD
% of
Net
Assets
Financial liabilities
Financial derivative instruments (Liabilities)
Financial derivative instruments - Over-the-counter (OTC) (Liabilities)
Equity swaps
Canada - (95) (0.00)%
Cayman Islands (5,938) (93,403) (0.15)%
India (45,197) (81,047) (0.13)%
Ireland (7,895) (32,096) (0.05)%
Japan (153,200) (37,519) (0.06)%
Republic of Korea 4,711 (11,304) (0.02)%
Sweden 6,297 (133,789) (0.21)%
Taiwan Province of China (332,000) (41,270) (0.07)%
United States of America 8,570 (1,212,359) (1.92)%
Total Equity swaps (31 December 2019: USD (2,534,194) – (3.03)%) (1,642,882) (2.61)%

LYXOR NEWCITS IRL II PLC
122
CONDENSED SCHEDULE OF INVESTMENTS (continued)
As at 30 June 2021
Lyxor/Bluescale Global Equity Alpha Fund (continued)
Fair Value
USD
% of
Net
Assets
Financial liabilities (continued)
Financial derivative instruments (Liabilities) (continued)
Financial derivative instruments - Over-the-counter (OTC) (Liabilities) (continued)
Foreign currency forwards
Bought
Currency
Amount
Bought
Sold
Currency
Amount
Sold
Settlement
Date
Unrealised
Loss
% of
Net
Assets
CAD 1,623,800 USD 1,333,275 21 July, 2021 (22,924) (0.04)%
CHF 777,400 USD 867,767 15 September, 2021 (25,905) (0.04)%
CNH 10,484,600 USD 1,630,911 18 August, 2021 (14,829) (0.02)%
CNY 2,488,600 USD 385,091 18 August, 2021 (1,590) (0.00)%
EUR 1,330,283 USD 1,618,327 9 July, 2021 (40,578) (0.06)%
EUR 1,520,600 USD 1,851,051 15 September, 2021 (45,095) (0.07)%
GBP 524,900 USD 742,607 15 September, 2021 (16,521) (0.03)% JPY 526,539,000 USD 4,827,081 18 August, 2021 (85,697) (0.14)%
KRW 1,908,472,100 USD 1,699,567 18 August, 2021 (10,984) (0.02)%
USD 889,939 BRL 4,932,600 2 July, 2021 (101,847) (0.15)%
USD 1,249,202 BRL 6,362,500 4 October, 2021 (15,490) (0.02)%
USD 5,253,861 CAD 6,606,700 21 July, 2021 (77,506) (0.11)%
USD 1,878,487 CNH 12,204,800 18 August, 2021 (2,741) (0.00)%
USD 6,807,797 CNY 44,388,200 18 August, 2021 (32,554) (0.05)%
USD 811,859 ILS 2,659,400 21 July, 2021 (3,681) (0.02)%
Total Foreign currency forwards (31 December 2020: USD ((958,523) – (1.14)%) (497,942) (0.77)%
Total Financial derivative instruments - Over-the-counter (OTC)
(Liabilities) (31 December 2020: USD (3,492,717) –(4.17)%) (2,140,824) (3.38)%
Total Financial derivative instruments (Liabilities) (31 December 2020: USD (3,492,717) –
(4.17)%) (2,140,824) (3.38)%
Total Financial Liabilities at Fair Value Through Profit or Loss (31 December 2020: USD
(3,492,717) –(4.17)%) (2,140,824) (3.38)%

LYXOR NEWCITS IRL II PLC
123
CONDENSED SCHEDULE OF INVESTMENTS (continued)
As at 30 June 2021
Lyxor/Bluescale Global Equity Alpha Fund (continued)
No. of
shares/
Nominal
value/ No.
of
contracts
Fair Value
USD
% of
Net
Assets
Cash and cash equivalents and Other assets and liabilities – net
(31 December 2020: USD 12,154,127 – 14.50%) 6,819,882 10.78%
Net assets attributable to holders of redeemable participating shares
(31 December 2020: USD 83,849,492 – 100.00%) 63,290,376 100.00%
Analysis of Total Assets
Fair Value
USD
% of
Total
Assets
Transferrable securities traded on a regulated market 55,141,477 83.94%
Financial derivative instruments - Over-the-counter (OTC) (Assets) 3,469,841 5.28%
Cash and cash equivalents 5,064,119 7.71%
Other assets 2,014,673 3.07%
Total Assets 65,690,110 100.00%
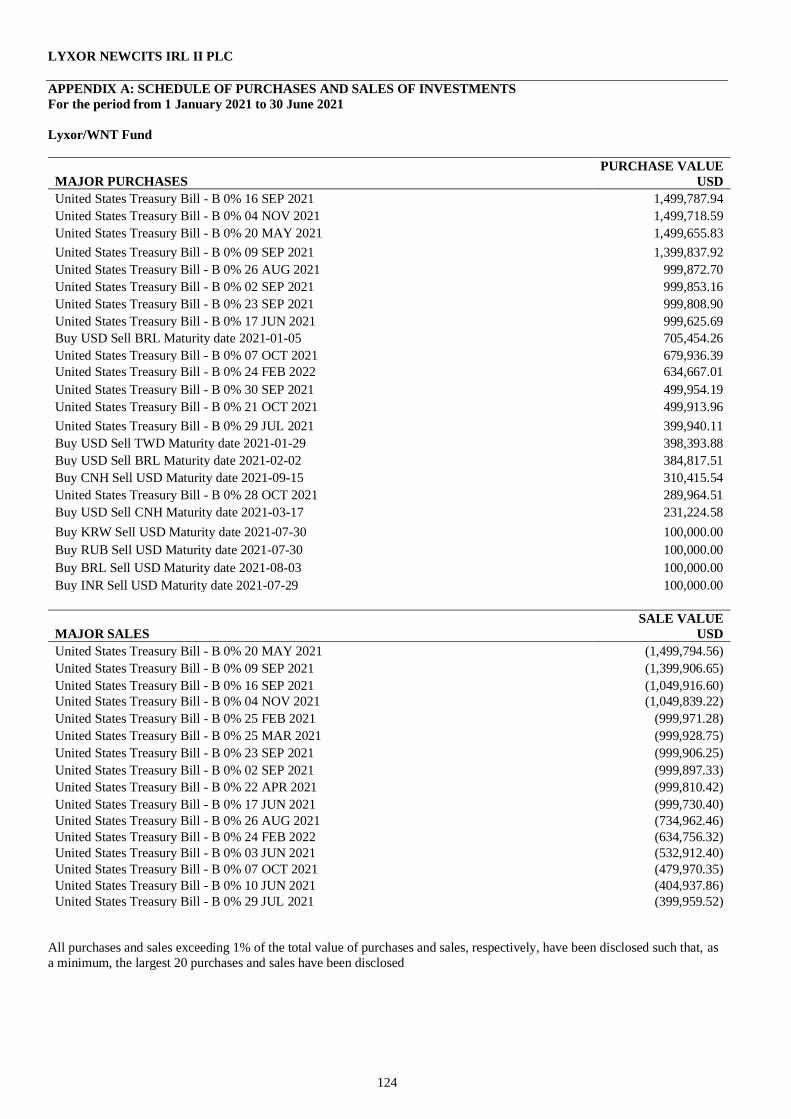
LYXOR NEWCITS IRL II PLC
124
APPENDIX A: SCHEDULE OF PURCHASES AND SALES OF INVESTMENTS
For the period from 1 January 2021 to 30 June 2021
Lyxor/WNT Fund
MAJOR PURCHASES
PURCHASE VALUE
USD
United States Treasury Bill - B 0% 16 SEP 2021 1,499,787.94
United States Treasury Bill - B 0% 04 NOV 2021 1,499,718.59
United States Treasury Bill - B 0% 20 MAY 2021 1,499,655.83
United States Treasury Bill - B 0% 09 SEP 2021 1,399,837.92
United States Treasury Bill - B 0% 26 AUG 2021 999,872.70
United States Treasury Bill - B 0% 02 SEP 2021 999,853.16
United States Treasury Bill - B 0% 23 SEP 2021 999,808.90
United States Treasury Bill - B 0% 17 JUN 2021 999,625.69
Buy USD Sell BRL Maturity date 2021-01-05 705,454.26
United States Treasury Bill - B 0% 07 OCT 2021 679,936.39
United States Treasury Bill - B 0% 24 FEB 2022 634,667.01
United States Treasury Bill - B 0% 30 SEP 2021 499,954.19
United States Treasury Bill - B 0% 21 OCT 2021 499,913.96
United States Treasury Bill - B 0% 29 JUL 2021 399,940.11
Buy USD Sell TWD Maturity date 2021-01-29 398,393.88
Buy USD Sell BRL Maturity date 2021-02-02 384,817.51
Buy CNH Sell USD Maturity date 2021-09-15 310,415.54
United States Treasury Bill - B 0% 28 OCT 2021 289,964.51
Buy USD Sell CNH Maturity date 2021-03-17 231,224.58
Buy KRW Sell USD Maturity date 2021-07-30 100,000.00
Buy RUB Sell USD Maturity date 2021-07-30 100,000.00
Buy BRL Sell USD Maturity date 2021-08-03 100,000.00
Buy INR Sell USD Maturity date 2021-07-29 100,000.00
MAJOR SALES
SALE VALUE
USD
United States Treasury Bill - B 0% 20 MAY 2021 (1,499,794.56)
United States Treasury Bill - B 0% 09 SEP 2021 (1,399,906.65)
United States Treasury Bill - B 0% 16 SEP 2021 (1,049,916.60)
United States Treasury Bill - B 0% 04 NOV 2021 (1,049,839.22)
United States Treasury Bill - B 0% 25 FEB 2021 (999,971.28)
United States Treasury Bill - B 0% 25 MAR 2021 (999,928.75)
United States Treasury Bill - B 0% 23 SEP 2021 (999,906.25)
United States Treasury Bill - B 0% 02 SEP 2021 (999,897.33)
United States Treasury Bill - B 0% 22 APR 2021 (999,810.42)
United States Treasury Bill - B 0% 17 JUN 2021 (999,730.40)
United States Treasury Bill - B 0% 26 AUG 2021 (734,962.46)
United States Treasury Bill - B 0% 24 FEB 2022 (634,756.32)
United States Treasury Bill - B 0% 03 JUN 2021 (532,912.40)
United States Treasury Bill - B 0% 07 OCT 2021 (479,970.35)
United States Treasury Bill - B 0% 10 JUN 2021 (404,937.86)
United States Treasury Bill - B 0% 29 JUL 2021 (399,959.52)
All purchases and sales exceeding 1% of the total value of purchases and sales, respectively, have been disclosed such that, as
a minimum, the largest 20 purchases and sales have been disclosed
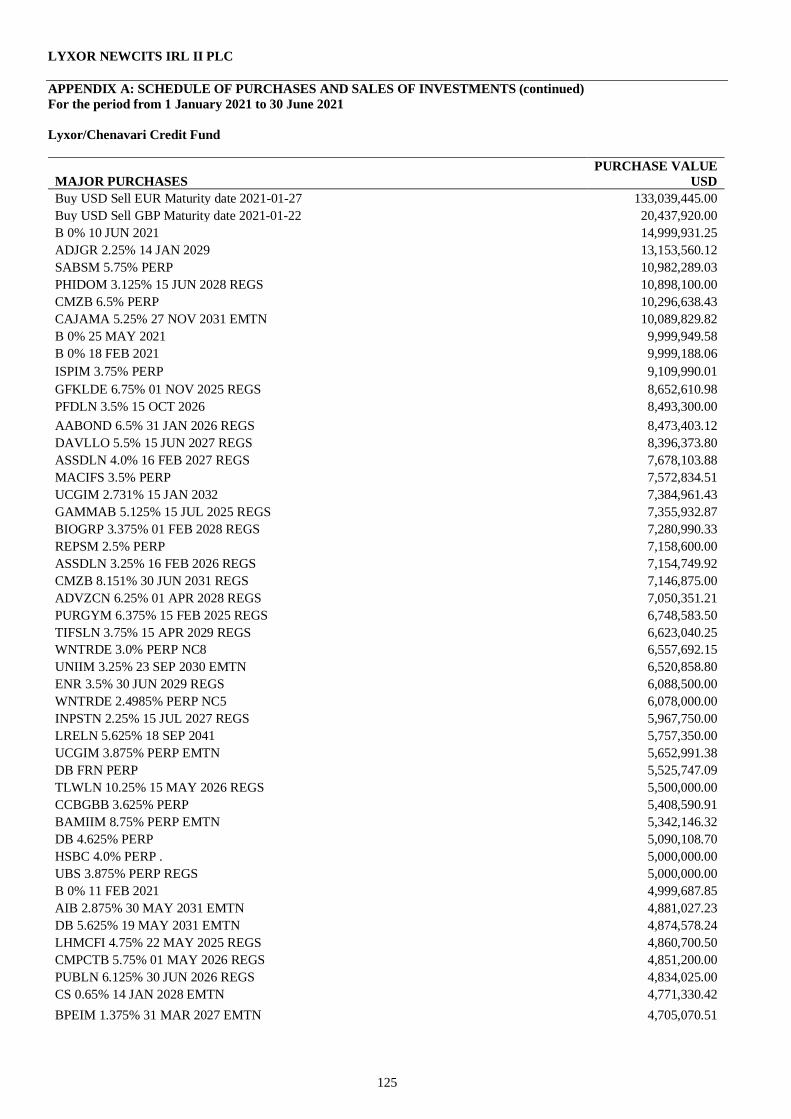
LYXOR NEWCITS IRL II PLC
125
APPENDIX A: SCHEDULE OF PURCHASES AND SALES OF INVESTMENTS (continued)
For the period from 1 January 2021 to 30 June 2021
Lyxor/Chenavari Credit Fund
MAJOR PURCHASES
PURCHASE VALUE
USD
Buy USD Sell EUR Maturity date 2021-01-27 133,039,445.00
Buy USD Sell GBP Maturity date 2021-01-22 20,437,920.00
B 0% 10 JUN 2021 14,999,931.25
ADJGR 2.25% 14 JAN 2029 13,153,560.12
SABSM 5.75% PERP 10,982,289.03
PHIDOM 3.125% 15 JUN 2028 REGS 10,898,100.00
CMZB 6.5% PERP 10,296,638.43
CAJAMA 5.25% 27 NOV 2031 EMTN 10,089,829.82
B 0% 25 MAY 2021 9,999,949.58
B 0% 18 FEB 2021 9,999,188.06
ISPIM 3.75% PERP 9,109,990.01
GFKLDE 6.75% 01 NOV 2025 REGS 8,652,610.98
PFDLN 3.5% 15 OCT 2026 8,493,300.00
AABOND 6.5% 31 JAN 2026 REGS 8,473,403.12
DAVLLO 5.5% 15 JUN 2027 REGS 8,396,373.80
ASSDLN 4.0% 16 FEB 2027 REGS 7,678,103.88
MACIFS 3.5% PERP 7,572,834.51
UCGIM 2.731% 15 JAN 2032 7,384,961.43
GAMMAB 5.125% 15 JUL 2025 REGS 7,355,932.87
BIOGRP 3.375% 01 FEB 2028 REGS 7,280,990.33
REPSM 2.5% PERP 7,158,600.00
ASSDLN 3.25% 16 FEB 2026 REGS 7,154,749.92
CMZB 8.151% 30 JUN 2031 REGS 7,146,875.00
ADVZCN 6.25% 01 APR 2028 REGS 7,050,351.21
PURGYM 6.375% 15 FEB 2025 REGS 6,748,583.50
TIFSLN 3.75% 15 APR 2029 REGS 6,623,040.25
WNTRDE 3.0% PERP NC8 6,557,692.15
UNIIM 3.25% 23 SEP 2030 EMTN 6,520,858.80
ENR 3.5% 30 JUN 2029 REGS 6,088,500.00
WNTRDE 2.4985% PERP NC5 6,078,000.00
INPSTN 2.25% 15 JUL 2027 REGS 5,967,750.00
LRELN 5.625% 18 SEP 2041 5,757,350.00
UCGIM 3.875% PERP EMTN 5,652,991.38
DB FRN PERP 5,525,747.09
TLWLN 10.25% 15 MAY 2026 REGS 5,500,000.00
CCBGBB 3.625% PERP 5,408,590.91
BAMIIM 8.75% PERP EMTN 5,342,146.32
DB 4.625% PERP 5,090,108.70
HSBC 4.0% PERP . 5,000,000.00
UBS 3.875% PERP REGS 5,000,000.00
B 0% 11 FEB 2021 4,999,687.85
AIB 2.875% 30 MAY 2031 EMTN 4,881,027.23
DB 5.625% 19 MAY 2031 EMTN 4,874,578.24
LHMCFI 4.75% 22 MAY 2025 REGS 4,860,700.50
CMPCTB 5.75% 01 MAY 2026 REGS 4,851,200.00
PUBLN 6.125% 30 JUN 2026 REGS 4,834,025.00
CS 0.65% 14 JAN 2028 EMTN 4,771,330.42
BPEIM 1.375% 31 MAR 2027 EMTN 4,705,070.51
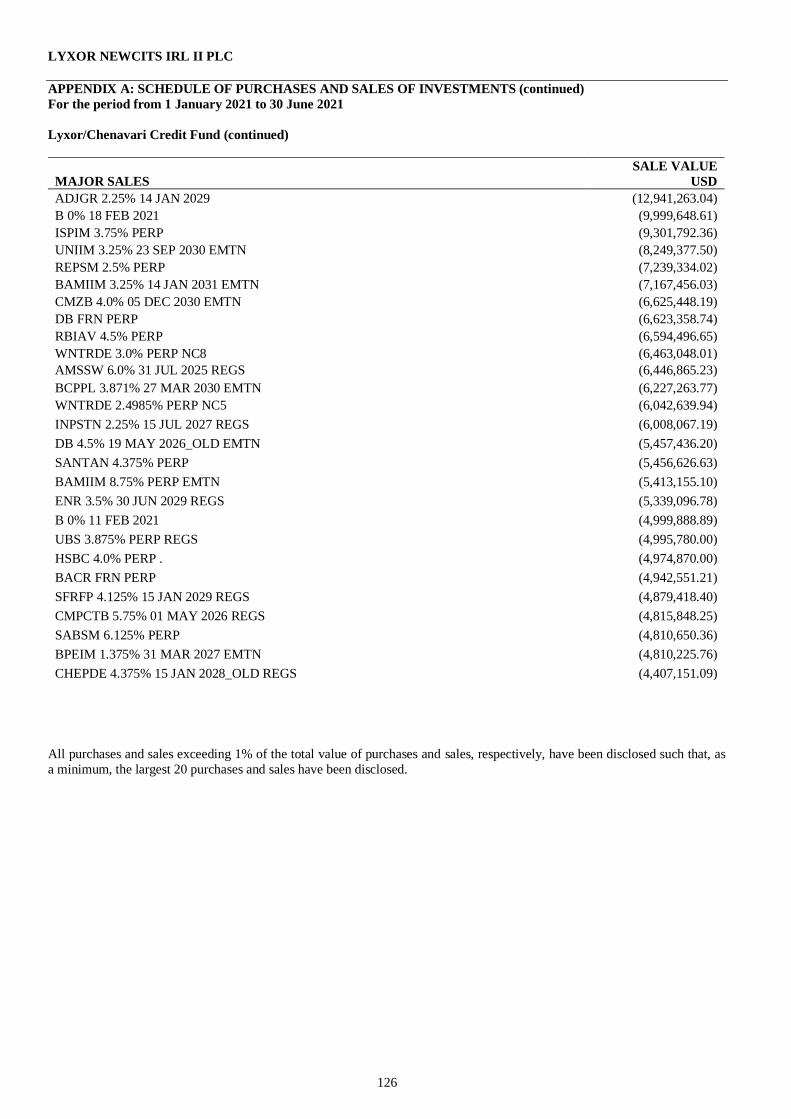
LYXOR NEWCITS IRL II PLC
126
APPENDIX A: SCHEDULE OF PURCHASES AND SALES OF INVESTMENTS (continued)
For the period from 1 January 2021 to 30 June 2021
Lyxor/Chenavari Credit Fund (continued)
MAJOR SALES
SALE VALUE
USD
ADJGR 2.25% 14 JAN 2029 (12,941,263.04)
B 0% 18 FEB 2021 (9,999,648.61)
ISPIM 3.75% PERP (9,301,792.36)
UNIIM 3.25% 23 SEP 2030 EMTN (8,249,377.50)
REPSM 2.5% PERP (7,239,334.02)
BAMIIM 3.25% 14 JAN 2031 EMTN (7,167,456.03)
CMZB 4.0% 05 DEC 2030 EMTN (6,625,448.19)
DB FRN PERP (6,623,358.74)
RBIAV 4.5% PERP (6,594,496.65)
WNTRDE 3.0% PERP NC8 (6,463,048.01)
AMSSW 6.0% 31 JUL 2025 REGS (6,446,865.23)
BCPPL 3.871% 27 MAR 2030 EMTN (6,227,263.77)
WNTRDE 2.4985% PERP NC5 (6,042,639.94)
INPSTN 2.25% 15 JUL 2027 REGS (6,008,067.19)
DB 4.5% 19 MAY 2026_OLD EMTN (5,457,436.20)
SANTAN 4.375% PERP (5,456,626.63)
BAMIIM 8.75% PERP EMTN (5,413,155.10)
ENR 3.5% 30 JUN 2029 REGS (5,339,096.78)
B 0% 11 FEB 2021 (4,999,888.89)
UBS 3.875% PERP REGS (4,995,780.00)
HSBC 4.0% PERP . (4,974,870.00)
BACR FRN PERP (4,942,551.21)
SFRFP 4.125% 15 JAN 2029 REGS (4,879,418.40)
CMPCTB 5.75% 01 MAY 2026 REGS (4,815,848.25)
SABSM 6.125% PERP (4,810,650.36)
BPEIM 1.375% 31 MAR 2027 EMTN (4,810,225.76)
CHEPDE 4.375% 15 JAN 2028_OLD REGS (4,407,151.09)
All purchases and sales exceeding 1% of the total value of purchases and sales, respectively, have been disclosed such that, as
a minimum, the largest 20 purchases and sales have been disclosed.

LYXOR NEWCITS IRL II PLC
127
APPENDIX A: SCHEDULE OF PURCHASES AND SALES OF INVESTMENTS (continued)
For the period from 1 January 2021 to 30 June 2021
Lyxor/Wells Capital Financial Credit Fund
MAJOR PURCHASES
PURCHASE VALUE
USD
Buy USD Sell EUR Maturity date 2021-01-12 74,727,896
Buy USD Sell GBP Maturity date 2021-01-12 24,361,101
ABANCA 6.0% PERP 5,438,247
CS 1.125% 15 DEC 2025 EMTN 4,222,680
SRENVX 4.625% PERP 4,096,250
CNPFP 4.875% PERP 4,020,000
LRELN 5.625% 18 SEP 2041 4,000,000
CAJAMA 5.25% 27 NOV 2031 EMTN 3,721,639
MACIFS 2.125% 21 JUN 2052 3,622,578
BAMIIM 2.875% 29 JUN 2031 EMTN 3,573,791
BCPPL 3.871% 27 MAR 2030 EMTN 3,542,994
ACAFP 7.5% PERP REGS 3,352,431
ISPIM 5.5% PERP EMTN 3,336,925
IPMID 3.0% 19 AUG 2031 EMTN 3,320,900
ACAFP 7.5% PERP . 3,273,106
CS 5.25% PERP REGS 3,127,500
SHBASS 4.75% PERP . 2,762,500
UBS 0.5% 31 MAR 2031 EMTN 2,578,859
KBCBB 4.75% PERP 2,574,276
ANZ 0.669% 05 MAY 2031 EMTN 2,057,935
EFGBNK 5.5% PERP 2,000,000
BNP 2.0% 24 MAY 2031 EMTN 1,834,148
NWG 2.105% 28 NOV 2031 EMTN 1,626,503
ISPIM 7.75% PERP 1,445,379
CABKSM 1.5% 03 DEC 2026 EMTN 1,410,838
BKTSM 6.25% PERP 1,359,774
CMZB 6.125% PERP 1,315,770
NYKRE 4.125% PERP 1,285,494
CS 3.091% 14 MAY 2032 REGS 1,000,000
LGEN FRN 01 NOV 2050 784,401
ASRNED 4.625% PERP . 652,147

LYXOR NEWCITS IRL II PLC
128
APPENDIX A: SCHEDULE OF PURCHASES AND SALES OF INVESTMENTS (continued)
For the period from 1 January 2021 to 30 June 2021
Lyxor/Wells Capital Financial Credit Fund (continued)
MAJOR SALES
SALE VALUE
USD
ISPIM 7.75% PERP (5,844,166)
CS 1.125% 15 DEC 2025 EMTN (4,163,560)
SRENVX 4.625% PERP (4,121,000)
RBIAV 6.0% PERP (3,926,281)
SAMPFH 2.5% 03 SEP 2052 EMTN (3,912,478)
BCPPL 3.871% 27 MAR 2030 EMTN (3,480,963)
UBS 7.0% PERP (3,474,000)
ACAFP 7.5% PERP . (3,352,431)
CS 7.5% PERP REGS (3,268,500)
CS 5.25% PERP REGS (3,097,500)
BACR FRN PERP (2,818,775)
SHBASS 4.75% PERP . (2,769,000)
BAMIIM 5.0% 14 SEP 2030 (2,575,445)
BAMIIM 6.125% PERP (2,422,792)
SABSM 2.0% 17 JAN 2030 (2,379,877)
SRENVX 5.0% 02 APR 2049 REGS (2,340,000)
BKTSM 6.25% PERP (2,182,750)
EFGBNK 5.5% PERP (2,052,600)
BNP 6.625% PERP REGS (2,013,170)
ANZ 0.669% 05 MAY 2031 EMTN (1,997,335)
ABANCA 6.0% PERP (1,778,707)
USIMIT 6.375% PERP (1,312,960)
RBIAV 6.125% PERP (1,263,788)
CS 3.091% 14 MAY 2032 REGS (1,011,470)
All purchases and sales exceeding 1% of the total value of purchases and sales, respectively, have been disclosed such that, as
a minimum, the largest 20 purchases and sales have been disclosed
.

LYXOR NEWCITS IRL II PLC
129
APPENDIX A: SCHEDULE OF PURCHASES AND SALES OF INVESTMENTS (continued)
For the period from 1 January 2021 to 30 June 2021
Lyxor/Marathon Emerging Markets Bond Fund
MAJOR PURCHASES
PURCHASE VALUE
USD
MEX 4.28% 14 AUG 2041 9,721,508
COLOM 3.25% 22 APR 2032 9,497,983
MEX 2.659% 24 MAY 2031 8,987,076
BRAZIL 3.75% 12 SEP 2031 8,281,948
DOMREP 5.3% 21 JAN 2041 REGS 8,254,769
PETRPE 5.625% 19 JUN 2047 REGS 7,734,601
DOMREP 4.5% 30 JAN 2030 REGS 7,711,197
COLOM 4.125% 22 FEB 2042 7,393,284
ADGLXY 2.94% 30 SEP 2040_OLD REGS 7,084,800
PANAMA 2.252% 29 SEP 2032 6,622,304
PEMEX 6.75% 21 SEP 2047 6,528,929
BRAZIL 3.875% 12 JUN 2030 6,519,922
TURKEY 4.75% 26 JAN 2026 6,103,948
CHILE 2.55% 27 JAN 2032 5,668,098
PEMEX 5.95% 28 JAN 2031 5,444,078
PETRPE 5.625% 19 JUN 2047 FEB 5,402,401
CHILE 3.1% 07 MAY 2041 5,144,977
PETMK 2.48% 28 JAN 2032 REGS 5,119,130
PERU 2.783% 23 JAN 2031 4,918,044
UKRAIN 7.253% 15 MAR 2033 REGS 4,908,382
QPETRO 1.375% 12 SEP 2026 REGS 4,695,535
MAJOR SALES
SALE VALUE
USD
BRAZIL 3.875% 12 JUN 2030 (14,321,452)
COLOM 3.125% 15 APR 2031 (10,243,864)
PERU 2.783% 23 JAN 2031 (8,225,399)
MEX 4.28% 14 AUG 2041 (7,886,309)
ARAMCO 3.5% 24 NOV 2070 REGS (7,702,379)
MEX 2.659% 24 MAY 2031 (6,328,826)
PANAMA 4.5% 01 APR 2056 (6,320,027)
PEMEX 6.875% 16 OCT 2025 REGS (5,796,379)
PETRPE 5.625% 19 JUN 2047 FEB (5,402,401)
UKRAIN 7.253% 15 MAR 2033 REGS (5,046,703)
TURKEY 5.125% 25 MAR 2022 (4,942,996)
PANAMA 3.87% 23 JUL 2060 (4,880,060)
REPHUN 6.375% 29 MAR 2021 (4,307,408)
GNBSUD 7.5% 16 APR 2031 REGS (4,258,374)
QATAR 3.75% 16 APR 2030 REGS (4,101,112)
CHILE 3.5% 25 JAN 2050 (4,049,862)
ABDPOC 2.5% 06 MAY 2031 EMTN (3,970,641)
All purchases and sales exceeding 1% of the total value of purchases and sales, respectively, have been disclosed such that, as
a minimum, the largest 20 purchases and sales have been disclosed
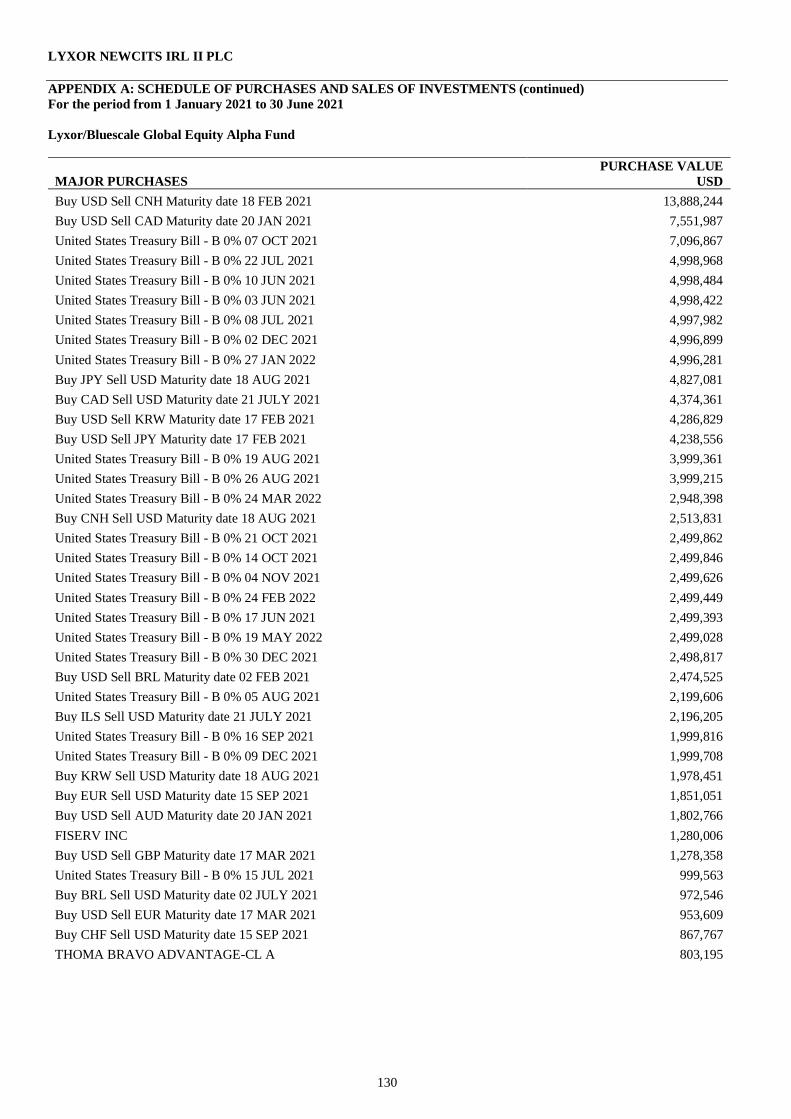
LYXOR NEWCITS IRL II PLC
130
APPENDIX A: SCHEDULE OF PURCHASES AND SALES OF INVESTMENTS (continued)
For the period from 1 January 2021 to 30 June 2021
Lyxor/Bluescale Global Equity Alpha Fund
MAJOR PURCHASES
PURCHASE VALUE
USD
Buy USD Sell CNH Maturity date 18 FEB 2021 13,888,244
Buy USD Sell CAD Maturity date 20 JAN 2021 7,551,987
United States Treasury Bill - B 0% 07 OCT 2021 7,096,867
United States Treasury Bill - B 0% 22 JUL 2021 4,998,968
United States Treasury Bill - B 0% 10 JUN 2021 4,998,484
United States Treasury Bill - B 0% 03 JUN 2021 4,998,422
United States Treasury Bill - B 0% 08 JUL 2021 4,997,982
United States Treasury Bill - B 0% 02 DEC 2021 4,996,899
United States Treasury Bill - B 0% 27 JAN 2022 4,996,281
Buy JPY Sell USD Maturity date 18 AUG 2021 4,827,081
Buy CAD Sell USD Maturity date 21 JULY 2021 4,374,361
Buy USD Sell KRW Maturity date 17 FEB 2021 4,286,829
Buy USD Sell JPY Maturity date 17 FEB 2021 4,238,556
United States Treasury Bill - B 0% 19 AUG 2021 3,999,361
United States Treasury Bill - B 0% 26 AUG 2021 3,999,215
United States Treasury Bill - B 0% 24 MAR 2022 2,948,398
Buy CNH Sell USD Maturity date 18 AUG 2021 2,513,831
United States Treasury Bill - B 0% 21 OCT 2021 2,499,862
United States Treasury Bill - B 0% 14 OCT 2021 2,499,846
United States Treasury Bill - B 0% 04 NOV 2021 2,499,626
United States Treasury Bill - B 0% 24 FEB 2022 2,499,449
United States Treasury Bill - B 0% 17 JUN 2021 2,499,393
United States Treasury Bill - B 0% 19 MAY 2022 2,499,028
United States Treasury Bill - B 0% 30 DEC 2021 2,498,817
Buy USD Sell BRL Maturity date 02 FEB 2021 2,474,525
United States Treasury Bill - B 0% 05 AUG 2021 2,199,606
Buy ILS Sell USD Maturity date 21 JULY 2021 2,196,205
United States Treasury Bill - B 0% 16 SEP 2021 1,999,816
United States Treasury Bill - B 0% 09 DEC 2021 1,999,708
Buy KRW Sell USD Maturity date 18 AUG 2021 1,978,451
Buy EUR Sell USD Maturity date 15 SEP 2021 1,851,051
Buy USD Sell AUD Maturity date 20 JAN 2021 1,802,766
FISERV INC 1,280,006
Buy USD Sell GBP Maturity date 17 MAR 2021 1,278,358
United States Treasury Bill - B 0% 15 JUL 2021 999,563
Buy BRL Sell USD Maturity date 02 JULY 2021 972,546
Buy USD Sell EUR Maturity date 17 MAR 2021 953,609
Buy CHF Sell USD Maturity date 15 SEP 2021 867,767
THOMA BRAVO ADVANTAGE-CL A 803,195

LYXOR NEWCITS IRL II PLC
131
APPENDIX A: SCHEDULE OF PURCHASES AND SALES OF INVESTMENTS (continued)
For the period from 1 January 2021 to 30 June 2021
Lyxor/Bluescale Global Equity Alpha Fund (continued)
MAJOR SALES
SALE VALUE
USD
United States Treasury Bill - B 0% 22 JUL 2021 (4,999,767)
United States Treasury Bill - B 0% 26 AUG 2021 (3,999,720)
United States Treasury Bill - B 0% 10 JUN 2021 (2,499,984)
United States Treasury Bill - B 0% 03 JUN 2021 (2,499,983)
United States Treasury Bill - B 0% 17 JUN 2021 (2,499,968)
United States Treasury Bill - B 0% 08 JUL 2021 (2,499,927)
United States Treasury Bill - B 0% 07 OCT 2021 (2,499,660)
United States Treasury Bill - B 0% 02 DEC 2021 (2,499,265)
FISERV INC (1,299,097)
United States Treasury Bill - B 0% 27 JAN 2022 (999,663)
QUALTRICS INTERNATIONAL-CL A (905,672)
THOMA BRAVO ADVANTAGE-CL A (685,255)
DRAGONEER GROWTH OPPORTUNITI (658,005)
RENESAS ELECTRONICS CORP (500,336)
COINBASE GLOBAL INC -CLASS A (469,899)
EQSWAP AFFIRM HOLDINGS INC(NSM) 20210115-20991231 - CITINY (459,170)
EQSWAP DIALOG SEMICONDUCTOR PLC(GER) 20201209-20991231 -
GOLDLN (407,040)
OPEN LENDING CORP - CL A (374,483)
COUPANG INC (366,637)
REPAY HOLDINGS CORP(NAS) (329,819)
All purchases and sales exceeding 1% of the total value of purchases and sales, respectively, have been disclosed such that, as
a minimum, the largest 20 purchases and sales have been disclosed.
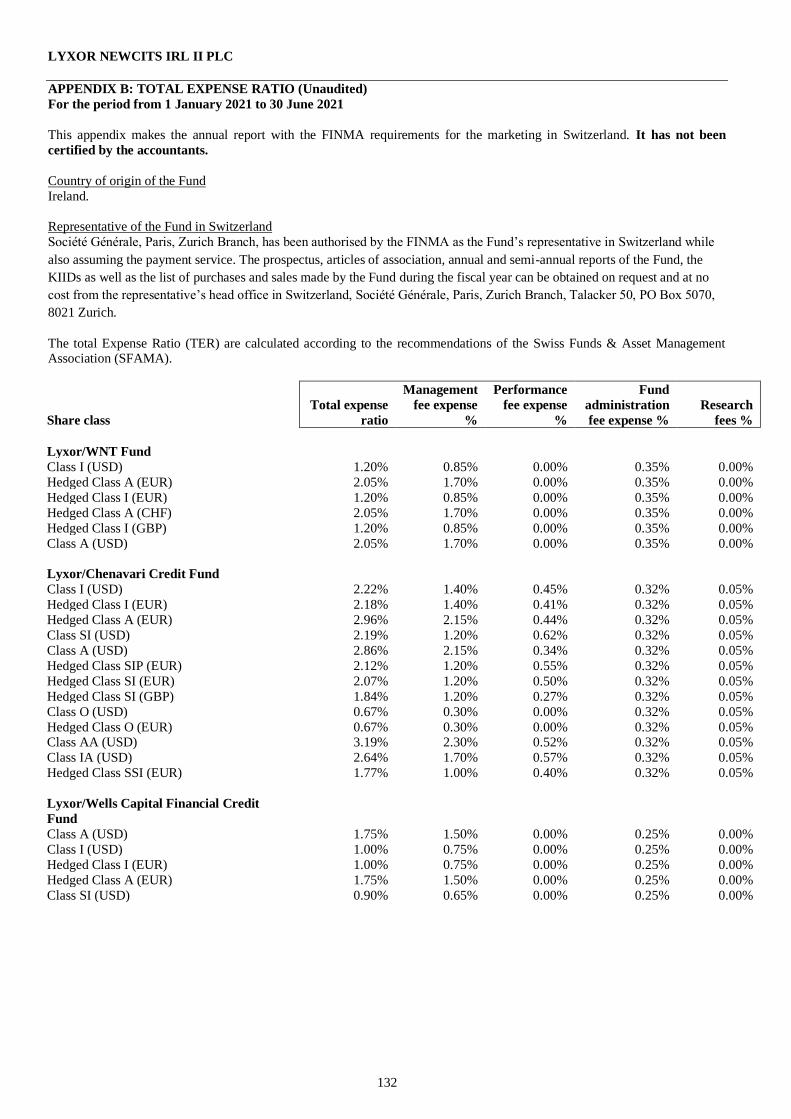
LYXOR NEWCITS IRL II PLC
132
APPENDIX B: TOTAL EXPENSE RATIO (Unaudited)
For the period from 1 January 2021 to 30 June 2021
This appendix makes the annual report with the FINMA requirements for the marketing in Switzerland. It has not been
certified by the accountants.
Country of origin of the Fund
Ireland.
Representative of the Fund in Switzerland
Société Générale, Paris, Zurich Branch, has been authorised by the FINMA as the Fund’s representative in Switzerland while
also assuming the payment service. The prospectus, articles of association, annual and semi-annual reports of the Fund, the
KIIDs as well as the list of purchases and sales made by the Fund during the fiscal year can be obtained on request and at no
cost from the representative’s head office in Switzerland, Société Générale, Paris, Zurich Branch, Talacker 50, PO Box 5070,
8021 Zurich.
The total Expense Ratio (TER) are calculated according to the recommendations of the Swiss Funds & Asset Management Association (SFAMA).
Share class
Total expense
ratio
Management
fee expense
%
Performance
fee expense
%
Fund
administration
fee expense %
Research
fees %
Lyxor/WNT Fund
Class I (USD) 1.20% 0.85% 0.00% 0.35% 0.00%
Hedged Class A (EUR) 2.05% 1.70% 0.00% 0.35% 0.00%
Hedged Class I (EUR) 1.20% 0.85% 0.00% 0.35% 0.00%
Hedged Class A (CHF) 2.05% 1.70% 0.00% 0.35% 0.00%
Hedged Class I (GBP) 1.20% 0.85% 0.00% 0.35% 0.00%
Class A (USD) 2.05% 1.70% 0.00% 0.35% 0.00%
Lyxor/Chenavari Credit Fund
Class I (USD) 2.22% 1.40% 0.45% 0.32% 0.05%
Hedged Class I (EUR) 2.18% 1.40% 0.41% 0.32% 0.05%
Hedged Class A (EUR) 2.96% 2.15% 0.44% 0.32% 0.05%
Class SI (USD) 2.19% 1.20% 0.62% 0.32% 0.05%
Class A (USD) 2.86% 2.15% 0.34% 0.32% 0.05%
Hedged Class SIP (EUR) 2.12% 1.20% 0.55% 0.32% 0.05%
Hedged Class SI (EUR) 2.07% 1.20% 0.50% 0.32% 0.05%
Hedged Class SI (GBP) 1.84% 1.20% 0.27% 0.32% 0.05%
Class O (USD) 0.67% 0.30% 0.00% 0.32% 0.05%
Hedged Class O (EUR) 0.67% 0.30% 0.00% 0.32% 0.05% Class AA (USD) 3.19% 2.30% 0.52% 0.32% 0.05%
Class IA (USD) 2.64% 1.70% 0.57% 0.32% 0.05%
Hedged Class SSI (EUR) 1.77% 1.00% 0.40% 0.32% 0.05%
Lyxor/Wells Capital Financial Credit
Fund
Class A (USD) 1.75% 1.50% 0.00% 0.25% 0.00%
Class I (USD) 1.00% 0.75% 0.00% 0.25% 0.00%
Hedged Class I (EUR) 1.00% 0.75% 0.00% 0.25% 0.00%
Hedged Class A (EUR) 1.75% 1.50% 0.00% 0.25% 0.00%
Class SI (USD) 0.90% 0.65% 0.00% 0.25% 0.00%
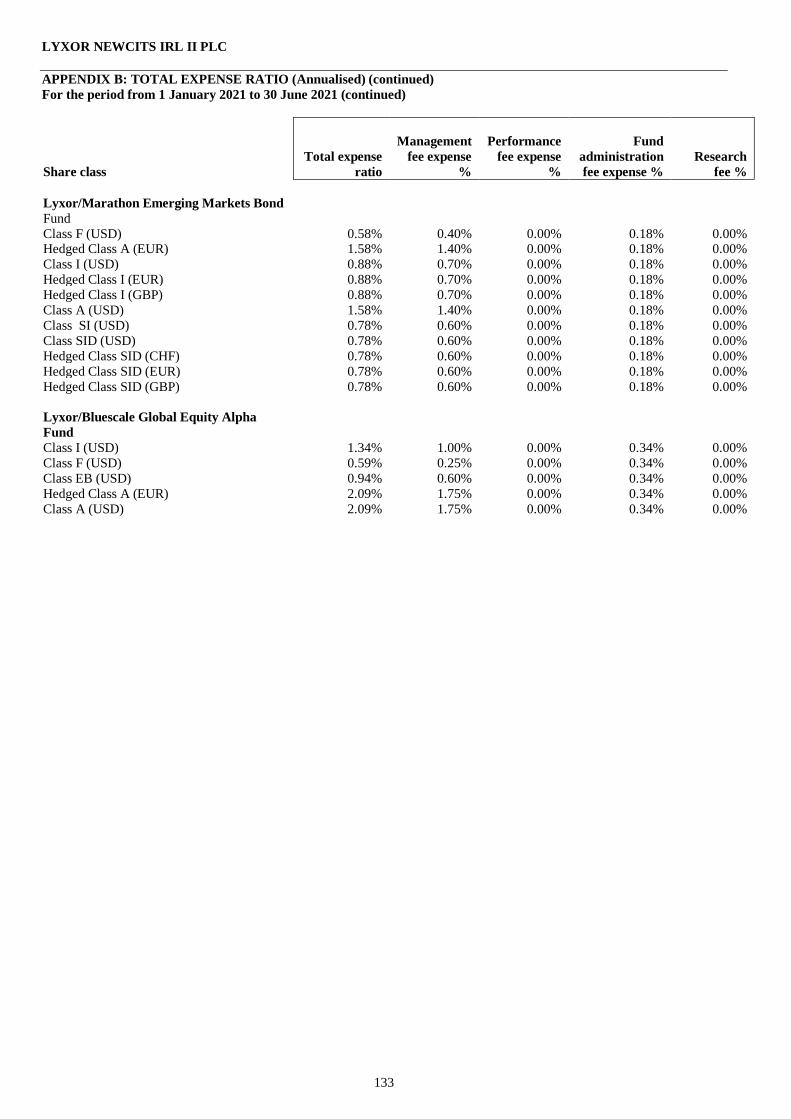
LYXOR NEWCITS IRL II PLC
133
APPENDIX B: TOTAL EXPENSE RATIO (Annualised) (continued)
For the period from 1 January 2021 to 30 June 2021 (continued)
Share class
Total expense
ratio
Management
fee expense
%
Performance
fee expense
%
Fund
administration
fee expense %
Research
fee %
Lyxor/Marathon Emerging Markets Bond
Fund
Class F (USD) 0.58% 0.40% 0.00% 0.18% 0.00% Hedged Class A (EUR) 1.58% 1.40% 0.00% 0.18% 0.00%
Class I (USD) 0.88% 0.70% 0.00% 0.18% 0.00%
Hedged Class I (EUR) 0.88% 0.70% 0.00% 0.18% 0.00%
Hedged Class I (GBP) 0.88% 0.70% 0.00% 0.18% 0.00%
Class A (USD) 1.58% 1.40% 0.00% 0.18% 0.00%
Class SI (USD) 0.78% 0.60% 0.00% 0.18% 0.00%
Class SID (USD) 0.78% 0.60% 0.00% 0.18% 0.00%
Hedged Class SID (CHF) 0.78% 0.60% 0.00% 0.18% 0.00%
Hedged Class SID (EUR) 0.78% 0.60% 0.00% 0.18% 0.00%
Hedged Class SID (GBP) 0.78% 0.60% 0.00% 0.18% 0.00%
Lyxor/Bluescale Global Equity Alpha
Fund
Class I (USD) 1.34% 1.00% 0.00% 0.34% 0.00%
Class F (USD) 0.59% 0.25% 0.00% 0.34% 0.00%
Class EB (USD) 0.94% 0.60% 0.00% 0.34% 0.00%
Hedged Class A (EUR) 2.09% 1.75% 0.00% 0.34% 0.00%
Class A (USD) 2.09% 1.75% 0.00% 0.34% 0.00%