m96- 70679
TRANSCRIPT

M96- 70679 The Effect of Laser Pulse Tailored Welding of Inconel 718+
T. Dwayne ~ c C a ~ , f Mary Helen McCayIv C. Michael Sharp,"" and Michael G. Womack""
Center for Advanced Space Propulsion University of Tennessee Space Institute
Tullahoma, Tennessee 37388 USA
Abstract
Pulse tailored laser welding has been applied to wrought, wrought grain grown and cast Inconel 718 using a C 0 2 laser. Prior to welding, the material was characterized metallographically and the solid state transformation regions were identified using Differen- tial Scanning Calorimetry and high temperature x- ray diffraction. Bead on plate welds (restrained and unrestrained) were then produced using a matrix of pulse duty cycles and pulsed average power. Sub- sequent characterization included heat affected zone width, penetration and underbead width, the presence of cracks, microfissures and porosity, fusion zone cur- vature, and precipitation and liquated region width. Pedigree welding on three selected processing condi- tions was shown by microstructural and dye penetrant analysis to produce no microfissures, a result which strongly indicates the viability of pulse tailored weld- ing for microfissure free IN 718.
I. Introduction
Inconel 718 was developed over thirty years ago' by the International Nickel Company. Since that time its use has grown until it accounts for thirty-five per- cent of superalloy production.l Due to its exceptional properties from cryogenic temperatures up to 650' C, the material is routinely employed in gas turbine disks for resistance to creep and stress rupture at elevated temperature and in cryogenic piping for environmen- tal cracking resistance. Additional uses are continually being developed as techniques for processing and fab- ricating the alloy advance.
t This work was supported in part by the UT- Calspan Center for Advanced Space Propulsion under NASA Grant No. NAGW-1195.
t Professor, Engineering Science & Mechanics, Principal Investigator, UTSI
" Associate Professor, Engineering Science 9r; Mechanics, UTSI
'* Processing Engineer, UTSI *"" Graduate Research Assistant, UTSI
Welding is one of the more desirable fabrication techniques for turbine and aircraft engine components and hence has been seriously investigated for IN 718. The main problem is microfissuring and cracking al- though the reduction of properties in the heat affected zone (HAZ) is also a concern. Common welding tech- niques are2 shielded-metal arc, gas-tungsten arc, gas- metal arc, resistance, and electron beam. The common requirement for these processes is that they use mini- mal heat input in order to prevent cracking. Since laser welding uses a very localized heat source and produces a narrow heat affect zone (similar to electron beam welding), it has recently begun to be investigated as a technique for joining IN 718.
The purpose of this report is to present the results of recent studies and analyses of laser pulse tailored welding on three microstructures of Inconel; wrought, wrought-grain grown, and cast.
11. Background
Alloy 718 is known as a nickel-iron base alloy. Its nominal composition is 53% Ni, 18.6% Cr, 18.5% Fe, 3.1% Mo, 5% Nb, 0.4% Al, 0.9% Ti, 0.2% Mn, 0.3% Si and 0.04% C. The matrix is austenitic and the major strengthening components are gamma double prime (Ni3Nb,Al), an ordered body centered tetrago- nal phase, and gamma prime (Ni3A1,Nb) which is a face centered cubic phase. Although they are both primarily nickel, the gamma double prime is richer in niobium while the gamma prime is richer in aluminum, Other phases of significance which occur in present day alloys are delta (Ni3Nb), Laves (A2B) and MC.' T i e - temperature-precipitation (TTP) diagrams have been developed by a number of investigator^^^^*^ to describe the formation of these phases in IN 718. A composite of those results is shown in Figure 1.2 The state of the alloy can shift the curves to the right or the left, hence differences in grain size or thermal history can produce differences in phase formation.
Although Alloy 718 was originally developed as a wrought alloy, increasing need for its properties has resulted in its recent use as an investment casting al- loy. In this form, the microstructure is significantly different from the wrought as can be seen from the

comparisons in Figure 2. There is significant concen- tration of niobium in the Laves phase (NisaUb) eutectic which forms interdendriticaily and in the grain bound- aries. The extensive niobium segregation is extremely difficult to eliminate by thermal treatment6. As would be expected, this creates difficulties in processes such as welding when going fiom wrought to cast material.
During the welding of Alloy 718, microfissures of- ten occur in the heat affected zone creating problems in fabrication and repair. The microfissures are gener- ally thought to be due to the combination of welding stresses and liquation, a phenomena that is influenced by microstructure and constituent inhomogeneities? Laser welding with its inherently small heat affected zone has been considered as a potential solution to these difficulties. A studya on the welding and cutting of Inconel 718 with a 15kW CW laser indicated that it could be an effective joining method although there were some isolated instances of microfissuring. Ad- ditional studiesgl10 using YAG lasers produced cracks in the nailhead which were attributed to solidification cracking. More recently, pulsed COa laser welding has been applied to wrought Inconel 718 with excellent success in eliminating the microfissures."
111. Material characterization
To better understand the response of the IN 718 structures that were to be welded, Differential Scan- ning Calorimetry (DSC) was applied to the wrought, grain grown wrought (1 hr. a t 1177' C, air cool), and cast. The DSC tests were conducted in argon on 150- 160mg samples at two heating and cooling rates. Typ ical curves for the 40° C/min rate are shown in Figures 3, 4, and 5. The temperatures at which transforma- tions occurred are identified in Table 1 for the three material states being studied. Figure 6 shows the rela- tionship of the transformations (40° C/min runs) with the regions of phase formation for IN 718."
After determining the temperatures for the phase transformations via DSC, high temperature x-ray analysis was conducted to aid in the eventual iden- tification of the phase structures. The data was ob- tained first a t room temperature by scanning through 20° to 120° for 20 angle a t 1°/min. The data was col- lected for each sample state a t discrete temperatures (wrought: 540, 570, 600, 730, and 7G0° C, wrought grain grown: 590, 630, 730, 770, 800' C, and cast: 530, 580, 620, 720, 770, and 820° C). A slow rate of scanning (0.5O/min) was selected for high temperature diffractometry to ensure the detection of slow as well as secondary transformations. In order to avoid the surface oxidation effect on the data, the experiments were conducted in an argon atmosphere. Following the
runs, the room temperature x-ray scans were again run on the same samples. Figure 7 shows the x-ray data obtained over these temperatures. Similar analyses are presently being conducted on the fusion zones and heat affected zones of welded samples.' '
IV. Descri~tion of laser and worktable
Bead-on-plate welds were made using a Rofin- Sinar RS3000 fast axial flow COz laser which pro- duces a peak power of 3,700 watts. The laser is radio-frequency excited at 27.12 MHz and is config- ured to give a TEMlo beam mode which has a spatial power distribution described as a ring with a central peak. The wavelength of the beam is 10.6 microns (far-infrared).
Restrained welds were made using a fixture de- signed specifically for this project. The fixture, in the welding position, is shown in Figure 8. Sample re- straint was provided by a pair of jaws that produced both horizontal and vertical pressure on the material (see Figure 9). A slot in the base accommodated the weld underbead. The fixture was mounted on a nu- merically controlled Aerotech work table which moved the material horizontally beneath the beam.
The beam was focused on the workpiece with an off-axis parabolic mirror having a focal length of 150 mm, equivalent to an f/6 system. The focused laser beam is directed perpendicular to the workpiece through a conical gas flow nozzle. The nozzle deliv- ers a coaxial flow of inert gas which serves to shield the weld while it solidifies and to protect the laser op- tics from weld spatter. Helium was used as a shielding gas because of its high ionization potential and pIasma suppression capabilities. The coaxial gas flow rate was 26 liters/min.
A nozzle positioned to the side of the beam de- livery nozzle directed an additional flow of helium to- wards the workpiece at an angle of 45 degrees fiom the vertical and thus served as a separate means of plasma control. The plasma control gas flow rate was 20 liters/rnin.
A. Pulsing and delivered Dower
The laser output can be continuous-wave (CW) or pulsed. The pulsing format chosen for this experiment was the mived frequency format (5 kHz pulse width modulation on/gated pulse on) shown in Figure 10.
When the laser is operated in the mixed frequency pulse format the output is gated into pulses with a frequency which is set by independent adjustments of the time on and time off for one pulse cycIe. In ad- dition, each gated pulse is composed of multiple high frequency (5 kHz) pulses. The 5 kHz duty cycle is ad-

justable (pulse width modulation) such that the power delivered during the time on of each gated pulse (pulse average power) is adjustable from 7 to 100 percent of peak power (260 to 3,700 watts).
The duty cycle of the low frequency gated pulses is defined as the time on divided by the total time for one pulse cycle. Therefore, the average power delivered during welding is equal to the duty cycle multiplied by the pulse average power.
Welds were attempted using the lowest specific en- ergy input (energy per unit length of weld) possible in an effort to increase the cooling rate, reduce the heat affected zone width, and decrease the incidence of mi- crofissures while maintaining full penetration. Pulse tailoring using the mixed frequency pulse format af- forded the greatest flexibility in the selection of weld- ing parameters with lower specific energies than those obtainable with continuous welding processes.
B. General procedure
Prior to the experiment the delivered power was measured using a Scientech water cooled calorimeter. The results are shown in Figure 11. The delivered power is slightly less than the laser controls indicate because of losses in the beam delivery and focussing system. Because the losses were minimal, the laser control indicator was used for subsequent power set- tings.
The focal position was determined by, quickly passing a plexiglass specimen, held-on a special fix- ture, through the beam at an angle of 6 degrees from vertical. Seven measurements were made at different powers. A hyperbolic impression was burned into the plexiglass, and the narrowest point in the impression was considered to be the focal point of the laser beam.
The distance from the bottom (datum) edge on the plexiglass to the narrowest point in the impression was measured using a 20X optical comparator. The distance from a known datum on the laser weld head to the bottom of the plexiglass was measured using the positional outputs from the CNC motion system. The focal position was then determined by subtracting the plexiglass datum to focal impression distance from the weld head datum to plexiglass datum distance. The focal position location did not appear to be function- ally related to the laser power, and a mean value of the seven measurements was used as a determination of focal position.
Previous Inconel weIds at UTSI were produced with the beam focused at 3 mm below the plane of the top surface. To determine the optimum focal position for the present research, unrestrained bead-on-plate
weIds were produced at focal positions from 1 to 4 mm below the sample surface. The best penetration for the 3.2 mm thick material was produced when the focus was from 2 to 3 m below the surface. A focal
of 3 mm below the surface was maintained in order to be consistent with the previous work."
The following parameters were kept fixed for all experiments:
1. Beam mode (TEMlo); 2. Focussing system (f/6 off-axis parabola); 3. Focus position (3 mm below workpiece sur-
face); 4. Pulse format (mixed frequency); 5. Nozzle standoff distance (6 mm); 6. Coaxial gas (helium, 26 liters/min); 7. Side gas jet (helium, 20 literslmin).
Four experiment matrices were selected for this study. They are: unrestrained weld matrix, restrained weld matrix, variable duty cycle weld matrix, and pedigree weld matrix. These are discussed in detail in the fol- lowing sections.
C. Unrestrained weld matrix
During the first phase of the experiment, unre- strained bead-on-plate welds were produced on 118- inch (3.2 mm) wrought Inconel 718. Pulse average power, pulse duty cycle, and weld translation speed
'were the welding parameters that were varied in or- der to find a matrix of weld parameters which met the penetration criterion. This criterion was established as a continuous underbead with a minimum width be- tween 0.8 and 0.9 mm. The function of the penetra- tion criterion was to give the researchers a measurable standard by which to compare welds produced with different welding parameters.
After processing, the weld underbead was mea- sured with a scaled loop (Magnification: 10 X, Scale Divisions: one-tenth of a millimeter). For welds which did not meet the penetration criterion, the pulse av- erage power was either increased or decreased while the pulse duty cycle and translation velocity were held constant. In this manner the parameters which give acceptable penetration were determined. The final weld conditions are given in Table 2. A uU" pre- cedes the sample number to designate the weld as un- restrained.
During the welding just described, it was observed that welds produced at the lowest duty cycles could be made to meet the penetration criterion over a wider range of pulse average powers than could the high duty cycle welds. Weld conditions U28, U29, U30, U31, and U32 were selected for further examination of this

behavior because they spanned a range of duty cycles from 37 to 71 percent at the same translation velocity.
These five conditions were rewelded, and this time the pulse power was increased until excessive pene- tration (minimum underbead width greater than 0.9 mm) was observed. The welds were again made and the pulse power lowered until under penetration was achieved (minimum underbead width less than 0.8 mm) . D. Restrained weld matrix
Restrained weld samples were cut to 3.5 cm by 0.95 cm from the as-received stock of thickness 3.2 mm (118-inch). Paint and oil were removed from the surface with an acetone flush.
The samples were clamped into the fixture (Figure 9) by first tightening the four vertical jaw bolts until they contacted their seating surfaces, preventing verti- cal jaw movements. Next, the two horizontal jaw bolts were hand-tightened, thus applying pressure horizon- tally. The vertical jaw bolts were further tightened, thus applying downward pressure. After the samples were welded, they were left in the fixture until the Sam- ple was cool to the touch and the tightening procedure was reversed.
Restrained welds were performed at five duty cy- cles (37,52, 61, 71, and 80 percent), four pulse average power levels (2600, 2250, 2050, and 1900 watts), and a translation velocity of 12 mmls; twenty conditions were used to produce the samples. Four fully pene- trated conditions were repeated from the unrestrained matrix. These were U28, U29, U30, and U31.
The restrained weld conditions were selected so that the effect of duty cycIe and/or the effect of pulse average power on the weld microstructure (microfis- sures and porosity) could be examined along lines of constant duty cycle (with changes in pulse average power) or along Iines of constant pulse average power (with changes in duty cycle). In this manner a ma- trix of conditions (Table 3) was established. An "R" precedes the sample number to designate a restrained weld.
E. Variable dutv cycle weld matrix
The purpose of this experiment was to investigate the microstructural relationship between pulsed laser welds in small grain wrought (ASTM #$ or smaller), grain grown wrought (ASTM #5), and cast (ASTM #2) Inconel 718. Restrained bead-on-plate welds were carried out using the same welding fixture and re- straint as used in the restrained weld matrix.
The small grain wrought and grain grown wrought samples were cut from sheet stock while the cast sam- ples were cut from a cast bar using an abrasive cut-off saw. The thickness for all samples was l/&inch (3.2 mm). All samples were cleaned with acetone immedi- ately prior to welding.
The translation speed was kept constant at 12 mm/s and the pulse average power was also kept con- stant a t 2250 W. Weld duty cycle was the experimen- tal variable and the values used are shown in Table 4. The designation RW indicates that these samples were wrought Inconel 718 welded in the restrained condi- tion. Likewise, RG indicates restrained welds on grain grown material, and RC indicates restrained welds on cast material.
F. Pedinee weld matrix
The purpose of the pedigree weld matrix was to demonstrate that three weIds from the restrained ma- trix, which were free from microfissures and porosity, could be reproduced with a quantitative level of con- fidence. The conditions for the pedigree matrix are listed in Table 5. Along with being free from microfis- sures and porosity, these conditions are near the me- dian of pulse average power, and near the median of the duty cycles used for the restrained matrix.
The samples were cut to the standard size (3.5 x -0.95 cm), cleaned, and placed in the welding fixture in the same manner as the restrained matrix samples. After welding, the samples were left in the fixture until they were cool to the touch. Nine samples (three for each condition) were welded.
G. Metallorrra~hic analvsis of samnles
The restrained weld matrix, pedigree weld ma- trix, and variable duty cycle weld matrix samples were transversely cut to begin the metallurgical analysis. Longitudinal sections of selected restrained weld Sam- ples were ground with a surface grinder in 0.2 mm in- crements parallel to the surface. Part of each variable duty cycle specimen was slant-ground using the tech- nique shown in Figure 12. All sections were mounted in thermosetting mounting material and then ground with silicon-carbide abrasive paper. Paper of 80, 120, 180, 240, 320, 400, and 600 grit was used in succession for grinding. The samples were then polished with 6-micron diamond paste on a cloth wheel to remove visible scratches.
Immediately after the samples were polished they were etched with Waterless Kallings reagent to reveal the microstructure. The reagent was applied with a cotton swab and left on for about 15 seconds or un- til the weld was clearly visible. The samples were

rinsed in running water, then ultrasonically cleaned in distilled water and air dried to remove the remain- ing reagent. An Olympus Model PME inverted-stage metallurgical microscope was used at magnifications from 13X to lOOOX to examine and photograph the transverse cross sections.
Images of the longitudinal restrained matrix weld sections were obtained with a video camera and macro- lens attached to a Vicom digital image processor. The outline of the longitudinal section was traced, and the area and perimeter enclosed by the trace were calcu- lated by the Vicom. Longitudinal curvature was calcu- lated by dividing the perimeter by the enclosed area. Since the welds have a three dimensional structure de- pendent on duty cycle, measurements of the longitudi- nal and transverse curvature were made as a basis for comparison between welds.
In order to calculate the transverse curvature, the outlines of the weld from the first, third, fifth, and sev- enth cross sections were stacked together in one image and the resuIting contour map was photographed. The spacing between the lines on the contour map was mea- sured at ten stations spaced every 3.5 mm. This spac- ing was selected because the measurements spanned the length welded by two pulses of the condition hav- ing the greatest pulse spacing (duty cycle of 37 percent, pulse average power of 2050 watts).
The method for establishing an approximate transverse cross ,sectional shape at an individual sta- tion is depicted for a typical weld in Figure 13. Trans- verse curvature is calculated by dividing the perimeter of the transverse cross section by the area (sum of ar- eas A, B, and C).
In practice, most of the microfissures that are ob- served after welding this material are found in the heat affected zone (HAZ) beneath the weld nailhead. Mi- crohardness measurements to determine HAZ width were made on samples U9, U28 and an unrestrained CW weld using a Buehler Micromet I1 hardness tester with 500 gram mass impact. The impact time was set a t 15 seconds.
V. Results
A. Unrestrained welds
Unrestrained bead-on-plate welds were produced on 1/8-inch thick wrought Inconel 718. The process parameters (pulse average power, pulse duty cycle, and weld translation velocity) were varied in order to find a matrix of weld parameters which met penetration and continuous underbead criteria.
1. Relationships between weld parameters
Unrestrained, fully penetrated welds (0.8 to 0.9 mm minimum underbead width) were produced over a wide range of pulse duty cycles, pulse average pow- ers, and weld translation velocities. As seen in Figure 14, a near-linear relationship exists between the pulse average power and the pulse duty cycle required to produce full penetration for a given weld translation velocity.
Penetration measurements also revealed a depen- dence of the acceptable pulse average power range on duty cycle (Figure 15). For example, sample U31 (37 percent duty cycle, 2600 W, 12 mm/s) had a range of 700 watts, while sample U28 (71 percent duty cycle, 1900 W, 12 mm/s) had only a 100 watt range between overpenetration and underpenetration. Therefore, the low duty cycle welds were more tolerant to pulse aver- age power variations.
2. Centerline cracks
Large centerline cracks were observed in some un- restrained welds. These were thought to occur because the small samples had no surrounding unaffected ma- terial to provide restraint during weld pool melting and resolidification. Figure 16 shows that fully penetrated welds having a duty cycle less than 54 percent exhib- ited no centerline cracks regardless of changes in the other weld parameters (pulse average power, speed).
ce his indicates that the long off-times that are charac- teristic of low duty cycle welds, give sufficient time for the weld to solidify and strengthen before additional heat from a subsequent pulse is added. Low duty cy- cle welds are therefore less prone to centerline cracking when mechanical restraint is not provided.
3. Heat affected zone width
Microhardness measurements across the weld and into the matrix metal (Figures 17, 18 and 19) were used to determine the width of the heat affected zone (HAZ). Material which had no increase in hardness above that of the matrix was presumed to be outside of the HAZ. Weld condition U9 (61 percent duty cycle) had a heat affected zone width averaging 48 percent of the weld width, whereas weld condition U28 (71 percent duty cycle) had a heat affected zone width averaging 65 percent of weld width. In comparison, the HAZ of a similar (unrestrained) CW weld (2500 W, 1.5 M/min) on the same material was 61 percent of weld width. The results indicate that a weld having a duty cycle of 71 percent or more has a HA2 width that is approximately equal to the HAZ width of a CW weld.

B. Restrained welds
The unaffected material surrounding a weld acts as restraint during solidification. The small sample size used for this experiment necessitated the use of mechanical restraint since there was a limited amount of unaffected material surrounding the weld.
1. Nailhead microfissurzs
Figures 20, 21, and 22 show typical weld cross sections. Figures 23, 24, and 25 show typical weld mi- crostructures a t increasing magnifications. Although precipitates have accumulated in the grain boundaries within the heat affected zone beneath the nailhead, nailhead microfissures were not observed in any of the restrained weld cross sections.
The absence of cracking in the restrained welds produced by the laser for this study may be attributed to the rapid cooling rate and its associated small heat affected zone and limited extent of grain boundary li- quation. In addition, the low total heat input to the welds, which is made possible by the use of pulse tai- lored laser welding, lessens the localized strains which occur in the HAZ.
2. Porosity
Restrained welds having large centerline pores are indicated on Figure 26 along with the other welds in that matrix. Pores were more likely to occur in welds which were processed with the lowest duty cy- cles and/or the lowest pulse average powers. During the "beam-off portion of the pulsing cycle, the inter- nal pressure in the keyhole decreases to the point that it will no longer support the walls and the keyhole partially collapses. Keyhole gases (metallic plasma), trapped by the collapsing of the keyhole, can nucleate into spherical pores which are engulfed by the rapid so- lidification front before they rise to the surface. These gases would then condense and solidify as the weld cooIs, leaving a void.
The high duty cycle and high pulse power welds did not exhibit porosity. The higher specific energy in- puts significantly increase the time that the weld pool remains molten, thus allowing any pores which have nucleated the time to escape the molten material.
3. Nailhead curvature
proximate since the assumption of linearity between contours was made; the errors should be small since the difference in depth between contours is small.
It is desirable to reduce-the two curvature values for each weld to a single curvature rating in order to compare the welds within the matrix. The individ- ual values were first normalized by expressing them as a fraction of the largest value obtained by the same method.
It was assumed that the transverse and longitu- dinal curvature were equaIly important and therefore given equal weight. The curvature rating was calcu- lated as the sum of the normalized longitudinal and transverse curvatures. As seen in Table 9, the curva- ture rating is inversely related to duty cycle and pulse average power.
C. Variable dutv cvcle weld matrix
Figure 2 shows the base material microstructures that were used in this study. The wrought grain grown (ASTM #5) has significantly larger grains than the wrought (ASTM #8). It also exhibits fewer transfor- mation regions during DSC analysis, a result of the recovery and solutionizing which occurs during the grain growth treatment. The cast structure is large grained (ASTM #2) and obviously dendritic with ex- tensive segregation. DSC analysis shows similar trans- formations to the wrought and wrought grain grown but with a significant transformation occurring around 1180° C which is probably incipient melting as a result of the segregation.
Subsequent to welding, the three Alloy 718 ma- terials exhibited precipitation and evidence of grain boundary liquation and interdendritic remeking in the heat affected zones. Figure 27, 28 and 29 show mi- crostructures in the region of the nailhead. The vi- sually affected region extends 0.098&0.015 mm from the fusion zone in the wrought material, 0.139f 0.001 mm from the fusion zone in the wrought grain grown material, and 0.309f 0.147 mm from the fusion zone in the cast material.
D. Pedigree welding trials
Five metallurgical cross-sections were prepared from each of the nine samples welded using the con- ditions shown in Table 4. The cross-sections were ex- amined at lOOX magnification. Although some grain Longitudinal curvature was calculated by divid- boundary precipitation was observed in the region ad- ing the perimeter of the longitudinal section by the jacent to the nailhead, no microfissures and porosity longitudinal area. The results are found in Tables 6 were found. The cross-sections were then crack tested and 7. Transverse curvature was calculated from cross using the dye-penetrant technique. No cracks were de- sections obtained using the technique shown in Figure tected. 13. Table 8 lists the mean value of ten measurements
for each weld. The results must be regarded as ap-

Acknowledgments
The authors would like to acknowledge the con- tributions of the Marshall Space Flight Center, Mate-. rials and Processes Laboratory and in particular Mr. R. J. Schwinghamer and Mr. Ernie Bayless for pro- viding the wrought Inconel. The High Temperature Materials Laboratory at Oak Ridge National Labo- ratory allowed access to their Differential Scanning Calorimeter and their high temperature x-ray diirac- tometer through their user program. Discussions and co1Iaboration with ORNL personnel through this p r e
10. J. P. Reynolds, H. W. Kerr, P. 9. Fenrenbach, L. Bourque, and R. D. Davidson, Advances in Welding Science and Technology, TWR '86, Proceedings of an International Conference on Trends in Welding Research, May 1986, Ed. S. A. David, ASM International.
11. M. Sharp, M. H. McCay, T. D. McCay, N. B. Dahotre, A. Sedghinasab and S. Gopinathan, "Pulsed Laser Welding of Inca 718," ICALEO '89 Proceedings, Volume 69, Laser Material Processing, October 1989, pp. 229-238.
gram have been invaluable. In particular the authors 12. R. G. Carlson and J. F. Radavich, "Microstruc- would like to thank the Center for Advanced Space tural Characterization of CAST 718," Superalloy Propulsion for their sponsorship of this work. This 718 - Metallurgy and Applications, ed. E. A. Lo- work was performed within the Center for Advanced ria, The Minerals, Metals & Materials Society, Space Propulsion and was supported in part by NASA 1989, pp. 79-95. Grant No. NAGFV-1195. The Center for Advanced Space Propulsion is part of the UT- Calspan Center for Aerospace Research, a not-for-profit organization located at UTSI.
References
1. John R. Radavich, "Metallography of Alloy 718," Journal of Metals, July 1988, pp. 42-43.
2. C. T. Sims, N. S. Stoloff and W. C. Hagel, Su- peralloys 11, John Wiley and Sons, New York (1987). John R. Radavich, "The Physical Metallurgy of - Cast and Wrought Alloy 718," Superalloy 718 - ~ e t a l l u r ~ y and Applications, ed. E.A. Loria, The Minerals, Metals and Materials Society, pp. 229-240, 1989.
3. R. Cozar and A. Pineau, Met. 'Ilans. 4,47 (1973).
4. H. L. Eiselstein, "Advances in the Technology of Stainless Steels and Related Alloys," STP 369, ASTM Philadelphia, PA, pp. 62-67, 1965.
5. W. J. Boesch and H. B. Canada, J. Met., 21 (lo), 34 (1969).
6. T. J. Kelly, "Investigation of Elemental Effects on the Weidability of Cast Nickel-Based Super- alloys," Advances in Welding Science a n d Technology T W R '86, ed. S. A. David (May 1986) pp. 623-627.
7. R. G. Thompson, "Microfissuring of Alloy 718 in the Weld Heat-Affected Zone," Journal of Metals, July 1988, pp. 44-48.
8. C. M. Banas, Final Report, Contract NAS8- 36306.
9. L. A. Weeter, C. E. Albright and W. H. Jones, WeIdina Research Supplement, March 1986, 51s- 62s.

Table 1. Transformation Temperatures in IN 718.
Sample DS C Treatment Transformation Temperatures (O C)
Wrought Heating 10°C/min 568, 702, 1030, 1220, 1280 Cooling 10°C/rnin 760, 1270 Heating 40°C/min 615, 760, 912, 1025, 1220, 1275 Cooling 40°C/min 730, 1100, 1150, 1265
Wrought Heating 10°C/min 592, 775, 1230, 1280 Grain Cooling 10' C/min 765, 1272 Grown Heating 40°C/min 655, 850, 1220
Cooling 40°C/min 1100, 1266
Cast Heating 10°C/min 538, 725, 1175 Cooling 10°C/min 1265 Heating 40°C/min 585, 770, 1130, 1180, 1205, 1280 Cooling 40°C/min 1160, 1267

Table 2. Unrestrained Weld Matrix.
Translation Pulse On Off Duty Specific Underbead Designation Velocity Average Time Time Cycle Energy Width
(mmls) Power ON) (ms) (ms) (Oh) (Jlmm) (mm)
U1 25 2500 17 3 85 85.0 1 .O U2 25 3000 17 7 71 85.2 1 .O U3 25 3000 17 21 45 54.0 0.6 U4 25 2700 17 7 71 76.7 0.8 U5 25 2900 17 11 61 70.7 0.8 U6 25 2475 17 4 8 1 80.2 0.8

Table 3. Restrained Weld &Iatrix, Translation Velocity = 12 min/s.
Table 4. Variable Duty Cycle Weld Matrix, Translation Velocity = 12 min/s.
- Specific
Pulse Average On Time Off Time Duty Energy Designation Power (W) (ms) (ms) Cycle (%) (Jlmm)
35 60 35 69.4 RW1 2250 35 32 52 97.5 DW')
61 11 4.4 15 71 133.1 9 80 150.0 4 90 168.8
PW 187.5

Table 5. Pedigree Weld Matrix, Translation Velocity = 12 min/s.
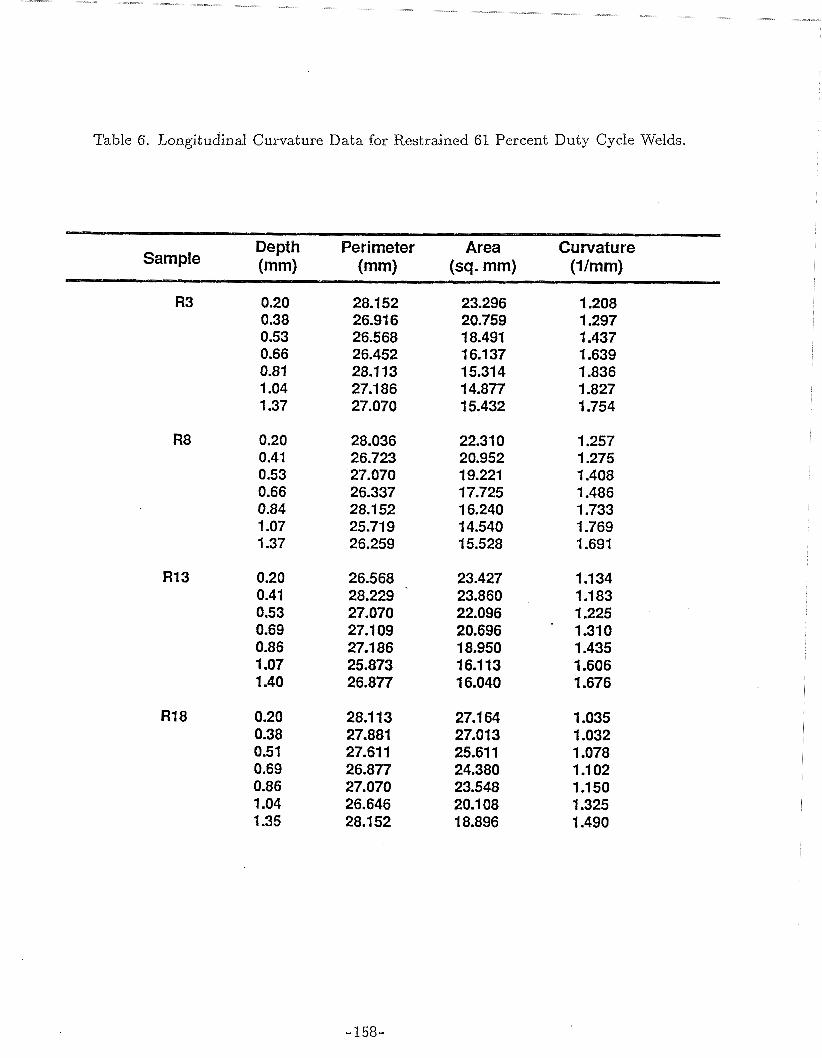
Table 6. Longitudinal Curvature Data for Restrained 61 Percent Duty Cycle Welds.

Table 7. Longitudinal Curvature Data for Restrained 2050 Watt Pulse Average Power Welds.

Table 8. Transverse Curvature of Restrained Welds.
Table 9. Weld Curvature Summary.
Mean Longitudinal Mean Transverse Curvature Sample Curvature Curvature
(Normalized Value) (Normalized Value) Rating

Table 10. Weld Metallographic Observations.
Nailhead Large Sample Microfissures Pores

TIME, HOURS Figure 1. Time-temperature precipitation (TTP) diagrams for Inconel 718 illustrating the ki-
netics of formation for MC, Ms C, Laves, 6, and -yl phases.2
Figure 2. Typical microstructures, of IN 715 (a) wrought, (b) wrought grain grown, and (c) cast (1OOX).

Y HETHOO * SAWPLE RATE- 1
-40.00-
Figure 3. Differential Scanning Calorimetry curves of wrought IN 718 (a) Heating a t 40°C/min, (b) cooling at 40°C/min.
-.-- . . . . . . . - . - . . - . - . . . .- . --- ,-- --, - , , : . : --t----t---f---+-t---)
-2.00- ALUMINA CRUCIBLES
- -- 0 al 03
-14 .00-2 m U -- E -
-18.00- 3: 0
c, m -- aJ IL
Y HETHOO -26.00- SAMPLE RATE- i
6 START FINAL RATE TIME GAS 1 1300 400 40 AH0
+t- o 1200 1280

-6.0 t -14.0
t -18.0
C i -
u HETHO0 * t
-26.0 SAMPLE RATE- I C START FINAL WTE TIME GAS i 1300 400 40 ARG C I
-30.0 J- ---C--)-
490 570 ; 650 ' 7i0 ' 8- 9j0 ' 1i50 ' Temp (Deg C)
Figure 4. Differential Scanning Calorimetry curves of wrought grain grown IN 718 (a) Heating at 40°C/min, (b) cooling at 40°C/min.

. . _ ..-_ - - _ _ _ _ _ . . . , I I . .
-2.0 ALUMINA CRUCIBLES 1 1
8i METHOD * SAMPLE RATE- I
f START FINAL RATE TIHE GAS I 1300 400 40 * R G
0
Figure 5. Differential Scanning Calorimetry curves of cast IN 718 (a) Heating at 40°C/min, (b) cooling at 40°C/min.

1400 Solidification1 Laves
Grain Cast Wrought Grown
Transformations
\ . . . . - ... . - - - . .. . . - . .
+ Represents DSC identified transformations while heating (4OmC/min). 0 Represents DSC identified transformations while cooling (4O4C/min).
Figure 6. Transformation temperatures for phases in Inconel 718.'

INCONEL 718
WROUGWT. A S RECELVEO r 90
I N C O W - 7 1 8 1" 90 CAST. AS RECEIVE0
0.0-1.-m-r, T-rrrrl-r--r-17--7-r7.~--~-k o . 2 . 0 - 3 P 4 - & 5 9 6 0 8.9_90---LO!L- ;
Figure 7. High temperature x-ray diffraction of scans of wrought Inconel 718.

Figure 8. Welding fixture at nozzle.
Figure 9. Welding fixture.

Mixed Frequency Pulsing (5kHz pulse width modulation onIGated pulse on) Pulse On Time = 35 ms . Peak Power 370 W Pulse Off Time = 60 ms Pulse Average Power = 1850 W Gate Duty Cycle = 37% Mixed Frequency Average Power 685 W 5kHz PWM Duty Cycle 50%
Time (ms)
Figure 10. Mixed frequency pulsing format.

Indicated Power (watts)
Figure 11. Results of laser power calibration.
Fixture - Actual Size
I Surface 'A'
Grind Sample
-3= Cut
Cross Section Through Mount
Mount & Polish Surface 'A'.
Figure 12. Preparation of slant-grind specimens.

S U R F A C E
GRlND #I 0.48 MM
GRIND #2 0.94 MM
GRIND #3 1.32 M M
Figure 13. Transverse curvature measurement.

Duty Cycle (%)
Figure 14. Unrestrained welds having full penetration - welded at four speeds.

Under Q\ \
Duty Cycle (%)
Figure 15. Penetration as it relates to pulse average power and duty cycle.

Duty Cycle (%)
Figure 16. Centerline cracking as it relates to duty cycle in unrestrained welds.

Distance from Datum (mm)
Figure 17. HAZ measurement for sample U9, 61% duty cycle, 2567 watts, speed 18 mm/s (Darkened points visually determined to be in fusion zone).

Distance from Datum (mm)
Figure 18. HAZ measurement for sample U28, 71% duty cycle, 1900 watts, speed 12 mm/s (Darkened points visually determined to be in fusion zone).

Distance from Datum (mm)
Figure 19. HAZ measurement for a CW weld, 2500 watts, speed 25 mm/s (Darkened points visually determined to be in fusion zone).

Figure 20. Fully penetrated restrained weld, 2250 watts, 61 percent duty cycle (Condition R13).

Figure 21. Underpenetrated restrained weld, 2050 watts, 37 percent duty cycle (Condition R10).

Figure 22. Overpenetrated restrained weld, 2600 watts, 71 percent duty cycle (Condition R17).

Figure 23. Typical view of weld nailhead/HAZ interface for Condition R6 (2050 watts, 80 percent duty cycle).

Figure 24. Weld nailhead showing weld structure and grain boundaries for Condition R6 (2050 watts, SO percent duty cycle).

Figure 25. Typical weld HAZ - note the dark grain boundary precipitates. Condition R6 (2020 watts, SO percent duty cycle).

Duty Cycle (%)
Figure 26. Restrained weld matrix (P indicates samples containing pores).

Figure 27. Microstructure of wrought IN 718 in the region of the nailhead (a) lOOX and (b) 200X.

Figure 28. hiIicrostructure of wrought grain grown IN 718 in the region of the nailhead (a) lOOX and (b) 200X.

. . . . . .
Figure 29. Microstructure of cast IN 718 in the region of the nailhead (a) lOOX and (b) 200X.
-187-