mackison, d., mooney, john, macleod, m. and anderson, a. s ...sure.sunderland.ac.uk/7023/3/lessons...
TRANSCRIPT

Mackison, D., Mooney, John, Macleod, M. and Anderson, A. S. (2016) Lessons learnt from a feasibility study on price incentivised healthy eating promotions in workplace catering establishments. Journal of Human Nutrition and Dietetics, 29 (1). pp. 8694. ISSN 09523871
Downloaded from: http://sure.sunderland.ac.uk/id/eprint/7023/
Usage guidelines
Please refer to the usage guidelines at http://sure.sunderland.ac.uk/policies.html or alternatively contact [email protected].


1
Abstract 1 Objective: To assess the feasibility of implementing and evaluating a 10-week price incentive 2
intervention to promote healthy eating options in workplace canteens. 3
Design: Workplace canteens participating in Healthy Living schemes were invited to participate in the 4
study. The intervention design was informed by qualitative work with catering staff and canteen 5
patrons. Assessments included canteen measures of intervention uptake and individual level measures 6
of food habits using online pre- and post-intervention questionnaires. Qualitative measures were used 7
to ascertain consumer acceptability and caterers perspective of the intervention. 8
Setting/Subjects: Three workplace sites in Central Scotland initiated, and two completed, the 10-week 9
intervention study. 10
Results: Pre-intervention findings indicated that price, product quality and quick service were 11
fundamental aspects of the intervention design and a soup/sandwich meal combination deal was 12
identified as the intervention focus. The intervention had a nutrient composition consistent with FSA 13
traffic light criteria, was sold at 10-20% reduction of the original price and promoted using on-site 14
marketing. Till data indicated that at all time points there was greater uptake of intervention soup than 15
the price incentivised intervention meal deal. The response rate for both pre and post questionnaires 16
were low. Qualitative findings reported improved value for money and quality however dissatisfaction 17
with limited choice, poor quantities and inadequate marketing were also noted. 18
Conclusions: A price incentivised healthy eating intervention designed in collaboration with worksites 19
was feasible to implement in two canteens. However, further work is required to develop a 20
comprehensive intervention package and to improve data collection. 21
22

2
Introduction 23 Rapidly rising levels of overweight and obesity in recent decades have been especially evident in 24
Scotland with an adult prevalence rate for obesity of 27.1%, globally third only to Mexico (30.0%) and 25
the United States (34.5%)(1). Obesity is now well established as a contributory factor to many 26
conditions including diabetes, cardiovascular disease, certain cancers and arthritis. The overall costs of 27
obesity in Scotland are estimated at £175M (2). In a rapid review of potential policy options for obesity 28
prevention and control in Scotland, one of the most promising settings for effective interventions in 29
adults was the workplace environment (3). Similarly, a systematic review by the WCRF highlighted 17 30
primary studies of workplace interventions that reported dietary changes (4). The role of workplace 31
canteens has been recognised in numerous countries in the provision of employee’s daily meals (5), and 32
thus the catering sector is likely to play a pivotal role in influencing dietary choices in adults of 33
working age, especially main meal selections (6-8). 34
French and colleagues (2003) have highlighted the influence of local pricing strategies in workplace 35
canteens and vending machines as a means of increasing healthier food (9). In addition, worksite 36
schemes offering free fruit can result in increased consumption of fruit and decreased consumption of 37
added sugar (10), and this can also result in positive dietary change for “blue collar” workplaces (11). 38
A review by Hawkes (2009) on financial incentives and disincentives to promote healthier eating has 39
highlighted that financial incentive schemes are “most effective when implemented as part of an 40
integrated package of mutually re-enforcing strategies, such as education/marketing” (12).Thus it would 41
be appropriate to view financial incentives such as price promotions as a tool to help stimulate healthy 42
eating as part of a broader package of activities. 43
In Scotland there is a unique opportunity to test the effect of promoting healthier eating in the 44
workplace given that the Healthy Living Award scheme and the Healthy Working Life Programme lay 45
the foundation for increasing access and provide a platform to add financial incentives and marketing 46
approaches. Against this backdrop, the current study aimed to investigate the feasibility of 47
implementing and evaluating a 10 week price incentive intervention to promote healthy eating in 48
workplace settings. This paper will discuss the lessons learnt from this feasibility study and 49
implications for future work. 50
51

3
Experimental methods 52
Recruitment 53
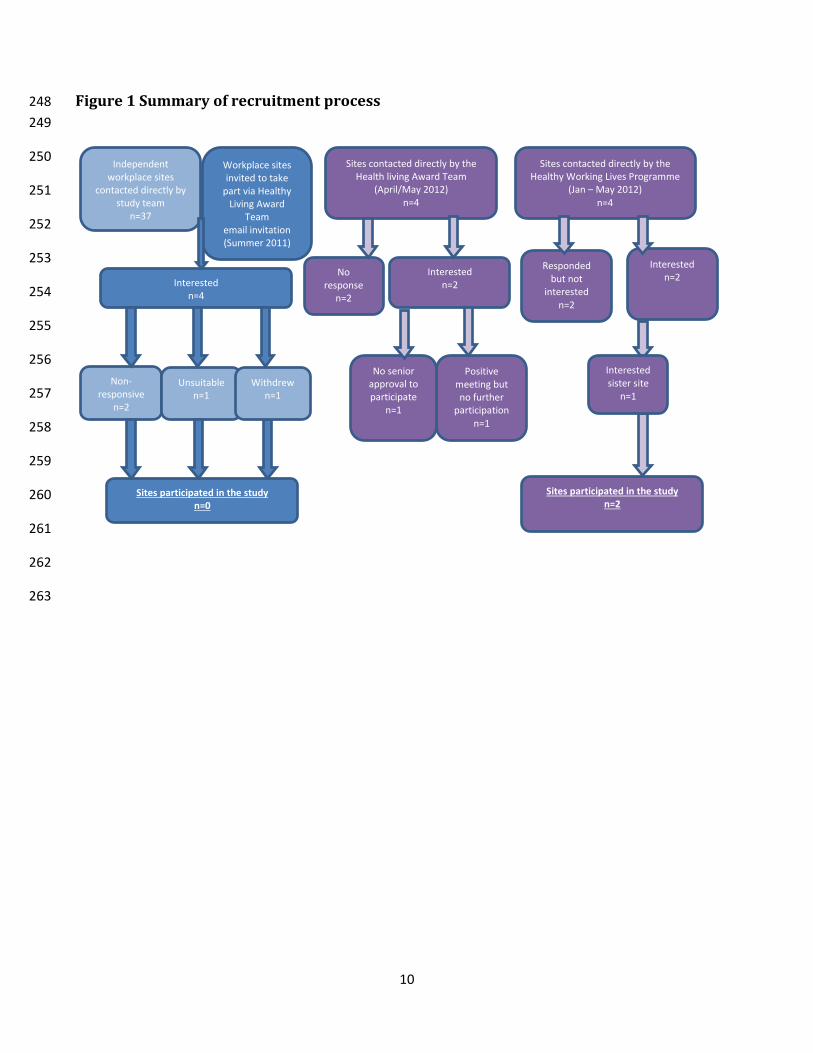
Recruitment was undertaken in conjunction with the HLA team. Thirty-seven workplace canteens and 54
18 contract caterers (with varying numbers of workplace canteens) were initially invited to participate 55
in the short term study which offered an incentive of £1000 per site to cover personnel time, training 56
and related costs. Four worksites responded positively but then declined to participate. Further 57
recruitment, involving personal contact and follow-up telephone calls by the HLA team, also failed to 58
identify interested sites. The HWL team then approached 4 possible worksites (one of which had an 59
interested sister site), two of whom completed the study. Figures 1and 2 provide a summary of the 60
recruitment process. 61
Intervention development 62
The intervention design was informed by qualitative research with canteen staff and users. Focus 63
groups and interviews were conducted in each workplace, with topic guides allowing the exploration of 64
plausible interventions. Marketing strategies were also discussed. Qualitative research was digitally 65
recorded and transcribed verbatim, content of which was verified by two researchers independently for 66
accuracy. Data analysis was performed using the principles of the Constant Comparative Method 67
(CCM) and Framework analysis (FA). 68
Intervention components 69
The intervention combined price incentives, healthy choices and a marketing strategy (Table 1). Price 70
incentives focused on consumer and caterers preference for “healthy meal deals” at a 10-20% cost 71
reduction. Recipes aimed to achieve a nutrient composition consistent with the FSA traffic light 72
grading low (or maximum of one medium) for fat, saturated fat, sugar and salt (13). Due to recently 73
introduced EU Regulation, individual items could not be labelled as “healthy” but were labelled with 74
value for money symbols (14). Marketing focused on a value strategy by promoting reduced prices, 75
products and key placing of targeted items within the canteen setting. 76
Intervention support 77
Workplaces were provided with substantial support during the intervention period: 78
• Promotional materials including stickers, posters, weekly and daily point of sale menus, content 79
for electronic bulletins etc. 80
• Practical catering resources including nutrient analysed recipes, shopping lists and daily/weekly 81
menu rotations. 82

4
• On-call researcher support (mobile telephone and email details provided to ensure constant 83
support and quick clarification of queries). 84
• £1000 to compensate for any costs incurred during the intervention period. 85
Intervention evaluation 86
Observational measures were taken at three official site visits during the implementation period to 87
ensure fidelity of intervention implementation and promotions. Sales data were provided by worksites. 88
At Site A the till was programmed to record intervention meal deals however no records were kept of 89
individual intervention component sales. Soup uptake was estimated using preparation and wastage 90
calculations. At Site B catering staff manually recorded individual component item sales. 91
A pre- and post-intervention questionnaire was delivered online to all employees at both sites via the 92
intranet and by adopting a “word of mouth” strategy. A prize draw was offered as an incentive for 93
participation at Site A (not permitted at Site B). Questionnaires collected data on socio-demographic 94
details, food habits, key dietary intake indicators, knowledge of five a day messages, canteen 95
perspectives and purchasing behaviour at the canteen. Data was analysed using SPSS (Version 21.0, 96
Chicago, IL, USA). 97
Post-intervention qualitative work (focus group and interviews) collected information on perception, 98
acceptability, marketing and perceived benefits of the intervention with catering staff and user in each 99
site. 100
Ethical approval was obtained from the University of Dundee Research Ethics Committee. 101
Results 102
Two worksites participated and completed the study. Site A was a private call centre employing 103
approximately 1600 employees (with a maximum of 800 employees onsite at any time), and Site B was 104
a government call centre with approximately 550 employees. Both sites were involved in the design 105
and delivery of tailored price incentivised interventions (marketed as EatSMART) which comprised of 106
a “meal deal” (e.g. soup, sandwich and fruit combination sale). 107
Intervention evaluation 108
Intervention uptake was estimated using till receipt data (Table 2) and varied by week (range 60 to 187 109
items) and by worksite. Throughout the intervention period there was greater uptake of intervention 110
soup (range 44 to 138) compared to the price incentivised meal deal (range 4 to 31). The intervention 111

5
did not appear to impact on snacks with snack sales remaining buoyant during the intervention period. 112
Notably, analysis of till receipt data was particularly time-consuming and did not enable the 113
identification of individual level consumption data. 114
The response rate from pre- and post-intervention questionnaires was low, with 2.9% (n=46) of the 115
workforce responding pre- and 1.6% (n=28) post in Site A and 15% (n=84) and 9.6% (n=53) of the 116
workforce responding pre- and post-intervention, respectively, in Site B. 117
Site observations reported that the intervention meal deal was available at the agreed price and 118
marketing strategies were visible throughout the intervention period. However, the number of visible 119
quantities of the intervention items on offer appeared limited. Substantial support from the research 120
team (Table 1) was required to recruit, initiate, develop and support the implementation of the 121
intervention. 122
Catering staff perception of the intervention 123
Pre- and post-intervention qualitative work with catering staff indicated that barriers to implementing 124
the intervention included; access to healthy ingredients, restrictions in catering contracts, limited choice 125
of ingredients, competition from externally sourced vending machines, time to deliver intervention, 126
limited cooking, storage and preparation facilities, difficulty identifying appropriate person to approve 127
intervention delivery, resistance from senior catering managers, additional workload and capacity 128
issues, and (perceived) unwillingness of canteen patrons to “try something new”. 129
Consumer perception of the intervention 130
Quantitative analysis of the repeated cross-sectional data at both sites and paired data from Site B 131
(n=20) indicated a more positive perception of all measures of post intervention (Tables 3 – 6a&b). At 132
both sites respondents reported purchasing an EatSMART promotional product (15% to 43%, 133
respectively) and reported having seen the promotional materials (36% and 58% respectively). Post-134
intervention focus groups highlighted that targeted foods were considered to be “tastier” and “ 135
healthier” with reports of more salad on sandwiches and an improvement in overall quality. However 136
respondents didn’t always consider the intervention items to be healthy – “soups can be greasy”. In 137
addition, availability and limited choice of intervention items were reported by consumers. 138
Discussion 139
It is recognised that the catering sector can have a pivotal role in influencing dietary intake, with the 140
potential to impact on obesity prevention. In Scotland, the Healthy Living Award is designed to 141

6
encourage caterers to increase the availability of healthier options. Preparatory work for the current 142
study (at the funding application phase) indicated interest from four catering sites (with the HLA). 143
However all four sites withdrew prior to the intervention commencement and considerable efforts were 144
needed to recruit additional catering establishments. These findings suggest limited interest by worksite 145
caterers in this area. In addition, it highlights the importance of allocating significant time for for 146
recruitment in future intervention research. 147
The extent to which culturally popular food selections (pies, fries, crisps and confectionary), catering 148
promotions (e.g. chocolate promotions during the Olympics) and general concerns about the impact of 149
“healthy eating” options on sale margins contributed to the poor response from caterers warrants 150
further exploration. It is unclear why financial imbursement (£1000 token of appreciation for 151
participating) helped to initiate discussions with some caterers but was insufficient to persuade 152
dialogue with others. Given the limited interest from worksite caterers to participate in healthy eating 153
research study (with substantial support), the current work calls into question the extent to which the 154
voluntary catering measures are likely to result in improvements in dietary intake at a population level. 155
Intervention components were tailored to consumer preferences and catering practicalities and although 156
operationalized as planned, consumer feedback suggested limited availability of certain meal deal 157
items, possibly reflecting caution in preparation exerted by caterers anticipating waste. The catering 158
staff involved in the study invested substantial time and energy contacting suppliers, organising and 159
preparing new menus, accessing ingredients and testing new recipes, highlighting the commitment 160
needed for such interventions which involve prepared foods in contrast to fast, highly processed items. 161
The uptake of price incentivised “meal deals” was modest although the uptake of healthier component 162
parts without the price reduction was very encouraging. Single item intervention components such as 163
soup sold for less than £1 (typically around 56-84p) were often the cheapest items available on the 164
menu. Although meal deals were suggested by consumers as desirable in the pre-intervention work, the 165
potential for more expensive meal deals to be impractical and unfeasible for many low income workers 166
is likely to impact on the limited uptake of “meal deals”. Menu planners and caterers need to consider 167
the nutrient profile of the lowest cost items available on menus to ensure healthy options are the most 168
desirable options. For many low income consumers, lowering the price of (more expensive) healthy 169
options or providing reduced cost meal deals that result in a greater financial outlay than the cheapest 170
available items is unlikely to increase choice in real terms, more likely to contribute to inequalities 171
experienced by this consumer group and unlikely be helpful in initiating change in food habits. If we 172

7
are to seriously tackle the burden of energy dense foods sold in catering establishments then a range of 173
policy levers may need to be utilized (with consideration given to the role of mandatory and legislative 174
activities). 175
Future research 176
The current study has highlighted numerous barriers to delivering price incentivised healthy eating 177
interventions in workplace catering establishments and has provided valuable learning for future 178
research in this area. Future studies should explore utilising technological advances in the catering 179
arena to reduce the data collection burden experienced. For example, using cashless systems to collate 180
sales information and link purchases to individual level data or study surveys warrant further 181
exploration. Smartphone technology (such as apps, multi-media/text messages or instant messaging) to 182
record purchasing behaviour or communicate with consumers may also improve study methodologies. 183
However, it is important not to avoid investigations in smaller and less affluent establishments where 184
these technologies may not be available. In addition, success in the current study was highly dependent 185
upon the working relationship and level of support provided by the research team to the caterer. 186
Researchers designing studies in this area should not underestimate the amount of time, resource and 187
support that is required to enable caterers to engage in research studies. Nurturing, supporting and 188
understanding perceived and actual challenges faced by enthusiastic individuals in the catering industry 189
who want to engage with “healthy eating” options is essential if successful outcomes are to be 190
achieved. 191
Acknowledgements 192
The authors are grateful for funding from the Scottish Collaboration for Public Health Research and 193
Policy. The authors would like to thank Ms Lyndsay Watkins for providing research assistance 194
throughout the duration of the study and Ms Clare Doogan for her help designing the marketing 195
strategy. They also thank the worksites, caterers and staff who took the time to participate in qualitative 196
research and assist with the study. 197
198
199

8
References 200
1. OECD (2010), “Obesity”, in OECD Factbook 2010:Economic, Environmental and Social 201 Statistics, OECD Publishing. http://dx.doi.org/10.1787/factbook-2010-87-en 202
2. McCormick B, Stone I, Corporate Analytical Team: Economic costs of obesity and the case for 203 government intervention. Obesity reviews 2007, 8 (Supplement 1), 161-4. . Obesity Reviews 204 2007, 8:161-164. 205
3. Mooney J, Haw S and John Frank.(2011) A report for the Early to Mid-Working Life Working 206 Group of the Scottish Collaboration for Public Health Research and Policy (SCPHRP): Policy 207 Interventions to Tackle the Obesogenic Environment, Focusing on adults of working age in 208 Scotland. 209 https://www.scphrp.ac.uk/system/files/publications/policy_interventions_to_tackle_the_obesog210 enic_environment_0.pdf 211
4. World Cancer Research Fund (2009) Policy and Action for Cancer prevention WCRF/AICR 212 Washington. 213
5. Wanjek C (2005) Food at work: workplace Solutions for malnutrition, Obesity and 214 Chronic Diseases. Geneva: International labour Organisation. 215
6. WHO/World Economic Forum. (2008) Preventing non-communicable diseases in the 216 workplace through diet and physical activity: WHO World economic Forum report of a joint 217 event. Geneva WHO/WEF. 218
7. Henriqu Bandoni et al 2011 Impact of an intervention on the availability and consumption of 219 fruits and vegetables in the workplace. Public Health Nutrition 14(6) pp 975-981. 220
8. Roos E et al (2004) Having lunch at a staff canteen is associated with recommended food habits 221 Public Health Nutr 7 53-61. 222
9. French SA. (2003) Pricing effects on food choices. J Nutr;133:841S–3S. 223 10. Alinia S et al (2011) A workplace feasibility study of the effect of a minimal fruit intervention 224
on fruit intake. Public Health Nutrition ;14(8):1382-1387. 225 11. Lassen et al (2011) Improving the diet of employees at blue-collar worksites: results from the 226
‘Food at Work’ intervention study. 227 12. Hawkes C. (2009) Identifying Innovative Interventions to Promote Healthy Eating Using 228
Consumption Oriented Food Supply Chain Analysis Journal of Hunger & Environmental 229 Nutrition;4(3-4):336-356. 230
13. Food Standards agency. Front-of-pack nutrition labelling. 231 http://www.food.gov.uk/scotland/scotnut/signposting/#.U34JW01OW2w 232
14. Food Standards Agency. Guidance notes on nutritional labelling. 233 http://multimedia.food.gov.uk/multimedia/pdfs/nutlabel2.pdf 234
235

9
Figure legend 236
Figure 1 Summary of recruitment process 237
Figure 2 Site details including recruitment response 238
Table 1 Summary of EatSMART tailored intervention & marketing package 239
Table 2 Intervention Uptake 240
Table 3 Online questionnaire survey respondent demographics 241
Table 4a Reported food intake in last 24 hour 242
Table 4b Reported food intake in last 24 hour (paired data) 243
Table 5 – Reported lunch time spend 244
Table 6a Perceptions of canteen 245
Table 6b Perceptions of canteen (paired data) 246
247
10
Figure 1 Summary of recruitment process 248 249
250
251
252
253
254
255
256
257
258
259
260
261
262
263
Sites contacted directly by the Healthy Working Lives Programme
(Jan – May 2012) n=4
Interested n=2
Sites participated in the study n=2
Sites contacted directly by the Health living Award Team
(April/May 2012) n=4
Responded but not
interested n=2
Interested n=2
No response
n=2
Positive meeting but no further
participation n=1
No senior approval to participate
n=1
Interested sister site
n=1
Workplace sites invited to take
part via Healthy Living Award
Team email invitation (Summer 2011)
Independent workplace sites
contacted directly by study team
n=37
Interested n=4
Sites participated in the study n=0
Non-responsive
n=2
Unsuitable n=1
Withdrew n=1

11
264
Figure 2 Site details including recruitment response 265 Site
Description
Recruitment
Strategy
Location No of contact (approx) Outcome Email/ Mail
Telephone Calls
Person Visits
Financial Services Primary (HLA – Summer 2011)
Edinburgh 8 4 1(x1 personnel)
1(x2 personnel)
Unsuitable: Site anticipated 12% increase in sales & limited capacity with staff at Olympics
Oil Refinery Primary (HLA – Summer 2011)
Grangemouth 6 8 1(x2 personnel) Un-responsive: Site stopped returning calls
Insurance Company Primary (HLA – Summer 2011)
Edinburgh 4 1 0 Un-responsive
Local authority Primary (HLA – Summer 2011)
Cardenden, Fife 13 12 1 (x1 personnel)
2 (x2 personnel)
Withdrew: Due to uncertain future
Energy company Secondary (HLA – Spring 2012)
Glasgow 2 2 0 Withdrew: Caterer unwilling to participate
Call centre (Brewers)
Secondary (HLA – Spring 2012)
Livingston 2 2 0 Un-responsive
Local authority Secondary (HLA – Spring 2012)
Hamilton 2 3 0 Un-responsive
Contract caterers Secondary (HLA – Spring 2012)
HQ– Stirling
Sites across Scotland
5 4 1(x1 personnel) Un-responsive
Energy Company customer service centre
Secondary (HWL – Spring 2012)
Cumbernauld 3 2 0 Interested initially but then nothing more following approvals
Call Centre Secondary (HWL – Spring 2012)
Uddingston 1 0 1 Not interested
Call centre Secondary (HWL – Spring 2012)
Airdrie 49 9 7(x1personnel) 6(x2 personnel) 1(x3 personnel)
Intervention completed
Call centre Secondary (Via Teleperformance Airdrie – Spring 2012)
Erskine 9 2 1(x1 personnel) Un-responsive
Government call centre
Secondary (HWL – Spring 2012)
Motherwell 47 9 3(x1 personnel) 6(x2 personnel) 1(x3 personnel)
Intervention completed
Total number of contacts/visits
151 58 53 person visits
266
267

12
Table 1 Summary of EatSMART tailored intervention & marketing package 268
269
Site A Site B
Intervention Combination deal Combination deal
Specifics Alternate weeks Soup & Sandwich Soup, Salad & Brown roll
Two options: Soup & Sandwich Soup, Sandwich & Fruit
Price £1.80 £2.50 or £3.00
Marketing Strategy
Product
• New reduced price combination deal
• Combination is healthy and complies with TL nutrient profiling system
Price • Reduced price for the 10 week
intervention period • 10-20% reduction price • Following qualitative research
price to be below £2 mark (actual £1.80)
Place • Site A Canteen
Promotion • Desk awareness strategy (3B’s) • Visualisation Strategy • Catering staff communication
strategy
Product
• New reduced price combination deal
• Combination is healthy and complies with TL nutrient profiling system
Price • Reduced price for the 10 week
intervention period • 10-20% reduction price (actually
may be more given current price range of sandwiches)
• Following qualitative research price to be (actual £2.50 for soup and sandwich and £3 for soup, sandwich & fruit)
Place • Site B Canteen
Promotion • Site B company intranet (new) • Visualisation Strategy in canteen
only (paperless site) • Catering staff communication
strategy (small team all on board and aware of intervention – all active players)
Nutrient criteria Comply with green TL nutrient criteria for 3 out of 4 nutrients below:
• Fat • Saturated Fat • Salt • Sugar

13
Table 2 Intervention Uptake
Week Site A
n=1600#
Site B
n=550
Combo
Estimated
Intervention Soup1
Salads Sandwiches*
Snacks
(crisps, chocolate sweets)
Combo
Soup Sandwiches Snacks
(crisps, chocolate, sweets)
Intervention % total soup sales
Intervention % total sandwich sales
Week 1 17 62 16 70 206 27 44 43 8 34 454
Week 2 7 85 20 55 193 23 55 45 1 28 517
Week 3 4 45 29 72 169 31 49 54 0 31 566
Week 4 10 59 13 70 129 27 52 63 0 33 531
Week 5 29 138 20 130 159 21 94 82 0 38 430
Week 6 8 68 2 76 161 8 52 37 0 13 540
Week 7 17 57 13 52 114 7 55 37 0 9 560
Week 8 24 118 17 81 236 22 58 50 0 41 612
Week 9 9 92 18 95 293 9 71 57 1 27 553
Week 10 17 95 18 74 242 12 72 45 1 27 493
# Only ~800 employees on the premises at any one time 1 estimated from production and waste *Included non-intervention items

14
Table 3 Online questionnaire survey respondent demographics Site A Site B
Pre-intervention n=46
Post-intervention n=28
Pre-intervention n=84
Post-intervention n=53
Male (%) 24(52) 19(68) 24(29) 14(27)
Age (years) Mean (range) 36(20 – 64) 31(21 – 41) 43(23 – 72) 42(23 – 65)
SIMD 1-5* (%) 29(74) 15(75) 39(65) 25(63)
Highest educational achievement –school level qualification (%) 14(30) 5(18) 37(46) 24(45)
Highest educational achievement – post school certificates (%) 14(30) 16(57) 28(35) 18(34)
Highest educational achievement – degree (%) 15(33) 6(21) 14(18) 9(17)
Gross annual household income < 15000 (%) 9(27) 7(30) 12(20) 7(20)
Gross annual household income 15000 - 40000 (%) 19(58) 11(49) 30(50) 17(49)
Gross annual household income >40000 (%) 5(15) 5(22) 18(30) 11(31)
Ethnicity – white (%) 43(94) 27(96) 76(95) 51(96)
Smoker (%) 13(30) 7(26) 8(10) 11(21)
Live with other adults (%) 36(86) 15(56) 72(88) 44(86)
Children in household (%) 18(39) 12(44) 34(42) 19(37)
Part-time working (%) 8(17) 5(17) 16(19) 10(20)
Full-time working (%) 38(83) 23(83) 64(81) 40(80)
BMI >30kg/m2 27(61) 11(41) 40(54) 12(27)
All percentages reported are valid percentages
*Scottish Index of Multiple Deprivation deciles 1-5 = most deprived areas

15
Table 4a Reported food intake in last 24 hour Site A Site B
Pre-intervention n=46
Post-intervention n=28
Pre-intervention n=84
Post-intervention n=53
Breakfast cereal – at least 1 portion (%) 25(57) 14(52) 53(67) 30(60)
Fruit (Portions) Mean (range)
3.2 (1 - 9) 3.1 (1 - 10) 2.6 (0 – 12) 2.7 (0 – 10)
Vegetables (portions) Mean (range)
2.3 (0 - 5) 2.0 (0 - 8) 2.3 (0 – 9) 2.2 (0 – 10)
Crisps, chocolate,(portions) Mean (range)
1.6 (0 – 6) 1.5 (0 - 7) 2.1 (0 – 8) 1.7 (0 – 4)
Sugary drinks – at least 1 portion (%) 25(56) 17(68) 32(40) 17(34)
Sugary drinks (portions) Mean (range)
1.3 (0 – 4) 1.4 (0 – 4) 0.7 (0 – 4) 1.5 (1 – 4)
Meat - >2 portions (%) 3(7) 5(19) 9(11) 6(12)
Fish – at least 1 portion (%) 10(23) 8(30) 23(31) 9(19)
Homemade soup – at least 1 portion (%) 16(36) 8(32) 25(32) 14(30)

16
Table 4b Reported food intake in last 24 hour (paired data) Site B
Pre-intervention n=20
Post-intervention n=20
p=1
Breakfast cereal, at least 1 portion (%) 14(82) 13(69) 1.00
Fruit (Portions) Mean (range)
1.8 (0 – 5) 2.4(0 - 10 0.31
Vegetables (portions) Mean (range)
2.7 (1 – 9) 2.1 (0 – 7) 0.13
Crisps, chocolate (portions) Mean (range)
2.9 (0 – 6) 1.8 (0 – 4) 0.02*
Sugary drinks, at least 1 portion (%) 8(42) 9(50) 1.00
Sugary drinks (portions) Mean (range)
1.6 (1 – 3) 1.7 (1 – 3) 0.77
Meat, >2 portions (%) 3(16) 4(20) 1.00
Fish, at least 1 portion (%) 7(39) 4(24) 0.48
Homemade soup, at least 1 portion (%) 7(37) 2(13) 0.13
1 Fisher Exact tests (chi squared test for differences in proportions/small samples) or paired student t test for differences in means
17
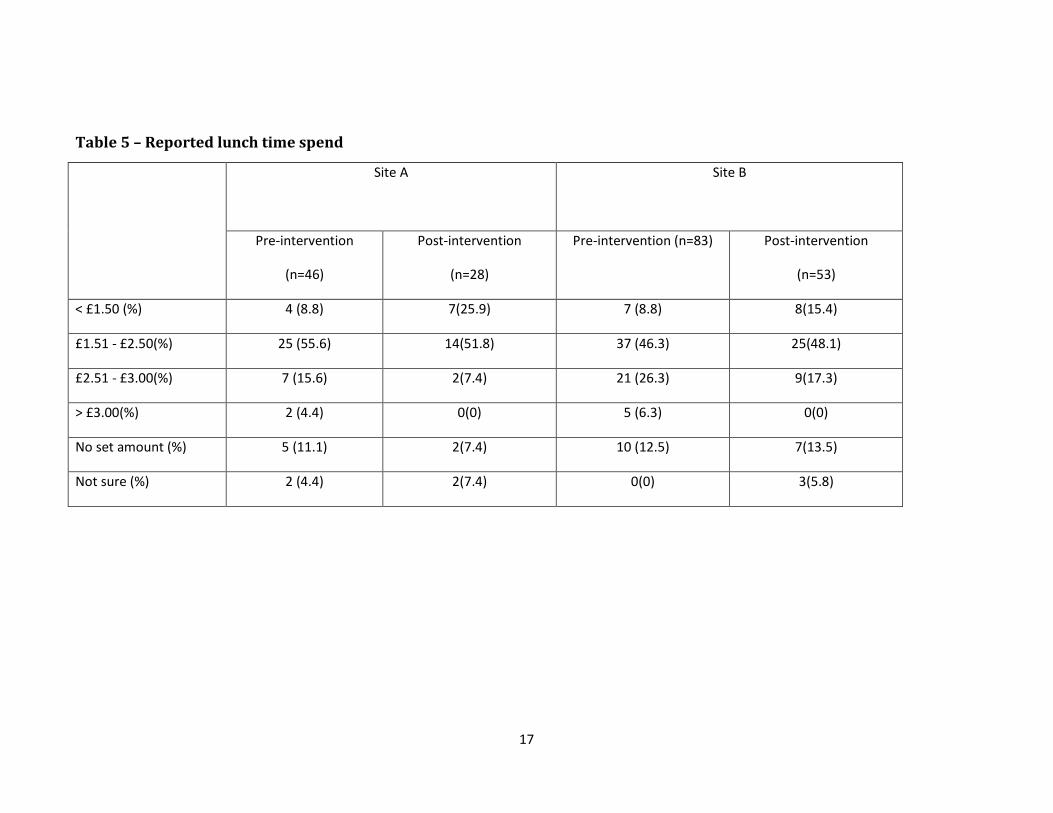
Table 5 – Reported lunch time spend
Site A
Site B
Pre-intervention
(n=46)
Post-intervention
(n=28)
Pre-intervention (n=83) Post-intervention
(n=53)
< £1.50 (%) 4 (8.8) 7(25.9) 7 (8.8) 8(15.4)
£1.51 - £2.50(%) 25 (55.6) 14(51.8) 37 (46.3) 25(48.1)
£2.51 - £3.00(%) 7 (15.6) 2(7.4) 21 (26.3) 9(17.3)
> £3.00(%) 2 (4.4) 0(0) 5 (6.3) 0(0)
No set amount (%) 5 (11.1) 2(7.4) 10 (12.5) 7(13.5)
Not sure (%) 2 (4.4) 2(7.4) 0(0) 3(5.8)

18
Table 6a Perceptions of canteen Site A Site B
Pre-intervention n=46
Post-intervention n=28
Pre-intervention n=84
Post-intervention n=53
Choice of items on sale Mean (range)1
2.9 (1 – 5) 3.9 (1-7) 2.8 (1 – 6) 3.3 (1 – 6)
Range of healthy eating choices Mean (range)1
2.6 (1 – 6) 3.8 (1 – 6) 2.6 (1 – 6) 3.5 (1 – 6)
Quality of food Mean (range)1
3.1 (1 – 5) 3.3 (1 – 6) 2.6 (1 – 5) 3.3 (1 – 6)
Value for money Mean (range) 1
2.3 (1 – 5) 3.1 (1 – 7) 1.9 (1 – 5) 2.5 (1 – 5)
Marketing materials Mean (range) 1
2.3 (1 – 5) 2.8 (1 – 6) 3.0 (1 – 6) 3.7 (1 – 6)
Promoted items Mean (range) 1
2.2 (1 – 6) 3.0 (1 – 6) 3.1 (1 – 6) 3.6 (1 – 7)
Dining experience Mean (range) 1
2.6 (1 – 5) 3.3 (1 – 6) 2.6 (1 – 6) 3.0 (1 – 6)
1 Likert scale 1=poor, 7=excellent

19
Table 6b Perceptions of canteen (paired data) Site B
Pre-intervention n=20
Post-intervention n=20
p=2
Choice of items on sale Mean (range)1
3.0 (1 – 5) 3.4(1 – 6) 0.008*
Range of healthy eating choices Mean (range)1
2.8(1 – 6) 3.6(1 – 6) 0.08
Quality of food Mean (range)1
2.9(1 – 5) 3.3(1 – 5) 0.008*
Value for money Mean (range) 1
2.1 (1 – 5) 2.7(1 – 5) 0.035*
Marketing materials Mean (range) 1
3.2 (2 – 5) 3.8(1 – 6) 0.008*
Promoted items Mean (range) 1
3.4 (1 – 6) 3.8(1 – 7) 0.047*
Dining experience Mean (range) 1
2.9 (1 – 6) 3.1(1 – 5) 0.004*
1 Likert scale 1=poor, 7=excellent 2 Paired Student t test for comparison of means *Significant p<0.05