macro and housing market slides
DESCRIPTION
Macro and Housing Market Slides. ASF Panel January 31, 2006 – Las Vegas, Nevada Mike Fratantoni Senior Director, Single Family Research and Economics Mortgage Bankers Association. Real Gross Domestic Product. Source: Bureau of Economic Analysis. Payroll Employment Monthly Change. - PowerPoint PPT PresentationTRANSCRIPT

Macro and Housing Market SlidesMacro and Housing Market Slides
ASF PanelJanuary 31, 2006 – Las Vegas, Nevada
Mike FratantoniSenior Director, Single Family Research and Economics
Mortgage Bankers Association

Real Gross Domestic ProductReal Gross Domestic Product
Source: Bureau of Economic Analysis.

Payroll EmploymentPayroll EmploymentMonthly Change
Source: Bureau of Labor Statistics.

Unemployment RateUnemployment Rate
3
4
5
6
7
8
9
1990
1991
1992
1993
1994
1995
1996
1997
1998
1999
2000
2001
2002
2003
2004
2005
Percent, Seasonally AdjustedPercent, Seasonally Adjusted
Nov5.0
Source: BLS Household Survey.

Current Account BalanceShare of GDP
Q1.1960 Q1.1970 Q1.1980 Q1.1990 Q1.2000
0
2
-2
-4
-6
-8
Percent

Percent of US Long-term Securities Percent of US Long-term Securities Held InternationallyHeld Internationally
0%
5%
10%
15%
20%
25%
30%
35%
40%
45%
50%
55%
Treasury 12.0% 13.5% 22.0% 19.4% 35.2% 40.7% 45.5% 52.0%
Agency 2.8% 2.6% 4.1% 5.4% 7.3% 10.2% 11.3% 10.5%
Corporate Debt 1.0% 2.5% 7.3% 7.8% 12.3% 15.7% 15.7% 17.0%
Equity 4.7% 4.9% 5.9% 5.1% 6.9% 7.8% 8.7% 9.2%
1978 1984 1989 1994 2000 2002 2003 2004
Source: U.S. Department of the Treasury.

Consumer PricesConsumer Prices(PCE Chain Price Index)(PCE Chain Price Index)
Source: Federal Reserve Board.

Federal Funds RateFederal Funds RateFederal Funds [effective] Rate
% p.a.
0504030201Source: Federal Reserve Board
8
6
4
2
0
8
6
4
2
0
Percent
Source: Federal Reserve Board.

Corporate Baa minus 10-Year TreasuryCorporate Baa minus 10-Year Treasury
Source: U.S. Department of the Treasury.

Low Grade Bonds minus 10-yr. TreasuryLow Grade Bonds minus 10-yr. Treasury
Source: U.S. Department of the Treasury.

Yield Spread:Yield Spread:30-Year Fixed Mortgages and 10-Year Treasuries30-Year Fixed Mortgages and 10-Year Treasuries
0
100
200
300
400
500
Source: Federal Reserve Board.
Basis Points

Yield Spread:Yield Spread:30-Year Fixed Mortgages and 10-Year Treasuries30-Year Fixed Mortgages and 10-Year Treasuries
120
145
170
195
220
245
Jan 4 2002 Sep 13 2002 May 23 2003 Jan 30 2004 Oct 8 2004 Jun 17 2005
Source: Federal Reserve Board.
Basis Points

State-level House Price Appreciation State-level House Price Appreciation at State-Level: Q3 2005at State-Level: Q3 2005
Source: Office of Federal Housing Enterprise Oversight (OFHEO).

Employment vs. House Price GrowthEmployment vs. House Price Growth

Population vs. HPGPopulation vs. HPG

Home Purchase Loans for Second Homes and Home Purchase Loans for Second Homes and Investor PropertiesInvestor Properties
2.0 2.3 2.0
3.54.3
5.56.3
5.8 6.0
7.07.8
8.8
6.97.6
6.87.3
11.3
7.5
0
2
4
6
8
10
12
1999 2000 2001 2002 2003 2004
Perc
en
t
Second Homes (LP) Investors (LP) Non-owner-occupied (HMDA)
Source: LoanPerformance and HMDA.

Growth in Condo and Single-Family Growth in Condo and Single-Family Detached Prices at the National LevelDetached Prices at the National Level

Housing Inventory/Sales RatioHousing Inventory/Sales Ratio
0
1000
2000
3000
4000
5000
6000
7000
8000
9000
19
90
19
91
19
92
19
93
19
94
19
95
19
96
19
97
19
98
19
99
20
00
20
01
20
02
20
03
20
04
20
05
Sa
les
pe
r m
on
th
0
1
2
3
4
5
6
7
8
9
10
Mo
nth
s s
up
ply
(S
A)
Sales per month Months supply
Sources: Census Bureau and National Association of Realtors (NAR)
Note: Months it would take to sell all available homes at the current pace of sales.

Annual Mortgage ProductionAnnual Mortgage Production
Billions of Dollars
Source: Mortgage Bankers Association and Department of Housing and Urban Development.
0
500
1,000
1,500
2,000
2,500
3,000
3,500
4,000
1990 1991 1992 1993 1994 1995 1996 1997 1998 1999 2000 2001 2002 2003 2004 2005 2006 2007
Purchase Refinance

2002-5 Purchase Index: 2002-5 Purchase Index: Four Week Moving Average, S.A.Four Week Moving Average, S.A.
SourceSource: Mortgage Bankers Association.: Mortgage Bankers Association.
300
350
400
450
500
550
Dec Jan
Feb
Mar
Apr
May Ju
l
Aug Sep Oct
Nov
SA
Pu
rch
as
e In
de
x
2005
2004
2003
2002

2002-05 Refinance Index: 2002-05 Refinance Index: Four Week Moving Average, S.A.Four Week Moving Average, S.A.
SourceSource: Mortgage Bankers Association.: Mortgage Bankers Association.
0
2000
4000
6000
8000
10000
Dec Jan Feb Mar Apr May Jul Aug Sep Oct Nov
SA
Pu
rch
as
e In
de
x
2003
2002
2004
2005
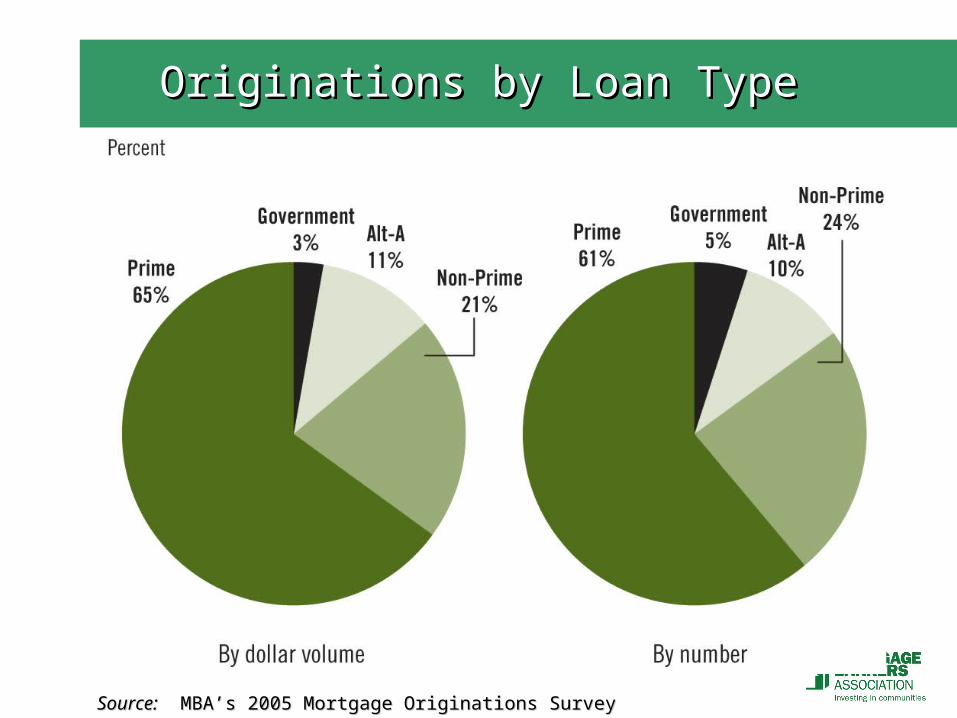
Originations by Loan TypeOriginations by Loan Type
Source:Source: MBA’s 2005 Mortgage Originations Survey MBA’s 2005 Mortgage Originations Survey

Originations by amortization typeOriginations by amortization type
Source:Source: MBA’s 2005 Mortgage Originations Survey MBA’s 2005 Mortgage Originations Survey

RMBS Issuance Market ShareRMBS Issuance Market Share
RMBS Issuance Market Share
0.0%
10.0%
20.0%
30.0%
40.0%
50.0%
60.0%
2003Q1
2003Q2
2003Q3
2003Q4
2004Q1
2004Q2
2004Q3
2004Q4
2005Q1
2005Q2
2005Q3
Calculations based on data from Inside MBS&ABS
Ginnie Freddie Fannie Private Label
Source: Calculations based on data from Inside MBS & ABS.

Alt-A Issuance by DocumentationAlt-A Issuance by Documentation
Source: Standard and Poor’s.

Total Delinquencies:1979-PresentTotal Delinquencies:1979-Present
Prime
All Loans
VA
Subprime
FHA
0.00
2.00
4.00
6.00
8.00
10.00
12.00
14.00
16.00
19
79
:Q1
19
80
:Q1
19
81
:Q1
19
82
:Q1
19
83
:Q1
19
84
:Q1
19
85
:Q1
19
86
:Q1
19
87
:Q1
19
88
:Q1
19
89
:Q1
19
90
:Q1
19
91
:Q1
19
92
:Q1
19
93
:Q1
19
94
:Q1
19
95
:Q1
19
96
:Q1
19
97
:Q1
19
98
:Q1
19
99
:Q1
20
00
:Q1
20
01
:Q1
20
02
:Q1
20
03
:Q1
20
04
:Q1
20
05
:Q1
Quarter/Year
SA
To
tal P
ast
Du
e
Source: MBA National Delinquency Survey

Delinquency Rate vs. Employment GrowthDelinquency Rate vs. Employment Growth

FRM vs. ARM Total Delinquency Rates: FRM vs. ARM Total Delinquency Rates: Q1 1992-Q2 2004Q1 1992-Q2 2004

Nominal Oil Price and MortgageNominal Oil Price and Mortgage Delinquency Rate Delinquency Rate
0
10
20
30
40
50
60
70
1975 -Q1
1978 -Q1
1981 -Q1
1984 -Q1
1987 -Q1
1990 -Q1
1993 -Q1
1996 -Q1
1999 -Q1
2002 -Q1
2005 -Q1
We
st
Te
xa
s In
term
ed
iate
($
/ba
rre
l)
0
1
2
3
4
5
6
7
To
tal p
as
t d
ue
ra
te
Nominal oil prices Total past due, US, SA
Source: MBA National Delinquency Survey

Homeowning Household Distribution Homeowning Household Distribution by Mortgage Typeby Mortgage Type