macro-economic and demographic factors shaping jobs growth
TRANSCRIPT

Macroeconomic and demographic factors shaping jobs growth
Macro-economic and demographic factors shaping jobs growth
Report prepared for the Department of Planning and Environment February 2016
Macroeconomic and demographic factors shaping jobs growth
This report has been prepared for Report prepared for the Department of Planning and Environment. SGS Economics and Planning has taken all due care in the preparation of this report. However, SGS and its associated consultants are not liable to any person or entity for any damage or loss that has occurred, or may occur, in relation to that person or entity taking or not taking action in respect of any representation, statement, opinion or advice referred to herein. SGS Economics and Planning Pty Ltd ACN 007 437 729 www.sgsep.com.au Offices in Canberra, Hobart, Melbourne and Sydney

Macroeconomic and demographic factors shaping jobs growth
TABLE OF CONTENTS
1 INTRODUCTION 1 1.1 Background 1
1.2 Overview of main factors across industries 1
2 KEY FACTORS AND INDUSTRIES 3 2.1 Globalisation 3
2.2 The rise of Asia 3
2.3 Domestic economic and demographic factors 5
2.4 Domestic policy and regulation 9
2.5 Technological improvements 10
2.6 Online retail trade 11
2.7 Education 12
2.8 Industrial and freight & logistics 13
2.9 Proportion of ’footloose jobs’ 17

Macro-economic and demographic factors shaping jobs growth 1
1 INTRODUCTION
1.1 Background There are a range of tasks underway to inform subregional planning for each of Sydney’s six subregions. This includes analysis of housing markets, analysis of recent jobs change and potential in strategic centres and transport gateways, feasibility of development in different locations, the operation of the transport system and barriers to the development of commercial buildings in strategic centres. As part of a technical advisory role on subregional planning SGS has prepared this overview of macro-economic and demographic factors shaping jobs growth. It provides context to help understand the potential for employment growth within each of Sydney’s Strategic Centres and is a companion document to the Barriers to Growth work being undertaken.
1.2 Overview of main factors across industries The main factors across industries can be summarised as:
Domestic policies. The NSW Government Decentralisation Policy is expected to help promote regional activity and employment by relocating government departments and providing incentives for people to move for employment purposes. In addition, recent national free trade agreements are expected to help boost agricultural production within Australia and NSW, particularly meat and dairy.
Health sector. Australia’s population is ageing. The Productivity Commission has estimated that Government spending on health care and aged care across Australia will increase from 4.9 per cent of GDP in 2011-12 to just under 10 per cent by 2059-60. This will mean strong growth across all major categories of health spending and employment in NSW including hospitals, medical benefits, pharmaceuticals and private health insurance.
Freight and logistics. The freight and logistics industry is being influenced by a raft of factors that are having varying effects on different segments of the industry. Road and rail freight businesses exposed to the manufacturing sector are in decline, while activity is stronger across businesses exposed to mining and broader export networks.
Mining. Growth in Asia is leading to strong demand for Australia’s resources. While not at the same scale of recent projects located in Western Australia and Queensland, there are currently a number of coal mine and infrastructure projects at the committed stage along the east coast of NSW to support the expected future demand for Australian resources. These developments are likely to stimulate activity and employment within the mining and transportation sectors operating across the east coast.
Population. The absolute changes in NSW population has been increasing over the past 5 years, from close to 20 000 people per quarter to 30 000 people. This has reflected an increase in net overseas migration as well as a more modest rise in net interstate migration. The latter is likely to reflect a reduction in net interstate migration to Queensland and Western Australia due to more subdued mining-related activity. These changes in demographic dynamics are likely to affect retail and hospitality services and jobs, which typically need to be located near to centres of population.
Macro-economic and demographic factors shaping jobs growth 2
Professional services. Firms in goods-producing industries such as manufacturing have progressively outsourced a range of business services to take advantage of the economies of scale generated when these services are pooled together and provided by specialised firms. These businesses and jobs are often concentrated in central business districts.
Technological improvements. Continual improvements in ICT and digital technologies is expected to result in more jobs being ’footloose’ or not restricted to a specific location. For example, retail banking and insurance for example can be conducted online using web based and telephone communications.
Education. Data from the Federal Department of Education and Training shows that the number of international students have increased dramatically over the past decade. While growth has halted over recent years, international student enrolments remain at an elevated level. Recent amendments to student and skilled migration visas between 2012 and 2014 is expected to help promote further growth in international students and employment growth in education sector.
Terms of trade. The decline in the Australian dollar over the last few years has brought benefits for a number of NSW industries, including:
Education
Tourism
Manufacturing

Macro-economic and demographic factors shaping jobs growth 3
2 KEY FACTORS AND INDUSTRIES
2.1 Globalisation The process and impact of globalisation on Australian industries has been widely documented. Greater efficiencies of technology and mechanisation are changing the way that traditional industrial businesses operate. The global economy today consists of sophisticated linkages between businesses, which are designed to enable the efficient sharing of information and the delivery of goods through a global supply chain. Supply-chains have become more fragmented and business components are often scattered across wide areas – sometimes internationally. An example of this change can be seen in the motor industry. Once concentrated in cities, the motor industry has evolved into a process where design, manufacture, and assembly occur in many different locations worldwide. All this has heightened time-based competition and flexibility, with implications for the functional characteristics and spatial disposition of industrial activity.
2.2 The rise of Asia The emergence of the economies of East Asia as major producers of manufactured goods over the past 50 years has had a significant effect on the structure of the world economy. East Asia's share of global manufacturing more than doubled from 1970 to 2008, reflecting the region's comparative advantage owing to relatively low labour costs. This process was led by Japan from the 1960s, followed by the newly industrialising economies of East Asia, and most recently China. The rising share of manufacturing in East Asia has been mirrored by a decline in the share of the United States and Europe, as well as in Australia's share.1 The strong growth in Asia's demand for commodities to supply an expanding manufacturing sector has significantly boosted the share of resources in Australian export income and the economy more generally, reflecting Australia's resource endowment and proximity to Asian markets. While not at the same scale of recent projects located in Western Australia and Queensland, there are currently a number of coal mine and infrastructure projects at the committed stage along the east coast of NSW to support the expected future demand for Australian resources (see map below). These developments are likely to stimulate activity and employment within the mining and transportation sectors operating across the east coast.
1 For more information, please see: http://www.rba.gov.au/publications/bulletin/2010/sep/1.html

Macro-economic and demographic factors shaping jobs growth 4
MNING AND NATURAL GA S INFRASTRUCTURE PROJECTS ACROSS AUSTRAL IA
Source: Department of Industry, Resources and Major Projects, April 2015
Macro-economic and demographic factors shaping jobs growth 5
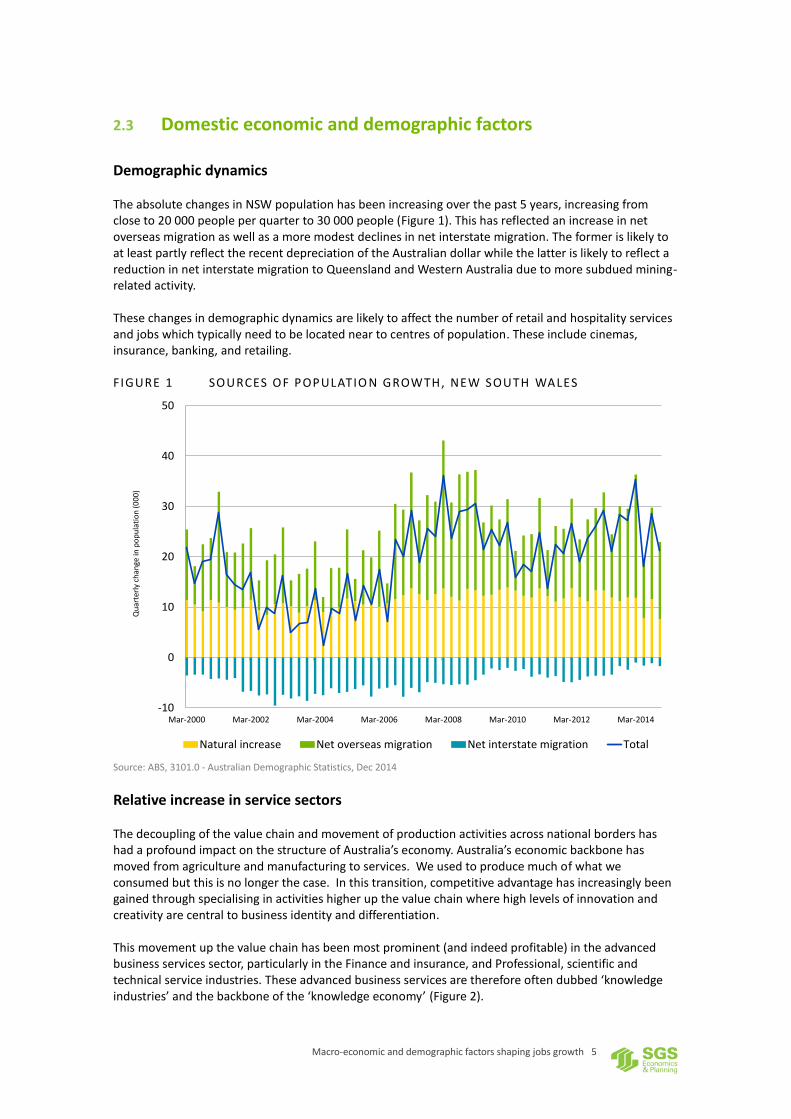
2.3 Domestic economic and demographic factors
Demographic dynamics The absolute changes in NSW population has been increasing over the past 5 years, increasing from close to 20 000 people per quarter to 30 000 people (Figure 1). This has reflected an increase in net overseas migration as well as a more modest declines in net interstate migration. The former is likely to at least partly reflect the recent depreciation of the Australian dollar while the latter is likely to reflect a reduction in net interstate migration to Queensland and Western Australia due to more subdued mining-related activity. These changes in demographic dynamics are likely to affect the number of retail and hospitality services and jobs which typically need to be located near to centres of population. These include cinemas, insurance, banking, and retailing.
FIGURE 1 SOURCES OF POPULATIO N GROWTH, NEW SOUTH WALES
Source: ABS, 3101.0 - Australian Demographic Statistics, Dec 2014
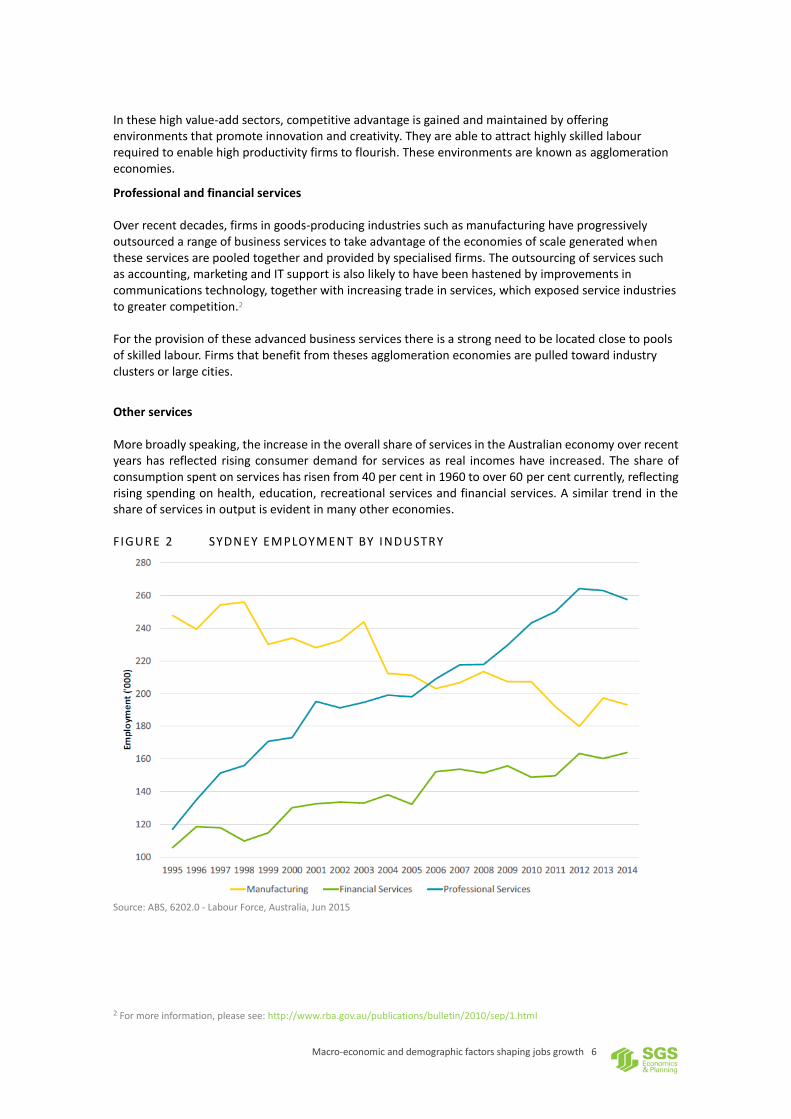
Relative increase in service sectors The decoupling of the value chain and movement of production activities across national borders has had a profound impact on the structure of Australia’s economy. Australia’s economic backbone has moved from agriculture and manufacturing to services. We used to produce much of what we consumed but this is no longer the case. In this transition, competitive advantage has increasingly been gained through specialising in activities higher up the value chain where high levels of innovation and creativity are central to business identity and differentiation. This movement up the value chain has been most prominent (and indeed profitable) in the advanced business services sector, particularly in the Finance and insurance, and Professional, scientific and technical service industries. These advanced business services are therefore often dubbed ‘knowledge industries’ and the backbone of the ‘knowledge economy’ (Figure 2).
-10
0
10
20
30
40
50
Mar-2000 Mar-2002 Mar-2004 Mar-2006 Mar-2008 Mar-2010 Mar-2012 Mar-2014
Natural increase Net overseas migration Net interstate migration Total
Qu
arte
rly
chan
ge in
po
pu
lati
on
(0
00
)
Macro-economic and demographic factors shaping jobs growth 6
In these high value-add sectors, competitive advantage is gained and maintained by offering environments that promote innovation and creativity. They are able to attract highly skilled labour required to enable high productivity firms to flourish. These environments are known as agglomeration economies.
Professional and financial services Over recent decades, firms in goods-producing industries such as manufacturing have progressively outsourced a range of business services to take advantage of the economies of scale generated when these services are pooled together and provided by specialised firms. The outsourcing of services such as accounting, marketing and IT support is also likely to have been hastened by improvements in communications technology, together with increasing trade in services, which exposed service industries to greater competition.2 For the provision of these advanced business services there is a strong need to be located close to pools of skilled labour. Firms that benefit from theses agglomeration economies are pulled toward industry clusters or large cities.
Other services More broadly speaking, the increase in the overall share of services in the Australian economy over recent years has reflected rising consumer demand for services as real incomes have increased. The share of consumption spent on services has risen from 40 per cent in 1960 to over 60 per cent currently, reflecting rising spending on health, education, recreational services and financial services. A similar trend in the share of services in output is evident in many other economies.
FIGURE 2 SYDNEY EMPLOYMENT BY INDUSTRY
Source: ABS, 6202.0 - Labour Force, Australia, Jun 2015
2 For more information, please see: http://www.rba.gov.au/publications/bulletin/2010/sep/1.html
Macro-economic and demographic factors shaping jobs growth 7
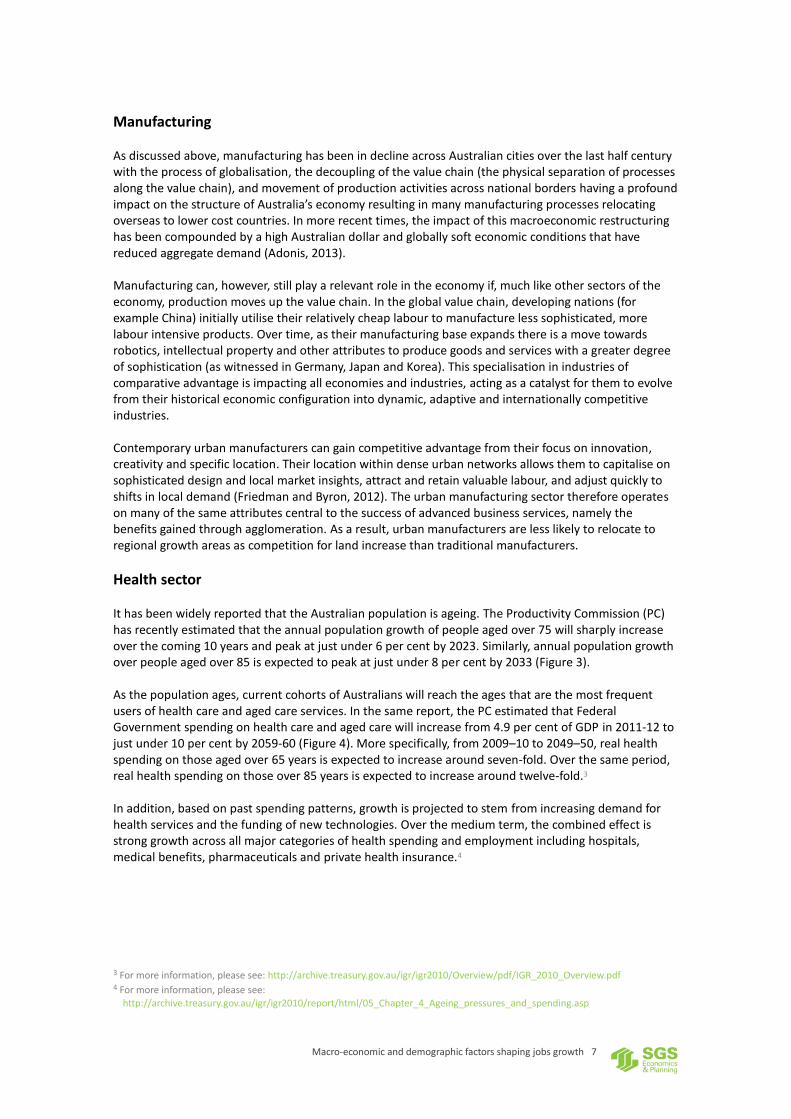
Manufacturing As discussed above, manufacturing has been in decline across Australian cities over the last half century with the process of globalisation, the decoupling of the value chain (the physical separation of processes along the value chain), and movement of production activities across national borders having a profound impact on the structure of Australia’s economy resulting in many manufacturing processes relocating overseas to lower cost countries. In more recent times, the impact of this macroeconomic restructuring has been compounded by a high Australian dollar and globally soft economic conditions that have reduced aggregate demand (Adonis, 2013). Manufacturing can, however, still play a relevant role in the economy if, much like other sectors of the economy, production moves up the value chain. In the global value chain, developing nations (for example China) initially utilise their relatively cheap labour to manufacture less sophisticated, more labour intensive products. Over time, as their manufacturing base expands there is a move towards robotics, intellectual property and other attributes to produce goods and services with a greater degree of sophistication (as witnessed in Germany, Japan and Korea). This specialisation in industries of comparative advantage is impacting all economies and industries, acting as a catalyst for them to evolve from their historical economic configuration into dynamic, adaptive and internationally competitive industries. Contemporary urban manufacturers can gain competitive advantage from their focus on innovation, creativity and specific location. Their location within dense urban networks allows them to capitalise on sophisticated design and local market insights, attract and retain valuable labour, and adjust quickly to shifts in local demand (Friedman and Byron, 2012). The urban manufacturing sector therefore operates on many of the same attributes central to the success of advanced business services, namely the benefits gained through agglomeration. As a result, urban manufacturers are less likely to relocate to regional growth areas as competition for land increase than traditional manufacturers.
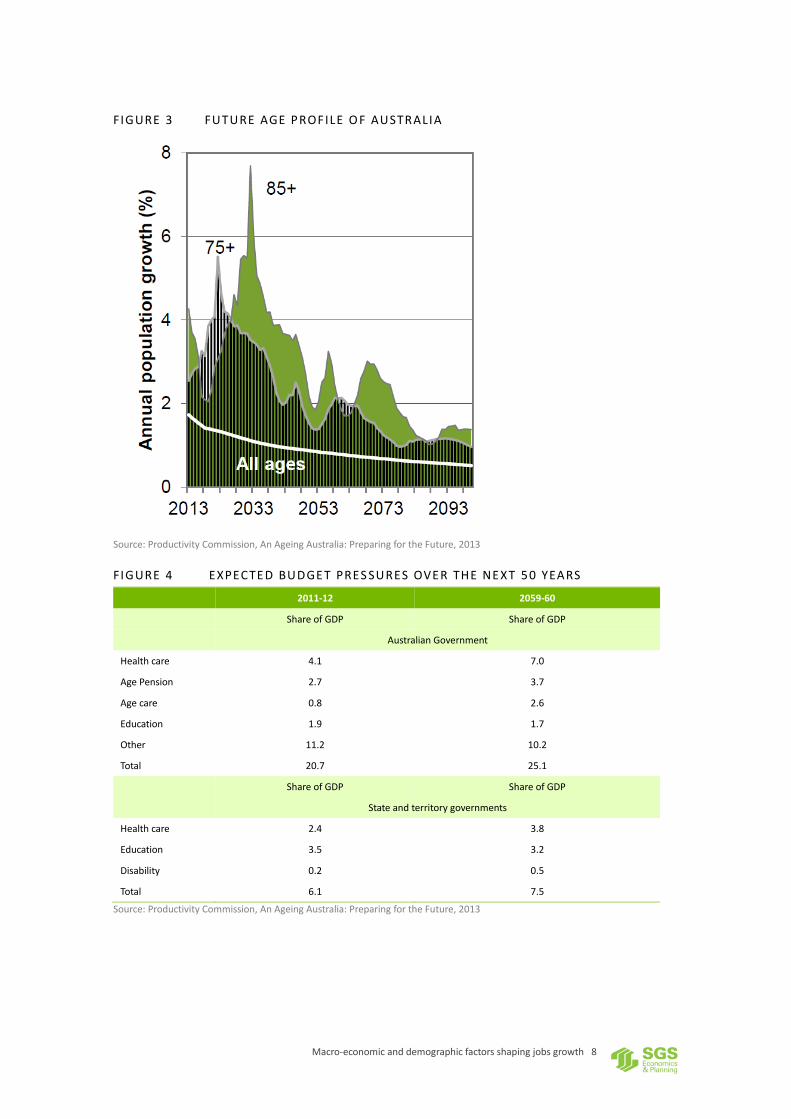
Health sector It has been widely reported that the Australian population is ageing. The Productivity Commission (PC) has recently estimated that the annual population growth of people aged over 75 will sharply increase over the coming 10 years and peak at just under 6 per cent by 2023. Similarly, annual population growth over people aged over 85 is expected to peak at just under 8 per cent by 2033 (Figure 3). As the population ages, current cohorts of Australians will reach the ages that are the most frequent users of health care and aged care services. In the same report, the PC estimated that Federal Government spending on health care and aged care will increase from 4.9 per cent of GDP in 2011-12 to just under 10 per cent by 2059-60 (Figure 4). More specifically, from 2009–10 to 2049–50, real health spending on those aged over 65 years is expected to increase around seven-fold. Over the same period, real health spending on those over 85 years is expected to increase around twelve-fold.3 In addition, based on past spending patterns, growth is projected to stem from increasing demand for health services and the funding of new technologies. Over the medium term, the combined effect is strong growth across all major categories of health spending and employment including hospitals, medical benefits, pharmaceuticals and private health insurance.4
3 For more information, please see: http://archive.treasury.gov.au/igr/igr2010/Overview/pdf/IGR_2010_Overview.pdf 4 For more information, please see:
http://archive.treasury.gov.au/igr/igr2010/report/html/05_Chapter_4_Ageing_pressures_and_spending.asp
Macro-economic and demographic factors shaping jobs growth 8
FIGURE 3 FUTURE AGE PROFILE O F AUSTRALIA
Source: Productivity Commission, An Ageing Australia: Preparing for the Future, 2013
FIGURE 4 EXPECTE D BUDGE T PRES SURES OVER THE NEXT 50 YEARS
2011-12 2059-60
Share of GDP Share of GDP
Australian Government
Health care 4.1 7.0
Age Pension 2.7 3.7
Age care 0.8 2.6
Education 1.9 1.7
Other 11.2 10.2
Total 20.7 25.1
Share of GDP Share of GDP
State and territory governments
Health care 2.4 3.8
Education 3.5 3.2
Disability 0.2 0.5
Total 6.1 7.5
Source: Productivity Commission, An Ageing Australia: Preparing for the Future, 2013
Macro-economic and demographic factors shaping jobs growth 9
2.4 Domestic policy and regulation
Government Policies
The NSW Government decentralisation policy The Decade of Decentralisation is the Government's policy vision for regional economic development in NSW. There are numerous State Government policies that have the potential to influence the future spatial distribution of employment within NSW. One recent example has been The NSW Government decentralisation policy, which has been designed to boost activity and employment throughout NSW regional centres. Key components of the Government's decentralisation policy agenda include:
actively pursuing strategies and policies to encourage decentralisation - steady and strategic growth in regions;
ensuring the services people need to make regional living attractive and viable are available and of high quality;
giving increased local decision-making and participation to regional communities;
managing NSW's predicted population growth with a careful balance between green-fields, urban infill and regional housing growth;
providing infrastructure to increase the productivity and build the capacity of regional economies to grow;
identifying more public sector job opportunities for relocation to regional areas; and
working with local government authorities, including regional councils and shires, to deliver the right priorities and the best value for local areas from the NSW roads budget.
Key initiatives being implemented to further the Decade of Decentralisation policy include:
Delivery of priority infrastructure to regional NSW;
Proposed reforms to NSW's planning system which will support regional development;
Delivery of infrastructure in mining-affected communities;
Implementation of initiatives to support local decision-making;
Grants to encourage people to relocate from metropolitan Sydney, Newcastle and Wollongong to regional NSW;
Ongoing implementation of the local government reform agenda; and Government agency decentralisation.5
In the 2015 Economic Development Strategy for Regional NSW, it was noted that:
Of the targeted 1,500 jobs to relocate from metropolitan Sydney to Regional NSW by 2021, 470 have already been relocated or proposed for relocation, including 167 from NSW Trade & Investment.
In addition, the Regional Relocation Grants Act have provided for payments to approved applicants who relocate from metropolitan areas of New South Wales to regional areas of New South Wales for the purpose of employment or self-employment. Given the current scale of the program, it is expected to have a noticeable though limited impact on the spatial distribution of jobs in NSW.
Trade liberalisation Australia has continued to reduce domestic and foreign trade barriers through the use of bilateral and multilateral trade agreements. Most recently, these have included the:
Australia-China FTA
Australia-Japan FTA
Australia-Korea FTA
Australia-EU FTA
5 For more information, please see: http://www.industry.nsw.gov.au/invest-in-nsw/why-sydney-and-nsw/economic-development-
framework/invest-in-critical-infrastructure/nsw-government-decentralisation-policy

Macro-economic and demographic factors shaping jobs growth 10
The Rural Industries Research and Development Corporation estimates that these agreements are likely to help boost Australian agricultural production and employment, in particular within the meat and dairy sub-sectors (Figure 5).
FIGURE 5 RECENT TRADE AGREEEM ENTS INVOLVING AUSTR ALIA
Effect on participants Australia production
Australia-China FTA
Small increase in GDP for both countries. Chinese trade with Australia increased, with little change in trade with other countries.
Large increases in wool and plant based fibres, declines in textiles and wearing apparel. Other sectors little change.
Australia-Japan FTA 36% increase in Japanese exports to
Australia.
Increases in most agricultural products, especially meat and dairy. Some declines in manufacturing.
Australia-Korea FTA (w/out KORUS)
Small GDP increases for both. Korean exports to Australia increases by over 35%,
and almost 90% for motor vehicles.
Increases for beef and dairy products.
Australia-Korea FTA (with KORUS)
Increase in GDP in Korea, very small impacts on Australia and US. Increase in Korea trade with US and Australia.
Increases for beef and dairy products and their inputs.
Australia-EU FTA Small income effect for both countries, 6 to
15% increase in Australia-EU trade.
Main increase in meat and dairy, but also some declines in manufacturing.
Source: Rural Industries Research and Development Corporation, The impact of free trade agreements on Australia, 2014
2.5 Technological improvements Continual improvements in ICT and digital technologies is expected to result in more jobs being ’footloose’. The defining characteristic of footloose jobs is that they are not required for commercial purposes to be located in a specific location. This is in contrast to jobs in the resource sector, for example, which are typically required to be located near transport networks (Figure 6).
FIGURE 6 SCHE MATIC OVE RVIE W O F JOB TYPES
Source: SGS Economics and Planning
For example, retail banking and insurance for example can be conducted online using web based and telephone communications. Call centres that serve these service industries do not have to be located in urban centres anymore - so that many jobs have been relocated where labour costs are lower.

Macro-economic and demographic factors shaping jobs growth 11
In addition, more and more online businesses and other consultant services are likely to be based out of residential premises or other alternative locations. There are two groups who work from home, the first are people who work sporadically from home (for personal reasons), and secondly those who choose to operate a business from their place of residence permanently. This practice is likely to continue, particularly given ongoing improvements in technology and communication, though the impact of this trend on driving the spatial location of employment is unlikely to be significant.
Broader role of technology Thinking more broadly, the overall impacts of technology on the spatial distribution of employment remain unclear. It has been suggested that developments such as the National Broadband Network (NBN) could allow people to work remotely from any location within Australia. This could reshape the economic geography of our cities and region. However, given recent trends, this is unlikely to have a major impact on the future distribution of employment across Sydney. The past fifteen years since the emergence of a range of information & communications technologies (ICT), including the internet, email, personal computers, laptops, mobile phones, smart phones, have dramatically changed the way business is conducted. All of the ICT platforms could have allowed jobs to disperse more widely across cities and regions. However, major cities have experienced an increase in the concentration of employment within the central core. It would appear that ICT has heightened the strength of agglomeration economies rather than diluted them. Further advances such as the NBN are unlikely to alter this cluster we see in the central city of Sydney. Jobs will continue to agglomerate and ICT will be used to service more remote areas. The development and application of new technologies has also driven structural change over recent decades, particularly in service industries. Since 1970, investment in computers and software has increased exponentially in real terms, reflecting the rapid improvement in the quality of computers over time and their range of uses. In the finance industry, the adoption of technologies such as automatic teller machines and electronic payment methods in the 1980s and 1990s resulted in significant structural change. Improved transportation technologies and new business practices (such as just-in-time production) are also likely to have resulted in better inventory management and contributed to the reduction in the relative size of distribution services such as wholesale trade and transport.
2.6 Online retail trade In line with improvements in ICT and other technologies, an increasing share of goods and services are purchased online. While the level of this activity is difficult to quantify, experimental estimates produced by the ABS suggest that close to 3 per cent of domestic retail sales are currently purchased online. If other collaborative consumption platforms such as E-Bay and Gumtree are also accounted for then it possible that this figure may be closer to 5 per cent (Figure 7) The current growth in online platforms is likely to alter the structure of retail supply chains. For example, online retail businesses are likely to focus on a wholesale and distribution models as opposed to retail premises. Given the fact that retail premises are located near centres of population or activity while wholesale and distribution centres are typically located in regional areas, this trend is likely to alter the spatial distribution of premises involved in retail supply chains.

Macro-economic and demographic factors shaping jobs growth 12
FIGURE 7 DOMESTIC ONLINE RETA IL TURNOVER
2015 Total online retail trade Per cent of total retail trade
$m %
January 656.2 2.8
February 596.4 2.8
March 708.5 3.0
April 685.4 3.0
May 717.6 3.1
Source: ABS, 8501.0 - Retail Trade, Australia, May 2015
2.7 Education
Data from the Department of Education and Training shows that the number of international students have increased dramatically over the past decade, and while growth has halted over recent years, international student enrolments remain at an elevated level (Figure 8). The major of enrolments are in higher education, vocational education, and English language intensive courses for overseas students (ELICOS) places across the country, which is helping to stimulate activity and jobs within the education sector.
FIGURE 8 INTERNATIONAL STUDEN T ENROLMENTS, AUSTRA LIA, 1994 TO 2014
Source: Australian Government, Department of Education and Training, International Student Data 2014
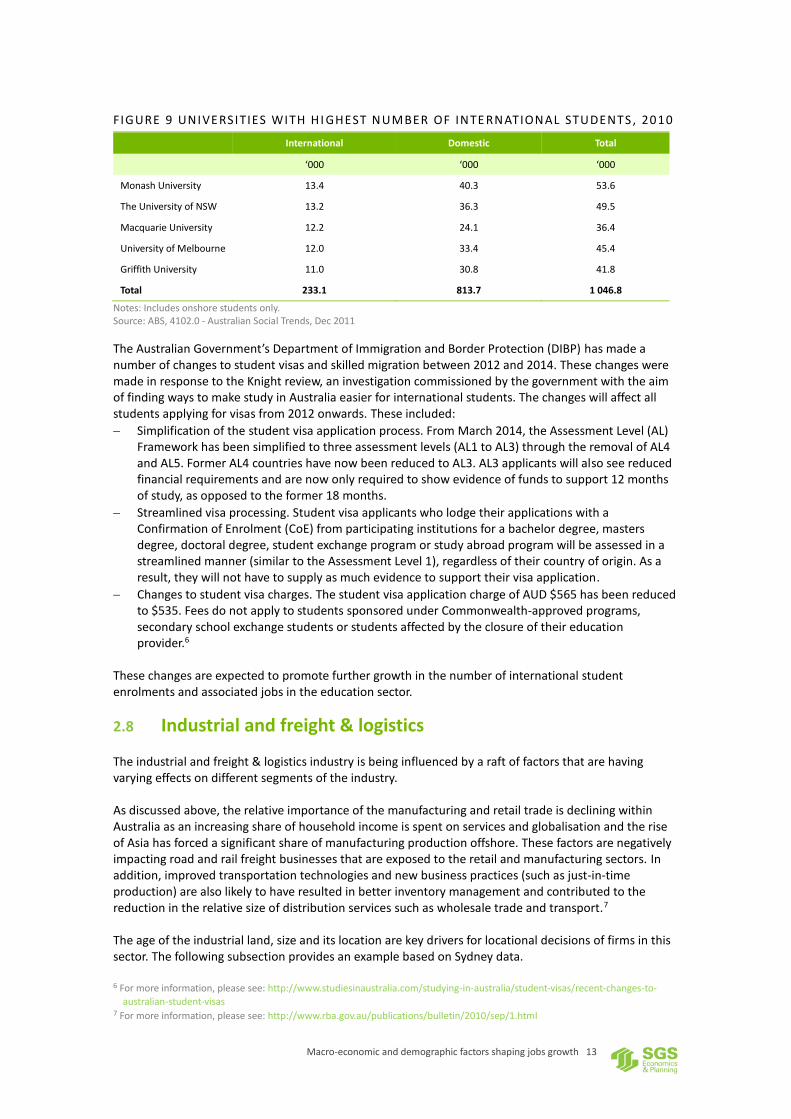
A large share of these students are enrolling into universities throughout New South Wales, in particular, The University of NSW and Macquarie University (Figure 9).
Macro-economic and demographic factors shaping jobs growth 13
FIGURE 9 UNIVE RSITIES WITH HI GHEST NUMBER OF INTE RNATIONAL STUDENTS , 2010
International Domestic Total
‘000 ‘000 ‘000
Monash University 13.4 40.3 53.6
The University of NSW 13.2 36.3 49.5
Macquarie University 12.2 24.1 36.4
University of Melbourne 12.0 33.4 45.4
Griffith University 11.0 30.8 41.8
Total 233.1 813.7 1 046.8
Notes: Includes onshore students only. Source: ABS, 4102.0 - Australian Social Trends, Dec 2011
The Australian Government’s Department of Immigration and Border Protection (DIBP) has made a number of changes to student visas and skilled migration between 2012 and 2014. These changes were made in response to the Knight review, an investigation commissioned by the government with the aim of finding ways to make study in Australia easier for international students. The changes will affect all students applying for visas from 2012 onwards. These included:
Simplification of the student visa application process. From March 2014, the Assessment Level (AL) Framework has been simplified to three assessment levels (AL1 to AL3) through the removal of AL4 and AL5. Former AL4 countries have now been reduced to AL3. AL3 applicants will also see reduced financial requirements and are now only required to show evidence of funds to support 12 months of study, as opposed to the former 18 months.
Streamlined visa processing. Student visa applicants who lodge their applications with a Confirmation of Enrolment (CoE) from participating institutions for a bachelor degree, masters degree, doctoral degree, student exchange program or study abroad program will be assessed in a streamlined manner (similar to the Assessment Level 1), regardless of their country of origin. As a result, they will not have to supply as much evidence to support their visa application.
Changes to student visa charges. The student visa application charge of AUD $565 has been reduced to $535. Fees do not apply to students sponsored under Commonwealth-approved programs, secondary school exchange students or students affected by the closure of their education provider.6
These changes are expected to promote further growth in the number of international student enrolments and associated jobs in the education sector.
2.8 Industrial and freight & logistics The industrial and freight & logistics industry is being influenced by a raft of factors that are having varying effects on different segments of the industry. As discussed above, the relative importance of the manufacturing and retail trade is declining within Australia as an increasing share of household income is spent on services and globalisation and the rise of Asia has forced a significant share of manufacturing production offshore. These factors are negatively impacting road and rail freight businesses that are exposed to the retail and manufacturing sectors. In addition, improved transportation technologies and new business practices (such as just-in-time production) are also likely to have resulted in better inventory management and contributed to the reduction in the relative size of distribution services such as wholesale trade and transport.7 The age of the industrial land, size and its location are key drivers for locational decisions of firms in this sector. The following subsection provides an example based on Sydney data.
6 For more information, please see: http://www.studiesinaustralia.com/studying-in-australia/student-visas/recent-changes-to-
australian-student-visas 7 For more information, please see: http://www.rba.gov.au/publications/bulletin/2010/sep/1.html

Macro-economic and demographic factors shaping jobs growth 14
Sydney Example Figure 10 maps existing and proposed employment lands across Sydney. Though it shows a somewhat scattered distribution of industrial precincts, the historical pattern can be discerned. Employment land is defined in the Employment Land Development Program 2015 Report as: “Land that is zoned for industry and/or warehouse uses including manufacturing; transport and warehousing; service and repair trades and industries; integrated enterprises with a mix of administration, production, warehousing, research and development; and urban services and utilities”8.
The first wave included those areas around inner Sydney, particularly south of the CBD and north of the airport and port;
The second wave of supply (20th century) was in the middle ring areas such as Parramatta, Silverwater, Bankstown and Homebush;
The third wave followed new arterial roads and motorways through south-west Sydney into Smithfield, Wetherill Park, Ingleburn and western Sydney into St Marys and north of Penrith;
The fourth wave is still in progress but it is based around major transport and freight infrastructure such as the M7 and proposed intermodal terminals, as well as Badgerys Creek airport. Erskine Park and the proposed Moorebank and WSEA areas are part of this fourth wave.
FIGURE 10. EXISTING AND PROPOSE D EMPLOYMENT LANDS I N SYDNEY
Source: Department of Planning and Environment, 2014
Generally speaking the ‘ring’ of employment lands around the CBD – particularly to the west and south – were the locations for the city’s production, distribution and ‘heavy’ industry activities until around the time of the Second World War. These old industrial areas are rapidly transforming as the pressure for inner city residential development grows and commercial districts expand.
8 NSW Department of Planning and Environment (2015) Employment Land Development Program Report
(http://www.planning.nsw.gov.au/~/media/Files/DPE/Manuals-and-guides/employment-lands-development-program-report-2015.ashx)
Macro-economic and demographic factors shaping jobs growth 15
Of Sydney’s approximate 15,000 hectares of industrial zoned land, almost 75 per cent is developed, with the bulk of the undeveloped land located in the west central, central coast, west and south west subregions. Central saw a reduction of 53 hectares of industrial zoned land in the year to January 2014.
TABLE 1. INDUSTRIAL LAND BY S UBREGION (HECTARES)
Undeveloped Developed Total
Year Change (hectares)
Central 46 0.30% 1,432 9.30% 1,478 9.60% -53
North 19 0.10% 313 2.00% 332 2.20% -9
South 73 0.50% 823 5.40% 896 5.80% -6
South West 715 4.70% 3,459 22.60% 4,174 27.20% 180
West 754 4.90% 1,057 6.90% 1,811 11.80% 20
West Central 1,356 8.80% 3,241 21.10% 4,598 30.00% 29
Sydney Region 2,963 19.3% 10,325 67.3% 13289 86.6% 161
Note: Sydney Region excludes Central Coast. Source: SGS Economics and Planning, 2014
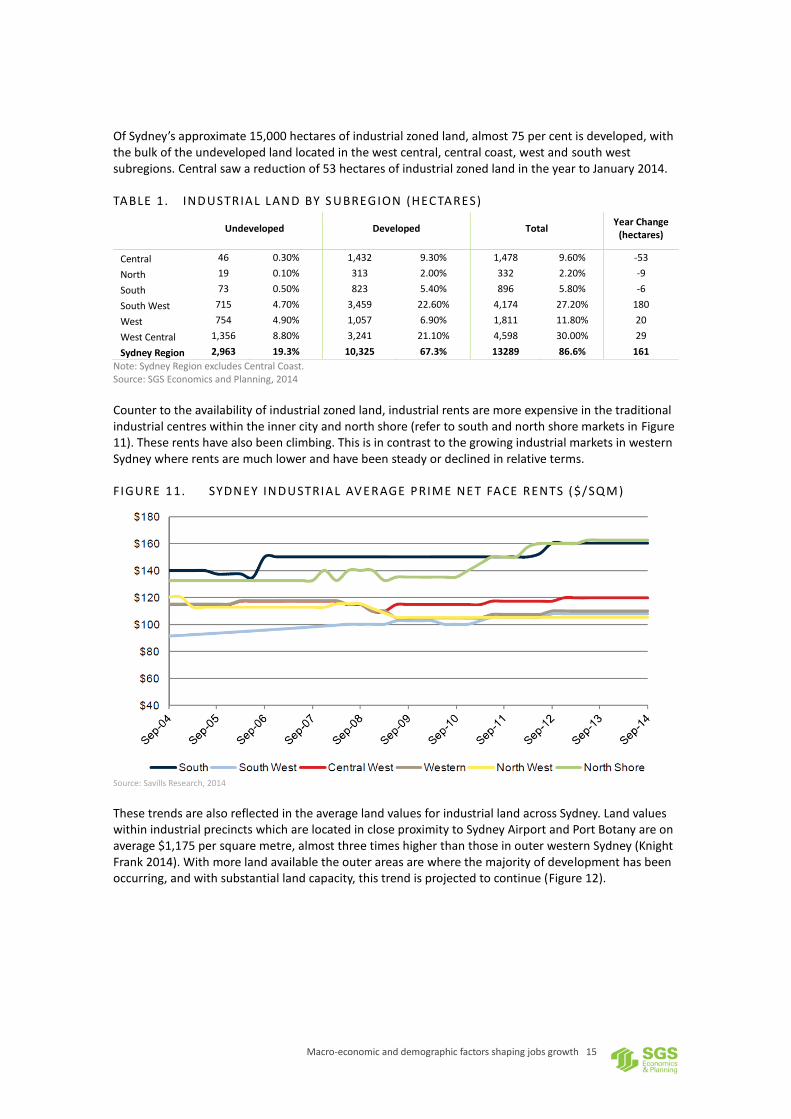
Counter to the availability of industrial zoned land, industrial rents are more expensive in the traditional industrial centres within the inner city and north shore (refer to south and north shore markets in Figure 11). These rents have also been climbing. This is in contrast to the growing industrial markets in western Sydney where rents are much lower and have been steady or declined in relative terms.
FIGURE 11. SYDNEY INDUSTRIAL AV ERAGE PRIME NET FACE RENTS ($/SQM)
Source: Savills Research, 2014
These trends are also reflected in the average land values for industrial land across Sydney. Land values within industrial precincts which are located in close proximity to Sydney Airport and Port Botany are on average $1,175 per square metre, almost three times higher than those in outer western Sydney (Knight Frank 2014). With more land available the outer areas are where the majority of development has been occurring, and with substantial land capacity, this trend is projected to continue (Figure 12).

Macro-economic and demographic factors shaping jobs growth 16
FIGURE 12. SYDNEY INDUSTRI AL DEVELOPMENT
Source: Knight Frank, 2014
Observations:
Development is occurring in the west of Sydney due to a number of factors including cheaper rents, larger lots and availability of land, and accessibility to major arterial roads.
As the mix of activity in the inner land stock (in South and North Shore) intensifies, and the contest over possible conversions to higher order uses increases on some of the sites, rents in these precincts have gone up and diverged from the outer suburban stocks.
The rent data suggests there is a clear distinction emerging in roles and functions between the inner and outer suburban industrial land markets.
The general picture observed from these trends is the westward shift in industrial land demand focus, particularly amongst the transport, warehouse and wholesale sector.
Employment lands now face pressure from a range of competing land uses. The most obvious pressure on employment lands in Inner Sydney is from residential development. Intense demand for housing sites is driven by a desire from residents to access the significant and diverse employment on offer nearby, particularly in the City of Sydney. Planning proposals are in progress to rezone industrial lands in precincts such as at Eastgardens, Botany Bay, which may potentially reduce stocks of industrial lands in surrounding LGAs.

Macro-economic and demographic factors shaping jobs growth 17
2.9 Proportion of ’footloose jobs’
In projecting employment growth across regional areas, it is important to consider the likely scale of ‘footloose jobs’. Regional growth areas are likely to generate two main types of employment:
population serving employment, and
‘footloose jobs’ that are not restricted to central business districts or specific transport networks.
Previous work by SGS suggested that approximately 137,000 new jobs, or around 20 to 25 per cent of total future jobs in Melbourne over the 2006 – 2026 period would be ‘footloose’. If a similar proportion is applicable to the NSW economy, this suggests that new regional areas throughout the State will be competing for a significant number of ‘footloose jobs’.

Macro-economic and demographic factors shaping jobs growth 18
Contact us CANBERRA
Level 6, 39 London Circuit Canberra ACT 2601
+61 2 6263 5940 [email protected]
HOBART
Unit 2, 5 King Street Bellerive TAS 7018
+61 (0)439 941 934 [email protected]
MELBOURNE
Level 5, 171 La Trobe Street Melbourne VIC 3000
+61 3 8616 0331 [email protected]
SYDNEY
209/50 Holt Street Surry Hills NSW 2010
+61 2 8307 0121 [email protected]