macroeconomic policy frameworks for resource-rich - imf
TRANSCRIPT
`F
MACROECONOMIC POLICY FRAMEWORKS FOR RESOURCE-RICH DEVELOPING COUNTRIES
Challenges and objective. Resource-rich developing countries (RRDCs) face the challenges of transforming resource wealth into other assets that support sustained development, while also maintaining mechanisms to avoid the boom-bust cycles that stem from volatility in natural resource revenues. Their distinct characteristics—low per capita incomes, scarcity of domestic capital, and limited access to international capital markets—make advice based on traditional consumption-savings/investment theories inadequate. The objective of this paper is to develop new macrofiscal frameworks and policy analysis tools for RRDCs that could enhance Fund policy advice.
Optimal macroeconomic management of resources. While some frontloading of consumption may be desirable given pressing development needs, a high proportion of resource revenue should go to savings and domestic investment to generate lasting development gains. RRDCs need to avoid boom-bust cycles by working to delink spending from the volatility dynamics of resource revenues.
Key innovations. The paper puts forward five key innovations:
A fiscal sustainability framework that accounts for the growth- and revenue-enhancing impact of public investment;
A sustainable investment tool for RRDCs to analyze the fiscal and macroeconomic implications of saving/investment scaling up scenarios;
A set of proposed fiscal indicators for RRDC staff reports to measure the savings from and use (consumption or investment) of resource flows;
A new toolkit for designing fiscal rules that smooth revenue volatility and assess long-term fiscal sustainability; and
A framework that generates current account benchmarks for external sustainability analysis in RRDCs.
Next steps. The next phase of the work initiated for this paper will include further developing and piloting the proposed new frameworks and tools. Work will also proceed on ways to better analyze and gauge countries “absorptive capacity,” build a cross-country database of variables relevant for RRDCs, and analyze more deeply the short-run macroeconomic challenges facing RRDCs and their implications for the macroeconomic policy mix.
August 24, 2012
MACROECONOMIC POLICY FRAMEWORKS FOR RESOURCE-RICH DEVELOPING COUNTRIES
2 INTERNATIONAL MONETARY FUND
Approved By Siddharth Tiwari, Carlo Cottarelli, Olivier Blanchard, Antoinette M. Sayeh, and José Viñals
Prepared by a staff team led by Dhaneshwar Ghura and Catherine Pattillo and comprising Chris Geiregat, Juliana Araujo, Armine Khachatryan, Lynge Nielsen, Nkunde Mwase, Friska Parulian, Sibabrata Das and Lisa Kolovich (all SPR); Alex Segura-Ubiergo, Santiago Acosta, Nathaniel Arnold, Fuad Hasanov, Takuji Komatsuzaki, Todd Mattina, Kyung-Seoul Min, Marcos Poplawski-Ribeiro, and Christine Richmond (all FAD); Maria Oliva (MCM); Felipe Zanna, Susan Yang, Grace Bin Li, Manzoor Gill, Salifou Issoufou, Rafael Portillo, and Nicola Spatafora (all RES); Javier Arze del Granado, Carol Baker, Thomas Baunsgaard, Felix Fischer, Rodrigo Garcia-Verdu, Mumtaz Hussain, Shawn Ladd, Lamin Leigh, Geoffrey Oestreicher, Gonzalo Salinas, Darlena Tartari Schwegler, Alun Thomas, Juan Treviño, Mauricio Villafuerte, and Irene Yackovlev (all AFR); Byung Kyoon Jang (APD); Dora Iakova and Daniel Rodriguez-Delgado (all WHD); and Hannah Behrendt (World Bank). An interdepartmental advisory group included representatives from the above departments, and Benedict Bingham (APD), Nikolay Gueorguiev (EUR), Rabah Arezki (ICD), Ron Van Rooden (MCD), and Przemek Gajdeczka (WHD). General guidance was provided by Hugh Bredenkamp (SPR), Sanjeev Gupta (FAD), Andrew Berg (RES), Seán Nolan (AFR), and Udaibir Das (MCM). Production assistance provided by Neri Gomes and Nazma Nunhuck (SPR).
CONTENTS
Abbreviations and Acronyms ______________________________________________________________________ 5
I. MOTIVATION, OBJECTIVES, AND KEY INNOVATIONS _______________________________________ 6
II. SAVINGS-INVESTMENT ANALYTICS IN RRDCS ____________________________________________ 11
A. Consumption and Savings/Investment Decisions _____________________________________________ 11
B. Dealing with Uncertainty and Volatility ________________________________________________________ 14
III. FISCAL POLICY CONSIDERATIONS _________________________________________________________ 16
A. Analytical Framework _________________________________________________________________________ 18
B. Fiscal Institutions ______________________________________________________________________________ 30
C. Managing Natural Resource Funds ____________________________________________________________ 31
IV. SHORT- AND MEDIUM-TERM MACROECONOMIC ISSUES _______________________________ 33
V. EXTERNAL SECTOR ASSESSMENTS _________________________________________________________ 37
A. External Assessments for Natural Resource Producers ________________________________________ 37

MACROECONOMIC POLICY FRAMEWORKS FOR RESOURCE-RICH DEVELOPING COUNTRIES
INTERNATIONAL MONETARY FUND 3
B. Incorporating Characteristics of RRDCs in CA Dynamics—A Model-Based Approach _________ 38
VI. LESSONS FROM FUND ENGAGEMENT _____________________________________________________ 40
VII. NEW APPROACHES AND PLANNED WORK _______________________________________________ 43
A. Future Work ___________________________________________________________________________________ 44
B. Issues for Discussion __________________________________________________________________________ 45
TABLES
1. Fiscal Frameworks for Resource-Rich Countries _______________________________________________ 25
2. Republic of Congo: Selected Economic Indicators Under the Standard PIH and FSF Scenarios 27
3. A Schematic Representation of the Policy Responses to a Natural Resource Windfall ________ 36
FIGURES
1. Paved Roads _____________________________________________________________________________________ 6
2. Growth in Real GDP Per Capita for RRDCs and Non-RRDCs _____________________________________ 8
3. Incremental Consumption from a Resource Windfall using Various Criteria __________________ 11
4. Incremental Consumption and Saving/Investment of a Resource Windfall ____________________ 13
5. Incremental Consumption and Saving from an Uncertain Resource Windfall _________________ 15
6. Real Primary Expenditure Growth _____________________________________________________________ 22
7. Cumulative Financial Savings __________________________________________________________________ 23
8. Real Primary Expenditure Growth _____________________________________________________________ 23
9. Nigeria Fiscal Stance ___________________________________________________________________________ 34
10. Nigeria External Balance ______________________________________________________________________ 34
11. Dynamics of a Resource Windfall: Impact of External Borrowing Constraints ________________ 39
12. Dynamics of a Resource Windfall: Impact of Absorptive Capacity Constraints _______________ 39
13. Fiscal Frameworks: Fund Advice and Country Adherence in RRDCs __________________________ 41
14. Fund Advice on Fiscal Institutions in RRDCs __________________________________________________ 41
15. Public Financial Management Technical Assistance to RRDCs and Non-RRDCs ______________ 41
16. Fiscal Conditionality in Fund-Supported Programs __________________________________________ 42
17. Revenue Administration Conditionality in Fund-Supported Programs _______________________ 42
BOXES
1. Resource-Rich Developing Countries: A Few Stylized Facts _____________________________________ 7
2. The Permanent Income Approach to Consuming/Saving Resource Wealth ___________________ 12
3. Approaches to Assessing the Adequate Size of a RRDC Stabilization Buffer __________________ 16
MACROECONOMIC POLICY FRAMEWORKS FOR RESOURCE-RICH DEVELOPING COUNTRIES
4 INTERNATIONAL MONETARY FUND
4. The Sustainable Investment Tool ______________________________________________________________ 28
5. Tailoring Regression Based CGER Methodologies to Natural Resource-Rich Countries _______ 38
APPENDIX
1. Resource-Rich and Non-Resource Rich Countries Included in the Analysis ___________________ 47
APPENDIX TABLES
1. Countries Rich in Non-Renewable Natural Resources Included in the Analysis _______________ 48
2. Other Resource-Rich Countries: LICs/LMICs, UMICs ___________________________________________ 49
3. Other Resource-Rich Countries: HICs __________________________________________________________ 50
References _______________________________________________________________________________________ 51
MACROECONOMIC POLICY FRAMEWORKS FOR RESOURCE-RICH DEVELOPING COUNTRIES
INTERNATIONAL MONETARY FUND 5
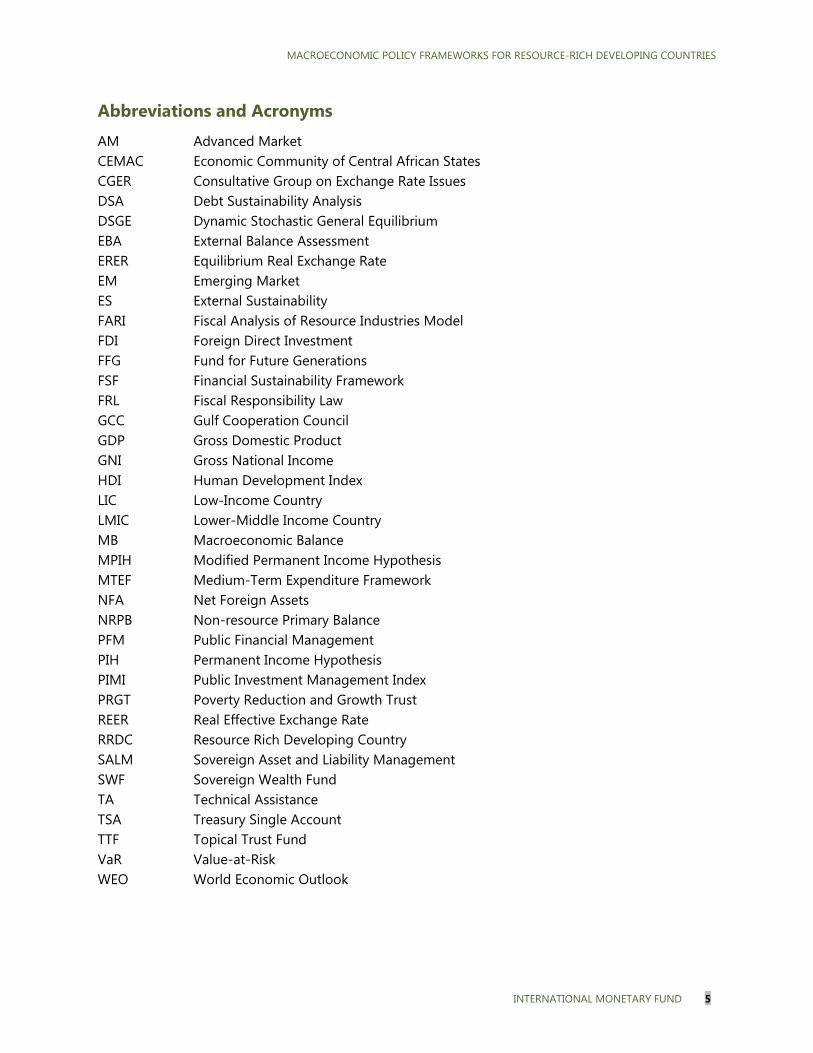
Abbreviations and Acronyms
AM Advanced Market CEMAC Economic Community of Central African States CGER Consultative Group on Exchange Rate Issues DSA Debt Sustainability Analysis DSGE Dynamic Stochastic General Equilibrium EBA External Balance Assessment ERER Equilibrium Real Exchange Rate EM Emerging Market ES External Sustainability FARI Fiscal Analysis of Resource Industries Model FDI Foreign Direct Investment FFG Fund for Future Generations FSF Financial Sustainability Framework FRL Fiscal Responsibility Law GCC Gulf Cooperation Council GDP Gross Domestic Product GNI Gross National Income HDI Human Development Index LIC Low-Income Country LMIC Lower-Middle Income Country MB Macroeconomic Balance MPIH Modified Permanent Income Hypothesis MTEF Medium-Term Expenditure Framework NFA Net Foreign Assets NRPB Non-resource Primary Balance PFM Public Financial Management PIH Permanent Income Hypothesis PIMI Public Investment Management Index PRGT Poverty Reduction and Growth Trust REER Real Effective Exchange Rate RRDC Resource Rich Developing Country SALM Sovereign Asset and Liability Management SWF Sovereign Wealth Fund TA Technical Assistance TSA Treasury Single Account TTF Topical Trust Fund VaR Value-at-Risk WEO World Economic Outlook
MACROECONOMIC POLICY FRAMEWORKS FOR RESOURCE-RICH DEVELOPING COUNTRIES
6 INTERNATIONAL MONETARY FUND
I. MOTIVATION, OBJECTIVES, AND KEY INNOVATIONS 1. Exhaustible natural resources can offer vast opportunities for economic development. They account for a major share of export and government revenues in a rapidly growing number of resource-rich developing countries (RRDCs).1 Many developing countries are experiencing a “double bonanza” of high prices for their natural resource exports and new discoveries. Properly managed, these resources could be used to speed up development and lift countries out of poverty.
2. Resource-rich economies face the challenges of resource revenue exhaustibility and volatility. Resource exhaustibility gives rise to intertemporal decisions about how much of the resource wealth to consume and how much to save, with implications for intergenerational equity and long-term fiscal and external sustainability. Revenue volatility calls for distinct medium-term fiscal rules and precautionary savings.
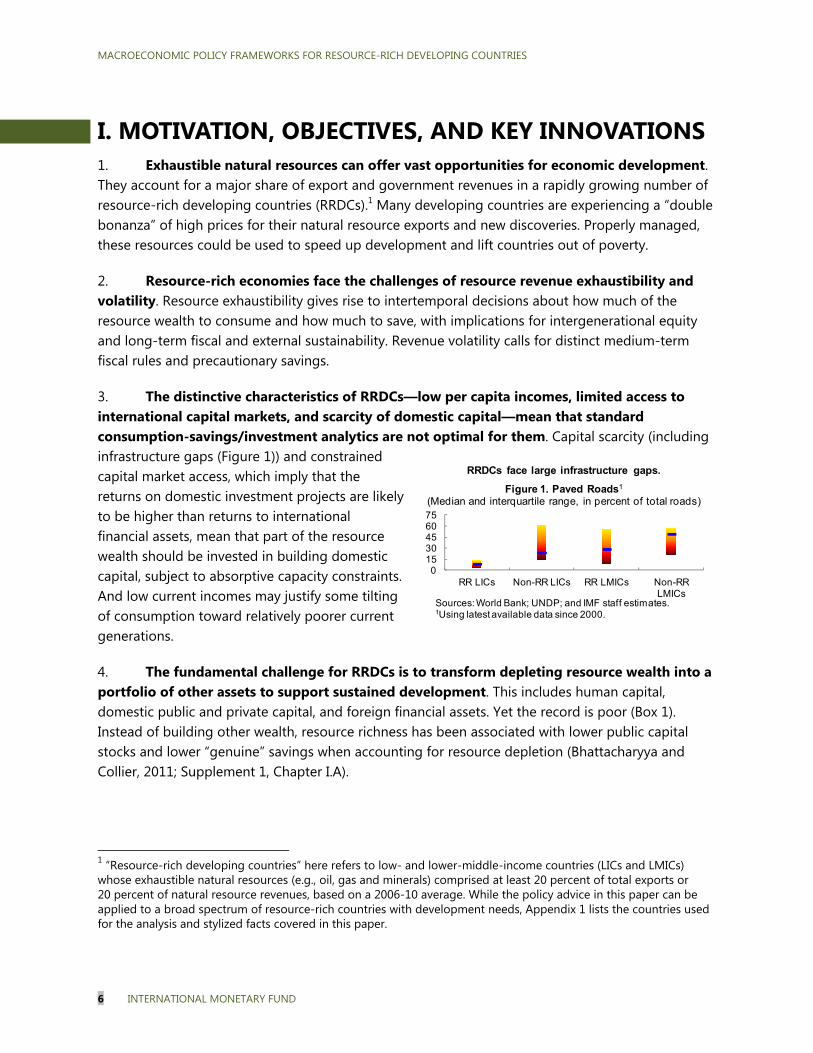
3. The distinctive characteristics of RRDCs—low per capita incomes, limited access to international capital markets, and scarcity of domestic capital—mean that standard consumption-savings/investment analytics are not optimal for them. Capital scarcity (including infrastructure gaps (Figure 1)) and constrained capital market access, which imply that the returns on domestic investment projects are likely to be higher than returns to international financial assets, mean that part of the resource wealth should be invested in building domestic capital, subject to absorptive capacity constraints. And low current incomes may justify some tilting of consumption toward relatively poorer current generations.
4. The fundamental challenge for RRDCs is to transform depleting resource wealth into a portfolio of other assets to support sustained development. This includes human capital, domestic public and private capital, and foreign financial assets. Yet the record is poor (Box 1). Instead of building other wealth, resource richness has been associated with lower public capital stocks and lower “genuine” savings when accounting for resource depletion (Bhattacharyya and Collier, 2011; Supplement 1, Chapter I.A).
1 “Resource-rich developing countries” here refers to low- and lower-middle-income countries (LICs and LMICs) whose exhaustible natural resources (e.g., oil, gas and minerals) comprised at least 20 percent of total exports or 20 percent of natural resource revenues, based on a 2006-10 average. While the policy advice in this paper can be applied to a broad spectrum of resource-rich countries with development needs, Appendix 1 lists the countries used for the analysis and stylized facts covered in this paper.
01530456075
RR LICs Non-RR LICs RR LMICs Non-RR LMICs
RRDCs face large infrastructure gaps.
Figure 1. Paved Roads1
(Median and interquartile range, in percent of total roads)
Sources: World Bank; UNDP; and IMF staff estimates.1Using latest available data since 2000.
MACROECONOMIC POLICY FRAMEWORKS FOR RESOURCE-RICH DEVELOPING COUNTRIES
INTERNATIONAL MONETARY FUND 7
Box 1. Resource-Rich Developing Countries: A Few Stylized Facts1
In spite of natural resource abundance, many RRDCs have not closed infrastructure gaps and have large development needs. Volatility in resource flows has posed challenges to policy makers and may have contributed to boom-bust cycles. As a result, socioeconomic outcomes have been mixed.
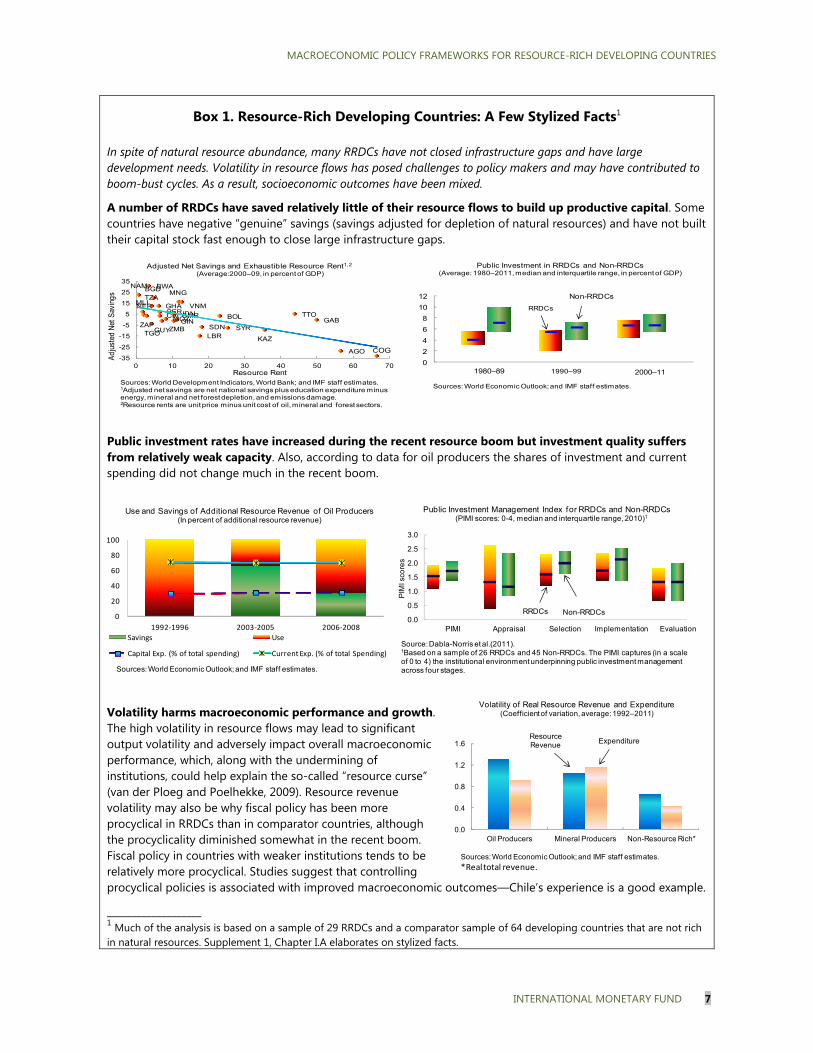
A number of RRDCs have saved relatively little of their resource flows to build up productive capital. Some countries have negative “genuine” savings (savings adjusted for depletion of natural resources) and have not built their capital stock fast enough to close large infrastructure gaps.
Public investment rates have increased during the recent resource boom but investment quality suffers from relatively weak capacity. Also, according to data for oil producers the shares of investment and current spending did not change much in the recent boom.
Volatility harms macroeconomic performance and growth. The high volatility in resource flows may lead to significant output volatility and adversely impact overall macroeconomic performance, which, along with the undermining of institutions, could help explain the so-called “resource curse” (van der Ploeg and Poelhekke, 2009). Resource revenue volatility may also be why fiscal policy has been more procyclical in RRDCs than in comparator countries, although the procyclicality diminished somewhat in the recent boom. Fiscal policy in countries with weaker institutions tends to be relatively more procyclical. Studies suggest that controlling procyclical policies is associated with improved macroeconomic outcomes—Chile’s experience is a good example.
___________________ 1 Much of the analysis is based on a sample of 29 RRDCs and a comparator sample of 64 developing countries that are not rich in natural resources. Supplement 1, Chapter I.A elaborates on stylized facts.
0
2
4
6
8
10
12
Public Investment in RRDCs and Non-RRDCs(Average: 1980–2011, median and interquartile range, in percent of GDP)
1980–89 1990–99 2000–11
RRDCs
Non-RRDCs
Sources: World Economic Outlook; and IMF staff estimates.
AGO
BGD
BOL
BWA
CMR
COG
CIVGAB
GHA
GINGUY
IDN
KAZLBR
MLI
MNG
MOZ
NAM
NERPER
ZAF SDN SYR
TZA
TGO
TTOVNM
ZMB
-35
-25
-15
-5
5
15
25
35
0 10 20 30 40 50 60 70Resource Rent
Adj
uste
d N
et S
avin
gs
Adjusted Net Savings and Exhaustible Resource Rent1,2
(Average:2000–09, in percent of GDP)
Sources: World Development Indicators, World Bank; and IMF staff estimates.1Adjusted net savings are net national savings plus education expenditure minus energy, mineral and net forest depletion, and emissions damage. 2Resource rents are unit price minus unit cost of oil, mineral and forest sectors.
0.0
0.4
0.8
1.2
1.6
Oil Producers Mineral Producers Non-Resource Rich*
Sources: World Economic Outlook; and IMF staff estimates.
*Realtotal revenue.
Volatility of Real Resource Revenue and Expenditure(Coefficient of variation, average: 1992–2011)
ResourceRevenue Expenditure
RRDCs Non-RRDCs0.0
0.5
1.0
1.5
2.0
2.5
3.0
PIMI Appraisal Selection Implementation Evaluation
PIM
I sco
res
Public Investment Management Index for RRDCs and Non-RRDCs(PIMI scores: 0-4, median and interquartile range, 2010)1
Source: Dabla-Norris et al.(2011).1Based on a sample of 26 RRDCs and 45 Non-RRDCs. The PIMI captures (in a scale of 0 to 4) the institutional environment underpinning public investment management across four stages.
0
20
40
60
80
100
1992-1996 2003-2005 2006-2008
Savings Use
Capital Exp. (% of total spending) Current Exp. (% of total Spending)
Use and Savings of Additional Resource Revenue of Oil Producers(In percent of additional resource revenue)
Sources: World Economic Outlook; and IMF staff estimates.
MACROECONOMIC POLICY FRAMEWORKS FOR RESOURCE-RICH DEVELOPING COUNTRIES
8 INTERNATIONAL MONETARY FUND
5. This paper reassesses the Fund’s policy advice to RRDCs in light of recent advances in analytic thinking, the stylized facts of performance in RRDCs, and lessons from Fund engagement.2 Specifically, the paper (i) utilizes and extends consumption-savings/investment analytical frameworks from recent research to derive implications for fiscal policy and external sector assessments; (ii) analyzes short- to medium-term fiscal rules and resource fund management that can help manage the volatility of resource revenues, as well as the implications for other short-run macro management policies; (iii) examines macroeconomic performance in RRDCs compared to a non-resource-rich peer group; and (iv) draws lessons for Fund policy advice based both on an assessment of how the specific challenges of RRDCs were previously addressed in Fund advice, programs, and technical assistance (TA) and on selected case studies and preliminary applications of the paper’s proposed frameworks. This assessment suggests that there is an opportunity for some rethinking of Fund policy advice to RRDCs. The objective of the paper is to develop new macrofiscal frameworks and policy analysis tools for RRDCs that would enhance Fund policy advice. The paper has benefitted from staff dialogue with external stakeholders, including country authorities, who stressed the need to use resource revenues for domestic investment, but only in the context of strong and transparent governance frameworks (Supplement 1, Chapter V).
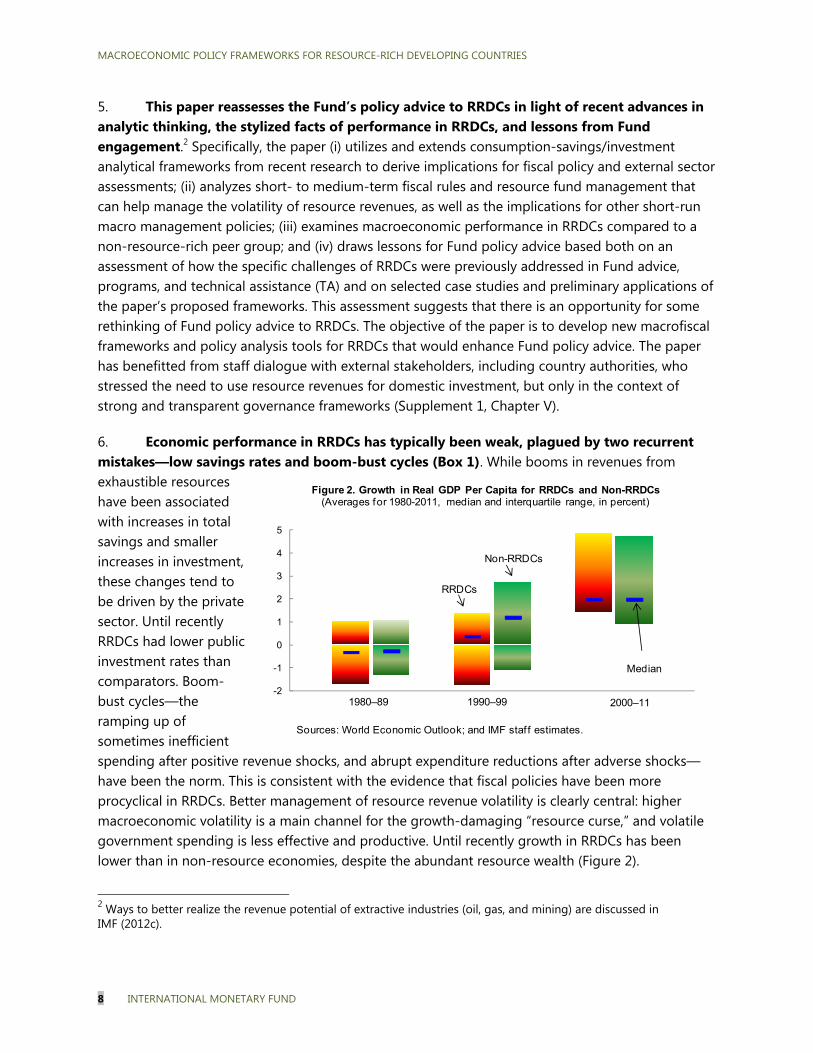
6. Economic performance in RRDCs has typically been weak, plagued by two recurrent mistakes—low savings rates and boom-bust cycles (Box 1). While booms in revenues from exhaustible resources have been associated with increases in total savings and smaller increases in investment, these changes tend to be driven by the private sector. Until recently RRDCs had lower public investment rates than comparators. Boom-bust cycles—the ramping up of sometimes inefficient spending after positive revenue shocks, and abrupt expenditure reductions after adverse shocks—have been the norm. This is consistent with the evidence that fiscal policies have been more procyclical in RRDCs. Better management of resource revenue volatility is clearly central: higher macroeconomic volatility is a main channel for the growth-damaging “resource curse,” and volatile government spending is less effective and productive. Until recently growth in RRDCs has been lower than in non-resource economies, despite the abundant resource wealth (Figure 2).
2 Ways to better realize the revenue potential of extractive industries (oil, gas, and mining) are discussed in IMF (2012c).
-2
-1
0
1
2
3
4
5
1980–89 1990–99 2000–11
RRDCs
Non-RRDCs
Figure 2. Growth in Real GDP Per Capita for RRDCs and Non-RRDCs(Averages for 1980-2011, median and interquartile range, in percent)
Sources: World Economic Outlook; and IMF staf f estimates.
Median
MACROECONOMIC POLICY FRAMEWORKS FOR RESOURCE-RICH DEVELOPING COUNTRIES
INTERNATIONAL MONETARY FUND 9
7. Two key features of optimal resource revenue management, developed in the recent analytic literature and in this paper’s approach, can help to avoid these problems. First, a high proportion of resource revenue should go to savings and domestic investment. Second, RRDCs need to avoid boom-bust cycles by aiming to more or less smooth consumption, or current spending, and in particular to delink it from the dynamics of resource revenue. The goal is to increase current spending in a sustainable way while scaling up investment appropriately given capacity constraints, and to sustain the resulting higher public capital stock.
Volatility Matters for all RRDCs, as Does Exhaustibility for Many
8. Long-run considerations—influenced by intertemporal consumption-savings/investment decisions related to an exhaustible resource—and management of revenue volatility need to be linked. The paper’s general approach to short- to medium-run fiscal rules illustrates this. Short- to medium-term fiscal targets should be informed by long-term fiscal sustainability frameworks. This involves determining an appropriate path for public investment and largely smoothing government consumption, conditioned on expected resource revenue based on expected production and prices. Fiscal rules can then protect this path from the volatility of actual revenues. The medium-term plan would need to be revised periodically as expectations of prices or volumes change. The resulting smoothing of “fiscal shocks” eases the task of short-run monetary and exchange rate policy in maintaining macroeconomic stability and achieving other policy objectives.
9. The design of policy frameworks needs to acknowledge that resource horizons are uncertain. While a country’s resource horizon and wealth are key concepts underlying sustainability analysis, they are also highly uncertain. Some countries may have substantially more resource wealth than is currently known, given unproven reserves and new discovery potential; and the difficulties of projecting long-term prices add risk to any wealth estimates. What do these considerations imply?
For countries with very long-lasting resource reserves, sustainability (stemming from depleting resource revenues) is clearly not as central as for countries with short reserve horizons. As with all countries, however, they face the same sustainability challenges of avoiding excessive borrowing.
For other countries, reserve horizons are highly uncertain, but finite. As with other aspects of economic policy-making where there is uncertainty, the unknowability of reserve horizons and wealth suggests a need for approaches that consider ranges of alternative scenarios, as well as frequent updates as new information becomes available. Assuming in these cases that resource flows will continue indefinitely (and “spending like it will never end”) is not advisable.
When current information (including unproven resource reserves, prospects, etc.) suggests that reserve horizons are relatively short, intertemporal consumption/savings-investment decisions and fiscal sustainability must be priorities. These need to help embed current policies (the relevant focus for policymakers) in a long-term perspective, lock in high savings rates, and
MACROECONOMIC POLICY FRAMEWORKS FOR RESOURCE-RICH DEVELOPING COUNTRIES
10 INTERNATIONAL MONETARY FUND
ensure as the capacity to invest efficiently is improved, a significant share of resource revenue savings is devoted to domestic investment.
Key Innovations in the Paper
10. There are several weaknesses and gaps in the Fund’s general approach to policy advice to RRDCs on managing natural resource revenues. These include:
Inadequacies of the permanent income hypothesis (PIH) for RRDCs. Fund papers and policy advice have often been guided by the broad principles of the PIH.3 While the desirability of smoothing and of avoiding unsustainably high levels of consumption should continue to anchor sustainability frameworks, some tilting of consumption paths toward relatively poorer current generations in RRDCs may be welfare-improving. Further, conceptually, the PIH is silent on the question of desirable investment dynamics, and so does not help with the dialog on where to invest the resource wealth—at home or abroad. Because investment abroad and at home have very different implications for the current account, the PIH similarly falls short in shaping discussions on the optimal dynamics of the current account in RRDCs.
Policy discussion not focused on consumption and savings/investment. The Fund has typically taken the expenditure-smoothing principle of the PIH and applied it to total government spending by deriving a stable path for the non-resource balance. Thus, a consumption-smoothing theory has been transformed into a framework for stabilizing total spending, without any distinction being made between consumption (current spending) and investment (capital spending). Moreover, standard fiscal frameworks, budget tables, and fiscal policy discussions in staff reports do not provide a basis for identifying, analyzing, and facilitating a policy discussion on a key issue: how much of the nonrenewable revenue source is being consumed versus saved, and how much of the latter is in domestic investment or foreign assets. Viewed through this alternative prism, two countries with the same non-resource balance may actually look very different. The challenge is to design fiscal frameworks and indicators that facilitate the type of fundamental reorientation implied by the new analytics of RRDCs, while recognizing the practical realities of budgeting and fiscal targets.
Insufficient attention to managing volatile resource revenues. In only about half of RRDCs has Fund advice focused on short- to medium-term fiscal rules that could help smooth the impact of resource revenue volatility. The volatility of total expenditure is over 60 percent higher in resource-rich countries than in comparators and, while fiscal policy has become less procyclical over the last decade, the boom-bust cycle has not been eliminated.4 Revenue shocks cause fiscal outcomes to deviate substantially from budgets, and given weak risk management frameworks and other constraints, RRDCs make very limited use of market hedging instruments (IMF, 2011b).
3 When the PIH is applied to natural resource wealth, a country sustains a constant consumption flow equal to the implicit return on the present value of future natural resource revenue. 4 IMF (2012a) demonstrates this for sub-Saharan Africa.
MACROECONOMIC POLICY FRAMEWORKS FOR RESOURCE-RICH DEVELOPING COUNTRIES
INTERNATIONAL MONETARY FUND 11
In light of these gaps, the paper recommends five key innovations:
A new long-term fiscal sustainability framework that accounts for the growth- and revenue-enhancing impact of investment, providing a long-run benchmark for the non-resource primary balance (NRPB) that gradually draws down net (financial and resource) wealth and stabilizes it at a lower level than with the PIH.
A sustainable-investing tool for RRDCs to analyze the macroeconomic and fiscal implications of different saving/investment scaling up scenarios that also builds in fiscal sustainability.
Complementary fiscal indicators for measuring growth in public investment and financial savings in relation to growth in resource revenue that could be included in RRDC staff reports.
A new toolkit to facilitate analysis of practical steps for designing fiscal rules to smooth short-term revenue volatility, and to assess long-term fiscal sustainability under different frameworks.
A framework that generates current account benchmarks for analyzing external stability in RRDCs, based on a simple model with optimal investment decisions following exhaustible resource windfalls.
Country case studies of some of these new approaches demonstrate how these frameworks and tools can provide new insights; they also illustrate some of the remaining challenges.
II. SAVINGS-INVESTMENT ANALYTICS IN RRDCS
For RRDCs the question of how much of resource flows to consume and how much to save/invest is critical. Policymakers also need to decide where to save and invest: in the domestic economy or abroad, in foreign assets. Some frontloading of consumption spending to benefit presently poor generations may be welfare improving. At the same time, a high saving/investment rate is necessary if there is to be a lasting impact on development. Scaling up domestic investment would normally be part of an optimal development strategy, though this could run into bottlenecks that would need to be addressed first. The volatility and uncertainty of resource flows may give rise to a precautionary need for liquidity buffers.
A. Consumption and Savings/Investment Decisions
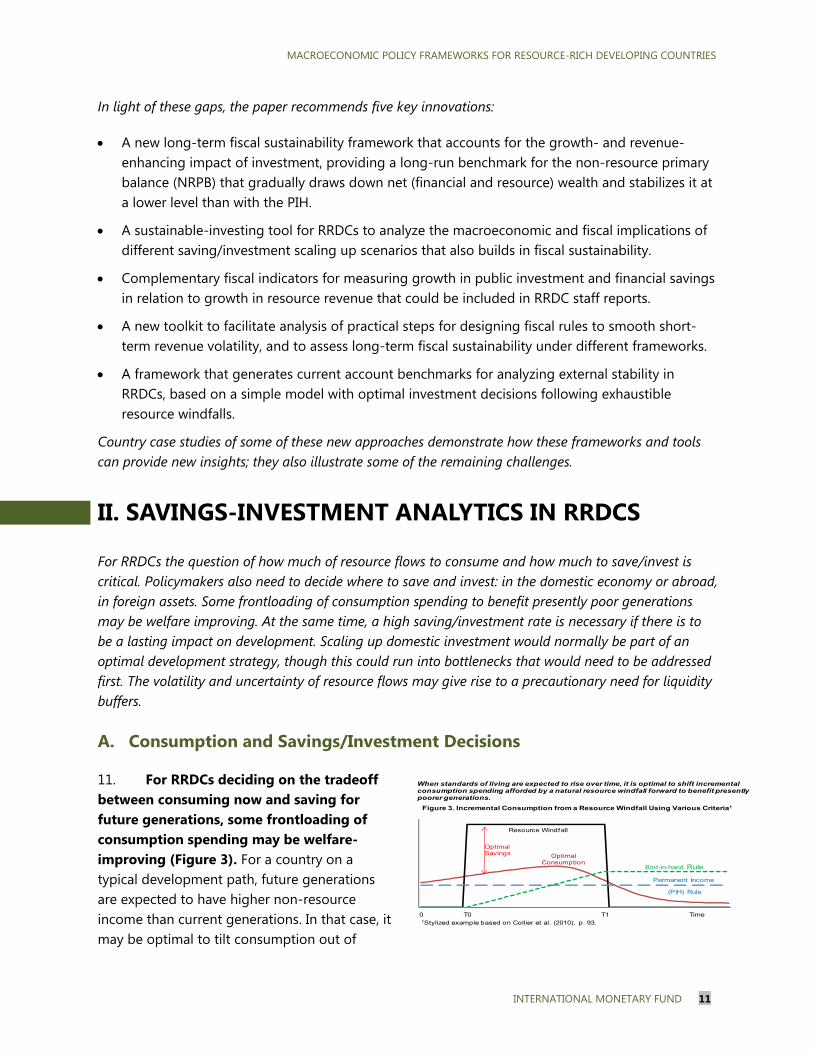
11. For RRDCs deciding on the tradeoff between consuming now and saving for future generations, some frontloading of consumption spending may be welfare-improving (Figure 3). For a country on a typical development path, future generations are expected to have higher non-resource income than current generations. In that case, it may be optimal to tilt consumption out of
0 T0 T1 Time
Resource Windfall
Optimal Consumption
Bird-in-hand Rule
Permanent Income
(PIH) Rule
1Stylized example based on Collier et al. (2010), p. 93.
Figure 3. Incremental Consumption from a Resource Windfall Using Various Criteria1
OptimalSavings
When standards of living are expected to rise over time, it is optimal to shift incremental consumption spending afforded by a natural resource windfall forward to benefit presently poorer generations.
MACROECONOMIC POLICY FRAMEWORKS FOR RESOURCE-RICH DEVELOPING COUNTRIES
12 INTERNATIONAL MONETARY FUND
resource inflows toward presently poor generations because an additional “unit” of consumption for the present generation has a higher marginal utility (added value).5 It follows that for such countries consumption rules based on the PIH (see Box 2) or on the bird-in-hand approach (which allows only interest income from already extracted resources to be consumed) would not be optimal. This is because neither strategy allows for frontloading of consumption spending: the first exhibits perfect consumption smoothing across generations, and the second actually backloads consumption spending.
12. To have a lasting impact on development, part of the natural resource revenues needs to be saved and invested. Other things being equal, optimal savings rates from resource windfall inflows are higher when returns on savings are higher and the resource windfall is relatively short-lived. Except for some extreme examples, for there to remain any permanent consumption increment the savings rate would approach 100 percent of resource flows as the time-to-depletion date nears (Venables, 2012). Intuitively, the income from saved resources gradually grows larger and will eventually fully cover consumption spending as resource flows dwindle, thus avoiding discrete (and undesired) jumps in the intertemporal consumption profile.6
5 See Collier et al. (2010) and van der Ploeg and Venables (2011). Consumption tilting might not improve welfare, however, if the resource windfall stimulates a splurge in wasteful spending or causes a breakdown in governance. In those cases, adverse spillovers could on balance reduce overall welfare. 6 This result also holds in a PIH-type setting in which consumption is constant and “surplus” resource inflows are saved as financial assets. By the final extraction period interest earnings would grow large enough to fully cover the consumption annuity, so that at the end savings equal (100 percent of) resource revenues.
Box 2. The Permanent Income Approach to Consuming/Saving Resource Wealth
The permanent income hypothesis (PIH) holds that a country sustains a constant consumption flow equal to the (implicit) return on the present value of future natural resource revenue. Once extraction is in full swing, much of the revenue is saved to build up a stock of non-resource assets. The return on these assets sustains the spending annuity after extraction has ended. Note that in principle the PIH is a consumption theory; it is silent on where to invest savings.
The PIH approach to consumption and saving of resource wealth leaves out real-world characteristics that matter for RRDCs. A pure PIH-based rule does not consider that current generations may be relatively poorer than future ones, which suggests that the marginal utility of a unit of consumption out of resource wealth is not the same across generations. Also, the framework assumes there are no liquidity constraints, which in an open economy is extended to an assumption of perfect capital mobility and thus a single interest rate on lending and borrowing. This premise underlies the theory that the timing of consumption (perfect smoothing) is independent of revenue flows. The single interest rate used to derive the annuity assumes away investment opportunities in domestic capital or incentives to pay off expensive debt; it is usually understood that any savings would be put into external financial assets because investing in domestic assets would drive down the domestic interest rate. This feature is not realistic for developing countries with shallow domestic markets and limited access to international capital markets. Finally, the PIH does not take into account the impact of uncertainty, which would mean initially higher savings.
MACROECONOMIC POLICY FRAMEWORKS FOR RESOURCE-RICH DEVELOPING COUNTRIES
INTERNATIONAL MONETARY FUND 13
13. Scaling up domestic investment financed by natural resource wealth is likely to be part of an optimal strategy for many RRDCs.7 The decision on how much to consume and save/invest needs to be considered in addition to the question of where to invest.8 For RRDCs, the optimal allocation is likely to have a significant domestic investment component. Capital-scarce developing countries could have high returns on capital, but limited (if any) access to international capital markets, and their own financial markets are relatively shallow. Of course, allowance would need to be made to cover maintenance and other recurrent costs for a higher domestic capital stock.
14. Boosting domestic spending may cause the economy to bump into short- to medium-term constraints.9 The increase in domestic demand (consumption and domestic investment) may run into supply bottlenecks that push up the price of non-traded goods. This, in turn, could create inflationary pressures and possibly also adversely impact the non-resource tradable sector (Dutch disease).10 The domestic output response may be delayed because of the need to install more “home-grown” (i.e., non-traded) capital (van der Ploeg and Venables, 2010). Plans to ramp up investment spending may also reveal bottlenecks at the microeconomic level: Gupta et al. (2011) found that weaknesses in project implementation, project selection, and budgeting lower the efficiency of investments.
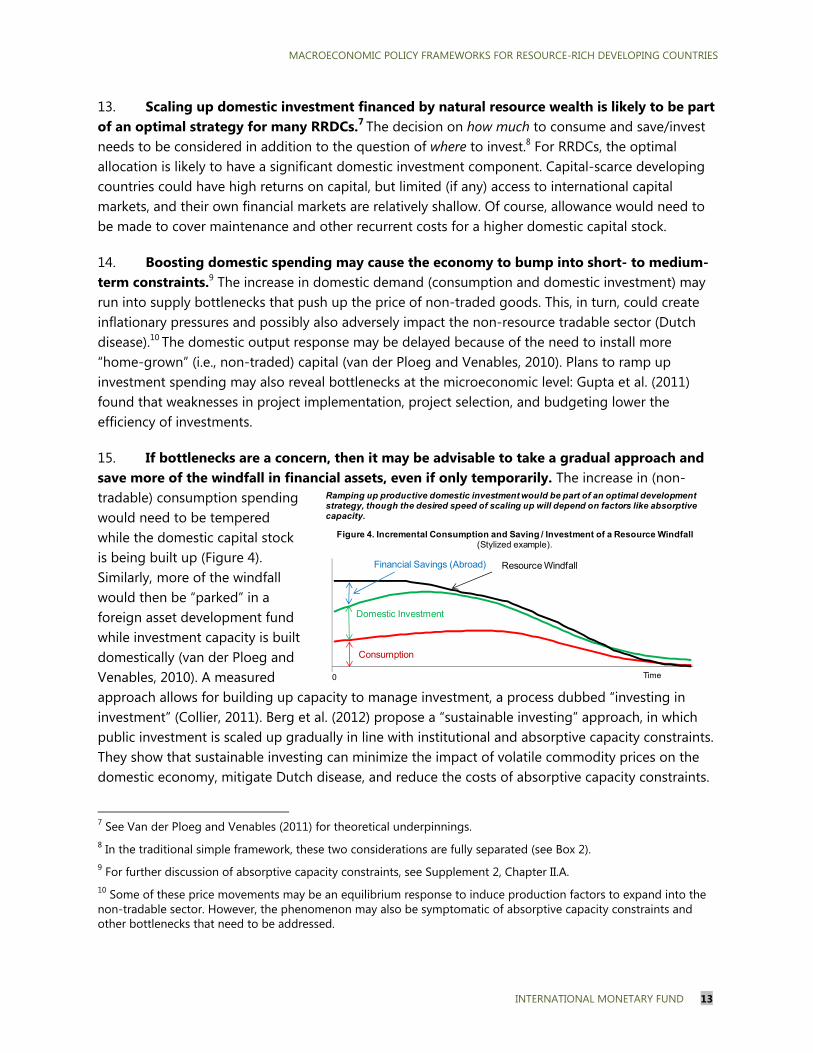
15. If bottlenecks are a concern, then it may be advisable to take a gradual approach and save more of the windfall in financial assets, even if only temporarily. The increase in (non-tradable) consumption spending would need to be tempered while the domestic capital stock is being built up (Figure 4). Similarly, more of the windfall would then be “parked” in a foreign asset development fund while investment capacity is built domestically (van der Ploeg and Venables, 2010). A measured approach allows for building up capacity to manage investment, a process dubbed “investing in investment” (Collier, 2011). Berg et al. (2012) propose a “sustainable investing” approach, in which public investment is scaled up gradually in line with institutional and absorptive capacity constraints. They show that sustainable investing can minimize the impact of volatile commodity prices on the domestic economy, mitigate Dutch disease, and reduce the costs of absorptive capacity constraints.
7 See Van der Ploeg and Venables (2011) for theoretical underpinnings. 8 In the traditional simple framework, these two considerations are fully separated (see Box 2). 9 For further discussion of absorptive capacity constraints, see Supplement 2, Chapter II.A. 10 Some of these price movements may be an equilibrium response to induce production factors to expand into the non-tradable sector. However, the phenomenon may also be symptomatic of absorptive capacity constraints and other bottlenecks that need to be addressed.
0
Resource Windfall
Consumption
Figure 4. Incremental Consumption and Saving / Investment of a Resource Windfall (Stylized example).
Domestic Investment
Financial Savings (Abroad)
Time
Ramping up productive domestic investment would be part of an optimal development strategy, though the desired speed of scaling up will depend on factors like absorptive capacity.
MACROECONOMIC POLICY FRAMEWORKS FOR RESOURCE-RICH DEVELOPING COUNTRIES
14 INTERNATIONAL MONETARY FUND
16. The importance to RRDCs of sound institutions cannot be overemphasized. Resource wealth can undermine institutions by promoting rent-seeking and corruption, risking dissipation of government savings and poor investment quality. Resource-rich countries with stronger economic and political institutions tend to have better macroeconomic and growth performance (van der Ploeg, 2011; Arezki and Brueckner, 2011; Arezki et al., 2011).
17. The political economy and institutional framework of RRDCs can pose severe challenges for effectively scaling up public investment. Among them are (i) multiple powerful groups pushing for redistribution of a windfall when institutions are weak (the “voracity effect”; Lane and Tornell, 1998, Arezki and Brueckner, 2010); (ii) pressures to earmark investments to the geographic areas where resources are extracted; and (iii) investments by oil or mining parastatals and public-private partnerships in resource-for-infrastructure deals that are not integrated into the budget or not fully transparent (Barma et al., 2012). Governments need some type of commitment mechanism (institutionalized savings rules) to support incentives for saving resource revenues; otherwise there is a possibility that their savings may merely transfer spending power to a bad successor (Collier, 2012). Making credible mechanisms such as fiscal responsibility laws or constitutional amendments is difficult where enforcement mechanisms, such as an independent judiciary, are weak. Thus, RRDC-tailored fiscal frameworks and improvements in the management of public investment need to be part of a continuous process of building up institutions and take into account political economy constraints and incentives.
18. Implications: Chapters III.A and V will elaborate how the principles discussed above can in practice be factored into macroeconomic frameworks, in the form of fiscal policy frameworks and rules and model-based tools.
B. Dealing with Uncertainty and Volatility
19. Swings in commodity revenue complicate macroeconomic management.11 Commodity price swings can be large, long-lasting (even permanent), and asymmetric.12 These characteristics make it hard to forecast prices and complicate the task of policy makers trying to assess whether a shock is permanent or temporary—hence whether to choose adjustment or smoothing. There may also be uncertainty and volatility in the volume of output and exports, possibly due to technical difficulties, accidents, strikes, sociopolitical unrest, and global demand shifts.
20. Revenue volatility creates a motive to save some of the resources for precautionary reasons. Prudent policymakers may wish to build up a liquidity fund in good times that can be tapped to smooth consumption spending when resource inflows fall short. The optimal size of such a liquidity buffer would be larger when revenue volatility is high and more persistent, and if society
11 For further discussion of the nature and implications of uncertainty and volatility, see Supplement, Chapter I.A.
12 For stylized facts, see Cashin et al. (2000, 2002), Cuddington and Jerrett (2008), Hamilton (2009), and IMF (2012d).
MACROECONOMIC POLICY FRAMEWORKS FOR RESOURCE-RICH DEVELOPING COUNTRIES
INTERNATIONAL MONETARY FUND 15
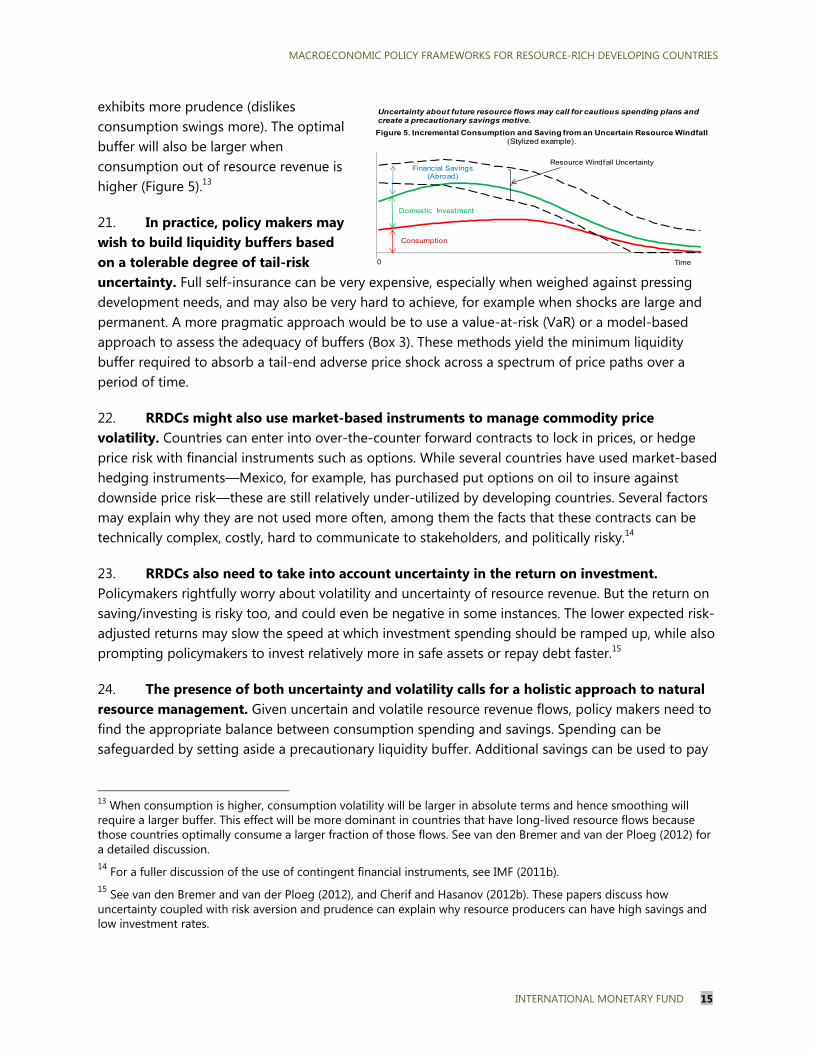
exhibits more prudence (dislikes consumption swings more). The optimal buffer will also be larger when consumption out of resource revenue is higher (Figure 5).13
21. In practice, policy makers may wish to build liquidity buffers based on a tolerable degree of tail-risk uncertainty. Full self-insurance can be very expensive, especially when weighed against pressing development needs, and may also be very hard to achieve, for example when shocks are large and permanent. A more pragmatic approach would be to use a value-at-risk (VaR) or a model-based approach to assess the adequacy of buffers (Box 3). These methods yield the minimum liquidity buffer required to absorb a tail-end adverse price shock across a spectrum of price paths over a period of time.
22. RRDCs might also use market-based instruments to manage commodity price volatility. Countries can enter into over-the-counter forward contracts to lock in prices, or hedge price risk with financial instruments such as options. While several countries have used market-based hedging instruments—Mexico, for example, has purchased put options on oil to insure against downside price risk—these are still relatively under-utilized by developing countries. Several factors may explain why they are not used more often, among them the facts that these contracts can be technically complex, costly, hard to communicate to stakeholders, and politically risky.14
23. RRDCs also need to take into account uncertainty in the return on investment. Policymakers rightfully worry about volatility and uncertainty of resource revenue. But the return on saving/investing is risky too, and could even be negative in some instances. The lower expected risk-adjusted returns may slow the speed at which investment spending should be ramped up, while also prompting policymakers to invest relatively more in safe assets or repay debt faster.15
24. The presence of both uncertainty and volatility calls for a holistic approach to natural resource management. Given uncertain and volatile resource revenue flows, policy makers need to find the appropriate balance between consumption spending and savings. Spending can be safeguarded by setting aside a precautionary liquidity buffer. Additional savings can be used to pay
13 When consumption is higher, consumption volatility will be larger in absolute terms and hence smoothing will require a larger buffer. This effect will be more dominant in countries that have long-lived resource flows because those countries optimally consume a larger fraction of those flows. See van den Bremer and van der Ploeg (2012) for a detailed discussion. 14 For a fuller discussion of the use of contingent financial instruments, see IMF (2011b). 15 See van den Bremer and van der Ploeg (2012), and Cherif and Hasanov (2012b). These papers discuss how uncertainty coupled with risk aversion and prudence can explain why resource producers can have high savings and low investment rates.
0
Resource Windfall Uncertainty
Consumption
Figure 5. Incremental Consumption and Saving from an Uncertain Resource Windfall (Stylized example).
Domestic Investment
Financial Savings (Abroad)
Time
Uncertainty about future resource flows may call for cautious spending plans and create a precautionary savings motive.
MACROECONOMIC POLICY FRAMEWORKS FOR RESOURCE-RICH DEVELOPING COUNTRIES
16 INTERNATIONAL MONETARY FUND
down debt, ramp up domestic investment spending, or invest in external financial assets for future generations—for example, when absorptive capacity constraints make it impossible to invest faster.
Box 3. Approaches to Assessing the Adequate Size of a RRDC Stabilization Buffer
Value-at-Risk and model-based approaches can be used to assess whether a stabilization fund under a given fiscal framework can provide a sufficient liquidity buffer to protect spending.
The Value-at-Risk (VaR) approach estimates the minimum required size of a stabilization buffer that can absorb tail risk in resource revenue volatility, to ensure that—with a given degree of confidence—the buffer is unlikely to be fully depleted (thus not require spending cuts) over the forecast horizon.
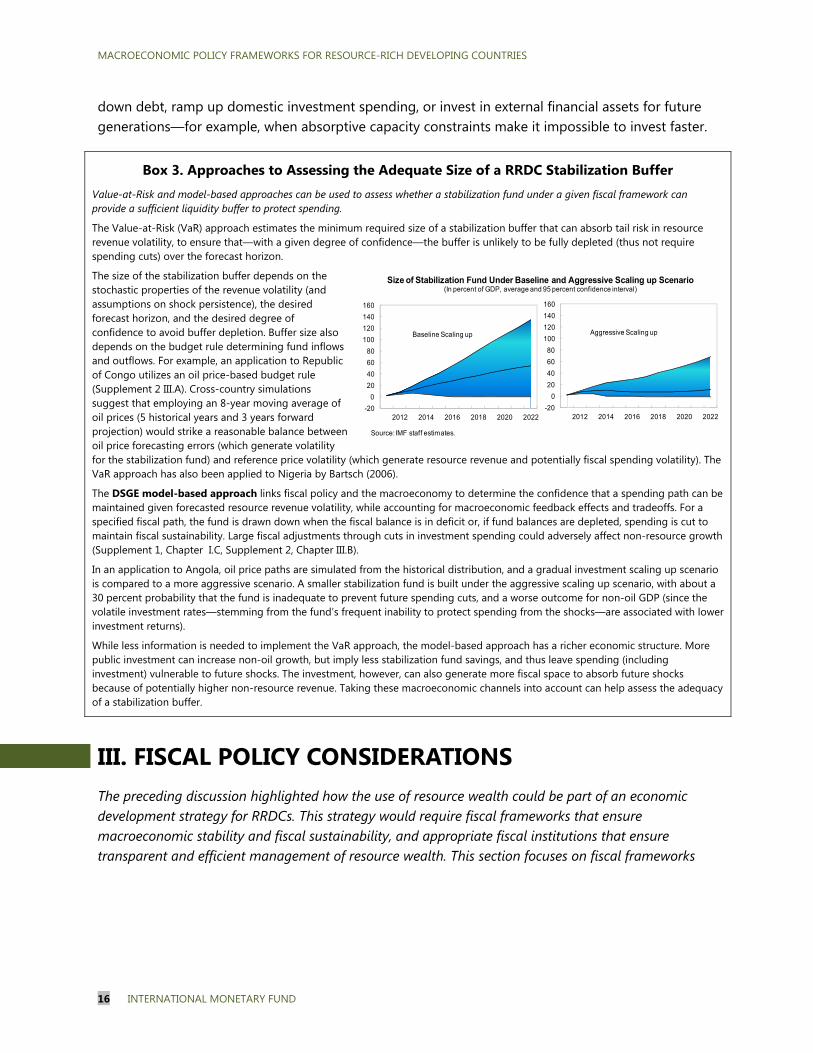
The size of the stabilization buffer depends on the stochastic properties of the revenue volatility (and assumptions on shock persistence), the desired forecast horizon, and the desired degree of confidence to avoid buffer depletion. Buffer size also depends on the budget rule determining fund inflows and outflows. For example, an application to Republic of Congo utilizes an oil price-based budget rule (Supplement 2 III.A). Cross-country simulations suggest that employing an 8-year moving average of oil prices (5 historical years and 3 years forward projection) would strike a reasonable balance between oil price forecasting errors (which generate volatility for the stabilization fund) and reference price volatility (which generate resource revenue and potentially fiscal spending volatility). The VaR approach has also been applied to Nigeria by Bartsch (2006).
The DSGE model-based approach links fiscal policy and the macroeconomy to determine the confidence that a spending path can be maintained given forecasted resource revenue volatility, while accounting for macroeconomic feedback effects and tradeoffs. For a specified fiscal path, the fund is drawn down when the fiscal balance is in deficit or, if fund balances are depleted, spending is cut to maintain fiscal sustainability. Large fiscal adjustments through cuts in investment spending could adversely affect non-resource growth (Supplement 1, Chapter I.C, Supplement 2, Chapter III.B).
In an application to Angola, oil price paths are simulated from the historical distribution, and a gradual investment scaling up scenario is compared to a more aggressive scenario. A smaller stabilization fund is built under the aggressive scaling up scenario, with about a 30 percent probability that the fund is inadequate to prevent future spending cuts, and a worse outcome for non-oil GDP (since the volatile investment rates—stemming from the fund’s frequent inability to protect spending from the shocks—are associated with lower investment returns).
While less information is needed to implement the VaR approach, the model-based approach has a richer economic structure. More public investment can increase non-oil growth, but imply less stabilization fund savings, and thus leave spending (including investment) vulnerable to future shocks. The investment, however, can also generate more fiscal space to absorb future shocks because of potentially higher non-resource revenue. Taking these macroeconomic channels into account can help assess the adequacy of a stabilization buffer.
III. FISCAL POLICY CONSIDERATIONS The preceding discussion highlighted how the use of resource wealth could be part of an economic development strategy for RRDCs. This strategy would require fiscal frameworks that ensure macroeconomic stability and fiscal sustainability, and appropriate fiscal institutions that ensure transparent and efficient management of resource wealth. This section focuses on fiscal frameworks
-20
0
20
40
60
80
100
120
140
160
2012 2014 2016 2018 2020 2022
Baseline Scaling up
-20
0
20
40
60
80
100
120
140
160
2012 2014 2016 2018 2020 2022
Aggressive Scaling up
Size of Stabilization Fund Under Baseline and Aggressive Scaling up Scenario(In percent of GDP, average and 95 percent confidence interval)
Source: IMF staff estimates.

MACROECONOMIC POLICY FRAMEWORKS FOR RESOURCE-RICH DEVELOPING COUNTRIES
INTERNATIONAL MONETARY FUND 17
and institutions relevant for RRDCs. The issues relating to fiscal regimes for extractive industries are elaborated in the related Board paper.16
25. As in other countries, a fiscal framework for RRDCs needs to address issues of demand management and sustainability. Hence, indicators are needed in order to assess: (i) the short-term fiscal stance (e.g., whether an expansionary fiscal policy is leading to inflation and larger current account deficits) and (ii) solvency (i.e., the government’s capacity to meet the intertemporal budget constraint). Traditional fiscal indicators are often not adequate to guide this type of analysis; RRDCs should therefore focus on a broader set of indicators, paying particular attention to the NRPB.17
26. In RRDCs these issues are further complicated by price volatility and the exhaustibility of natural resources. Price volatility complicates fiscal planning because it leads to revenue volatility and requires the adoption of certain fiscal rules to limit procyclicality (by delinking expenditures from resource revenues). Exhaustibility raises issues of sustainability and intergenerational equity and calls for smoothing government consumption over time, ensuring balanced growth and avoiding the need for massive fiscal adjustment once resource wealth has been depleted. The relative importance of these objectives is likely to vary by country circumstances, such as the degree of resource dependence and the reserve horizon,18 as discussed in section III.A.
27. The fiscal framework also needs to be supported by appropriate fiscal institutions, including those that affect the capacity to undertake long-term revenue forecasts, establish a medium-term orientation of the budget, implement quality public investment projects, and manage special institutions, such as natural resource funds. These issues are discussed in sections III.B and III.C.19
28. This chapter also provides a toolkit for staff and country authorities to analyze these issues. Topics covered by the toolkit include the practical steps required to assess long-term fiscal sustainability and in smoothing out short-term volatility, as well as the tradeoffs involved in choosing specific fiscal targets and different levels of net wealth.20 These issues are analyzed through a stylized 16 See IMF (2012c). 17 The NRPB is defined as non-resource revenues minus primary expenditures (i.e., excluding net interest payments and income). Resource revenues and expenditures associated with development of the resource sector are also excluded. 18 The reserve horizon refers to the expected life of resource reserves given projected production levels. A common threshold for classifying countries as having a long reserve horizon is 30–35 years, or about one generation. A country can be considered resource-dependent when it derives about 20 percent of its revenues from natural resources. Having an appropriate rule of thumb is important. A lower share of resource revenues in total revenues would probably not justify setting up special institutional arrangements to manage fiscal policy. These thresholds have been used in the IMF’s guide to resource revenue transparency (IMF, 2008) and other policy papers. This being said, while such thresholds are useful, there is a continuum of country conditions in practice. 19 For good practices and the challenges relating to some of these issues, see Supplement 1, Chapter III, which presents case studies for Botswana, Chile, Timor Leste, and Mongolia. 20 Supplement 2, Chapter I.B provides an Excel-based template that can be used to simulate the effects of different fiscal rules to help inform choices of various options.

MACROECONOMIC POLICY FRAMEWORKS FOR RESOURCE-RICH DEVELOPING COUNTRIES
18 INTERNATIONAL MONETARY FUND
case in Supplement 2, Chapter I.B. A second phase of the project after this Board paper will involve refining the templates and adapting them to specific country circumstances. This will require more in-depth discussion with country authorities and testing the proposed approach/methodologies with pilot cases.
A. Analytical Framework
29. The fiscal framework for RRDCs should set out additional indicators on resource use, fiscal rules to manage price volatility in the short term, and should establish fiscal sustainability benchmarks. The importance of exhaustibility issues is a function of the length of the reserve horizon. In countries, with long reserve horizons, the main focus in the short to medium term should be on managing revenue volatility and avoiding fiscal procyclicality. In countries with shorter reserve horizons, having a benchmark for fiscal sustainability that takes into account resource exhaustibility is also a key concern for fiscal policy formulation. As elaborated below, the sustainability benchmark serves as an anchor for the medium- to long-term fiscal framework while smoothing of resource revenues through different mechanisms can help mitigate externally driven volatility in the short to medium term.
30. For RRDCs with short reserve horizons, the key fiscal indicator to assess the fiscal stance is the non-resource primary balance (NRPB).21 As a measure of the macrofiscal stance, the NRPB22 identifies the impact of government operations on domestic demand, since resource revenues typically originate abroad.23 A higher non-resource primary deficit would indicate an expansionary fiscal stance.24 Setting fiscal policy on the basis of this indicator can help delink fiscal
21 For a detailed analysis of the importance of non-resource balances in RRDCs, see Barnett and Ossowski (2003) and Baunsgaard et al. (2012). A key advantage of using the non-resource primary balance, rather than the non-resource overall balance, is that it better assesses the fiscal policy stance by excluding interest payments, which in many resource countries go to non-residents and therefore do not affect the disposable income of residents. However, the non-resource overall balance could supplement this analysis for countries where interest payments related to domestic debt represent a large share of the total interest bill. Another important advantage of the non-resource primary balance is that it facilitates analysis of long-term sustainability issues, particularly in countries with limited resources. Other complementary fiscal indicators are presented in Supplement 2, Chapter I.B. 22 Given the large volatility of resource GDP (which spills over into overall GDP), indicators and targets should ideally be expressed in terms of non-resource GDP. Otherwise, particularly in countries where resource GDP is a large fraction of total GDP, the authorities would have to introduce a fiscal adjustment in response to (large) declines in resource prices. 23 See Medas and Zhakharova (2009). 24 The impact on the external current account of a loosening of the NRPB financed by additional resource revenues is similar to an externally-financed increase in the overall deficit in a non-resource-rich economy, and may give rise to Dutch disease effects. This is similar to the “absorption” framework proposed by Berg et al. (2007) in which an increase in aid is used to finance a widening of the external current account. In this context, the macroeconomic impact of a widening of the NRPB will be a function of the degree to which the additional resource revenues are used to finance public spending with high import content. This is more likely to be the case to the extent that resource revenues are used to finance an increase in public investment, rather than government consumption (e.g., wages and salaries), which tends to fall on non-tradable goods. If resource revenues are spent domestically and fully absorbed, the non-resource primary deficit and the non-resource current account will widen directly. The impact on inflation will
(continued)

MACROECONOMIC POLICY FRAMEWORKS FOR RESOURCE-RICH DEVELOPING COUNTRIES
INTERNATIONAL MONETARY FUND 19
policy from the volatility of resource revenues and, as explained below, facilitates an explicit link to the sustainability framework for countries with limited reserve horizons (see also Supplement 2, Chapter I.B). By contrast, the overall fiscal balance can shift abruptly as a result of the volatility of natural resource prices. A massive fiscal expansion would not be detected by the overall balance after a spike in natural resource prices and revenues.
31. Targeting a “structural” primary balance—defined as the primary balance excluding the cyclical component of resource revenues25—is an important complement to the NRPB in RRDCs with long reserve horizons. In these countries, resource revenues can be decomposed into a structural and a cyclical component using various approaches, including a price-based smoothing rule as elaborated below. The structural primary balance is equal to the NRPB plus the structural component of resource revenues. In this manner, the structural primary balance target could be set to ensure a sustainable fiscal policy framework, and the smoothing rule would delink expenditures from externally-driven volatility in commodity prices. The structural balance approach allows for the sustainability of fiscal policy to be assessed in a similar manner as non-resource-rich countries.
Countries with Relatively Short Reserve Horizons
32. Countries with relatively short reserve horizons should rely on the NRPB as a fiscal anchor. This is the case for two reasons. First, countries that smooth the overall balance rather than the NRPB would need to adjust spending abruptly when resource revenues are exhausted, which would have disruptive effects on economic activity and the provision of public services. The second reason relates to sustainability issues that would arise if the NRPB were not used as the fiscal anchor. With forward-looking markets, pressures in countries running a large non-resource primary deficit could arise well ahead of the time when resources are actually exhausted. Preventing this outcome is best achieved through an NRPB rule. As elaborated below, such a rule is usually anchored around a sustainability benchmark but it can also be used in combination with an expenditure growth or price-based smoothing rule to manage short-term volatility.
Non-resource Primary Balance Rules
33. An NRPB is particularly appropriate in countries with shorter reserve horizons where issues of exhaustibility should figure more prominently. The target for the NRPB can be set in a variety of ways. As noted in Chapter II, in the traditional PIH framework, preservation of wealth requires that the government consumes each year the implicit real return on financial wealth already accumulated and the implicit return on the net present value of future resource revenues. While the PIH approach is a model for the optimal path for consumption, the Fund has typically made a
be smaller since the additional resources will be spent on imports. If resource revenues are spent but not absorbed (i.e., without a change in the non-resource current account), the impact on inflation will be higher. 25 For simplicity, we do not discuss adjusting the primary balance for non-resource economic cycles that result in output gap fluctuations. See IMF (2009) for a discussion of more broadly defined structural balance rules. In practice, cyclical adjustments and potential output are difficult to compute in developing countries where GDP is subject to substantial volatility.

MACROECONOMIC POLICY FRAMEWORKS FOR RESOURCE-RICH DEVELOPING COUNTRIES
20 INTERNATIONAL MONETARY FUND
simplifying assumption that equates consumption with total spending (IMF, 2012). In practice, the NRPB rule in the standard PIH approach could be set in two possible ways:
Consistent with the “bird-in-hand” approach, the NRPB would be set at a level that is equal to the real rate of return on the accumulated financial assets.
The other approach is consistent with the traditional PIH. The NRPB would be set at a level that is consistent with both accumulated and expected financial wealth, basically treating resource wealth in the ground as “virtual” financial wealth and computing the present value by assuming an implicit rate of return. This implies calculation of the value of the resources in the ground and the associated resource revenues that will accrue to the government in the future (see Supplement 2, Chapter I.B).
34. As noted in Chapter II, the PIH approach is excessively restrictive for RRDCs and alternative frameworks for calibrating the path of NRPBs are needed. This can be achieved through alternative sustainability frameworks—as discussed below—which provide greater flexibility to accommodate a scaling up of public investment relative to the PIH approach (see Supplement 2, Chapter I.B). Unlike the PIH, such approaches involve determining optimal paths for public investment and the NRPBs based on absorptive capacity and smoothing government consumption depending on the country’s cyclical position.26 This includes an analysis of inflation, real exchange rates and interest rates, to ensure that the fiscal stance is consistent with desired demand management. Specialized models (e.g., dynamic stochastic general equilibrium models, financial programming), which are already being used by some RRDCs, can help support this analysis. The “FARI” cash flow model developed by the IMF’s Fiscal Affairs Department (FAD) can also be used to forecast resource revenues (see Supplement 2, Chapter II.C, Box 2 and Daniel et al., 2010). Adopting a fiscal framework based on an NRPB rule also mitigates short-run volatility since resource revenues are fully excluded from the target path.
35. These alternative sustainability approaches should aim for a relatively smooth path of current spending to avoid potentially abrupt adjustments when resource revenues are exhausted. Anchoring the fiscal framework to a sustainable path of NRPBs would help ensure this outcome. In this way, current expenditure could increase in a sustainable manner relative to the PIH baseline so that future adjustment would not require a consolidation in government consumption, which may be economically disruptive and adversely affect priority spending on socially sensitive programs.
Countries with Long Reserve Horizons
36. Though for this group of countries exhaustibility is not the primary concern, they are still faced with cyclical and sustainability issues. Cyclical issues arise when resource revenues induce spending increases, generating a fiscal impulse as measured by changes in the NRPB that is 26 Public investment and current spending are equivalent to the acquisition of non-financial assets and gross expenses, respectively, in the GFSM 2001 framework.
MACROECONOMIC POLICY FRAMEWORKS FOR RESOURCE-RICH DEVELOPING COUNTRIES
INTERNATIONAL MONETARY FUND 21
large in relation to existing supply (potential output). This occurs when expenditure patterns follow natural resource prices closely, thus reinforcing economic cycles. Sustainability issues arise when these countries spend more than their expected long-term resource revenues. This can occur when they extrapolate temporary increases in prices and hence “misprice” their resource wealth and/or fail to maintain appropriate fiscal buffers to sustain current spending levels.27 All this can lead to the boom-bust cycles so often seen in resource-rich countries. A useful approach to address sustainability issues in these countries is to target the structural primary balance.
Structural Primary Balance Rules Based on Price Smoothing (Price-based rules)
37. A price-based smoothing rule is a suitable approach to compute structural resource revenues.28 This is the case for two reasons:
To the extent that a country derives an increasingly large part of its fiscal revenues from natural resources, excluding resource revenues from fiscal targets (as an NRPB rule would do) will be less intuitive for policy makers and more questionable economically since more economic activity would be excluded from fiscal indicators. An NRPB rule can also create the misperception of a worsening fiscal situation when countries expand their capital budgets in response to rising resource revenues, even when the scaling up of investment is consistent with macroeconomic stability.
A price-based rule can mitigate the transmission of externally-driven resource price volatility, which can result in a procyclical fiscal stance. A price-based smoothing rule does not offer a direct link to sustainability benchmarks but it can help support solvency through “prudent” forecasting of structural revenues by deliberately under-projecting the sustainable resource price.29
38. A key decision is the reference price used to compute structural resource revenues. Two approaches are possible: the reference or benchmark commodity price could be set by using an automatic formula or by an independent committee. In practice, the former approach is more common. Chile is an exception where an independent committee of experts makes a judgment on medium- to long-term reference prices. In most developing countries, however, limited institutional capacity and lack of a deep pool of independent experts suggest that price-based rules should rely on automatic formulas. Both approaches can bolster credibility and protect fiscal policy from the pressures of the political cycle.
27 The shorter the reserve horizon, the more important are the exhaustibility and intergenerational issues as discussed in Supplement 2, Chapter I.B. 28 Consideration of a price-based rule could also reflect the underlying fiscal regime for the extractive industry. For example, rent-based taxes can track resource prices closely. Further, there could be a direct link between the level of resource revenues and volatility stemming from the design of the fiscal regime. See IMF (2012c) for an elaboration. 29 Resource revenues are the main channel for volatile resource revenues to impact the fiscal stance. However, domestic fuel subsidies are almost entirely procyclical with resource revenues. A forthcoming FAD paper will focus on the reform of domestic energy subsidies in more detail.
MACROECONOMIC POLICY FRAMEWORKS FOR RESOURCE-RICH DEVELOPING COUNTRIES
22 INTERNATIONAL MONETARY FUND
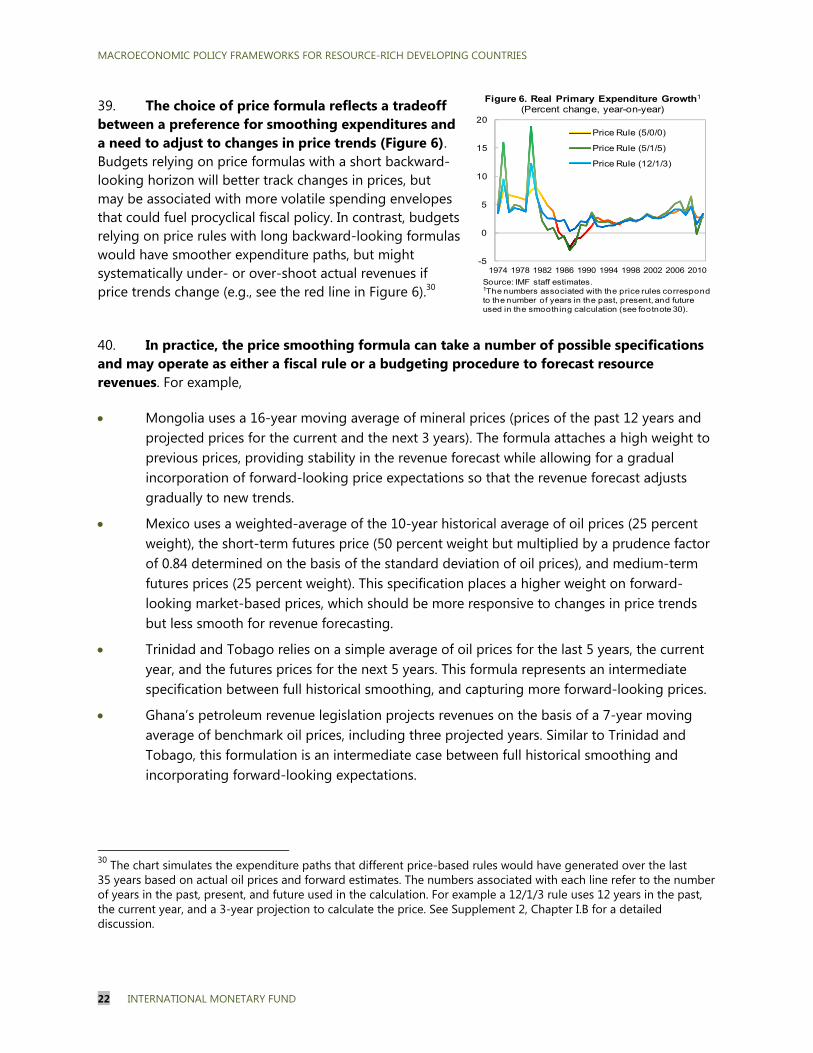
39. The choice of price formula reflects a tradeoff between a preference for smoothing expenditures and a need to adjust to changes in price trends (Figure 6). Budgets relying on price formulas with a short backward-looking horizon will better track changes in prices, but may be associated with more volatile spending envelopes that could fuel procyclical fiscal policy. In contrast, budgets relying on price rules with long backward-looking formulas would have smoother expenditure paths, but might systematically under- or over-shoot actual revenues if price trends change (e.g., see the red line in Figure 6).30
40. In practice, the price smoothing formula can take a number of possible specifications and may operate as either a fiscal rule or a budgeting procedure to forecast resource revenues. For example,
Mongolia uses a 16-year moving average of mineral prices (prices of the past 12 years and projected prices for the current and the next 3 years). The formula attaches a high weight to previous prices, providing stability in the revenue forecast while allowing for a gradual incorporation of forward-looking price expectations so that the revenue forecast adjusts gradually to new trends.
Mexico uses a weighted-average of the 10-year historical average of oil prices (25 percent weight), the short-term futures price (50 percent weight but multiplied by a prudence factor of 0.84 determined on the basis of the standard deviation of oil prices), and medium-term futures prices (25 percent weight). This specification places a higher weight on forward-looking market-based prices, which should be more responsive to changes in price trends but less smooth for revenue forecasting.
Trinidad and Tobago relies on a simple average of oil prices for the last 5 years, the current year, and the futures prices for the next 5 years. This formula represents an intermediate specification between full historical smoothing, and capturing more forward-looking prices.
Ghana’s petroleum revenue legislation projects revenues on the basis of a 7-year moving average of benchmark oil prices, including three projected years. Similar to Trinidad and Tobago, this formulation is an intermediate case between full historical smoothing and incorporating forward-looking expectations.
30 The chart simulates the expenditure paths that different price-based rules would have generated over the last 35 years based on actual oil prices and forward estimates. The numbers associated with each line refer to the number of years in the past, present, and future used in the calculation. For example a 12/1/3 rule uses 12 years in the past, the current year, and a 3-year projection to calculate the price. See Supplement 2, Chapter I.B for a detailed discussion.
-5
0
5
10
15
20
1974 1978 1982 1986 1990 1994 1998 2002 2006 2010
Price Rule (5/0/0)
Price Rule (5/1/5)
Price Rule (12/1/3)
Figure 6. Real Primary Expenditure Growth1
(Percent change, year-on-year)
Source: IMF staff estimates.1The numbers associated with the price rules correspond to the number of years in the past, present, and future used in the smoothing calculation (see footnote 30).
MACROECONOMIC POLICY FRAMEWORKS FOR RESOURCE-RICH DEVELOPING COUNTRIES
INTERNATIONAL MONETARY FUND 23
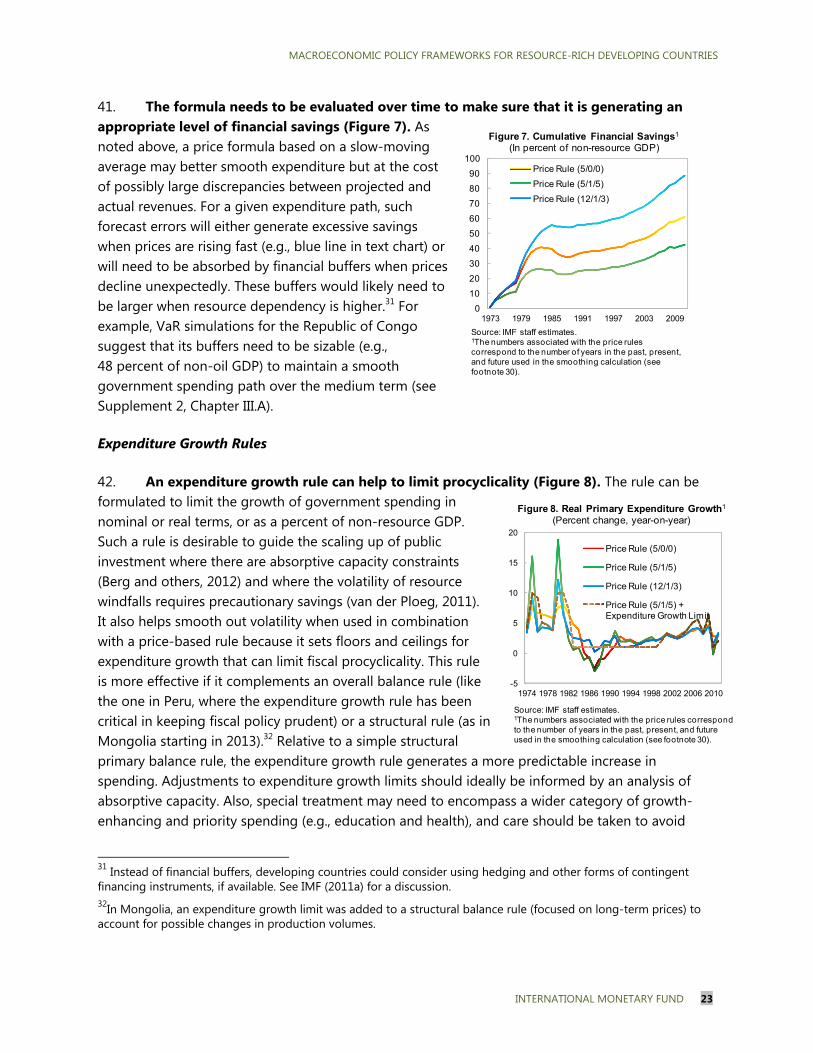
41. The formula needs to be evaluated over time to make sure that it is generating an appropriate level of financial savings (Figure 7). As noted above, a price formula based on a slow-moving average may better smooth expenditure but at the cost of possibly large discrepancies between projected and actual revenues. For a given expenditure path, such forecast errors will either generate excessive savings when prices are rising fast (e.g., blue line in text chart) or will need to be absorbed by financial buffers when prices decline unexpectedly. These buffers would likely need to be larger when resource dependency is higher.31 For example, VaR simulations for the Republic of Congo suggest that its buffers need to be sizable (e.g., 48 percent of non-oil GDP) to maintain a smooth government spending path over the medium term (see Supplement 2, Chapter III.A).
Expenditure Growth Rules
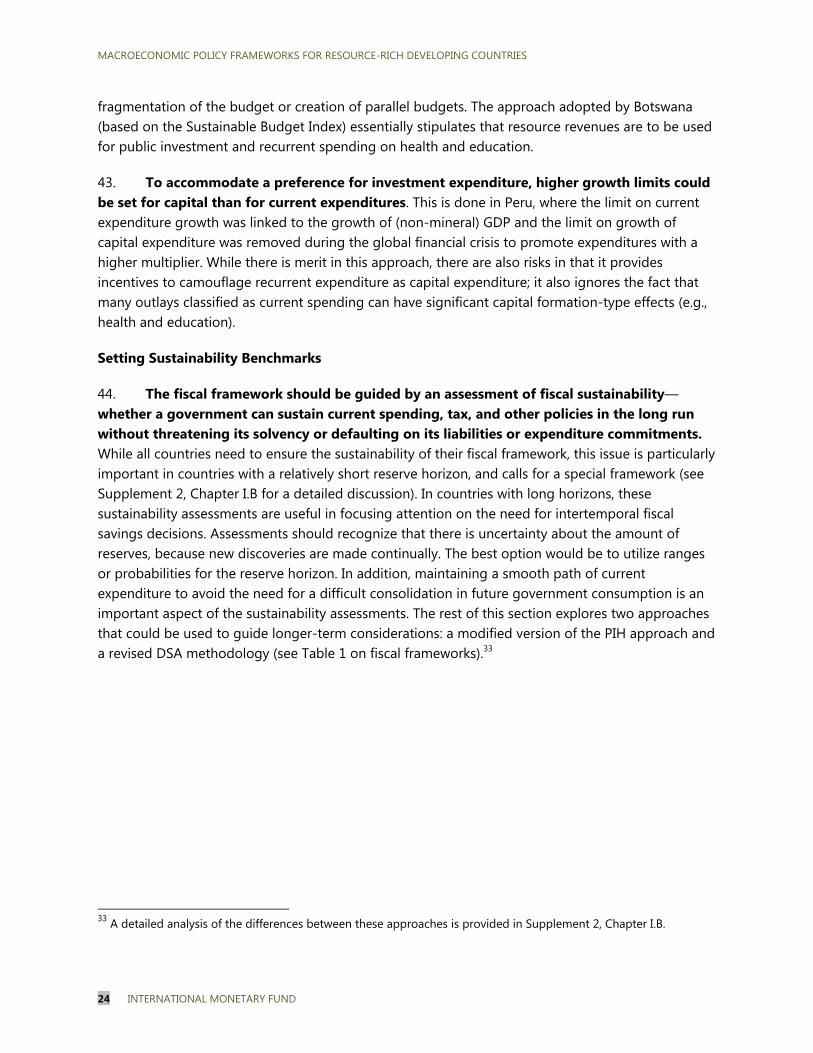
42. An expenditure growth rule can help to limit procyclicality (Figure 8). The rule can be formulated to limit the growth of government spending in nominal or real terms, or as a percent of non-resource GDP. Such a rule is desirable to guide the scaling up of public investment where there are absorptive capacity constraints (Berg and others, 2012) and where the volatility of resource windfalls requires precautionary savings (van der Ploeg, 2011). It also helps smooth out volatility when used in combination with a price-based rule because it sets floors and ceilings for expenditure growth that can limit fiscal procyclicality. This rule is more effective if it complements an overall balance rule (like the one in Peru, where the expenditure growth rule has been critical in keeping fiscal policy prudent) or a structural rule (as in Mongolia starting in 2013).32 Relative to a simple structural primary balance rule, the expenditure growth rule generates a more predictable increase in spending. Adjustments to expenditure growth limits should ideally be informed by an analysis of absorptive capacity. Also, special treatment may need to encompass a wider category of growth-enhancing and priority spending (e.g., education and health), and care should be taken to avoid
31 Instead of financial buffers, developing countries could consider using hedging and other forms of contingent financing instruments, if available. See IMF (2011a) for a discussion. 32In Mongolia, an expenditure growth limit was added to a structural balance rule (focused on long-term prices) to account for possible changes in production volumes.
0
10
20
30
40
50
60
70
80
90
100
1973 1979 1985 1991 1997 2003 2009
Price Rule (5/0/0)
Price Rule (5/1/5)
Price Rule (12/1/3)
Figure 7. Cumulative Financial Savings1
(In percent of non-resource GDP)
Source: IMF staff estimates.1The numbers associated with the price rules correspond to the number of years in the past, present, and future used in the smoothing calculation (see footnote 30).
-5
0
5
10
15
20
1974 1978 1982 1986 1990 1994 1998 2002 2006 2010
Price Rule (5/0/0)
Price Rule (5/1/5)
Price Rule (12/1/3)
Price Rule (5/1/5) + Expenditure Growth Limit
Figure 8. Real Primary Expenditure Growth1
(Percent change, year-on-year)
Source: IMF staff estimates.1The numbers associated with the price rules correspond to the number of years in the past, present, and future used in the smoothing calculation (see footnote 30).
MACROECONOMIC POLICY FRAMEWORKS FOR RESOURCE-RICH DEVELOPING COUNTRIES
24 INTERNATIONAL MONETARY FUND
fragmentation of the budget or creation of parallel budgets. The approach adopted by Botswana (based on the Sustainable Budget Index) essentially stipulates that resource revenues are to be used for public investment and recurrent spending on health and education.
43. To accommodate a preference for investment expenditure, higher growth limits could be set for capital than for current expenditures. This is done in Peru, where the limit on current expenditure growth was linked to the growth of (non-mineral) GDP and the limit on growth of capital expenditure was removed during the global financial crisis to promote expenditures with a higher multiplier. While there is merit in this approach, there are also risks in that it provides incentives to camouflage recurrent expenditure as capital expenditure; it also ignores the fact that many outlays classified as current spending can have significant capital formation-type effects (e.g., health and education).
Setting Sustainability Benchmarks
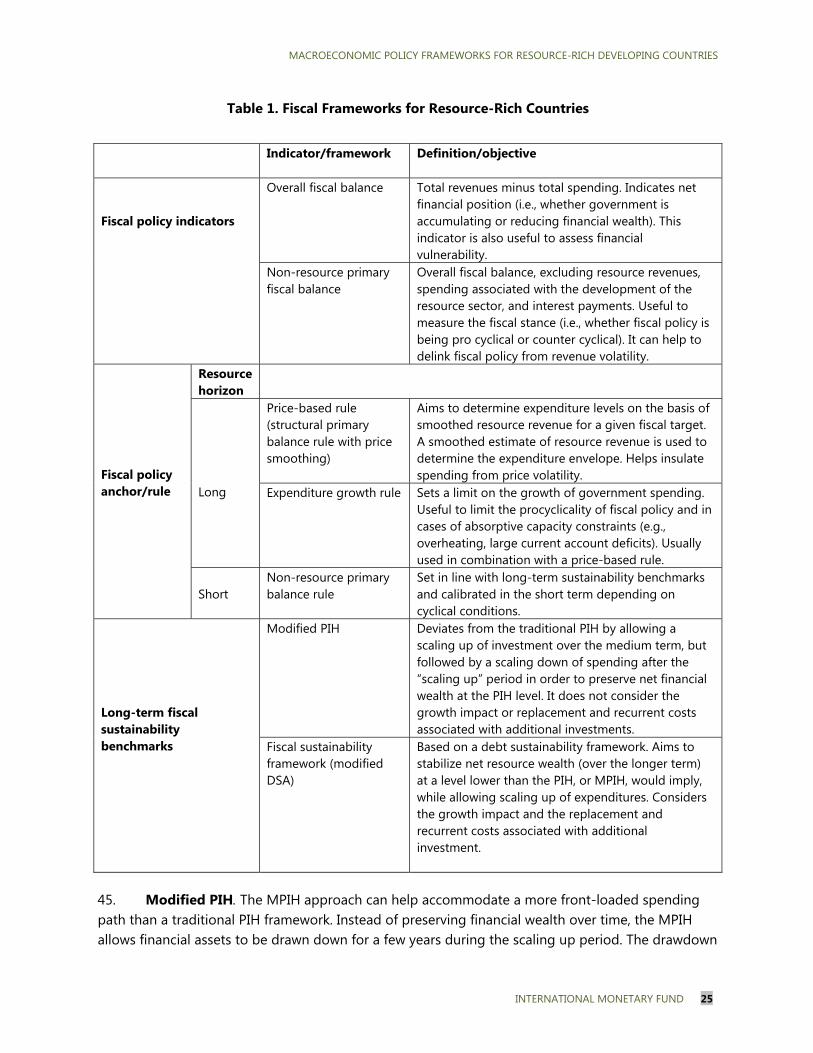
44. The fiscal framework should be guided by an assessment of fiscal sustainability—whether a government can sustain current spending, tax, and other policies in the long run without threatening its solvency or defaulting on its liabilities or expenditure commitments. While all countries need to ensure the sustainability of their fiscal framework, this issue is particularly important in countries with a relatively short reserve horizon, and calls for a special framework (see Supplement 2, Chapter I.B for a detailed discussion). In countries with long horizons, these sustainability assessments are useful in focusing attention on the need for intertemporal fiscal savings decisions. Assessments should recognize that there is uncertainty about the amount of reserves, because new discoveries are made continually. The best option would be to utilize ranges or probabilities for the reserve horizon. In addition, maintaining a smooth path of current expenditure to avoid the need for a difficult consolidation in future government consumption is an important aspect of the sustainability assessments. The rest of this section explores two approaches that could be used to guide longer-term considerations: a modified version of the PIH approach and a revised DSA methodology (see Table 1 on fiscal frameworks).33
33 A detailed analysis of the differences between these approaches is provided in Supplement 2, Chapter I.B.
MACROECONOMIC POLICY FRAMEWORKS FOR RESOURCE-RICH DEVELOPING COUNTRIES
INTERNATIONAL MONETARY FUND 25
Table 1. Fiscal Frameworks for Resource-Rich Countries
Indicator/framework Definition/objective
Fiscal policy indicators
Overall fiscal balance
Total revenues minus total spending. Indicates net financial position (i.e., whether government is accumulating or reducing financial wealth). This indicator is also useful to assess financial vulnerability.
Non-resource primary fiscal balance
Overall fiscal balance, excluding resource revenues, spending associated with the development of the resource sector, and interest payments. Useful to measure the fiscal stance (i.e., whether fiscal policy is being pro cyclical or counter cyclical). It can help to delink fiscal policy from revenue volatility.
Fiscal policy anchor/rule
Resource horizon
Long
Price-based rule (structural primary balance rule with price smoothing)
Aims to determine expenditure levels on the basis of smoothed resource revenue for a given fiscal target. A smoothed estimate of resource revenue is used to determine the expenditure envelope. Helps insulate spending from price volatility.
Expenditure growth rule Sets a limit on the growth of government spending. Useful to limit the procyclicality of fiscal policy and in cases of absorptive capacity constraints (e.g., overheating, large current account deficits). Usually used in combination with a price-based rule.
Short
Non-resource primary balance rule
Set in line with long-term sustainability benchmarks and calibrated in the short term depending on cyclical conditions.
Long-term fiscal sustainability benchmarks
Modified PIH Deviates from the traditional PIH by allowing a scaling up of investment over the medium term, but followed by a scaling down of spending after the “scaling up” period in order to preserve net financial wealth at the PIH level. It does not consider the growth impact or replacement and recurrent costs associated with additional investments.
Fiscal sustainability framework (modified DSA)
Based on a debt sustainability framework. Aims to stabilize net resource wealth (over the longer term) at a level lower than the PIH, or MPIH, would imply, while allowing scaling up of expenditures. Considers the growth impact and the replacement and recurrent costs associated with additional investment.
45. Modified PIH. The MPIH approach can help accommodate a more front-loaded spending path than a traditional PIH framework. Instead of preserving financial wealth over time, the MPIH allows financial assets to be drawn down for a few years during the scaling up period. The drawdown
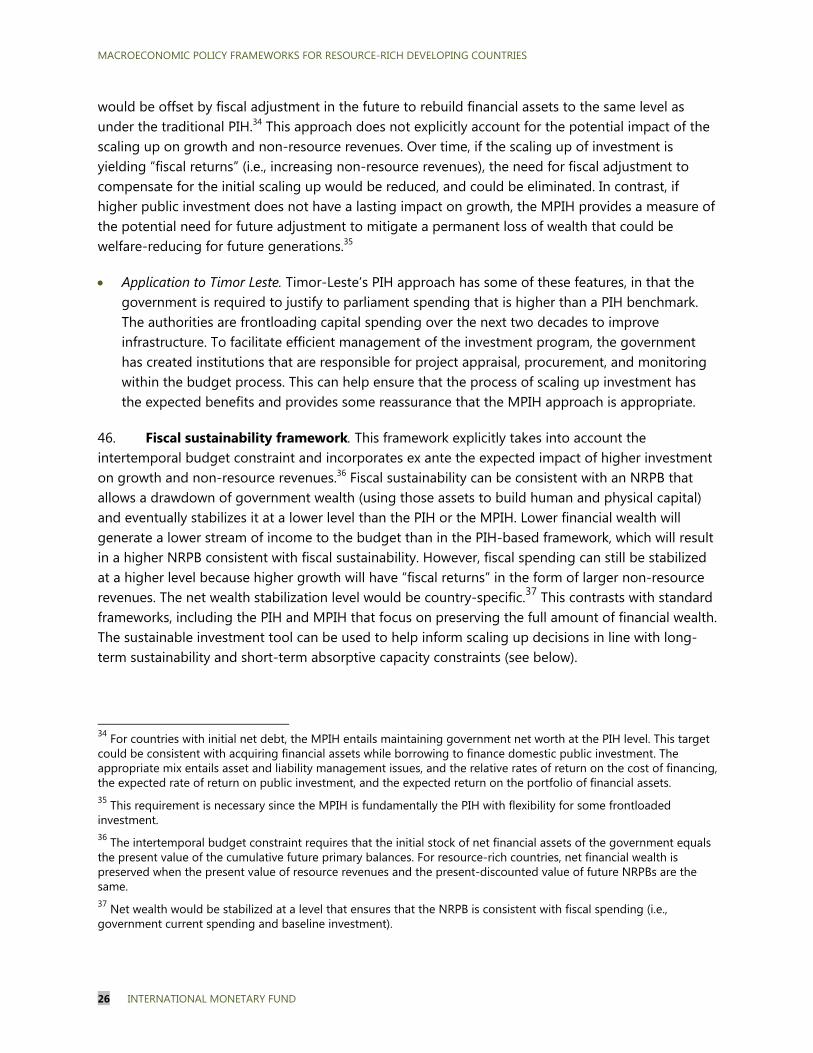
MACROECONOMIC POLICY FRAMEWORKS FOR RESOURCE-RICH DEVELOPING COUNTRIES
26 INTERNATIONAL MONETARY FUND
would be offset by fiscal adjustment in the future to rebuild financial assets to the same level as under the traditional PIH.34 This approach does not explicitly account for the potential impact of the scaling up on growth and non-resource revenues. Over time, if the scaling up of investment is yielding “fiscal returns” (i.e., increasing non-resource revenues), the need for fiscal adjustment to compensate for the initial scaling up would be reduced, and could be eliminated. In contrast, if higher public investment does not have a lasting impact on growth, the MPIH provides a measure of the potential need for future adjustment to mitigate a permanent loss of wealth that could be welfare-reducing for future generations.35
Application to Timor Leste. Timor-Leste’s PIH approach has some of these features, in that the government is required to justify to parliament spending that is higher than a PIH benchmark. The authorities are frontloading capital spending over the next two decades to improve infrastructure. To facilitate efficient management of the investment program, the government has created institutions that are responsible for project appraisal, procurement, and monitoring within the budget process. This can help ensure that the process of scaling up investment has the expected benefits and provides some reassurance that the MPIH approach is appropriate.
46. Fiscal sustainability framework. This framework explicitly takes into account the intertemporal budget constraint and incorporates ex ante the expected impact of higher investment on growth and non-resource revenues.36 Fiscal sustainability can be consistent with an NRPB that allows a drawdown of government wealth (using those assets to build human and physical capital) and eventually stabilizes it at a lower level than the PIH or the MPIH. Lower financial wealth will generate a lower stream of income to the budget than in the PIH-based framework, which will result in a higher NRPB consistent with fiscal sustainability. However, fiscal spending can still be stabilized at a higher level because higher growth will have “fiscal returns” in the form of larger non-resource revenues. The net wealth stabilization level would be country-specific.37 This contrasts with standard frameworks, including the PIH and MPIH that focus on preserving the full amount of financial wealth. The sustainable investment tool can be used to help inform scaling up decisions in line with long-term sustainability and short-term absorptive capacity constraints (see below).
34 For countries with initial net debt, the MPIH entails maintaining government net worth at the PIH level. This target could be consistent with acquiring financial assets while borrowing to finance domestic public investment. The appropriate mix entails asset and liability management issues, and the relative rates of return on the cost of financing, the expected rate of return on public investment, and the expected return on the portfolio of financial assets. 35 This requirement is necessary since the MPIH is fundamentally the PIH with flexibility for some frontloaded investment. 36 The intertemporal budget constraint requires that the initial stock of net financial assets of the government equals the present value of the cumulative future primary balances. For resource-rich countries, net financial wealth is preserved when the present value of resource revenues and the present-discounted value of future NRPBs are the same. 37 Net wealth would be stabilized at a level that ensures that the NRPB is consistent with fiscal spending (i.e., government current spending and baseline investment).
MACROECONOMIC POLICY FRAMEWORKS FOR RESOURCE-RICH DEVELOPING COUNTRIES
INTERNATIONAL MONETARY FUND 27
Application to the Republic of Congo. The Congo staff team simulated a scaling up of investment sufficient to raise the stock of infrastructure capital to the middle income country average, taking into account absorptive capacity constraints and the efficiency of investment. The exercise demonstrated that it was possible to both scale up investment and ensure long-term fiscal sustainability because government wealth is stabilized in the post-scaling up period at about 400 percent of non-oil GDP, lower than current levels and than under the PIH. The result is significantly higher per capita income growth (see Table 2 and Supplement 2, Chapter III.A).
47. These frameworks are particularly concerned with ensuring that resource revenues are used more for public investment than for government consumption. Although conceptually the long-run sustainability approaches would suggest focusing on the stability of the non-resource current balance, it is not advisable to use this indicator as a fiscal anchor because it does not on its own satisfy the intertemporal budget constraint,38 it may be associated with budget fragmentation, and it is likely to generate incentives for creative accounting in the form of shifting current spending into the capital budget. At the same time, the attention to public investment is a necessary element of the approach. This would require a dialogue with the authorities on what is truly "investment.” For example, if staff's view is that a particular "investment" is best treated as consumption, or is likely to be unproductive, they should advise the authorities to reclassify this spending and/or assume that its long-term impact on growth is negligible.
48. The choice between sustainability frameworks depends on the assessed impact of public investment on both growth and non-resource revenues. While this is subject to great uncertainty, it is necessary to adopt frameworks that generate a dialogue on how public investment plans will impact growth and future sustainability. Where the productivity of public investment is highly uncertain, the MPIH might be an appropriately prudent approach. In other cases, where there
38 The non-resource current balance is equal to the NRPB without public investment. It is in this regard similar to a “golden rule.” This indicator would not deteriorate to the extent that countries use resource wealth for public investment. Thus it cannot ensure fiscal sustainability as it places no restriction on the future path for public investment. In the GFSM 2001 framework, the non-resource current balance is equivalent to the gross operating balance.
2017 2032 2017 2032
Per Capita GDP (in U.S. dollars) 2,992 2,571 3,868 4,872
Real GDP (annual percent change)1 -1.7 2.3 5.1 3.9
Public Capital Spending (in percent non-oil GDP) 6.8 17.3 23.8 9.1
Cumulative Capital Spending (in billions of U.S. dollars) 4.6 26.5 18.8 40.9
Non-Resource Primary Balance (NRPB) -14.9 -14.9 -28.7 -3.5
Net Financial Assets (in billions of U.S. dollars) 30.2 135.2 18.2 100.8
Source: IMF staff estimates.1 Data for 2017 report the average forecast of 2013-17, and 2032 report the average forecast of 2018-32.
Fiscal Sustainability Framework
Table 2. Republic of Congo: Selected Economic Indicators Under the Standard PIH and the FSF Scenarios
Standard-PIH
MACROECONOMIC POLICY FRAMEWORKS FOR RESOURCE-RICH DEVELOPING COUNTRIES
28 INTERNATIONAL MONETARY FUND
is greater confidence in the positive impact of investment, the FSF would seem to provide a better sustainability framework. In this case, the sustainable investment tool could be used to inform choices about alternative investment scaling up paths, accounting for the full macroeconomic effects (see Box 4).
Box 4. The Sustainable Investment Tool
A new sustainable investing tool can help determine how much and how fast public investment can be scaled up. This tool provides a way to determine paths for the non-resource fiscal variables that are sustainable in the long run (i.e., do not require unfeasible future fiscal adjustments), based on a macroeconomic framework that links fiscal variables, investment, growth and the real exchange rate. Scaling up of public investment has potential growth and expanded tax base benefits, but rapid expansion risks resource misuse, higher costs, Dutch disease effects, and heightened macroeconomic volatility. The framework accounts for inefficiencies in translating public investment to increases in the public capital stock, and absorptive capacity constraints. In addition, larger capital stocks need to be maintained by budgeting for operation and maintenance. For a given investment scaling up path and envelope of resource revenues, the framework assesses the long-term sustainability of a fully specified fiscal path based on the magnitude of fiscal adjustments in current government spending or tax rates required to ensure debt sustainability. When the implied adjustments are unlikely to be feasible, the scaling up magnitude should be revised downward in light of fiscal sustainability considerations. The framework can also assess the growth sustainability of a scaling up path in terms of whether capital, non-resource GDP, and private consumption can be permanently higher relative to an initial state. Overall, the framework can serve as an analytical that informs short- to medium-term fiscal policy choices while also being consistent with longer-term fiscal and capital sustainability (Berg and others, 2012, Supplement 2 I.C).
Application to Angola. The Angola team compared the macroeconomic outcomes of a “spend-as-you-go approach” (quite similar to the pre-2009 policy in Angola), to an alternative approach of more gradual investment scaling up paths in line with the sustainable investing approach discussed above. Assuming different projections for oil price volatility, the exercise yields paths that would allow the building of a stabilization fund buffer large enough to prevent the need for sizable investment cuts when there are large negative oil price shocks. Gradually scaling up investment would give the authorities time to improve absorptive capacity and public investment efficiency and build fiscal buffers to prevent a disruption to investment if there is a negative oil shock (Supplement 2, Chapter III.B).
49. There are various ways to assess the effectiveness of public investment. The Public Investment Management Index or PIMI (see Dabla-Norris et al., 2011)—when available—can be used to evaluate which of the four stages of the public investment management process (project appraisal, selection, implementation, and evaluation) is a bottleneck and needs to be strengthened before scaling up public investment.39 The cross country estimates of growth effects of public capital can further guide policy makers, including the public investment stage that has the most impact on growth (e.g., Gupta et al., 2011). While it is difficult to get robust estimates of country-specific rates of return on public investment, some information is available from multilateral and bilateral sources (e.g., World Bank and donor projects; see Supplement 1, Chapter I.A). These 39 The World Bank is also working on strengthening public investment management in RRDCs. A comprehensive assessment framework (see Rajaram et al., 2010) has been developed to motivate governments to undertake periodic self-assessments of their public investment systems and design reforms to enhance the productivity of public investment. The diagnostic tool provides a rigorous foundation for policy dialogue and has been applied to over two dozen countries.

MACROECONOMIC POLICY FRAMEWORKS FOR RESOURCE-RICH DEVELOPING COUNTRIES
INTERNATIONAL MONETARY FUND 29
assessments of the rate of return are clearly necessary when resource revenues are used to finance a scaling up of public investment. In any case, the fiscal frameworks discussed here will also create demand for more and better information.
50. How best to build productive assets may vary among RRDCs. Certain types of current expenditure, such as education spending to build human capital, can yield returns similar to public investment, and should be a high priority in some RRDCs. Similarly, some types of capital investment, for example on hospitals and schools, cannot be productive without associated recurrent outlays on operations and maintenance. Furthermore, RRDCs are a heterogeneous group: in fragile states, for instance, public spending on the security and justice sectors may have a growth return as high as building infrastructure.
51. For higher investment and the resulting growth to have a beneficial impact on the NRPB, it is essential that RRDCs improve their non-resource tax policy and administration.40 There is evidence that rising resource revenues create disincentives for RRDCs to mobilize non-resource revenues (see Bornhorst, Gupta, and Thornton 2009). Failure to capture fiscal returns from higher growth would compromise the assessment of long-term sustainability.
52. In this context, it is also critical to put in place indicators to track the use of natural resource revenues. While an “optimal” strategy for the use of resource wealth might be to target higher public investment, it is not possible given the fungibility of financial resources to establish a dollar-to-dollar link between the use of natural resources and capital expenditures.
Two simple indicators worth considering are (i) the share of public investment in total spending and (ii) the ratio of the increase in public investment to the increase in resource revenues, both as a percent of non-resource GDP.
For countries where resource revenues are expected to increase over time, the expectation is that the share of public investment in total spending rises over time. Where resource revenues are expected to remain constant or decline, the challenge would be to maintain the share of investment in total spending until major infrastructure gaps are closed. Similarly, the second indicator would provide a measure of the extent to which additional resource revenues are used to expand capital spending.
In addition to the above, monitoring changes in public consumption (through the non-resource current balance) and the overall balance, in terms of the increase in resource revenues, would provide a picture of consumption and financial savings associated with increments in resource revenues.
53. Setting a baseline to assess the evolution of these indicators may not always be straightforward. For countries where natural resources have recently been discovered, the appropriate baseline would be the pre-resource period. For more mature resource-rich countries,
40 See IMF (2011d).

MACROECONOMIC POLICY FRAMEWORKS FOR RESOURCE-RICH DEVELOPING COUNTRIES
30 INTERNATIONAL MONETARY FUND
setting the baseline could be more difficult. Three options are: the pre-resource period, a pre-resource boom year (e.g., 2004 before the surge in oil prices began), or (if the first two options are not feasible) the current year. The justification for the last is that the country is committed to following a new framework going forward.
B. Fiscal Institutions
54. RRDCs should be equipped with well-designed fiscal institutions that support scaling up of public investment while maintaining sound fiscal policies. Among these institutions should be well-designed and transparent public financial management (PFM) systems (see Supplement 2, Chapter I.B); as well as special fiscal institutions, such as natural resource funds and independent forecasting bodies, to ensure prudent planning and utilization of resource revenues. The PFM system should be sufficiently robust to
provide reasonable forecasts for natural resource prices, production, and fiscal revenues and analyze risks related to the central scenario;
carry out medium-term budget planning;
facilitate investment project appraisal, selection, and implementation to ensure that resource revenues, and other funding if any, are used to support long-term economic development;
integrate cash and liability management to minimize financing costs and ensure a single route between the budget and any natural resource fund; and
ensure transparency in the collection and utilization of natural resource revenues, and of other available resources, through appropriate fiscal accounting, reporting, and audit.
55. The issues of how much of the above needs to be set out in a fiscal responsibility law (FRL) or constitution will depend on the circumstances and the legal and administrative traditions of the country. Most countries opt to codify the rules and institutional arrangements for natural resource management in some form of legislation (e.g., the organic budget law), but the degree of detail varies considerably. In general, best practice is to be clear about the objectives, institutions, and reporting arrangements for natural resource management and to guard against over-prescription, in particular with regard to the amounts of revenue flowing into or out of funds, to ensure that these rules do not come into conflict with wider macrofiscal objectives and undermine the credibility of the law.
56. Fiscal transparency and good governance should be given prominence when fiscal institutions are established. In countries that do not have relatively inclusive political institutions, scaling up public investment (which is assumed to be welfare-enhancing given capital scarcity) might be counterproductive because the budget process does not necessarily reflect broader social preferences. Since this is a relatively common situation in resource-rich countries, it is essential that application of the code of good practices on fiscal transparency be monitored closely. This involves several issues, including an assessment of the clarity of the roles and responsibilities of different

MACROECONOMIC POLICY FRAMEWORKS FOR RESOURCE-RICH DEVELOPING COUNTRIES
INTERNATIONAL MONETARY FUND 31
government entities; establishment of an open budget process; public availability of information; and assurances of data integrity.41
C. Managing Natural Resource Funds
57. Natural resource funds allow policy makers to deal with resource revenue volatility, meet development needs, and save for future generations. Thus, asset management strategies will be informed by one or more macrofiscal objectives:
Stabilization: to insulate the budget and economy from volatile commodity prices;
Savings: to transfer wealth across generations or across time (e.g., pension funds); and
Development: to allocate resources to priority socioeconomic projects.42
58. Resource funds should be seen as complementary policy tools, not the main fiscal policy instrument. These funds are not a substitute for fiscal policy, and potentially complicated rules governing flows between the budget and resource funds are not conducive to effective fiscal policy management. Specifically, the accumulation of financial assets in a fund for self-insurance and/or intergenerational objectives should be derived from actual fiscal surpluses and the government’s cash management strategy.43
59. Resource fund flows should be integrated into the budget process to ensure its integrity and protect its role as the mechanism for setting expenditure priorities and allocating public resources. Resource flows should not be entrusted with independent spending authority, and all their inflows and outflows should go through the budget.
60. Resource funds are a key component of asset and liability management.44 The design of resource funds should therefore be considered in a holistic manner that takes into account the government’s broad fiscal, balance of payments, and financial objectives. Key fiscal objectives include maintaining adequate liquidity to stabilize budget execution over time, funding capacity that
41 See IMF (2008). 42 Chile, Timor Leste, and Iran set up stabilization funds to insulate the budget from external shocks and commodity volatility; the Abu Dhabi Investment Authority, Libya, and Russia set up savings funds; UAE and Kazakhstan have development funds. Other funds used in advanced and emerging market economies include pension reserve funds, created to cover future pension and/or contingent-type liabilities on the government’s balance sheet; and reserve investment corporations, used to extract higher returns from existing reserves. 43 Countries with a large stock of debt might opt to pay down public debt rather than to accumulate financial assets. Such a strategy can be justified not only on purely financial grounds (e.g., borrowing rates higher than lending ones) but to reduce the country’s interest premium and thereby foster private sector growth. By the same token, countries with low levels of debt may opt to issue debt to develop a yield curve that serves as a reference for private sector development. 44 The Santiago Principles (2008) adopted by a group of internationally recognized funds, provide a set of generally accepted good operating principles that can help guide countries with the financial management of fund resources.
MACROECONOMIC POLICY FRAMEWORKS FOR RESOURCE-RICH DEVELOPING COUNTRIES
32 INTERNATIONAL MONETARY FUND
is adequate to finance future budgeted development projects, and financing buffers adequate to cover possible future longer-term liabilities.
61. Funds with flexible inflow and outflow rules tend to be more effective than those that follow fixed rules (e.g., those linked to a threshold resource price or to a proportion of resource revenues). An example of a flexible fund is Chile’s stabilization fund, which operates as the “mirror image” of the structural balance rule: it receives fiscal surpluses associated with the fiscal rule during the boom years; and those surpluses are then used to support counter-cyclical fiscal policies when the fiscal position shifts to deficits. At the same time, it is important to consider the introduction of some “withdrawal brake” rules that limit the depletion of the funds in any single year. They can protect the fund from political pressures that can lead to its depletion, especially during electoral years. São Tomé and Príncipe, for example, limits withdrawals from the fund in any single year to a maximum of 20 percent of the accumulated assets.
62. The design and operational considerations underpinning the funds can vary with country circumstances and capacity levels. Practices might also evolve over time to adjust to new macroeconomic and financial market realities (Supplement 1, Chapter IV). When institutional capacity is weak, especially with regard to PFM, it is advisable for RRDCs to maintain only one natural resource fund that has two separate portfolios, each set up to meet one of the two objectives (one for stabilization and one for savings/development) along with a well-specified asset management framework.
Pooling resources in a single fund helps countries to minimize financing costs, maximize returns on pooled savings, and avoid the complexities and asset-liability management rigidities associated with managing transfers from and to the budget by multiple funds.
Two portfolios increase flexibility to cope with multiple financial objectives (e.g., facilitate portfolio design, investment implementation, and performance evaluation) and foster greater transparency in the purpose, investment objectives, and implementation of each portfolio for public stakeholders. To deal with unexpected adverse economic circumstances (such as a significant economic downturn or an abnormal drop in revenue), it is important to ensure that the asset allocation strategies of (and between) various portfolios are flexible enough to ensure that withdrawals for government’s liquidity needs can be met without incurring higher day-to-day borrowing or other financial costs.
In RRDCs with well-developed institutional capacity, more than one fund could be set up to increase flexibility to cope with multiple financial objectives, especially long-term savings goals. Such a strategy would be justified to increase accountability for the management of financial resources by providing a more explicit link to the relevant strategic asset allocation framework. However, this approach requires careful design to avoid inconsistencies between asset and liability management (the “below the line”) with the actual conduct of fiscal policy (the “above the line”).
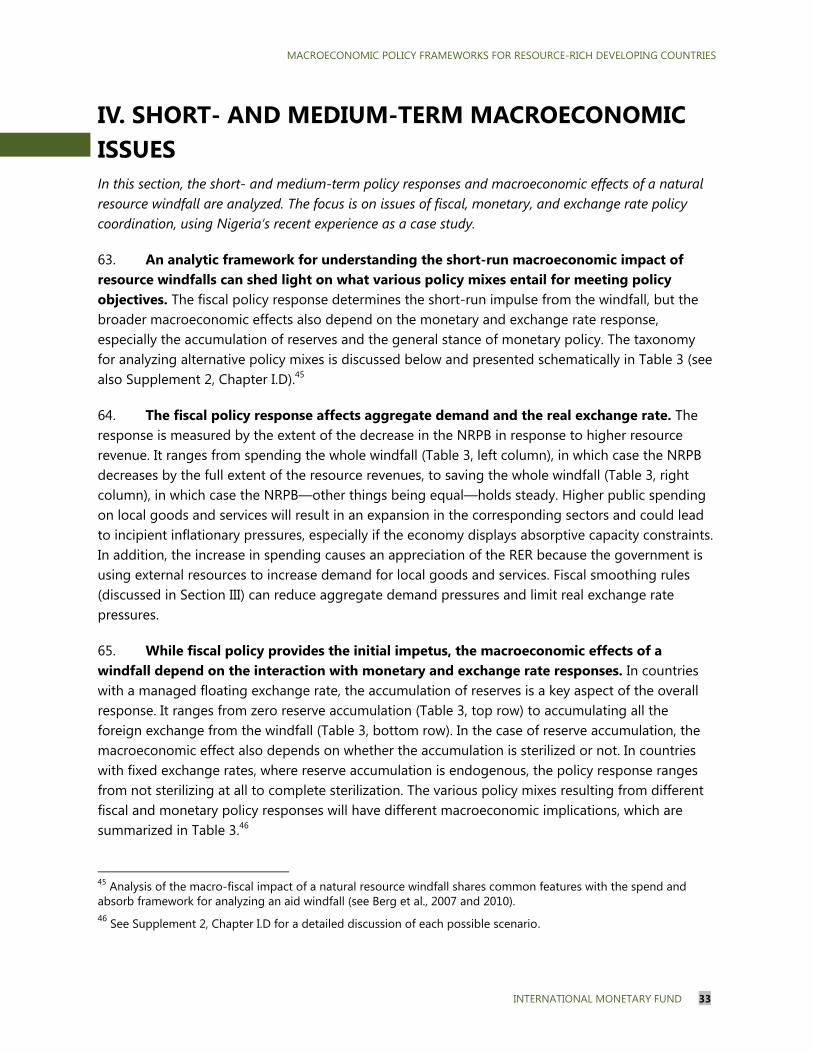
MACROECONOMIC POLICY FRAMEWORKS FOR RESOURCE-RICH DEVELOPING COUNTRIES
INTERNATIONAL MONETARY FUND 33
IV. SHORT- AND MEDIUM-TERM MACROECONOMIC ISSUESIn this section, the short- and medium-term policy responses and macroeconomic effects of a natural resource windfall are analyzed. The focus is on issues of fiscal, monetary, and exchange rate policy coordination, using Nigeria’s recent experience as a case study.
63. An analytic framework for understanding the short-run macroeconomic impact of resource windfalls can shed light on what various policy mixes entail for meeting policy objectives. The fiscal policy response determines the short-run impulse from the windfall, but the broader macroeconomic effects also depend on the monetary and exchange rate response, especially the accumulation of reserves and the general stance of monetary policy. The taxonomy for analyzing alternative policy mixes is discussed below and presented schematically in Table 3 (see also Supplement 2, Chapter I.D).45
64. The fiscal policy response affects aggregate demand and the real exchange rate. The response is measured by the extent of the decrease in the NRPB in response to higher resource revenue. It ranges from spending the whole windfall (Table 3, left column), in which case the NRPB decreases by the full extent of the resource revenues, to saving the whole windfall (Table 3, right column), in which case the NRPB—other things being equal—holds steady. Higher public spending on local goods and services will result in an expansion in the corresponding sectors and could lead to incipient inflationary pressures, especially if the economy displays absorptive capacity constraints. In addition, the increase in spending causes an appreciation of the RER because the government is using external resources to increase demand for local goods and services. Fiscal smoothing rules (discussed in Section III) can reduce aggregate demand pressures and limit real exchange rate pressures.
65. While fiscal policy provides the initial impetus, the macroeconomic effects of a windfall depend on the interaction with monetary and exchange rate responses. In countries with a managed floating exchange rate, the accumulation of reserves is a key aspect of the overall response. It ranges from zero reserve accumulation (Table 3, top row) to accumulating all the foreign exchange from the windfall (Table 3, bottom row). In the case of reserve accumulation, the macroeconomic effect also depends on whether the accumulation is sterilized or not. In countries with fixed exchange rates, where reserve accumulation is endogenous, the policy response ranges from not sterilizing at all to complete sterilization. The various policy mixes resulting from different fiscal and monetary policy responses will have different macroeconomic implications, which are summarized in Table 3.46
45 Analysis of the macro-fiscal impact of a natural resource windfall shares common features with the spend and absorb framework for analyzing an aid windfall (see Berg et al., 2007 and 2010). 46 See Supplement 2, Chapter I.D for a detailed discussion of each possible scenario.
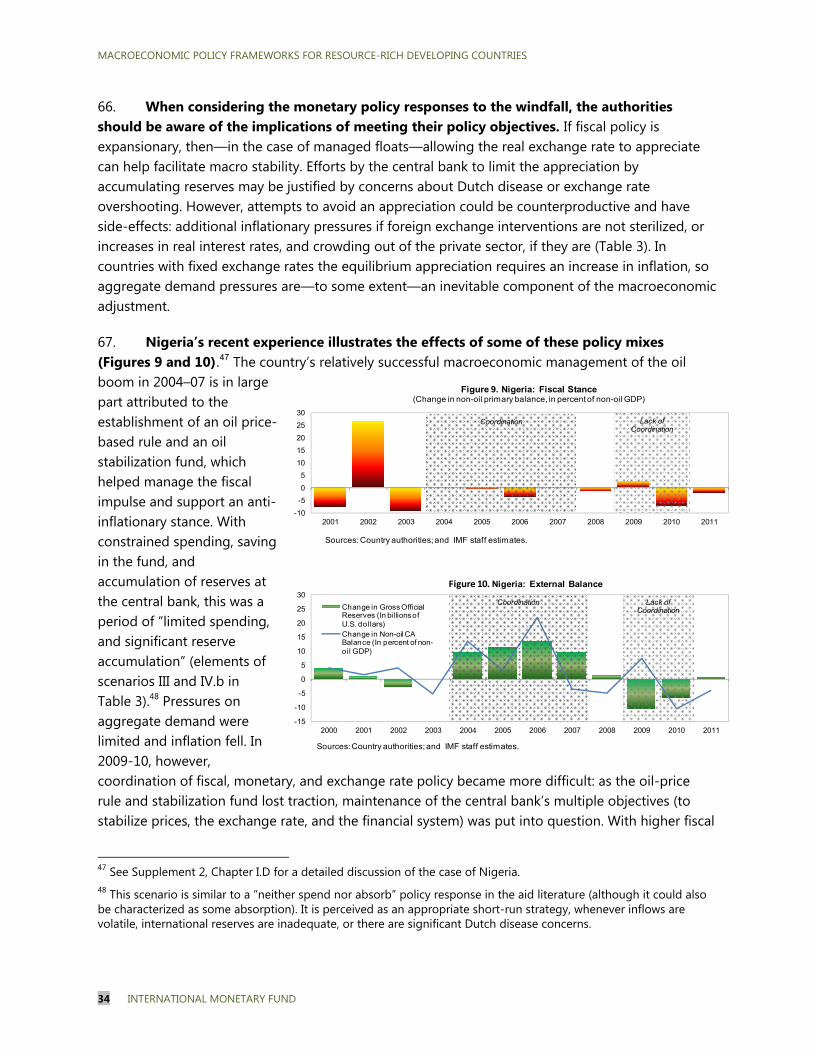
MACROECONOMIC POLICY FRAMEWORKS FOR RESOURCE-RICH DEVELOPING COUNTRIES
34 INTERNATIONAL MONETARY FUND
66. When considering the monetary policy responses to the windfall, the authorities should be aware of the implications of meeting their policy objectives. If fiscal policy is expansionary, then—in the case of managed floats—allowing the real exchange rate to appreciate can help facilitate macro stability. Efforts by the central bank to limit the appreciation by accumulating reserves may be justified by concerns about Dutch disease or exchange rate overshooting. However, attempts to avoid an appreciation could be counterproductive and have side-effects: additional inflationary pressures if foreign exchange interventions are not sterilized, or increases in real interest rates, and crowding out of the private sector, if they are (Table 3). In countries with fixed exchange rates the equilibrium appreciation requires an increase in inflation, so aggregate demand pressures are—to some extent—an inevitable component of the macroeconomic adjustment.
67. Nigeria’s recent experience illustrates the effects of some of these policy mixes (Figures 9 and 10).47 The country’s relatively successful macroeconomic management of the oil boom in 2004–07 is in large part attributed to the establishment of an oil price-based rule and an oil stabilization fund, which helped manage the fiscal impulse and support an anti-inflationary stance. With constrained spending, saving in the fund, and accumulation of reserves at the central bank, this was a period of “limited spending, and significant reserve accumulation” (elements of scenarios III and IV.b in Table 3).48 Pressures on aggregate demand were limited and inflation fell. In 2009-10, however, coordination of fiscal, monetary, and exchange rate policy became more difficult: as the oil-price rule and stabilization fund lost traction, maintenance of the central bank’s multiple objectives (to stabilize prices, the exchange rate, and the financial system) was put into question. With higher fiscal
47 See Supplement 2, Chapter I.D for a detailed discussion of the case of Nigeria. 48 This scenario is similar to a “neither spend nor absorb” policy response in the aid literature (although it could also be characterized as some absorption). It is perceived as an appropriate short-run strategy, whenever inflows are volatile, international reserves are inadequate, or there are significant Dutch disease concerns.
-10
-5
0
5
10
15
20
25
30
2001 2002 2003 2004 2005 2006 2007 2008 2009 2010 2011
Sources: Country authorities; and IMF staff estimates.
Figure 9. Nigeria: Fiscal Stance(Change in non-oil primary balance, in percent of non-oil GDP)
Coordination Lack of Coordination
-15
-10
-5
0
5
10
15
20
25
30
2000 2001 2002 2003 2004 2005 2006 2007 2008 2009 2010 2011
Sources: Country authorities; and IMF staff estimates.
Change in Gross Official Reserves (In billions of U.S. dollars)Change in Non-oil CA Balance (In percent of non-oil GDP)
Figure 10. Nigeria: External Balance
Coordination Lack of Coordination
MACROECONOMIC POLICY FRAMEWORKS FOR RESOURCE-RICH DEVELOPING COUNTRIES
INTERNATIONAL MONETARY FUND 35
spending, loss of reserves and a loose monetary policy, this was a period of “full spending and reserve loss” (scenario I), resulting in a rise in inflation and exchange rate depreciation pressures.49
68. A resource windfall may also result in a credit boom. As a windfall improves a country’s external outlook, appetite for domestic assets may increase, and the country may experience capital inflows. These inflows could feed into the domestic financial system, increasing the availability of domestic credit. Credit growth may also stem from an accommodating monetary policy but it may arise even if monetary policy is relatively neutral. While some expansion in credit is beneficial, contributing to financial deepening, there is a risk that excessive credit growth could amplify aggregate demand pressures, exert inflationary pressures, and expose the domestic financial system to a reversal in foreign investor appetite for domestic assets and deterioration in credit quality. The monetary authorities may decide to tighten policy in response to the credit boom but must consider any unintended macroeconomic consequences (e.g., an exchange rate appreciation). The pace of government spending may also have to be lowered to alleviate inflationary pressures. Moreover, besides prudent macromanagement, strengthened supervision and regulation are key to avoiding a buildup of financial fragilities during a natural resource windfall.
69. Specific aspects of the economy and public finances at the onset of the windfall may call for a particular policy response. Countries starting with high inflation and fiscal dominance may use the windfall to reduce central bank financing of deficits. Countries with weak or depleted policy buffers may prefer to use the windfall to build up reserves. Finally, countries facing incipient credit booms or busts at the onset of the windfall may wish to respond in ways that minimize the amplification of the credit cycle.
70. The composition and speed of spending can help maintain short-term macroeconomic stability in the face of a scaling up of spending financed by windfall revenues. Although in the short term limited fiscal spending might be desirable to contain aggregate demand pressures, scaled-up public spending to build physical and human capital addresses development needs in many RRDCs. The high import content of infrastructure spending can help mitigate some of the short-term macro effects on the domestic economy.
71. In sum, the analytic framework and the experience of Nigeria highlight the importance of fiscal, monetary, and exchange rate policy coordination to help ensure macroeconomic stability. A more gradual and smooth fiscal response can limit the impact on inflation and the real exchange rate, thus facilitating the task of the central bank. In addition, efforts to build reserves (or other forms of external savings, e.g., in a SWF) are best supported by a prudent fiscal policy. More generally, policy makers must thoroughly assess all aspects of policy and their combined implications for policy objectives.
49 This scenario shares similarities with a “spend and absorb” case (fiscal spending with no accumulation of foreign exchange). While this option can be desirable under normal circumstances, a loose monetary policy and the attempt to keep the naira-US$ exchange rate within a narrow band also significantly contributed to the loss of reserves and the increase in inflation during the period.

MACROECONOMIC POLICY FRAMEWORKS FOR RESOURCE-RICH DEVELOPING COUNTRIES
36 INTERNATIONAL MONETARY FUND
Table 3. A Schematic Representation of the Policy Responses to a Natural Resource Windfall
Fiscal Policy: Changes in the Non-resource Primary Balance (NRPB)
Monetary and Exchange Rate Policy
Full Spending
∆ ∆
Limited Spending
∆0
∆
Savings in the Central Bank
Savings in the Sovereign Wealth Fund
Man
aged
Flo
at
Accumulation of limited reserves ∆
0∆
I
The real exchange rate appreciates
Aggregate demand pressures rise
Domestic inflation is offset by nominal appreciation
There are positive spillovers to private demand.
IVa
The real exchange rate appreciates
Monetary financing is reduced or real interest rates fall
There are no additional inflationary pressures
The private sector is crowded in.
IVb
Similar to III
Accumulation of large reserves ∆ ∆
Full
ster
iliza
tion
IIa
The real appreciation rate is reduced
Real interest rates increase The private sector is crowded
out Inflationary pressures rise (real
appreciation acts as an escape valve).
III
The real exchange rate is mostly flat
There is no pressure on the private sector
Aggregate demand pressures are limited.
No
ster
iliza
tion IIb
Depreciation is nominal Inflation increases Aggregate demand increases.
Fixe
d Ex
chan
ge R
ate
Passive policy (no sterilization)
V
The real exchange rate appreciates (through a rise in inflation)
Inflation must increase Aggregate demand pressures
rise.
VII
Similar to III Active policy (sterilization)
VI
Similar to IIa
MACROECONOMIC POLICY FRAMEWORKS FOR RESOURCE-RICH DEVELOPING COUNTRIES
INTERNATIONAL MONETARY FUND 37
V. EXTERNAL SECTOR ASSESSMENTSExternal sustainability is particularly important for exhaustible natural resource producers, who need to manage their net foreign assets in a way that anticipates future resource depletion and an abrupt decline in resource exports, as well as maintaining a foreign asset cushion that would help mitigate external shocks. Traditional PIH consumption-smoothing frameworks for optimal net foreign asset and current account (savings minus investment) dynamics are inadequate for capital-scarce RRDCs, as they do not account for investment decisions. In this section, a simple analytic framework that considers several features of RRDCs tracks current account dynamics in the context of resource revenue windfalls, emphasizing the role of consumption and investment behavior. The results, which are complementary to other methodologies, can be used to inform the Fund’s current account norm analysis. The framework is applied to the CEMAC region.
A. External Assessments for Natural Resource Producers
72. Traditional methodologies to assess external stability, including those of the Consultative Group on Exchange Rates (CGER) developed at the Fund, have been modified to incorporate characteristics of resource-rich economies.50 Box 5 discusses extensions of the macroeconomic balance (MB) and the ERER approaches for resource-rich economies. The external sustainability (ES) approach, which does not rely on econometric estimations, is used to compute the medium-term current account balance that stabilizes a country’s net foreign assets (NFA), and has also been customized for resource-rich economies (Bems and de Carvalho, 2009b).
73. The customized ES approach might not be suitable for assessing external sustainability in capital-scarce RRDCs, since it does not account for optimal investment decisions. ES models suggest that natural resource exporting countries should have larger current account surpluses, higher NFA, and more appreciated real exchange rates than non-resource economies, particularly in boom times, due to both consumption smoothing and high precautionary savings to manage high revenue volatility (Bems and de Carvalho, 2009a, 2009b; Thomas, Kim, and Aslam, 2008). To address these gaps a new calibrated model-based approach incorporating investment decisions can be used to help inform the current account norm analysis for RRDCs, complementing current CGER methodologies.51
50 See Lee, Milesi-Ferretti, and others (2008) for the CGER-type approach to external assessments. IMF external assessments emphasize the use of a broad range of pertinent inputs (such as current account balances, exchange rates, capital flows, reserve accumulation, and external asset and liability positions) as well as quantitative methods. For a discussion of LIC issues in external assessments, see Christiansen and others (2009). 51 The external balance assessment (EBA) methodology is being developed as a successor to the CGER methods. (IMF, 2012b) The most fundamental innovation that EBA makes is a sharper distinction between the positive (descriptive) analysis and normative evaluations by allowing for the impact of policy distortions on current accounts. For this, EBA considers a number of policy variables: the cyclically-adjusted fiscal balance, social protection spending, capital controls, and foreign exchange market intervention. EBA also goes beyond CGER in taking into account several cyclical influences, including the output gap, commodity terms of trade cycle, and swings in global capital market conditions.
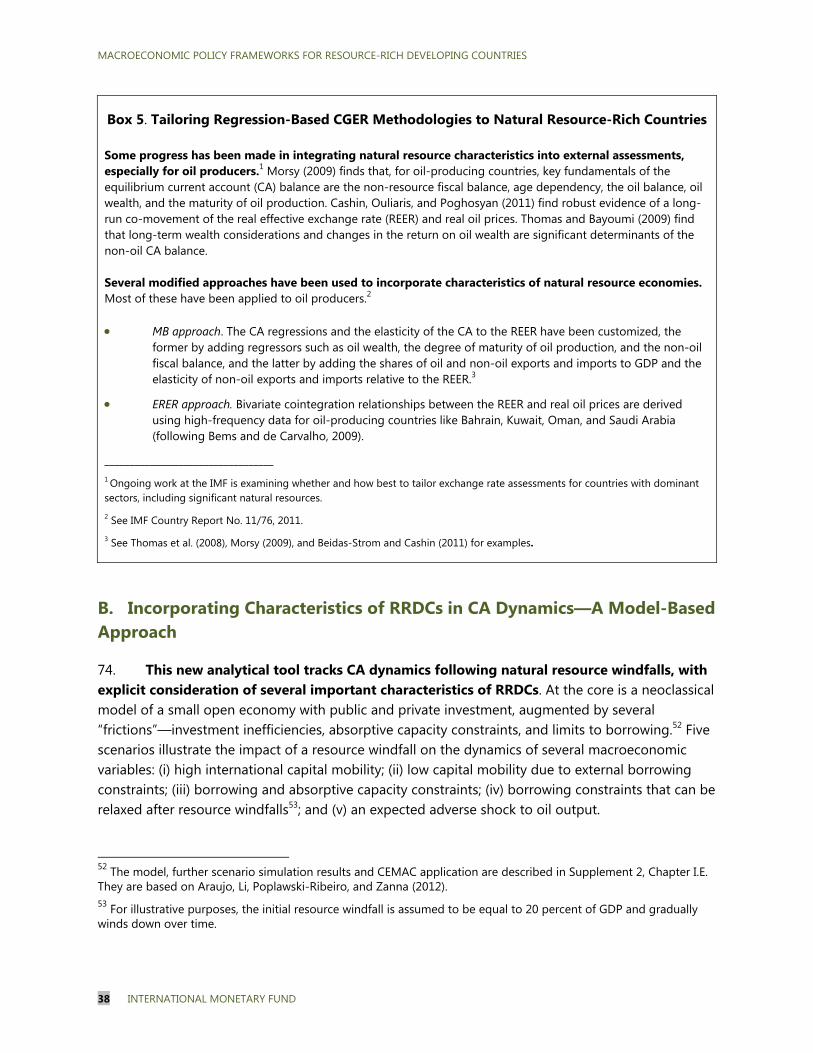
MACROECONOMIC POLICY FRAMEWORKS FOR RESOURCE-RICH DEVELOPING COUNTRIES
38 INTERNATIONAL MONETARY FUND
Box 5. Tailoring Regression-Based CGER Methodologies to Natural Resource-Rich Countries Some progress has been made in integrating natural resource characteristics into external assessments, especially for oil producers.1 Morsy (2009) finds that, for oil-producing countries, key fundamentals of the equilibrium current account (CA) balance are the non-resource fiscal balance, age dependency, the oil balance, oil wealth, and the maturity of oil production. Cashin, Ouliaris, and Poghosyan (2011) find robust evidence of a long-run co-movement of the real effective exchange rate (REER) and real oil prices. Thomas and Bayoumi (2009) find that long-term wealth considerations and changes in the return on oil wealth are significant determinants of the non-oil CA balance. Several modified approaches have been used to incorporate characteristics of natural resource economies. Most of these have been applied to oil producers.2 MB approach. The CA regressions and the elasticity of the CA to the REER have been customized, the
former by adding regressors such as oil wealth, the degree of maturity of oil production, and the non-oil fiscal balance, and the latter by adding the shares of oil and non-oil exports and imports to GDP and the elasticity of non-oil exports and imports relative to the REER.3
ERER approach. Bivariate cointegration relationships between the REER and real oil prices are derived using high-frequency data for oil-producing countries like Bahrain, Kuwait, Oman, and Saudi Arabia (following Bems and de Carvalho, 2009).
__________________________________ 1 Ongoing work at the IMF is examining whether and how best to tailor exchange rate assessments for countries with dominant sectors, including significant natural resources. 2 See IMF Country Report No. 11/76, 2011. 3 See Thomas et al. (2008), Morsy (2009), and Beidas-Strom and Cashin (2011) for examples.
B. Incorporating Characteristics of RRDCs in CA Dynamics—A Model-Based Approach
74. This new analytical tool tracks CA dynamics following natural resource windfalls, with explicit consideration of several important characteristics of RRDCs. At the core is a neoclassical model of a small open economy with public and private investment, augmented by several “frictions”—investment inefficiencies, absorptive capacity constraints, and limits to borrowing.52 Five scenarios illustrate the impact of a resource windfall on the dynamics of several macroeconomic variables: (i) high international capital mobility; (ii) low capital mobility due to external borrowing constraints; (iii) borrowing and absorptive capacity constraints; (iv) borrowing constraints that can be relaxed after resource windfalls53; and (v) an expected adverse shock to oil output.
52 The model, further scenario simulation results and CEMAC application are described in Supplement 2, Chapter I.E. They are based on Araujo, Li, Poplawski-Ribeiro, and Zanna (2012). 53 For illustrative purposes, the initial resource windfall is assumed to be equal to 20 percent of GDP and gradually winds down over time.
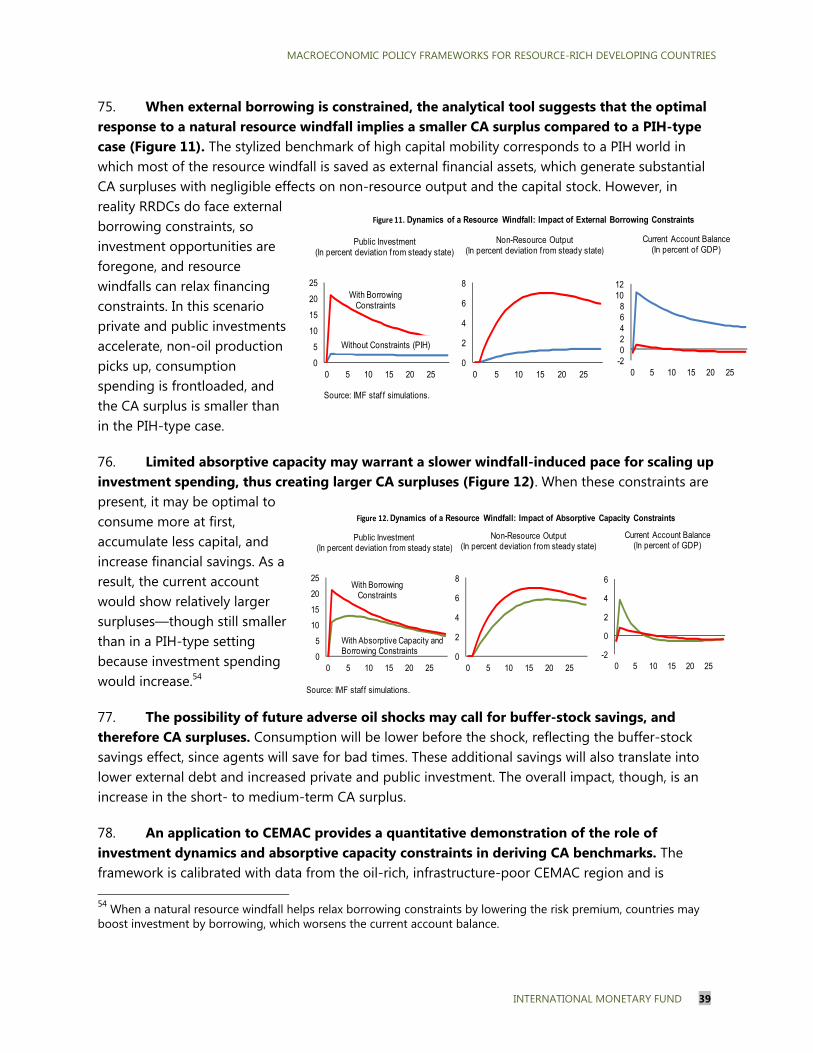
MACROECONOMIC POLICY FRAMEWORKS FOR RESOURCE-RICH DEVELOPING COUNTRIES
INTERNATIONAL MONETARY FUND 39
75. When external borrowing is constrained, the analytical tool suggests that the optimal response to a natural resource windfall implies a smaller CA surplus compared to a PIH-type case (Figure 11). The stylized benchmark of high capital mobility corresponds to a PIH world in which most of the resource windfall is saved as external financial assets, which generate substantial CA surpluses with negligible effects on non-resource output and the capital stock. However, in reality RRDCs do face external borrowing constraints, so investment opportunities are foregone, and resource windfalls can relax financing constraints. In this scenario private and public investments accelerate, non-oil production picks up, consumption spending is frontloaded, and the CA surplus is smaller than in the PIH-type case.
76. Limited absorptive capacity may warrant a slower windfall-induced pace for scaling up investment spending, thus creating larger CA surpluses (Figure 12). When these constraints are present, it may be optimal to consume more at first, accumulate less capital, and increase financial savings. As a result, the current account would show relatively larger surpluses—though still smaller than in a PIH-type setting because investment spending would increase.54
77. The possibility of future adverse oil shocks may call for buffer-stock savings, and therefore CA surpluses. Consumption will be lower before the shock, reflecting the buffer-stock savings effect, since agents will save for bad times. These additional savings will also translate into lower external debt and increased private and public investment. The overall impact, though, is an increase in the short- to medium-term CA surplus.
78. An application to CEMAC provides a quantitative demonstration of the role of investment dynamics and absorptive capacity constraints in deriving CA benchmarks. The framework is calibrated with data from the oil-rich, infrastructure-poor CEMAC region and is 54 When a natural resource windfall helps relax borrowing constraints by lowering the risk premium, countries may boost investment by borrowing, which worsens the current account balance.
Source: IMF staf f simulations.
0
5
10
15
20
25
0 5 10 15 20 25
Public Investment(In percent deviation f rom steady state)
Without Constraints (PIH)
With BorrowingConstraints
0
2
4
6
8
0 5 10 15 20 25
Non-Resource Output(In percent deviation f rom steady state)
-202468
1012
0 5 10 15 20 25
Current Account Balance(In percent of GDP)
Figure 11. Dynamics of a Resource Windfall: Impact of External Borrowing Constraints
Source: IMF staf f simulations.
0
5
10
15
20
25
0 5 10 15 20 25
Public Investment(In percent deviation f rom steady state)
With Absorptive Capacity and Borrowing Constraints
With BorrowingConstraints
0
2
4
6
8
0 5 10 15 20 25
Non-Resource Output(In percent deviation f rom steady state)
-2
0
2
4
6
0 5 10 15 20 25
Current Account Balance(In percent of GDP)
Figure 12. Dynamics of a Resource Windfall: Impact of Absorptive Capacity Constraints
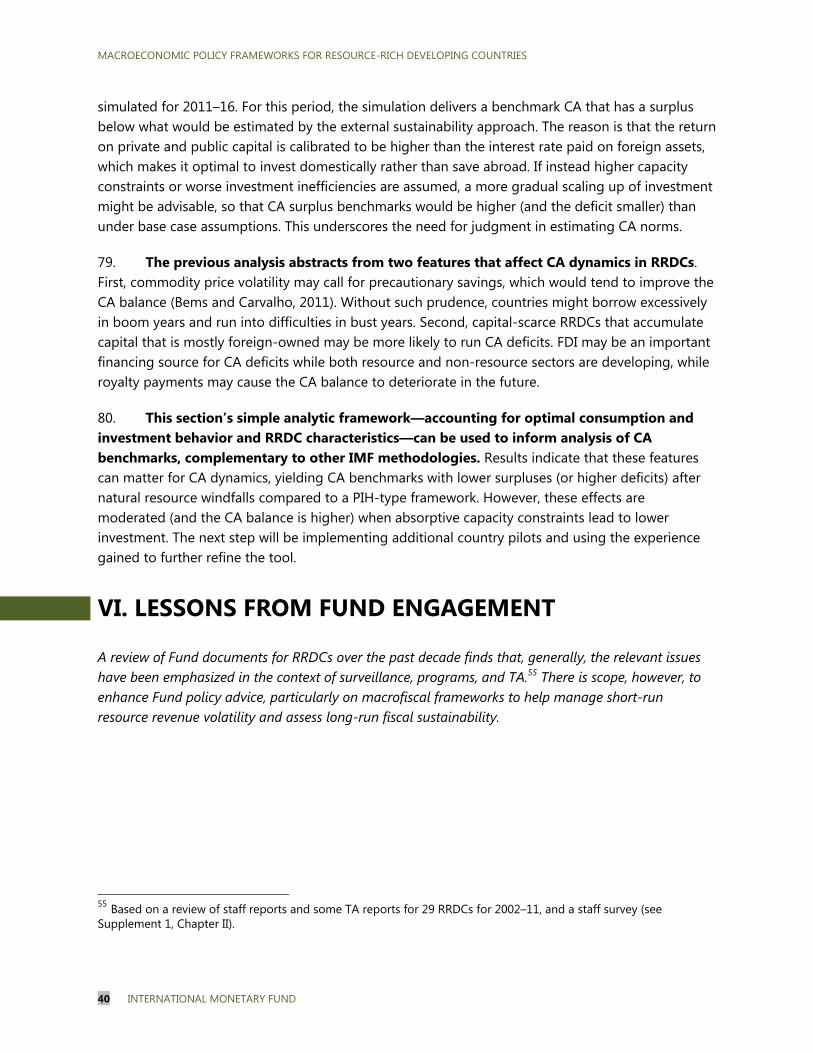
MACROECONOMIC POLICY FRAMEWORKS FOR RESOURCE-RICH DEVELOPING COUNTRIES
40 INTERNATIONAL MONETARY FUND
simulated for 2011–16. For this period, the simulation delivers a benchmark CA that has a surplus below what would be estimated by the external sustainability approach. The reason is that the return on private and public capital is calibrated to be higher than the interest rate paid on foreign assets, which makes it optimal to invest domestically rather than save abroad. If instead higher capacity constraints or worse investment inefficiencies are assumed, a more gradual scaling up of investment might be advisable, so that CA surplus benchmarks would be higher (and the deficit smaller) than under base case assumptions. This underscores the need for judgment in estimating CA norms.
79. The previous analysis abstracts from two features that affect CA dynamics in RRDCs. First, commodity price volatility may call for precautionary savings, which would tend to improve the CA balance (Bems and Carvalho, 2011). Without such prudence, countries might borrow excessively in boom years and run into difficulties in bust years. Second, capital-scarce RRDCs that accumulate capital that is mostly foreign-owned may be more likely to run CA deficits. FDI may be an important financing source for CA deficits while both resource and non-resource sectors are developing, while royalty payments may cause the CA balance to deteriorate in the future.
80. This section’s simple analytic framework—accounting for optimal consumption and investment behavior and RRDC characteristics—can be used to inform analysis of CA benchmarks, complementary to other IMF methodologies. Results indicate that these features can matter for CA dynamics, yielding CA benchmarks with lower surpluses (or higher deficits) after natural resource windfalls compared to a PIH-type framework. However, these effects are moderated (and the CA balance is higher) when absorptive capacity constraints lead to lower investment. The next step will be implementing additional country pilots and using the experience gained to further refine the tool.
VI. LESSONS FROM FUND ENGAGEMENT
A review of Fund documents for RRDCs over the past decade finds that, generally, the relevant issues have been emphasized in the context of surveillance, programs, and TA.55 There is scope, however, to enhance Fund policy advice, particularly on macrofiscal frameworks to help manage short-run resource revenue volatility and assess long-run fiscal sustainability.
55 Based on a review of staff reports and some TA reports for 29 RRDCs for 2002–11, and a staff survey (see Supplement 1, Chapter II).
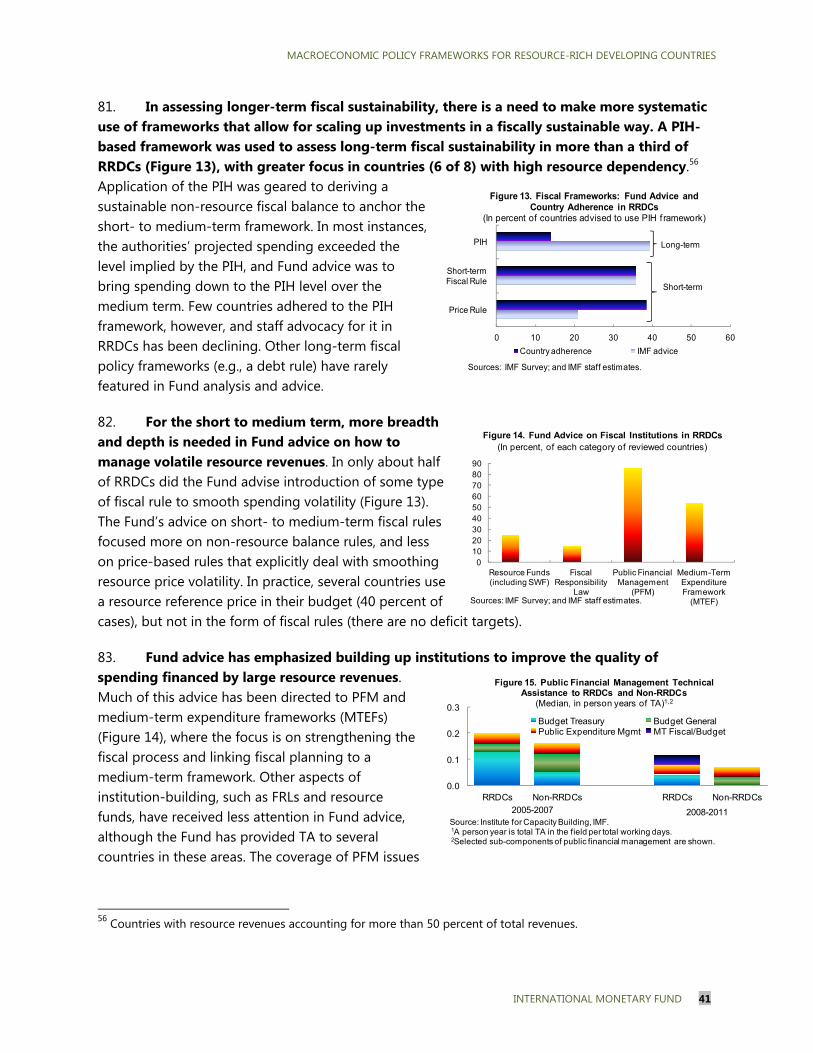
MACROECONOMIC POLICY FRAMEWORKS FOR RESOURCE-RICH DEVELOPING COUNTRIES
INTERNATIONAL MONETARY FUND 41
81. In assessing longer-term fiscal sustainability, there is a need to make more systematic use of frameworks that allow for scaling up investments in a fiscally sustainable way. A PIH-based framework was used to assess long-term fiscal sustainability in more than a third of RRDCs (Figure 13), with greater focus in countries (6 of 8) with high resource dependency.56 Application of the PIH was geared to deriving a sustainable non-resource fiscal balance to anchor the short- to medium-term framework. In most instances, the authorities’ projected spending exceeded the level implied by the PIH, and Fund advice was to bring spending down to the PIH level over the medium term. Few countries adhered to the PIH framework, however, and staff advocacy for it in RRDCs has been declining. Other long-term fiscal policy frameworks (e.g., a debt rule) have rarely featured in Fund analysis and advice.
82. For the short to medium term, more breadth and depth is needed in Fund advice on how to manage volatile resource revenues. In only about half of RRDCs did the Fund advise introduction of some type of fiscal rule to smooth spending volatility (Figure 13). The Fund’s advice on short- to medium-term fiscal rules focused more on non-resource balance rules, and less on price-based rules that explicitly deal with smoothing resource price volatility. In practice, several countries use a resource reference price in their budget (40 percent of cases), but not in the form of fiscal rules (there are no deficit targets).
83. Fund advice has emphasized building up institutions to improve the quality of spending financed by large resource revenues. Much of this advice has been directed to PFM and medium-term expenditure frameworks (MTEFs) (Figure 14), where the focus is on strengthening the fiscal process and linking fiscal planning to a medium-term framework. Other aspects of institution-building, such as FRLs and resource funds, have received less attention in Fund advice, although the Fund has provided TA to several countries in these areas. The coverage of PFM issues
56 Countries with resource revenues accounting for more than 50 percent of total revenues.
0 10 20 30 40 50 60
Price Rule
Short-term Fiscal Rule
PIH
Sources: IMF Survey; and IMF staff estimates.
Figure 13. Fiscal Frameworks: Fund Advice and Country Adherence in RRDCs
(In percent of countries advised to use PIH f ramework)
Country adherence IMF advice
Long-term
Short-term
0102030405060708090
Resource Funds (including SWF)
Fiscal Responsibility
Law
Public Financial Management
(PFM)
Medium-Term Expenditure Framework
(MTEF)Sources: IMF Survey; and IMF staff estimates.
Figure 14. Fund Advice on Fiscal Institutions in RRDCs (In percent, of each category of reviewed countries)
0.0
0.1
0.2
0.3
RRDCs Non-RRDCs RRDCs Non-RRDCs
Figure 15. Public Financial Management Technical Assistance to RRDCs and Non-RRDCs
(Median, in person years of TA)1,2
Budget Treasury Budget GeneralPublic Expenditure Mgmt MT Fiscal/Budget
Source: Institute for Capacity Building, IMF.1A person year is total TA in the field per total working days.2Selected sub-components of public financial management are shown.
2005-2007 2008-2011
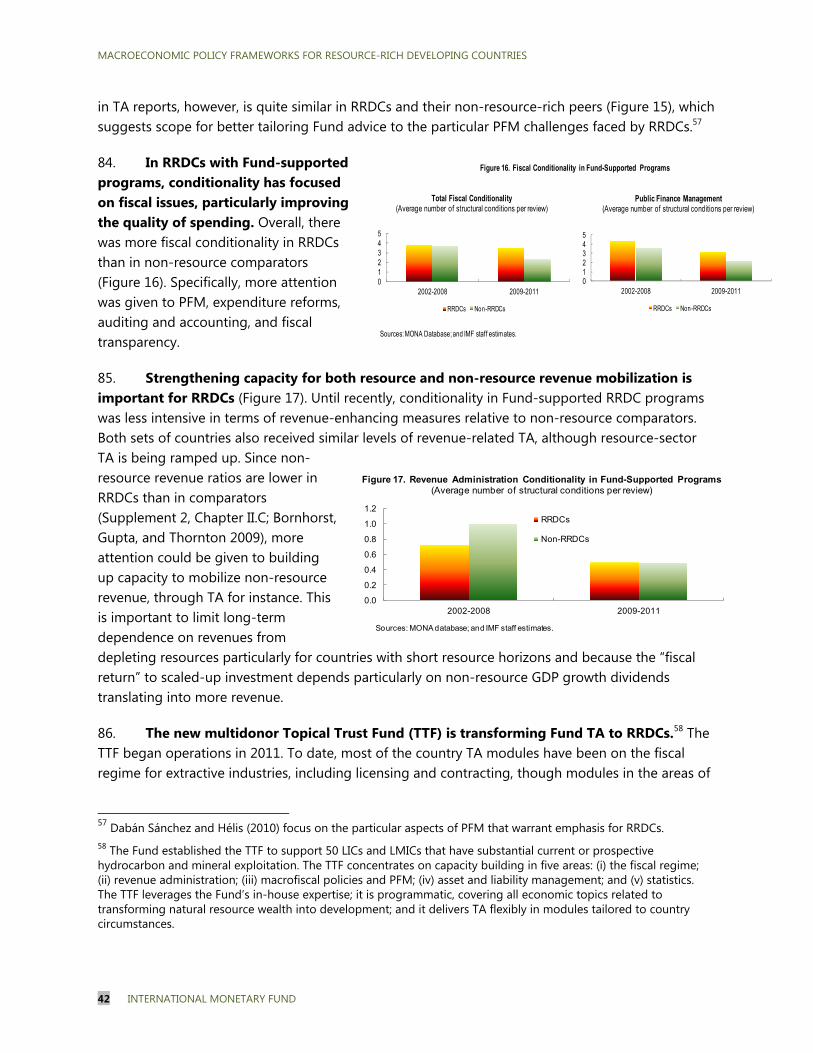
MACROECONOMIC POLICY FRAMEWORKS FOR RESOURCE-RICH DEVELOPING COUNTRIES
42 INTERNATIONAL MONETARY FUND
in TA reports, however, is quite similar in RRDCs and their non-resource-rich peers (Figure 15), which suggests scope for better tailoring Fund advice to the particular PFM challenges faced by RRDCs.57
84. In RRDCs with Fund-supported programs, conditionality has focused on fiscal issues, particularly improving the quality of spending. Overall, there was more fiscal conditionality in RRDCs than in non-resource comparators (Figure 16). Specifically, more attention was given to PFM, expenditure reforms, auditing and accounting, and fiscal transparency.
85. Strengthening capacity for both resource and non-resource revenue mobilization is important for RRDCs (Figure 17). Until recently, conditionality in Fund-supported RRDC programs was less intensive in terms of revenue-enhancing measures relative to non-resource comparators. Both sets of countries also received similar levels of revenue-related TA, although resource-sector TA is being ramped up. Since non-resource revenue ratios are lower in RRDCs than in comparators (Supplement 2, Chapter II.C; Bornhorst, Gupta, and Thornton 2009), more attention could be given to building up capacity to mobilize non-resource revenue, through TA for instance. This is important to limit long-term dependence on revenues from depleting resources particularly for countries with short resource horizons and because the “fiscal return” to scaled-up investment depends particularly on non-resource GDP growth dividends translating into more revenue.
86. The new multidonor Topical Trust Fund (TTF) is transforming Fund TA to RRDCs.58 The TTF began operations in 2011. To date, most of the country TA modules have been on the fiscal regime for extractive industries, including licensing and contracting, though modules in the areas of
57 Dabán Sánchez and Hélis (2010) focus on the particular aspects of PFM that warrant emphasis for RRDCs. 58 The Fund established the TTF to support 50 LICs and LMICs that have substantial current or prospective hydrocarbon and mineral exploitation. The TTF concentrates on capacity building in five areas: (i) the fiscal regime; (ii) revenue administration; (iii) macrofiscal policies and PFM; (iv) asset and liability management; and (v) statistics. The TTF leverages the Fund’s in-house expertise; it is programmatic, covering all economic topics related to transforming natural resource wealth into development; and it delivers TA flexibly in modules tailored to country circumstances.
012345
2002-2008 2009-2011
Total Fiscal Conditionality(Average number of structural conditions per review)
RRDCs Non-RRDCs
012345
2002-2008 2009-2011
Public Finance Management(Average number of structural conditions per review)
RRDCs Non-RRDCs
Figure 16. Fiscal Conditionality in Fund-Supported Programs
Sources: MONA Database; and IMF staff estimates.
0.0
0.2
0.4
0.6
0.8
1.0
1.2
2002-2008 2009-2011
Sources: MONA database; and IMF staff estimates.
RRDCs
Non-RRDCs
Figure 17. Revenue Administration Conditionality in Fund-Supported Programs(Average number of structural conditions per review)
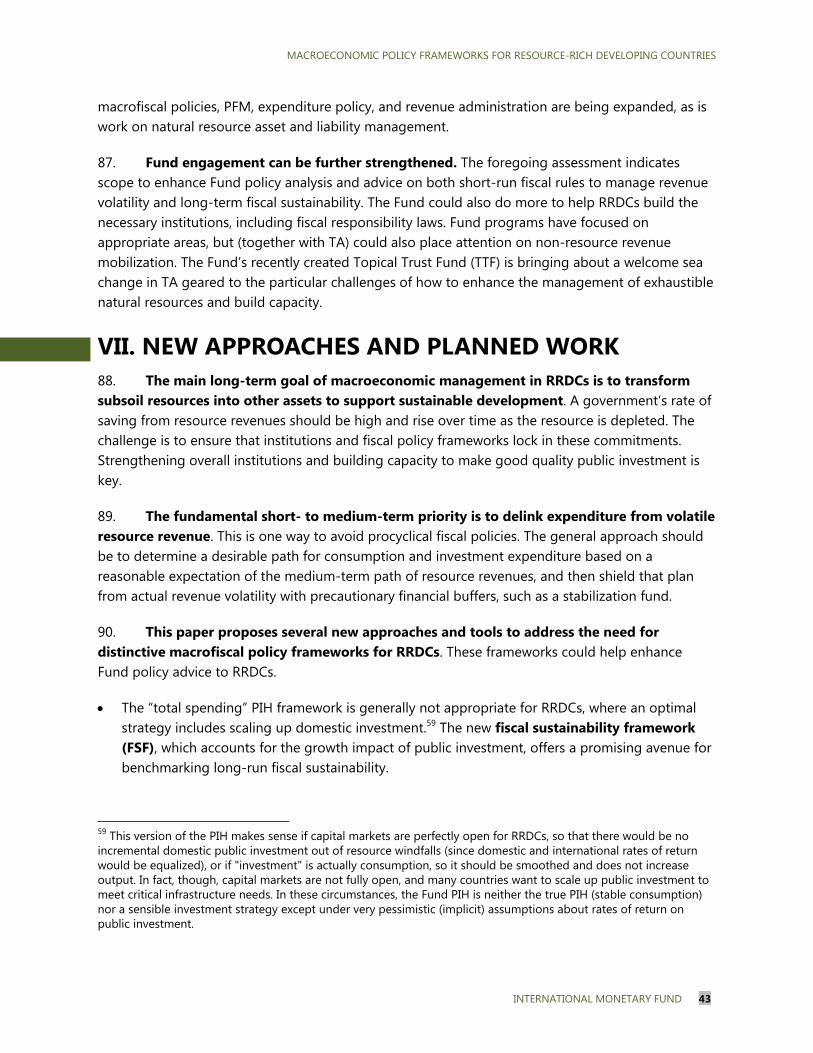
MACROECONOMIC POLICY FRAMEWORKS FOR RESOURCE-RICH DEVELOPING COUNTRIES
INTERNATIONAL MONETARY FUND 43
macrofiscal policies, PFM, expenditure policy, and revenue administration are being expanded, as is work on natural resource asset and liability management.
87. Fund engagement can be further strengthened. The foregoing assessment indicates scope to enhance Fund policy analysis and advice on both short-run fiscal rules to manage revenue volatility and long-term fiscal sustainability. The Fund could also do more to help RRDCs build the necessary institutions, including fiscal responsibility laws. Fund programs have focused on appropriate areas, but (together with TA) could also place attention on non-resource revenue mobilization. The Fund’s recently created Topical Trust Fund (TTF) is bringing about a welcome sea change in TA geared to the particular challenges of how to enhance the management of exhaustible natural resources and build capacity.
VII. NEW APPROACHES AND PLANNED WORK 88. The main long-term goal of macroeconomic management in RRDCs is to transform subsoil resources into other assets to support sustainable development. A government’s rate of saving from resource revenues should be high and rise over time as the resource is depleted. The challenge is to ensure that institutions and fiscal policy frameworks lock in these commitments. Strengthening overall institutions and building capacity to make good quality public investment is key.
89. The fundamental short- to medium-term priority is to delink expenditure from volatile resource revenue. This is one way to avoid procyclical fiscal policies. The general approach should be to determine a desirable path for consumption and investment expenditure based on a reasonable expectation of the medium-term path of resource revenues, and then shield that plan from actual revenue volatility with precautionary financial buffers, such as a stabilization fund.
90. This paper proposes several new approaches and tools to address the need for distinctive macrofiscal policy frameworks for RRDCs. These frameworks could help enhance Fund policy advice to RRDCs.
The “total spending” PIH framework is generally not appropriate for RRDCs, where an optimal strategy includes scaling up domestic investment.59 The new fiscal sustainability framework (FSF), which accounts for the growth impact of public investment, offers a promising avenue for benchmarking long-run fiscal sustainability.
59 This version of the PIH makes sense if capital markets are perfectly open for RRDCs, so that there would be no incremental domestic public investment out of resource windfalls (since domestic and international rates of return would be equalized), or if "investment" is actually consumption, so it should be smoothed and does not increase output. In fact, though, capital markets are not fully open, and many countries want to scale up public investment to meet critical infrastructure needs. In these circumstances, the Fund PIH is neither the true PIH (stable consumption) nor a sensible investment strategy except under very pessimistic (implicit) assumptions about rates of return on public investment.

MACROECONOMIC POLICY FRAMEWORKS FOR RESOURCE-RICH DEVELOPING COUNTRIES
44 INTERNATIONAL MONETARY FUND
Countries need to scale up public investment sustainably while building capacity to alleviate absorption constraints (notably by improving PFM, especially the capacity for investment selection, monitoring, and ex post evaluation) and ensuring a permanently higher public capital stock. The new model-based sustainable investment tool can inform policy choices on alternative investment scaling up paths and examine implications for reasonable overall rates for saving out of resource revenues and sustainable consumption trajectories. This requires making assumptions about expected investment returns and tax revenue benefits, which though difficult to forecast in practice are essential. Frameworks that demand such assessments will promote more and better analyses of the rate of return on public capital, the efficiency of public investment, and absorptive capacity constraints.
Complementary fiscal indicators for RRDC staff reports that measure the growth in public investment and financial savings in relation to the growth in resource revenue could help reorient policy discussions. Indicators could provide a basis for assessing how much of a nonrenewable revenue source is being consumed, and how much of what is saved is in domestic investment and how much in foreign assets. Policy makers could use these assessments for potentially resonant communication with their citizens.
Non-resource balance and price-based fiscal rules are useful fiscal policy anchors to delink expenditure paths from volatile and uncertain resource revenues. Expenditure growth limits for current and capital expenditure can be useful complementary “speed bump” targets. A new Excel template for fiscal rules in RRDCs can be used to analyze practical steps for designing frameworks to smooth revenue volatility and assess long-run fiscal sustainability.
Value-at-risk analysis and model-based tools can help determine the necessary size of precautionary fiscal buffers to prevent significant cuts in investment and other spending if there are resource revenue shocks while investment is being scaled up.
An analytic framework for understanding the short-run macroeconomic impact of resource windfalls highlights the need for coordination of fiscal, monetary, and exchange rate policies.
External sector assessments also need to account for public investment scaling up and the impact on private investment, with implications for CA dynamics and NFA positions after resource windfalls. A simple model-based external sustainability tool can complement current Fund approaches.
A. Future Work
91. A second phase of the work initiated for this paper is planned. Staff intends to create a practical tool kit to guide the work of mission teams and country authorities, with strategies for TA and training. This would need to be flexible so that it can be tailored to country circumstances. Opportunities to link with the World Bank on this agenda will also be explored.60
60 The World Bank's Extractives for Development (E4D) Initiative seeks to integrate assistance to oil, gas, and mining-endowed developing countries across the extractive industry value chain. E4D shifts the focus from the development
(continued)
MACROECONOMIC POLICY FRAMEWORKS FOR RESOURCE-RICH DEVELOPING COUNTRIES
INTERNATIONAL MONETARY FUND 45
92. The proposed new frameworks and tools will be further developed and piloted:
Fiscal frameworks and rules. The Excel templates with steps for assessing long-run fiscal sustainability and analyzing tradeoffs associated with alternative short-run fiscal rules and anchors will be further refined, adapted to specific country circumstances, and piloted.
Complementary fiscal indicators. The indicators will be calculated and analyzed in a few country case studies (including, for example, cases of a new resource discovery, a resource revenue windfall, and a non-boom revenue growth period for a mature producer). Operational guidelines for use of these indicators in RRDC staff reports would be prepared as a future step.
Sustainable investing tool. The model will be extended to allow for the possibility of financing investment by borrowing. Additional country applications will be piloted (particularly for a country with a short reserve horizon), and usage could be promoted through development of a user-friendly “front end” (interface to the specialized software) and internal training.
External sustainability model. Additional country applications and further work on taking the model to the data will be undertaken, with the model tailored to country-specific circumstances. To analyze the impact of resource price volatility, uncertainty will be introduced into the model more systematically.
93. In the next stages of the work, staff will also (i) examine the multidimensional and hard-to-quantify “absorptive capacity” concept and develop country-specific proxies; (ii) build a cross-country database of variables for RRDCs (for example, reserves and reserve horizon, actual and projected resource revenue by main component, non-resource GDP, and the investment strategy of resource funds in terms, e.g., of strategic asset allocation characteristics and governance structures); and (iii) further analyze short-run macroeconomic management challenges, such as the optimal size of stabilization funds, and the implications of policy mixes for the volatility of key macroeconomic aggregates.
B. Issues for Discussion
Do Directors agree that the distinct characteristics of RRDCs (e.g., credit constraints and capital scarcity) make the traditional consumption-saving/investment frameworks inadequate? Do Directors agree that it is optimal for RRDCs to save part of their natural resource revenues in domestic real assets, with a focus on scaling up public investment in order to enhance the economy’s productive capacity, and that governments should aim for a relatively smooth path of
of the extractive industry (Discovery and Depletion) to a broader perspective encompassing Diversification and Development. E4D's work program is focused on (1) Sector Governance to improve transparency, accountability, and oversight through the value chain, including the award of concessions and contracts, revenue mobilization, management of SWFs, and use of resource revenues for development; (2) integrated Sector Management through investments in geodata and infrastructure supporting extractive industries, and integration of extractive industries in regional planning and community-based development; and (3) Economic Management to link the sector and broader development policy, notably through resource-led diversification, resource corridors and local content development.
MACROECONOMIC POLICY FRAMEWORKS FOR RESOURCE-RICH DEVELOPING COUNTRIES
46 INTERNATIONAL MONETARY FUND
current spending to avoid abrupt consolidations in future public consumption (which could have a detrimental impact on domestic economic activity and the delivery of key public services)?
Do Directors agree that, in view of exhaustibility of natural resources, the assessment of fiscal sustainability is important for all RRDCs and is especially critical for countries with short reserve horizons? Do Directors support the proposed fiscal sustainability benchmarks to guide a possible of public spending scaling up?
Do Directors support fiscal frameworks that seek to delink government expenditure from externally-driven volatility?
Do Directors agree that resource funds should be managed transparently within a properly formulated asset and liability management framework managed according to country circumstances and capacity levels? Do Directors also agree that deposits and withdrawals from resource funds should be integrated in the budget to avoid fragmentation in expenditure prioritization, and effective fiscal management?
Do Directors agree that external sector assessments should take into account the need for scaling up public investment?
MACROECONOMIC POLICY FRAMEWORKS FOR RESOURCE-RICH DEVELOPING COUNTRIES
INTERNATIONAL MONETARY FUND 47
Appendix 1. Resource-Rich and Non-Resource-Rich Countries Included in the Analysis
This paper compares a group of resource-rich developing countries (RRDCs) to a group of countries that are not resource-rich. The RRDC group members were selected based on the following two criteria:
Using 2010 GNI per capita, they were either a low- or lower-middle-income country (LIC or LMIC according to the World Bank classification); and
Using average data for 2006–10, at least 20 percent of their total exports were natural resources or they derived at least 20 percent of their revenue from natural resources.
Gabon and Equatorial Guinea are also treated as RRDCs (even though their income is above the LMIC threshold) because they are members of the CEMAC monetary union, and Liberia, Niger, Côte d´Ivoire, and Uzbekistan are included even though data for them are incomplete. This gives the following groups (see also Table 1 in this appendix):
Resource-rich developing countries (29): Angola, Bolivia, Cameroon, Chad, Dem. Rep. of Congo, Rep. of Congo, Côte d’Ivoire, Equatorial Guinea, Gabon, Guinea, Guyana, Indonesia, Iraq, Lao PDR, Liberia, Mali, Mauritania, Mongolia, Niger, Nigeria, Papua New Guinea, Sudan, Syrian Arab Republic, Timor-Leste, Turkmenistan, Uzbekistan, Vietnam, Yemen, and Zambia.
Comparison group (63): Afghanistan, Armenia, Bangladesh, Belize, Benin, Bhutan, Burkina Faso, Burundi, Cambodia, Cape Verde, Central African Republic, Comoros, Djibouti, Dominica, Egypt, El Salvador, Eritrea, Ethiopia, Fiji, The Gambia, Georgia, Ghana, Grenada, Guatemala, Guinea-Bissau, Haiti, Honduras, India, Kenya, Kiribati, Kyrgyz Republic, Lesotho, Madagascar, Malawi, Maldives, Moldova, Morocco, Mozambique, Myanmar, Nepal, Nicaragua, Pakistan, Paraguay, Philippines, Rwanda, Samoa, São Tomé and Príncipe, Senegal, Sierra Leone, Solomon Islands, Sri Lanka, St. Kitts and Nevis, St. Lucia, St. Vincent & Grenadines, Swaziland, Tajikistan, Tanzania, Togo, Tonga, Uganda, Ukraine, Vanuatu, and Zimbabwe.
Some of the policy recommendations in this paper may also apply to LICs/LMICs that are prospective natural resource exporters and to resource-rich upper-middle-income countries:
Prospective natural resource-exporting LICs/LMICs: Afghanistan, Central African Republic, Ghana, Guatemala, Kyrgyz Republic, Lao PDR, Madagascar, Mozambique, São Tomé and Príncipe, Sierra Leone, Tanzania, and Togo.
Upper-middle-income resource-rich economies: Albania, Algeria, Azerbaijan, Botswana, Chile, Ecuador, Iran, Kazakhstan, Libya, Mexico, Peru, Russia, Suriname, and Venezuela.
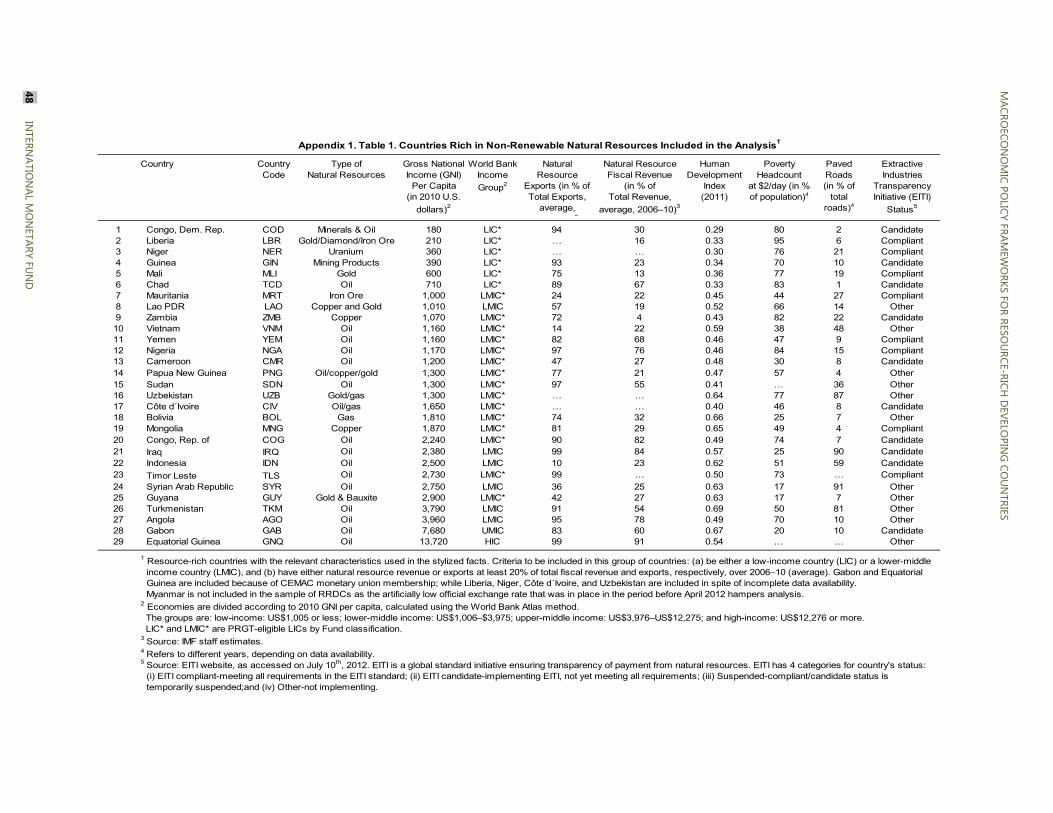
Country CountryCode
Type ofNatural Resources
Gross NationalIncome (GNI)
Per Capita(in 2010 U.S.
dollars)2
World BankIncome
Group2
Natural Resource
Exports (in % ofTotal Exports,
average, 3
Natural ResourceFiscal Revenue
(in % ofTotal Revenue,
average, 2006–10)3
Human Development
Index(2011)
PovertyHeadcount
at $2/day (in %of population)4
PavedRoads(in % of
total roads)4
Extractive Industries
Transparency Initiative (EITI)
Status5
1 Congo, Dem. Rep. COD Minerals & Oil 180 LIC* 94 30 0.29 80 2 Candidate2 Liberia LBR Gold/Diamond/Iron Ore 210 LIC* … 16 0.33 95 6 Compliant3 Niger NER Uranium 360 LIC* … … 0.30 76 21 Compliant4 Guinea GIN Mining Products 390 LIC* 93 23 0.34 70 10 Candidate5 Mali MLI Gold 600 LIC* 75 13 0.36 77 19 Compliant6 Chad TCD Oil 710 LIC* 89 67 0.33 83 1 Candidate7 Mauritania MRT Iron Ore 1,000 LMIC* 24 22 0.45 44 27 Compliant8 Lao PDR LAO Copper and Gold 1,010 LMIC 57 19 0.52 66 14 Other9 Zambia ZMB Copper 1,070 LMIC* 72 4 0.43 82 22 Candidate10 Vietnam VNM Oil 1,160 LMIC* 14 22 0.59 38 48 Other11 Yemen YEM Oil 1,160 LMIC* 82 68 0.46 47 9 Compliant12 Nigeria NGA Oil 1,170 LMIC* 97 76 0.46 84 15 Compliant13 Cameroon CMR Oil 1,200 LMIC* 47 27 0.48 30 8 Candidate14 Papua New Guinea PNG Oil/copper/gold 1,300 LMIC* 77 21 0.47 57 4 Other15 Sudan SDN Oil 1,300 LMIC* 97 55 0.41 … 36 Other16 Uzbekistan UZB Gold/gas 1,300 LMIC* … … 0.64 77 87 Other17 Côte d´Ivoire CIV Oil/gas 1,650 LMIC* … … 0.40 46 8 Candidate18 Bolivia BOL Gas 1,810 LMIC* 74 32 0.66 25 7 Other19 Mongolia MNG Copper 1,870 LMIC* 81 29 0.65 49 4 Compliant20 Congo, Rep. of COG Oil 2,240 LMIC* 90 82 0.49 74 7 Candidate21 Iraq IRQ Oil 2,380 LMIC 99 84 0.57 25 90 Candidate22 Indonesia IDN Oil 2,500 LMIC 10 23 0.62 51 59 Candidate23 Timor Leste TLS Oil 2,730 LMIC* 99 … 0.50 73 … Compliant
24 Syrian Arab Republic SYR Oil 2,750 LMIC 36 25 0.63 17 91 Other25 Guyana GUY Gold & Bauxite 2,900 LMIC* 42 27 0.63 17 7 Other26 Turkmenistan TKM Oil 3,790 LMIC 91 54 0.69 50 81 Other27 Angola AGO Oil 3,960 LMIC 95 78 0.49 70 10 Other28 Gabon GAB Oil 7,680 UMIC 83 60 0.67 20 10 Candidate29 Equatorial Guinea GNQ Oil 13,720 HIC 99 91 0.54 … … Other
1 Resource-rich countries with the relevant characteristics used in the stylized facts. Criteria to be included in this group of countries: (a) be either a low-income country (LIC) or a lower-middleincome country (LMIC), and (b) have either natural resource revenue or exports at least 20% of total fiscal revenue and exports, respectively, over 2006–10 (average). Gabon and EquatorialGuinea are included because of CEMAC monetary union membership; while Liberia, Niger, Côte d´Ivoire, and Uzbekistan are included in spite of incomplete data availability. Myanmar is not included in the sample of RRDCs as the artificially low official exchange rate that was in place in the period before April 2012 hampers analysis.
2 Economies are divided according to 2010 GNI per capita, calculated using the World Bank Atlas method. The groups are: low-income: US$1,005 or less; lower-middle income: US$1,006–$3,975; upper-middle income: US$3,976–US$12,275; and high-income: US$12,276 or more. LIC* and LMIC* are PRGT-eligible LICs by Fund classification.3 Source: IMF staff estimates.4 Refers to different years, depending on data availability.5 Source: EITI website, as accessed on July 10th, 2012. EITI is a global standard initiative ensuring transparency of payment from natural resources. EITI has 4 categories for country's status:
(i) EITI compliant-meeting all requirements in the EITI standard; (ii) EITI candidate-implementing EITI, not yet meeting all requirements; (iii) Suspended-compliant/candidate status istemporarily suspended;and (iv) Other-not implementing.
Appendix 1. Table 1. Countries Rich in Non-Renewable Natural Resources Included in the Analysis1
MACRO
ECON
OM
IC POLICY FRAM
EWO
RKS FOR RESO
URCE-RICH
DEVELO
PING
COU
NTRIES
48 IN
TERNATIO
NAL M
ON
ETARY FUN
D
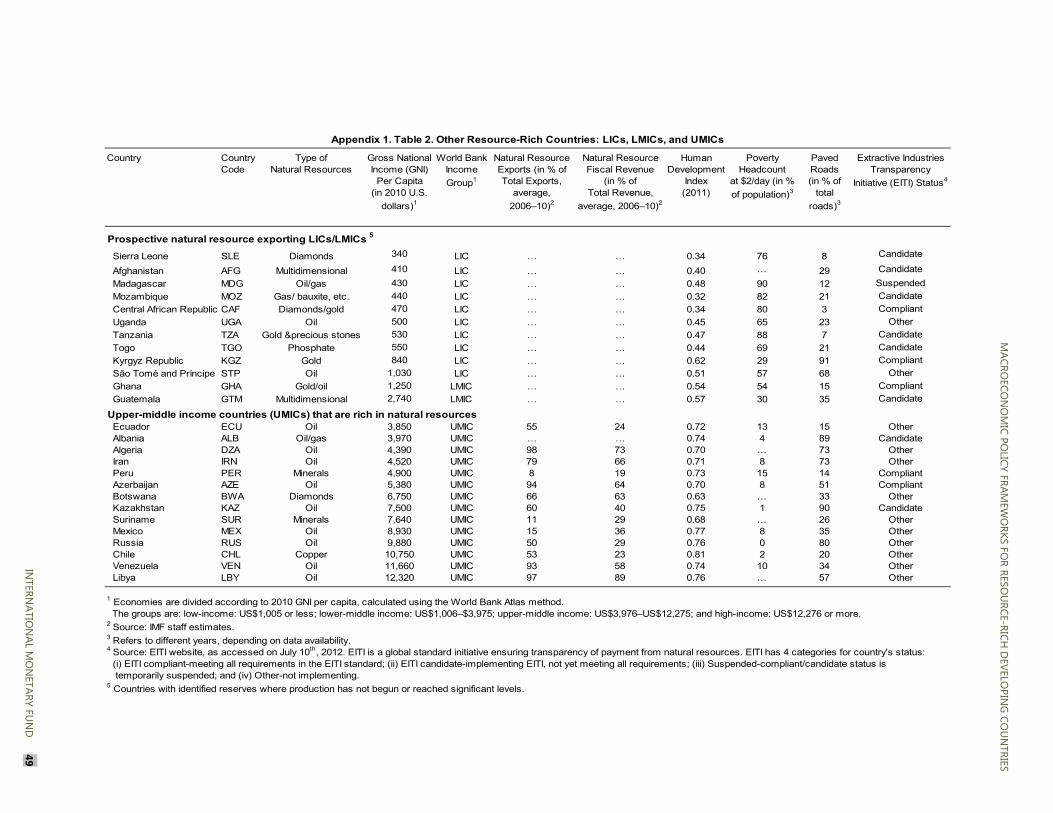
Country CountryCode
Type ofNatural Resources
Gross NationalIncome (GNI)
Per Capita(in 2010 U.S.
dollars)1
World BankIncome
Group1
Natural Resource Exports (in % ofTotal Exports,
average,
2006–10)2
Natural ResourceFiscal Revenue
(in % ofTotal Revenue,
average, 2006–10)2
Human Development
Index(2011)
PovertyHeadcount
at $2/day (in %
of population)3
PavedRoads(in % of
total
roads)3
Extractive Industries Transparency
Initiative (EITI) Status4
Prospective natural resource exporting LICs/LMICs 5
Sierra Leone SLE Diamonds 340 LIC … … 0.34 76 8 Candidate
Afghanistan AFG Multidimensional 410 LIC … … 0.40 … 29 Candidate
Madagascar MDG Oil/gas 430 LIC … … 0.48 90 12 Suspended
Mozambique MOZ Gas/ bauxite, etc. 440 LIC … … 0.32 82 21 Candidate
Central African Republic CAF Diamonds/gold 470 LIC … … 0.34 80 3 Compliant
Uganda UGA Oil 500 LIC … … 0.45 65 23 Other
Tanzania TZA Gold &precious stones 530 LIC … … 0.47 88 7 Candidate
Togo TGO Phosphate 550 LIC … … 0.44 69 21 Candidate
Kyrgyz Republic KGZ Gold 840 LIC … … 0.62 29 91 Compliant
São Tomé and Príncipe STP Oil 1,030 LIC … … 0.51 57 68 Other
Ghana GHA Gold/oil 1,250 LMIC … … 0.54 54 15 Compliant
Guatemala GTM Multidimensional 2,740 LMIC … … 0.57 30 35 Candidate
Upper-middle income countries (UMICs) that are rich in natural resourcesEcuador ECU Oil 3,850 UMIC 55 24 0.72 13 15 OtherAlbania ALB Oil/gas 3,970 UMIC … … 0.74 4 89 CandidateAlgeria DZA Oil 4,390 UMIC 98 73 0.70 … 73 OtherIran IRN Oil 4,520 UMIC 79 66 0.71 8 73 OtherPeru PER Minerals 4,900 UMIC 8 19 0.73 15 14 CompliantAzerbaijan AZE Oil 5,380 UMIC 94 64 0.70 8 51 CompliantBotswana BWA Diamonds 6,750 UMIC 66 63 0.63 … 33 OtherKazakhstan KAZ Oil 7,500 UMIC 60 40 0.75 1 90 CandidateSuriname SUR Minerals 7,640 UMIC 11 29 0.68 … 26 OtherMexico MEX Oil 8,930 UMIC 15 36 0.77 8 35 OtherRussia RUS Oil 9,880 UMIC 50 29 0.76 0 80 OtherChile CHL Copper 10,750 UMIC 53 23 0.81 2 20 OtherVenezuela VEN Oil 11,660 UMIC 93 58 0.74 10 34 OtherLibya LBY Oil 12,320 UMIC 97 89 0.76 … 57 Other
1 Economies are divided according to 2010 GNI per capita, calculated using the World Bank Atlas method. The groups are: low-income: US$1,005 or less; lower-middle income: US$1,006–$3,975; upper-middle income: US$3,976–US$12,275; and high-income: US$12,276 or more.2 Source: IMF staff estimates.3 Refers to different years, depending on data availability.
5 Countries with identified reserves where production has not begun or reached significant levels.
(i) EITI compliant-meeting all requirements in the EITI standard; (ii) EITI candidate-implementing EITI, not yet meeting all requirements; (iii) Suspended-compliant/candidate status is
4 Source: EITI website, as accessed on July 10th, 2012. EITI is a global standard initiative ensuring transparency of payment from natural resources. EITI has 4 categories for country's status:
temporarily suspended; and (iv) Other-not implementing.
Appendix 1. Table 2. Other Resource-Rich Countries: LICs, LMICs, and UMICs
MACRO
ECON
OM
IC POLICY
FRAMEW
ORKS FO
R RESOU
RCE-RICH D
EVELOPIN
G CO
UN
TRIESM
ACROECO
NO
MIC PO
LICY FRAMEW
ORKS FO
R RESOU
RCE-RICH D
EVELOPIN
G CO
UN
TRIESM
ACROECO
NO
MIC PO
LICYFRAM
EWO
RKS FOR RESO
URCE-RICH
DEVELO
PING
COU
NTRIES
INTERN
ATION
AL MO
NETARY FU
ND
49
IN
TERNATIO
NAL M
ON
ETARY FUN
D
49
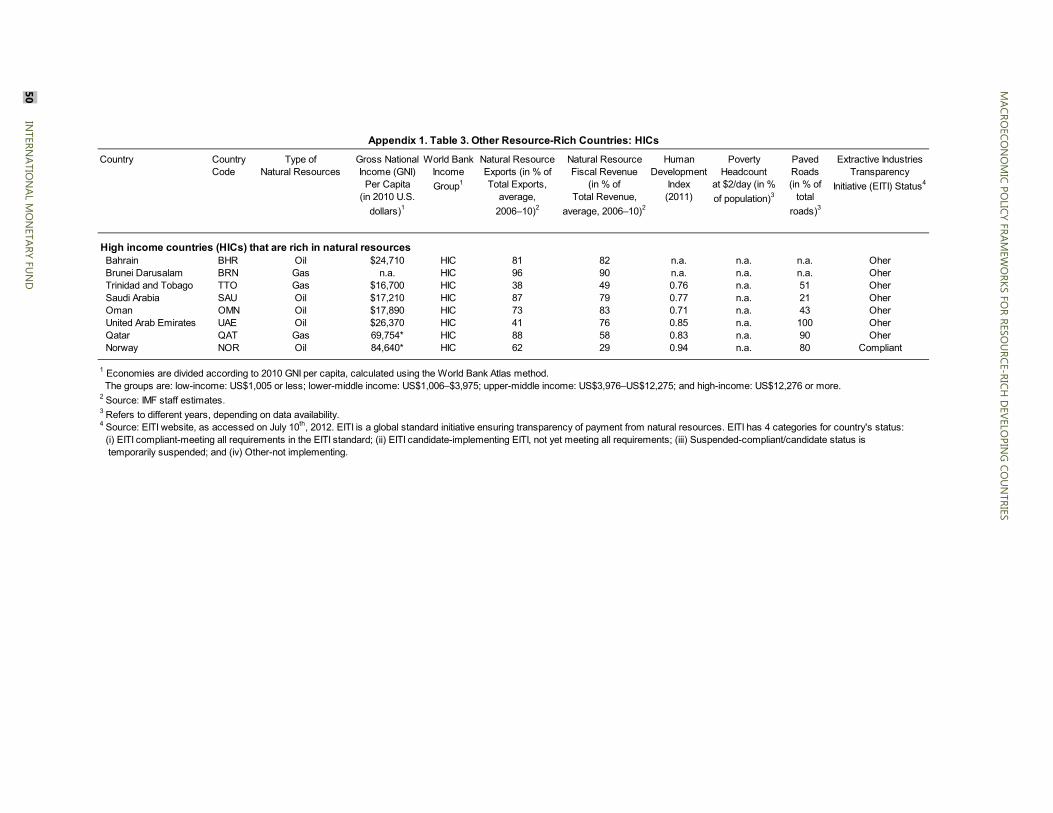
Country CountryCode
Type ofNatural Resources
Gross NationalIncome (GNI)
Per Capita(in 2010 U.S.
dollars)1
World BankIncome
Group1
Natural Resource Exports (in % ofTotal Exports,
average,
2006–10)2
Natural ResourceFiscal Revenue
(in % ofTotal Revenue,
average, 2006–10)2
Human Development
Index(2011)
PovertyHeadcount
at $2/day (in %
of population)3
PavedRoads(in % of
total
roads)3
Extractive Industries Transparency
Initiative (EITI) Status4
High income countries (HICs) that are rich in natural resourcesBahrain BHR Oil $24,710 HIC 81 82 n.a. n.a. n.a. OherBrunei Darusalam BRN Gas n.a. HIC 96 90 n.a. n.a. n.a. OherTrinidad and Tobago TTO Gas $16,700 HIC 38 49 0.76 n.a. 51 OherSaudi Arabia SAU Oil $17,210 HIC 87 79 0.77 n.a. 21 OherOman OMN Oil $17,890 HIC 73 83 0.71 n.a. 43 OherUnited Arab Emirates UAE Oil $26,370 HIC 41 76 0.85 n.a. 100 OherQatar QAT Gas 69,754* HIC 88 58 0.83 n.a. 90 OherNorway NOR Oil 84,640* HIC 62 29 0.94 n.a. 80 Compliant
1 Economies are divided according to 2010 GNI per capita, calculated using the World Bank Atlas method. The groups are: low-income: US$1,005 or less; lower-middle income: US$1,006–$3,975; upper-middle income: US$3,976–US$12,275; and high-income: US$12,276 or more.2 Source: IMF staff estimates.3 Refers to different years, depending on data availability.4 Source: EITI website, as accessed on July 10th, 2012. EITI is a global standard initiative ensuring transparency of payment from natural resources. EITI has 4 categories for country's status:
(i) EITI compliant-meeting all requirements in the EITI standard; (ii) EITI candidate-implementing EITI, not yet meeting all requirements; (iii) Suspended-compliant/candidate status is temporarily suspended; and (iv) Other-not implementing.
Appendix 1. Table 3. Other Resource-Rich Countries: HICs
MACRO
ECON
OM
IC POLICY FRAM
EWO
RKS FOR RESO
URCE-RICH
DEVELO
PING
COU
NTRIES
50 IN
TERNATIO
NAL M
ON
ETARY FUN
D
MACROECONOMIC POLICY FRAMEWORKS FOR RESOURCE-RICH DEVELOPING COUNTRIES
INTERNATIONAL MONETARY FUND 51
References Araujo, Juliana, Bin Grace Li, Marcos Poplawski-Ribeiro, and Luis Felipe Zanna, 2012,“Current
Account Norms in Natural Resource-Rich and Capital Scarce Economies,” IMF Working Paper (forthcoming; Washington: International Monetary Fund).
Arezki, Rabah and Marcus Bruckner, 2010, “Commodity Windfalls, Polarization, and Net Foreign Assets: Panel Data on the Voracity Effect,” IMF Working Paper 10/209 (Washington: International Monetary Fund).
__________, 2011, “Oil Rents, Corruption, and State Stability: Evidence From Panel Data Regressions,” European Economic Review, Vol. 55, No.7, pp. 955-963.
________, K. Hamilton and K. Kazimov, 2011, “Resource Windfalls, Macroeconomic Stability and Economic Growth”, IMF Working Paper 11/142 (Washington: International Monetary Fund).
__________ and Kareem Ismail, 2010, “Boom-Bust Cycles, Asymmetrical Fiscal Response and the Dutch Disease,” IMF Working Paper 10/94 (Washington: International Monetary Fund).
Barma, Naazneen, Kai Kaiser, Tuanh Minh Le, and Lorena Vinuela, 2012, Rents to Riches? The Political Economy of Natural Resource-Led Development, (Washington: World Bank).
Barnett, Steven and Rolando Ossowski, 2003, “Operational Aspects of Fiscal Policy in Oil-Producing Countries,” IMF Working Paper 02/177 (Washington: International Monetary Fund).
Bartsch, Ulrich, 2006, “How Much Is Enough? Monte Carlo Simulations of an Oil Stabilization Fund for Nigeria,” IMF Working Paper 06/142 (Washington: International Monetary Fund).
Baunsgaard, Thomas, Mauricio Villafuerte, Marcos Poplawski-Ribeiro, and Christine Richmond, 2012, Fiscal Frameworks for Natural Resource Intensive Developing Countries, IMF Staff Discussion Note No. 12/04 (Washington: International Monetary Fund).
Beidas-Strom, Samya and Paul Cashin, 2011, “Are Middle Eastern Current Account Imbalances Excessive?” IMF Working Paper 11/195 (Washington: International Monetary Fund).
Bems, Rudolfs and Irineu de Carvalho Filho, 2009a, “Exchange Rate Assessments: Methodologies for Oil Exporting Countries,” IMF Working Paper 09/281(Washington: International Monetary Fund).
__________, 2009b, “Current Account and Precautionary Savings for Exporters of Exhaustible Resources,” IMF Working Paper 09/33 (Washington: International Monetary Fund).
__________, 2011, “The Current Account and Precautionary Savings for Exporters of Exhaustible Resources,” Journal of International Economics, Vol. 84, No. 1, pp. 48–64.
Berg, Andrew, Rafael Portillo, Chu-Shun S. Yang, and Luis Felipe Zanna, 2012, “Public Investment in Resource Abundant Low-Income Countries” (forthcoming; Washington: International Monetary Fund).
MACROECONOMIC POLICY FRAMEWORKS FOR RESOURCE-RICH DEVELOPING COUNTRIES
52 INTERNATIONAL MONETARY FUND
__________, Jan Gottschalk, Rafael Portillo and Luis Felipe Zanna, 2010, “The Macroeconomics of Medium Term Aid Scaling up Scenarios,” IMF Working Paper 10/160 (Washington: International Monetary Fund).
__________, Shekhar Aiyar, Mumtaz Hussain, Shaun K. Roache, Tokhir N. Mirzoev, and Amber Mahone, 2007, The Macroeconomics of Scaling Up Aid: Lessons from Recent Experience, IMF Occasional Paper No. 253 (Washington: International Monetary Fund).
Bhattacharyya, Sambit and Paul Collier, 2011, “Public Capital in Resource-Rich Economies: Is there a curse?” CSAE Working Paper 2011-14 (Oxford: Center for the Study of African Economies).
Boakye, Daniel, Sébastien Dessus, Yusuf Foday, and Felix Oppong, “Investing Mineral Wealth in Development Assets: Ghana, Liberia and Sierra Leone,” World Bank Policy Research Paper No. 6089 (Washington: World Bank).
Bornhorst, Fabian, Sanjeev Gupta, and John Thornton, 2009, “Natural Resource Endowments, Governance, and the Domestic Revenue Effort,” European Journal of Political Economy, Vol. 25, pp. 439-446.
Brahmbhatt, Milan, Otaviano Canuto, and Ekaterina Vostroknutova, 2010, “Natural Resources and Development Strategy after the Crisis,” in The Day after Tomorrow: A Handbook on the Future of Economic Policy in the Developing World, ed. by Canuto, Otaviano, and Giugale (Washington: World Bank).
Cashin, Paul and Catherine Pattillo, 2000, “Terms of Trade Shocks in Africa: Are they Short-Lived or Long-Lived?” IMF Working Paper 00/72 (Washington: International Monetary Fund).
Cashin, Paul and C. John McDermott, 2000, “The Long-Run Behavior of Commodity Prices: Small Trends and Big Variability,” Staff Papers, International Monetary Fund, Vol. 47, No. 2, pp. 175–199.
Cashin, Paul, C. John McDermott, and Alasdair Scott, 2002, “Booms and Slumps in World Commodity Prices,” Journal of Development Economics, Vol. 69, pp. 277–296.
Cashin, Paul, Sam Ouliaris, and Tigran Poghosyan, 2011, “Oil Currencies and the Real Exchange Rate,” IMF Working Paper (forthcoming; Washington: International Monetary Fund).
Cashin, Paul, Hong Liang, and C. John McDermott, 2000, “How Persistent are Shocks to World Commodity Prices?” Staff Papers, International Monetary Fund, Vol. 47, No. 2, pp. 177–217.
Cherif, Reda and Fuad Hasanov, 2012a, “Oil Exporters’ Dilemma: How Much to Save and How Much to Invest,” IMF Working Paper 12/4 (Washington: International Monetary Fund).
__________, 2012b, “The Volatility Trap: Precautionary Saving, Investment, and Aggregate Risk,” IMF Working Paper 12/134 (Washington: International Monetary Fund).
Christiansen, Lone, Alessandro Prati, Luca Antonio Ricci, and Thierry Tressel, 2009, “External Balance in Low Income Countries,” IMF Working Paper 09/221 (Washington: International Monetary Fund).

MACROECONOMIC POLICY FRAMEWORKS FOR RESOURCE-RICH DEVELOPING COUNTRIES
INTERNATIONAL MONETARY FUND 53
Collier, Paul, 2011, “Savings and Investment Decisions in Low-Income Resource-Rich Countries.” (Oxford: Center for the Study of African Economies).
__________, 2012, “Savings from Natural Resource Revenues in Developing Countries: Principles and Policy Rules,” (Mimeo, Oxford University).
Collier, Paul, Frederick van der Ploeg, Michael Spence, and Anthony J. Venables, 2010, “Managing Resource Revenues in Developing Countries,” Staff Papers, International Monetary Fund, Vol. 57, No. 1, pp. 84–118.
Cuddington, John and Daniel Jerrett, 2008, “Super Cycles in Real Metals Prices?” Staff Papers, International Monetary Fund, Vol. 55, No. 4, pp. 541–565.
Dabán Sánchez, Teresa and Jean-Luc Hélis, 2010, “A Public Financial Management Framework for Resource-Producing Countries,” IMF Working Paper 10/72 (Washington: International Monetary Fund).
Dabla-Norris, Era, Jim Brumby, Annette Kyobe, Zac Mills, and Chris Papageorgiou, 2011, “Investing in Public Investment: An Index of Public Investment Efficiency,” IMF Working Paper 11/37 (Washington: International Monetary Fund).
Daniel, Philip, Michael Keen, and Charles McPherson, 2010, The Taxation of Petroleum and Minerals: Principles, Problems and Practice (New York: Routledge).
Escolano, Julio, 2010, “A Practical Guide to Public Debt Dynamics, Fiscal Sustainability, and Cyclical Adjustment of Budgetary Aggregates,” IMF Technical Notes and Manuals. Available at http://www.imf.org/external/pubs/ft/tnm/2010/tnm1002.pdf
Foster, Vivian and Cecilia Briceno-Garmendia, 2010, Africa’s Infrastructure: A Time for Transformation, (Washington: World Bank).
Frankel, Jeffrey, 2012, "The Natural Resource Curse: A Survey of Diagnoses and Some Prescriptions," Harvard University Working Paper No. 12-014 (Cambridge, MA: John F. Kennedy School of Government).
___________, 2011, "A Solution to Fiscal Procyclicality: The Structural Budget Institutions Pioneered by Chile," NBER Working Paper No. 16945 (Cambridge, MA: National Bureau of Economic Research).
Gupta, Sanjeev, Alvar Kangur, Chris Papageorgiou, and Abdoul Wane, 2011, “Efficiency-Adjusted Public Capital and Growth,” IMF Working Paper 11/217 (Washington: International Monetary Fund).
Hamilton, James, 2009, “Understanding Crude Oil Prices,” NBER Working Paper No. 14492 (Cambridge, MA: National Bureau of Economic Research). Available at http://www.nber.org/papers/w14492.pdf
International Monetary Fund, 2011, IEO Evaluation of Research at the IMF: Relevance and Utilization. Available at http://www.ieo-imf.org/ieo/pages/EvaluationImages124.aspx
MACROECONOMIC POLICY FRAMEWORKS FOR RESOURCE-RICH DEVELOPING COUNTRIES
54 INTERNATIONAL MONETARY FUND
__________, 2008, “Fiscal Transparency, Guide on Resource Revenue Transparency, Manual on Fiscal Transparency, Code of Good Practices on Fiscal Transparency, Report on the Observance of Standards and Codes.” Available via the internet at http://www.imf.org/external/np/fad/trans/guide.htm
__________, 2009, “Fiscal Rules: Anchoring Expectations for Sustainable Public Finances.” Available at http://www.imf.org/external/np/pp/eng/2009/121609.pdf
__________, 2011a, World Economic Outlook, April 2011: Oil Scarcity, Growth, and Global Imbalances. Available at http://www.imf.org/external/pubs/ft/weo/2011/01/
__________, 2011b, “Managing Volatility in Low-Income Countries—The Role and Potential for Contingent Financial Instruments.” Available at http://www.imf.org/external/np/pp/eng/2011/103111a.pdf
__________, 2011c, Mongolia: 2011 Article IV Consultation-Staff Report, IMF Country Report No. 11/76. Available at http://www.imf.org/external/pubs/ft/scr/2011/cr1176.pdf
__________, 2011d, “Revenue Mobilization in Developing Countries.” Available at http://www.imf.org/external/np/pp/eng/2011/030811.pdf
__________, 2012a, “Regional Economic Outlook for Sub-Saharan Africa–Sustaining Growth amid Global Uncertainty” available at http://www.imf.org/external/pubs/ft/reo/2012/afr/eng/sreo0412.pdf
__________, 2012b, “External Balance Assessment (EBA): Technical Background of the Pilot Methodology.” Available at http://www.imf.org/external/np/res/eba/
__________, 2012c, “Fiscal Regimes for Extractive Industries: Design and Implementation,” IMF Staff Papers (forthcoming; Washington).
__________, 2012d, World Economic Outlook, April 2012: Commodity Price Swings and Commodity Exporter. Available at www.imf.org/external/pubs/ft/weo/2012/01/pdf/c4.pdf
International Working Group of Sovereign Wealth Funds, 2008, “Sovereign Wealth Funds: Generally Accepted Principles and Practices—Santiago Principles.” Available at www.iwg-swf.org/pubs/eng/santiagoprinciples.pdf
Lane, Aaron, and Philip R. Lane, 1999, “The Voracity Effect,” The American Economic Review, Vol. 89, No. 1, pp. 22-46.
Lee, Jaewoo, Gian Maria Milesi-Ferretti, Jonathan Ostry, Alessandro Prati, and Luca Antonio Ricci, 2008, Exchange Rate Assessments: CGER Methodologies, IMF Occasional Paper No. 261 (Washington: International Monetary Fund).
Medas, Paulo and Daria Zakharova, 2009, “A Primer on Fiscal Analysis in Oil-Producing Countries,” IMF Working Paper 09/56 (Washington: International Monetary Fund). Available at http://www.imf.org/external/pubs/ft/wp/2009/wp0956.pdf
MACROECONOMIC POLICY FRAMEWORKS FOR RESOURCE-RICH DEVELOPING COUNTRIES
INTERNATIONAL MONETARY FUND 55
Morsy, Hanan, 2009, “Current Account Determinants for Oil-Exporting Countries,” IMF Working Paper 09/28 (Washington: International Monetary Fund).
__________, Kirk Hamilton, and Kazim Kazimov, 2011, “Resource Windfalls, Macroeconomic Stability and Growth: The Role of Political Institutions,” IMF Working Paper 11/142 (Washington: International Monetary Fund).
Rajaram, Anand, Tuan Minh Le, Nataliya Biletska, and Jim Brumby, 2010, “A Diagnostic Framework for Assessing Public Investment Management,” World Bank Policy Research Working Paper No. 5397 (Washington: World Bank).
Tabova, Alexandra and Carol Baker, 2012, “Non-oil Growth in the CFA Oil-Producing Countries: How Is It Different?” in Oil Wealth in Central Africa Policy for Inclusive Growth, ed. by B. Akitoby and S. Coorey (Washington: International Monetary Fund).
Thomas, Alun, Jun Il Kim, and Aqib Aslam, 2008, “Equilibrium Non-Oil Current Account Assessments for Oil Producing Countries,” IMF Working Paper 08/198 (Washington: International Monetary Fund).
Thomas, Alun and Tamim Bayoumi, 2009, “Today Versus Tomorrow: The Sensitivity of the Non-Oil Current Account Balance to Permanent and Current Income,” IMF Working Paper 09/248 (Washington: International Monetary Fund).
Van den Bremer, Ton S. and Frederick van der Ploeg, 2012, “How to Spend a Windfall: Dealing with Volatility and Capital Scarcity,” paper prepared for the CBRT-IMFER Conference on “Policy Responses to Commodity Price Movements,” Istanbul, 6-7 April. Available at www.imf.org/external/np/seminars/eng/2011/tur/pdf/vander.pdf
Van der Ploeg, Frederick, 2011, “Natural Resources: Curse or Blessing?” Journal of Economic Literature, Vol. 49, No. 2, pp. 366–420.
Van der Ploeg, Frederick and Anthony J. Venables, 2011, “Harnessing Windfall Revenues: Optimal Policies for Resource-Rich Developing Economies,” The Economic Journal, Vol. 121, pp. 1–30.
Van der Ploeg, Frederick and Anthony J. Venables, 2010, “Absorbing a Windfall of Foreign Exchange: Dutch Disease Dynamics,” OxCarre Research Paper, No. 52. (Oxford: Centre for the Analysis of Resource-Rich Economies).
Van der Ploeg, Frederick, 2010, “Aggressive Oil Extraction and Precautionary Saving: Coping With Volatility,” Journal of Public Economics, Vol. 94, Issue 5-6, pp. 421–433.
Van der Ploeg, Frederick and Steven Poelhekke, 2009, “Volatility and the Natural Resource Curse,” Oxford Economic Papers, Vol. 61, pp. 727–760.
World Bank, 2007, Natural Resources: Neither Curse nor Destiny (Washington: World Bank).
__________, 2011, The Changing Wealth of Nations. Measuring Sustainable Development in the New Millennium (Washington: World Bank).
__________, 2012, Beyond the Curse: Policies to Harness the Power of Natural Resources (Washington: World Bank).