macroeconomic trends and near-term policy challenges in emerging asia
TRANSCRIPT
Chaipat Poonpatpibul
ASEAN+3 Macroeconomic Research Office
14 May 2015, Tokyo, Japan
4th OECD-AMRO-ADB Asian Regional Roundtable
0
Macroeconomic trends and near-term policy challenges in Emerging Asia
Disclaimer: The findings, interpretations, and conclusions expressed in this material represent the views of the author(s) and are not necessarily those of the ASEAN+3 Macroeconomic Research Office (AMRO) or its member authorities. Neither AMRO nor its member authorities shall be held responsible for any consequence of the use of the information contained therein.
1
Outline
1. Major Global Developments and Impact on Regional Economies
2. Developments on Regional Growth and Stability
3. Near-term Policy Discussion

2
1. Major Global Developments and Impact
on Regional Economies
- Declining global oil prices
- Divergence of monetary policy in advanced economies
- Growth moderation and structural changes in China
3
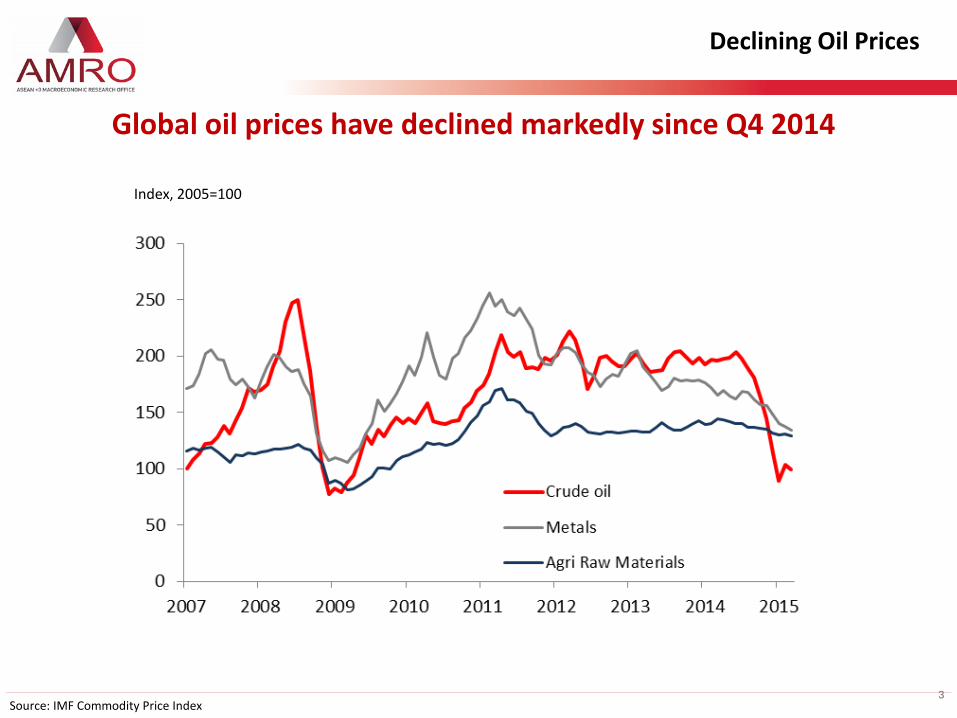
Declining Oil Prices
Global oil prices have declined markedly since Q4 2014
Source: IMF Commodity Price Index
Index, 2005=100
4
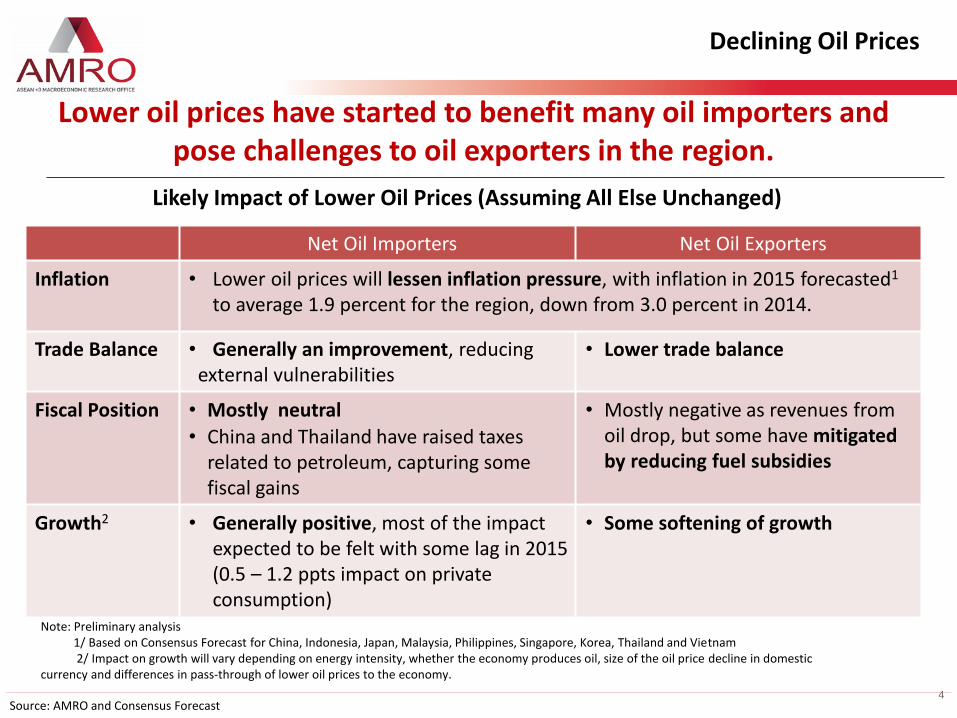
Likely Impact of Lower Oil Prices (Assuming All Else Unchanged)
Source: AMRO and Consensus Forecast
Net Oil Importers Net Oil Exporters
Inflation • Lower oil prices will lessen inflation pressure, with inflation in 2015 forecasted1 to average 1.9 percent for the region, down from 3.0 percent in 2014.
Trade Balance • Generally an improvement, reducing external vulnerabilities
• Lower trade balance
Fiscal Position
• Mostly neutral
• China and Thailand have raised taxes related to petroleum, capturing some fiscal gains
• Mostly negative as revenues from oil drop, but some have mitigated by reducing fuel subsidies
Growth2 • Generally positive, most of the impact expected to be felt with some lag in 2015 (0.5 – 1.2 ppts impact on private consumption)
• Some softening of growth
Note: Preliminary analysis 1/ Based on Consensus Forecast for China, Indonesia, Japan, Malaysia, Philippines, Singapore, Korea, Thailand and Vietnam 2/ Impact on growth will vary depending on energy intensity, whether the economy produces oil, size of the oil price decline in domestic currency and differences in pass-through of lower oil prices to the economy.
Declining Oil Prices
Lower oil prices have started to benefit many oil importers and pose challenges to oil exporters in the region.
5
Divergence of monetary policy in advanced economies
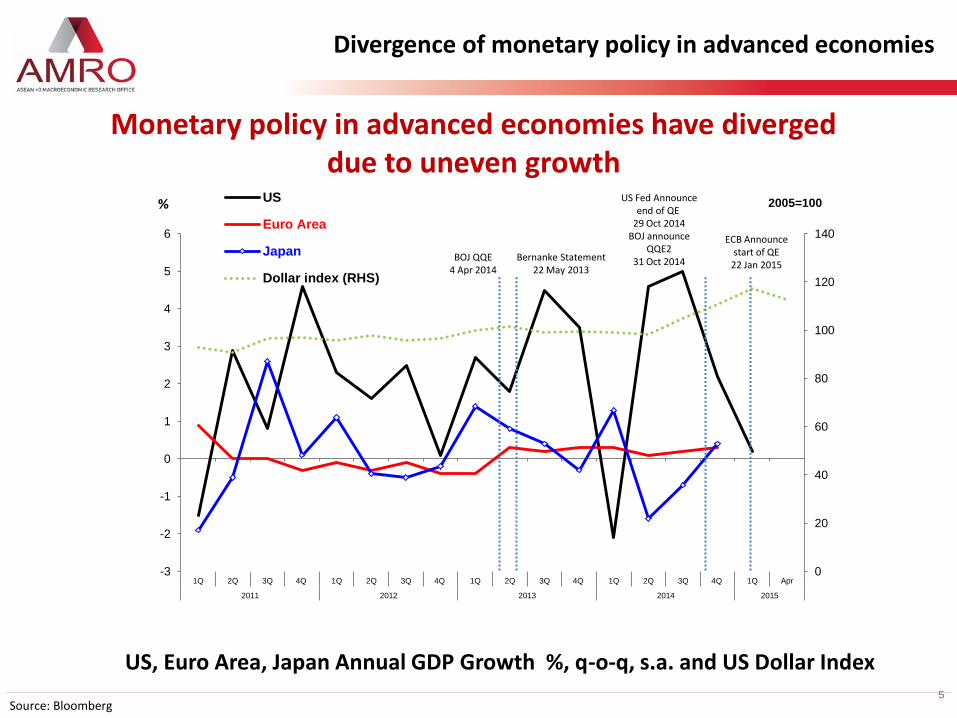
Monetary policy in advanced economies have diverged due to uneven growth
Source: Bloomberg
US, Euro Area, Japan Annual GDP Growth %, q-o-q, s.a. and US Dollar Index
0
20
40
60
80
100
120
140
-3
-2
-1
0
1
2
3
4
5
6
1Q 2Q 3Q 4Q 1Q 2Q 3Q 4Q 1Q 2Q 3Q 4Q 1Q 2Q 3Q 4Q 1Q Apr
2011 2012 2013 2014 2015
2005=100 US
Euro Area
Japan
Dollar index (RHS)
%
ECB Announce start of QE
22 Jan 2015
US Fed Announce end of QE
29 Oct 2014 BOJ announce
QQE2 31 Oct 2014 BOJ QQE
4 Apr 2014 Bernanke Statement
22 May 2013
Developments in Capital flows
6
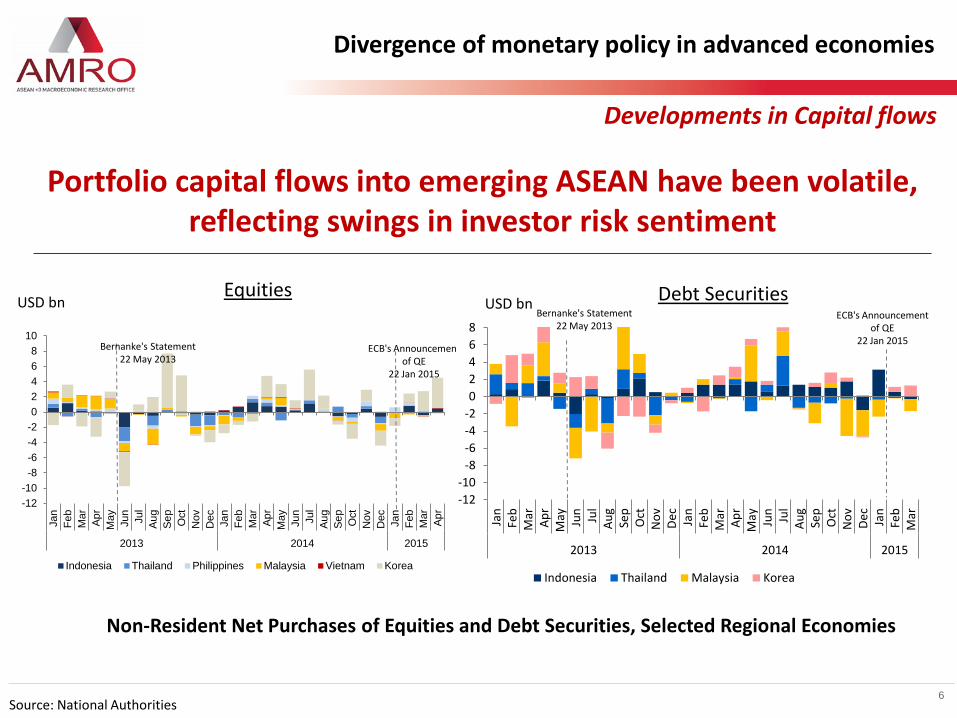
Portfolio capital flows into emerging ASEAN have been volatile, reflecting swings in investor risk sentiment
Non-Resident Net Purchases of Equities and Debt Securities, Selected Regional Economies
USD bn USD bn Equities Debt Securities
Source: National Authorities
-12
-10
-8
-6
-4
-2
0
2
4
6
8
Jan
Feb
Mar
Ap
rM
ay Jun
Jul
Au
gSe
pO
ctN
ov
De
cJa
nFe
bM
arA
pr
May Jun
Jul
Au
gSe
pO
ctN
ov
De
cJa
nFe
bM
ar
2013 2014 2015
Indonesia Thailand Malaysia Korea
Bernanke's Statement 22 May 2013
ECB's Announcement of QE
22 Jan 2015
Divergence of monetary policy in advanced economies
-12
-10
-8
-6
-4
-2
0
2
4
6
8
10
Jan
Fe
b
Ma
r
Ap
r
Ma
y
Jun
Jul
Au
g
Se
p
Oct
Nov
Dec
Jan
Fe
b
Ma
r
Ap
r
Ma
y
Jun
Jul
Au
g
Se
p
Oct
Nov
Dec
Jan
Fe
b
Ma
r
Ap
r
2013 2014 2015
Indonesia Thailand Philippines Malaysia Vietnam Korea
Bernanke's Statement 22 May 2013
ECB's Announcement of QE
22 Jan 2015
Developments in Capital flows
7
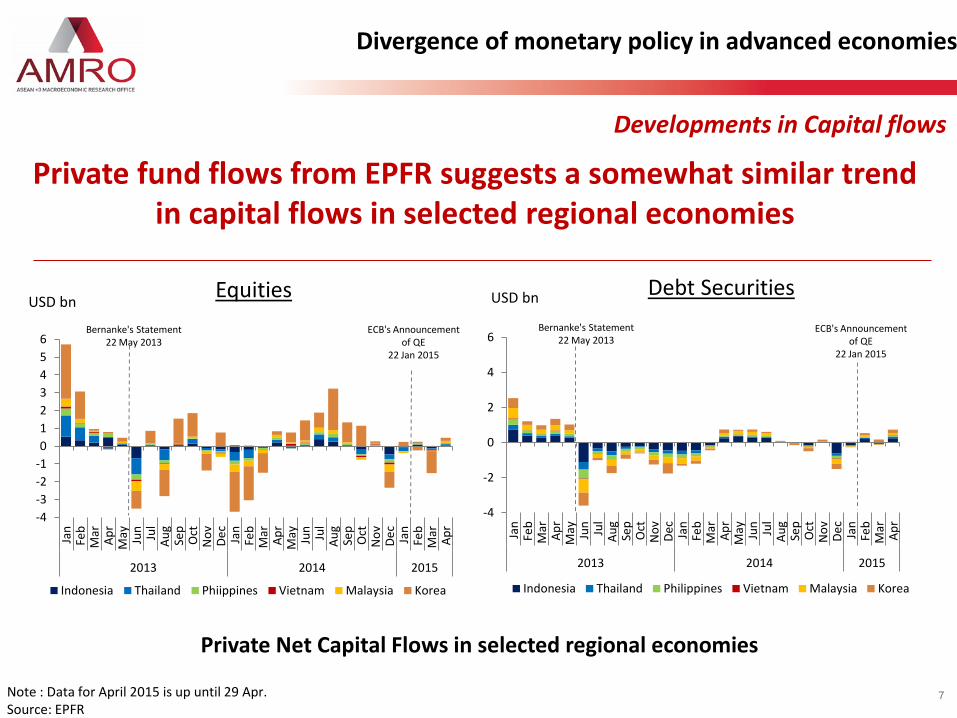
Private fund flows from EPFR suggests a somewhat similar trend in capital flows in selected regional economies
Note : Data for April 2015 is up until 29 Apr. Source: EPFR
Divergence of monetary policy in advanced economies
Private Net Capital Flows in selected regional economies
Equities Debt Securities USD bn USD bn
-4
-3
-2
-1
0
1
2
3
4
5
6
Jan
Feb
Mar
Ap
rM
ay Jun
Jul
Au
gSe
pO
ctN
ov
De
cJa
nFe
bM
arA
pr
May Jun
Jul
Au
gSe
pO
ctN
ov
De
cJa
nFe
bM
arA
pr
2013 2014 2015
Indonesia Thailand Phiippines Vietnam Malaysia Korea
Bernanke's Statement 22 May 2013
ECB's Announcement of QE
22 Jan 2015
-4
-2
0
2
4
6
Jan
Feb
Mar
Ap
rM
ay Jun
Jul
Au
gSe
pO
ctN
ov
De
cJa
nFe
bM
arA
pr
May Jun
Jul
Au
gSe
pO
ctN
ov
De
cJa
nFe
bM
arA
pr
2013 2014 2015
Indonesia Thailand Philippines Vietnam Malaysia Korea
Bernanke's Statement 22 May 2013
ECB's Announcement of QE
22 Jan 2015
Risk of rising sovereign debt costs
8
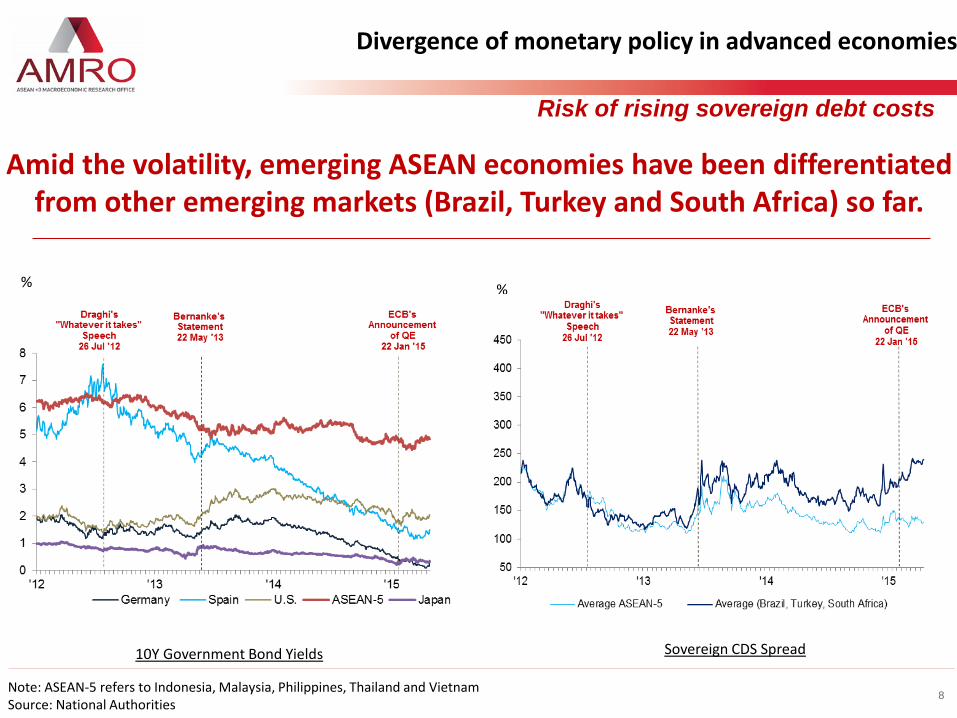
Amid the volatility, emerging ASEAN economies have been differentiated
from other emerging markets (Brazil, Turkey and South Africa) so far.
% %
10Y Government Bond Yields Sovereign CDS Spread
Note: ASEAN-5 refers to Indonesia, Malaysia, Philippines, Thailand and Vietnam Source: National Authorities
Divergence of monetary policy in advanced economies
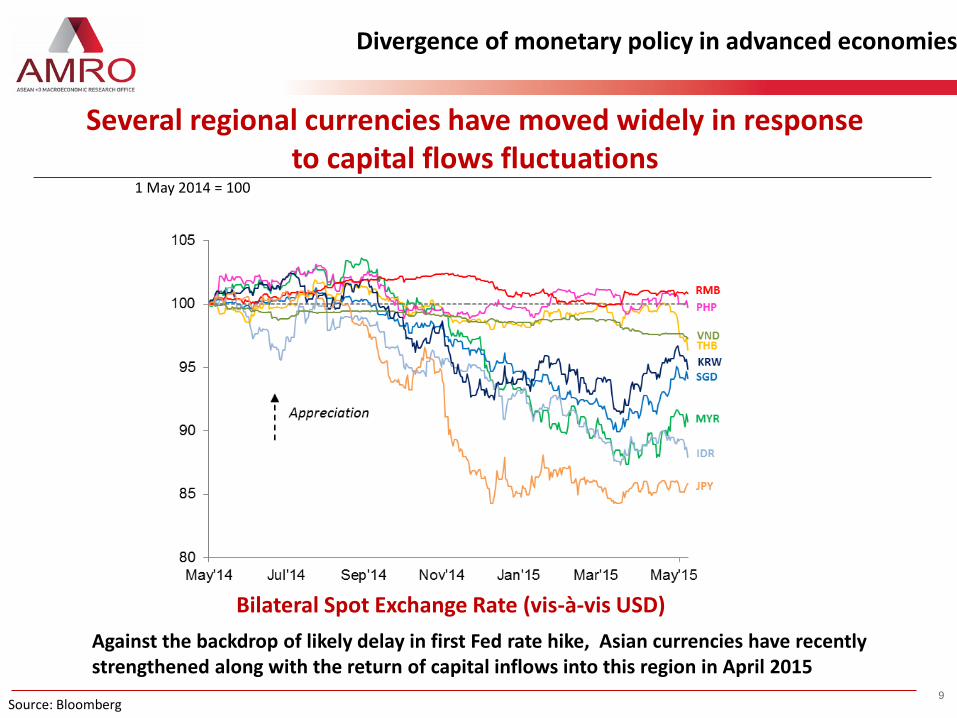
9 Source: Bloomberg
Bilateral Spot Exchange Rate (vis-à-vis USD)
1 May 2014 = 100
Divergence of monetary policy in advanced economies
Several regional currencies have moved widely in response to capital flows fluctuations
Against the backdrop of likely delay in first Fed rate hike, Asian currencies have recently strengthened along with the return of capital inflows into this region in April 2015
10
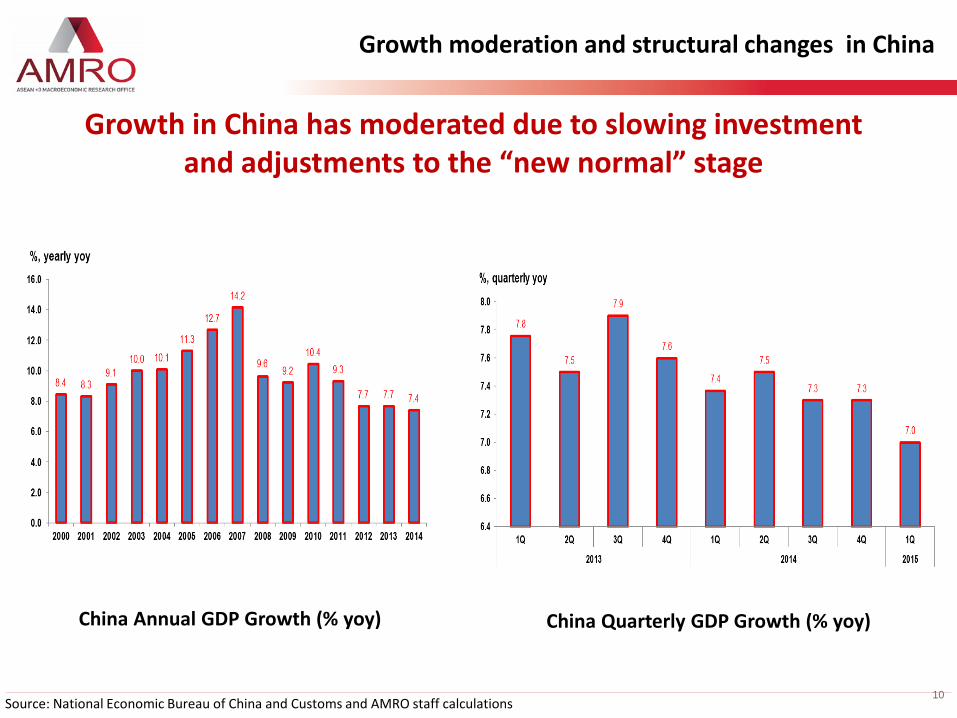
Growth moderation and structural changes in China
Growth in China has moderated due to slowing investment and adjustments to the “new normal” stage
Source: National Economic Bureau of China and Customs and AMRO staff calculations
China Annual GDP Growth (% yoy) China Quarterly GDP Growth (% yoy)
11
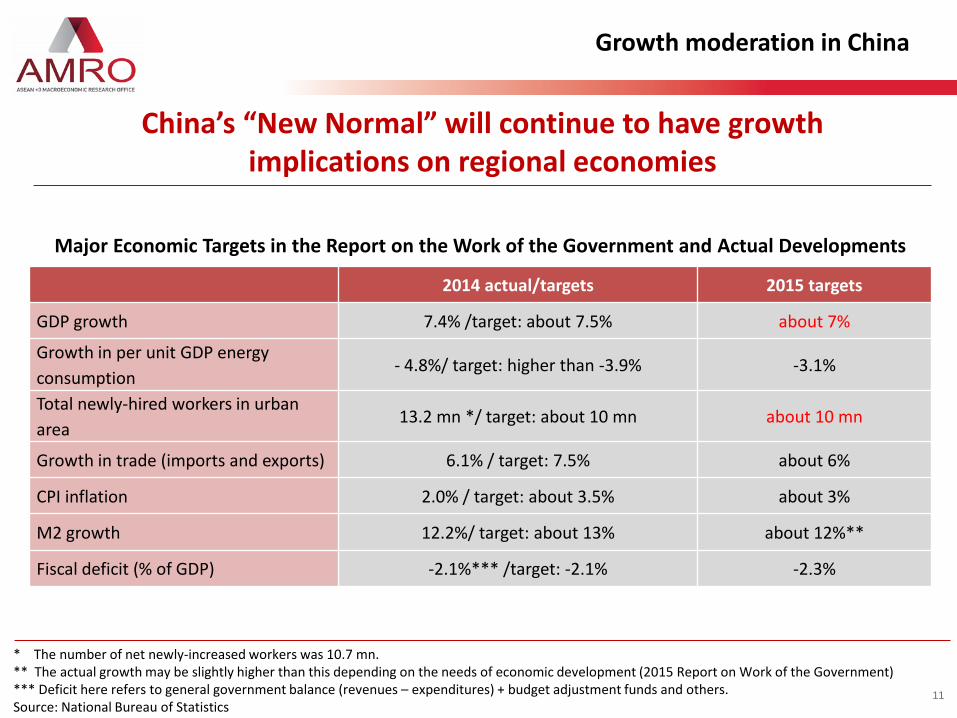
China’s “New Normal” will continue to have growth implications on regional economies
Major Economic Targets in the Report on the Work of the Government and Actual Developments
2014 actual/targets 2015 targets
GDP growth 7.4% /target: about 7.5% about 7%
Growth in per unit GDP energy
consumption - 4.8%/ target: higher than -3.9% -3.1%
Total newly-hired workers in urban
area 13.2 mn */ target: about 10 mn about 10 mn
Growth in trade (imports and exports) 6.1% / target: 7.5% about 6%
CPI inflation 2.0% / target: about 3.5% about 3%
M2 growth 12.2%/ target: about 13% about 12%**
Fiscal deficit (% of GDP) -2.1%*** /target: -2.1% -2.3%
* The number of net newly-increased workers was 10.7 mn. ** The actual growth may be slightly higher than this depending on the needs of economic development (2015 Report on Work of the Government) *** Deficit here refers to general government balance (revenues – expenditures) + budget adjustment funds and others. Source: National Bureau of Statistics
Growth moderation in China
12
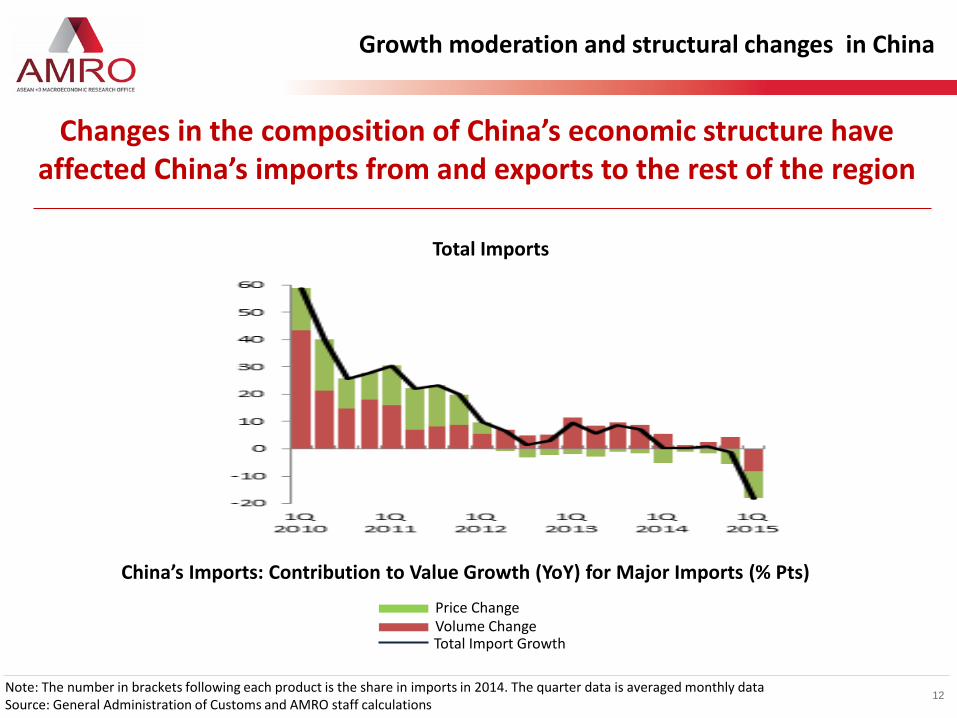
Changes in the composition of China’s economic structure have affected China’s imports from and exports to the rest of the region
China’s Imports: Contribution to Value Growth (YoY) for Major Imports (% Pts)
Total Imports
Price Change Volume Change Total Import Growth
Note: The number in brackets following each product is the share in imports in 2014. The quarter data is averaged monthly data Source: General Administration of Customs and AMRO staff calculations
Growth moderation and structural changes in China
13
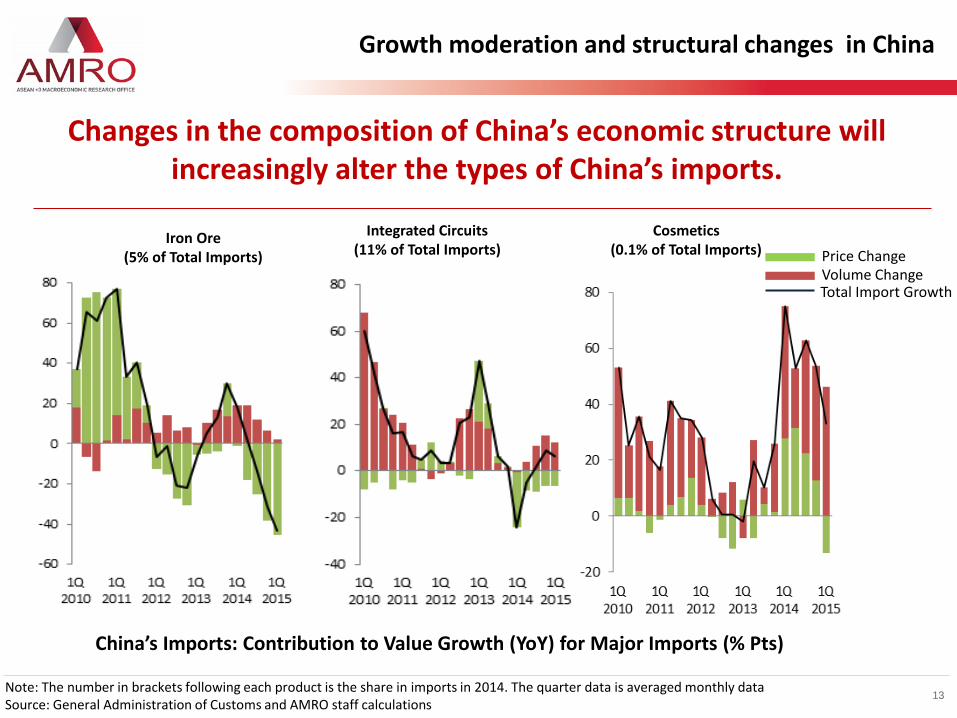
Changes in the composition of China’s economic structure will increasingly alter the types of China’s imports.
China’s Imports: Contribution to Value Growth (YoY) for Major Imports (% Pts)
Iron Ore (5% of Total Imports)
Integrated Circuits (11% of Total Imports)
Cosmetics (0.1% of Total Imports) Price Change
Volume Change Total Import Growth
Note: The number in brackets following each product is the share in imports in 2014. The quarter data is averaged monthly data Source: General Administration of Customs and AMRO staff calculations
Growth moderation and structural changes in China

Source: National Authorities and AMRO Staff Estimates 14
Impact will depend on the size of exports to China and increasingly on the types of goods exported.
Exports to China by Major Products Items : Selected Economies (2014)
Growth moderation and structural changes in China
15
2. Developments on Regional Growth and Stability
- Growth
- Stability
- Recent developments in CLMV economies
Recent Growth Performance
16
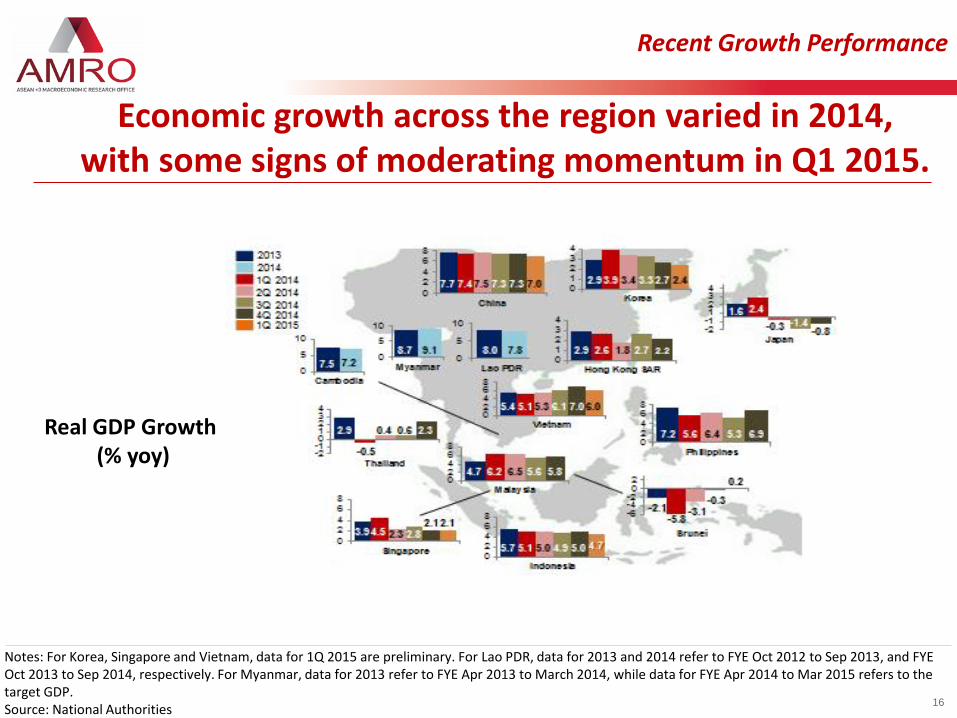
Economic growth across the region varied in 2014, with some signs of moderating momentum in Q1 2015.
Notes: For Korea, Singapore and Vietnam, data for 1Q 2015 are preliminary. For Lao PDR, data for 2013 and 2014 refer to FYE Oct 2012 to Sep 2013, and FYE Oct 2013 to Sep 2014, respectively. For Myanmar, data for 2013 refer to FYE Apr 2013 to March 2014, while data for FYE Apr 2014 to Mar 2015 refers to the target GDP. Source: National Authorities
Real GDP Growth (% yoy)
Industrial Production and Retail Sales
17
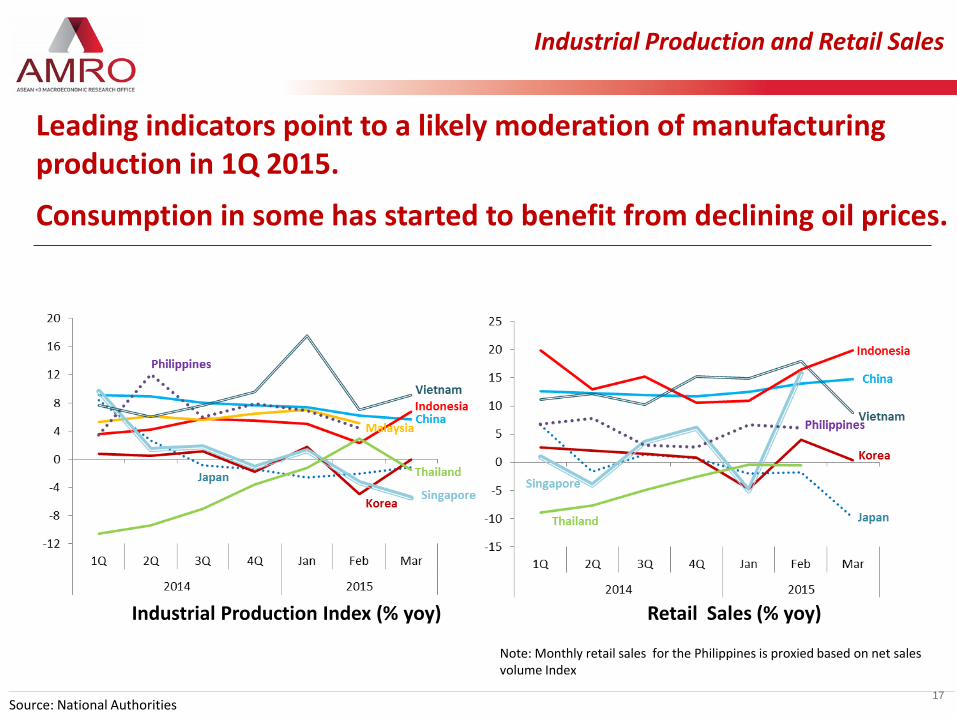
Leading indicators point to a likely moderation of manufacturing production in 1Q 2015.
Consumption in some has started to benefit from declining oil prices.
Industrial Production Index (% yoy) Retail Sales (% yoy)
Source: National Authorities
Note: Monthly retail sales for the Philippines is proxied based on net sales volume Index
18
Growth Outlook
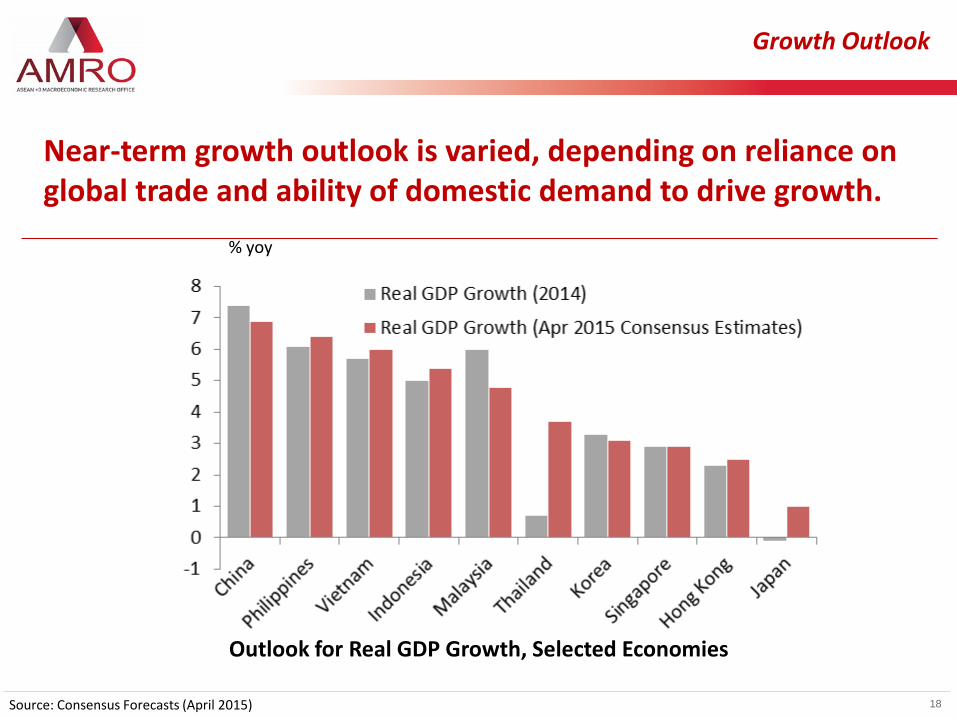
Near-term growth outlook is varied, depending on reliance on global trade and ability of domestic demand to drive growth.
% yoy
Outlook for Real GDP Growth, Selected Economies
Source: Consensus Forecasts (April 2015)
19
Growth Outlook
Near-term growth outlook is varied, depending on reliance on global trade and ability of domestic demand to drive growth.
Source: Consensus Forecasts (April 2015)
Shared factors
• Enhanced policy to strengthen domestic demand
• Reforms since the Asian crisis • Room for counter-cyclical policy
Different factors
• Impact of declining oil prices • Degrees of openness • Ability to adjust to structural
changes in China • Size of policy space
Price stability
20
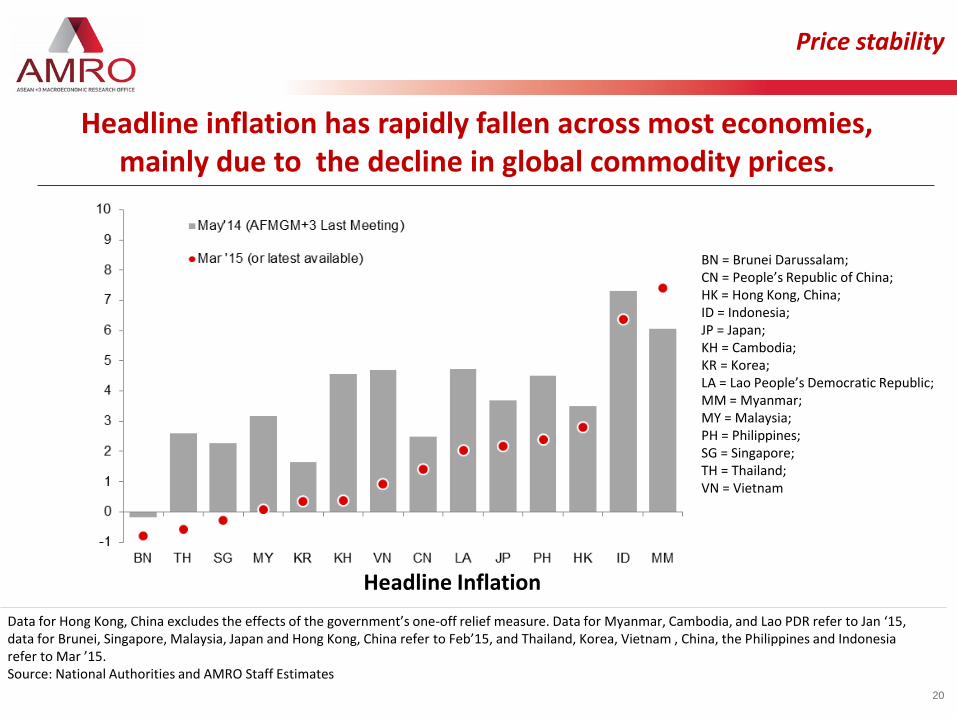
Headline inflation has rapidly fallen across most economies, mainly due to the decline in global commodity prices.
Data for Hong Kong, China excludes the effects of the government’s one-off relief measure. Data for Myanmar, Cambodia, and Lao PDR refer to Jan ‘15, data for Brunei, Singapore, Malaysia, Japan and Hong Kong, China refer to Feb’15, and Thailand, Korea, Vietnam , China, the Philippines and Indonesia refer to Mar ’15. Source: National Authorities and AMRO Staff Estimates
Headline Inflation
% yoy
BN = Brunei Darussalam; CN = People’s Republic of China; HK = Hong Kong, China; ID = Indonesia; JP = Japan; KH = Cambodia; KR = Korea; LA = Lao People’s Democratic Republic; MM = Myanmar; MY = Malaysia; PH = Philippines; SG = Singapore; TH = Thailand; VN = Vietnam
21
Financial stability: Financial Soundness
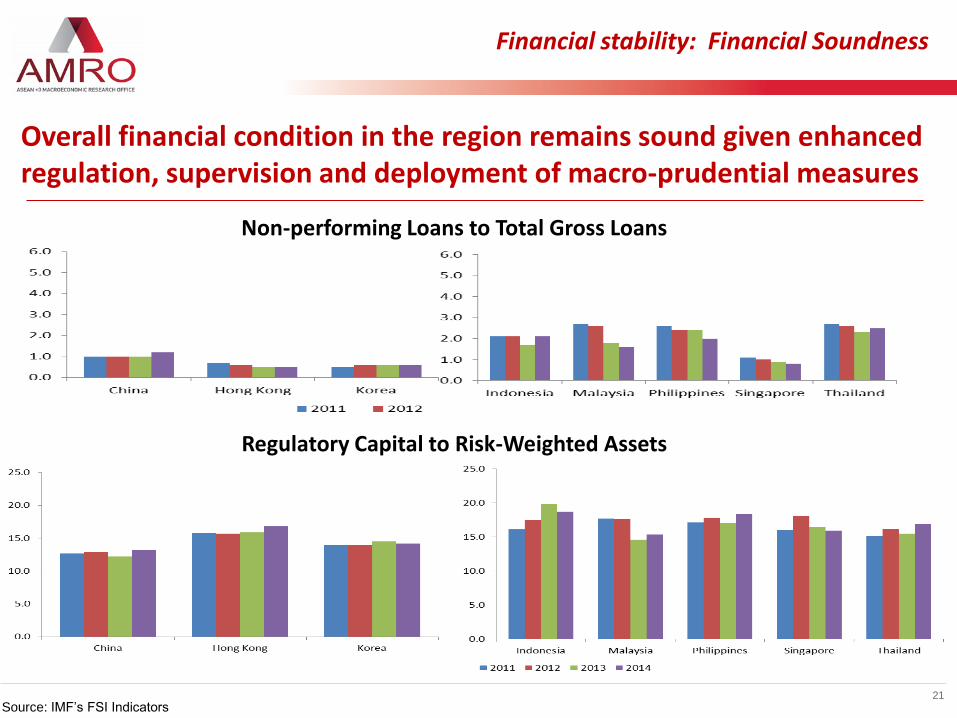
Overall financial condition in the region remains sound given enhanced regulation, supervision and deployment of macro-prudential measures
Source: IMF’s FSI Indicators
Regulatory Capital to Risk-Weighted Assets
Non-performing Loans to Total Gross Loans

22
Note: Data for Myanmar refers to fiscal year, except 2014 which refers to Dec 2014. For Vietnam , Cambodia and Lao PDR, data are up to Dec 2014. Data for Brunei are available from 1Q 2012 (and up to 4Q 2014). Latest data for China is as at Mar’15. For Japan, Korea, Singapore, Thailand, Malaysia, Indonesia and the Philippines, latest data is as at Feb’15. Source: National Authorities
Average Credit Growth
% yoy
Private sector credit growth moderated across larger ASEAN economies.
Credit growth remains somewhat buoyant in smaller ASEAN economies.
Financial stability: Credit Growth
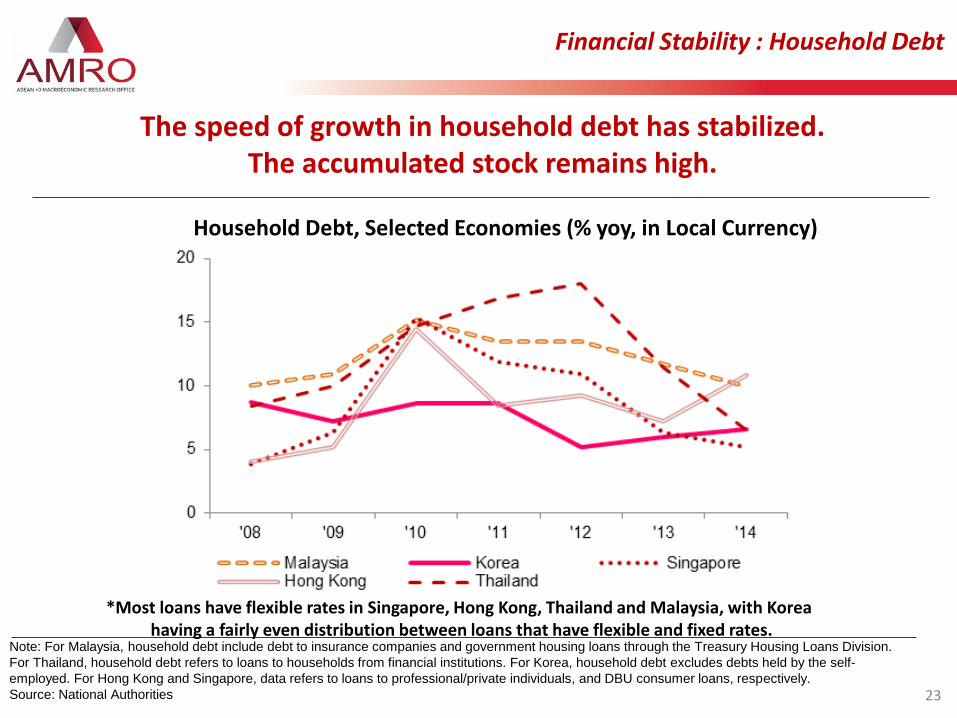
Note: For Malaysia, household debt include debt to insurance companies and government housing loans through the Treasury Housing Loans Division.
For Thailand, household debt refers to loans to households from financial institutions. For Korea, household debt excludes debts held by the self-
employed. For Hong Kong and Singapore, data refers to loans to professional/private individuals, and DBU consumer loans, respectively.
Source: National Authorities 23
The speed of growth in household debt has stabilized. The accumulated stock remains high.
Financial Stability : Household Debt
Household Debt, Selected Economies (% yoy, in Local Currency)
*Most loans have flexible rates in Singapore, Hong Kong, Thailand and Malaysia, with Korea having a fairly even distribution between loans that have flexible and fixed rates.

24
Corporates with large foreign currency denominated liabilities are vulnerable to the coming US Fed rate hike and USD appreciation
Outstanding International Debt Securities by Non-Financial Corporations (By Residence of Issuer), Selected Economies
USD bn
Notes: Since the mid-2000s, borrowers from many countries are able to borrow offshore in their own currency. Notwithstanding these developments, bonds denominated in foreign currencies, i.e. in a currency different from that of the country where the borrower resides still account for about half of total outstanding international debt securities (BIS Quarterly Review, December 2012). Source: BIS
Financial Stability : Corporate FX Liabilities
25
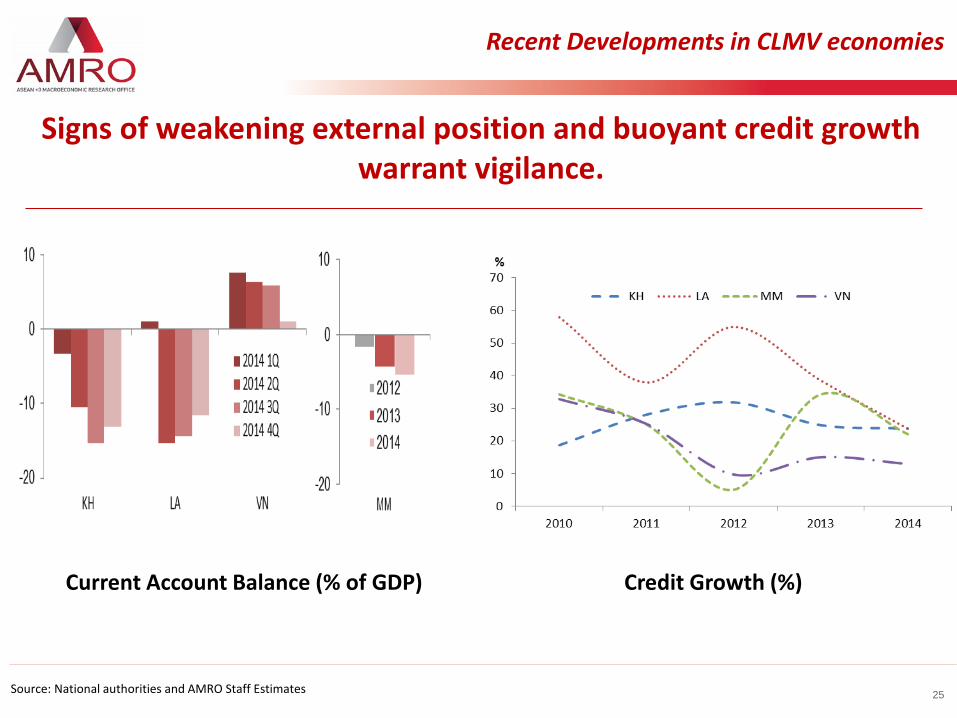
Source: National authorities and AMRO Staff Estimates
Signs of weakening external position and buoyant credit growth warrant vigilance.
Credit Growth (%) Current Account Balance (% of GDP)
Recent Developments in CLMV economies
26
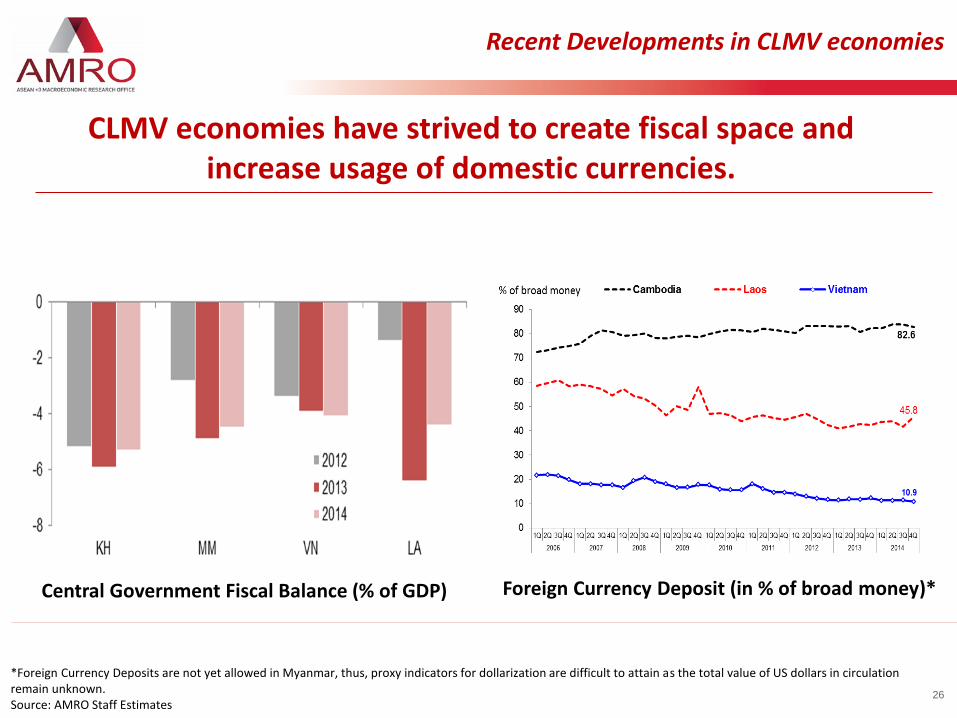
*Foreign Currency Deposits are not yet allowed in Myanmar, thus, proxy indicators for dollarization are difficult to attain as the total value of US dollars in circulation remain unknown. Source: AMRO Staff Estimates
CLMV economies have strived to create fiscal space and increase usage of domestic currencies.
Foreign Currency Deposit (in % of broad money)* Central Government Fiscal Balance (% of GDP)
Recent Developments in CLMV economies

27
3. Near-term policy discussion
28
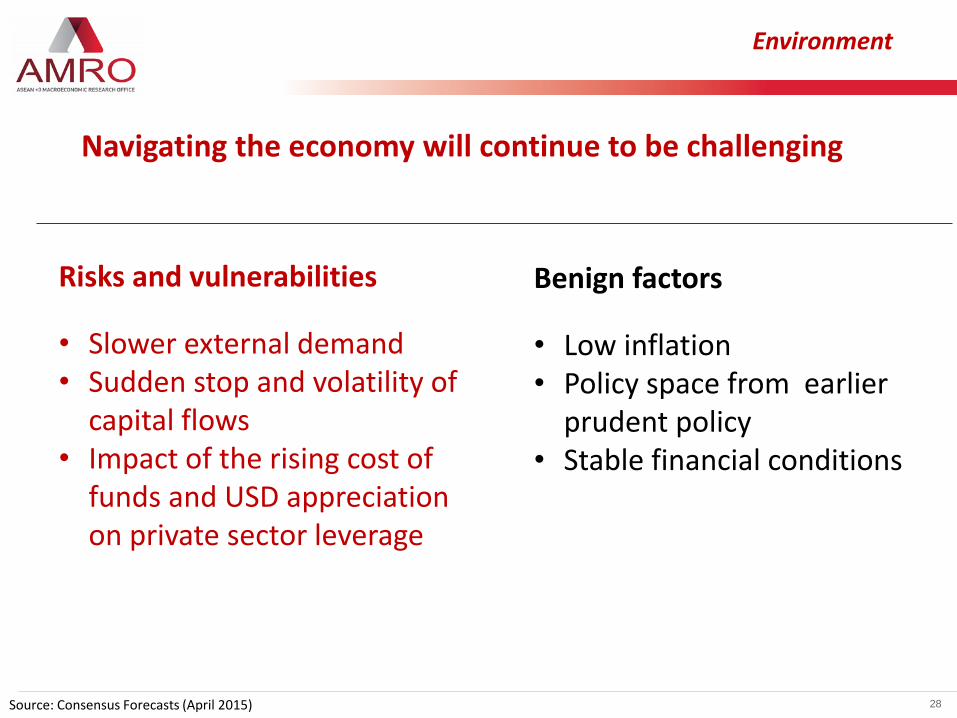
Environment
Navigating the economy will continue to be challenging
Source: Consensus Forecasts (April 2015)
Benign factors
• Low inflation • Policy space from earlier
prudent policy • Stable financial conditions
Risks and vulnerabilities
• Slower external demand • Sudden stop and volatility of
capital flows • Impact of the rising cost of
funds and USD appreciation on private sector leverage
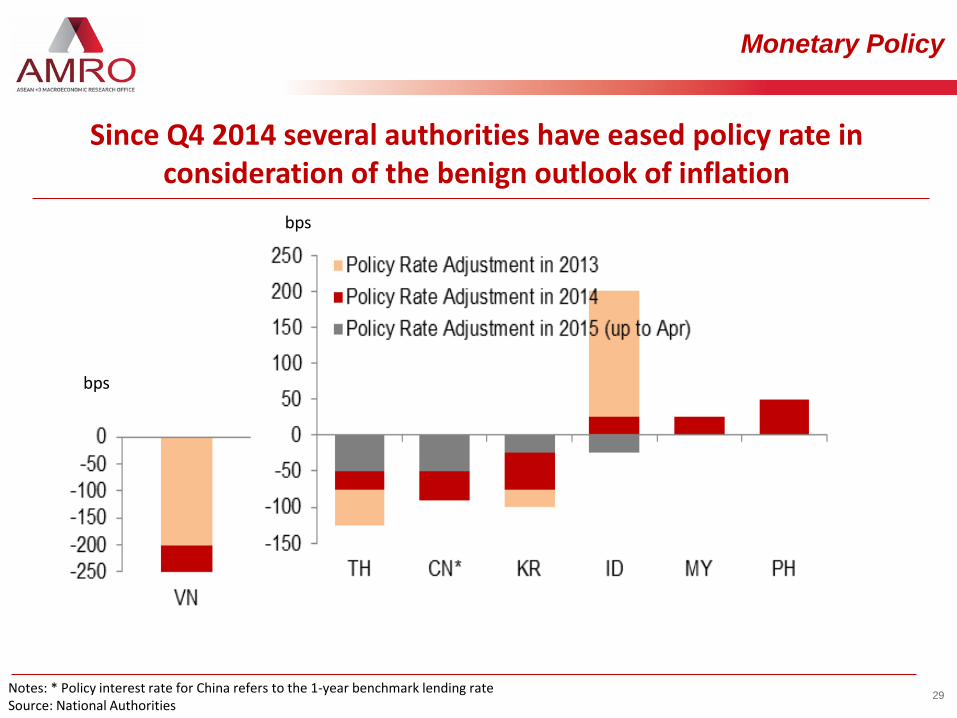
Monetary Policy
29 Notes: * Policy interest rate for China refers to the 1-year benchmark lending rate Source: National Authorities
Since Q4 2014 several authorities have eased policy rate in consideration of the benign outlook of inflation
bps
bps
30
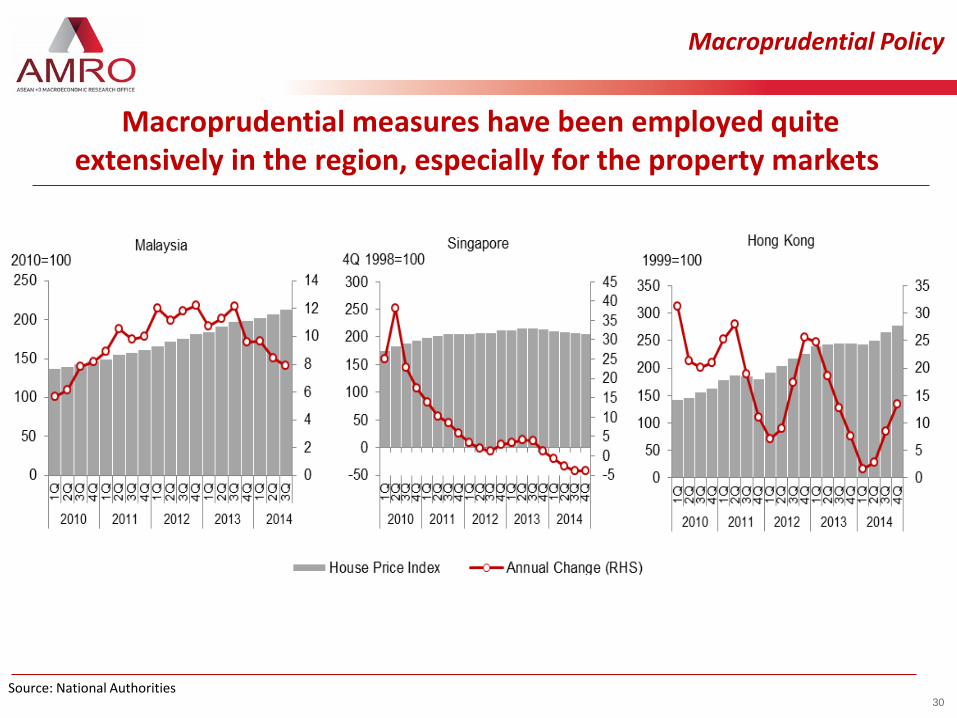
Macroprudential Policy
Macroprudential measures have been employed quite extensively in the region, especially for the property markets
Source: National Authorities

31
Source: National Authorities
Macroprudential measures have helped mitigate pressures in the real estate sector
Macroprudential Policy
32
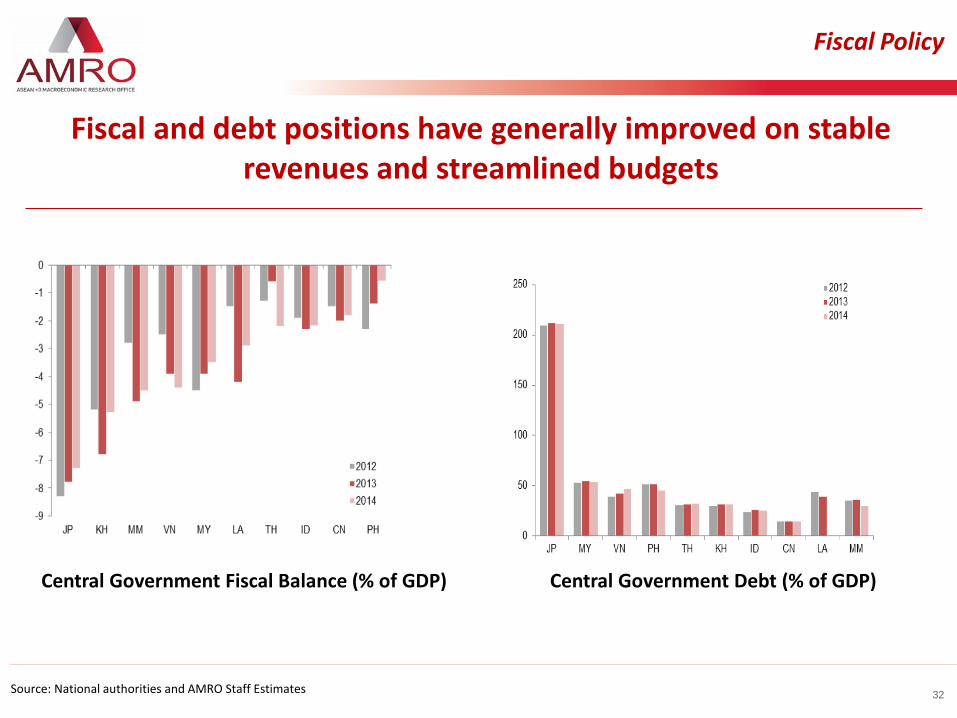
Source: National authorities and AMRO Staff Estimates
Fiscal and debt positions have generally improved on stable revenues and streamlined budgets
Central Government Debt (% of GDP) Central Government Fiscal Balance (% of GDP)
Fiscal Policy

33
Policy to address vulnerabilities, deal with volatility and enhance growth
Address vulnerability of sectors that are exposed to interest rate and FX risks such as through macroprudential measures.
Carefully employ monetary policy taking into account limitations of monetary policy and caution about the effects on private debt accumulation.
Prepare and manage fiscal space to address risks to growth ahead.
Enhance policy coordination on crisis prevention and management – strengthen coordination between different layers of financial safety nets.
Safeguard Stability +Enhance Growth

Contact us:
ASEAN+3 Macroeconomic Research Office (AMRO) 10 Shenton Way, #11-07 MAS Building, Singapore 079117 Tel: +65 6323 9830 Fax: +65 6223 8187 www.amro-asia.org
THANK YOU