maerz, nh, 1999. online fragmentation analysis
TRANSCRIPT

Maerz, N. H., 1999. Online fragmentation analysis: Achievements in the mining industry. Center For Aggregates Research (ICAR) Seventh Annual Symposium Proceedings, Austin Texas, April 19-21, pp. C1-1-1 to B1-1-10.
Online Fragmentation Analysis: Achievements in the Mining Industry N. H. Maerz, Rock Mechanics and Explosives Research Center, University of Missouri-Rolla, MO, USA Abstract Size analysis of fragmentation based on optical imaging systems such as WipFrag has been available for some time now. Studies and industry experience has shown that the sampling errors are the significant problems with optical imaging systems. The most effective way to reduce these errors is to use continuous on-line real-time monitoring. As well as resulting in a sampling frequency that is orders of magnitude higher, it also has the advantage of producing results in real time. WipFrag System II has been specially designed for on-line monitoring. This paper describes the system and some of its applications. 1 Introduction The WipFrag fragmentation sizing system has been in widespread use for many years now (Maerz et. al, 1987; Maerz et al., 1996, Maerz, 1998). It is being used in the explosives, mining, and materials handling industries for the purpose of evaluating the efficiency of the comminution process, whether by blasting, crushing, grinding, or inadvertently by materials handling processes. The original WipFrag system, was designed primarily to use images from a "roving cameras" (Figure 1), whether video cameras, digital cameras, or conventional film cameras (Maerz, 1996; Palangio and Franklin, 1996). In this way a camera operator could survey a muck pile, take some pictures, and later analyze them on his computer.

Figure 1. Typical "roving camera" approach to acquiring images for analysis. The experience gained with these types of systems has revealed the accuracy, precision, and errors associated with these systems (Maerz and Zhou, 1999a). By far the most significant source of error is sampling, whether the source is a result of:
1. Poor judgement in where the roving images are taken, or, 2. It is not possible to get a representative sample by looking at only the surface of a
pile of rock, or, 3. Whether the variability in size is just too great for such a simple approach.
As a result, workers have for the most part adapted a calibration as a standard (Maerz and Zhou, 1999b; Barkley and Russel, 1999; Katsabanis, 1999). Others, recognizing that calibration is merely a transformation of measured results, and consequently does not refined the measurement or add precision prefer not to calibrate, and instead correlate measurement results directly to their application without calibration (Simkus and Dance, 1998). More importantly, it is being recognized that for serious studies, a better way to measure fragmentation is on line, either on a conveyor belt or free falling off the end of a conveyor belt (Figure 2). This has the advantage of discounting a significant amount of sampling bias, getting a larger statistical sample, as well as allowing real time process control if necessary. WipFrag System II has been designed to meet all these requirements.

Figure 2. Conveyor belt images. 2 Automated on-line processing with WipFrag System II Automated on-line processing has a special set of requirements that are not important when using a manual roving camera approach. Material needs to be imaged while moving at high speed. Data is acquired at such a high rate, that real time data reduction needs to be done to prevent an overload of data. For the same reason, manual editing of images is not feasible in real time. Inferior images, such as empty or near empty belts need to be automatically rejected. At the same time the requirement for a conscientiously planned and executed sampling strategy, required with the roving camera approach, is no longer needed. 2.1 Capturing moving images Capturing moving images of materials moving at high speed requires the use of high speed video cameras with shutter speeds on the order of 1/4000 to 1/10000 sec, to freeze images of material travelling at speeds of several metres per second. Secondly, because most video cameras use interlaced video, the interlacing must be removed. For typical video cameras such as those using the RS170, which is the monochrome version of NTSC, each video frame is constructed by alternately displaying two "fields", one containing the odd numbered lines of the image, the other containing the even numbered lines. Because these two fields, which are subsequently interlaced to form a single frame, are taken 1/60 of a second apart, it is difficult to freeze even images of slow moving material (Figure 3).
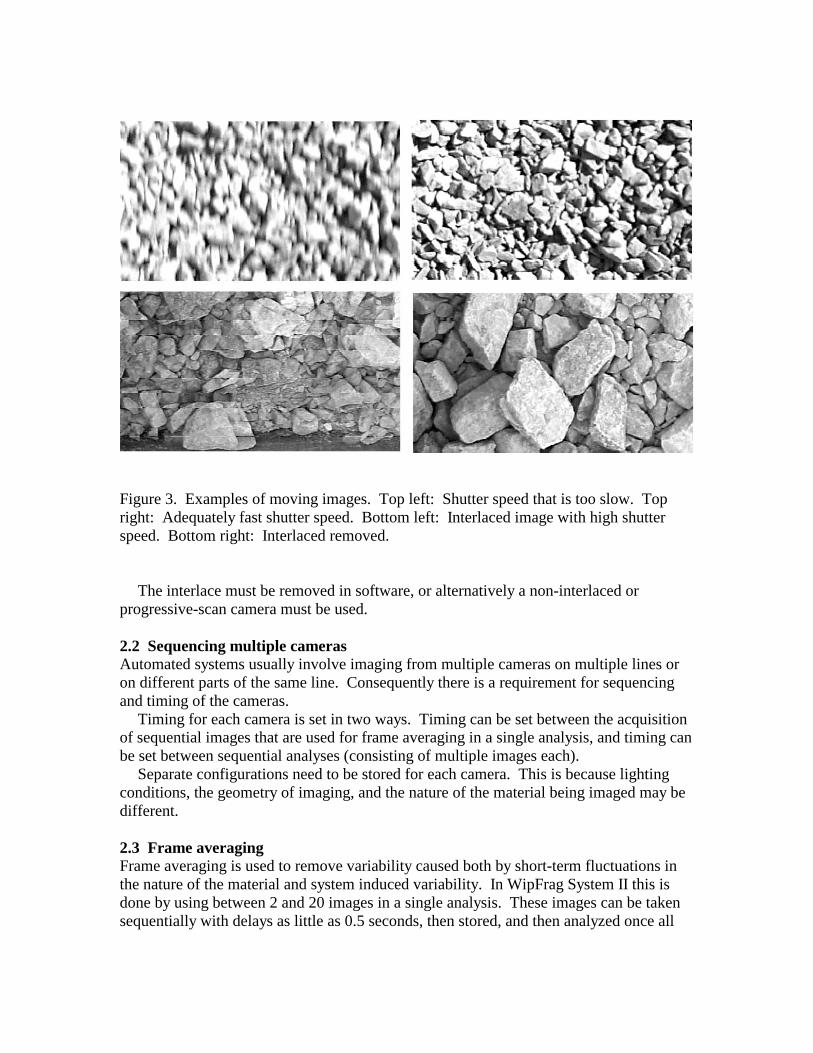
Figure 3. Examples of moving images. Top left: Shutter speed that is too slow. Top right: Adequately fast shutter speed. Bottom left: Interlaced image with high shutter speed. Bottom right: Interlaced removed. The interlace must be removed in software, or alternatively a non-interlaced or progressive-scan camera must be used. 2.2 Sequencing multiple cameras Automated systems usually involve imaging from multiple cameras on multiple lines or on different parts of the same line. Consequently there is a requirement for sequencing and timing of the cameras. Timing for each camera is set in two ways. Timing can be set between the acquisition of sequential images that are used for frame averaging in a single analysis, and timing can be set between sequential analyses (consisting of multiple images each). Separate configurations need to be stored for each camera. This is because lighting conditions, the geometry of imaging, and the nature of the material being imaged may be different. 2.3 Frame averaging Frame averaging is used to remove variability caused both by short-term fluctuations in the nature of the material and system induced variability. In WipFrag System II this is done by using between 2 and 20 images in a single analysis. These images can be taken sequentially with delays as little as 0.5 seconds, then stored, and then analyzed once all
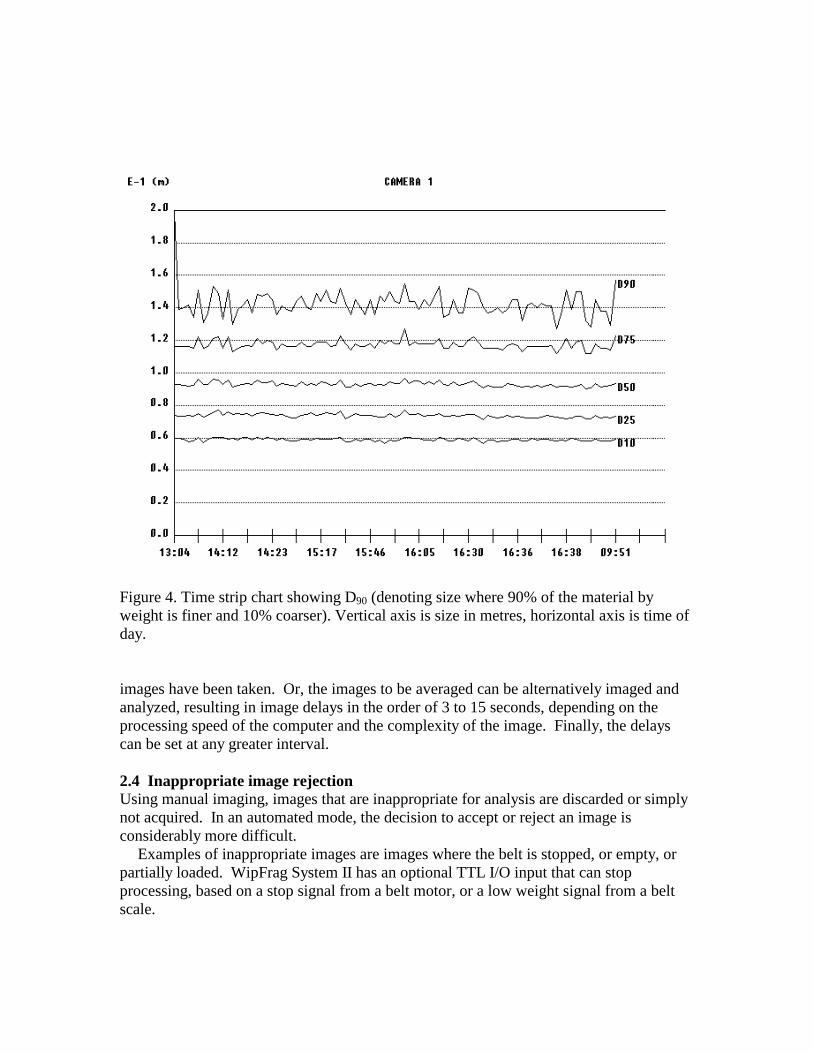
Figure 4. Time strip chart showing D90 (denoting size where 90% of the material by weight is finer and 10% coarser). Vertical axis is size in metres, horizontal axis is time of day. images have been taken. Or, the images to be averaged can be alternatively imaged and analyzed, resulting in image delays in the order of 3 to 15 seconds, depending on the processing speed of the computer and the complexity of the image. Finally, the delays can be set at any greater interval. 2.4 Inappropriate image rejection Using manual imaging, images that are inappropriate for analysis are discarded or simply not acquired. In an automated mode, the decision to accept or reject an image is considerably more difficult. Examples of inappropriate images are images where the belt is stopped, or empty, or partially loaded. WipFrag System II has an optional TTL I/O input that can stop processing, based on a stop signal from a belt motor, or a low weight signal from a belt scale.

Figure 5. Images of a crusher run product. Top left: Static Image on stockpile. Top right: On moving conveyor belt. Bottom left: Falling off end of conveyor belt. Bottom right: Measured size distribution vs. Rosin-Rammler fit of sieved distribution. Another option is to use a filter that measures the characteristics of the image, and uses limits of a particular characteristic to determine if the image is appropriate. This can be used to reject empty or near empty belt conditions, as well as conditions like dust or fog obscured images. 2.5 Continuous output strip chart Data presentation requirements for continuous on-line monitoring again are different than those for manual methods. Because of the large amount of data being generated, producing reports showing the size distribution of each analysis is not useful. It is better to track one or several parameters throughout the course of the analysis, so that each analysis can be portrayed as a single data point on a time based chart (Figure 4). The data used to generate this strip chart, in its various configurations is also saved on the computer as a continuous log file.

Figure 6. Typical Highland Valley copper image of ore free falling off the end of a transfer chute, and the WipFrag generated block outlines (Simkus and Dance, 1998). 2.6 Real time output / external communications The biggest advantage of an on-line system is that it can generate measurement results in real time. Consequently it is useful to be able to send that information to control systems, so that they can act on information, such as adjusting belt feeds, mixtures, crusher setting, or shut down the system before a greater deal of material is produced that is out of specification. External communication can be done in several ways. TTL I/O signals can be used to trigger alarms, based on out of specification conditions. 4-20 mA current loop output can be used to generate a current in proportion to a specified size passing. RS232 outputs can be used to transmit digital data to another computer for process control decisions. RS422 or digital current loop outputs can transmit the same digital data over greater distances. 3. On-line experience in the mining industry 3.1 Material Services Quarry, Chicago In a small investigation, a clear minus 5/8" crusher run product was measured in a stock pile, on a moving conveyor belt, and falling off the end of the conveyor belt (Figure 5). Size distributions from each of the analyses were compared to each other and to the specification, and found to be in close agreement. The measurement that was closest to the actual specification was from the images falling off the end of the conveyor belt. This has been attributed simply to the fact that in these images, the fines were more visible.

Figure 7. Comparison of predicted (modeled) vs. actual mill throughput based on input parameters of size and hardness (Simkus and Dance, 1998). 3.2 INCO Underground mining operations, Copper Cliff, Ontario, Canada INCO mines uses on-line time-lapse video photography at drawpoints to characterize the fragmentation of their ore (Preston and Lidkea, 1996). Images are transmitted to surface by broadband coaxial cable, fiber optic cables, or wireless transmission. At INCO's Coleman mine, a large study using WipFrag resulted in a 40% pattern expansion, twice as good fragmentation, and considerable reduction of oversize (Palangio et al., 1996) 3.3 Highland Valley Copper, Logan Lake, B. C., Canada, grinding mill performance Highland Valley Copper is using on-line monitoring of ore size, and combining it with ore hardness tracking to predict SAG (Semi-autogenous grinding) mill performance (Simkus and Dance, 1998). Figure 6 shows a typical image, and Figure 7 shows the correlation between the actual SAG mill throughput and the throughput predicted by the model that was developed based on feed size as measured by WipFrag and feed hardness. Highland Valley Copper is claiming a 10% increase in mill productivity as a result of controlling feeds based on size and hardness.

Figure 8: Brunswick Images. Left: Fragmented lead ore rock on conveyor belt in grinding mill; Right: Sinter (lead concentrate) on conveyor belt in smelter. 3.4 Brunswick Mining, Bathurst, N. B., Canada, autogenous grinding Noranda's Brunswick mining has recently installed an on-line monitoring system to optimize feed sizes to maximize productivity for their new autogenous grinding mill (Figure 8). 3.5 Brunswick Mining, Belledune, N. B., Canada, smelter Noranda's Brunswick smelting division has recently installed an on-line monitoring system to monitor and optimize return sinter size and uniformity for blast furnace optimization (Figure 8). 4. Summary Experience with optical image processing systems has revealed that the greatest source of measurement errors result from sampling error, and limited sample sizes. On-line analysis provides the solution to the sampling problem, by allowing random or systematic sampling, as well as allowing the possibility of complete sampling. Given their improved accuracy and sampling ability, and that they are also totally automated, on-line systems will certainly become more prominent in the future of the mining and materials handling industries. 5. References 1. Barkley, T., and Russell, C., 1999. "Evaluation of optical sizing methods."
Proceedings of the 25th Annual Conference on Explosives and Blasting Technique, Nashville, Tennessee, USA, Vol. II, pp. 305-323.

2. Katsabanis, P. D., 1999. "Comparison between laboratory analysis and sieving using laboratory scale model muckpiles." Proceedings of the 25th Annual Conference on Explosives and Blasting Technique, Nashville, Tennessee, USA, Vol. II, pp. 323-332.
3. Maerz, N. H., 1996. "Image sampling techniques and requirements for automated image analysis of rock fragmentation." Proceedings of the FRAGBLAST 5 Workshop on Measurement of Blast Fragmentation, Montreal, Quebec, Canada. Franklin, J. A, and Katsabanis, T., (ed.). A. A. Balkema, pp. 115-120.
4. Maerz, N. H., 1998. "Aggregate sizing and shape Determination using digital image processing." Center For Aggregates Research (ICAR) Sixth Annual Symposium Proceedings, pp. 195-203.
5. "Maerz, N. H., Franklin, J. A., and Coursen, D. L., 1987. Fragmentation measurement for experimental blasting in Virginia." S.E.E., Proc. 3rd. Mini-Symposium on Explosives and Blasting Research, pp. 56-70.
6. Maerz, N. H., Palangio, T. C., and Franklin, J. A., 1996. "WipFrag image based granulometry system." Proceedings of the FRAGBLAST 5 Workshop on Measurement of Blast Fragmentation, Montreal, Quebec, Canada. Franklin, J. A, and Katsabanis, T., (ed.). A. A. Balkema, pp. 91-99.
7. Maerz, N. H., and Zhou, W., 1999a. "Optical digital fragmentation measuring systems - inherent sources of error." Accepted for publication, FRAGBLAST- The International Journal For Blasting and Fragmentation.
8. Maerz, N. H., and Zhou, W., 1999b. "Calibration of optical digital fragmentation measuring systems." To be presented, FRAGBLAST 6 - The Sixth International Symposium for Rock Fragmentation by Blasting, Johannesburg, South Africa, 8-12 August, 1999.
9. Palangio, T. C., and Franklin, J. A., 1996. "Practical guidelines for lighting and photography." Proceedings of the FRAGBLAST 5 Workshop on Measurement of Blast Fragmentation, Montreal, Quebec, Canada. Franklin, J. A, and Katsabanis, T., (ed.). A. A. Balkema, pp. 111-114.
10. Palangio, T. C., Franklin, J. A., and Maerz, 1995. "WipFrag - A breakthrough in fragmentation measurement." Sixth High Tech Seminar, State-of-the-Art, Blasting Technology Instrumentation and Explosives Applications, Boston, Massachusetts. Vol. 2, pp. 943-971.
11. Preston, C., and Lidkea, W., 1996. "INCO and DYNO experience with underground fragmentation measurement." Proceedings of the FRAGBLAST 5 Workshop on Measurement of Blast Fragmentation, Montreal, Quebec, Canada. Franklin, J. A, and Katsabanis, T., (ed.). A. A. Balkema, pp. 265-270.
12. Simkus R., and Dance A., 1998. "Tracking Hardness and Size: Measuring and Monitoring ROM Ore Properties at Highland Valley Copper." Proceedings Mine to Mill 1998 Conference. Australasian Institute of Mining and Metallurgy: Melbourne, pp. 113 -119.