main highlights release of the 1q14 results -...
TRANSCRIPT

1Q14 Results 1
Release of the 1Q14 Results In the 1Q14, the main highlights were the following:
Consolidated adjusted EBITDA was R$655 million, 27% higher than in the 4Q13 and 109%
above the 1Q13;
Consolidated adjusted EBITDA was 21%, 500 basis points higher than in the 4Q13 and 110
basis points higher than in the 1Q13 – the highest margin since the 3rd quarter, 2010;
EBITDA margin in the Steel Business Unit reached 17% in the 1Q14, against 11% in the
4Q13 and 7% in the 1Q13 – the highest margin since the 3rd quarter, 2010;
Net profit reached R$222 million, 372% higher than in the 4Q13 and R$344 million above
the 1Q13.
Public Disclosure - Belo Horizonte, April 24th, 2014. Usinas Siderúrgicas de Minas Gerais S.A. - Usiminas (BM&FBOVESPA: USIM3, USIM5 e USIM6; OTC: USDMY and USNZY; Latibex: XUSIO and XUSI) today releases its first quarter results of fiscal year 2014 (1Q14). Operational and financial information of the Company, except where otherwise stated, are presented based on consolidated figures, in Brazilian Real, according to International Financial Reporting Standards (IFRS). All comparisons made in this release take into consideration the fourth quarter of 2013 (4Q13), except where stated otherwise.
BM&FBOVESPA: USIM5 R$10.23/share
USIM3 R$9.21/share
EUA/OTC: USNZY US$4.40/ADR
Latibex: XUSI €3.24/share XUSIO €2.92/share
• Consolidated Results
• Performance of the Business Units: - Siderurgia - Mining - Steel - Steel Processing - Capital Goods • Events Subsequent to closing of the Quarter
• Highlights
• Capital Markets
• Balance Sheet, Income and Cash Flow Statements
3T11
Market Data – 03/31/14 Index
R$ million - Consolidated 1Q14 4Q13 1Q13Chg.
1Q14/4Q13
Steel Sales Volume (000 t) 1,437 1,492 1,591 -4%
Iron Ore Sales Volume (000 t) 1,765 2,212 1,346 -20%
Net Revenue 3,142 3,193 3,195 -2%
COGS (2,623) (2,756) (2,988) -5%
Gross Profit (Loss) 520 437 207 19%
Net Income (Loss) 222 47 (123) 372%
EBITDA (Instruction CVM 527) 648 515 296 26%
EBITDA Margin (Instruction CVM 527) 21% 16% 9% 500bps
Adjusted EBITDA 655 514 313 27%
Adjusted EBITDA Margin 21% 16% 10% 500bps
Investments (CAPEX) 238 308 175 -23%
Cash Position 2,914 3,469 4,239 -16%
Main Highlights

1Q14 Results 2
Economic Scenario
The global economy continues to show improvement and the International Monetary Fund (IMF)
forecasts higher economic growth from 3.0% in 2013 to 3.6% in 2014. The greater improvement
manly comes from the growth in the advanced economies.
In Brazil, GDP growth in the 1Q14 should be weak. The positive indicators of the economic activity
at the beginning of the year, such as the Economic Activity Indicator (IBC-Br) and the Industrial
Production Research (PIM-IBGE), were not sustained during the quarter and should show modest
expansion.
The lack of dynamism of the economy in addition to inflation pressures and high interest rates
impose a negative impact on the consumers’ and entrepreneurs’ expectations. Confidence
indicators confirm gradual deterioration on the perception of business environment. Due to this,
the scenario is less favorable to the growth of industrial sectors related to investments, which
expansion has sustained, so far, the growth in steel consumption.
The expectation that the Brazilian currency devaluation would promote significant change in the
trade balance of products that contain steel did not show impacts in the 1Q14. Although there has
been a decline in indirect steel imports, exports had declined even more. According to the Brazil
Steel Institute, indirect imports of flat steel products totaled 1.2 million tons in 1Q14.
Steel Industry
According to the World Steel Association (WSA), global crude steel production reached 261.7
million tons in the first two months of the year, 1.6% higher than that seen in the same period of
the previous year, with Chinese production, which has a 50% share of global production,
advancing 1.7%. Apparent consumption in 2013 exceeded WSA forecasts and reached 1.5 billion
tons in 2013, an advance of 3.6% over 2012. For 2014, even with the expectation of slight
slowdown in investments in the Chinese economy, the WSA forecasts a 3.1% increase in the
apparent steel consumption in the world. According to this entity, the capacity utilization rate
increased for the second consecutive month in February, reaching a level of 77.6%. Nevertheless,
the condition of excess capacity persists, negatively affecting profitability conditions in the global
steel industry.
In Brazil, crude steel production reached 5.3 million tons in the first two months of the year and
was stable if compared with 2013. In the 12-month accumulated figure, production totaled 34.2
million tons. The estimates indicate that flat steel apparent consumption reached 3.6 million tons
in the 1Q14, with imports having around a 12.2% share. Consumption grew 1.1% compared with
the 4Q13 as a result of higher sales in the Distribution and Civil Construction segments.
According to the Steel Distributors National Association (INDA), flat steel sales in the distribution
network grew 12.3% in the 1Q14 and inventories remained at historical levels with a turnover at
2.6 months. Among the product lines, positive highlights are for the sales of heavy plate and
coated steel, in line with the improved performance of the capital goods sector, manly related to
machinery and equipment production and civil construction.
Mining
In the 1Q14, the negative outlook regarding weaker results in China, uncertainties in relation to its
growth rates, credit restrictions and the need to comply with anti-pollution environmental control
indicators reflected in the prices of iron ore, which declined 10% in comparison with the 4Q13,
reaching US$121/t (62% iron content, CFR China).
In spite of lower expectation in relation to iron ore sales volume in the 1Q14, the lower seasonal
effects allowed a greater volume of iron ore exports in comparison with the last years.
Cru Metals’ market analysis referring to the price of iron ore for 2014 indicates a declining trend,
mainly based on the assumption of entrance of significant volumes of Australian iron ore with
competitive costs and prices in the export market.

1Q14 Results 3
Economic and Financial Performance
Comments on Consolidated Results
Net Revenues
Net revenues in the 1Q14 totaled R$3.1 billion, nearly stable in comparison with the 4Q13, in
function of lower total sales volume compensated by higher average prices of steel and iron
ore.
Cost of Goods Sold (COGS)
In the 1Q14, COGS totaled R$2.6 billion, 4.8% lower than in the 4Q13, mainly due to lower
sales volumes of steel and iron ore.
Thus, gross margin in the 1Q14 was 280 basis points above that accounted for in the 4Q13, as
shown below:
Operating Expense and Revenue
In the 1Q14, sales expenses were stable in relation to the 4Q13. General and administrative
expenses were 10.5% lower, due to the decrease in expenses related to third party services
and labor force. The operating expenses and revenues presented a revenue of R$28.5 million
in the 1Q14 against an expense of R$42.3 million in the 4Q13, mainly due to the sale of
electric energy in the amount of R$75.0 million and provision for contingencies of only R$8.2
million, against R$40.7 million in the 4Q13. Besides, the 4Q13 had the positive effects of
“Programa Reintegra” and the sale of Automotiva Usiminas.
Thus, the Company’s operating margin showed the following performance:
2011
1Q14 4Q13 1Q13
Domestic Market 87% 89% 85%
Exports 13% 11% 15%
Total 100% 100% 100%
Net Revenue Breakdown
1Q14 4Q13 1Q13
16.5% 13.7% 6.5%
Gross Margin
1Q14 4Q13 1Q13
10.6% 5.3% -0.5%
EBIT Margin

1Q14 Results 4
Adjusted EBITDA
Adjusted EBITDA is calculated from net income (loss), reversing profit (loss) from discontinued
operations, income tax and social contribution, financial result, depreciation, amortization and
depletion, and equity in the results of Associate, Joint Subsidiary and Subsidiary Companies.
The adjusted EBITDA includes the proportional participation of 70% of Unigal and others joint
subsidiary companies.
Adjusted EBITDA in the 1Q14 reached R$655.4 million, 27.5% higher than in the 4Q13, which
was R$514.1 million. Adjusted EBITDA margin in the 1Q14 increased 480 basis points,
reaching 20.9%, mainly in function of the operational improvement in all of the Company’s
Business Units, with reduction of cost and operational expenses, in addition to the sale of
electric energy. The adjusted EBITDA margins are shown below:
Financial Result
In the 1Q14, net financial expenses were R$18.1 million, against R$265.2 million in the 4Q13,
mainly due to the positive effect on the currency exchange variation and lower financial
expenses.
1Q14 4Q13 1Q13
20.9% 16.1% 9.8%
Adjusted EBITDA Margin
R$ thousand 1Q14 4Q13 1Q13Chg.
1Q14/4Q13
Currency Exchange Variation 64,830 (105,029) 50,396 -
Swap Operations Market Cap. (959) 3,921 14,065 -124%
Inflationary Variation (44,148) (35,552) (43,568) 24%
Financial Income 39,052 50,901 37,018 -23%
Financial Expenses (76,832) (179,423) (294,061) -57%
FINANCIAL RESULT (18,057) (265,182) (236,150) -93%
Financial Result - Consolidated

1Q14 Results 5
Equity in the Results of Associate and Subsidiary Companies
Equity in the results of associate and subsidiary companies was R$44.3 million in the 1Q14,
lower by 19.2% compared with the 4Q13, mainly due to lower contribution of MRS Logística in
the period.
Net Income (Loss)
The Company presented net income of R$221.6 million in the 1Q14, against R$47.0 million in
the 4Q13, an increase of 371.5%, mainly due to the better performance of all its Business Units
(with a highlight for the Steel Unit), reduction in cost and reduction in operating and financial
expenses.
Investments (CAPEX)
Investments totaled R$237.7 million in the 1Q14, mainly in function of maintenance CAPEX,
technological update in the plants and the Coke Plant II revamp in Ipatinga, in the Steel Unit,
and the Friables Project, in the Mining Unit.
Out of total investments in the 1Q14, 83% were applied to the Steel Unit, 12% to the Mining
Unit, 3% to the Steel Processing Unit and 2% to the Capital Goods Unit.
Indebtedness
Total consolidated debt was R$6.7 billion on 03/31/14, against R$6.9 billion on 12/31/13,
showing a reduction of 3.6%. Net consolidated debt was R$3.7 billion at the end of March
2014, against R$3.4 billion at the end of 2013. On the other hand, the net debt/EBITDA ratio
was 1.7 times on 03/31/14, against 1.9 times on 12/31/13.
On 03/31/14, debt composition by maturity was 21.2% in the short term and 78.8% in the
long term. Composition by currency represented 67.6% in local currency and 32.4% in foreign
currency. The following chart shows the consolidated debt by index:
31-Dec-13
Short Term Long Term TOTAL TOTAL
Local Currency 875,190 3,624,974 4,500,164 68% 4,537,975 -1%
TJLP 221,901 558,582 780,483 - 836,348 -7%
CDI 613,221 2,999,043 3,612,264 - 3,591,129 1%
Others 40,068 67,349 107,417 - 110,498 -3%
Foreign Currency (*) 535,533 1,622,064 2,157,597 32% 2,364,859 -9%
Gross Debt 1,410,723 5,247,038 6,657,761 100% 6,902,834 -4%
Cash and Cash Equivalents - - 2,913,979 - 3,468,816 -16%
Net Debt - - 3,743,782 - 3,434,018 9%
(*) 99% of total foreign currency is US dollars denominated
R$ thousand31-Mar-14
%Chg.
Mar14/Dec13
Total Indebtedness by Index - Consolidated

1Q14 Results 6
The graph below shows consolidated debt and cash position:
Performance of the Business Units
Intercompany transactions are on an arm’s-length basis (market prices and conditions).
Mining Steel Steel Processing Capital Goods
Mineração Usiminas Ipatinga Mill Soluções Usiminas Usiminas Mecânica
Cubatão Mill
Unigal
Usiminas - Business Units
1,893
849 892754
999
312
670
19 7
1,021
535222 493
282
6194
2 0
Cash 2014 2015 2016 2017 2018 2019 2020 2021 on
Local Currency Foreign Currency
2,914
1,384
1,113
1,280
931
675
721
1,246
Duration: R$: 35 meses
US$: 34 meses
Debt Profile
R$ million
1Q14 4Q13 1Q14 4Q13 1Q14 4Q13 1Q14 4Q13 1Q14 4Q13 1Q14 4Q13
Net Revenue 346 382 2,877 2,824 562 612 169 202 (812) (828) 3,142 3,193
Domestic Market 234 345 2,575 2,521 557 609 169 190 (812) (828) 2,723 2,835
Exports 112 38 302 304 6 3 0 12 0 0 420 357
COGS (153) (200) (2,539) (2,600) (529) (559) (151) (188) 750 790 (2,623) (2,756)
Gross Profit 192 182 339 225 33 53 18 15 (63) (38) 520 437
Operating Income
(Expenses)(41) (42) (96) (158) (31) (52) (16) (19) 1 2 (183) (269)
EBIT 151 141 242 67 3 1 2 (5) (62) (36) 336 168
Adjusted EBITDA 175 181 477 308 12 13 9 2 (18) 10 655 514
Adj.EBITDA Margin 51% 47% 17% 11% 2% 2% 5% 1% - - 21% 16%
*Consolidates 70% of Unigal
Income Statement per Business Units - Non Audited
ConsolidatedMining Steel*Steel
ProcessingCapital Goods Adjustment

1Q14 Results 7
I) M I N I N G
Operational and Sales Performance
In the 1Q14, production volume reached 1.6 million tons, 20.5% lower than in the 4Q13, in order
to be adjusted to the sales pace of the period.
Sales volume in the 1Q14 registered a decline of 20.2% in comparison with the 4Q13, mainly in
function of lower sales volume in the domestic market, partially compensated by the increase in
exports. Iron ore volume destined to the Ipatinga and Cubatão plants was 1.0 million tons.
Production and sales volumes are shown in the following chart:
Comments on the Business Unit Results - Mining
Net revenue of the Mining Unit accounted for in the 1Q14 was R$345.6 million, a 9.6% decrease
when compared with the 4Q13, which was R$382.4 million, mainly due to lower sales volume,
partially compensated by higher average prices in Reais (lower average price in Dollar
compensated by higher exchange rate on average in the quarter).
In the 1Q14, Cost of Goods Sold (COGS) totaled R$153.3 million, 23.4% lower in relation to the
4Q13, mainly in function of lower sales volume. The COGS per ton was reduced by 4.0% manly
due to lower mining rights leasing costs.
Consequently, gross profit reached R$192.3 million in the 1Q14, against R$182.3 million in the
4Q13, and gross margin was 55.6% against 47.7%, respectively.
Operating expenses in the 1Q14 were R$41.3 million, stable in relation to the 4Q13. There was an
increase in sales expenses due to higher exports by 203.0%, compensated by the sale of surplus
electric energy of R$16.2 million.
Therefore, in the 1Q14, Adjusted EBITDA was R$175.2 million, 3.0% lower than in the 4Q13,
which was R$180.6 million. Nevertheless, EBITDA margin was 50.7% in the 1Q14, an increase of
350 basis points compared with the 4Q13, in function of higher efficiency in the management of
costs.
Investments (CAPEX)
Investments in the 1Q14 reached R$28.9 million, mainly related to the Friables Project, and
were 36.1% below the amount invested in the 4Q13.
Stake in MRS Logística
Mineração Usiminas holds a stake in MRS through its subsidiary UPL – Usiminas Participações e
Logística S.A.
MRS Logística is a concession that controls, operates and monitors the Brazilian Southeastern
Federal Railroad Network (Malha Sudoeste da Rede Ferroviária Federal). The company operates
Thousand tons 1Q14 4Q13 1Q13Chg.
1Q14/4Q13
Production 1,618 2,036 1,649 -21%
Sales - Third Parties - Domestic Market 298 996 48 -70%
Sales - Exports 509 168 165 203%
Sales to Usiminas 957 1,048
1.133 -9%
Total Sales 1,765 2,212 1,346 -20%
Iron Ore
1Q14 Results 8
in railway transportation segment, connecting the states of Rio de Janeiro, Minas Gerais and São
Paulo, and its core business is transporting with integrated logistics of cargo in general, such as
iron ore, finished steel products, cement, bauxite, agricultural products, pet coke and containers.
MRS transported a total volume of 36.2 million tons in the 1Q14, which represented a decrease
of 13.0% in relation to the 4Q13, following the seasonality of the period, which traditionally
presents lower volumes at the beginning of every year.
II) S T E E L
Production – Ipatinga and Cubatão Plants
In the 1Q14, crude steel production at the Ipatinga and Cubatão plants was 1.7 million
tons, stable in relation to the 4Q13.
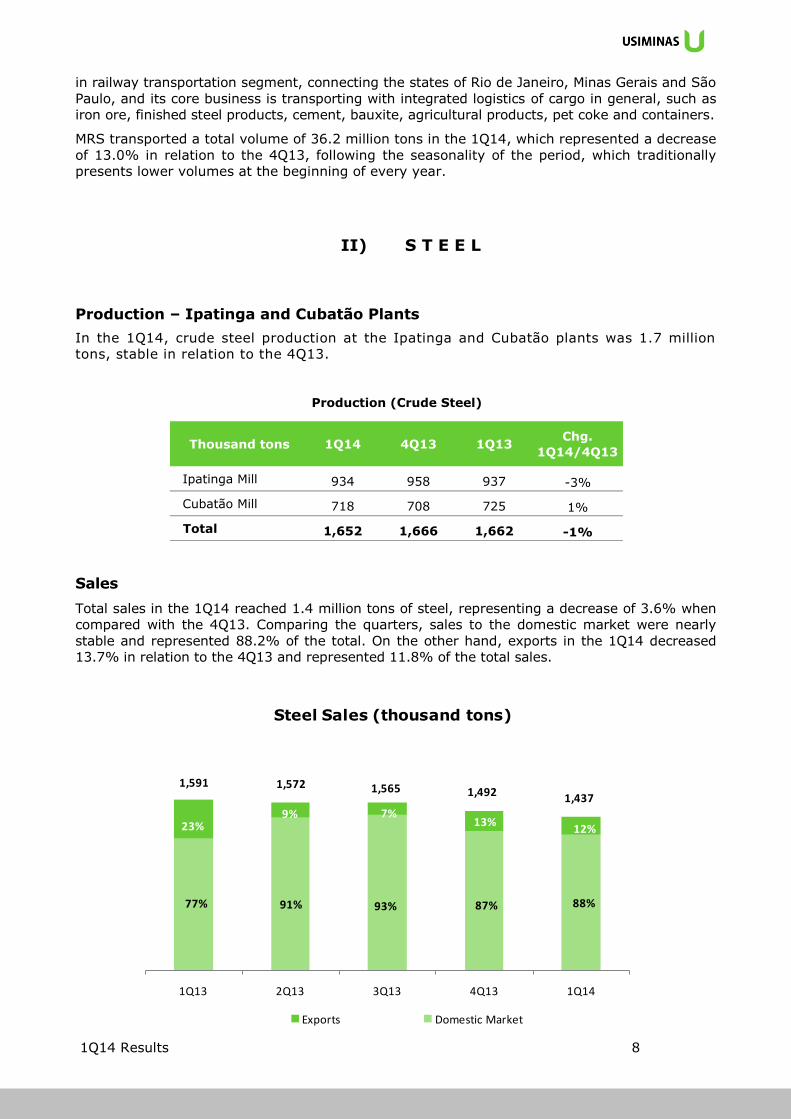
Sales
Total sales in the 1Q14 reached 1.4 million tons of steel, representing a decrease of 3.6% when
compared with the 4Q13. Comparing the quarters, sales to the domestic market were nearly
stable and represented 88.2% of the total. On the other hand, exports in the 1Q14 decreased
13.7% in relation to the 4Q13 and represented 11.8% of the total sales.
Thousand tons 1Q14 4Q13 1Q13Chg.
1Q14/4Q13
Ipatinga Mill 934 958 937 -3%
Cubatão Mill 718 708 725 1%
Total 1,652 1,666 1,662 -1%
Production (Crude Steel)
1Q13 2Q13 3Q13 4Q13 1Q14
Steel Sales (thousand tons)
Exports Domestic Market
1,5651,591 1,5721,492 1,437
7%
87%
13%
77%
23%
91%
9%
88%
12%
93%

1Q14 Results 9
The main export destinations are listed below:
38%
21%
19%
8%
5%5%2%2%
Exports - Main Markets – 1Q14
USA
Colombia
Argentina
Singapore
Taiwan
Chile
Mexico
Others
Thousand tons Chg.
1Q14/4Q13
Total Sales 1,437 100% 1,492 100% 1,591 100% -4%
Heavy Plates 279 19% 297 20% 273 17% -6%
Hot Rolled 517 36% 518 35% 573 36% 0%
Cold Rolled 377 26% 367 25% 360 23% 3%
Electrogalvanized 29 2% 30 2% 31 2% -3%
Hot Dip Galvanized 186 13% 194 13% 197 12% -4%
Processed Products 26 2% 25 2% 35 2% 5%
Slabs 23 2% 61 4% 120 8% -62%
Domestic Market 1,268 88% 1,299 87% 1,226 77% -2%
Heavy Plates 228 16% 255 17% 238 15% -11%
Hot Coils 465 32% 470 31% 431 27% -1%
Cold Coils 336 23% 339 23% 298 19% -1%
Electrogalvanized 26 2% 27 2% 28 2% -3%
Hot Dip Galvanized 172 12% 171 11% 177 11% 1%
Processed Products 25 2% 23 2% 30 2% 5%
Slabs 17 1% 14 1% 25 2% 23%
Exports 169 12% 193 13% 365 23% -12%
Heavy Plates 51 4% 42 3% 36 2% 23%
Hot Rolled 52 4% 48 3% 142 9% 9%
Cold Rolled 41 3% 27 2% 62 4% 50%
Electrogalvanized 3 0% 3 0% 4 0% -5%
Hot Dip Galvanized 14 1% 24 2% 20 1% -41%
Processed Products 1 0% 1 0% 5 0% 9%
Slabs 7 0% 48 3% 95 6% -86%
4Q131Q14 1Q13
Sales Volume Breakdown
1Q14 Results 10
Comments on the Business Unit Results - Steel
In the 1Q14, the Steel Unit registered net revenue of R$2.9 billion, 1.9% higher than in the
4Q13, due to the increase in the steel average prices by 6.2%.
In the 1Q14, Cost of Goods Sold (COGS) was R$2.5 billion, 2.4% lower than in the 4Q13, mainly
due to lower sales volume. COGS per ton was nearly stable in comparison with the previous
quarter, explained by higher costs with electric energy and fuels, compensated by lower costs
with coal, iron ore, own labor force and third-party services.
In the 4Q14, sales expenses were 12.7% lower than in the 4Q13, as a result of lower export
volume. General and administrative expenses decreased 9.6%, mainly due to the reduction in
the third-party services and lower general expenses. Total operating expenses accounted for in
the 1Q14 were R$96.5 million, against R$157.8 million in the 4Q13, a reduction of 38.9%, in
function of the reduction in the SG&A and the sale of electric energy of R$58.8 million in this
period, against R$21.6 million in the 4Q13.
Adjusted EBITDA was R$477.1 million in the 1Q14, 55.0% higher than in the 4Q13, and EBITDA
margin went from 10.9% in the 4Q13 to 16.6% in the 1Q14, mainly in function of operational
improvement and greater efficiency in the industrial facilities, with lower costs and operational
expenses, and higher steel average prices by 6.2%.
Investments (CAPEX)
Investments in the 1Q14 totaled R$198.5 million, mainly with maintenance CAPEX and the Coke
Plant II revamp in Ipatinga. The Coke Plant revamp will increase gas and coke self-generation
and is forecast to start up in the 4Q14.
III) S T E E L P R O C E S S I N G
Soluções Usiminas (SU)
Soluções Usiminas operates in the distribution, services and small-diameter tubes markets
nationwide, offering its customers high-value added products. It serves several economic
segments, such as automotive, autoparts, civil construction, distribution, electro-electronics,
machinery and equipment and household appliances, among others.
Sales of the Distribution, Just in Time Services and Tubes’ Business Units were responsible for
57%, 34% and 9% of total sales volume in the 1Q14, respectively.
Net revenue of Soluções Usiminas grew 1.9% in relation to the 4Q13, due to the increased sales
volume by 4.5% compared with the 4Q13.
Comments on the Business Unit Results – Steel Processing
Due to the conclusion of the sale of Automotiva Usiminas in December 2013, this Company no
longer contributes to the results of the Steel Processing Business Unit from the 1Q14 on, being
not able to compare such figures.
In the 1Q14, net revenue summed R$562.5 million. On the other hand, cost of goods sold
totaled R$529.0 million and operating expenses, R$30.7 million.
In the 1Q14, Adjusted EBITDA totaled R$12.3 million and EBITDA margin was 2.2%.

1Q14 Results 11
IV) C A P I T A L G O O D S
Usiminas Mecânica S.A.
Usiminas Mecânica is a capital goods company in Brazil, which operates in the following
business areas: steel structures, shipbuilding and offshore, oil and gas, industrial equipment,
industrial assembly and foundry and railcars.
Highlight
In the 1Q14, the main contract signed was with Vale for the project of Carajas’ railroad
bridges.
Comments of the Business Unit Results – Capital Goods
Net revenue accounted for in the 1Q14 was R$169.2 million, 16.4% lower than in the 4Q13.
The decrease was due to the conclusion of some projects in the structures segment, partially
compensated by the increase in revenues in the assembly and equipment segments.
Gross profit was R$18.0 million in the quarter, R$3.2 million higher than in the 4Q13,
reflecting a reduction of fixed costs and better margins obtained in the assembly and
equipment segments.
Adjusted EBITDA in the 1Q14 was R$8.8 million, against R$2.3 million in the 4Q13, due to the
better performance in the assembly and equipment segments.
Subsequent Events to the Closing of the Quarter
• Usiminas informed through a Material Fact published at the CVM on 04/10/2014 that
the Economic Defense Council (CADE), in its ordinary judgment session held on
04/09/2014, deliberated on the process relative to the acquisition of minority equity in
its capital by the Companhia Siderúrgica Nacional – CSN and corporations related to it
(“Grupo CSN”). Grupo CSN has executed a Term of Compliance with CADE
compromising to dispose part of its equity held in Usiminas. The deadline for CSN to
dispose the shares acquired in Usiminas and the percentage to be sold were kept
confidential.
General Ordinary Meeting: it will take place on 04/25/2014. The meeting will deliberate
on the following subjects: (1) Appreciation of the managements’ report and analysis,
discussion and vote on the financial statements and annual management report
regarding the fiscal year ending 12/31/13; (2) Settlement of the global budget for the
Administrators´ compensation for the period until the 2015 Annual Shareholders´
Meeting; (3) Appointment of the members of the Board of Directors, effectives and
alternates, for a term until the 2016 Annual Shareholders´ Meeting, including the
deliberation on the number of seats to be fulfilled by such appointment; (4)
Appointment of the members of the “Fiscal Council” (Conselho Fiscal), effectives and
alternates, for a term until the 2015 Annual Shareholders´ Meeting, as well as
determination of their respective compensation.

1Q14 Results 12
Highlights
John Deere, global leader in manufacture of agricultural machinery, granted the award
in the “Partner” category to Usiminas for the third consecutive year, the highest level of
the relationship program with its suppliers in Brazil and Latin America, which indicates
the maximum standards of supply and performance.
Mangels, a manufacturer of vehicles components and leader in the gas containers and
cylinders segment, recognized Usiminas as a differentiated supplier of direct raw
material. The award consolidates the Company as an unique supplier due to products
quality, delivery punctuality and continuous improvement proposes.
Capital Markets
Performance on the BM&FBOVESPA
Usiminas’ Common shares (USIM3) closed the 1Q14 quoted at R$9.21 and its Preferred shares
(USIM5) at R$10.23. In the quarter, USIM3 depreciated 25.7% in value and USIM5, 28.0%. In
the same period, the Ibovespa index declined 2.1%.
Foreign Stock Markets
OTC – New York
Usiminas has American Depositary Receipts (ADRs) traded on the over-the-counter market:
USDMY is backed by common shares and USNZY backed by Class A preferred shares. On
03/31/2014, greater liquidity USNZY ADRs were quoted at US$4.40 and depreciated 27.2% in
value in the quarter.
Latibex – Madrid
Usiminas’ shares are traded on the LATIBEX – the Madrid Stock Market: XUSI as preferred
shares and XUSIO as common shares. On 03/31/2014, XUSI closed quoted at €3.24, having
appreciated 27.4%. XUSIO shares closed at €2.92, with a depreciation of 23.2% in the
quarter.
1Q14 4Q13Chg.
1Q14/4Q131Q13
Chg.
1Q14/1Q13Number of Deals 868,117 865,514 0% 784,676 11%
Daily Average 13,780 14,189 -3% 13,300 4%
Traded - thousand shares 438,819 382,106 15% 416,547 5%
Daily Average 6,965 6,264 11% 7,060 -1%
Financial Volume - R$ million 4,897 4,701 4% 4,450 10%
Daily Average 78 77 1% 75 4%
Maximum 14.08 14.50 -3% 13.25 6%
Minimum 8.52 10.91 -22% 9.24 -8%
Closing 10.23 14.21 -28% 10.82 -5%
Market Capitalization - R$ million 10,371 14,406 -28% 10,969 -5%
Usiminas Performance Summary - BM&FBOVESPA (USIM5)

1Q14 Results 13
For further information:
Visit the investor relations website: www.usiminas.com/ri
or access on your mobile phone: m.usiminas.com/ri
Brasília time: at 11:00 a.m.
Dial-in Numbers:
Brazil: (55 11) 3193 1001 / 2820 4001
Pincode for replay: 1597213# - Portuguese
Audio of the conference call will be transmitted live via Internet
See the slide presentation on our website: www.usiminas.com/ri
1Q14 Conference Call - Date 04/24/2014
New York time: at 10:00 a.m.
Dial-in Numbers:
In Portuguese - Simultaneous Translation into English
Audio replay available at (55 11) 3193 1012
USA: (1 786) 924 6977
Pincode for replay: 4796362# - English
Statements contained in this release, relative to the business outlook of the Company, forecasts of operating and financial income and references to growth prospects are mere forecasts and were based on the expectations of Management in relation to future performance. These expectations are highly dependent on market conduct, the economic situation in Brazil, its industry and international markets and, therefore, are subject to change.

1Q14 Results 14
31-Mar-14 31-Dec-13
4,921,801 5,087,491
Loans and Financing and Taxes Payable in Installments 1,410,723 1,355,940
Suppliers, Subcontractors and Freight 2,330,740 2,422,024
Wages and Social Charges 259,912 250,849
Taxes and Taxes Payables 163,670 135,278
Related Companies 144,520 140,042
Financial Instruments 54,141 51,015
Liabilities on Non Current Assets for Sale - -
Dividends Payable 1,121 1,122
Customers Advances 133,699 178,309
Others 423,275 552,912
7,142,870 7,436,558
Loans and Financing and Taxes Payable in Installments 5,247,038 5,546,894
Actuarial Liability 1,246,574 1,230,316
Provision for Contingencies 482,764 506,679
Financial Instruments 50,134 52,910
Environmental Protection Provision 78,643 76,588
Others 37,717 23,171
19,026,499 18,833,945
Capital 12,150,000 12,150,000
Hedge Accounting 0 -3,131
Reserves & Revenues from Fiscal Year 4,717,273 4,565,039
Non-controlling shareholders participation 2,159,226 2,122,037
31,091,170 31,357,994
Long-Term Liabilities
Total Liabilities and Shareholders' Equity
Shareholders' Equity
Current Liabilities
Balance Sheet - Liabilities and Shareholders' Equity - Consolidated | IFRS - R$ thousand
Liabilities and Shareholders' Equity
Assets 31-Mar-14 31-Dec-13
Current Assets 9,241,989 9,460,294
Cash and Cash Equivalents 2,913,979 3,468,816
Trade Accounts Receivable 1,736,898 1,639,551
Taxes Recoverable 305,896 323,520
Inventories 4,068,636 3,850,420
Advances to suppliers 13,052 13,541
Financial Instruments 49,372 45,637
Non Current Assets for Sale - -
Other Securities Receivables 154,156 118,809
Non-Current Assets 21,849,181 21,897,700
Long-Term Receivable 2,768,902 2,830,342
Deferred Income Tax & Social Contribution 1,851,482 1,914,996
Deposits at Law 565,200 565,404
Accounts Receiv. Affiliated Companies 21,268 20,831
Taxes Recoverable 109,654 113,474
Financial Instruments 39,832 40,608
Others 181,466 175,029
Investments 1,201,463 1,159,948
Property, Plant and Equipment 15,481,317 15,506,833
Intangible 2,397,499 2,400,577
Total Assets 31,091,170 31,357,994
Balance Sheet - Assets - Consolidated | IFRS - R$ thousand

1Q14 Results 15

1Q14 Results 16