maine s transportation system
TRANSCRIPT

MAINE’S TRANSPORTATION SYSTEMStatus and Trend Indicators
of Economic Growth and Quality of Life
October, 1999
Prepared by the
MAINE DEVELOPMENT FOUNDATION

Prepared by the Maine Development Foundation for the Maine Department of Transportation, October, 1999 1
IntroductionMaine’s Transportation System ......................................... 1
System Overview ...................................................... 1Contribution to the Economy................................... 1Maine’s Unique Transportation Challenges............... 2Funding for Transportation ....................................... 2
Report Purpose, Organization, and Process...................... 3Purpose of this Report.............................................. 3How the Report is Organized ................................... 3Relation of this Report to Others ............................. 4The Process............................................................... 4
Indicators
System Use1 - Vehicle Miles Traveled.................................................. 52 - Passenger Travel by Mode............................................ 63 - Freight Transport by Mode .......................................... 7
Impact on Economy4 - Satisfaction Among Manufacturers .............................. 85 - Satisfaction Among Service Providers.......................... 96 - Freight Transport Competitiveness............................ 107 - Air Travel Competitiveness ........................................ 118 - Tourism & Seasonal Highway Use.............................. 12
Impact on Quality of Life9 - Rail Safety .................................................................. 1310 - Road Safety .............................................................. 1411 - Road Congestion in Urban Areas ............................. 1512 - Road Congestion in Rural Areas............................... 1613 - Highway Speed Related to Development................ 1714 - Satisfaction Among Non-commercial Drivers .......... 1815 - Environmental Impact ............................................. 1916 - System Impact on Sense of Community.................. 21
Infrastructure17 - Road Condition........................................................ 2218 - Bridge Condition ..................................................... 2419 - Railways in Active Service ....................................... 2520 - Cargo Port Condition............................................... 2621 - Airport Capacity....................................................... 2722 - Public Involvement in Transportation Planning ...... 29
AppendicesAppendix A - Survey Methodology................................. 30Appendix B - Related Documents .................................. 31Appendix C - Feedback Form......................................... 32Appendix D - People Involved in Preparing This Report. 33Appendix E - Glossary .................................................... 33
Contents

Prepared by the Maine Development Foundation for the Maine Department of Transportation, October, 1999 1
IntroductionThe exchange of goods and services that make up what we call “the Maine economy” would simply not be possible with-out our transportation system. Economic activity depends enormously on our roads, railways, cargo ships, and aircraft. It is via these transportation modes that Maine people connect with each other and with the rest of the world.
The quality and accessibility of Maine’s transportation sys-tems has a huge impact on Maine’s prospects for economic growth. This report provides a summary description of Maine’s transportation system and how it contributes to the economy. It profiles those key issues which serve as indica-tors of the vitality of the system.
Maine’s Transportation System
System Overview
The largest and most important component of Maine’s trans-portation system is its highway network. The overwhelming majority of people and goods in Maine are moved over the State’s 22,612 miles of public highways, and the highway system consumes the vast majority of transportation expendi-tures. The Maine Department of Transportation is responsible for approximately 8,303 miles, or 37% of the system. The Maine Turnpike Authority is responsible for the 111-mile Turn-pike. In addition, 336 miles of state highways are located within state or federal reservations. The remaining 13,862 miles, or 61% public of roads in Maine, are the responsibility of local government. These roads carry 11% of the total traffic. In addition, there is a very large network of private roads in Maine including camp roads and roads owned by paper companies.
Currently, Maine’s transportation system is used by millions of people that generate nearly 20 billion person-miles of travel (PMT) per year. With an average of 1.5 persons per vehicle, this translates to about 13 billion vehicle-miles traveled (VMT) on the highway system. Over the next 20 years, highway travel in Maine is expected to grow by 18%.
Maine has 3,564 public highway bridges, each having a clear span length of at least 10 feet (this number does not include bridges used strictly for rail traffic or for pedestrian use, or structures owned by the Maine Turnpike Authority, federal agencies, and private entities). Of the 3,564 public bridges, 2,842 are categorized as “traditional” bridges, and 722 are categorized as steel bridge culverts.
Maine’s aviation system consists of 35 publicly owned air-ports, six of which are served by regularly scheduled pas-senger service. In 1997, a total of 2 million passengers (enplanement and deplanement) used these commercial ser-vices into or out of Maine. This number is projected to increase to nearly 3 million by 2005.
The Maine State Ferry Service provides transportation to Isles-boro, North Haven, Vinalhaven, Swan’s Island, Matinicus and Frenchboro. The system is owned, operated, and subsidized by the State of Maine and provides year-round service. In 1997, the Maine State Ferry Service carried 464,022 passengers. In addition, the Maine Department of Transportation works
closely with Casco Bay Island Transit District (CBITD), based in Portland, and the towns of Cumberland and Yarmouth to provide access from Casco Bay islands to the mainland. In 1997, CBITD ferries carried 786,490 passengers. Also, numer-ous private operators provide seasonal or year-round trans-portation to other island communities.
The State of Maine is served by seven private railroads operat-ing over 1,100 miles of track traversing most metropolitan areas and many rural areas of the state. In 1996, approxi-mately 4 million tons of products left Maine by rail while about 3.9 million tons came into the state.
Maine’s three cargo ports of Eastport, Searsport, and Portland have shown steady, consistent growth for the past twenty years. In 1998, about 1.4 million short tons of dry cargo was moved through these ports. In addition, Rockland and Winterport also serve as valuable cargo ports.
In recent years, truck/rail intermodal facilities have been con-structed in Auburn and Waterville which effectively serve Mid-western and Canadian markets for Maine businesses. Presque Isle has also added a third site for intermodal traffic. These facilities are growing and currently move about 30,000 truck units per year.
An important part of the freight transportation system is the network of pipelines. A 500 mile network of natural gas pipelines connecting Maine to the national grid is cur-rently being constructed. Maine also has two major petroleum pipelines: from Montreal to Portland and from Searsport to Bangor.
Contribution to the Economy
It is easy to take for granted the ways in which Maine’s transportation system contributes to the economy. It’s similar to the way that an insurance agent’s telephone contributes to her ability to do business. Although she can’t define the exact dollar amount of her business that results from having a telephone, she can’t imagine doing business without it. Even though the telephone’s contribution is largely indirect, it is absolutely essential.
This report presents data that indicate many of the indirect impacts of Maine’s transportation system. For each indicator we have provided a brief description of how the particular issue impacts the economy. Taken as a whole, the indirect impacts form a complex picture from which multiple conclu-sions may be drawn.
In terms of direct economic impacts, the U.S. Department of Transportation estimates that about 10.5% of gross domestic product (the value of all goods and services exchanged in the economy) can be attributed to transportation. This includes the value of all goods and services purchased for transporta-tion services plus business investments for transportation services. This estimate applied to Maine suggests that about $3.2 billion worth of economic activity in Maine is annually attributed to transportation.
Based on U.S. Department of Labor consumer spending data, it is estimated that the average American household spends almost 20% of it’s annual spending on transportation-related goods and services, (just over $6,000). About 45% of house-

2 Prepared by the Maine Development Foundation for the Maine Department of Transportation, October, 1999 Prepared by the Maine Development Foundation for the Maine Department of Transportation, October, 1999 3
hold transportation spending goes to vehicle purchase, 32% to vehicle maintenance, insurance, financing, and related, and 16% goes to gasoline and motor oil. Just 6% of the average household’s transportation expenditures goes to non-vehicle related items such as purchases of transportation services including taxis, and tickets for airlines, buses and trains.
Overall, about 13,000 people are employed in Maine’s trans-portation industry, which includes all those employed in moving goods by truck, air, rail, water, buses, and taxis. This amounts to 1.95% of the labor force. Nationally, about 3.5% of the labor force is employed in the transportation industry.
However, there are many more people employed in jobs related to transportation such as manufacturing motor vehi-cles, aircraft, ships, trains, tires and other such goods; sales and service of automobiles and auto parts; construction of transportation infrastructure; and employees of transporta-tion-related government agencies.
Based on analysis conducted by the Federal Bureau of Trans-portation Statistics and our own analysis based on data from the Maine Department of Labor, it appears that a smaller per-centage of Maine’s labor force is employed in transportation-related industries than for the U.S. as a whole. This is due in large part to our geographic location relative to other states and that we have no major transportation hubs.
Maine’s Unique Transportation Challenges Constructing and maintaining a system to move goods and services around Maine is more challenging than in many other states for several reasons. First of all, Maine has a rela-tively sparse population relative to our land area. With a density of just 37 residents per square mile, Maine ranks 36th among the states in terms of density and it is the least dense of all the New England states. This is the leading reason why public transportation is not prominent in Maine and why the cost of constructing and maintaining highway infrastructure is relatively high per Maine resident.
Another reason for relatively high per resident costs is that Maine has an enormous number of visitors each year relative to its resident population. Transportation infrastructure must be built and maintained to support summer’s peak population.
Related to density, Maine has more miles of road per person than any other New England state and this is reflected in federal funding for our highways. While Maine received about
$17 federal dollars per mile of road in 1997, New England states on average received $93 federal dollars per mile of road. The 1997 national average was $23 per mile.
Worth noting are three trends about the nature of our popula-tion that will continue to impact our transportation system:
• Maine people are more reliant on cars than they used to be. While Maine’s population has grown about 28% since 1960, the number of registered vehicles has grown by 180%.
• Maine’s is an aging population. In 1970, 12% of the population was 65 and older. Currently, 14% of Maine people are 65 and older. By 2020, it is estimated that 18% of Maine people will be 65 and older. This presents ever increasing challenges to provide public transportation and adapt highway design and traffic control devices to be increasingly sensitive to a driv-ing population with somewhat diminished physical capabilities.
• Maine people are moving out of the urban centers and into rural areas. In 1960, 60% of Maine people lived in service center communities, whereas today just 46% of the population lives in these communi-ties. This puts substantial increased burden on rural roads to carry traffic to and from the urban centers.
Maine’s geophysical characteristics also pose transportation challenges. The Maine coast is estimated to be over 3,000 miles long and people want to be able to access a good deal of it by road. To the west, mountains and lakes stand in the way of direct travel and increase construction costs of roads and railways.
Another challenge, relative to southern states, is Maine’s weather. A significant amount of money is spent annually on snow removal, and the construction and maintenance of roads and railways needs to account for cyclical freezing down to the frost line. The operation of Maine’s airports and sea ports is also seriously impacted by Maine’s winter weather.
Lastly, it is worth noting that Maine people care deeply about preserving the natural environment. While we like to be independent, we are deeply concerned that transpor-tation infrastructure doesn’t unreasonably harm our water quality, wildlife habitats, and other environmental amenities. Maine’s transportation planners are challenged to strike the balance between minimizing environmental impact yet pro-viding mobility for independent-minded people.
Funding for Transportation
Maine’s transportation infrastructure was built with a com-bination of public and private investments over the past 300 years. The system’s maintenance and improvement still depend upon this partnership today.
The principal sources of funds for public spending on trans-portation in Maine comes from the state’s Dedicated Highway Fund and the federal government. Funds from these sources are derived from the proceeds of motor fuel taxes, motor vehicle registration and license fees and other transportation user fees. Over the 10 year period beginning 1988 and ending 1997, fund allocations to the Maine Department of Transporta-tion grew at a rate of approximately 4.9% per year, from a
Employment in Transportation Related Jobs - Maine, 1997Industry Jobs Percent
Transport Industry (movement of goods) 12,724 1.95%
Transportation Equipment Manufacture 16,594 2.55%
Auto Sales, Service, Parts, and Related 19,600 3.01%
Trans. Infrastructure Construction 13,233 2.03%
Maine Department of Transportation 2,329 0.36%
Total Transport-Related 64,480 9.9%
All Maine Industries 651,000 100%All data from Maine Dept. Of Labor except construction jobs estimate from the American Road and Transportation Builders Association

2 Prepared by the Maine Development Foundation for the Maine Department of Transportation, October, 1999 Prepared by the Maine Development Foundation for the Maine Department of Transportation, October, 1999 3
low of $239 million in fiscal year 1988 to a high of $357 million in 1997. Contributing to this increase was a 3 cent per gallon increase in Maine’s motor fuel tax, a one-time alloca-tion from the state General Fund for transportation purposes, and increased federal funding under the Intermodal Surface Transportation Efficiency Act of 1991 (ISTEA).
When adjusted for inflation, however, transportation funding has been flat for the past 10 years, even while state govern-ment allocations from the General Fund have generally grown (for example, state allocations to education grew by over 40% and allocations to human services grew by over 80%). This is because as vehicles become more fuel-efficient, the state Highway Fund realizes less and less revenue even though the number of vehicle-miles traveled is increasing. Moreover, the state’s cent-per-gallon motor fuel tax makes no automatic adjustment for inflation in the way that the income tax and sales tax do. These factors were among those that led to a 3 cent per gallon fuel tax increase in 1999. Yet this increase does not address the structural gap in the Highway Fund.
During the last 12 years, bond financing has been an impor-tant source of funding in expanding the Department’s capital program. The amount of principal outstanding has grown from $93 million in 1987 to $159 million in 1998 and debt service has grown concurrently. This increase in the debt level has been necessitated by increasing need for transportation investments with a relatively flat revenue stream. The recent 3 cent per gallon fuel tax increase allowed a modest reduction in borrowing.
Apart from state and federal funding, municipalities build and maintain local roads which comprise about 61% of Maine’s public roads and carry about 11% of total traffic. Construction and maintenance of these roads is supported in large part by locally collected property taxes. An analysis of data col-lected via Maine Municipal Association’s 1998 local govern-ment fiscal survey suggests that Maine municipalities spent over $100 million on local roads in 1998.
A recent study by David Hartgen of the University of North Carolina at Charlotte analyzes the 50 states in terms of how much they spend on transportation improvements and main-tenance relative to how well their transportation systems perform. Performance is assessed by looking at pavement condition, bridge condition, urban Interstate congestion, fatal accident rates, and lane widths on rural roads. By this analysis, Maine ranks 14th among all 50 states and 1st among New England states in terms of system performance per dollars spent. This suggests that Maine improves and maintains it roads to a higher standard with less money than most states.
Report Purpose, Organization, and Process
Purpose of this Report
This report was prepared to serve as an objective statement about the status and trends of key aspects of Maine’s transpor-tation system. It is not intended to serve as a commentary on the effectiveness of the Maine Department of Transporta-tion or as a case statement for increased transportation fund-ing. It was prepared by the independent, non-partisan Maine Development Foundation as an impartial statement about various issues and it invites the reader to draw his or her own conclusions.
This report does not tell the whole story about Maine’s trans-portation system - that would take volumes. Rather, this report attempts to condense what would otherwise be volumes into a very concise statement. It presents “indicators” - snippets of data that give us a good indication of the larger picture. Like the weather forecaster’s use of symbols to convey a very complex dynamic happening outside, or like a car’s dashboard gauges convey the most critical information about the complex happenings under the hood, so too this report represents Maine’s incredibly complex transportation system via a short list of indicators. While the report doesn’t tell the entire story, it tells the story in way that is easily accessible and understandable to a wide and varied audience.
This report may be used by legislators, state and federal agency managers, business leaders, municipal officials, and others to inform a wide variety of policy decisions. Since transportation issues affect land use policy, environmental policy, energy policy, tax policy and a range of other issues, the findings of this report have very broad application.
Also, this report may be used by the media and the general public as a summary of where Maine stands on key transpor-tation issues. It serves to profile a wide variety of issues in a single reference document.
It is anticipated that future editions of this report will be published periodically in the years to come. As we are able to examine a longer trend for each of these indicators, the value of this effort will improve considerably.
How the Report Is Organized After considering many different ways to organize this sum-mary of information about Maine’s transportation system, we settled on a simple framework of 22 indicators organized into four categories: System Use, Impact on Economy, Impact on Quality of Life, and Infrastructure. The System Use indicators simply tell us about how and how much our transportation system is being used and how that is changing. The Impact on Economy and Impact on Quality of Life sections address those components of the transportation system that most impact our economy and quality of life. Generally, these are outcome measures. The Infrastructure section is a collection of indica-tors that tell us about the current and changing condition of the system’s major infrastructure components.

4 Prepared by the Maine Development Foundation for the Maine Department of Transportation, October, 1999 Prepared by the Maine Development Foundation for the Maine Department of Transportation, October, 1999 5
For each indicator, we have provided a simple graph with some textual explanation, a statement about how the issue impacts the economy, a statement about where the trend is headed into the future and the key factors that will affect the trend, and in some cases, a graph and explanation of related data. The related graph and data is not to be confused with the indicator itself, but merely tries to provide a little more information about the issue at hand.
Relation of this Report to Others A leading inspiration for the style of this report was Measures of Growth, the annual report of the Maine Economic Growth Council. Like this report showcases a short list of indicators that, as a whole, tell us about Maine’s transportation system, Measures of Growth showcases 56 indicators that summarize the Maine economy. Measures of Growth is mandated by state statute and has now been published annually for the past five years. Legislators, state agency managers, business leaders, non-profit leaders, and education leaders have come to rely on it as the definitive annual statement on the Maine economy, and so too it is hoped that Maine leaders will look to this report as the definitive periodic statement on the state’s transportation system.
This report does not set forth goals or targets for the indica-tors but there are other important transportation reports that do contain goals and targets related to these indicators. Appendix B provides a summary of related reports.
Perhaps in future years, once longer trends have been estab-lished, targets (or benchmarks) will be set for each of these indicators and perhaps even Gold Stars and Red Flags will be assigned, as they are to the indicators in Measures of Growth. Gold Stars are awarded to indicators of exceptional performance and Red Flags are assigned to indicators that need attention.
The Process
To ensure objectivity and integrity of the information pre-sented in this report, the Maine Development Foundation convened two committees to guide selection of the indica-tors and preparation of the report. The Transportation Indi-cators Advisory Committee is a carefully selected group of leaders who represent a wide variety of perspectives on transportation issues. The group includes top officials from government, business, and non-profit trade associations (see Appendix D for a list of members). The primary responsibility of this group has been to guide overall content of the report and essentially serve as an editorial advisory board. The Com-mittee met twice, once at the beginning of the project and again to review a final draft. The content of this report repre-sents consensus of the Transportation Indicators Advisory Committee.
The Transportation Indicators Working Group is made up almost entirely of Department of Transportation staff, and a few others (see Appendix D for a list of members). These are the technical experts - the people who collect the data and are most familiar with the correct way to interpret and present it. Working Group members assembled the data and prepared draft text for much of this report, in response to
Advisory Committee guidance. The Working Group met four times over the course of the project.
In most cases, data for the indicators comes from the Maine Department of Transportation. However, there are six indica-tors in the report (4, 5, 6, 14, 16,22) which the Advisory Com-mittee felt important to include although no data previously existed to inform these issues. To gather data on these issues we have surveyed Maine citizens and Maine businesses (see Appendix A - Survey Methodology). Because these are public opinion polls, and the results depend in large part on how the questions are asked, we are hesitant to put too much stock in the data gathered for just this first year of polling. However, we believe that if these questions are asked several years in a row by the same methodology, the trends reflected in the survey data over time will accurately reflect trends in public perception of these issues.
The Advisory Committee was chaired by Maine Department of Transportation Commissioner John Melrose and the Work-ing Group was chaired by Carl Croce, Assistant Director of the Department’s Bureau of Planning, Research, and Community Services. The project was paid for by the Maine Department of Transportation. Craig Freshley of the Maine Development Foundation served as overall project coordinator and prin-ciple author.
4 Prepared by the Maine Development Foundation for the Maine Department of Transportation, October, 1999 Prepared by the Maine Development Foundation for the Maine Department of Transportation, October, 1999 5
Vehicle Miles Traveled in billions
billi
ons
of V
MT
14
13
12
11
10
9
81987 1989 1991 1993 1995 1997
Vehicle Miles Traveled per capita
VM
T/C
apita
10,90010,70010,50010,30010,1009,9009,7009,5009,3009,1008,9008,7008,500
1987 1989 1991 1993 1995 1997
1 - Vehicle Miles Traveled
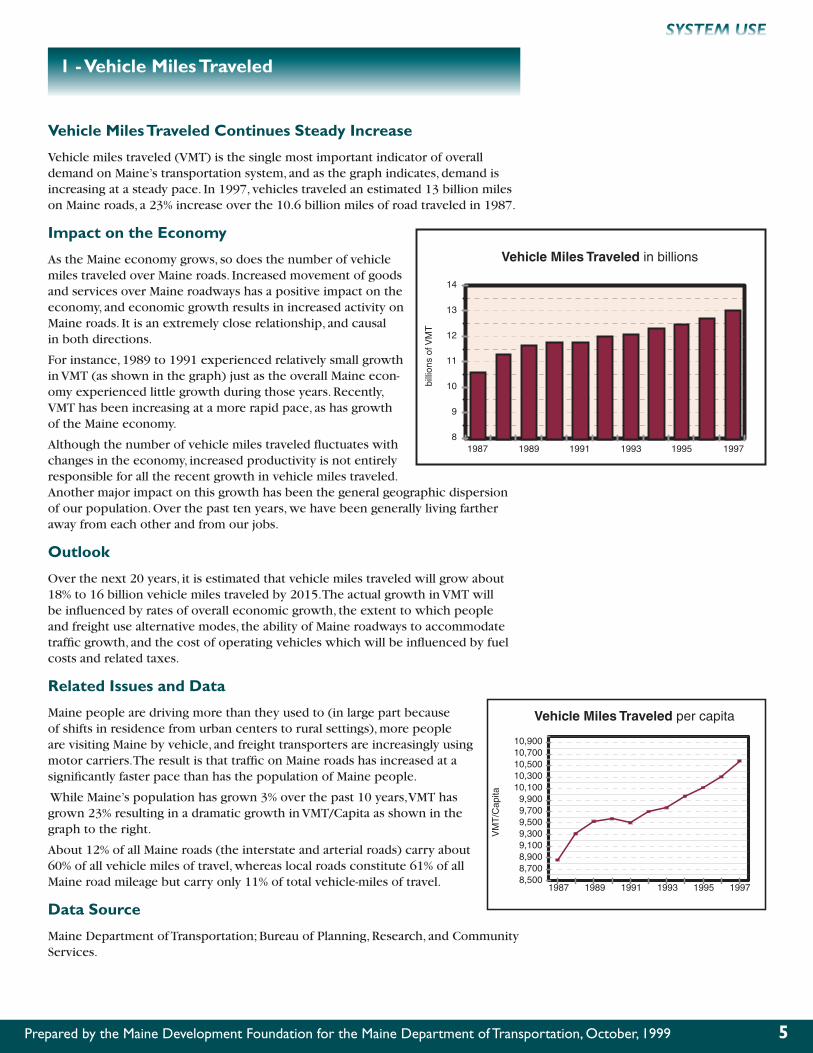
Vehicle Miles Traveled Continues Steady Increase
Vehicle miles traveled (VMT) is the single most important indicator of overall demand on Maine’s transportation system, and as the graph indicates, demand is increasing at a steady pace. In 1997, vehicles traveled an estimated 13 billion miles on Maine roads, a 23% increase over the 10.6 billion miles of road traveled in 1987.
Impact on the Economy
As the Maine economy grows, so does the number of vehicle miles traveled over Maine roads. Increased movement of goods and services over Maine roadways has a positive impact on the economy, and economic growth results in increased activity on Maine roads. It is an extremely close relationship, and causal in both directions.
For instance, 1989 to 1991 experienced relatively small growth in VMT (as shown in the graph) just as the overall Maine econ-omy experienced little growth during those years. Recently, VMT has been increasing at a more rapid pace, as has growth of the Maine economy.
Although the number of vehicle miles traveled fluctuates with changes in the economy, increased productivity is not entirely responsible for all the recent growth in vehicle miles traveled. Another major impact on this growth has been the general geographic dispersion of our population. Over the past ten years, we have been generally living farther away from each other and from our jobs.
Outlook
Over the next 20 years, it is estimated that vehicle miles traveled will grow about 18% to 16 billion vehicle miles traveled by 2015. The actual growth in VMT will be influenced by rates of overall economic growth, the extent to which people and freight use alternative modes, the ability of Maine roadways to accommodate traffic growth, and the cost of operating vehicles which will be influenced by fuel costs and related taxes.
Related Issues and Data
Maine people are driving more than they used to (in large part because of shifts in residence from urban centers to rural settings), more people are visiting Maine by vehicle, and freight transporters are increasingly using motor carriers. The result is that traffic on Maine roads has increased at a significantly faster pace than has the population of Maine people.
While Maine’s population has grown 3% over the past 10 years, VMT has grown 23% resulting in a dramatic growth in VMT/Capita as shown in the graph to the right.
About 12% of all Maine roads (the interstate and arterial roads) carry about 60% of all vehicle miles of travel, whereas local roads constitute 61% of all Maine road mileage but carry only 11% of total vehicle-miles of travel.
Data Source
Maine Department of Transportation; Bureau of Planning, Research, and Community Services.

6 Prepared by the Maine Development Foundation for the Maine Department of Transportation, October, 1999 Prepared by the Maine Development Foundation for the Maine Department of Transportation, October, 1999 7
2 - Passenger Travel by Mode
Vehicle Travel Outpacing Alternative Modes
From 1994 to 1997, the number of trips made by fixed route buses, ferries, and airplanes (collectively known as alternative modes) increased by 5.3% while the number of miles traveled by vehicles grew by 5.7%. In order to compare these two trends, the data in the graph to the right is presented in indexed format such that the value of each mode in 1994 is indexed to equal 100 points.
In 1997, fixed route buses, ferries, and airplanes made an esti-mated 5.6 million trips in Maine, up from 5.4 million trips in 1994. Over the same time period, vehicle travel increased from 12.3 billion vehicle miles traveled in 1994 to just over 13 billion vehicle miles traveled in 1997.
Impact on the Economy
People traveling by any mode generally has a positive impact on the economy because it represents the movement of goods and services. However, we are increasingly aware that travel by modes other than low occupancy private automobiles can provide environmentally beneficial transportation and, at the same time, benefit the economy because it reflects the existence of competitive choices.
Outlook
The state is embarking on a Strategic Passenger Transportation Plan which seeks to bring increasing numbers of tourists into Maine by rail, cruise ship and airplane. The plan is in keeping with Maine traditions following maritime routes of steam-ship lines and excursions to the Maine woods. The plan conservatively projects that the system will attract 87,000 new visitors per year to Maine with a direct economic benefit of $48 million per year, increasing to $121 million when indirect spending is included. The plan also projects the creation of over 1,400 new full time jobs.
People traveling from place to place within Maine are also increasingly using alternative modes. A stellar performer this past year was the free National Park Bus System in Acadia National Park. Eight propane powered Island Explorer buses carried 142,260 riders thus reducing traffic congestion and air pollution. This is an inspiring model for future transit development.
Related Data and Issues
The graph to the right shows a historical breakdown of the different types of the use of alternative modes. Over the past four years, ferry ridership has increased by 9.7% while air travel has increased by 4% and travel on fixed route buses has increased 3.4%.
Note that neither this graph or the one on the previous page reflect the successful and growing private interstate bus service that links Maine com-munities to one another and with out of state destinations. Nor do these graphs include the growth in ferry ridership experienced in 1998 with the introduction of high speed ferry service between Bar Harbor and Nova Scotia.
Data Source
Maine Department of Transportation’s 1997 Strategic Plan, Strategic Passenger Trans-portation Plan, Biennial Operating Plans, Transportation Service Providers.
Vehicle Miles Traveled andAlternate Mode Trips (indexed from 1994)
inde
x po
ints
110108106104102100
98969492908886848280
Vehicle Miles Alternative Trips
1994 1995 1996 1997
Number of Trips by Ferry, Transit Vehicle and Airplane
num
ber
of tr
ips
6,000,000
5,000,000
4,000,000
3,000,000
2,000,000
1,000,000
01994 1997
Ferry
Transit Vehicle
Airplane

6 Prepared by the Maine Development Foundation for the Maine Department of Transportation, October, 1999 Prepared by the Maine Development Foundation for the Maine Department of Transportation, October, 1999 7
Manufacturing Freightby Truck and Other Modes
tons
100,000,000
80,000,000
60,000,000
40,000,000
20,000,000
1991 1993 1995 1997
Truck Other Modes
87% 88%
89%
82%
Percents reflecttrucked weight asa percent of total
No data availablefor 1992-1994
3 - Freight Transport by Mode
Trucked Freight on the Increase
In 1997, approximately 89% of all manufacturing freight tonnage transported in Maine was done via truck, while just 11% was shipped by rail, water, and air. Overall, the amount of manufactur-ing freight shipped in Maine increased 65% from 1991 to 1997, and trucks are increasingly the preferred mode.
The decentralization of freight delivery and inventory control systems has contributed to the increased dominance of motor carriers, at the expense of railroads, in the movement of freight in Maine. The deregulation of the trucking industry has also increased the percentage of freight moved by truck.
Impact on the Economy
Overall increases in the amount of freight shipped bodes well for the economy although the increased reliance on trucking relative to other modes raises some economic concerns. For instance, an increase in heavy truck traffic on our highways and bridges has necessarily increased the rate of pavement consumption and bridge stress, particularly on older local and secondary highway systems. This translates to increased highway and bridge funding needs. It also has an impact on the increasing traffic congestion of our major highway corridors such as the Maine Turnpike, and impacts highway safety in terms of large vehicle interaction with automobiles.
Outlook
The historical trend suggests that increased reliance on trucking may continue. However, by creating more choices for Maine companies to ship their goods, it is believed that shipping costs will come down and thus, make Maine a better place to do business.
Related Data and Issues
In 1997, about 11% of manufactured freight in Maine was shipped by modes other than truck. About 8% was shipped by rail and 3% went by cargo ship. Less than .01% was shipped by air.
Data Source
Maine Department of Transportation; Office of Freight Transportation based on data from Reebie Associates, Stamford, Connecticut.

8 Prepared by the Maine Development Foundation for the Maine Department of Transportation, October, 1999 Prepared by the Maine Development Foundation for the Maine Department of Transportation, October, 1999 9
4 - Satisfaction Among Manufacturers
Manufacturers Moderately Satisfied with Trans-portation System
About 15% of a representative sample of all Maine manufacturers believe that Maine’s transportation system is very good or excel-lent. They were asked “How would you rate Maine’s transpor-tation system for meeting your business needs?” About 11% responded that the system is doing a poor job of meeting their needs.
Manufacturers have a better opinion of Maine’s transportation system then non-manufacturers (see indicator 5, next page).
Impact on the Economy
Manufacturing activity accounts for almost 20% of all economic activity in Maine and this sector is heavily reliant on transporta-tion for bringing in raw materials and shipping out finished products. The satisfaction of this class of businesses with the transportation system for meeting their business needs is an important indication of how effectively the system is supporting economic activity.
Related Data and Issues
When asked, “What type of transportation system improvement would help your business the most?” 59% of the manufacturers surveyed said “better roads.” About 7% said “better air freight service” and 6% said “better access to truck-rail facilities.”
Although most manufacturers rely on the transportation system to ship freight, 15% said that movement of customers and/or employees within Maine was more critical to their business than freight transportation.
Data Source
Maine Development Foundation Annual Survey of Maine Businesses, 1999. See Appendix A for methodology. Because this is the first year of data collection on this issue it is not appropriate to presume a trend or formulate an outlook.
Transportation System SatisfactionAmong Maine Manufacturers, 1999
%
%
%
%
%
%
%
%%%% % % % % %

8 Prepared by the Maine Development Foundation for the Maine Department of Transportation, October, 1999 Prepared by the Maine Development Foundation for the Maine Department of Transportation, October, 1999 9
5 - Satisfaction Among Service Providers
Service Providers Give Cool Opinion of Transportation System
About 10% of Maine businesses who are not manufacturers (ser-vice providers) say that Maine’s transportation system is doing a very good or excellent job of meeting their business needs. A statewide representative sample of service providers was asked “How would you rate Maine’s transportation system for meeting your business needs?”
Service providers have a slightly lower overall opinion of Maine’s transportation system than do manufacturers (see indicator 4, previous page).
Impact on the Economy
The service sector (about 62% of the economy) is growing in Maine relative to manufacturing and many growing service indus-tries rely heavily on the ability to move their employees and business partners to and from their facilities. Proximity to a major airport, for instance, is often cited as quite important to site location decisions of service companies.
Related Data and Issues
Non-manufacturing companies across Maine were asked: “Which of the following aspects of transportation is most critical to the success of your business?” About 39% responded “Movement of customers and/or employees within Maine.” About 33% responded “Movement of freight via road, air, rail, or water.” And 19% responded “Movement of customers and/or employees in and out of Maine.”
Data Source
Maine Development Foundation Annual Survey of Maine Businesses, 1999. See Appendix A for methodology. Because this is the first year of data collection on this issue it is not appropriate to presume a trend or formulate an outlook.
Transportation System SatisfactionAmong Maine Service Providers, 1999
%%%%% % % % % %
%
%
%
%
%
%

10 Prepared by the Maine Development Foundation for the Maine Department of Transportation, October, 1999 Prepared by the Maine Development Foundation for the Maine Department of Transportation, October, 1999 11
6 - Freight Transport Competitiveness
Competitiveness Appears to be Increasing
In a statewide survey of Maine businesses, 35% reported that movement of freight, rather than other uses of the transporta-tion system, is critical to their business. Those 35% to whom freight shipping is critical were asked: “Over the past three years, has your number of choices of freight shipping providers: increased dramatically, increased somewhat, stayed the same, decreased somewhat, or decreased dramatically?” The results of the latter question are shown.
Price competitiveness is driven by the number of alternative choices that shippers have. The graph to the right shows that for 26% of Maine businesses shipping choices have increased at least somewhat while choices have decreased for 16%.
Impact on the Economy
For some businesses, the cost of freight shipping (raw materials in and/or finished products out) is a substantial component of the cost of doing business. Maine’s economic growth relative to other states is somewhat dependant on the cost of shipping freight in this state. While a direct cost comparison with other states is not currently available, we are able to look at cost trends within Maine by tracking the number of choices available to shippers. An increasing number of choices bodes well for economic growth.
Related Data and Issues
Businesses to whom freight shipping is critical were asked “What type of transpor-tation system improvement would help your business the most?” About 76% said better roads, 5% said better public transportation, 4% said better air freight service, and 3% said better rail service.
Data Source
Maine Development Foundation Annual Survey of Maine Businesses, 1999. See Appendix A for methodology. Because this is the first year of data collection on this issue it is not appropriate to presume a trend or formulate an outlook.
Recent Change in Shipping ChoicesAmong Freight Dependant Businesses
%
%
%
%
%
%
% % % % % % %

10 Prepared by the Maine Development Foundation for the Maine Department of Transportation, October, 1999 Prepared by the Maine Development Foundation for the Maine Department of Transportation, October, 1999 11
7 - Air Travel Competitiveness
Air Travel Competitiveness of Major Maine Airports Improving
In 1998, an average of 43,245 commercial airline seats departed each week from Maine’s major airports: Portland International Jetport and Bangor International Airport. This represents a 4% increase in seat availability over 1994 levels.
From 1994 to 1998, seat availability from Portland International Jetport increased by almost 6% while seat availability from Bangor International Airport increased by about 1%.
Seat availability is a good proxy for cost competitiveness because greater freedom to choose when one will fly correlates with more competition and resulting competitive prices.
Impact on the Economy
Available and competitively priced air travel contributes to eco-nomic growth in two important ways: it impacts the cost and ease of doing business with out-of-state interests, and it has a direct bearing on the extent to which tourists visit Maine via air. A 1999 study finds that air travel is the most predominant mode of travel among overnight business visitors to Maine. It was estimated in 1994 that 11.4% of Maine’s employment was tied to the availability of commercial air service.
Outlook
The importance of air service will increase as Maine’s economy continues to evolve from manufacturing to tourism and other service industries. Historically, tourism and service industries use air service at significantly higher levels than manufacturing industries.
Related Data and Issues
The mix of jet service and turboprop service at Maine airports is important because higher levels of jet service indicate more direct flights to desired destinations and more comfortable air travel. At Portland, the ratio of jet service to turboprop service has remained constant over the past few years with jet service accounting for 68% of service. At Bangor, jet service has declined from 24% of the service in 1995 to 18% of the service in 1998.
Also important is the number and geographic distribution of Maine airports with regularly scheduled commercial air service. Currently, there are six such airports in Maine: Portland International, Bangor International, Augusta, Knox County, Hancock-Bar Harbor, and Northern Maine Regional. This number has declined over the past several years with the loss or regularly scheduled commercial air service from Lewiston-Auburn, Frenchville, and Waterville.
Data Source
Maine Department of Transportation; State of Maine Aviation Systems Plan Update, 1996; Portland International Economic Benefit Study, 1994; Maine’s Dependence On Commercial Air Travel, 1994; Bangor International Airport; SH&E Inc.; Maine Office of Tourism based on data provided by Longwoods, International.

12 Prepared by the Maine Development Foundation for the Maine Department of Transportation, October, 1999 Prepared by the Maine Development Foundation for the Maine Department of Transportation, October, 1999 13
8 - Tourism & Seasonal Highway Use
Traffic in Kittery Shows Tourism on the Increase
Long-term trends at the permanent traffic counting station on I-95 in Kittery, the major travel and tourism gateway into Maine, indicate a steady growth in Maine tourism as well as general traffic.
Between 1978 and 1998, average daily traffic in August (typi-cally, the highest traffic month of the year) has increased from 47,000 to 95,000 vehicles per day, a 102% increase. The differ-ence between August and year-round traffic volumes has also grown, from 17,000 to 26,000 vehicles per day, reflecting a 53% increase in traffic attributable to tourists over the past 10 years.
On a year-round basis, average daily traffic has increased from 30,000 to 69,000, a 130% increase. The higher percentage growth rate in year-round traffic suggests that the tourist season has been expanding beyond the traditional summer season into the spring, fall, and winter. As a result of this expansion of the tourist season, the available highway system capacity is being more evenly utilized over the whole year.
Impact on the Economy
In 1998, tourism related expenditures in Maine totaled 4.9 billion dollars. About $413 million of it was spent on hotels and other lodging establishments. It is estimated that non-resident visitors to Maine directly and indirectly generated $8 billion in sales of goods and services, over 104,000 jobs, and $2.3 billion in total payroll.
Outlook
If past trends continue, we can expect tourism to increase, not only in summer, but also in the spring, fall, and winter. This will continue the trend toward a higher rate of utilization of the transportation system and a more even distribution of that use throughout the year. However, peak season use of the system is likely to continue growing. Seasonal transportation services geared toward tourism can be an effective way of accommodating peak season demands and relieve some of the pressure for additional highway capacity.
Related Data and Issues
It is interesting to note that while the “August difference” in traffic volume on the Maine Turnpike has grown by 53% over the past 10 years, hotels and lodging sales have grown by virtually the same amount (55%) over the same time frame, affirming that the “August difference” shown in the graph on the previous page is a good indicator of overall tourist activity.
A survey of Turnpike travelers in August, 1998 found that 19% of all travelers were either beginning or completing a vacation to Maine.
Just over 90% of all tourists visiting Maine arrive by vehicle. About 5% arrive by plane, 4% by bus, and less than 2% by ferry or boat. None currently arrive by rail.
Day and overnight visits in Maine grew from 39.2 million in 1997 to 41.2 million in 1998, a 5% increase. In both years day trips accounted for 79% of visitor trips to Maine. The importance of day visitors should not be overlooked because future Amtrak passenger rail service from Boston will attract a growing number of day visitors to the state.
Data Source
Maine Department of Transportation; Bureau of Planning, Research, and Community Services. Department of Economic & Community Development, Office of Tourism, based on data from Longwoods, International.
aver
age
daily
traf
fic
Daily Traffic on I-95 in Kittery

12 Prepared by the Maine Development Foundation for the Maine Department of Transportation, October, 1999 Prepared by the Maine Development Foundation for the Maine Department of Transportation, October, 1999 13
9 - Rail Safety
Train Accidents Quite Rare
So far in 1999, Maine railways have experienced just 7 accidents even though they move over 8 million tons of freight per year on about 1,100 miles of track. Over the past five years, train accidents have been less frequent than in previous years.
Train accidents are a factor of rail condition, weather and natural conditions, and human factors.
This indicator focuses on train accidents other than at-grade cross-ing accidents because it is a direct reflection of rail safety. At-grade crossing accidents involve 2 modes of transport (in most cases, rail and vehicle) and the frequency of at-grade crossing accidents is generally not a function of railway safety but rather it is a function of driver judgement.
Impact on the Economy
Safe, reliable train service is important to the economy in a number of ways. The safe movement of goods and passengers is essential if rail is going to be used as an alternative to the highway system for passengers and freight. Rail crossing accidents have an impact on the economy insofar as they cost money in interruption of rail service, collision damage repair, medical bills, and frequently, loss of life.
Outlook
The downward trend in annual number of train accidents is expected to generally continue for two reasons: equipment and procedures are increasingly safe, and the number of miles of active track has declined. However, increased use of active rail lines by passenger trains in the near future may work to increase the likelihood of accidents. Overall, a good outcome would be no net increases in the annual number of accidents.
Related Data and Issues
Over the last twenty years, at-grade rail crossing accidents have steadily dropped in Maine; from 37 in 1978 to 8 in 1998. The state has been aggressive in installing rail crossing signalization devices and other rail cross-ing safety features over the last twenty years. Public outreach campaigns have also focused the public’s attention on the danger of highway-rail crossings. Recently, the fine for trespassing on rail tracks was increased from $5 to $100.
Data Source
Maine Department of Transportation and the Federal Rail Administration of the U.S. Department of Transportation.
Train AccidentsExcluding At-Grade Crossing Accidents
num
ber
of a
ccid
ents
22
20
18
16
14
12
10
8
6
4
2
01987 1989 1991 1993 1995 1997 1999*1985
* Preliminary, through August, 1999
Annual Number ofAt-Grade Crossing Accidents
num
ber
of a
ccid
ents
40
35
30
25
20
15
10
5
01981 1984 1987 1990 1993 19961978

14 Prepared by the Maine Development Foundation for the Maine Department of Transportation, October, 1999 Prepared by the Maine Development Foundation for the Maine Department of Transportation, October, 1999 15
10 - Road Safety
Maine Roads Are Generally Getting Safer
While the number of crashes that occur on Maine’s public roads has increased over the past ten years, the number of vehicle miles traveled (VMT) has increased at a much greater rate. As a result, the rate of crashes has dropped, as has the fatal crash rate.
In 1998, Maine roads experienced 40,877 crashes, 185 of which were fatal. This translates to a crash rate of 307 per hundred million vehicle miles of travel (HMVM), which is slightly higher than the national average, and a fatality rate of 1.39 HMVM, which is lower than the national average. So while Maine experiences a slightly greater frequency of crashes than the national average, crashes here aren’t as serious, on average.
Using the “lines of best fit” approach (see below), it can be stated that Maine’s crash rate has experienced a decrease of 5.7% over the past ten years (1989 through 1998). Over the same time frame, the number of crashes have increased 10.1% while the number of vehicle miles traveled has increased more than 15%.
Impact on the Economy
The economic impact of crashes in 1998 was approximately $1.25 billion. A recent study has shown that occupants not wearing a seat belt accounted for $3.7 million in hospital costs alone in 1995 and 1996. Of these, commercial insurance paid for 62% of the hospital charges in 1996, while Medicaid and Medicare paid 7% and 8%, respectively. There was no insurance coverage for the remaining 23% of the 1996 hospital charges.
Outlook
Some of the gains that were made in the early 1990s have been lost in recent years. This change in trend, while still down overall from ten years ago, is likely due to the robust economy. As disposable income increases, travel (and crashes) can be expected to increase as well. However, several factors are working in favor of safer roads such as operational improvements to enhance safety, turning lanes, wider lanes, improved intersections, safer vehicles, stronger litigation, and enhanced law enforcement.
Related Data and Issues
Less than one in two hundred vehicular crashes result in a fatality, although about three out of every ten crashes result in possible injury or worse.
The severity of the crashes, as determined by calculated crash cost, decreased 8.4% from 1989 to 1998. Over the same time period, the number of fatal crashes has decreased 11.6%, while the number of injury crashes has grown slightly at 0.5%.
Data Sources
Maine Department of Transportation, Bureau of Planning, Research and Community Services, Safety Management Section.
Note on Lines of Best Fit Approach: By their nature, crashes are random events. The number of crashes can and does fluctuate from year to year due to many outside influences, including economic and environmental conditions such as severe winter weather. In order to reduce the effect of these fluctuations, “lines of best fit” have been applied to the crash data to avoid using anomalies (peaks or valleys) either at the beginning or the end of the study period.
Crash RateNumber of Crashes per 100,000,000 VMT
14 Prepared by the Maine Development Foundation for the Maine Department of Transportation, October, 1999 Prepared by the Maine Development Foundation for the Maine Department of Transportation, October, 1999 15
11 - Road Congestion in Urban Areas
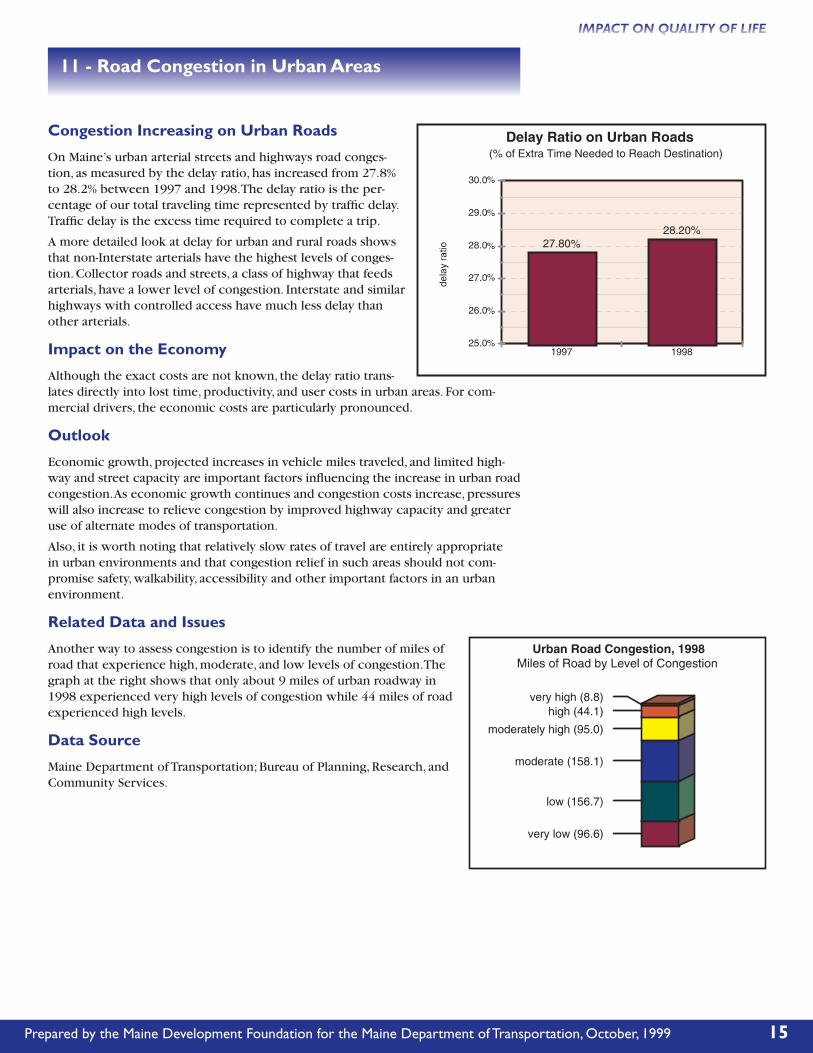
Congestion Increasing on Urban Roads
On Maine’s urban arterial streets and highways road conges-tion, as measured by the delay ratio, has increased from 27.8% to 28.2% between 1997 and 1998. The delay ratio is the per-centage of our total traveling time represented by traffic delay. Traffic delay is the excess time required to complete a trip.
A more detailed look at delay for urban and rural roads shows that non-Interstate arterials have the highest levels of conges-tion. Collector roads and streets, a class of highway that feeds arterials, have a lower level of congestion. Interstate and similar highways with controlled access have much less delay than other arterials.
Impact on the Economy
Although the exact costs are not known, the delay ratio trans-lates directly into lost time, productivity, and user costs in urban areas. For com-mercial drivers, the economic costs are particularly pronounced.
Outlook
Economic growth, projected increases in vehicle miles traveled, and limited high-way and street capacity are important factors influencing the increase in urban road congestion. As economic growth continues and congestion costs increase, pressures will also increase to relieve congestion by improved highway capacity and greater use of alternate modes of transportation.
Also, it is worth noting that relatively slow rates of travel are entirely appropriate in urban environments and that congestion relief in such areas should not com-promise safety, walkability, accessibility and other important factors in an urban environment.
Related Data and Issues
Another way to assess congestion is to identify the number of miles of road that experience high, moderate, and low levels of congestion. The graph at the right shows that only about 9 miles of urban roadway in 1998 experienced very high levels of congestion while 44 miles of road experienced high levels.
Data Source
Maine Department of Transportation; Bureau of Planning, Research, and Community Services.
%%
%
%
%
%
%
%
%

16 Prepared by the Maine Development Foundation for the Maine Department of Transportation, October, 1999 Prepared by the Maine Development Foundation for the Maine Department of Transportation, October, 1999 17
12 - Road Congestion in Rural Areas
Rural Road Congestion on the Increase
On Maine’s rural arterials, the delay ratio has increased from 7.2% in 1997 to 7.4% in 1998, almost a 3% increase in one year. Conges-tion on rural roads appears to be increasing at almost twice the rate as it is on urban roads, although congestion on rural roads is about one-fourth the magnitude found on urban roads.
The delay ratio is the percentage of our total traveling time repre-sented by traffic delay. Traffic delay is the excess time required to complete a trip.
Impact on the Economy
As with urban road congestion, increased rural road congestion also results in lost time, productivity, and user costs. Because rural roads tend to serve longer trips, congestion on these roads has an impact on the ability to transport people and goods between regions.
Outlook
Important factors in the increase in rural congestion are economic growth, tourism, the trend toward low-density land development, and uncontrolled access to rural highways. Actions that can help minimize rural road congestion include increased capacity where needed, stricter access control on rural arterials, policies that will encourage more compact land development patterns, and use of alternate modes where feasible.
Related Data and Issues
As shown in the graph, just 3 miles of rural roads experienced high or very high congestion levels in 1998. Most of Maine’s rural roads (54%) experienced very low levels of congestion and almost 90% experienced low or very low levels of congestion.
Data Source
Maine Department of Transportation; Bureau of Planning, Research, and Community Services.
%
%
%
%
%
%
%
%
%
%
%
%
%
%

16 Prepared by the Maine Development Foundation for the Maine Department of Transportation, October, 1999 Prepared by the Maine Development Foundation for the Maine Department of Transportation, October, 1999 17
13 - Highway Speed Related to Development
Arterial Speeds Slowing Slightly Due to Development
The average posted speed on Maine arterial roads in 1998 was 45.5 miles per hour, a slight decrease from the 1997 average posted speed. About 80% of Maine’s arterial roads are in rural areas.
Development along arterial highways results in more entrances along the route and increases the likelihood of crashes occur-ring. In response to the increased density of high volume entrances there is a need to reduce the speed limit to provide adequate safety. However, this represents a loss of the effective-ness of rural arterials in being able to transport vehicles quickly from one destination to another.
Impact on the Economy
Reduced speed limits on the arterial system are detrimental to the Maine economy as a majority of the vehicle miles of travel occur on these roads. The arterial highway system is expected to provide a high degree of mobility for relatively long trip lengths. Therefore, to provide efficient mobility, arterial highways should provide a relatively high operating speed and level of service. Access to abutting property is not the major function of the arterial system, but rather the function of the collector system and local roads. The most severe impact of reduced speeds on the arterial system are to commerce, where longer travel times between destina-tions translate into lost time, productivity and increased user costs.
Outlook
Access control on Maine’s arterial system is crucial in protecting the integrity of the system and the financial investment in construction and maintenance of that system. It is likely that development pressure will continue along the arterial highways, therefore, access management will emerge as a vital tool to maintain a safe and efficient system.
Related Data and Issues
Development along rural arterial roadways changes their character to urban. In 1998 almost 15% of the rural arterials were posted at 45 mph or less and approxi-mately three miles of rural arterial were reclassified to an urban designation, further reducing the ability of these miles to serve long-distance travel.
Although posted speeds are a good indicator of highway degradation due to more access points, posted speeds alone are not a good indicator of actual speeds. Traffic volume, capacity, and degree of access control are also important factors. Posted speed limits combined with these factors translate into actual travel speeds.
Data Source
Maine Department of Transportation; Bureau of Planning, Research and Community Services.
Average Posted Speed on Arterial Roadsweighted by miles of road

18 Prepared by the Maine Development Foundation for the Maine Department of Transportation, October, 1999 Prepared by the Maine Development Foundation for the Maine Department of Transportation, October, 1999 19
14 - Satisfaction Among Non-commercial Drivers
Transportation System Gets High Marks from Non-Commercial Users
Apart from strictly commercial uses such as freight delivery and business travel, Maine’s transportation contributes enormously to our quality of life. To assess citizen satisfaction with the transpor-tation system for non-commercial uses, a statewide representa-tive sample of citizens was asked, “On a scale of 1 to 5 where 1 means “Poor” and 5 means “Excellent,” how would you rate Maine’s road transportation system in meeting your personal needs such as commuting to work, running errands, and visiting people, places and events?”
The average rating was 3.5 points (see the scale on the graph) which reflects a fairly favorable opinion. More than one in five people said that the system was “excellent” for meeting personal needs.
Impact on the Economy
Quality of life issues such as this one impact the economy indirectly. They contrib-ute to why people want to live here and do business here. That Maine people generally think positively of the transportation system for non-commercial uses bodes well for business attraction and retention.
Related Data and Issues
To further understand public opinion about the transportation system, citizens were also asked: “For personal uses such as commuting to work, running errands, and visiting people, places and events, which aspect of the road transportation system in Maine is in most need of improvement?” About 46% of those questioned responded “pavement condition.” About 27% responded “traffic congestion relief.” And about 13% said “safety.” Other aspects were mentioned but no more than 1% of respondents identified any other single issue.
Data Source
Maine Development Foundation Annual Survey of Maine Citizens, 1999. See Appen-dix A for methodology. Because this is the first year of data collection on this issue it is not appropriate to presume a trend or formulate an outlook.
%
%
%
%
%
%
%% % % %% %%
Transportation System SatisfactionAmong Maine Non-Commercial Users, 1999

18 Prepared by the Maine Development Foundation for the Maine Department of Transportation, October, 1999 Prepared by the Maine Development Foundation for the Maine Department of Transportation, October, 1999 19
15 - Environmental Impact
Emissions from Mobile Sources Declining
In Maine in 1996, motor vehicles, trains, planes, and vessels released about 146 tons of nitrogen oxides (NOx) into the atmosphere, on average, every summer weekday. This amount is about 17% less than was released from such mobile sources in 1990.
Almost 60% of all NOx pollution comes from mobile sources, mostly driving vehicles. The amount of pollutants such as NOx emitted by a motor vehicle is the result of a combination of several factors: vehicle miles traveled, vehicle type, vehicle age, vehicle speed, and type of gasoline. Recent overall declines in total NOx released from Maine motor vehicles is most attribut-able to newer, cleaner running vehicles. While the number of vehicle miles traveled has substantially increased in recent years, new vehicles are about 99% cleaner than vehicles made in the 1960’s.
Impact on the Economy
Nitrogen oxides are just one of three major types of pollution emitted by motor vehicles. Others include carbon monoxide and volatile organic compounds. NOx is a significant contributor to smog and ground-level ozone and is produced almost entirely by human activities. Nitrogen oxides include all compounds of nitrogen and oxygen (such as nitrogen monoxide and nitrogen dioxide). Nitrogen oxides contribute to the formation of ground-level ozone when they react with Volatile Organic Compounds (VOC’s) in the presence of sunlight and heat.
Ground level ozone in high concentrations is a severe irritant causing coughing, shortness of breath, wheezing, headaches, nausea, stinging eyes, and chest pain. Everyone is susceptible, but people who suffer from lung diseases such as emphy-sema, bronchitis, pneumonia, asthma, and colds, as well as children, exercising adults, and the elderly are especially vulnerable.
This impacts the economy because it requires us to implement costly measures to reduce emissions and because it may act as a deterrent to people visiting Maine from away.
Outlook
The amount of ground-level ozone that is produced is influenced by the amount of nitrogen oxides and volatile organic compounds that we emit into the atmosphere combined with the amount and intensity of sunlight. While it appears that emis-sions are declining for the reasons stated above, it also appears that summer temperatures are on the rise. Experts suggest that reducing our use of motor vehicles is the single most effective thing we can do to reduce ground-level ozone.
Continued on next page
20 Prepared by the Maine Development Foundation for the Maine Department of Transportation, October, 1999 Prepared by the Maine Development Foundation for the Maine Department of Transportation, October, 1999 21
15 - Environmental Impact (continued)
Related Data and Issues
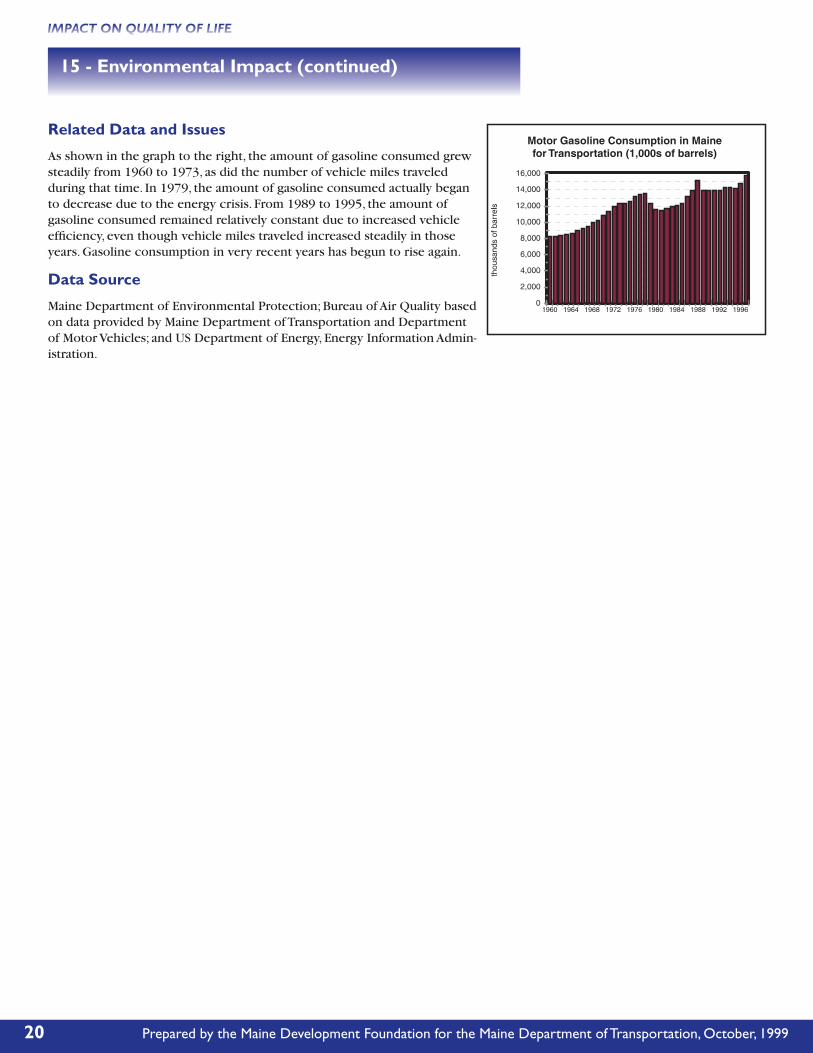
As shown in the graph to the right, the amount of gasoline consumed grew steadily from 1960 to 1973, as did the number of vehicle miles traveled during that time. In 1979, the amount of gasoline consumed actually began to decrease due to the energy crisis. From 1989 to 1995, the amount of gasoline consumed remained relatively constant due to increased vehicle efficiency, even though vehicle miles traveled increased steadily in those years. Gasoline consumption in very recent years has begun to rise again.
Data Source
Maine Department of Environmental Protection; Bureau of Air Quality based on data provided by Maine Department of Transportation and Department of Motor Vehicles; and US Department of Energy, Energy Information Admin-istration.
Motor Gasoline Consumption in Mainefor Transportation (1,000s of barrels)

20 Prepared by the Maine Development Foundation for the Maine Department of Transportation, October, 1999 Prepared by the Maine Development Foundation for the Maine Department of Transportation, October, 1999 21
16 - System Impact on Sense of Community
Transportation Impact on Sense of Community Difficult to Quantify
Besides affecting our ability to move from place to place and ship goods, the transportation system also affects our “sense of community” by virtue of highways going through our neigh-borhoods. For instance, faster roads help us get to work more quickly but they also diminish neighborhood qualities.
In order to assess the general perspective of Maine people on this issue, we asked via a statewide survey of Maine citizens: “On a scale of 1 to 10 where 10 indicates “Very strong agreement” and 1 indicates “Very strong disagreement”, please tell me how strongly you agree or disagree with this statement: Changes such as making roads wider or straighter that are critical to making it easier to get around should be made even when these improve-ments result in neighborhood changes such as cutting down trees, reducing yards, or removing fences.”
The results of this question are reflected in the graph to the right although the results are largely inconclusive. As we continue to ask this question over time we may be able to see if a trend emerges. It is interesting to note however that statewide, the mean response to this question was 5.1 (see the point scale on the graph) while in coastal counties the mean response was 4.4.
Impact on the Economy
The extent to which neighborhoods provide safe, quiet living environments has an indirect affect on economic growth. It is a key factor among the many reasons people like to live and work in Maine.
Related Data and Issues
Via the statewide survey, citizens were also asked “Consider for a moment the most recently completed road or bridge construction project near your home. What effect has this completed project had on your sense of community?” About 56% of the respondents said that the affect was negative while 10% said the affect was positive.
Data Source
Maine Development Foundation Annual Survey of Maine Businesses, 1999. See Appendix A for methodology. Because this is the first year of data collection on this issue it is not appropriate to presume a trend or formulate an outlook.
Citizen Preferences Between ImprovedRoads & Neighborhood Preservation
%% % % % % % % % % %

22 Prepared by the Maine Development Foundation for the Maine Department of Transportation, October, 1999 Prepared by the Maine Development Foundation for the Maine Department of Transportation, October, 1999 23
17 - Road Condition
Miles of Poor Roads Decreasing
Of the 8,300 miles of the state’s highway network that are maintained by the Maine Department of Transportation (MDOT), approximately half are ‘built’ to modern standards. Among the roads that are not ‘built’ to modern standards (known as the backlog) 2,502 miles are principle arterials, minor arterials, and major collector roads (see Appendix E for definitions). These roads provide vital links to destinations and other modes of travel through out Maine.
Roads ‘built’ to modern standards (not backlogged) are safe, smooth highways with gradual curves and slopes, good sight distances, an adequate structural base, adequate shoulders and drainage to move water away from the highway. By contrast ‘unbuilt’ roads, represented in the graph, could have abrupt curves, sudden dips and rises, trees and bushes could be closing in around the edge of pavement causing poor sight distances, and little or no shoulders or ditching for drainage. These roads can be easily damaged by heavy loads and quite often have to be posted (signs put up restricting use by heavy trucks) in the spring due to the lack of a good structural base.
Impact on the Economy
Road conditions directly impact the ability to move people and goods over the state’s highway network. When unbuilt roads are posted in the spring, businesses and their customers are affected. Substandard roads also create increased user costs by more frequent vehicle repairs and increased numbers of crashes. Delays from inadequate traffic capacity and increased highway maintenance activities causes decreased fuel economy, reduced air quality, and lost productivity.
Outlook
The State plans to invest $60 million per biennium to address the backlog of unbuilt roads. This will complete 100% of the Principal Arterials, 80% of the Minor Arterials, and 30% of the Major Collectors in 20 years. This is equal to approximately 104 miles of highway improvements per biennium, based on the $60 million level. The 2000/2001 Biennial Transportation Improvement Program (BTIP) addresses 140 miles of Principal and Minor Arterials and Major Collectors which exceeds the goals in the 20-Year Plan by 38%.
The biggest factor that favors reaching desired goals is increased funding allowing more reconstruction to take place. Other factors are innovative methods of recon-struction and advanced technology in materials. The cyclical nature of the economy, and the corresponding changes in the level of funding all work against achieving these goals. With funding dollars going first to system preservation and mainte-nance, the amount left for reconstruction can fluctuate depending on the preserva-tion needs and the total available funding.
Backlogged Miles: Principal ArterialsMinor Arterials, Major Collector Roads
Continued on next page

22 Prepared by the Maine Development Foundation for the Maine Department of Transportation, October, 1999 Prepared by the Maine Development Foundation for the Maine Department of Transportation, October, 1999 23
Backlogged Miles of Roadby Type, 1999
17 - Road Condition (continued)
Related Data and Issues
As the pie chart shows, there are relatively few miles of principle arterials that are not built to modern standards. However, in addition to those types of roads reflected in the pie chart, there are another 1700 miles of Minor Collectors also in need of reconstruction and will be the focus of new programs such as the Urban-Rural Initiative Program (URIP) currently being developed.
The huge investment in highways that have already been constructed needs to be preserved to keep the investment from deteriorating to the point of needing another expensive reconstruction. Therefore, each Bien-nial Transportation Improvement Program (BTIP) must first preserve the built sections with overlays that have a 10-14 year life cycle and also keep the backlog sections serviceable with a thin maintenance coat until reconstruction can take place. System preservation and maintenance needs to be done before reconstruction.
There are approximately 1003 miles of posted roads in the major collector and other classifications noted above. As funding is allocated, posted roads are given a higher priority which in the future will greatly reduce the need for springtime postings.
Data Source
Maine Department of Transportation, Bureau of Planning, Research and Community Services.

24 Prepared by the Maine Development Foundation for the Maine Department of Transportation, October, 1999 Prepared by the Maine Development Foundation for the Maine Department of Transportation, October, 1999 25
18 - Bridge Condition
Bridges in Need of Improvement
There are 3,565 bridges in Maine that are the responsibility of the public. These bridges include all those with spans greater than 10 feet on State Highways and public roads including Town Ways. Using the federal Sufficiency Rating (see below) it is esti-mated that 73% of these bridges are structurally and functionally sufficient such that they are not likely to need capital improve-ments for at least 10 years. A sufficiency rating of greater than 60 correlates to 10 years without capital improvement needs, except for the possibility of paint or wearing surface work. Tracking the percentage of bridges with a sufficiency rating of greater than 60 is a good proxy for overall condition of Maine’s bridges.
Impact on the Economy
Bridges are absolutely critical to the highway system. If a bridge fails, the road that travels over it fails. Furthermore, bridges represent a very sizable infrastructure investment on behalf of the government. Maintaining that investment and facilitating the flow of commerce has a large impact on the state and local economies. It is nearly impossible to imagine a functioning economy without them.
Outlook
As the recently increased bridge improvement budget continues to be fully realized and future bridge improvement budgets remain at the current levels, it is antici-pated that this positive trend will continue. Since 1998, MDOT annual investment for bridges has been approximately $12 million for maintenance and operations, with an additional $40 million for capital improvements.
Related Data and Issues
The 73% of bridges with a sufficiency rating of greater than 60 are Maine’s best bridges. Even though they are in good condition, some will need capital improve-ment starting as soon as 10 years.
Data Source
Maine Department of Transportation; Bureau of Planning, Research and Community Services; Bridge Management Systems.
A note on the Federal Sufficiency Rating: The federal government gives bridges a sufficiency rating based on a combination of four separate factors to provide a number from 0 to 100 (0=worst, 100=best) as to the overall sufficiency of each bridge. The four general categories used in the computations are:
1. Structural Adequacy and Safety 2. Serviceability and Functional Obsolescence 3. Essentially For Public Use 4. Special Reductions (detour length, traffic safety features)
Percent of Bridges Structurally Sufficient(Improvements Not Needed for 10 Years)
%
%
%
%
%
%
%
%%
%
%
%
% %%
%
%%
24 Prepared by the Maine Development Foundation for the Maine Department of Transportation, October, 1999 Prepared by the Maine Development Foundation for the Maine Department of Transportation, October, 1999 25
19 - Railways in Active Service
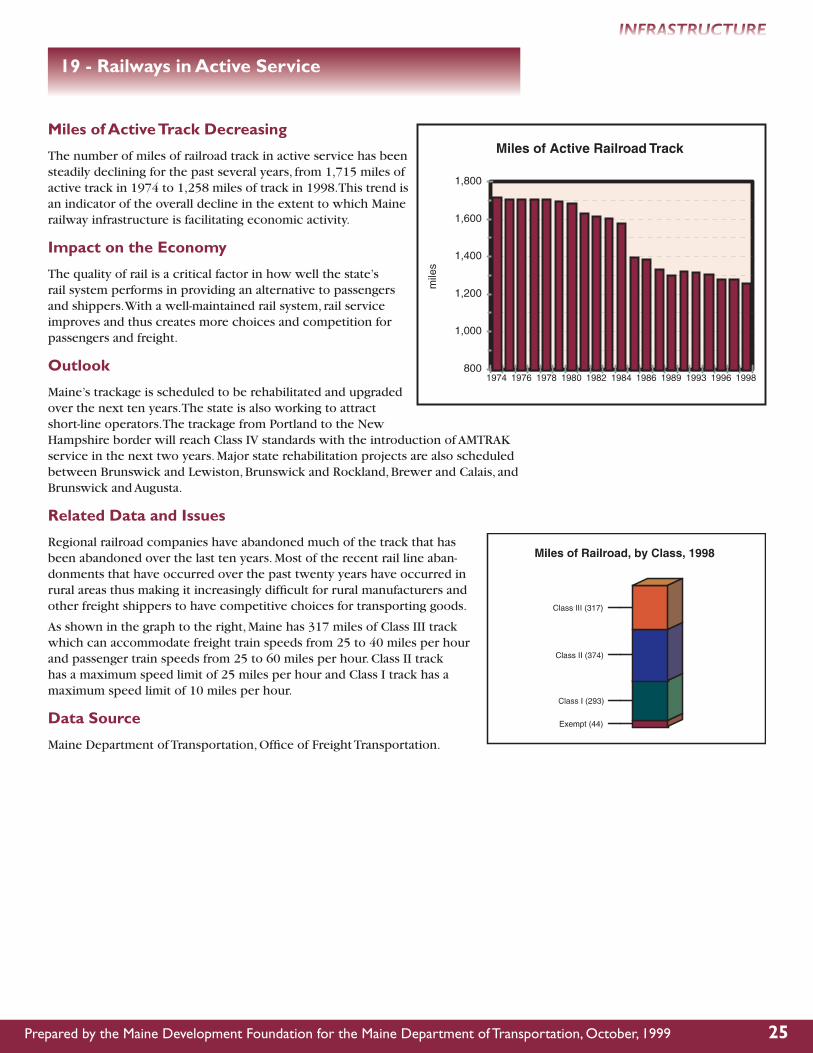
Miles of Active Track Decreasing
The number of miles of railroad track in active service has been steadily declining for the past several years, from 1,715 miles of active track in 1974 to 1,258 miles of track in 1998. This trend is an indicator of the overall decline in the extent to which Maine railway infrastructure is facilitating economic activity.
Impact on the Economy
The quality of rail is a critical factor in how well the state’s rail system performs in providing an alternative to passengers and shippers. With a well-maintained rail system, rail service improves and thus creates more choices and competition for passengers and freight.
Outlook
Maine’s trackage is scheduled to be rehabilitated and upgraded over the next ten years. The state is also working to attract short-line operators. The trackage from Portland to the New Hampshire border will reach Class IV standards with the introduction of AMTRAK service in the next two years. Major state rehabilitation projects are also scheduled between Brunswick and Lewiston, Brunswick and Rockland, Brewer and Calais, and Brunswick and Augusta.
Related Data and Issues
Regional railroad companies have abandoned much of the track that has been abandoned over the last ten years. Most of the recent rail line aban-donments that have occurred over the past twenty years have occurred in rural areas thus making it increasingly difficult for rural manufacturers and other freight shippers to have competitive choices for transporting goods.
As shown in the graph to the right, Maine has 317 miles of Class III track which can accommodate freight train speeds from 25 to 40 miles per hour and passenger train speeds from 25 to 60 miles per hour. Class II track has a maximum speed limit of 25 miles per hour and Class I track has a maximum speed limit of 10 miles per hour.
Data Source
Maine Department of Transportation, Office of Freight Transportation.
Miles of Active Railroad Track

26 Prepared by the Maine Development Foundation for the Maine Department of Transportation, October, 1999 Prepared by the Maine Development Foundation for the Maine Department of Transportation, October, 1999 27
20 - Cargo Port Condition
Growth in Port Traffic Appears to be Slowing
Over the last twenty years, Maine’s major ports (Eastport, Searsport, Portland) have grown significantly from processing 267,718 short tons in 1980 to nearly 1,400,000 short tons in 1998. This represents a five-fold increase. However, in the last few years, annual tonnage has shown somewhat flat growth as compared to previous years. This can be attributed to both the economic downturn in Asia and the fact that Maine’s ports have reached their capacity and require new investment in order to continue to grow.
Impact on the Economy
The ability of Maine’s businesses to grow and expand is in large part due to how well they succeed in delivering their products to international markets. Maine’s ports play a valuable role in this process by providing a cost-effective alternative to shipping via out-of-state ports.
According to methodology endorsed by the American Association of Port Authori-ties, it is estimated that about 1,700 jobs result directly from the Maine port industry.
Outlook
The outlook for Maine’s three ports is very positive. A $20 million terminal expan-sion in Eastport was completed last year and now offers Washington and Hancock County shippers a state-of-the-art facility. In Searsport, a unique $25 million public-private partnership will allow the current occupants of the Mack Point facility to rehabilitate their existing facilities to modern standards while re-paying the State’s participation over a twenty year period. About $7 million of this comes from private investment. This will capitalize the Maine Port Authority for future projects. Lastly, in Portland, the planned separation and expansion of the passenger and container operations will ensure their continued growth.
Given that the usefulness of cargo ports is in large part dependent on their access to major land-based transportation corridors, rail access to Eastport and highway access to Portland are currently being addressed.
Related Data and Issues
As shown in the graph, Searsport and Portland are Maine’s two largest ports and combined, they account for about 80% of Maine’s port traffic. Eastport accounts for about 12%. Rockland and Winterport also serve important niche roles.
The recent downturn in the Asian economy has created a soft market for many of Maine’s export products. Such uncontrollable situations as economic conditions in other ports of the world drive port tonnage both up and down regardless of the condition of Maine facilities.
Maine also handles a large amount of liquid cargo shipments such as oil. The Port of Portland is the third largest liquid cargo port on the east coast. In 1998, Maine ports handled over 123 million barrels of liquid cargo.
Data Source
Maine Department of Transportation based on U.S. Coast Guard Port Operators Reports
Dry Cargo through Maine Ports
%)
%
%
%

26 Prepared by the Maine Development Foundation for the Maine Department of Transportation, October, 1999 Prepared by the Maine Development Foundation for the Maine Department of Transportation, October, 1999 27
21 - Airport Capacity
Maine Commercial Airports in Good Condition
Maine commercial airports, as a whole, are operating at about 32% of their runway capacity which is an indication that their infrastructure is in good condition. The quality and capacity of Maine’s airports effects their ability to meet demand and to attract expanded air services. Optimum runway capacity is about 80%. Portland Jetport, Maine’s busiest airport, is currently operating at about 54% of its runway capacity.
An airport operating below 80% is an indicator that it is not capacity constrained. When an airport is operating at too high a capacity, delays cause negative economic impacts.
Runway capacity is just one component of an airport’s overall capacity, although this indicator regards it as a proxy for overall capacity. Other factors include automobile parking, access, and terminal size.
While no airports are reaching capacity constraints, Portland is experiencing pressure on its parking and terminal facilities. Numerous projects are underway or scheduled to address runway, access and parking capacity issues at Portland.
Impact on the Economy
Commercial air service is critical to Maine’s economy. It supports tourism, manufac-turing, and the service sector. In 1994, it was estimated that the following economic benefits resulted from commercial aviation:
• $553 million in total aviation related spending • 12,100 jobs directly and indirectly attributed to aviation• $196 million direct and indirect payroll• 11.4% of Maine’s employment is tied to the availability of commercial air
service.
Access to convenient airports is critical in attracting new businesses to Maine and the expansion of existing companies.
Outlook
The Maine Department of Transportation has identified the following strategies and projects to address aviation facility need:
• implement a runway pavement management program• develop intermodal facilities at major airports• reconstruct and rehabilitate runways• expand terminals• expand freight and cargo facilities and warehouses• increase parking capacity• improve instrument landing capabilities• assist airports in meeting requirements for economic development designa-
tion.
An estimated $35 million in federal and state funding will be invested in Bangor, Portland, Presque Isle, and Hancock County/Bar Harbor over the years 2000 to 2004. Runway improvements have been scheduled over the next four years to improve pavement condition at Bangor, Portland, and Presque Isle.
% %
%
%
%
%
%
%
%
%
%
Continued on next page

28 Prepared by the Maine Development Foundation for the Maine Department of Transportation, October, 1999 Prepared by the Maine Development Foundation for the Maine Department of Transportation, October, 1999 29
21 - Airport Capacity (continued)
Related Data and Issues
The graph to the right shows a breakdown of activity levels at Maine’s six commercial airports. In addition to these, there are 29 non-commercial airports in Maine.
Data Sources
State of Maine Aviation Systems Plan Update, 1996. Portland International Economic Benefit Study, 1994. Maine’s Dependence on Commercial Air Travel, 1994. Maine Department of Transportation Twenty Year Plan, 1998, Aviation Capital Investment Plan.
Maine Commercial Airport Operations
Airport (Number ofOperations)
PercentCapacityUtilized
54%
44%
22%
15%
26%
26%

28 Prepared by the Maine Development Foundation for the Maine Department of Transportation, October, 1999 Prepared by the Maine Development Foundation for the Maine Department of Transportation, October, 1999 29
22 - Public Involvement in Transportation Planning
Most Citizens Do Not Become Involved in Trans-portation Planning
In September, 1999, just 7% of Maine citizens reported that they had attempted in the previous two years to become involved in transportation planning. Of those 7%, the following question was asked: “Where 5 equals strongly agree and 1 equals strongly disagree, what is your level of agreement with the following statement: It is easy to become involved in transportation plan-ning?”
As shown in the graph, 9% strongly agreed (reflecting an opin-ion that involvement was easy) while 26% strongly disagreed (reflecting an opinion that involvement was difficult). The aver-age response was 2.6 points on the five point scale.
Impact on the Economy
In order to continually assist economic growth, the transporta-tion system must be responsive to changing needs and perspectives of those who use the system. This indicator is a proxy for the extent to which Maine citizens want to become involved in transportation planning decisions.
Related Data and Issues
The 7% of people who reported attempting to be involved in transportation plan-ning were also asked: “Where 5 equals strongly agree and 1 equals strongly disagree, what is your level of agreement with the following statement: Once involved in transportation planning, I felt that my ideas and opinions were fairly considered.” About 12% strongly agreed with the statement while 26% strongly disagreed.
Data Source
Maine Development Foundation Annual Survey of Maine Businesses, 1999. See Appendix A for methodology. Because this is the first year of data collection on this issue it is not appropriate to presume a trend or formulate an outlook.
Ease of Being Involvedin Transportation Planning
% % % % % % % % %
%
%
%
%
%

30 Prepared by the Maine Development Foundation for the Maine Department of Transportation, October, 1999 Prepared by the Maine Development Foundation for the Maine Department of Transportation, October, 1999 31
Appendix A - Survey Methodology
1999 Maine Development Foundation Surveyof Maine Citizens and Maine Businesses
The Maine Development Foundation retained Market Deci-sions, Inc., of South Portland, Maine, to design and conduct citizen and business surveys. These surveys provided data for indicators 4, 5, 6, 14, 16, and 22.
Maine Citizen Survey The statewide Citizen Survey was conducted by telephone between September 7th and September 21st, 1999. The Citi-zen Survey was conducted among a statewide sample of 603 Maine households. A sample of this size yields a sampling error of ± 3.99 percentage points with 95% confidence at the total sample level. A two-stage sampling process was used to identify individuals within households. Market Deci-sions acquired a statewide RDD (random digit dial) sample of telephone numbers from Survey Sampling, Inc.; a provider of scientifically generated random samples. After contacting a randomly selected household, the survey was conducted with the adult who celebrated the most recent birthday.
The survey instrument was pre-tested with persons unfamil-iar with the study, and was refined to correct question word-ing that may have been unclear to some respondents. The final instrument included approximately 120 questions and the actual respondent interviews averaged 27 minutes in length.
All interviewing was conducted for Market Decisions by its research partner, Corporate Research Associates of Halifax, Nova Scotia using computer-assisted telephone interviewing (CATI) technology. Among those households contacted for the survey, 1436 refused to be interviewed, 104 terminated the interview prior to its completion and 603 completed the interview for a 28% completion rate.
Maine Business Survey The Maine Business Survey was mailed out on September 1st 1999, and surveys returned by September 27th were included in the analysis. The population of known Maine companies was divided into manufacturing and non-manufacturing cat-egories. Within each of these groups, sub samples were identi-fied by size of the company (manufacturing: one to nine employees, 10 to 19 employees, 20 to 49 employees, 50 to 99 employees, and more than 100 employees; non-manufac-turing: one to nine employees, 10 to 19 employees, 20 to 49 employees, 50 to 249 employees, and more than 250 employees). The sample was constructed in this way in order to achieve a sample which would provide meaningful results by size and type of company.
Surveys were mailed to 2,100 firms in Maine. The sample list was generated from Tower Publishing’ state business directory for Maine. Each respondent was sent a four page survey book-let, a letter from the Honorable Angus S. King, Jr., Governor of Maine seeking cooperation in completing the survey, and a Market Decisions business reply envelope. The survey packets were addressed to the owner or the person identified as the chief executive officer of the company. The survey included 51 questions. Reminder postcards were sent out one week after the initial mailing (9/8/99) to encourage further coop-eration. Reminder telephone calls were made between Sep-tember 14th and September 20th to those companies in employee size sub samples that were under represented by the mail in responses, to request that they complete and return the surveys. Those who had misplaced the original survey were faxed a copy to complete and return.
A total of 2,100 surveys were initially mailed and five surveys were returned for non-delivery, resulting in an actual delivery of 2,095 surveys. A total of 593 completed surveys were returned by September 27th for a response rate of 28%. A random sample of 593 would be expected to yield a maximum sampling error of ± 4.02 percentage points. How-ever, because of the stratified nature of the sample, which allows for more reliable examination of the sub sample, the sampling error is actually considerably larger (± 7.56%) While the return rate matched last year’s rate, it is still subject to self-selection which introduces a non-determinable, non-response bias.
Prior to tabulation, the results of the returned surveys were weighted to more accurately represent the Maine population of employers.
A Cautionary Note on Sub-SamplesThe sampling errors and levels of confidence cited for each survey above refer to the total group of respondents in each case are not the same for sub-samples. For instance, the responses of just women, or just college educated people, or just manufacturers are not as statistically valid as are the aggregate data from ALL who responded. Sampling errors and levels of confidence for specific sub-samples can be determined on request if necessary. Contact Craig Freshley at the Maine Development Foundation.

30 Prepared by the Maine Development Foundation for the Maine Department of Transportation, October, 1999 Prepared by the Maine Development Foundation for the Maine Department of Transportation, October, 1999 31
Appendix B - Related Documents
Biennial Operations Plan. A Transit plan required by Maine Law to maximize coordination of funds from all state agencies that sponsor trans-portation services, and to outline procedures for the development and maintenance of a permanent and effective public transportation system, with particular regard to low income elderly and handicapped residents. Updated regularly - last revised 1998 (Office of Passenger Transportation)
Biennial Transportation Improvement Program. The Biennial Trans-portation Improvement Program, a funding document requiring State Legislature approval every two years, is a project-specific expression of the goals, objectives and strategies outlined in the Department’s Twenty-Year Plan and the project priorities of the Department’s Six-Year Plan. It describes how the Department proposes to apply millions of dollars in capital funding towards the study, design or construction of multi modal transportation improvements throughout the state. The current BTIP funds project for Fiscal Years 2000 and 2001. (July 1, 1999 through June 30, 2001 - Department of Transportation)
The Cost of Sprawl. A discussion of costs to taxpayers, the environment and community character. Emphasis on personal decisions. Also discusses future directions. May, 1997 (Maine State Planning Office)
Maine Integrated Freight Plan. An inventory of the current freight transportation network, identification of major and minor shortcomings, a methodology for assessing project benefit/cost ratios and a policy for addressing potential public-private investments and to target projects. 1998 (Office of Freight Transportation and Freight Transportation Advisory Committee)
Maine State Aviation Systems Plan. A plan designed to guide growth of aviation community for next twenty years. Includes an inventory of exist-ing facilities, projections of aviation demand, adequacy review and recom-mended system improvements, facility requirements, and an implementa-tion plan. August, 1996 (Office of Passenger Transportation)
Maine State Ferry Service Strategic Plan. A five-year strategic plan developed to address the needs and deficiencies of the State Ferry Service. 1996 (Office of Passenger Transportation and Maine State Ferry Service Advisory Board)
Maine Strategic Passenger Transportation Plan. A visitor oriented strategic plan which proposes to develop an integrated system of modal options that will attract travelers to Maine, and provide modal choice for Maine’s citizens. 1997 (Office of Passenger Transportation and Passenger Transportation Advisory Committee)
Maine Turnpike Authority Ten Year Plan. A plan required of the Maine Turnpike Authority by the Sensible Transportation Policy Act. The MTA plan shall include an inventory of transportation systems, forecasts of travel demand for the system under MTA jurisdiction, functional standards for transportation systems under MTA jurisdiction, identification of nature and extent of current and future deficiencies and needs of system under MTA jurisdiction and MTA’s recommendations for transportation improve-ment strategies, project priorities and multimodal projects and programs within its jurisdiction that should be considered by MDOT in preparing and approving the Statewide plan. 1998 (Maine Turnpike Authority)
Measures of Growth, 1999. Performance Measures and Benchmarks to Achieve Maine’s Long-Term Economic Goals. Fifth report of the Maine Economic Growth Council. Details 56 performance measures in six cat-egories which the Maine Economic Growth Council sees as necessary for achieving long-term economic growth in the state. Each performance measure has a benchmark or a target of where we would like to be at a specific time in the future, an explanatory paragraph, and a graph. The Growth Council is administered by the Maine Development Foundation, an independent non-profit, economic development corporation created by the legislature in 1978. January 1999 (Maine Development Foundation)
Six-Year Transportation Plan. The concept of a Six-Year Plan was developed in response to a need to provide a better linkage between the Department’s 20-Year Transportation Plan, which is policy based, and its Biennial Transportation Improvement Program (BTIP), which is project based. This Plan provides a view of project priorities beyond the traditional two-year period. The expanded vision provided by this six-year
planning document provides the Department with the opportunity for more effective management of its planning, project development, and financial resources. As importantly, it will allow communities to plan for their own multi-year capital improvement projects and heighten their awareness of how their transportation needs may be addressed in the near future. Nearly all projects considered in the development and preparation of the BTIP are drawn from the Six-Year Plan. This Plan is updated every two years to reflect changing needs and priorities. The first Six-Year Plan was developed in 1998. (Department of Transportation)
Strategic Plan for MDOT. Most recently, the MDOT has adopted its first Strategic Plan which redefines the Department’s mission and sets out three broad goals it will follow to achieve that mission. The Department’s Strategic Plan was developed in collaboration with the Governor’s Office and in consultation with the Legislature. It clearly defines the many chal-lenges the MDOT faces as it moves into the next century. (Department of Transportation)
A Summary of the Findings of Studies Regarding a Maine East-West Highway. Prepared by the Maine Department of Transportation and Maine State Planning Office, September 1999. This report presents a summary of findings from the following study documents:
A Technical Report On An East-West Highway in Maine, Maine Depart-ment of Transportation, September 1999.
Maine East-West Highway: Assessment of Toll Financing Feasibility, Wilbur Smith Associates, September 1999.
Maine East-West Highway Economic Impact Analysis, Phase I Technical Report, Baseline Conditions, RKG Associates, Inc., June 1999.
Maine East-West Highway Economic Impact Analysis, Phase II Technical Report, Survey Research and Commodity Forecasts, RKG Associates, Inc., July 1999.
Maine East-West Highway Economic Impact Analysis, Phase III Techni-cal Report, Economic Impacts, RKG Associates, Inc., September 1999.
Maine East-West Highway Economic Impact Analysis, Phase IV Technical Report, Case Study Analysis and Real Estate Impacts, RKG Associates, Inc., September 1999.
Twenty-Year Transportation Plan. Several changes in state and federal transportation planning and policy have taken place in recent years. Two of the most significant events contributing to this change occurred in 1991. At the federal level, landmark legislation known as the Intermodal Surface Transportation Efficiency Act of 1991 (ISTEA), established a new vision for surface transportation in America and significantly changed the direction of national and state transportation policy. At the state level, through a 1991 voter referendum, Maine’s Sensible Transportation Policy Act (STPA) was enacted. STPA, and the Rule which was developed to implement it, created a planning process that has significant public involvement and gives proper consideration to the diverse transportation needs of the people of the state, transportation efficiency, energy conser-vation, and the effects of transportation on the environment. In 1995, the MDOT developed a long range planning document to be consistent with the goals and requirements of these important new transportation poli-cies. This document was called the Statewide Twenty-Year Transportation Plan. This plan is updated every three years, with the most recent update occurring in 1998. (Department of Transportation)
You Can Get There From Here Volumes I & II. Bicycle and Pedestrian Plans designed to promote non-motorized travel in Maine. 1995 (Office of Passenger Transportation and Maine Bicycle Council)

32 Prepared by the Maine Development Foundation for the Maine Department of Transportation, October, 1999 Prepared by the Maine Development Foundation for the Maine Department of Transportation, October, 1999 33
Appendix C - Feedback Form
The Maine Department of Transportation invites your comments. Please tear out and mail or fax this form to the address below.
1. General comments about this report:
2. How could the report be improved? What changes should we make if we publish a similar report in the future?
3. Are there specific actions that should be taken as a result of some of the findings in this report?
4. If you would like someone to contact you, please provide your name and contact information:
Return to:
John Melrose, Commissioner, Maine Department of Transportation, 16 State House Station
Augusta, ME 04333 Fax: 207-287-2896

32 Prepared by the Maine Development Foundation for the Maine Department of Transportation, October, 1999 Prepared by the Maine Development Foundation for the Maine Department of Transportation, October, 1999 33
Appendix E - Glossary
public roads. Abutting property owners have no right of direct access.
Delay Ratio - the percentage of total travel-ing time represented by delay. Delay is the excess time required to reach one’s destina-tion due to traffic congestion.
Intermodal Facility - a facility at which pas-sengers or freight are transferred between two or more transportation modes.
Local Roads - roads primarily providing access to private property or low volume public facilities.
Minor Arterial - streets and highways link-ing cities and larger towns in rural areas, or distributing trips to small geographic areas in urban areas (not penetrating identifiable neighborhoods.)
Mode - a method or form of transportation, such as a plane, train, automobile, boat, etc.
National Highway System - a designated
Arterials - roads providing longer through travel between major trip generators such as larger cities or recreational areas.
Backlogged Roads - roads that are not built to modern standards.
Collector Roads - roads that collect traffic from the local roads and also connect smaller cities and towns with each other and to the arterials.
Commercial Airport - an airport which has regularly scheduled commercial flights in addition to chartered and private flights. Maine’s commercial airports include Portland International, Bangor International, Augusta, Knox County Regional (at Owl’s Head), Han-cock-Bar Harbor (at Trenton), and Northern Maine Regional (at Presque Isle).
Controlled Access - a controlled access highway is one on which priority is given to through traffic by providing access only at interchanges or intersections with selected
system of major roads including interstate highways and other principal arterial routes, approved by Congress in 1995 as a way of focusing federal resources on the nation’s most important roads. Nationwide, this system com-prises approximately four percent of public roads, while carrying over 40 percent of the nation’s highway traffic. In Maine, this system is comprised of more than 360 miles of inter-state highway and more than 900 miles of non-interstate principal arterials.
Principal Arterial - major streets or high-ways, often with multi-lane or freeway design, serving high-volume traffic corridor move-ments that connect major generators of travel.
Short Ton - a unit of weight equal to 2000 pounds.
Vehicle Miles Traveled - the total number of miles traveled by all vehicles in a given area over a certain period of time.
Appendix D - People Involved in Preparing This Report
Advisory CommitteeSteven Levesque Department of Community & Economic
Development, CommissionerRep. David Lindahl Transportation CommitteeCapt. Jeff Monroe City of Portland, Transportation DirectorChip Morrison Androscoggin County Chamber of CommerceSen. William O’Gara Transportation Committee, Senate ChairRichard Perkins Department of Public SafetyEvan Richert State Planning Office, DirectorDr. N. Shashikumar Maine Maritime AcademyScott Tompkins Associated Constructors of Maine, Public
Relations DirectorBob Ziegelaar Bangor International Airport, Director
John Melrose, Chair Department of Transportation, CommissionerBob Clark Northern Maine Development Commission,
DirectorCharles Colgan University of Southern MaineMaria Fuentes Maine Better Transportation Association,
DirectorDan Gwadosky Secretary of StateDale Hannington Maine Motor Transport Association, DirectorRep. Joseph Jabar Transportation Committee, House ChairMichael Kelley Department of Public Safety, CommissionerPaul Lariviere Federal Highway Administration, Division
Administrator
Working Group
Carl Croce, Chair Department of Transportation, PlanningSteve Abbott Department of Transportation, Bridge Man-
agementGerry Audibert Department of Transportation, Safety Man-
agement Graham Bailey Federal Highway AdministrationAllan Bartlett Department of Transportation, Office of
Freight TransportationAndy Bickmore Department of Transportation, Safety Man-
agement Mike Danforth Department of Transportation, PlanningJohn DelVecchio State Planning OfficeBarbara Donovan Department of Transportation, Office of Pas-
senger TransportationRick Dubois Department of Transportation, Management
SystemsRob Elder Department of Transportation, Office of
Freight TransportationKeith Fougere Department of Transportation, Pavement
ManagementKathy Fuller Department of Transportation, Office of Policy
Marc Guimont Department of Transportation, Maintenance & Operations
Ed Hanscom Department of Transportation, PlanningJeri Holt Maine Municipal AssociationMike Karagiannes Department of Environmental Protection,
Bureau of Air QualityDale Peabody Department of Transportation, ResearchTracey Perez Department of Transportation, Office of Pas-
senger TransportationPam Pottle Department of Transportation, Office of Pas-
senger TransportationKevin Rousseau Department of Transportation, Office of
Freight Transportation Ron Roy Department of Transportation, Office of Pas-
senger TransportationRon Severence Department of Environmental Protection,
Bureau of Air QualityGreg Shea Department of Transportation, Finance &
AdministrationKen Sweeney Department of Transportation, ConstructionDonald Young Department of Transportation, Pavement
Management

MAINE DEPARTMENT OF TRANSPORTATION
16 STATE HOUSE STATION • AUGUSTA, ME 04330-0016PHONE: 207/287-2551 • FAX: 207/287-2896
INTERNET: www.state.me.us/mdot/