maintenance and reliability – · pdf file1 maintenance and reliability – theory...
TRANSCRIPT
1
Maintenance and Reliability –Theory
John E. Skog P.E.WGA3-06 Tutorial
June 2006Rio de Janeiro
2
Today’s Agenda
• Evolution of Maintenance and Driving Theory
– Traditional Bimodal Maintenance
– Reliability Centered Maintenance
– Condition Based Maintenance
– Performance Focused
• Three Case Studies
– Cables
– SF6 Breakers
– Transformer On-line Monitoring

3
Overhaul
Time
CMCM
PMPMTr
aditio
nal
Asset Asset
Maintenance Evolution – Traditional

4
Characteristics of Traditional Maintenance
Intrusive Generalized
Conservative/Excessive
Belief More Maint.IncreasedReliability

5
Traditional Maintenance
Benefits DrawbacksPeriodic inspection servicing is necessary
Time is poor predictor of wear
Acknowledgement that full equipment operating life is only possible if worn parts are replaced.
Overhauls create more problems than they solve
High cost
Manufacturers did not understand the operating environmentReliability and availability were not being met

6
Overhaul
Safety Function
FailureCause
Criticality
EffectsTime
CMCM
PMPMTr
aditio
nal
Run toFailureRun toFailure
Event
FailureFindingFailureFinding
ConditionCondition
RCM
Asset Asset
Maintenance Evolution – RCM

7
RCM
“A structured process that identifies the effects of
failures and defines the appropriate maintenance path for managing their impacts. RCM identifies both the most technically and economic effective approach to maintenance .”

8
RCM History• Airlines
1965 MSG-1 (Maint. Steering Group)1970 MSG-2Experience
– DC 8• 339 Scheduled Removal Tasks• 7 Scheduled Removal Tasks
– 747• 8 Scheduled Removal Tasks

9
RCM History (cont.)
• Airline Observations:– Maintenance needs to focus on system that have
significant impact on safety or economics. – Hard time overhaul policies were ineffective.– Management of maintenance was crucial.
10
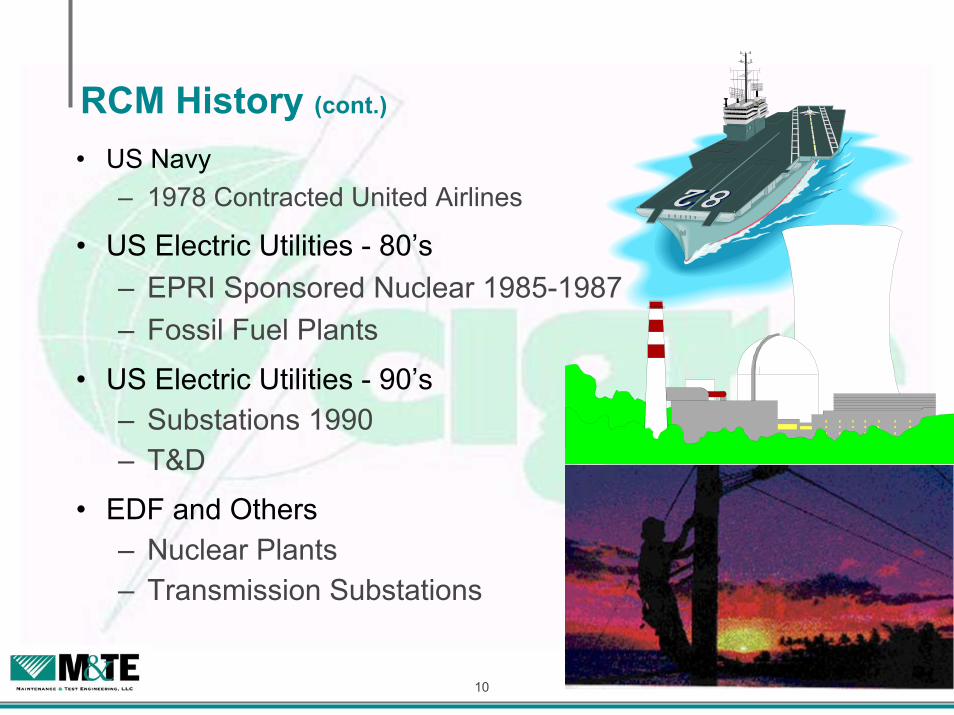
RCM History (cont.)
• US Navy – 1978 Contracted United Airlines
• US Electric Utilities - 80’s– EPRI Sponsored Nuclear 1985-1987– Fossil Fuel Plants
• US Electric Utilities - 90’s– Substations 1990– T&D
• EDF and Others– Nuclear Plants– Transmission Substations

11
RCM Task Selection
“The RCM task selection approach used to ensure that only applicable and cost effective tasks are selected to address
the causes of critical equipment failure modes”
RCM Task Categories– Inspection-Condition Monitoring-Predictive Maintenance– Periodic
• Rework-Time Directed• Discard-Time Directed
– Failure Finding– Run to Failure

12
Preserved
Simplified Task Selection Logic
PDM
PM
Design Change
Hidden Failure Finding
Yes
Yes
No
No
Yes
Yes
No
No
SafetyConsequences
Task Must ReduceRisk of Failure
OperationalConsequencesTask must cost
Less than the consequences
Non-OperationalConsequencesTask must costless than repair
Run to failure
Is the Failure Evident?
Can the failure be tolerated?
Is a time directed task effective?
Is Condition Monitoring Effective?
Review Effects
Mode & CauseSelected
Corrective Maintenance
Is the Failure Evident?
Can the failure be tolerated?
Is a periodic task effective?
Is Condition Monitoring Effective?
NoNo--Design Design ChangeChange
NoNo--Periodic Periodic PMPMNoNo--Failure Failure
Finding TaskFinding Task
Failed

13
Characteristics of Reliability Centered Maintenance
Preservationof
Function
SpecializedTasks
Focused onDominant
Causes

14
Reliability Centered Maintenance
Benefits DrawbacksCritical Functions Viewed as difficult and not applicable
to power industry
Equipment and application specific
99.999% (1 hour of outage per year) reliability is difficult to understand
Greater insight into failure process
Living program forgotten
Eliminated ineffective tasks Did not set maintenance intervals

15
Overhaul
Safety Function
FailureCause
Criticality
EffectsTime
Aging Models
Sensors
Real Time Data
Predictions
CMCM
PMPMTr
aditio
nal
Run toFailureRun toFailure
Event
FailureFindingFailureFinding
ConditionCondition
RCM
IMIM
PredictivePredictive
CBM
DiagnosticsDiagnosticsProactive
Asset Asset
Maintenance Evolution – CBM
16
Condition Based Maintenance
“Condition Based Maintenance accentuates the value of RCM task selection logic and emphasizes that more intrusive replacement and overhaul tasks only need to take place when measurable wear or aging occurs.”
“Condition Directed Tasks are initiated when deterioration has gone beyond a prescribed limit”

17
Characteristics of CBM
AgingMechanismUnderstood
DataDriven
GreaterReliance onMeasurableConditions
Unobtrusive

18
Condition Based Maintenance
Benefits DrawbacksIncreased availability Data systems were may not be
adequate.
Reduced costs Process management overlooked.
More frequent analysis of asset condition
No methodology for justifying increased monitoringIncreased back-office analysis

19
Overhaul
Safety Function
FailureCause
Criticality
EffectsTime
Aging Models
Sensors
Real Time Data
Predictions
CMCM
PMPMTr
aditio
nal
Run toFailureRun toFailure
Event
FailureFindingFailureFinding
ConditionCondition
RCM
IMIM
PredictivePredictive
CBM
DiagnosticsDiagnosticsProactive
Asset Asset
Maintenance Evolution – PFM
Orga
niza
tion
Process
Data
EventFailureFindingFailureFinding
Run toFailureRun toFailure
IMIM
PredictivePredictive
CMCM
PMPMConditionCondition
Asset Asset Tr
aditio
nal RCM
CBM
DiagnosticsDiagnosticsProactive
Performance Focused Maintenance
20
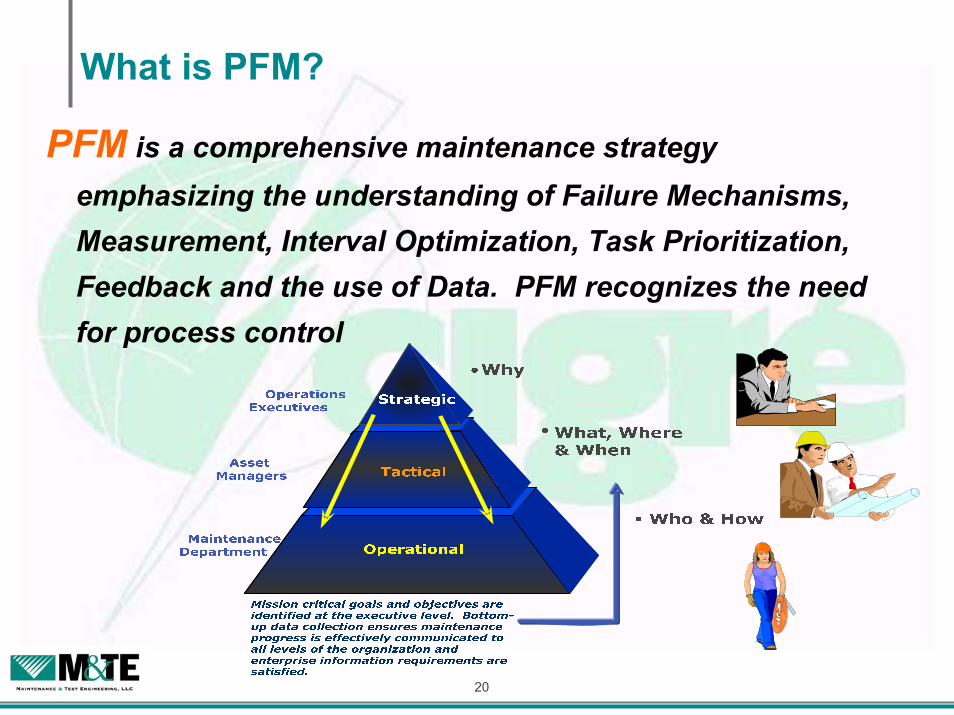
What is PFM?
PFM is a comprehensive maintenance strategy emphasizing the understanding of Failure Mechanisms, Measurement, Interval Optimization, Task Prioritization, Feedback and the use of Data. PFM recognizes the need for process control
21
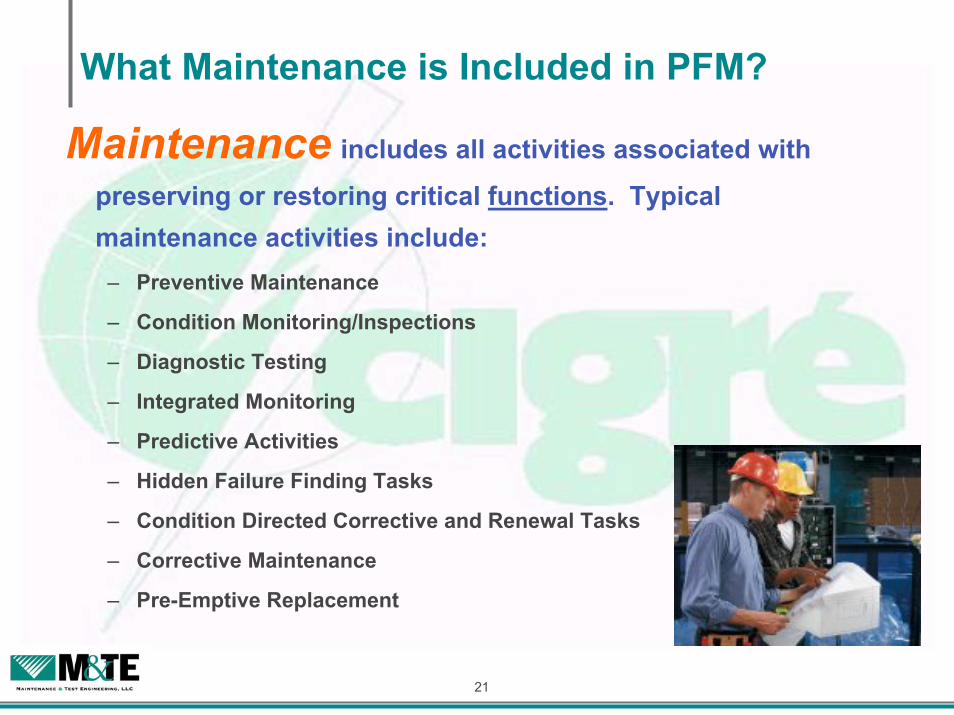
What Maintenance is Included in PFM?
Maintenance includes all activities associated with
preserving or restoring critical functions. Typical maintenance activities include:
– Preventive Maintenance
– Condition Monitoring/Inspections
– Diagnostic Testing
– Integrated Monitoring
– Predictive Activities
– Hidden Failure Finding Tasks
– Condition Directed Corrective and Renewal Tasks
– Corrective Maintenance
– Pre-Emptive Replacement
22
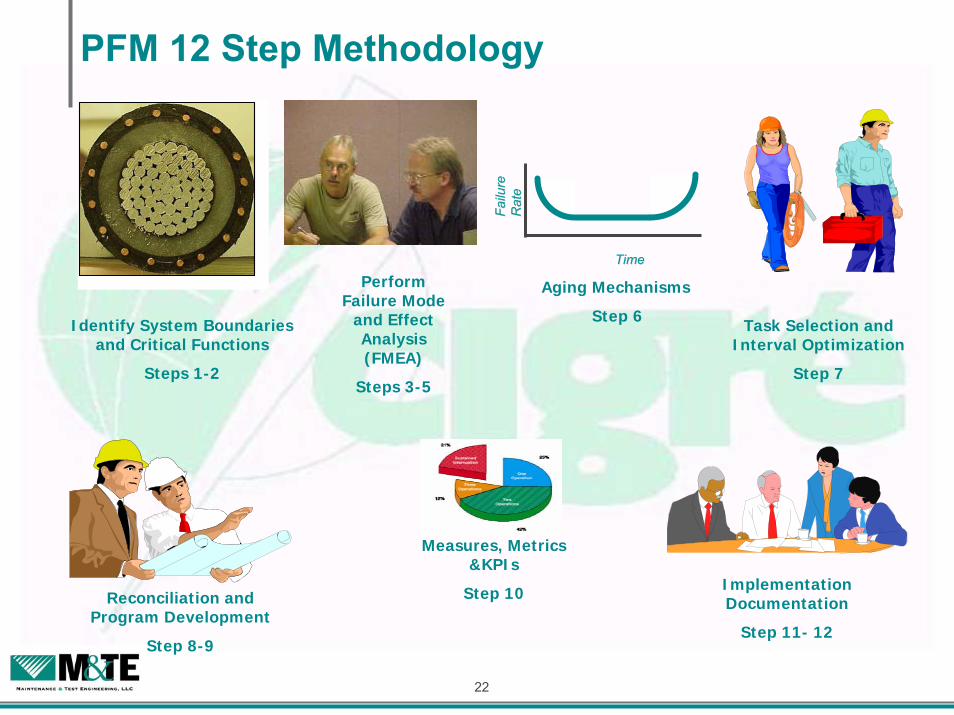
PFM 12 Step Methodology
Reconciliation and Program Development
Step 8-9
Implementation Documentation
Step 11- 12
Perform Failure Mode
and Effect Analysis (FMEA)
Steps 3-5
Aging Mechanisms
Step 6
TimeTime
Failu
re
Failu
re
Rat
eR
ate
Task Selection and Interval Optimization
Step 7
Identify System Boundaries and Critical Functions
Steps 1-2
Measures, Metrics &KPIs
Step 10
23
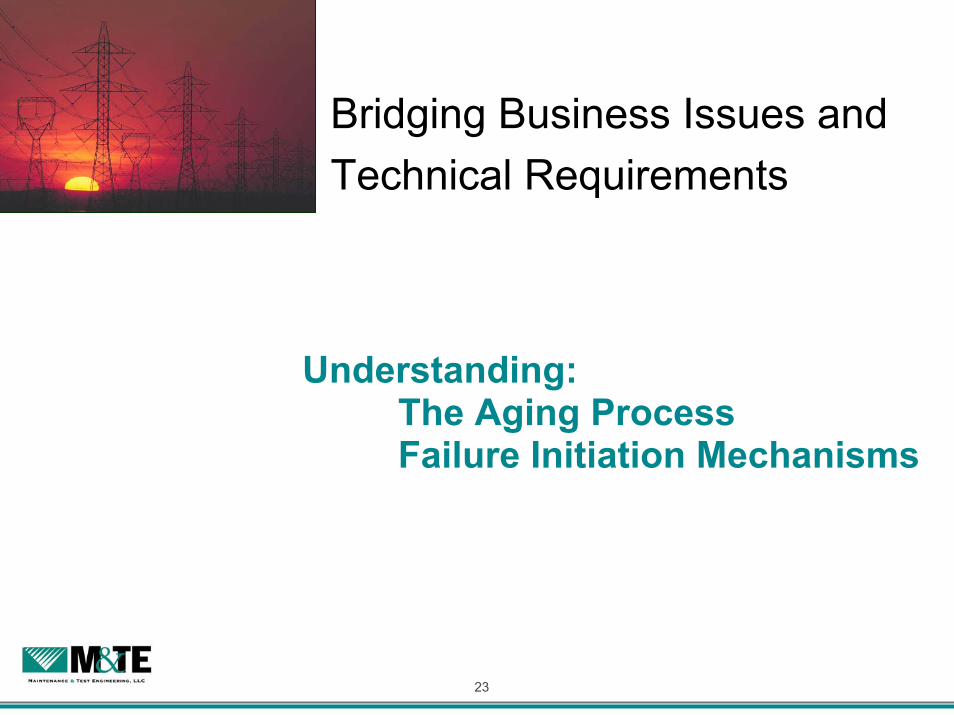
Understanding: The Aging ProcessFailure Initiation Mechanisms
Bridging Business Issues andTechnical Requirements
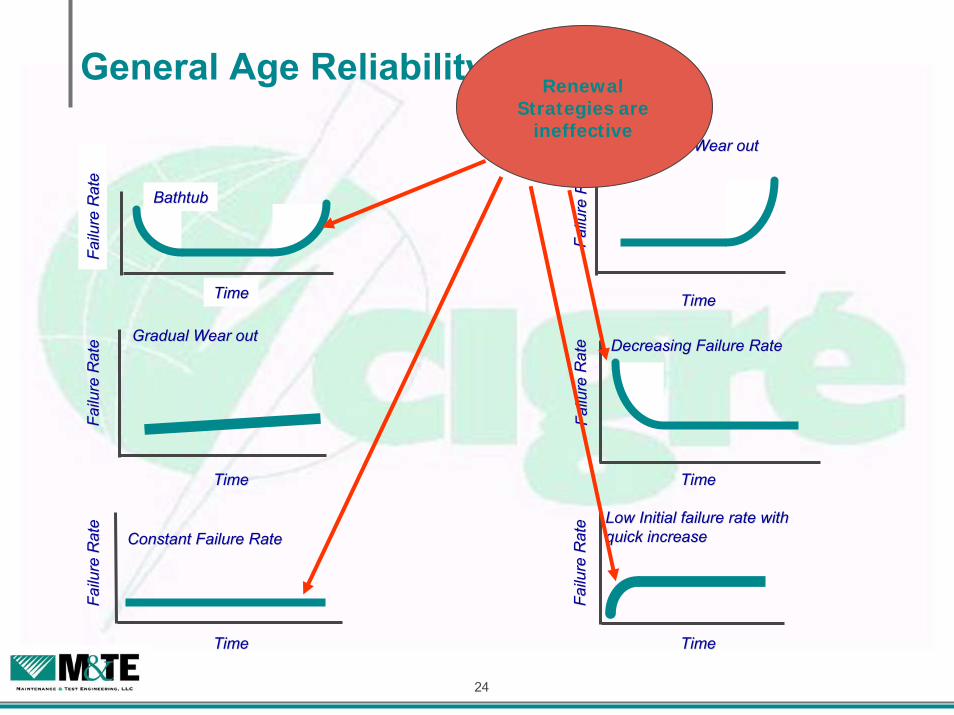
24
TimeTime
BathtubBathtub
Failu
re R
ate
Failu
re R
ate
TimeTime
Pronounced Wear outPronounced Wear out
Failu
re R
ate
Failu
re R
ate
TimeTime
Low Initial failure rate with Low Initial failure rate with quick increasequick increase
Failu
re R
ate
Failu
re R
ate
Failu
re R
ate
Failu
re R
ate Gradual Wear outGradual Wear out
TimeTime
TimeTime
Constant Failure RateConstant Failure Rate
Failu
re R
ate
Failu
re R
ate
TimeTime
Decreasing Failure RateDecreasing Failure Rate
Failu
re R
ate
Failu
re R
ate
General Age Reliability PatternsRenewal
Strategies are ineffective

25
Task Interval Optimization-Weibull Age Modeling
F(t) = 1-e-[(t-t0)/η]β
– t0 = Guarantee Period
– η = Characteristic Life .. MTBF
– β = Shape factor
Failure Probability Distribution
0%2%4%6%8%
10%12%14%16%18%
1 4 7 10 13 16 19 22 25 28 31 34 37 40 43 46 49
Infant MortalityRandom
Wear
Pronounced Wear
Cumulative Failure Probability
0%
20%
40%
60%
80%
100%
1 4 7 10 13 16 19 22 25 28 31 34 37 40 43 46 49
Infant Mortality
RandomWear
Pronounced Wear
With Some Good Data, Failures Can
be Predicted Mathematically
26
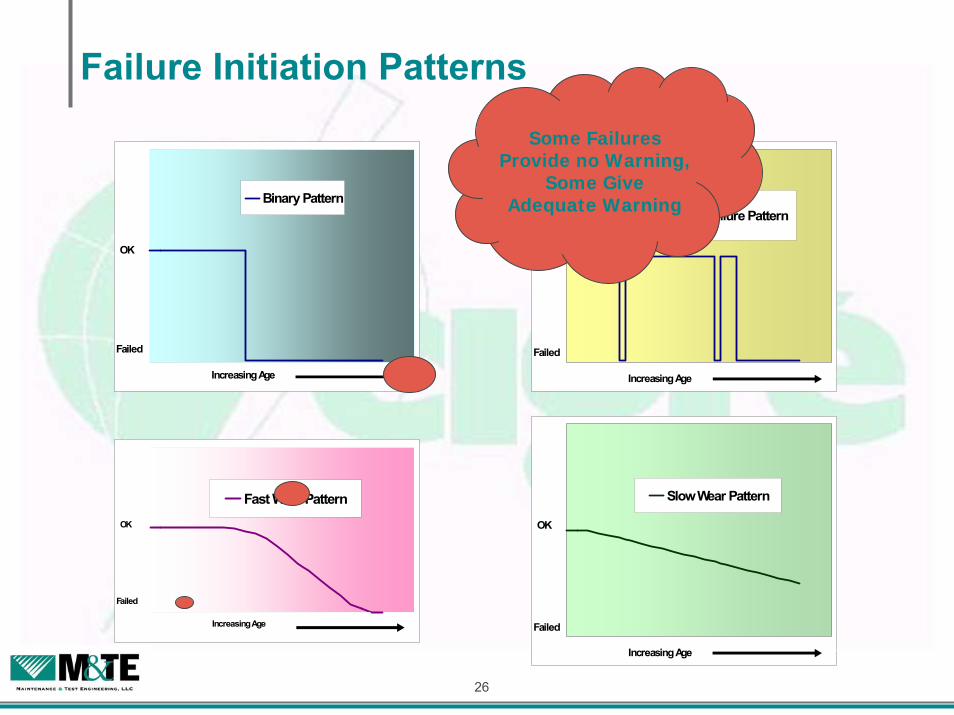
Failure Initiation Patterns
0
2
0 5 10 15 20 25
Binary Pattern
Increasing Age
OK
Failed0
2
0 5 10 15 20 25
Intermittant Failure Pattern
Increasing Age
OK
Failed
0
2
0 5 10 15 20 25
Fast Wear Pattern
Increasing Age
OK
Failed
0
2
0 5 10 15 20 25
Slow Wear Pattern
Increasing Age
OK
Failed
Some Failures Provide no Warning,
Some Give Adequate Warning

27
Characteristics of PFM
FocusedMaintenance
IntegratesBest Business
and TechnologyPractices
Optimization
Life CycleApproach to
Data Management
ProcessMeasurement
AndFeedback

28
Performance Focused Maintenance
Benefits DrawbacksIncreased availability and reliability
Requires quality data collection and storage processes
Reduced life-cycle costs Must be understood and supported by the highest management levels
Data collection fundamental part of the processIntegrated business and technology approach to maintenance

29
Performance Focused MaintenanceCase Studies (3)
30
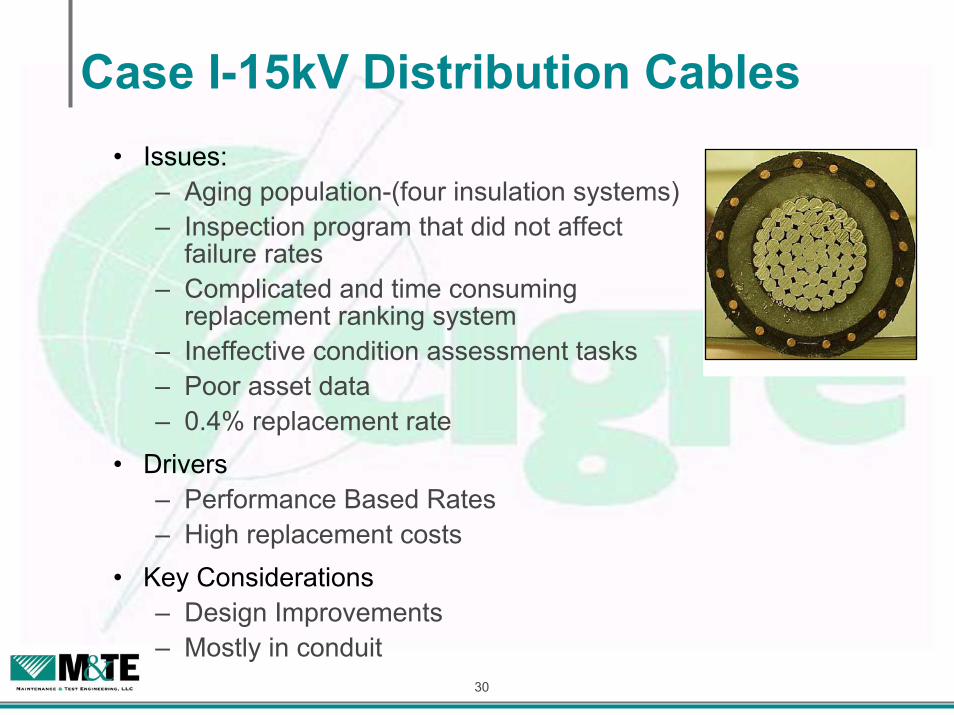
Case I-15kV Distribution Cables• Issues:
– Aging population-(four insulation systems)– Inspection program that did not affect
failure rates– Complicated and time consuming
replacement ranking system– Ineffective condition assessment tasks – Poor asset data– 0.4% replacement rate
• Drivers– Performance Based Rates– High replacement costs
• Key Considerations– Design Improvements– Mostly in conduit

31
Equipment Group: Population by Age and Insulation Type
U G P r i m a r y C a b l e s
0
2 0 0
4 0 0
6 0 0
8 0 0
1 ,0 0 0
1 ,2 0 0
1 ,4 0 0
1 ,6 0 0
1 ,8 0 0
2 ,0 0 0
1958
1960
1962
1964
1966
1968
1970
1972
1974
1976
1978
1980
1982
1984
1986
1988
1990
1992
1994
1996
1998
2000
Y e a r
Con
duct
or M
iles
X L P E
T R -X L P EP I L C
H M W
Type of Insulation
Expected Service Life
Circuit Miles
PILC 45 - 50 years 4,900HMW-PE 15-20 years 1,500XLPE 25-30 years 30,200TR-XLPE 45 years + 2,400
Identify System Boundaries and Critical Functions
Steps 1-2
32
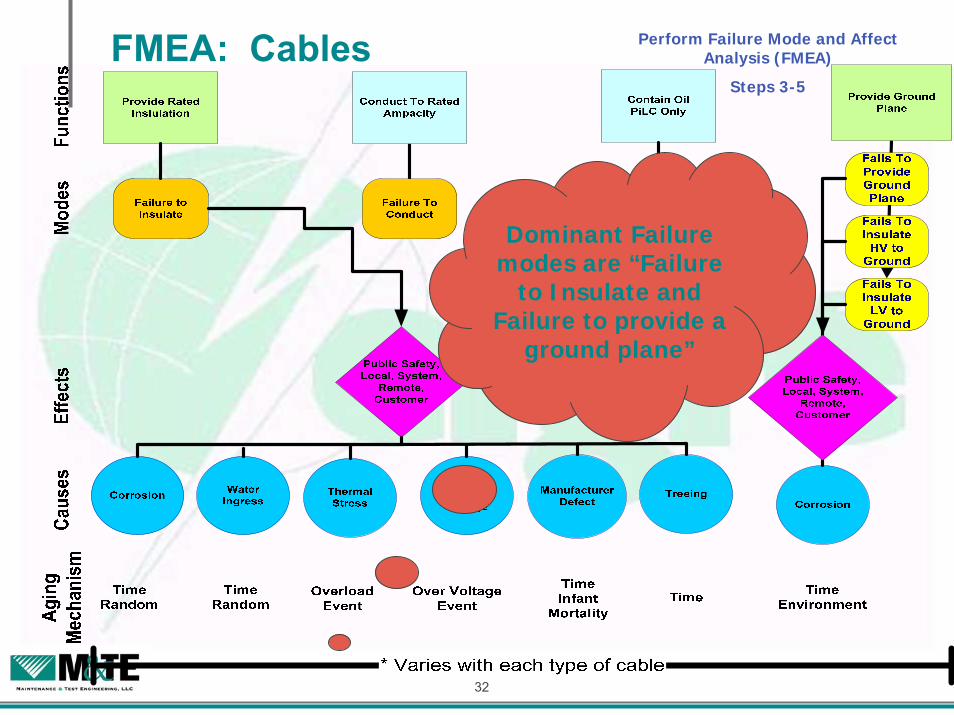
FMEA: Cables Perform Failure Mode and Affect Analysis (FMEA)
Steps 3-5
Dominant Failure modes are “Failure
to Insulate and Failure to provide a
ground plane”

33
Tree Examples - Failure to Insulate
#2 AWG HMW vintage cable which failed in Ridgecrest.Water treeing more than 50% through the insulation
#2 AWG XLPE cable from Fullerton. Water treeing more than 40% through the insulation.
Cable Insulation
Source: DAE, Improving the performance of underground cable. Sept 14, 2001
Water TreesCable Insulation
Aging Mechanism
Step 6
Resultant Strategy:
Pre-emptive Replacement

34
Cable Unreliability
0
0.2
0.4
0.6
0.8
1
yr(s) 10 yr(s) 20 yr(s) 30 yr(s) 40 yr(s) 50 yr(s) 60 yr(s)Years after installation
Unre
liabi
lit PILCHMWXLPETR-XLPE
Cable Insulation Failure Model
10% Limit

35
Pre-emptive Replacement Strategy – Age Limit (10% failure)
SAIDI + SAIFI IMPACTS
$0
$10
$20
$30
$40
$50
$60
$70
1 2 3 4 5 6 7 8 9 10 11 12 13 14 15 16
Mill
ions
Year
No Age LimitAge Limit
36
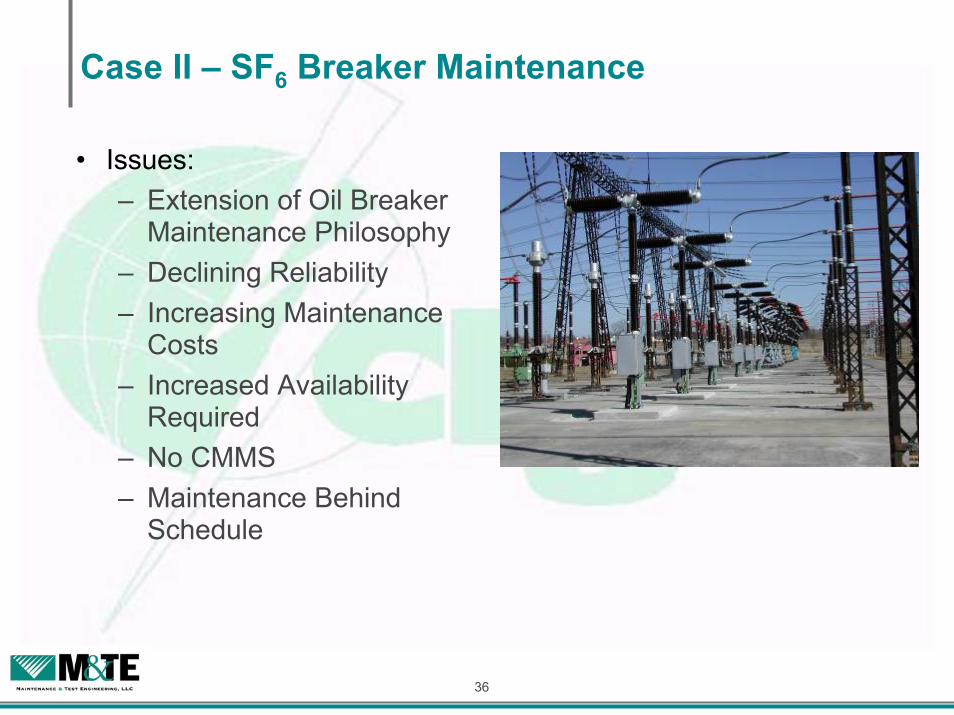
Case II – SF6 Breaker Maintenance
• Issues:– Extension of Oil Breaker
Maintenance Philosophy– Declining Reliability– Increasing Maintenance
Costs– Increased Availability
Required– No CMMS– Maintenance Behind
Schedule
37
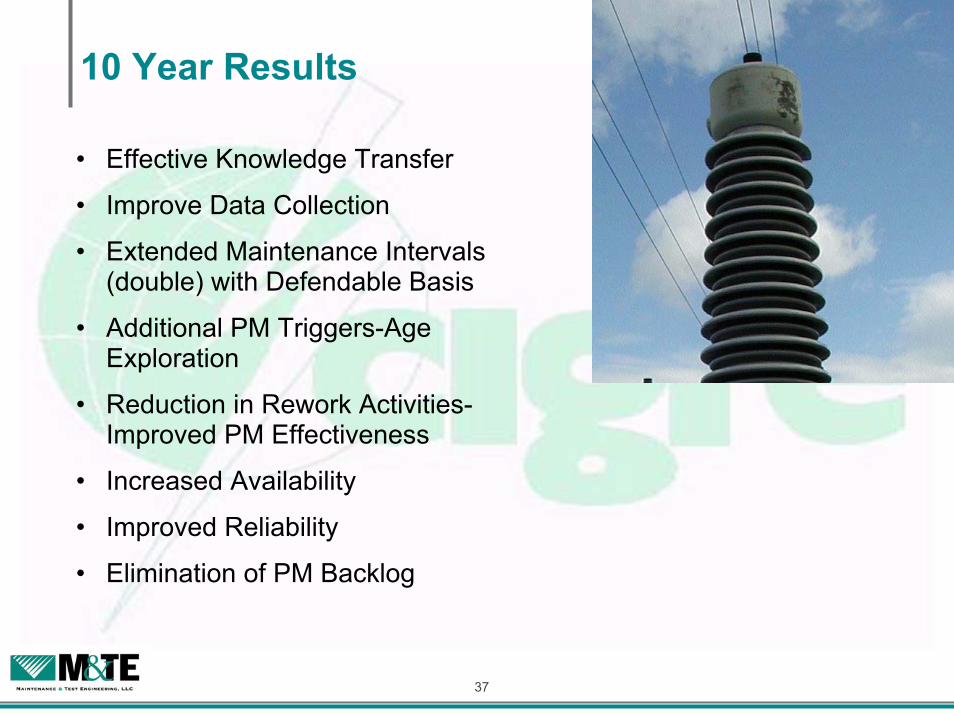
10 Year Results
• Effective Knowledge Transfer
• Improve Data Collection
• Extended Maintenance Intervals (double) with Defendable Basis
• Additional PM Triggers-Age Exploration
• Reduction in Rework Activities-Improved PM Effectiveness
• Increased Availability
• Improved Reliability
• Elimination of PM Backlog

38
SF6 PFM Implementation Results
10 Year Analysis Period
SF6 Breakers(69% of the total population)
More than 10,000 Inspections and Maintenance Tasks
39
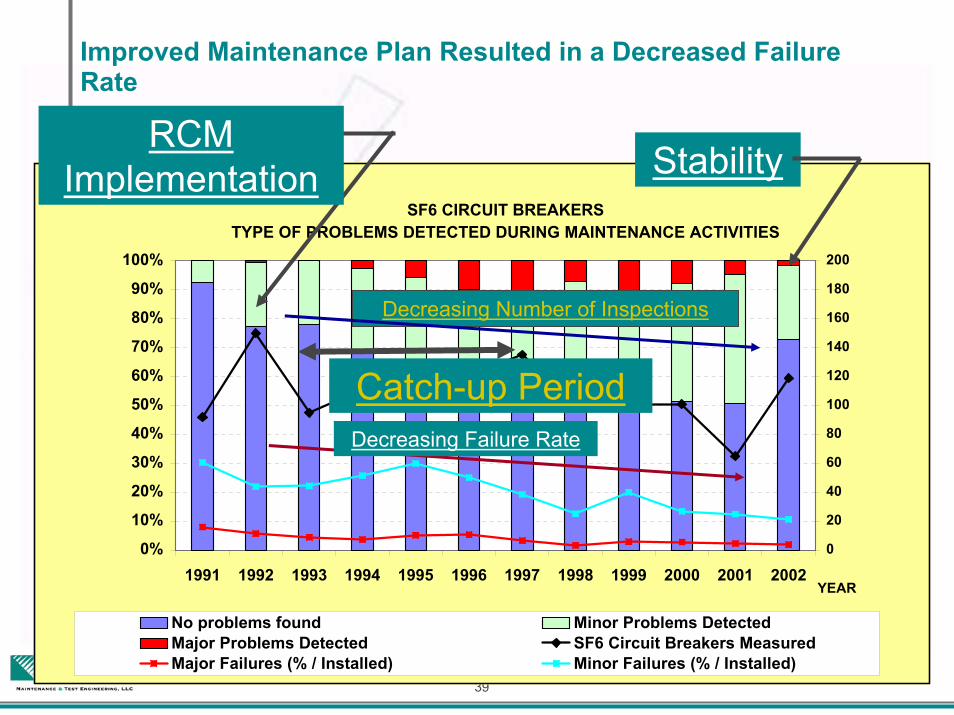
SF6 CIRCUIT BREAKERSTYPE OF PROBLEMS DETECTED DURING MAINTENANCE ACTIVITIES
0%
10%
20%
30%
40%
50%
60%
70%
80%
90%
100%
1991 1992 1993 1994 1995 1996 1997 1998 1999 2000 2001 2002YEAR
0
20
40
60
80
100
120
140
160
180
200
No problems found Minor Problems DetectedMajor Problems Detected SF6 Circuit Breakers MeasuredMajor Failures (% / Installed) Minor Failures (% / Installed)
Decreasing Failure Rate
Decreasing Number of Inspections
Improved Maintenance Plan Resulted in a Decreased Failure Rate
Catch-up Period
StabilityRCM
Implementation

40
S F 6 C IR C U IT B R E A K E R SF IN D IN G S D U R IN G R E V IS IO N S - R E S O L U T IO N O F M IN O R F A IL U R E S
0 %
2 0 %
4 0 %
6 0 %
8 0 %
1 0 0 %
1 9 9 1 1 9 9 2 1 9 9 3 1 9 9 4 1 9 9 5 1 9 9 6 1 9 9 7 1 9 9 8 1 9 9 9 2 0 0 0 2 0 0 1
R e s o lve d d u rin g w o rk s R e s o lve d in s h o rt te rm S c h e d u le fo r n e x t in s p e c tio n
Improvement in Maintenance Effectiveness
Improved Effectiveness
Improved Maint.
Techniques
41
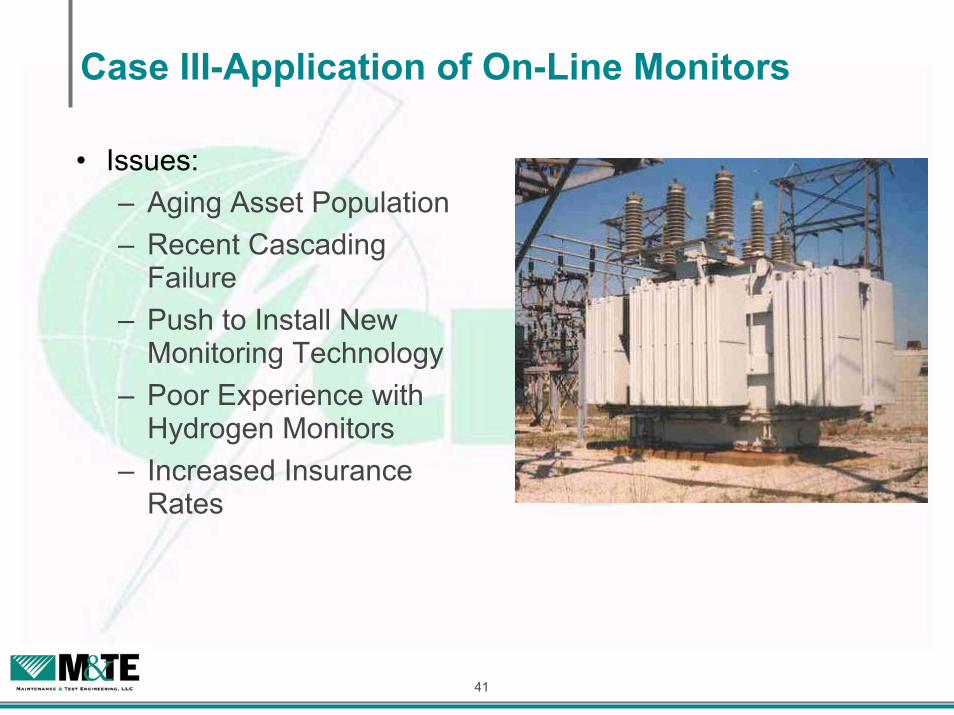
Case III-Application of On-Line Monitors
• Issues:– Aging Asset Population– Recent Cascading
Failure– Push to Install New
Monitoring Technology– Poor Experience with
Hydrogen Monitors– Increased Insurance
Rates
42
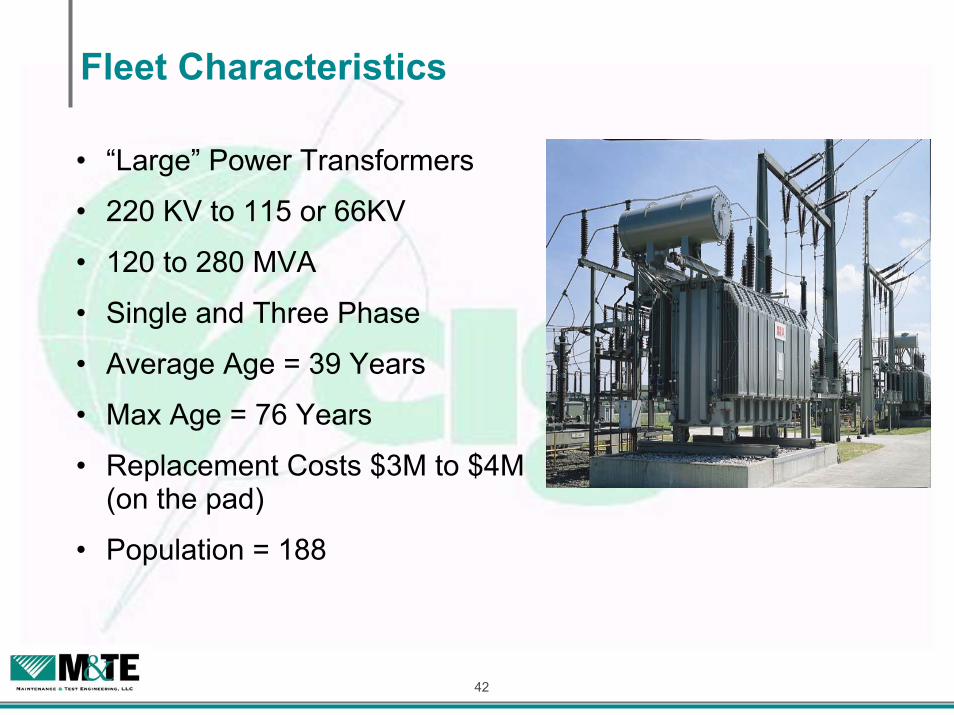
Fleet Characteristics
• “Large” Power Transformers
• 220 KV to 115 or 66KV
• 120 to 280 MVA
• Single and Three Phase
• Average Age = 39 Years
• Max Age = 76 Years
• Replacement Costs $3M to $4M (on the pad)
• Population = 188
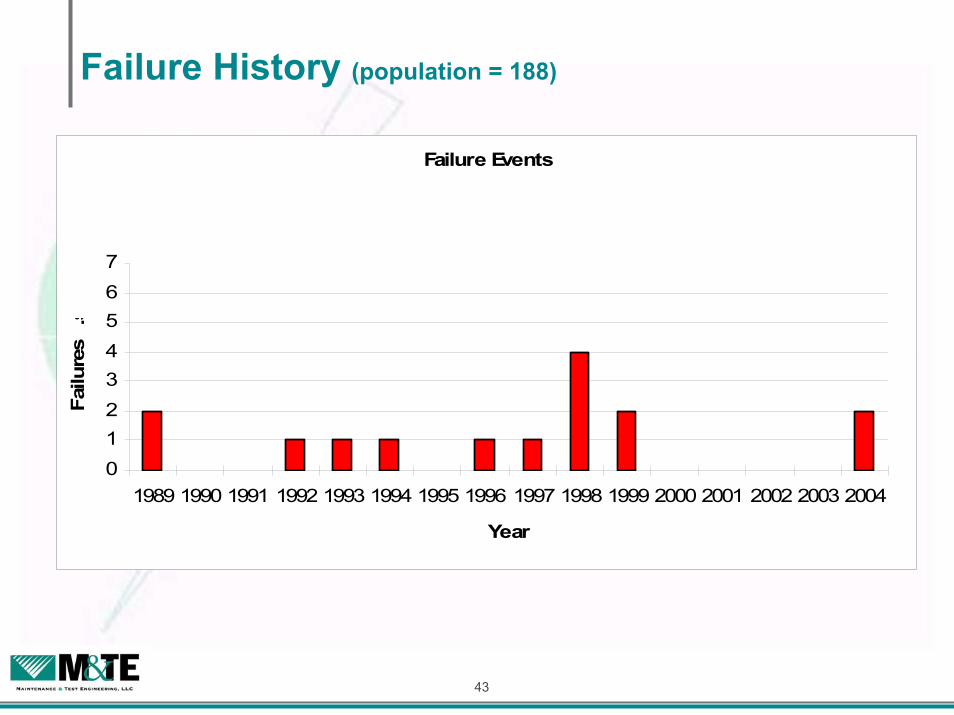
43
Failure History (population = 188)
Failure Events
01234567
1989 1990 1991 1992 1993 1994 1995 1996 1997 1998 1999 2000 2001 2002 2003 2004
Year
Failu
res
.s

44
Age Distribution
A-Bank Age Distribution
01020304050
76-80
66-70
56-60
46-50
36-40
26-30
16-20 6-1
0
Age
0%20%40%60%80%100%
AgeDistribution
AccumulatedPercentage
Median AgeMedian Age
44 years44 years

45
Failures as a Function of Age
A Bank Failures
0
1
2
3
4
5
6
0-5 6-10 11-15 16-20 21-25 26-30 31-35 36-40 41-45 46-50
Age at Time of Failure
Failu
res
0.00%
0.20%
0.40%
0.60%
0.80%
1.00%
1.20%
Rat
e
46
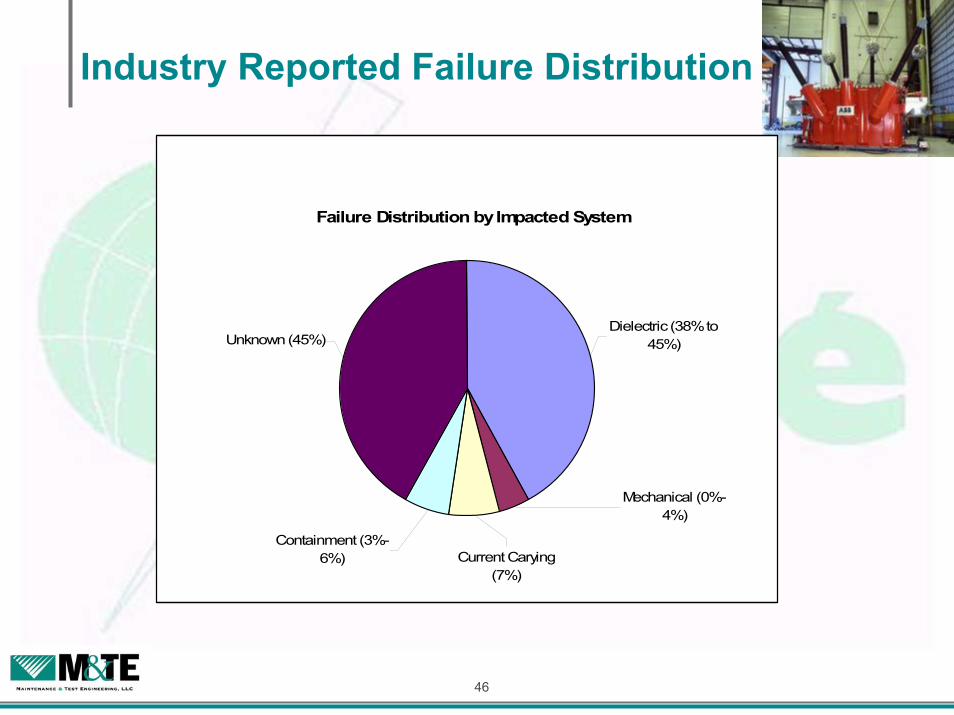
Industry Reported Failure Distribution
Failure Distribution by Impacted System
Unknown (45%)Dielectric (38% to
45%)
Containment (3%-6%) Current Carying
(7%)
Mechanical (0%-4%)

47
Utility Reported Failure and Trouble Distribution
Dielectric46%
External Interface
7%
Electro-magnetic
7%
Voltage Regulating
40%
Problem Occurrence Distribution
NLTC7%
Can't do Maintenance
2%
Accessories12%
Cooling13% Bushings
18%
Inert18%
Leaks19%
None9%
High PF2%
ProblemsFailures On-lineMonitorTarget
48
TimeTime
BathtubBathtub
Failu
re R
ate
Failu
re R
ate
TimeTime
Pronounced Wear outPronounced Wear out
Failu
re R
ate
Failu
re R
ate
TimeTime
Low Initial failure rate with Low Initial failure rate with quick increasequick increase
Failu
re R
ate
Failu
re R
ate
Failu
re R
ate
Failu
re R
ate Gradual Wear outGradual Wear out
TimeTime
TimeTime
Constant Failure RateConstant Failure Rate
Failu
re R
ate
Failu
re R
ate
TimeTime
Decreasing Failure RateDecreasing Failure Rate
Failu
re R
ate
Failu
re R
ate
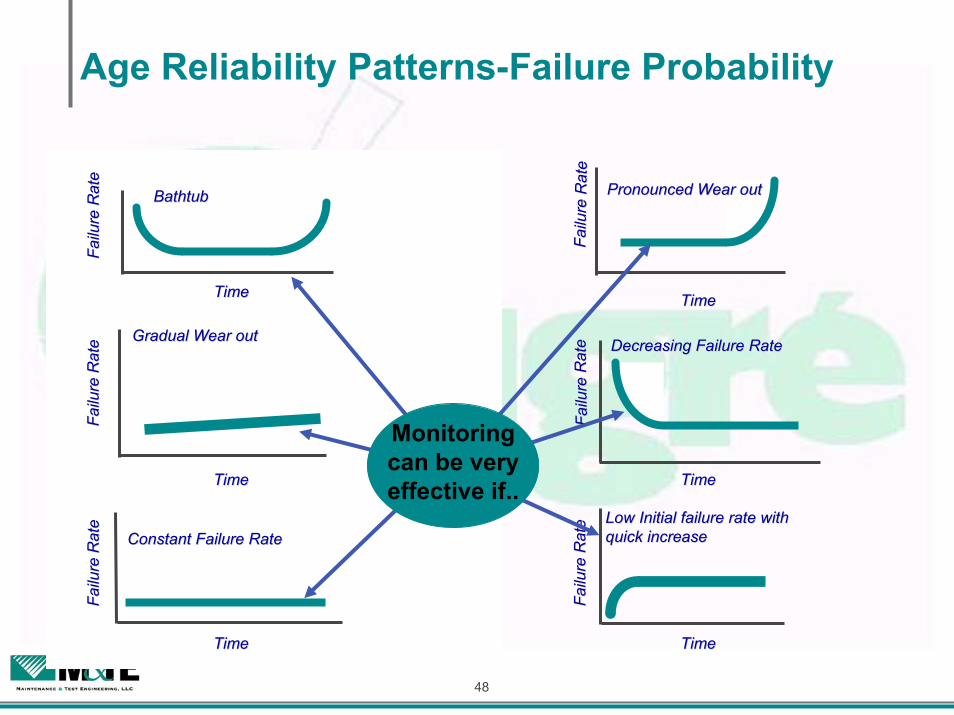
Age Reliability Patterns-Failure Probability
Monitoringcan be veryeffective if..

49
Typical Reliability Predictive Models
Annual Failure Rate
0.0%
0.5%
1.0%
1.5%
1 4 7 10 13 16 19 22 25 28 31 34 37 40 43 46 49 52 55
Year
Linear Failure RateActual
Annual Failure Rate
0.0%
10.0%
20.0%
30.0%
40.0%
50.0%
60.0%
0 3 6 9 12 15 18 21 24 27 30 33 36 39 42 45 48
HSB Failure ModelActual
Annual Failure Rate-Weibull
0.00%
0.50%
1.00%
1.50%
0 4 8 12 16 20 24 28 32 36 40 44 48 52 56
Age
Failure Rate-WeibullActual
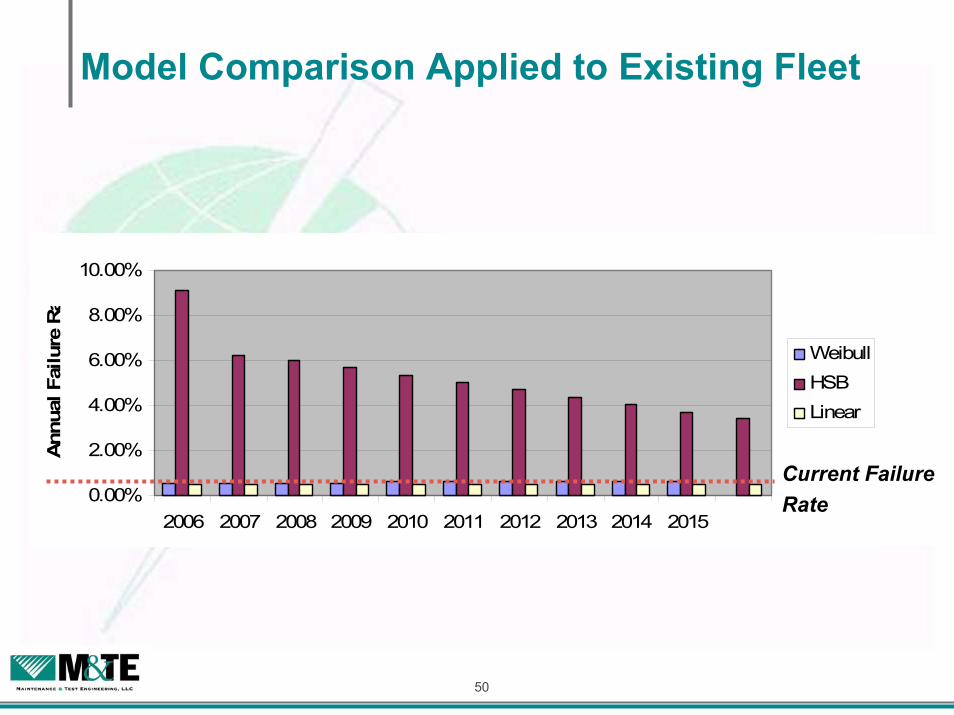
50
Model Comparison Applied to Existing Fleet
0.00%
2.00%
4.00%
6.00%
8.00%
10.00%
2006 2007 2008 2009 2010 2011 2012 2013 2014 2015
Ann
ual F
ailu
re R
a
WeibullHSBLinear
Current FailureRate

51
Failure Mechanisms
0
2
0 5 10 15 20 25
Binary Pattern
Increasing Age
OK
Failed0
2
0 5 10 15 20 25
Intermittant Failure Pattern
Increasing Age
OK
Failed
0
2
0 5 10 15 20 25
Fast Wear Pattern
Increasing Age
OK
Failed
0
2
0 5 10 15 20 25
Slow Wear Pattern
Increasing Age
OK
Failed

52
Incipient Failure Pre-cursor Model
0.0%
20.0%
40.0%
60.0%
80.0%
100.0%
0 2 4 6 8 10 1214 16 18 20 22 24 2628 30 32 34 36 38 40
Months
0.0%1.0%2.0%3.0%4.0%5.0%6.0%7.0%8.0%
Prob
abili
ty o
f Fai
lure
IncrementalProbaility of Failure
CumulativeProbability of Failure
Incipient Failure Model
Incipient Failure Pre-cursor Model
0.0%
20.0%
40.0%
60.0%
80.0%
100.0%
0 2 4 6 8 10 1214 16 18 20 22 24 2628 30 32 34 36 38 40
Months
0.0%1.0%2.0%3.0%4.0%5.0%6.0%7.0%8.0%
Prob
abili
ty o
f Fai
lure
IncrementalProbaility of Failure
CumulativeProbability of Failure
Probability ofSuccessfulDetection
Incipient Failure Pre-cursor Model
0.0%
20.0%
40.0%
60.0%
80.0%
100.0%
0 2 4 6 8 1012 14 16 18 2022 24 26 28 3032 34 36 38 40
Months
0.0%1.0%2.0%3.0%4.0%5.0%6.0%7.0%8.0%
Pro
babi
lity
of F
ailu
re
IncrementalProbaility of Failure
CumulativeProbability of Failure
Probability ofSuccessfulDetection
Mean Time for an incipient fault = 14 mos.
63% Probability of Detection
12 Month DGA Sampling Cycle
53
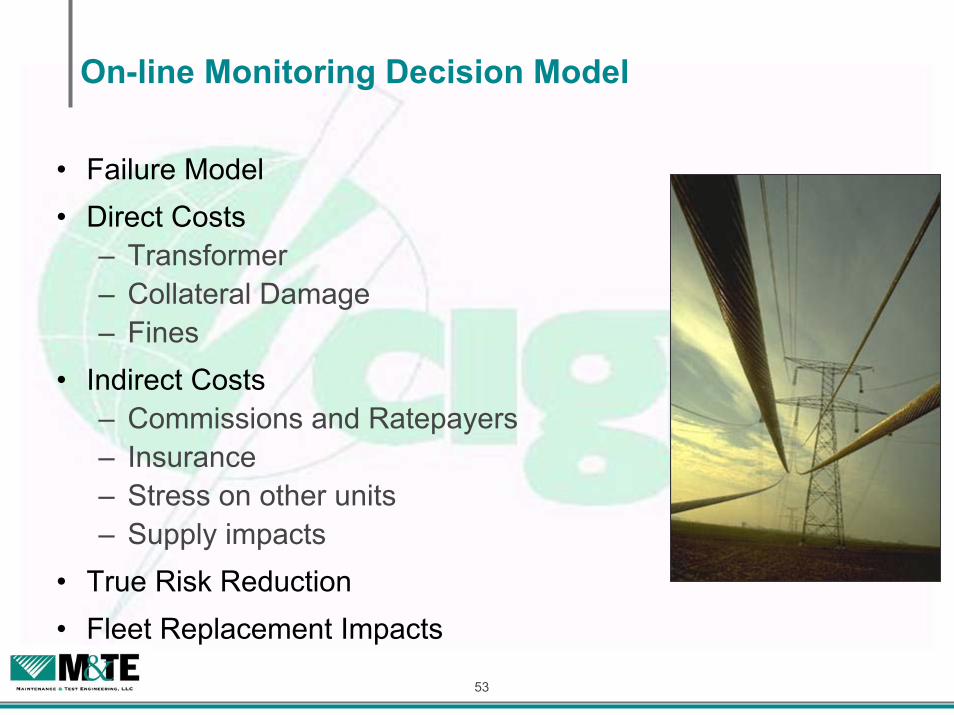
On-line Monitoring Decision Model
• Failure Model• Direct Costs
– Transformer– Collateral Damage– Fines
• Indirect Costs– Commissions and Ratepayers– Insurance– Stress on other units– Supply impacts
• True Risk Reduction• Fleet Replacement Impacts

54
-$250,000
-$200,000
-$150,000
-$100,000
-$50,000
$0
$50,000
$100,000
$150,000
40Years
41Years
42Years
43Years
44Years
45Years
46Years
47Years
48Years
49Years
50Years
51Years
52Years
53Years
54Years
55Years
56Years
57Years
58Years
59Years
2. No Maintenance
Cumulative Cash Flow for Multi-Gas Monitors
-$250,000
-$200,000
-$150,000
-$100,000
-$50,000
$0
$50,000
$100,000
$150,000
40Years
41Years
42Years
43Years
44Years
45Years
46Years
47Years
48Years
49Years
50Years
51Years
52Years
53Years
54Years
55Years
56Years
57Years
58Years
59Years
1. On-line Monitoring 2. No Maintenance
-$250,000
-$200,000
-$150,000
-$100,000
-$50,000
$0
$50,000
$100,000
$150,000
40Years
41Years
42Years
43Years
44Years
45Years
46Years
47Years
48Years
49Years
50Years
51Years
52Years
53Years
54Years
55Years
56Years
57Years
58Years
59Years
1. On-line Monitoring 2. No Maintenance 3. Periodic DGA
-$250,000
-$200,000
-$150,000
-$100,000
-$50,000
$0
$50,000
$100,000
$150,000
40Years
41Years
42Years
43Years
44Years
45Years
46Years
47Years
48Years
49Years
50Years
51Years
52Years
53Years
54Years
55Years
56Years
57Years
58Years
59Years
1. On-line Monitoring 2. No Maintenance5. No Maintenance-On-line Monitoring 3. Periodic DGA4. No Maintenance-Periodic DGA

55
Transformer Fleet Risk Exposure Profiles
$-$2$4$6$8
$10$12
Millions
NoMaintenance
Current PMProgram
Current PM +On-Line DGA
Total Annual "A Bank" Failure Risk
Electro-Magnetic
LTC
Bushing
Transformer Main InsulationSystem
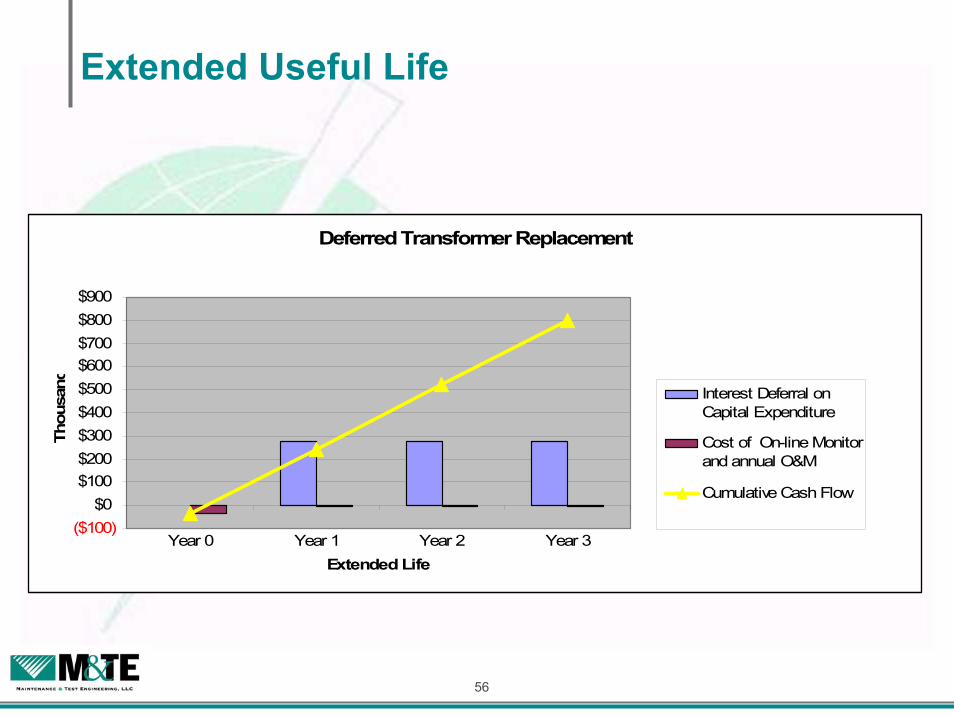
56
Extended Useful Life
Deferred Transformer Replacement
($100)$0
$100$200$300$400$500$600$700$800$900
Year 0 Year 1 Year 2 Year 3
Thou
sand
Extended Life
Interest Deferral onCapital Expenditure
Cost of On-line Monitorand annual O&M
Cumulative Cash Flow
57
Conclusions from PFM Approach:
Substantial benefit can be obtained from installation of multi-gas monitors across a large fleet of power transformers– Improved transformer reliability– Reduced failure impacts– Realization of full transformer useful life– Identification of units in urgent need of
repair/replacement.– Substantial reduction in overall
transformer operating risks
58
Future Trends in Maintenance
• Sharing of Failure and Trouble data– Mode and Cause Level– Demographics
• Application• Type
– Population• Age models vs. Failure Rate
• Full Asset Utilization• Risk Reduction• Key Performance Indicators
– Asset Family– Maintenance Process– Life Cycle Costs
59
Open Discussion and Questions:
Need More Information?
360.352.9977
2037 Berry St. NE
Olympia WA, 98506 USA