making sense of olfaction through predictions of the 3-d
TRANSCRIPT

Chem. Senses 29: 269–290, 2004 DOI: 10.1093/chemse/bjh030
Chemical Senses vol. 29 no. 4 © Oxford University Press 2004; all rights reserved.
Making Sense of Olfaction through Predictions of the 3-D Structure and Function of Olfactory Receptors
Wely B. Floriano, Nagarajan Vaidehi and William A. Goddard III
Materials and Process Simulation Center, MC 139-74, Division of Chemistry and Chemical Engineering, California Institute of Technology, Pasadena, CA 91125, USA
Correspondence to be sent to: William A. Goddard III, Materials and Process Simulation Center, MC 139-74, Division of Chemistry and Chemical Engineering, California Institute of Technology, Pasadena, CA 91125, USA. e-mail: [email protected]
Abstract
We used the MembStruk first principles computational technique to predict the three-dimensional (3-D) structure of six mouseolfactory receptors (S6, S18, S19, S25, S46 and S50) for which experimental odorant recognition profiles are available for a setof 24 odorants (4–9 carbons aliphatic alcohols, acids, bromo-acids and diacids). We used the HierDock method to scan eachpredicted OR structure for potential odorant binding site(s) and to calculate binding energies of each odorant in these bindingsites. The calculated binding affinity profiles are in good agreement with experimental activation profiles, validating thepredicted 3-D structures and the predicted binding sites. For each of the six ORs, the binding site is located between trans-membrane domains (TMs) 3–6, with contributions from extracellular loops 2 and 3. In particular, we find six residue positionsin TM3 and TM6 to be consistently involved in the binding modes of the odorants. Indeed, the differences in the experimentalrecognition profiles can be explained on the basis of these critical residues alone. These predictions are also consistent withmutation data on ligand binding for catecholamine receptors and sequence hypervariability studies for ORs. Based on this anal-ysis, we defined amino acid patterns associated with the recognition of short aliphatic alcohols and mono-acids. Using thesetwo sequence fingerprints to probe the alignment of 869 OR sequences from the mouse genome, we identified 34 ORsequences matching the fingerprint for aliphatic mono-acids and 36 corresponding to the recognition pattern for aliphaticalcohols. We suggest that these two sets of ORs might function as basic arrays for uniquely recognizing aliphatic alcohols andacids. We screened a library of 89 additional molecules against the six ORs and found that this set of ORs is likely to respondto aldehydes and esters with longer carbon chains than their currently known agonists. We also find that compounds associ-ated with the flavor in foods are often among the best calculated binding affinities. This suggests that physiologic ligands forthese ORs may be found among aldehydes and esters associated with flavor.
Key words: biosensors, docking, function prediction, GPCR, G protein coupled receptor, HierDock, mice, olfaction, olfactory receptor, structure prediction, taste, virtual screening
Introduction
Recent advances in the study of the olfactory system haveprovided important information about the mechanismsunderlying odor recognition. We now know that the earlystage in odorant detection involves binding of odor mole-cules to olfactory receptors (ORs), which are expressed inolfactory sensory neurons (OSNs) in the nose (Buck andAxel, 1991; Lancet and Ben-Airie, 1993). Each OSNexpresses only one OR type but a particular OR can respondto multiple odorants, while a particular ligand can elicitresponse from multiple ORs, leading to unique combina-tions of ORs for each odorant (Krautwurst et al., 1998;Malnic et al., 1999). ORs are members of the rhodopsin-likeclass of G protein coupled receptors (GPCR), which alsoincludes catecholamine receptors, and their three-dimen-
sional structure contains the seven helical transmembrane(TM) motif characteristic of GPCRs (Mombaerts et al.,1996). The ORs share sequence fingerprints not seen in otherGPCRs and their higher sequence variability is consistentwith the ability to recognize structurally diverse odorants(Buck and Axel, 1991). Each OR interacts with a variety ofstructurally diverse odor molecules, in contrast to othermembers of the GPCR family such as the receptors fordopamine, histamine and serotonin, which are narrowlytuned to one or a few closely related agonists (Bozza andKauer, 1998; Krautwurst et al., 1998; Zhao et al., 1998;Duchamp-Viret et al., 1999; Malnic et al., 1999; Mori et al.,1999; Rubin and Katz, 1999).

270 W.B. Floriano et al.
Bioinformatic analyses of genome sequence databasesindicate that mice have ∼1200 different ORs (Zhang andFirestein, 2002), while humans have ∼350 (Glusman et al.,2000; Zozulya et al., 2001). The combinatorial nature ofodor recognition explains how humans can detect anddistinguish an immense number and variety of odorantsusing only 350 distinct ORs. ‘Families’ of ORs, whosemembers have >40% protein sequence identity appearlargely to be common to both species (Zhang and Firestein,2002).
In order to learn more about the function of GPCRs, wedeveloped the MembStruk computational technique topredict the three-dimensional (3-D) structure of theseproteins and we developed the HierDock computationaltechnique to predict the binding site and binding energy ofligands to GPCRs (Floriano et al., 2000; Vaidehi et al.,2002). These methods have previously been applied topredict the binding site for epinephrine to adrenergicreceptor (Vaidehi et al., 2002), for dopamine to dopaminereceptor (Vaidehi et al., 2002) and for alcohols to the S25mouse OR (Floriano et al., 2000). Particularly for epine-phrine and dopamine, detailed mutation and binding studiesprovide strong evidence for the accuracy of the predicted 3-D structure.
In an earlier work (Floriano et al., 2000), we used compu-tational modeling to build a 3-D structure for OR S25shown experimentally by Malnic et al. (1999) to bindhexanol and heptanol. The calculated binding affinityprofile for a C4–C9 linear alcohol series suggests that it is thepattern of structural features rather than the specific molec-ular structure that triggers recognition. We found that thebinding site of hexanol and heptanol in OR S25 involves thehelical domains TM3, TM4, TM5 and TM6, which isconsistent with earlier computational work on rat I7receptor (Singer, 2000) and with mutation studies forbinding of dopamine and epinephrine in biogenic aminereceptors (Strader et al., 1994; Shi and Javitch, 2002;Bissantz et al., 2003). Residues we found to be involved inbinding in S25 (Floriano et al., 2000) were previouslyproposed on the basis of high variability among ORs to beinvolved in odorant binding (Malnic et al., 1999; Pilpel andLancet, 1999).
In this paper we report the predicted structures of six ORsstudied by Malnic et al. (1999). We also report the predictedbinding sites of the 24 aliphatic odorants they studied exper-imentally and calculated their relative binding energies toeach OR. We find quite good agreement between thepredicted binding profiles and the experimental activationprofiles.
We also screened a library of 89 additional moleculesagainst the six ORs and found that compounds associatedwith the flavor in mouse foods appear often among the bestbinders. This suggests that ORs function partly to identifynutrients-rich foods.
Materials and methods
We built 3-D structures for six mice (S6, S18, S19, S25, S46and S50) olfactory receptors (ORs) studied experimentallyby Malnic et al. (1999) who measured recognition profilesfor a systematic library of 24 aliphatic alcohols and acids(each with 4–9 carbons). Of the 14 ORs studied by Malnic etal. (1999), we selected six with complete amino acidsequences.
After predicting each OR structure, we used the HierDockprocedure to first scan the receptors for potential bindingsite(s) and then to dock the ligands into the putative bindingsite and predict their binding energies. The steps of 3-Dstructure prediction, scanning for possible binding sites andbinding of ligands were performed independently to eachOR, with no assumptions or constraints being carried fromone OR to another. We compared the predicted affinityprofiles for the set of 24 odorants to the known experimentalresponse and found good correlation. We then screened alibrary of 89 additional molecules against the six ORs.
Ligand/odorant structure building
We considered the two libraries of ligands shown in Table 1.List A consists of the 24 aliphatic acids, alcohols, diacidsand bromoacids (each with 4–9 carbons) tested experimen-tally by Malnic et al. (1999). List B contains an additional 89molecules including common odorants, molecules that areodorless to humans, tastants, glucose and some molecules ofpotential biodefense interest. We included tastants in this listto examine how tastants might affect ORs. Comparing thebinding affinities of such tastants as sugars (which arenatural agonists of the functionally related taste receptors,also members of the GPCR family) against ORs couldprovide insights into how function diversity evolved amongthe chemosensory receptors and more generally in theGPCR family.
Three-dimensional structures for all molecules in Table 1were built as follows.
1. Chemical structures were drawn using the programISISDRAW (MDL Information Systems Inc., 2001)and saved in the two-dimensional (2-D) ‘mol’ format.
2. The program Stereoplex 1.2 (Tripos Inc., 2001) was usedto generate all stereoisomers, whenever applicable.
3. We used the 2-D structures from (1) and (2) and theprogram Concord version 1.2 (Tripos Inc. 2001) togenerate 3-D structures, add hydrogens and assignGasteiger atomic charges to each molecule. Acids,diacids and bromoacids were assigned a formal chargeof –1.0 to each carboxyl group.
4. The starting structures from (3) were optimized byconjugate gradient minimization of the potential energyusing the Dreiding force field (Mayo et al., 1990) withGasteiger (Gasteiger and Marsili, 1980) charges. Thestructures were minimized (to an RMS force of 0.2 kcal/mol/Å) and used as starting conformations in HierDock

Olfaction and Olfactory Receptor Structure and Function 271
for locating the putative binding site of odorants in the3-D structure of each OR and to determine their bindingconfiguration and energy. The solvation energies for the
odorants were calculated using the analytical volumegeneralized born (AVGB) continuum solvationapproach (Zamanakos, 2002).
Table 1 Ligands for which we have calculated binding sites and binding energies to the six OR’s in the present study
Column 1 (hereafter referred to as Table 1A) is the list of 24 odorants for which Malnic et al. (1999) measured experimental response. The other three columns contain common odorants and tastants plus some molecules related to bioterrorism.
A. Known experimental response
B. Common odorants and others
Butanol 1-Decanol Furaneol Undecanal
Pentanol 2,3,5,6-Tetramethylpyrazine Furaneol glucoside Valeraldehyde
Hexanol 2,3,5-Trimethylpyrazine Geraniol Valerophenone
Heptanol 2,3-Dimethylpyrazine Heptanal 2-Aminoacetophenone
Octanol 2,4-Dimethylacetophenone Hexanal Citric acid
Nonanol 2,5-Dimethylpyrazine Hexyl octanoate Pyruvic acid
Butyric acid 2-Ethyl-3,5(6)-dimethylpyrazine Isoamyl nonanoate Piperidine
Valeric acid 2-Ethyl-3-methoxypyrazine Isobutyric acid Piperine
Hexanoic acid 2-Ethyl-3-methylpyrazine Isopropyl hexanoate 1-Propyldisulfanyl-propane
Heptanoic acid 2-Ethyl-5(6)-methylpyrazine Isopulegol Skatole
Octanoic acid 2-Ethylpyrazine Lilial Hexahydro-1, 3, 5-trinitro-1, 3, 5-triazine (rdx)
Nonanoic acid 2-Hexanone (+)-Linalool Octahydro-1,3,5,7-tetranitro-1,3,5,7-tetrazocine (hmx)
Succinic acid 2-Isobutyl-3-methoxypyrazine Citral Dichloro(trans-2-chlorovinyl)arsine (Lewisite)
Glutaric acid 2-Isopropyl-3-methoxypyrazine Citronellal 2,2′-Dichlorodiethyl sulfide (mustard gas)
Adipic acid Methyl-2-ethylbutyrate Decanal S-(+)-Carvone
Pimelic acid 2-Methoxy-3-methylpyrazine Dodecanal Trans-cinnamaldehyde
Suberic acid 2-Methoxypyrazine Ethyl acetoacetate Glucose
Azelaic acid 2-Methylpyrazine Ethyl butyrate 3-Methyl-1-butane-1-thiol
4-Bromobutyric acid Methyl-2-methylbutyrate Ethyl isobutyrate Pyridine
5-Bromovaleric acid 2-Octanone (–)-Linalool Tridecanal
6-Bromohexanoic acid 2-Phenylethanol Lyral b-Terpineol
7-Bromoheptanoic acid 2-Sec-butyl-3-methoxypyrazine (D,L)-Menthone Butyraldehyde
8-Bromooctanoic acid 2-Sec-butylcyclohexanone (D,D)-Menthone Butyrophenone
9-Bromononanoic acid Ethyl vanillin (L,L)-Menthone Eucalyptol
3-Heptanol (L,D)-Menthone Ethyl salicylate
Iso-amyl alcohol Mesifurane Eugenol
3-Phenyl-1-propanol Methyl isobutyrate Beta-ionone
Estragole Methyl nonanoate Salicylic acid
5-Hydroxy-tetradecanoic acid Methyl octanoate
Ethyl isoamyl ketone Nonanal
Acetoin Octanal
Acetone Phenylethylamine
Acetophenone Propiophenone
Benzaldehyde R-(–)-carvone

272 W.B. Floriano et al.
Building the 3-D structure of ORs
The 3-D structure of each ORs was predicted using theMembStruk 1.0 procedure as detailed in Floriano et al.(2000). The main steps in the MembStruk procedure are asfollows.
1. Predict the TM regions using hydropathicity analysis(Donnelly, 1993) combined with input from multi-sequence profiles calculated using the Eisenberg hydro-phobicity scale (Eisenberg et al., 1984). The sequencealignment profile is obtained from the sequence analysisfor the set of ORs described in Floriano et al. (2000).The TM regions are assigned using the hydropathicityprofiles and capping rules based on known helix breakerresidues (Pro, Gly and charged residues). The averagehydrophobicity at each sequence position is calculatedover window sizes from 12 to 20, until seven peaks canclearly be identified in the profile. The sequence align-ment showing the predicted TMs as well as the residueswe find to be involved in odorant binding is given inFigure 4 and will be discussed in the results section.
2. Construct canonical right-hand α-helices for thepredicted TM segments and add counterions Cl– andNa+ to neutralize charges in Lys, Arg, Glu and Asp resi-dues. Optimize these individual helices using conjugategradients energy minimization followed by 200 ps oftorsional dynamics using the NEIMO (Newton–Eulerinverse mass operator) torsional molecular dynamicsmethod (Mathiowetz et al., 1994; Vaidehi et al., 1996) at300K, which fixes bonds and angles. This allows thehelix to distort and bend in response to helix breakerssuch as proline and also optimize the side-chain confor-mations.
3. Identify lipid-accessible residues from analysis of theperiodicity of the hydrophobic residues (Donnelly,1993) in the sequence.
4. Assemble the helix bundle as follows. The helical axeswere oriented according to the 7.5 Å electron densitymap of frog rhodopsin (Schertler, 1998). Although thereare high resolution structures available for rhodopsin(Okada et al., 2002; Teller et al., 2001; Palczewski et al.,2000), we used this low resolution one because we onlywanted the orientations of the helical axes (not atomiccoordinates) to build an initial template bundle. Thehelices were then rotated to orient their hydrophobicmoments to the outside of the helix barrel. We thenadded an explicit lipid bilayer of 52 molecules of dilau-roylphosphatidyl choline to simulate the membrane.This lipid–TM bundle was minimized to an RMS forceof 0.2 kcal/mol/Å.
5. Further optimize the lipid-TMs bundle for 100 ps usingconstant temperature rigid body molecular dynamics(RBMD) at 300K.
6. Construct disulfide bridges as described below and addintracellular and extracellular connecting loops usingthe software WHATIF (Vriend, 1990).
7. Energy minimize the entire lipid-TM bundle using thesurface generalized born (SGB; Ghosh et al., 1998)continuum solvent method (we used dielectric constantof 60.0 to simulate the dielectric region surrounding themembrane).
All calculations were carried out with Dreiding force field(Mayo et al., 1990) using CHARMM22 (MacKerell et al.,1998) charges for the protein.
ORs have four highly conserved cysteines believed to formdisulfide bridges (Floriano et al., 2000). One of theconserved Cys is located in the extracellular loop 1 (EC1)and the other three are located in the extracellular loop 2(EC2). Mutation analysis (Singer et al., 1996) and trunca-tion experiments (Gimelbrant et al., 1999) suggest that theEC1 Cys is paired to the second Cys in EC2 and that the firstand third Cys in EC2 are bound together. These correspondto Cys127–Cys209 and Cys199–Cys219 in the amino acidsequence of S25. Disulfide bridges in the loop regionincrease the confidence in the modeled loop structure sincethey restrict the loops conformational space. However,because of their high flexibility, loops are still the part of thestructure with the least degree of confidence in our structurepredictions.
There is one additional highly conserved Cys located inTM6 that is unpaired in all six predicted structures (in S25this is Cys 241). S25 and S19 have additional disulfidebridges (S25: Cys132–Cys192 and Cys157–Cys171; S19:Cys60–Cys102, Cys92–Cys274 and Cys155–Cys176), all ofwhich were assigned by mutation analysis (Singer et al.,1996) and assumed in our calculations. S18 (Cys105–Cys187and Cys177–Cys197) and S46 (Cys99–Cys181 and Cys171–Cys191) have only the two highly conserved disulfide bonds.S50 and S6 have the two conserved linkages (Cys101–Cys183 and Cys173–Cys193) plus an extra disulfide bondbetween Cys116 and Cys289. S6 and S50 have three Cys(Cys76, Cys116, and Cys289) located about half-way intothe barrel on TMs 2, 3 and 7 that could potentially pair inany combination, consequently pulling two of the threehelices closer to each other. Our predicted structures for S50and S6 place the pair Cys116–Cys289 close enough to forman SS bond in the final structures and hence we made thisbond.
The 3-D structure for S25 used in our previous publication(Floriano et al., 2000) was improved by correcting somechirality problems not detected in the original structure. Thebinding profile of the odorants for S25 was re-calculatedusing the HierDock protocol reported here, which is consid-erably improved from the previous procedure (Floriano etal., 2000).

Olfaction and Olfactory Receptor Structure and Function 273
Predicting function for the ORs
Since there is no experimental information on the location ofthe binding site of the odorants, we used ScanBindSite (avariation of HierDock) to scan the entire receptor structureto locate the binding site of each odorant to each OR. Noassumption was made on the nature or the location of thebinding site in these receptors. Once the binding site wasdetermined, we applied HierDock to this putative bindingsite to predict the best binding configuration and energy foreach odorant in this site.
Scanning for a putative binding site (ScanBindSite)
Scanning of each OR for an energetically favorable bindingregion was performed as follows.
We partitioned the empty volume suitable for docking ineach OR structure into 4–13 (depending on the size of theempty volume) small overlapping regions. A modifiedversion of HierDock (called ScanBindSite) was used to inde-pendently dock the 24 ligands into each region. Rigiddocking of each ligand into each docking region wasperformed using the program Dock 4.0 (Ewing and Kuntz,1997). The maximum number of docked orientations was setto 100. Each configuration was torsion minimized. We usedthe option for bump filter (four bumps), energy scoring andautomated matching with no anchor search in the Dock 4.0code.
The configurations with the 10 best Dock 4.0 scores wereselected for each ligand in each region. Each of these config-urations (240 per region) was then energy minimized for 80steps while keeping the protein coordinates fixed. We theneliminated any configuration whose molecular surface was<70% buried into the receptor and selected the lowest energyconfiguration for each ligand in each region. For each ORthere was one region where most of the selected configura-tions cluster together. This region was then selected as thebinding site. No presumption was made on the nature or thelocation of the binding site in these receptors.
Calculating binding energy profiles using the HierDock protocol
We used the HierDock protocol to predict the structures ofthe odorant/OR bound complexes and to estimate theirbinding affinities. HierDock has been validated for otherORs (Floriano et al., 2000), other GPCRs (Vaidehi et al.,2002) and for globular proteins (Wang et al., 2002; Datta etal., 2003; Kekenes-Huskey et al., 2003). The main steps ofthe HierDock protocol are as follows.
1. Define docking region. We run HierDock twice for eachOR. In the first pass, the docking region for each targetprotein is defined as the location found in the ScanBind-Site step. For the second HierDock pass, the dockingregion is redefined using the best known positive from
the first pass. The new binding region is defined as the1 Å around the selected known positive and all theligands are re-docked into this narrower binding region.
2. Protein grid calculation. The docking step uses an energygrid for the protein contribution to the interactionenergy. This grid is calculated only once per target, usingthe program Grid provided as part of the Dock 4.0(Ewing and Kuntz, 1997) package.
3. Level 0. Generation of docked configurations of eachligand into the binding site of the target protein usingthe program Dock 4.0 (Ewing and Kuntz, 1997). Weused the options for flexible docking, torsion drive on,energy scoring, 75% reduced van der Waals parametersfor ligands, minimization before scoring and 1000maximum scored configurations. The 500 best configur-ations by Dock 4.0 scores for each ligand in the librarywere saved and used in subsequent steps.
4. Filter. A combined criterion of differential solvation andlevel 0 scores (Dock 4.0 energies) was applied to the 500configurations per ligand from level 0. We eliminatedconfigurations with <75% of buried surface and thosehaving energy >100 kcal/mol. The best 50 configura-tions per ligand were carried to next step.
5. Level 1. For each of the 50 configurations per ligandsurviving filter step 4, we used the Dreiding FF withCHARMM22 charges for protein and Gasteigercharges for ligand to minimize the structure of eachligand (gas phase) for (100 steps) using fixed proteincoordinates. The best five configurations by energy wereselected for each ligand.
6. Level 2. For each of the five configurations per ligandfrom level 1, we used the Dreiding FF to minimize thestructure of the ligand–protein complex for 100 steps,allowing all atoms of the protein to move. The bestconfiguration by energy was selected for each ligand.
7. Ranking. The complexes from level 2 were scored bysingle point energy calculation including solvation usingthe AVGB (Zamanakos, 2002) continuum solvationmethod with fixed protein (this gives the energy of theligand in the field of the protein) using a dielectricconstant of 2.5. In addition, we calculated the energyincluding solvation of the free ligand in its dockedconformation. The dielectric constant used for non-bonded interactions was 1.0, while the dielectricconstant for the continuum solvation calculation was setto 78.2 for exterior regions and 1.3 for the interiorregion. The binding energies were calculated as thedifference in the energies of the ligand in protein andligand in water [BindE = E(bound_ligand_in_protein) –E(free_ligand_in_water)]. The ligand list was thengrouped according to the main chemical functionalgroup and sorted by binding energies.
274 W.B. Floriano et al.
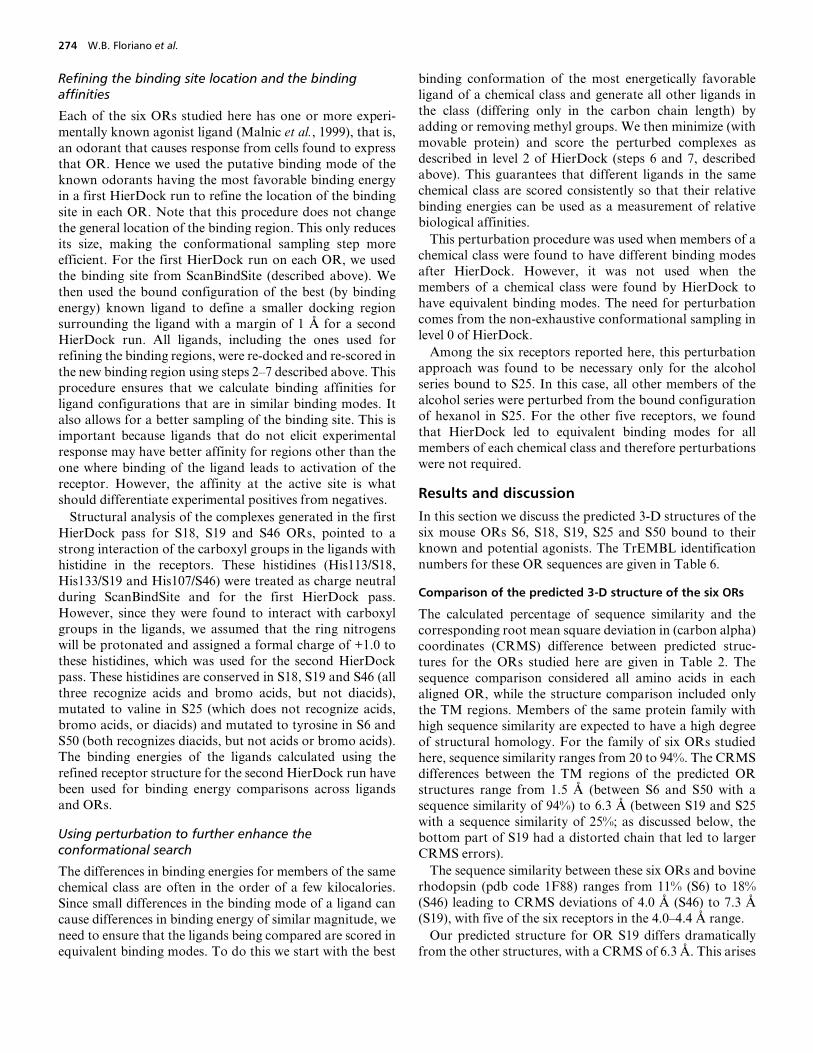
Refining the binding site location and the binding affinities
Each of the six ORs studied here has one or more experi-mentally known agonist ligand (Malnic et al., 1999), that is,an odorant that causes response from cells found to expressthat OR. Hence we used the putative binding mode of theknown odorants having the most favorable binding energyin a first HierDock run to refine the location of the bindingsite in each OR. Note that this procedure does not changethe general location of the binding region. This only reducesits size, making the conformational sampling step moreefficient. For the first HierDock run on each OR, we usedthe binding site from ScanBindSite (described above). Wethen used the bound configuration of the best (by bindingenergy) known ligand to define a smaller docking regionsurrounding the ligand with a margin of 1 Å for a secondHierDock run. All ligands, including the ones used forrefining the binding regions, were re-docked and re-scored inthe new binding region using steps 2–7 described above. Thisprocedure ensures that we calculate binding affinities forligand configurations that are in similar binding modes. Italso allows for a better sampling of the binding site. This isimportant because ligands that do not elicit experimentalresponse may have better affinity for regions other than theone where binding of the ligand leads to activation of thereceptor. However, the affinity at the active site is whatshould differentiate experimental positives from negatives.
Structural analysis of the complexes generated in the firstHierDock pass for S18, S19 and S46 ORs, pointed to astrong interaction of the carboxyl groups in the ligands withhistidine in the receptors. These histidines (His113/S18,His133/S19 and His107/S46) were treated as charge neutralduring ScanBindSite and for the first HierDock pass.However, since they were found to interact with carboxylgroups in the ligands, we assumed that the ring nitrogenswill be protonated and assigned a formal charge of +1.0 tothese histidines, which was used for the second HierDockpass. These histidines are conserved in S18, S19 and S46 (allthree recognize acids and bromo acids, but not diacids),mutated to valine in S25 (which does not recognize acids,bromo acids, or diacids) and mutated to tyrosine in S6 andS50 (both recognizes diacids, but not acids or bromo acids).The binding energies of the ligands calculated using therefined receptor structure for the second HierDock run havebeen used for binding energy comparisons across ligandsand ORs.
Using perturbation to further enhance the conformational search
The differences in binding energies for members of the samechemical class are often in the order of a few kilocalories.Since small differences in the binding mode of a ligand cancause differences in binding energy of similar magnitude, weneed to ensure that the ligands being compared are scored inequivalent binding modes. To do this we start with the best
binding conformation of the most energetically favorableligand of a chemical class and generate all other ligands inthe class (differing only in the carbon chain length) byadding or removing methyl groups. We then minimize (withmovable protein) and score the perturbed complexes asdescribed in level 2 of HierDock (steps 6 and 7, describedabove). This guarantees that different ligands in the samechemical class are scored consistently so that their relativebinding energies can be used as a measurement of relativebiological affinities.
This perturbation procedure was used when members of achemical class were found to have different binding modesafter HierDock. However, it was not used when themembers of a chemical class were found by HierDock tohave equivalent binding modes. The need for perturbationcomes from the non-exhaustive conformational sampling inlevel 0 of HierDock.
Among the six receptors reported here, this perturbationapproach was found to be necessary only for the alcoholseries bound to S25. In this case, all other members of thealcohol series were perturbed from the bound configurationof hexanol in S25. For the other five receptors, we foundthat HierDock led to equivalent binding modes for allmembers of each chemical class and therefore perturbationswere not required.
Results and discussion
In this section we discuss the predicted 3-D structures of thesix mouse ORs S6, S18, S19, S25 and S50 bound to theirknown and potential agonists. The TrEMBL identificationnumbers for these OR sequences are given in Table 6.
Comparison of the predicted 3-D structure of the six ORs
The calculated percentage of sequence similarity and thecorresponding root mean square deviation in (carbon alpha)coordinates (CRMS) difference between predicted struc-tures for the ORs studied here are given in Table 2. Thesequence comparison considered all amino acids in eachaligned OR, while the structure comparison included onlythe TM regions. Members of the same protein family withhigh sequence similarity are expected to have a high degreeof structural homology. For the family of six ORs studiedhere, sequence similarity ranges from 20 to 94%. The CRMSdifferences between the TM regions of the predicted ORstructures range from 1.5 Å (between S6 and S50 with asequence similarity of 94%) to 6.3 Å (between S19 and S25with a sequence similarity of 25%; as discussed below, thebottom part of S19 had a distorted chain that led to largerCRMS errors).
The sequence similarity between these six ORs and bovinerhodopsin (pdb code 1F88) ranges from 11% (S6) to 18%(S46) leading to CRMS deviations of 4.0 Å (S46) to 7.3 Å(S19), with five of the six receptors in the 4.0–4.4 Å range.
Our predicted structure for OR S19 differs dramaticallyfrom the other structures, with a CRMS of 6.3 Å. This arises

Olfaction and Olfactory Receptor Structure and Function 275
from TM 4 in S19, which is unraveled in the bottom one-third (C terminus). This probably resulted from an early badcontact in the helix optimization steps, but we did not goback to re-examine it because the intracellular C terminus isnot expected to be involved in direct binding of the ligand.
The CRMS differences found for the six ORs can becompared with that found in sets of homologous proteinsincluding globins, serine proteases and immunoglobulins(Chothia and Lesk, 1986). Sequence identities in the 20–50%range translate to structural differences between 1 and 2 Å.This agrees with the accuracy found for structures of glob-ular proteins predicted using homology methods for caseswith 50% sequence similarity (Marti-Renom et al., 2002).
The MembStruk structure prediction algorithm forGPCRs uses only sequence information combined to phys-ical principles to predict the 3-D structure. This leads toindependent unbiased predictions for each of the six ORs.The advantage of this approach is that mistakes made on amodel will not pass to models generated from it and theproblems that come with aligning low homology sequencesare avoided. However, this brings the disadvantage thatstructures of the same family may differ from each othermore that they should because of the statistical nature of ourapproach. We plan to apply homology methods to predictthe other five ORs from each of our predicted structures.Such methods might be used to obtain several predictedstructures that could be averaged in some way to providemore accurate structures than can be derived solely fromindependent MembStruk runs.
Predicted odorant recognition profiles for the six ORs
Table 3 and Figure 1a–f show the binding energies predictedfor the series of 24 odorants for which odorant activationprofiles were determined experimentally (Malnic et al.,1999). It is important to note that the calculated bindingenergy is a necessary but not sufficient condition for activa-tion of the receptor. Some odorants may bind to the receptorbut may not activate it. In Figure 1a–f odorants that activateexperimentally cells from where the ORs were isolated arefully shaded. Odorants not tested experimentally againstcells expressing a particular OR are half shaded. Odorantstested and found not to cause activation are not shaded.Each odorant family is ordered with C4 at the left and C9 atthe right.
The calculated recognition profiles for S50 (Figure 1a) andS6 (Figure 1b) clearly identify aliphatic diacids as the bestodorant binding class for both receptors, which is amplyconfirmed by the experiments. Within the diacids class, theligand with the most favorable calculated binding affinityfor S50, azelaic acid (C9 diacid), is the only odorantobserved to elicit response experimentally out of the 24odorants. The predicted odorant binding energy profile forS6 (Figure 1b) is also in good agreement with the experi-mental profile in terms of the chemical class identified bythis OR. Also, the predicted best ligand (by binding energy),azelaic acid (C9 diacid), is one of the two odorant agonistsobserved experimentally. However, the theory predicts thatthe second experimental positive (the C8 diacid suberic acid)is the third highest (more negative) binding energy while the
Table 2 Sequence and structural relationship among the six mouse olfactory receptors studied here
The percentage sequence similarity is given in each row followed by CRMS difference (Å) of the Cα atoms in the TM regions. Both provide a measure of the structural similarities between the various predicted OR structures. The CRMS was calculated for the 119 structurally equivalent residues in the superimposed OR structures.
OR Targeted chemical class Percentage homology
S6 S50 S19 S18 S46 S25
S6 Diacids Seq. 100 94 30 35 34 23
Struct. 0.0 1.5 5.7 2.4 1.8 3.0
S50 Diacids Seq. 94 100 32 35 34 24
Struct. 1.5 0.0 5.8 2.6 2.3 3.1
S19 Acid, bromo-acid, alcohol Seq. 30 32 100 48 45 25
Struct. 5.7 5.8 0.0 6.1 5.6 6.3
S18 Acid, bromo-acid, alcohol Seq. 35 35 48 100 52 27
Struct. 2.4 2.6 6.1 0.0 2.0 3.2
S46 Acid, bromo-acid Seq. 34 34 45 52 100 27
Struct. 1.8 2.3 5.6 2.0 0.0 2.8
S25 Alcohol Seq. 23 24 25 27 27 100
Struct. 3.0 3.1 6.3 3.2 2.8 0.0
Rhodopsin Aldehyde Seq. 11 12 15 13 18 12
Struct. 4.2 4.4 7.3 4.4 4.0 4.3

276 W.B. Floriano et al.
second best calculated binding energy (the C7 diacid pimelicacid) was not observed experimentally. However, subericacid elicited only a weak response in the experiments(Malnic et al., 1999) and it is possible that pimelic acid couldelicit response at higher concentrations or if tested withlonger residence time.
The ranking of ligands by predicted binding energy forS18 (Figure 1c), S19 (Figure 1d) and S46 (Figure 1e) corre-lates well to the experimental recognition profiles within thesame chemical class. Thus ligands found to elicit experi-mental response have more favorable binding energies thanligands that do not elicit response. However, the energydifferences cannot clearly separate them apart. For example,the calculated binding energies of the alcohols that activatethe ORs S18 and S19 are not comparable to the bindingenergies of acids. This discrepancy in binding energies across
chemical classes could arise from many factors such asdominance of the electrostatic contribution to the bindingenergy of the charged ligands with insufficient desolvationcontribution, or underestimation of the hydrogen bondcontribution to the energy of the receptor–ligand complex.Moreover, the binding energies are calculated at 0K temper-ature and do not include entropic effects.
The predicted binding profile for S25 is in good agreementwith the experimental one. The alcohols are predicted tobind much more strongly than any of the other three classes.Within the alcohol series, heptanol and hexanol, which werefound to elicit response experimentally (Malnic et al., 1999),have the best (more negative) binding energies, althoughbutanol (not tested experimentally), pentanol and octanolare very close in energy to the experimental positives.
Table 3 Calculated (HierDock) binding energies (kcal/mol) of the 24 odorants in Table 1for the six mouse olfactory receptors
Note that positive binding is indicated with a negative number, thus most negative is best. Ligands found experimentally (Malnic et al., 1999) to activate the receptor are highlighted for each receptor.aBinding energies for ligands not tested experimentally are highlighted in gray.
Class Ligand S6 S50 S18 His113+ S19 His133+ S46 His107+ s25
Alcohols Butanol (C4) –29.78a –16.79a –15.94a –20.22a –14.04a –29.78a
Pentanol (C5) –20.00 –17.84 –23.96 –20.96 –16.09 –28.80
Hexanol (C6) –30.29 –18.53 –27.75 –25.41 –22.10 –30.42
Heptanol (C7) –35.04 –26.61 –29.97 –26.40 –25.78 –31.97
Octanol (C8) –35.86 –27.18 –32.32 –29.52 –24.60 –28.01
Nonanol (C9) –38.68 –29.48 –33.42 –31.61 –27.08 –15.35
Bromo acids 4-Bromobutyric acid (C4) –81.88 –50.86 –37.40 –9.99 –11.61 12.45
5-Bromovaleric acid (C5) –83.70 –58.24 –40.46 –16.84 –14.21 8.05
6-Bromohexanoic acid (C6) –84.54 –41.62 –39.48 –19.04 –16.09 5.21
7-Bromoheptanoic acid (C7) –87.81a –64.55a –39.47a –20.11a –28.00a 3.14a
8-Bromooctanoic acid (C8) –91.73 –59.57 –45.52 –21.09 –28.80 1.53
9-Bromononanoic acid (C9) –91.78a –64.82a –49.21a –22.76a –22.45a 13.65a
Acids Butyric acid (C4) –79.08 –60.14 –36.38 –10.75 –10.30 13.36
Valeric acid (C5) –81.09 –62.12 –37.63 –12.02 –12.92 10.43
Hexanoic acid (C6) –82.94 –65.69 –39.93 –15.13 –13.36 7.40
Heptanoic acid (C7) –87.10 –62.81 –42.13 –17.88 –15.74 6.75
Octanoic acid (C8) –86.16 –64.40 –44.03 –19.74 –22.63 2.70
Nonanoic acid (C9) –85.74 –65.88 –45.23 –19.94 –28.36 5.54
Diacids Succinic acid (C4) –119.94a –77.89a –20.39a 18.96a 13.20a 63.06a
Glutaric acid (C5) –132.37a –79.91a –24.82a –1.73a 17.91a 56.58a
Adipic acid (C6) –138.79 –80.71 –39.56 –11.31 –7.43 62.73
Pimelic acid (C7) –145.84 –71.39 0.32 –12.50 –5.14 60.56
Suberic acid (C8) –141.07 –84.28 –16.93 –18.26 –8.81 62.70
Azelaic acid (C9) –151.40 –86.91 –7.15 –15.84 –10.40 70.71

Olfaction and Olfactory Receptor Structure and Function 277
Overall, all three receptors give good correlation for eachof the four chemical classes between the predicted bindingenergies and the observed activation profile. However, thereseem to be differences in the absolute values for the acti-vation threshold for different odorant classes. Also, theabsolute binding energies for different receptors varysignificantly between the various cases. This discrepancy inbinding energies for different chemical classes could arisefrom
1. slight errors in the 3-D structure (rotation or translationof one or more helices by an Ångstrom or so that mighthave differential effects on different classes);
2. approximations in the solvation of the active site wherewe use a non-variable dielectric constant and ignore the
possible role of water (and metals such as Zn) buried inthe active site; or
3. differential charging of the bound ligand with respect tothe ligand isolated in solvent (we assume that all acidshave the same net charge in the protein and in solution.
The calculated odorant binding profiles also correlate withthe experimental concentration threshold. Thus, nonanoicacid (which elicits experimental responses at 10 µM for S18and S46 and at 1 µM for S19) has higher binding affinitythan the acids that elicit experimental response at 10 µM(octanoic and heptanoic acids in S19) and 100 µM (octanoicacid in S46; octanoic and heptanoic acids in S18; hexanoicacid in S19). Correlation between concentration thresholdand binding energy is also found for S19 binding to alcohols
Figure 1 Calculated (HierDock) binding profiles for mouse olfactory receptors (a) S50, (b) S6, (c) S18, (d) S19, (e) S46 and (f) S46. Odorants found toelicit experimental response (Malnic et al., 1999) are filled in black. Odorants that were not tested experimentally are filled in grey. Odorants that do notelicit response experimentally are represented as non-shaded bars. The experimental concentration thresholds (Malnic et al., 1999) are provided to showtheir correlation with the calculated binding energies.

278 W.B. Floriano et al.
where nonanol (1 µM) has better (more negative) bindingenergy than octanol (10 µM), which is better than heptanol(100 µM). The same holds true for S19 and bromo acids,with 8-bromo octanoic acid (1 µM) ranking better than 6-bromo hexanoic acid (100 µM). In all these cases, the calcu-lated binding decreases with the decrease in carbon chainlength. Three odorants not tested experimentally showbetter binding energy than known ligands and are consistentwith the trend described above: 9-bromo nonanoic acid forS18; 9-bromononanoic acid and 7-bromoheptanoic acid forS19. We predict that these ligands should bind and likelyserve as agonists.
Location and general features of the binding sites
Figure 2 shows that the binding sites (side view and theextracellular top view) of odorants in all six ORs are locatedbetween TMs 3, 4, 5 and 6 and lie ∼10 Å below the extracel-lular loops of the helical barrel. Figure 3 superimposes thepredicted binding site for azelaic acid in S6 (receptor andligand in blue) and compares it to the binding site of cis-retinal in bovine rhodopsin crystal structure (pdb code:1F88) colored in red. This shows that the binding sites forORs are in the same general location as retinal in rhodopsin,even though all potential binding sites were determined byindependent scanning of the receptors. Figure 3 also showsthe differences between the crystal structure of bovinerhodopsin and our predicted structure for OR S6.
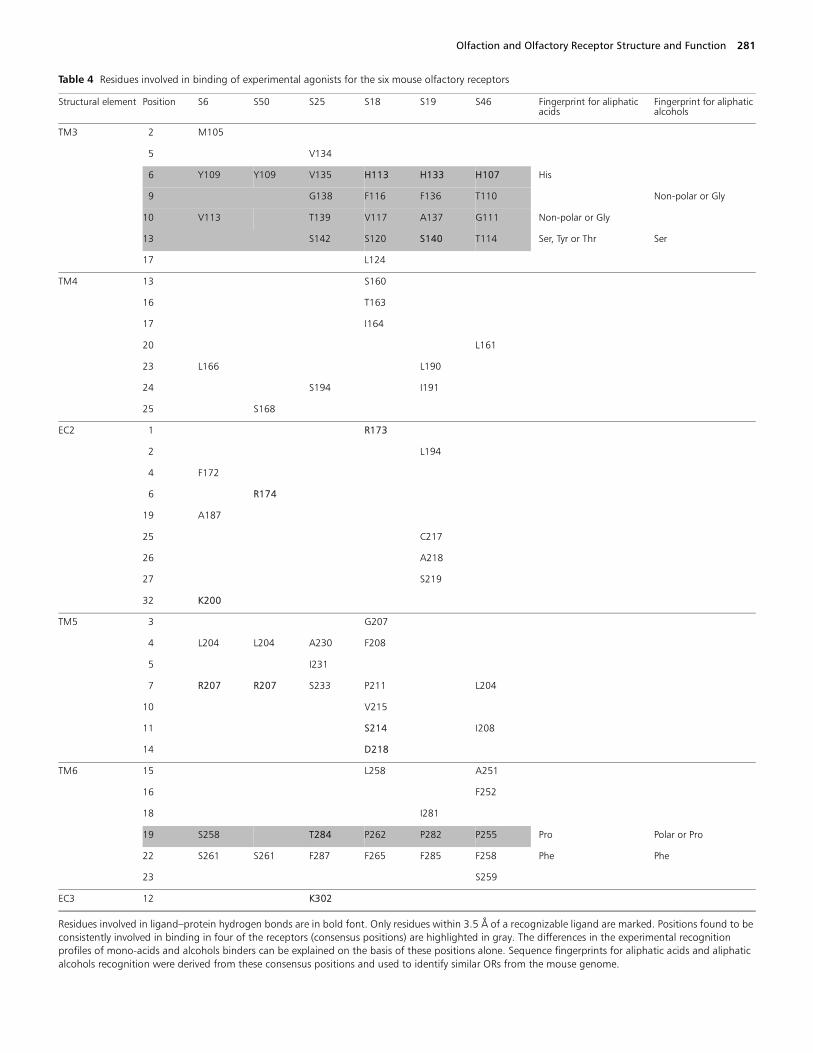
Residues within 3.5Å of the experimental agonists for allsix olfactory receptors are shown in Figure 5 and Table 4.The same set of residues is also marked in the sequencealignment of these ORs shown in Figure 4. Residues thatform hydrogen bonds with the ligand are shown in bold fontin Table 4. Amino acid positions in the sequence alignment(Figure 4) found to be involved in odorant binding for fourORs (S18, S19, S25 and S46) are highlighted in Table 4.These are positions 6, 9, 10 and 13 in TM3, and position 19in TM6. Consensus positions 6, 9 and 13 in TM3 are in thesame face of that helix. These four ORs recognize odorantsfrom the same chemical classes, while the other two (S6 andS50) recognize a class of odorants (diacids) not recognizedby any of the other four ORs.
We assume that these amino acid positions found to beconsistently involved in binding of odorants in S18, S19, S46and S25 are indeed responsible for odorant recognition. Wewill now examine whether this information on the bindingsite can be used to explain the differences in the experimentalodorant activation profiles for these ORs.
The ORs that recognize acids and bromo acids (S18, S19and S46) have a His in position TM3-6 (this notation meanssixth residue on TM3 starting from the amino end of thehelix 3), a residue with a short hydrophobic side chain (Val,Ala or Gly) at position TM3-10 and a Pro in position TM6-19.The only OR among the six considered here that does notrecognize acids (S25) has:
• a Val in TM3-6;• a polar Thr at position TM3-10;• another Thr in TM6-19.
The Thr284 at position TM6-19 in S25 is hydrogen-bondedto Lys302 (EC3), which is the anchor residue for thehydroxyl group.
The two ORs that recognize both alcohols and acids (S18and S19) have Phe at position TM3-9, which is occupied bya Thr in the OR S46, that recognizes only acids and by a Glyin the OR S25 that is activated only by alcohols. Figure 6shows a comparison between these positions in S18 (recog-nizes alcohols and mono-acids) compared with S25 (alco-hols but not mono-acids) and S46 (mono-acids but notalcohols). Together, these four positions seem to explain thedifferences in chemical class preference for S18, S19, S25 andS46. Three of them (TM3-6, TM3-9 and TM3-10) areconsidered hypervariable positions in OR sequence align-ments and have been suggested to be involved in differenti-ating among odorants (Malnic et al., 1999; Pilpel andLancet, 1999). The fifth consensus position TM3-13 (also ahypervariable position according to the literature; Malnic etal., 1999; Pilpel and Lancet, 1999) does not seem to accountfor differences in preference among the Malnic 24 odorantset and may be involved in the binding of some otherodorant not included in that set.
Comparing the binding sites for diacids in the homologues S6 and S50
The olfactory receptors S6 and S50 share 94% sequenceidentity. The structural homology of the MembStrukpredicted structures for S6 and S50 is high showing a CRMSdifference of only 1.5Å in the TM domain. The main devia-tions are in the loop conformations, which are not signifi-cant since the loops are conformationally flexible. S50recognizes only azelaic acid (C9 diacid), while S6 recognizesboth azelaic acid and suberic acid (C8 diacid). The muta-tions from S50 to S6 responsible for changing the activity arein TM2 (Leu82–Val), TM3 (Val112–Ile, Ser113–Val,Met114–Phe) and TM5 (Ala202–Val, Ile205–Thr, Ile206–Val, Thr208–Ile, Thr220–Ala).
Figures 4 and 5 show that of the 13 residues found within3.5 Å of agonist ligands, only four residues (Tyr109, Leu204,Arg207 and Ser261) are common to both S6 and S50. Wefind that a single mutation at Ser113 (TM3)–Val, in S50 toS6 is directly involved in odorant binding. However, 8 out of16 mutations between S50 and S6 are in TMs 3 and 5 and areinvolved in forming the shape of the active odorant bindingsite in S50 and S6. Another structural difference is that S6has significant contributions from residues in EC2, which inS6 is somewhat folded towards the opening of the helixbarrel, whereas it is in an ‘open’ conformation for S50. Sinceloops are the least accurate parts of our predicted 3-D struc-tures, loop residues identified with binding should be takenwith some reservation. It should be noted, however, that

Olfaction and Olfactory Receptor Structure and Function 279
Figure 2 Front and top (extracellular end) view of the 3-D structures of mouse olfactory receptors S6, S50, S18, S19, S25 and S46 with their respectiveagonists bound to the HierDock predicted binding sites. The TMs are, counter-clockwise from the back: TM 1 (red-brown), TM2 (ochre), TM3 (moss green),TM4 (lime green), TM5 (green), TM6 (light blue) and TM7 (blue). Figures were generated using VMD (Humphrey et al., 1998).

280 W.B. Floriano et al.
EC2 is folded into the binding site in the crystal structure ofrhodopsin with bound cis-retinal.
The binding site for alcohols in S25 compared with previous work
The calculated binding energy profile of the alcohol bindingreceptor S25 shows good agreement with the experimentalprofile as described in above. The binding energies reportedhere for odorants in S25 use the refined HierDock protocoldescribed in this paper. The absolute binding energies aredifferent from the previous published work (Floriano et al.,2000), but the relative binding energy profile remains iden-tical. Both studies lead to very good agreement betweencalculated and experimental profiles in terms of the chemicalclass recognized by the OR and, within that chemical class,the ranking of ligands by their likelihood of activating thereceptor. We also found the same residues to be involved inbinding and the same critical binding feature in thehydrogen bond (HB) to Lys302.
Comparing the binding modes of acids and alcohols with ORs S18, S19 and S46
The binding site of mono-acids, bromoacids and alcohols inthis family involves residues in TMs 3, 4, 5 and 6, and EC2.Odorants bind with their long axis generally parallel to theTMs, with their carboxyl group pointing toward the extra-cellular side of the helical barrel. Moreover their orientationis consistent with the idea that the N-terminal region of an
alpha helix favors the binding of negatively charged ligandsbecause of stabilization due to the positive charge of thehelix dipole (Hol et al., 1978). The binding mode (Figure 4)of alcohols to S19 involves a HB to Ser140 (TM3), while thebinding mode for acids has His133 (TM3) as the anchorpoint. The hydrophobic tails of alcohols and acids are
Figure 3 Structural superposition of mouse olfactory receptor S6 (withazelaic acid bound to predicted binding site) to bovine rhodopsin bound toretinal (pdb code 1F88) showing the differences in the protein structuresand the similarity in the binding sites location. S6 and azelaic acid are blue;rhodopsin and retinal are red. The OR structures and the locations of theirbinding sites were each derived independently. No structural informationabout the binding site location, length of the trans-membrane domains, tiltof the helices or loop configuration from the rhodopsin structure was usedin predicting the structure of the ORs.
Figure 4 Sequence alignment for mouse olfactory receptors S6, S50,S18, S19, S25, S46 and bovine rhodopsin. Predicted trans-membraneregions are highlighted. Residues found within 3.5 Å of an experimentalagonist are in bold underlined font. Cys involved in disulfide bonds are inlower case letter. Blue letters represent the amino acid differences in the94% homologous pair S6 and S50. Hypervariable positions are highlightedin the secondary structure assignment rows. There have been suggestionsin the literature that hypervarient positions are involved in odorantrecognition (Malnic et al., 1999; Pilpel and Lancet, 1999). Trans-membranehelices (TM) 1–7, extracellular loops (EC) 1–3 and intracellular loops (IC)1–3 are identified in the alignment. For bovine rhodopsin, the secondarystructure assignment was from the pdb file 1F88. Some of the residuesfound to be involved in binding in our models are also hypervariablepositions. Trans-membrane domains 3, 5 and 6 have positions consistentlyinvolved in binding for most ORs studied here.
Olfaction and Olfactory Receptor Structure and Function 281
Table 4 Residues involved in binding of experimental agonists for the six mouse olfactory receptors
Residues involved in ligand–protein hydrogen bonds are in bold font. Only residues within 3.5 Å of a recognizable ligand are marked. Positions found to be consistently involved in binding in four of the receptors (consensus positions) are highlighted in gray. The differences in the experimental recognition profiles of mono-acids and alcohols binders can be explained on the basis of these positions alone. Sequence fingerprints for aliphatic acids and aliphatic alcohols recognition were derived from these consensus positions and used to identify similar ORs from the mouse genome.
Structural element Position S6 S50 S25 S18 S19 S46 Fingerprint for aliphatic acids
Fingerprint for aliphatic alcohols
TM3 2 M105
5 V134
6 Y109 Y109 V135 H113 H133 H107 His
9 G138 F116 F136 T110 Non-polar or Gly
10 V113 T139 V117 A137 G111 Non-polar or Gly
13 S142 S120 S140 T114 Ser, Tyr or Thr Ser
17 L124
TM4 13 S160
16 T163
17 I164
20 L161
23 L166 L190
24 S194 I191
25 S168
EC2 1 R173
2 L194
4 F172
6 R174
19 A187
25 C217
26 A218
27 S219
32 K200
TM5 3 G207
4 L204 L204 A230 F208
5 I231
7 R207 R207 S233 P211 L204
10 V215
11 S214 I208
14 D218
TM6 15 L258 A251
16 F252
18 I281
19 S258 T284 P262 P282 P255 Pro Polar or Pro
22 S261 S261 F287 F265 F285 F258 Phe Phe
23 S259
EC3 12 K302

282 W.B. Floriano et al.
Figure 5 Details of the binding modes for the six mouse olfactory receptors: azelaic acid/S6, azelaic acid/S50, 8-bromo-octanoic acid/S18, (nonanol andoctanoic acid)/S19, nonanoic acid/ S46 and heptanal/ S25. Hydrogen bonds to anchor residues in the binding site are traced in the figures. Different ORsuse different binding modes to recognize the same ligands. Different anchor points within the same binding site can also be used for different functionalgroups.

Olfaction and Olfactory Receptor Structure and Function 283
bound similarly, with Leu190 (TM4), Ile191 (TM4), Leu194(EC2), Ile 281 (TM6), Pro282 (TM6) and Phe285 (TM6)providing a hydrophobic pocket around it. The hydroxyl
and carboxyl groups point in opposite directions in order toreach their anchors. This shows that the same OR can bindto two different odorants in two different binding modes.
Comparing critical residues for binding to available data for other GPCRs
Above, we listed common positions in the ORs sequencealignment that we identify as critical for odor recognitionand discussed their agreement with sequence hypervaria-bility intrinsic to OR function. Now the question is how wellthese positions compare to experimental data for ligandbinding to other GPCRs. For this comparison we chose a setof family A type (rhodopsin-like) GPCRs that have abun-dant experimental data because of their pharmaceuticalrelevance: muscarinic acetylcholine receptor, β2-adrenergicreceptor, dopamine receptor, type-1B angiotensin IIreceptor and purinergic receptor. We mapped reportedexperimental data (Strader et al., 1994; Wieland et al., 1995;Bourdon et al., 1997; Alberts et al., 1998; Allman et al.,2000; Klabunde and Hessler, 2002; Bissantz et al., 2003) onresidue positions involved in binding for those receptors andthen compared their important positions for binding to theones identified here for ORs. These are shown in Figure 7.
The sequences in Figure 7 were aligned as follows (no gapswere allowed in the TMs):
1. TM3 sequences were aligned based on the conservedpattern (D, E, or H)RY;
2. TM4 was aligned based on the conserved Trp;3. TMs 5 and 6 were aligned using clustalW (Thompson et
al., 1994).
Figure 6 Schematic diagram showing that the residues found to beinvolved in odorant binding are in conserved alignment positions acrossORs S18, S19, S25 and S46. These four sequence alignment positions inTM3 and TM6 can explain the differences in the experimental responseprofiles. We compare S18 (recognizes long alcohols and mono-acids) toS25 (medium alcohols but not mono-acids) and S46 (long mono-acids butnot alcohols). The ORs that recognize mono-acids (S18, S19 and S46) havea His in position TM3-6, a short hydrophobic side chain residue (V, A or G)at position TM3-10 and a Pro in position TM6-19, while the only OR in theset that does not recognize acids (S25) has a Val in TM3-6, a polar Thr atposition TM3-10 and another Thr in TM6-19. The Thr284 at position TM6-19 in S25 is hydrogen-bonded to Lys302 (EC3), which is the anchor residuefor the hydroxyl group. The two ORs that recognize both alcohols andmono-acids (S18 and S19) have Phe at position TM3-9, which is occupiedby a Thr in the acids-only S46 and by a Gly in the alcohols-only S25.
Figure 7 Comparison between residues predicted as critical for odorant recognition in ORs and residues experimentally found to be involved in agonistbinding for other GPCRs. Transmembrane domains for rhodopsin (1F88), muscarinic acetylcholine receptor (acm1_human), β2-adrenergic receptor(b2ar_human), dopamine receptor (d3dr_human), type-1B angiotensin II receptor (ag2s_rat) and purinergic receptor (p2yr_human) correspond to theregions assigned in the swiss-prot files. For each OR, positions found to be involved in binding are in underlined font with consensus positions (i.e. commonto all six cases presented in this paper) bold underlined. TM residues found within 3.5 Å of retinal in the rhodopsin structure 1F88 are underlined in therhodopsin sequence. Residues experimentally found to be involved in binding (Strader et al., 1994; Wieland et al., 1995; Bourdon et al., 1997; Alberts etal., 1998; Allman et al., 2000; Klabunde and Hessler, 2002; Bissantz et al., 2003) for muscarinic acetylcholine (Allman et al., 2000), β2-adrenergic receptor,dopamine, type-1B angiotensin II (Klabunde and Hessler, 2002) and purinergic receptors (Klabunde and Hessler, 2002) are also bold underlined in theirrespective sequences. The Trp residue half way through TM4 that is conserved in most GPCR (Rhee et al., 2000) is not conserved in ORs. In fact, for the sixORs studied here, only S18 has this Trp. The binding sites in the ORs were predicted based on interaction energies between odorants and ORs with no useof experimental information. All four OR consensus positions in TM3 have been implicated in ligand binding for other GPCRs. The OR consensus position inTM6 is in the same region of the helix as in the other receptors; however, not exactly in the same position. One of the two residues in TM5 that we foundto be involved in binding for some but not all six ORs studied here is also in good agreement with the data for the other GPCRs.

284 W.B. Floriano et al.
The Trp residue half way through TM4 that is conserved inmost GPCR (Rhee et al., 2000) is not conserved in ORs. Infact, out of the six ORs studied here, only S18 has this Trp,so we used S18 for aligning TM4 of the ORs to the otherGPCRs. The alignment for ORs and rhodopsin shown inFigure 4 was based on the complete amino acid sequencesand hence it differs from the TM-based alignment forrhodopsin TMs in Figure 7.
All four OR consensus positions in TM3 have been impli-cated in ligand binding for other GPCRs. The OR consensusposition in TM6 is in the same region of the helix as for theother receptors; however, it is not in exactly the same posi-tion. One of the two residues in TM5 that we found to beinvolved in binding for some but not all six ORs studied hereis also in good agreement with the data for the otherGPCRs. The good agreement between our predictions andthe available data for these other GPCRs is one indicationthat our methods provide accurate structures and bindingsite, since the binding sites in the ORs were predicted basedon interaction energies between odorants and ORs with nouse of experimental information.
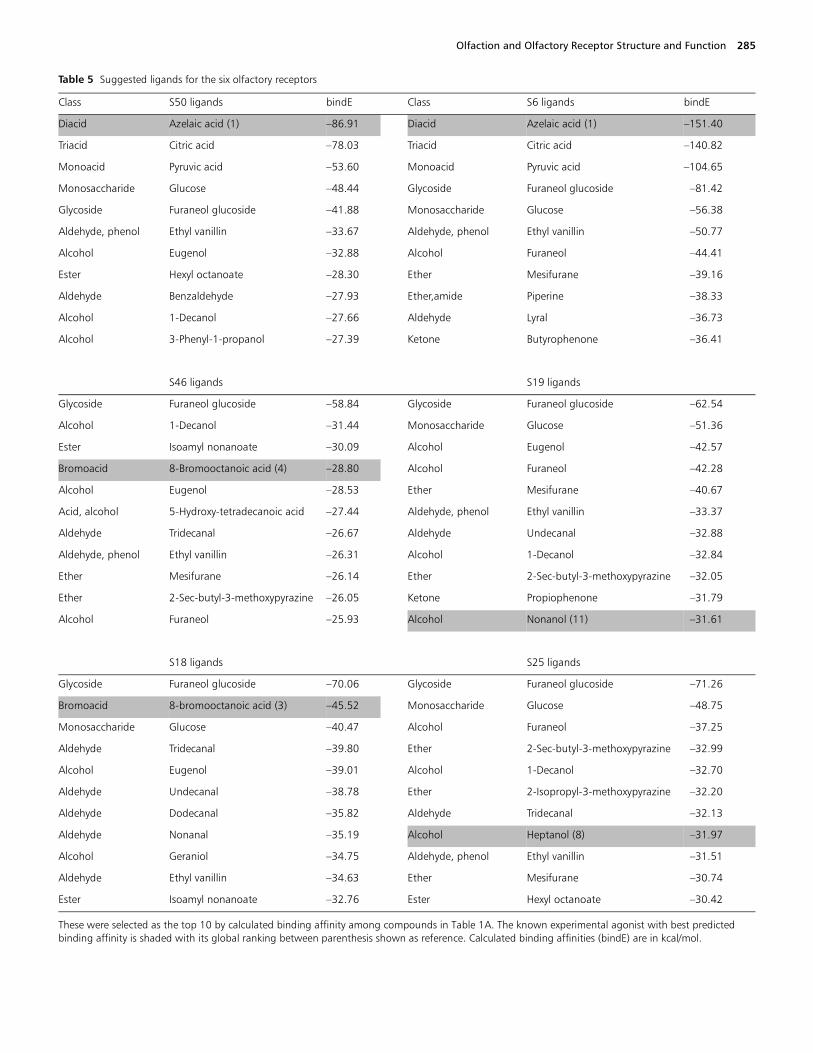
Screening odorant libraries to find potential agonists
We docked all ligands shown in Table 1B to all six OR struc-tures studied here and sorted them in order of decreasingbinding affinity. The top 10 potential ligands by bindingaffinity for each OR are shown in Table 5. These ligands arecandidates to serve as agonists or antagonists to these ORs.We included sugars in our screening set, even though theyare generally odorless, in order to provide data forcomparing the binding affinities to ORs of odorants versustastants (such as glucose, a natural agonist for taste recep-tors, which are functionally related members of the GPCRfamily). This may provide insights into how function diver-sity evolved in the GPCR family, and more specifically,among the chemosensory receptors.
Binding of a ligand to an OR is a necessary but not suffi-cient condition for activation and hence calculated bindingenergies alone cannot predict which molecules will elicitresponse in vivo. A ligand could bind strongly and not acti-vate the G protein. Also, the calculated binding energies donot take into account many physical–chemical propertiesthat may differentiate structurally similar ligands in vivo.However, we have shown in the previous sections that thereis correlation between calculated binding energies and thechemical classes recognized by each OR. The binding ener-gies also indicate very well odorants most likely to activatethe receptor within each of the four odorant classes ofMalnic, even though the energy distribution may not clearlyseparate active and inactive ligands. In addition, there issome correlation when comparing ligands of differentclasses. Thus we assume that ligands with better (more nega-tive) calculated binding energies than the best experimentalpositives are likely to activate the ORs, while ligands with
less favorable binding energy than the best experimentalpositives are not likely to activate the ORs. These ligandscan be tested experimentally.
The experimental procedure used in identifying the sixORs studied here may lead to functional relationships.Experimentally, calcium imaging was used (Malnic et al.,1999) to select from 647 mouse olfactory neurons from thedorsal nasal septum those that responded to one or more ofthe odorants in Table 1A. Then, RT–PCR was used to iden-tify the OR genes expressed by the responsive neurons.Odorants were first tested at 100 µM, then at 10 and 1 µM,depending on response. Consequently, only ORs sharingaffinity to those odorants were selected and identified,making them likely to share affinity for other odorants.
We find that some ligands have favorable binding energyto more than one of the six OR studied here. This may arisebecause this set of ORs was selected by their commonaffinity to aliphatic alcohols and acids with 6–9 carbons.This may explain their common preference for the aldehydesand esters in Table 5.
The most frequent hits are (number of ORs for which theyrank among the top 10 binders/total number of ORs consid-ered between parentheses):
• furaneol glucoside (6/6);• ethyl vanillin (6/6);• glucose (5/6);• furaneol (2,5-dimethyl-4-hydroxy-3(2H)-furanone) (4/6);• mesifurane (4/6);• eugenol (4/6);• decanol (4/6);• tridecanal (3/6);• sec-butyl-3-methoxypyrazine (3/6).
Interestingly, the ligands showing the best calculatedbinding affinities to the ORs studied in our work are impor-tant aroma and/or flavor components of nutrient sourcesmice are known to like, such as fruits, vegetables and cheese(Bramwell et al., 1969; Buttery et al., 1969, 1990; Murray etal., 1970; Maga and Sizer, 1973; Cronin and Stanton, 1976;Ohloff, 1978; Wu et al., 1991; Duke, 1992; Belay and Poole,1993). This is also true for the Malnic compounds (Table1A) that elicit experimental response from these ORs(Murray et al., 1970; Pabst et al., 1991; Wu et al., 1991;Teranishi et al., 1992; Krammer et al., 1994; Sanz et al.,1995; Forney, 2001; Jordan et al., 2001; Suriyaphan et al.,2001; Jackson and Linskens, 2002; Lavid et al., 2002). Inparticular, furaneol and its methoxy derivative (mesifurane)are among the most important volatile compounds in thearoma of strawberries (Sanz et al., 1995; Forney, 2001;Lavid et al., 2002). The concentration of these compoundsalong with the furaneol glucoside derivative, sharplyincrease during fruit ripening, with maximum values at theripe stage (Forney, 2001; Lavid et al., 2002). Furaneol is alsoan important component in the aroma and flavor of manyfruits including pineapples (Wu et al., 1991), tomatoes
Olfaction and Olfactory Receptor Structure and Function 285
Table 5 Suggested ligands for the six olfactory receptors
These were selected as the top 10 by calculated binding affinity among compounds in Table 1A. The known experimental agonist with best predicted binding affinity is shaded with its global ranking between parenthesis shown as reference. Calculated binding affinities (bindE) are in kcal/mol.
Class S50 ligands bindE Class S6 ligands bindE
Diacid Azelaic acid (1) –86.91 Diacid Azelaic acid (1) –151.40
Triacid Citric acid –78.03 Triacid Citric acid –140.82
Monoacid Pyruvic acid –53.60 Monoacid Pyruvic acid –104.65
Monosaccharide Glucose –48.44 Glycoside Furaneol glucoside –81.42
Glycoside Furaneol glucoside –41.88 Monosaccharide Glucose –56.38
Aldehyde, phenol Ethyl vanillin –33.67 Aldehyde, phenol Ethyl vanillin –50.77
Alcohol Eugenol –32.88 Alcohol Furaneol –44.41
Ester Hexyl octanoate –28.30 Ether Mesifurane –39.16
Aldehyde Benzaldehyde –27.93 Ether,amide Piperine –38.33
Alcohol 1-Decanol –27.66 Aldehyde Lyral –36.73
Alcohol 3-Phenyl-1-propanol –27.39 Ketone Butyrophenone –36.41
S46 ligands S19 ligands
Glycoside Furaneol glucoside –58.84 Glycoside Furaneol glucoside –62.54
Alcohol 1-Decanol –31.44 Monosaccharide Glucose –51.36
Ester Isoamyl nonanoate –30.09 Alcohol Eugenol –42.57
Bromoacid 8-Bromooctanoic acid (4) –28.80 Alcohol Furaneol –42.28
Alcohol Eugenol –28.53 Ether Mesifurane –40.67
Acid, alcohol 5-Hydroxy-tetradecanoic acid –27.44 Aldehyde, phenol Ethyl vanillin –33.37
Aldehyde Tridecanal –26.67 Aldehyde Undecanal –32.88
Aldehyde, phenol Ethyl vanillin –26.31 Alcohol 1-Decanol –32.84
Ether Mesifurane –26.14 Ether 2-Sec-butyl-3-methoxypyrazine –32.05
Ether 2-Sec-butyl-3-methoxypyrazine –26.05 Ketone Propiophenone –31.79
Alcohol Furaneol –25.93 Alcohol Nonanol (11) –31.61
S18 ligands S25 ligands
Glycoside Furaneol glucoside –70.06 Glycoside Furaneol glucoside –71.26
Bromoacid 8-bromooctanoic acid (3) –45.52 Monosaccharide Glucose –48.75
Monosaccharide Glucose –40.47 Alcohol Furaneol –37.25
Aldehyde Tridecanal –39.80 Ether 2-Sec-butyl-3-methoxypyrazine –32.99
Alcohol Eugenol –39.01 Alcohol 1-Decanol –32.70
Aldehyde Undecanal –38.78 Ether 2-Isopropyl-3-methoxypyrazine –32.20
Aldehyde Dodecanal –35.82 Aldehyde Tridecanal –32.13
Aldehyde Nonanal –35.19 Alcohol Heptanol (8) –31.97
Alcohol Geraniol –34.75 Aldehyde, phenol Ethyl vanillin –31.51
Aldehyde Ethyl vanillin –34.63 Ether Mesifurane –30.74
Ester Isoamyl nonanoate –32.76 Ester Hexyl octanoate –30.42

286 W.B. Floriano et al.
(Krammer et al., 1994), mangos (Lavid et al., 2002), grapes(Gunata et al., 1985) and raspberries (Pabst et al., 1991).
Our results support the idea that natural agonists for ORsare likely to be found among environmentally relatedsubstances.
The high affinity of the glycosidically bound furaneol toall six ORs studied here may indicate the complex role ORsplay in flavor perception. Glycosidically bound aromacompounds are considered important flavor precursors(Gunata et al., 1985; Pabst et al., 1991; Wu et al., 1991;Krammer et al., 1994; Jackson and Linskens, 2002), andbinding of those compounds to ORs may not lead to specificodor descriptor but instead to an overall ‘pleasant’ sensa-tion.
Other ORs sharing similar odorant preferences
One question that arises from the theory of combinatorialcoding for odors is how many receptors are used to uniquelyidentify an odorant. We cannot answer this question untilwe finish predicting the structure and odorant binding of allORs in the mouse or in the human genomes. However, wecan provide a rough estimate of how many ORs couldpotentially recognize the same class of chemical compoundsas the six ORs studied here. To do this we derived simplifiedrecognition patterns for identification of aliphatic alcoholand aliphatic acid from the amino acids we found to bedirectly involved in the binding pocket of these odorants inthe six ORs we studied. We found that these binding siteslead to specific positions in the ORs sequence alignment (seeTable 4). We will now use these patterns to identify relatedORs by pattern matching. In order to do this, we searchedfor all sequences in the TrEMBL database (http://ca.expasy.org/sprot/sprot-search.html) matching ‘mouse’ inthe organism and ‘MOR[number]’ in the descriptor fields.The sequences resulting from this query were extracted fromthe database. Incomplete and redundant sequences(homology >97%) were eliminated from the set. Sequencealignment was performed using ClustalW (Thompson et al.,1994) and the TM assignment for S25 was used to predictthe TM domains in the alignment. Sequence alignment wasalso used to identify the ‘S’ olfactory receptors in theTrEMBL set. The final set had 869 mouse OR sequences.
The pattern (shown in Table 4) of important amino acidsderived for binding of aliphatic acids with 6–9 carbons toS18, S19 and S46, is:
• His at position 6 in TM3;• any non-polar or Gly residues at TM3/10;• Ser, Tyr or Thr at TM3/13, Pro at TM6/19;• Phe at TM6/22.
We found that 32 out of 869 OR sequences match thispattern making them potential receptors for similaraliphatic acids. The TrEMBL codes for these sequences aregiven in Table 6.
The pattern for recognition of aliphatic alcohols with 6–9carbons (shown in Table 4) was derived as:
• non-polar residue or Gly at TM3/9;• Ser at TM3/13;• polar or Pro residues at TM6/19;• Phe at TM6/22.
This pattern is satisfied by 36 sequences from the 869 set.The TrEMBL codes for these sequences are given in Table 6.Of these 36, 12 were in common with the 32 recognizingacids.
Summary and conclusions
Our previous studies showed that MembStruk predicts thetransmembrane part of the 3-D structures of GPCRs to ∼3ÅCRMS error compared with the crystal structures of bovinerhodopsin and bacteriorhodopsin (Vaidehi et al., 2002). Inaddition, the studies of binding of retinal to bovinerhodopsin, epinephrine to β1 and β2 adrenergic receptorsand dopamine to dopamine receptor are sufficiently accu-rate to account for experimentally measured ligand bindingfunction for these receptors (Vaidehi et al., 2002).
This paper shows that the predicted structures for six ORslead to predicted odorant binding sites for the 24 experimen-tally studied odorants that lead to calculated binding energyprofiles that correlate well with the experimentally deter-mined activation profiles. In addition, the features commonto all six ORs found in the predicted binding modes ofknown agonists are in good agreement with experimentaldata for related proteins such as muscarinic acetylcholine,β2-adrenergic, dopamine, type-1B angiotensin II and purin-ergic receptors (Strader et al., 1994; Wieland et al., 1995;Bourdon et al., 1997; Alberts et al., 1998; Allman et al.,2000; Klabunde and Hessler, 2002; Bissantz et al., 2003), asseen above.
The good correlation between experimental and calcu-lated binding profiles for the six ORs studied here and thegood agreement between predicted binding mode and muta-tion studies for other GPCRs validates that the 3-D struc-tures built with MembStruk capture the binding sitecharacter sufficiently well to use them in predicting therecognition profiles for other potential agonists. In addition,the accuracy of these predictions validates the efficacy ofHierDock for predicting binding site and binding energy.We should stress that the binding sites in the ORs werepredicted based on interaction energies between odorantsand ORs only, with no use of experimental informationexcept to validate the predictions.
It may be argued that our 3-D models at the accuracy theyare expected to be (∼3Å in the TM region) are not suitablefor detailing binding modes. However, the intrinsically lessspecific character of the binding of odorants to ORs,compared with the degree of conformational specificityrequired for agonist binding in other systems, imply binding

Olfaction and Olfactory Receptor Structure and Function 287
interactions that are much less dependent on a specificbinding conformation. That means that the features incommon to all six independently generated 3-D models arevery likely to represent the most important interactions forodorant recognition in ORs.
For the six mouse ORs studied here, the binding sites arelocated in the same region, between TM helices 3, 4, 5 and 6.This binding region contains a number of hypervariable resi-dues among the ORs, consistent with their involvement inbinding, as proposed in the literature (Malnic et al., 1999;Pilpel and Lancet, 1999). However, we have been able toidentify specific conserved amino acid motifs that we suggestare used as signatures for recognizing specific chemical func-tional groups (alcohol and acid).
Two classes of ORs have been identified in vertebrates(Freitag et al., 1998): class I (fish-like receptors) and class II(mammalian-like receptors). Fish ORs respond to water-soluble odorants such as amino acids (Ivanova and Caprio,1993), while mammalian ORs respond to volatilecompounds (Mezler et al., 2001). It has been suggested thatclass I ORs may be specialized in detection of water-solubleodorants, while class II detect volatiles (Freitag et al., 1998;Mezler et al., 2001). The two classes differ by the length ofEC3 (longer in the fish-like class I ORs) and the sequencevariability in TMs 3–5, although no obvious class-specificamino acid motif has been detected in the TM domains(Freitag et al., 1998; Mezler et al., 2001). Of the six ORsstudied here, five (S18, S19, S46, S6 and S50) are selective forwater-soluble odorants as expected for the fish-like class IORs (Zhang and Firestein, 2002), while S25 is selective foralcohols, consistent with class II. Since we find that the pref-erence of our class I receptors for acids involves amino aciddifferences at positions TM3-6, TM3-9 and TM6-19 whencompared with S25, we suggest that these positions mightlead to class-specific fingerprints.
We should emphasize that our predictions of binding sitesand binding energies of the odorants do not indicatewhether binding will lead to activation of the G protein,which is essential to odor recognition. Other factors notaccounted for in our receptor/ligand docking studiesinclude: transport of the ligands to the ORs, latency (reac-tion time for recognition), ability to promote the conforma-tional changes in the receptor necessary for signaling andconcentration thresholds. On the other hand, the studies byMalnic measure only activation of the ORs. That is, theyonly measure agonists. It is possible that some ligands whichwe find to bind strongly might not activate the ORs (that isthey may serve as antagonists). Such a concept of goodbinder with no activation or ‘antagonists’ has not yet beenaddressed in the olfactory receptor literature.
Our studies raise points about the metrics used to organizethe odorant/olfactory receptor space. Most studies of theolfactory system have tested the activation of the ORs bychemically related structures. This assumes implicitly thatthere is some direct relationship between odor perception
Table 6 TrEMBL codes for the sequences extracted from the OR genome database set (comprised of 869 mouse OR amino acid sequences) by matching the recognition pattern deduced for 6–9 carbon aliphatic alcohols and aliphatic acids (highlighted in Table 4 based on predicted binding sites for mouse olfactory receptors: S18, S19, S46 and S25
Bold face indicates receptors predicted to recognize both alcohols and acids. The TrEMBL codes for the ‘S’ ORs are shown in parenthesis.
(a) Aliphatic acids (b) Aliphatic alcohols
S19 (Q9WU90) S19 (Q9WU90)
S18 (Q9WU89) S18 (Q9WU89)
S46 (Q9WU93) S25 (Q8VEZ0)
Q8VF03 Q8VEV6
Q8VF06 Q8VF62
Q8VF27 Q8VFQ6
Q8VG19 Q8VFR5
Q8VG23 Q8VFR6
Q8VG24 Q8VFR7
Q8VG26 Q8VFR9
Q8VG28 Q8VFV5
Q8VG78 Q8VFV6
Q8VG79 Q8VFV7
Q8VG84 Q8VFV8
Q8VGA1 Q8VFW0
Q8VGU9 Q8VFW3
Q8VGV3 Q8VFW9
Q8VGV4 Q8VFX1
Q8VGV5 Q8VG13
Q8VGV6 Q8VG17
Q8VGV8 QQ8VG19
Q8VGW2 QQ8VG78
Q8VGW3 QQ8VGA1
Q8VGW4 Q8VGE2
Q8VGW5 Q8VGV3
Q8VGX4 QQ8VGV4
Q8VGX8 Q8VGW1
Q8VGY0 Q8VGW5
Q8VGY3 Q8VGX8
Q8VGZ9 QQ8VGY0
Q8VH00 QQ8VGY3
Q8VH03 Q8VH03
Q8VH18 Q8VH09
Q9EQQ6 QQ8VH18
Q9WVD9 Q9EQ89
Q9EQA7
Q9EQB0
Q9EQB6
Q9WVD9

288 W.B. Floriano et al.
and chemical functional groups of odorants. This may bethe case but an alternate hypothesis is the olfactory systemmay be organized in ways that depend on the relationshipbetween odors in odorant space. The olfactory system mightbe organized around a built-in ‘understanding’ of thebiosynthetic relationships between different moleculesfound in nature or it could be organized to recognize odor-ants with similar perception (Mamlouk et al., 2003). Ourstudy suggests that odorants having biosynthetic relation-ships in odor space could be recognized by a specific set ofORs. However, to put such analyses on a firm foundationrequires determining the structure and odorant bindingproperties of all ORs in the genome. This work lays the basisfor such a study by validating the computational techniquesrequired.
The two sets of mouse ORs identified as potential recep-tors for aliphatic alcohols and aliphatic acids may formbasic arrays for unique combinatorial coding of single mole-cules in these classes. This prediction is testable experimen-tally. We speculate that these sets may also code odorantssuch as esters and aldehydes.
Our studies suggest that the set of six ORs presented hereare likely to respond to aldehydes and esters with chainslonger than 9 carbons, as found in flavors related to micediet. We suggest that such compounds may elicit response atconcentration closer to physiological thresholds than the setof aliphatic alcohols and acids used in our simulations.
AcknowledgementsWe want to thank Professor Linda Buck and Dr Betina Malnic(Fred Hutchinson Cancer Research Center) for many helpfuldiscussions about the experiments. We also want to thank DrMichael Singer, Professor Gordon Shepherd (Yale MedicalSchool) and Professor James Bower (University of Texas, SanAntonio) for many insightful suggestions. In addition we thank MrSpencer Hall for helpful discussions. This research was initiatedwith support by an ARO-MURI grant (Dr Robert Campbell) andcompleted with funding from NIHBRGRO1-GM625523, NIH-R29AI40567 and NIH-HD36385. The computational facilitieswere provided by a SUR grant from IBM and a DURIP grant fromARO. The facilities of the Materials and Process Simulation Centerare also supported by DURIP-ONR, DOE (ASCI ASAP), NSF,MURI-ONR, General Motors, ChevronTexaco, Seiko–Epson,Beckman Institute and Asahi Kasei.
ReferencesAlberts, G.L., Pregenzer, J.F. and Bin Im, W. (1998) Contributions of
cysteine 114 of the human D3 dopamine receptor to ligand binding andsensitivity to external oxidizing agents. Br. J. Pharmacol., 125, 705–710.
Allman, K., Page, K.M., Curtis, C.A.M. and Hulme, E.C. (2000) Scan-ning mutagenesis identifies amino acid side chains in transmembranedomain 5 of the M1 muscarinic receptor that participate in binding theacetyl methyl group of acetylcholine. Mol. Pharmacol., 58, 175–184.
Belay, M.T. and Poole, C.F. (1993) Determination of vanillin and relatedflavor compounds in natural vanilla extracts and vanilla-flavored foodsby thin-layer chromatography and automated multiple development.Chromatographia 37, 365–373.
Bissantz, C., Bernard, P., Hibert, M. and Rognan, D. (2003) Protein-based virtual screening of chemical databases II. Are homology modelsof G-protein coupled receptors suitable targets? Proteins Struct. Funct.Genet., 50, 5–25.
Bourdon, H., TrumppKallmeyer, S., Schreuder, H., Hoflack, J.,Hibert, M. and Wermuth, C.G. (1997) Modelling of the binding siteof the human M(1) receptor: experimental validation and refinement. J.Comput. Aid. Mol. Des., 11, 317–332.
Bozza, T.C. and Kauer, J.S. (1998) Odorant response properties of con-vergent olfactory receptor neurons. J. Neurosci., 18, 4560–4569.
Bramwell, A.F., Burrell, J.W.K. and Riezebos, G. (1969) Characteris-ation of pyrazines in galbanum oil. Tetrahedron Lett., 37, 3215.
Buck, L. and Axel, R. (1991) A novel multigene family may encode odorantreceptors: a molecular basis for odor recognition. Cell, 65, 175–187.
Buttery, R.G., Ling, L.C. and Guadagni, D.G. (1969) Food volatiles—volatilities of aldehydes ketones and esters in dilute water solution. J.Agric. Food Chem., 17, 385–389.
Buttery, R.G., Teranishi, R., Ling, L.C. and Turnbaugh, J.G. (1990)Tomato aroma components—identification of glycoside hydrolysis vola-tiles. J. Agric. Food Chem., 38, 336–340.
Chothia, C. and Lesk, A.M. (1986) The relation between the divergenceof sequence and structure in proteins. EMBO J., 5, 823–826.
Cronin, D.A. and Stanton, P. (1976) 2-Methoxy-3-sec-butylpyrazine—important contributor to carrot aroma. J. Sci. Food. Agric., 27, 145–151.
Datta, D., Nagarajan, V., Floriano, W.B., Kim, K.S., Prasadarao, N.V.and Goddard, W.A. III (2003) Interaction of E-coli outer membraneprotein A with sugars on the receptors of the brain microvascularendothelial cells. Proteins Struct. Funct. Genet., 50, 213–221.
Donnelly, D. (1993) Modeling alpha-helical transmembrane domains.Biochem. Soc. Trans., 21, 36–39.
Duchamp-Viret, P., Chaput, M.A. and Duchamp, A. (1999) Odorresponse properties of rat olfactory receptor neurons. Science, 284,2171–2174.
Duke, J.A. (1992) Handbook of Phytochemical Constituents of GRAS Herbsand Other Economic Plants. CRC Press, Boca Raton, FL.
Eisenberg, D., Weiss, R.M. and Terwilliger, T.C. (1984) The hydro-phobic moment detects periodicity in protein hydrophobicity. Proc. NatlAcad. Sci. USA, 8, 140–144.
Ewing, T.A. and Kuntz, I.D. (1997) Critical evaluation of search algor-ithms for automated molecular docking and database screening. J.Comput. Chem., 18, 1175–1189.
Floriano, W.B., Vaidehi, N., Singer, M.S., Shepherd, G.M. and God-dard, W.A. III (2000) Molecular mechanisms underlying differentialodor responses of a mouse olfactory receptor. Proc. Natl Acad. Sci. USA,97, 10712–10716.
Forney, C.F. (2001) Horticultural and other factors affecting aroma volatilecomposition of small fruit. Horttechnology, 11, 529–538.
Freitag, J., Ludwig, G., Andreini, I., Rössler, P. and Breer, H. (1998)Olfactory receptors in aquatic and terrestrial vertebrates. J. Comp. Phys-iol. A, 183, 635–650.
Gasteiger, J. and Marsili, M. (1980) Iterative partial equalization oforbital electronegativity—a rapid access to atomic charges. Tetra-hedron, 36, 3219–3228.
Ghosh, A., Rapp, C.S. and Friesner, R.A. (1998) Generalized bornmodel based on a surface integral formulation. J. Phys. Chem. B, 102,10983–10990.