mali: selected issues - imf.org · background documentation for the periodic consultation with the...
TRANSCRIPT
© 2008 International Monetary Fund August 2008
IMF Country Report No. 08/286
Mali: Selected Issues
This Selected Issues paper for Mali was prepared by a staff team of the International Monetary Fund as background documentation for the periodic consultation with the member country. It is based on the information available at the time it was completed on May 8, 2008. The views expressed in this document are those of the staff team and do not necessarily reflect the views of the government of Mali or the Executive Board of the IMF. The policy of publication of staff reports and other documents by the IMF allows for the deletion of market-sensitive information.
Copies of this report are available to the public from
International Monetary Fund ● Publication Services 700 19th Street, N.W. ● Washington, D.C. 20431
Telephone: (202) 623-7430 ● Telefax: (202) 623-7201 E-mail: [email protected] ● Internet: http://www.imf.org
Price: $18.00 a copy
International Monetary Fund
Washington, D.C.

INTERNATIONAL MONETARY FUND
MALI
Selected Issues
Prepared by Wayne Camard, Saji Thomas, and Abdoul Aziz Wane (All AFR)
Approved by the African Department
May 8, 2008
Contents
I. Avenues for Cotton Reform ................................................................................................. 3
A. Difficulties Facing the Cotton Sector .............................................................................. 3
B. Avenues to Address Problems in the Cotton Sector ........................................................ 5 Reform of the world cotton market................................................................................... 5 Long-term government subsidies to absorb cotton sector losses...................................... 6 Reform of the domestic price-setting mechanism ............................................................ 7 Reform of the integrated “filière” model .......................................................................... 8 Strengthening agricultural services................................................................................... 8 Improving corporate governance at CMDT...................................................................... 8
C. Conclusions ...................................................................................................................... 9
II. Macroeconomic Impact of the Mining Sector.................................................................... 11
A. Mali’s Gold Sector—Prospects and Potential................................................................ 11
B. Policies for a Pro-Development Mining Sector ............................................................. 14 Mining taxation............................................................................................................... 14 Macroeconomic policies and the management of mineral wealth.................................. 16 Other critical policies...................................................................................................... 17
C. Conclusions and Policy Implications ............................................................................. 17
Appendix I. Linkages between Mining and Other Sectors ................................................. 20
III. Private Sector Development— Elements of a Reform Agenda to Spur Growth.............. 22
A. Introduction.................................................................................................................... 22
B. The Agenda for Private Sector-Led Growth .................................................................. 23
C. The Business Climate and Macroeconomic Performance ............................................. 28
D. Concluding Remarks...................................................................................................... 30
2
ACRONYMS AFD Agence Française de Développement (French Development Agency) AfDB African Development Bank CMDT Compagnie Malienne pour le Développement des Textiles (Cotton Ginning
Company of Mali) EITI Extractive Industries Transparency Initiative EU European Union DBI Doing Business Indicators ICAC International Cotton Advisory Council IEF Indicators of Economic Freedom SSA Sub-Saharan Africa USAID United States Agency for International Development WACIP West Africa Cotton Improvement Program WTO World Trade Organization
3
I. AVENUES FOR COTTON REFORM 1
The cotton sector in Mali is facing tall challenges to overcome, with low export prices, technical hurdles, and a poorly-performing state-owned ginner. Some reforms, most notably with regard to the setting of the farmgate procurement price, have already been undertaken, but more is needed to put the sector on a sound financial basis. It is vital that the production process be modernized and the ginner profoundly reformed—all with an eye to production efficiency—if cotton is to play a major role in poverty reduction in rural Mali.
A. Difficulties Facing the Cotton Sector
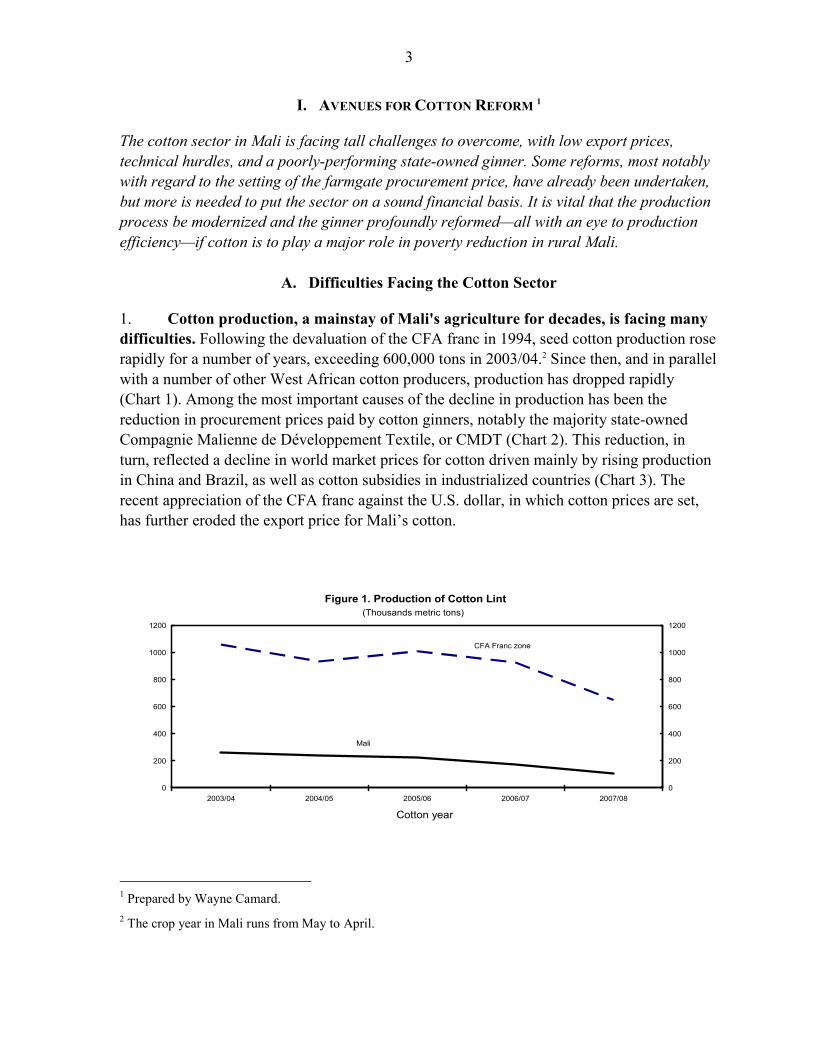
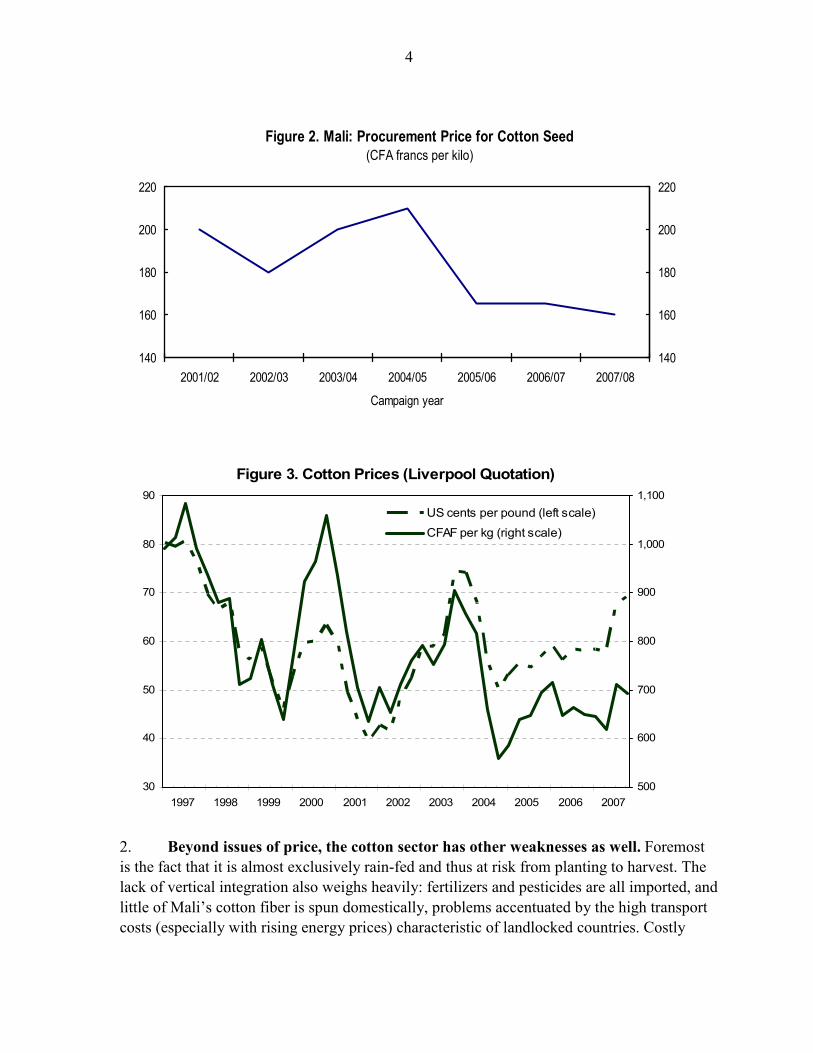
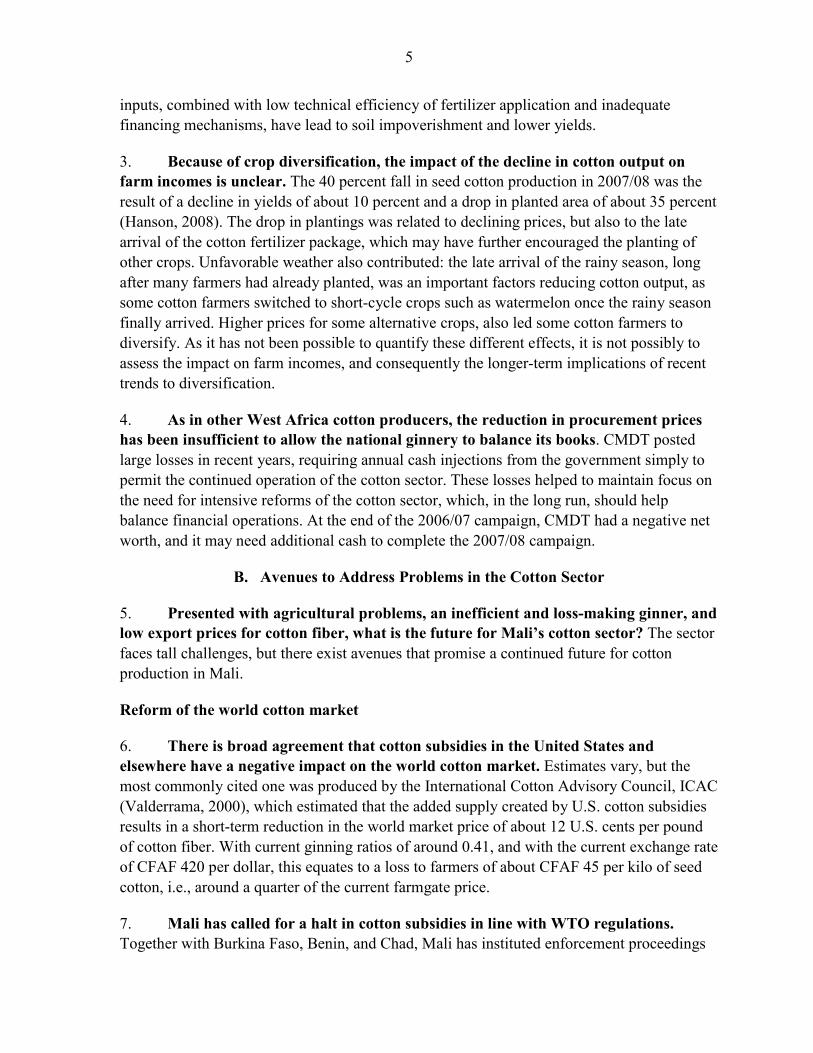
1. Cotton production, a mainstay of Mali's agriculture for decades, is facing many difficulties. Following the devaluation of the CFA franc in 1994, seed cotton production rose rapidly for a number of years, exceeding 600,000 tons in 2003/04.2 Since then, and in parallel with a number of other West African cotton producers, production has dropped rapidly (Chart 1). Among the most important causes of the decline in production has been the reduction in procurement prices paid by cotton ginners, notably the majority state-owned Compagnie Malienne de Développement Textile, or CMDT (Chart 2). This reduction, in turn, reflected a decline in world market prices for cotton driven mainly by rising production in China and Brazil, as well as cotton subsidies in industrialized countries (Chart 3). The recent appreciation of the CFA franc against the U.S. dollar, in which cotton prices are set, has further eroded the export price for Mali’s cotton.
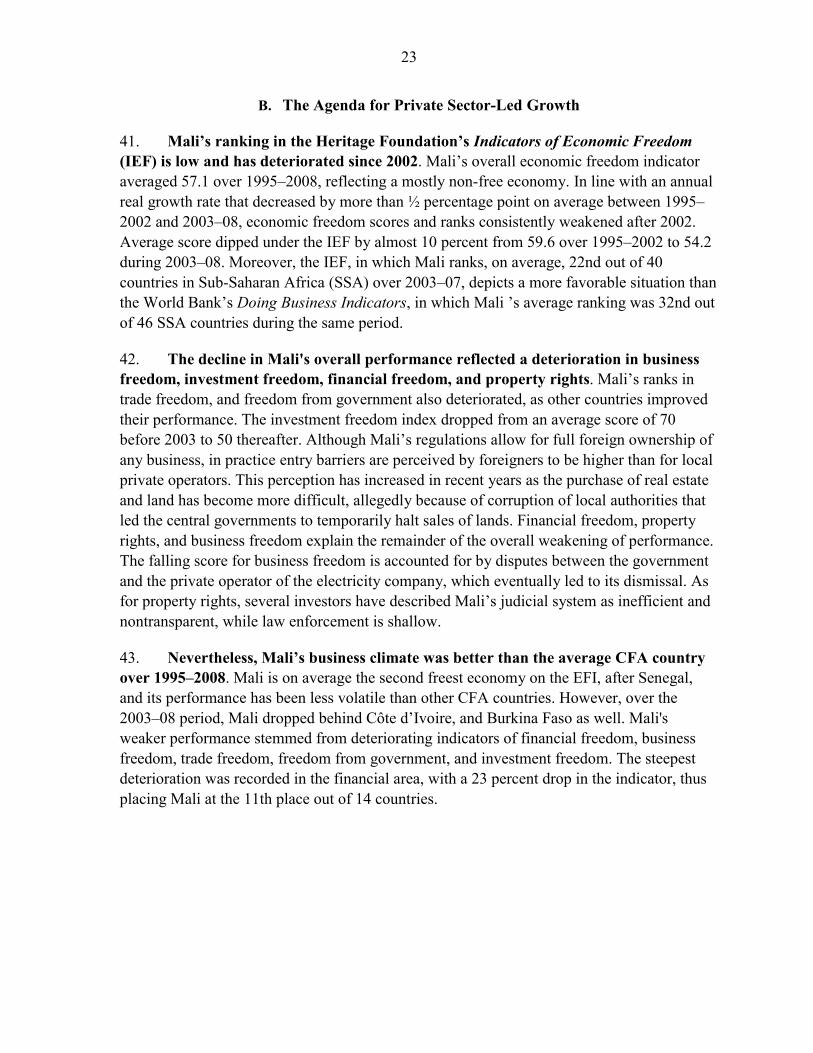
Figure 1. Production of Cotton Lint
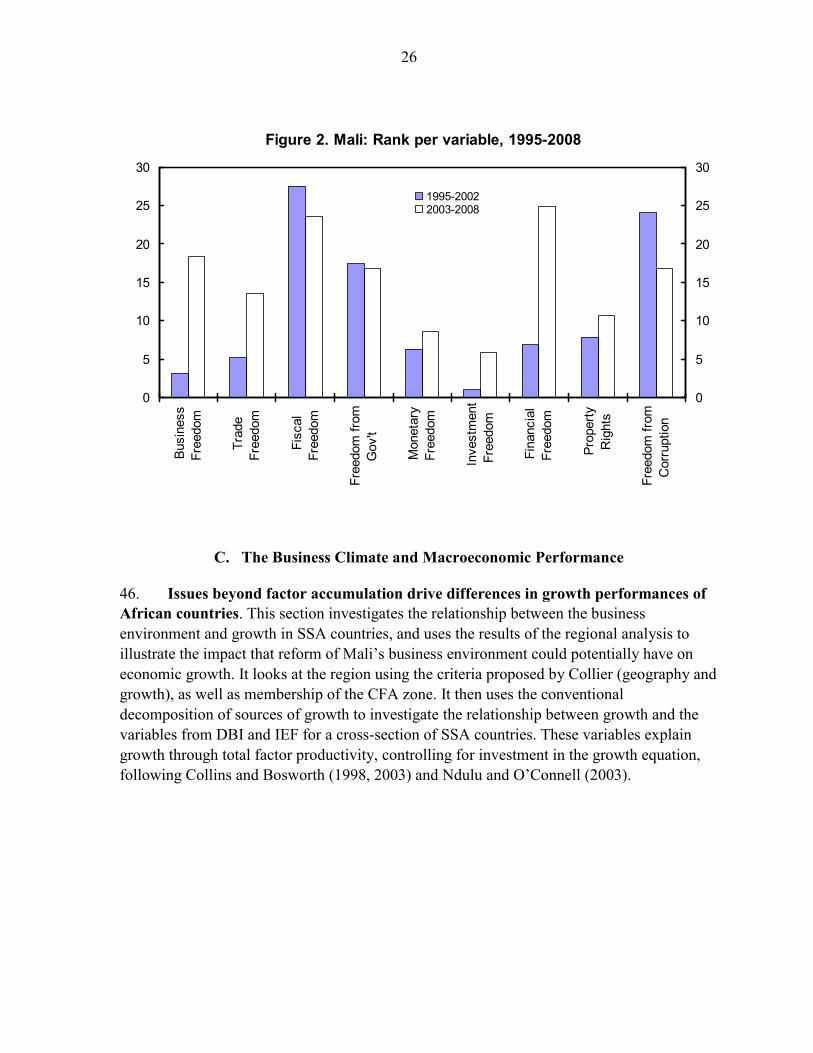
0
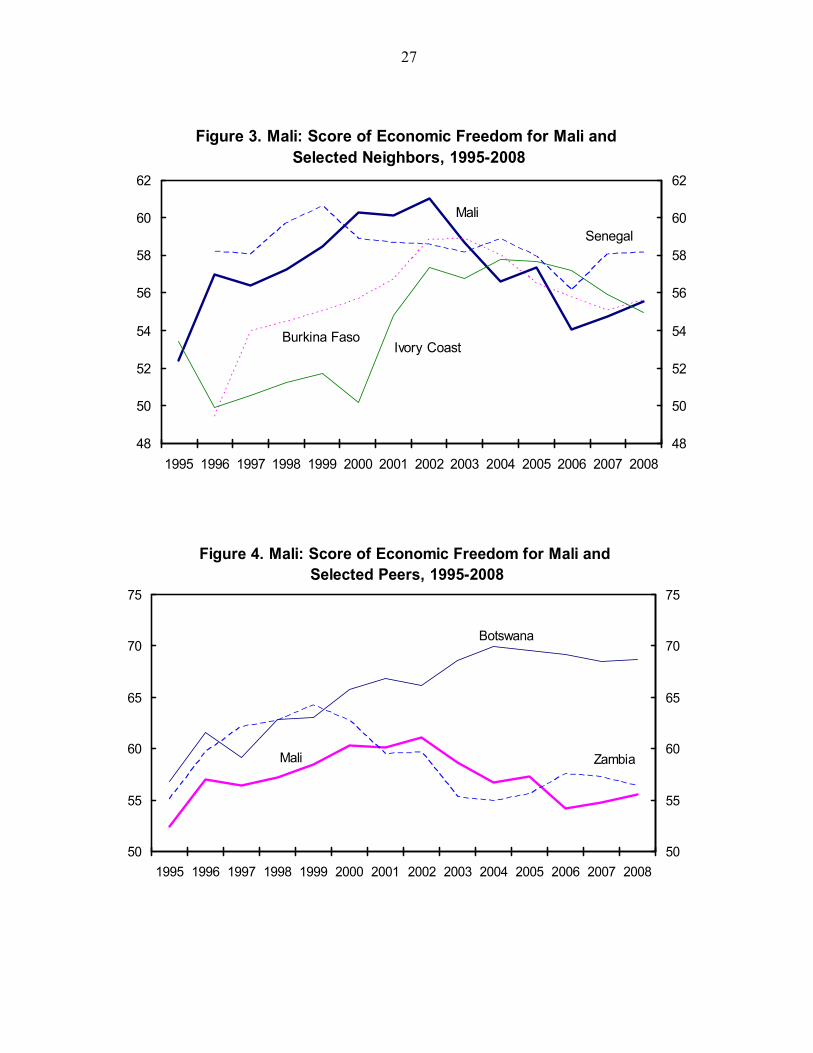
200
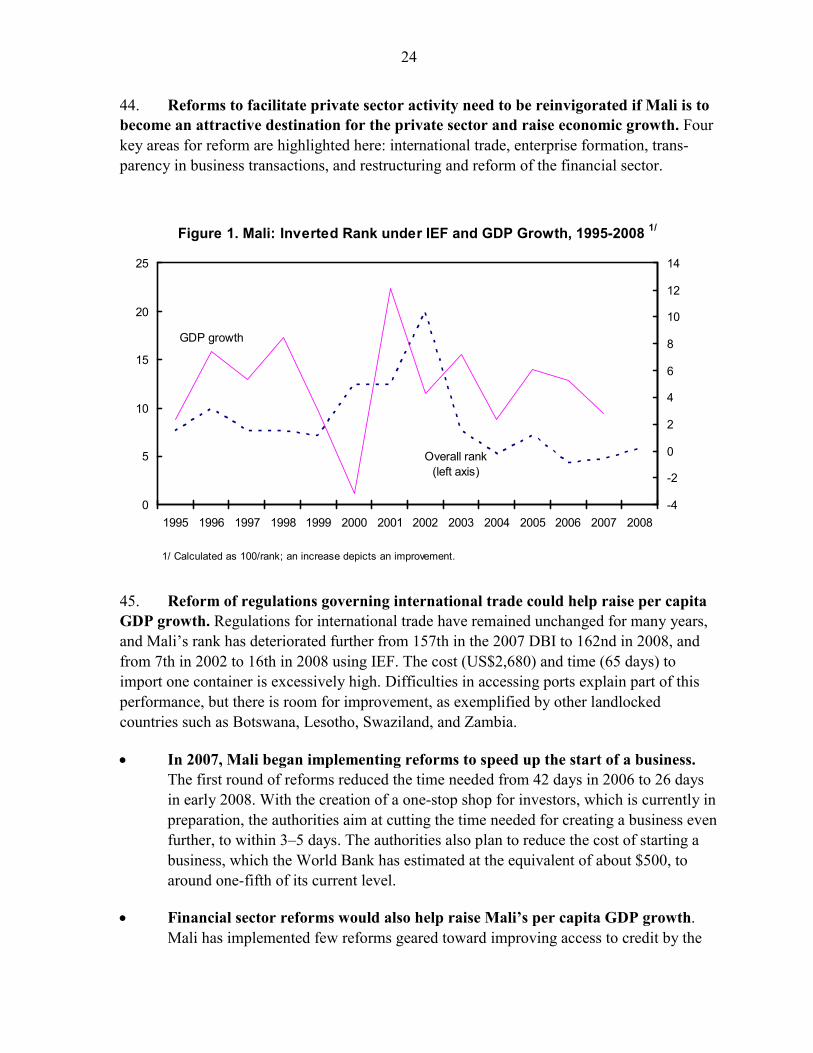
400
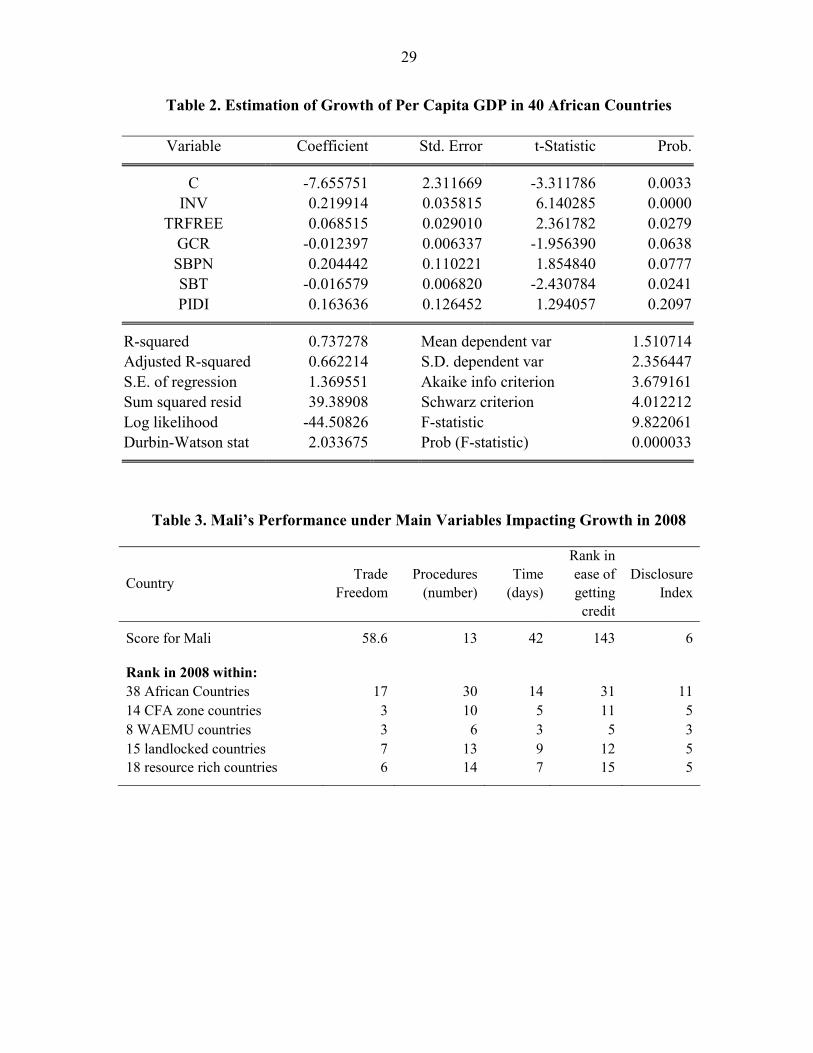
600
800
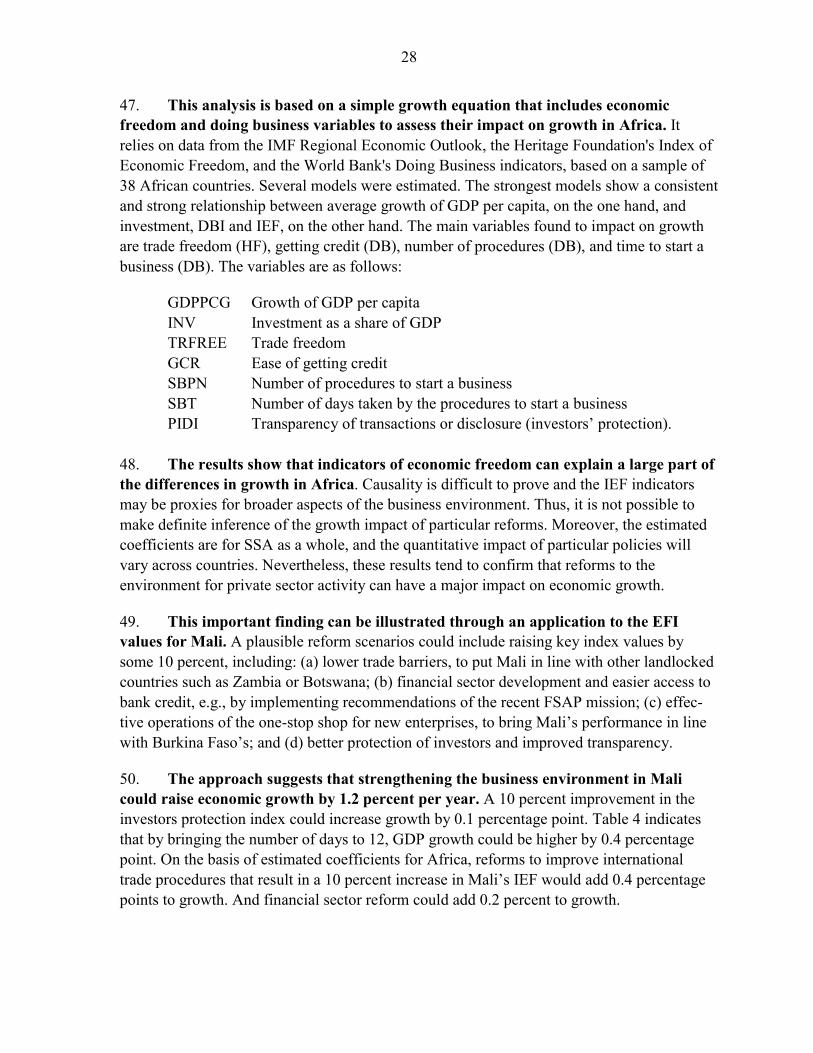
1000
1200
2003/04 2004/05 2005/06 2006/07 2007/08
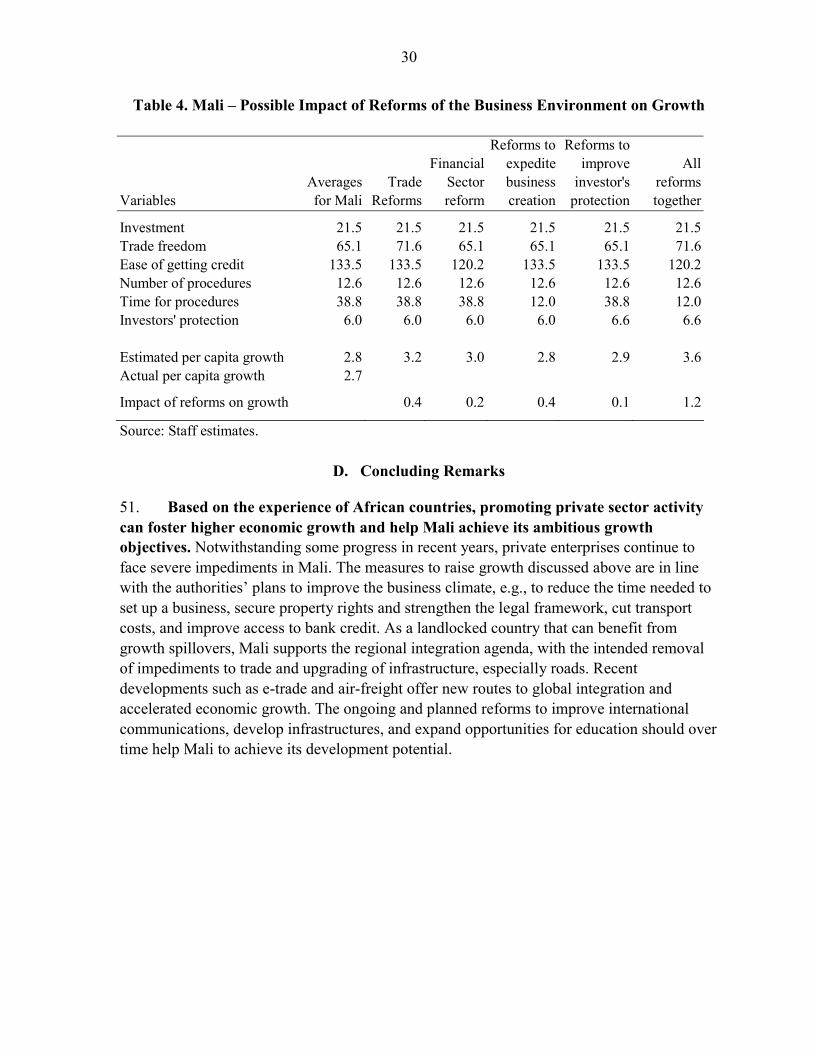
Cotton year
0
200
400
600
800
1000
1200
CFA Franc zone
Mali
(Thousands metric tons)
1 Prepared by Wayne Camard. 2 The crop year in Mali runs from May to April.
4
Figure 2. Mali: Procurement Price for Cotton Seed(CFA francs per kilo)
140
160
180
200
220
2001/02 2002/03 2003/04 2004/05 2005/06 2006/07 2007/08
Campaign year
140
160
180
200
220
Figure 3. Cotton Prices (Liverpool Quotation)
30
40
50
60
70
80
90
1997 1998 1999 2000 2001 2002 2003 2004 2005 2006 2007500
600
700
800
900
1,000
1,100US cents per pound (left scale)
CFAF per kg (right scale)
2. Beyond issues of price, the cotton sector has other weaknesses as well. Foremost is the fact that it is almost exclusively rain-fed and thus at risk from planting to harvest. The lack of vertical integration also weighs heavily: fertilizers and pesticides are all imported, and little of Mali’s cotton fiber is spun domestically, problems accentuated by the high transport costs (especially with rising energy prices) characteristic of landlocked countries. Costly
5
inputs, combined with low technical efficiency of fertilizer application and inadequate financing mechanisms, have lead to soil impoverishment and lower yields.
3. Because of crop diversification, the impact of the decline in cotton output on farm incomes is unclear. The 40 percent fall in seed cotton production in 2007/08 was the result of a decline in yields of about 10 percent and a drop in planted area of about 35 percent (Hanson, 2008). The drop in plantings was related to declining prices, but also to the late arrival of the cotton fertilizer package, which may have further encouraged the planting of other crops. Unfavorable weather also contributed: the late arrival of the rainy season, long after many farmers had already planted, was an important factors reducing cotton output, as some cotton farmers switched to short-cycle crops such as watermelon once the rainy season finally arrived. Higher prices for some alternative crops, also led some cotton farmers to diversify. As it has not been possible to quantify these different effects, it is not possibly to assess the impact on farm incomes, and consequently the longer-term implications of recent trends to diversification.
4. As in other West Africa cotton producers, the reduction in procurement prices has been insufficient to allow the national ginnery to balance its books. CMDT posted large losses in recent years, requiring annual cash injections from the government simply to permit the continued operation of the cotton sector. These losses helped to maintain focus on the need for intensive reforms of the cotton sector, which, in the long run, should help balance financial operations. At the end of the 2006/07 campaign, CMDT had a negative net worth, and it may need additional cash to complete the 2007/08 campaign.
B. Avenues to Address Problems in the Cotton Sector
5. Presented with agricultural problems, an inefficient and loss-making ginner, and low export prices for cotton fiber, what is the future for Mali’s cotton sector? The sector faces tall challenges, but there exist avenues that promise a continued future for cotton production in Mali.
Reform of the world cotton market
6. There is broad agreement that cotton subsidies in the United States and elsewhere have a negative impact on the world cotton market. Estimates vary, but the most commonly cited one was produced by the International Cotton Advisory Council, ICAC (Valderrama, 2000), which estimated that the added supply created by U.S. cotton subsidies results in a short-term reduction in the world market price of about 12 U.S. cents per pound of cotton fiber. With current ginning ratios of around 0.41, and with the current exchange rate of CFAF 420 per dollar, this equates to a loss to farmers of about CFAF 45 per kilo of seed cotton, i.e., around a quarter of the current farmgate price.
7. Mali has called for a halt in cotton subsidies in line with WTO regulations. Together with Burkina Faso, Benin, and Chad, Mali has instituted enforcement proceedings
6
at the WTO as one of the so-called “Cotton 4.” Effective relief from the impact of subsidies could give important breathing room to Mali’s cotton sector. However, there is little indication that such relief through the WTO will be forthcoming in the near future, and Mali needs to pursue other avenues in parallel.
Long-term government subsidies to absorb cotton sector losses
8. Cotton sector subsidies may turn out to be an important income transfer program essential to reduce poverty. For many years, African governments have done just that, often with the financial support of external donors, on the grounds that cotton provided a vital source of cash income to rural households. In addition, in the absence of other tools to perform targeted income transfers to the poor, the higher procurement prices that subsidies provided could lift many poor smallholders out of extreme poverty. Indeed, there is anecdotal evidence from around the region, especially for the 2004/05 campaign when procurement prices tended to be especially high around the region, that farmers used the increased incomes afforded by the high price to procure farm equipment, send children to school, and provide their families with additional health care.
9. The strength of the argument for subsidies, however, requires that cotton transfers have a noticeable impact at an affordable cost. It is not clear that this is the case in Mali today. While Mali’s cotton farmers tend to be relatively productive, they account for a relatively modest share of the population, making any substantial contribution to the per kilo procurement price both expensive and narrowly targeted. To illustrate, Table 1 compares the situation in Mali with that in Chad, where cotton farmers are more numerous but less productive, but where the size of the national budget and the level of procurement prices have been comparable. A subsidy of CFAF 50 per kilo of seed cotton—enough to make up for the impact of international cotton subsidies—would cost Mali some 4 percent of budgetary revenue, against only 1 percent in Chad. Moreover, the subsidy in Chad would potentially reach 20 percent of the population, against only 7 percent in Mali.
10. The effectiveness of the subsidy approach also requires that it not be absorbed by the ginning company. The knowledge that government support will be forthcoming can reduce the incentives to be efficient, as the presence of the subsidies lowers the base procurement price that ginners need to offer to secure production from farmers. This is a particularly important risk where ginners have a local monopsony and can use their power to insist on subsidies as a prerequisite for continued operation.
7
Table 1: The Burden of Cotton Subsidies, Chad and Mali
Chad Mali
Households in cotton production (est.) 350,000 170,000 Households in cotton production (percent of total) 20 7Production of seed cotton, 2006/07 ( MT) 1 98,000 417,000 Yield, 2006/07 (kg per hectare) 1 515 868Cost of a subsidy of CFAF50/kg (CFAF billions) 4.9 20.9
Subsidy per producing household (CFAF) 14,000 122,647 Government revenue, 2007 (CFAF billions) 735 570Cost of a subsidy of CFAF50/kg (percent of revenue) 0.7 3.7Cost of a subsidy of CFAF50/kg (CFAF per hectare) 10.3 17.4
Source: Chadian and Malian authorities and staff estimates. 1Production in the two countries in 2006/07 was down by about one third, compared with earlier years; however, the smaller absolute numbers are roughly proportional and do not affect the basic argument.
Reform of the domestic price-setting mechanism
11. Much attention has been given to the linkages between the farmgate prices paid by CMDT for seed cotton and the world market price of fiber at which it must sell. Mali introduced an important innovation with the 2005/06 cotton campaign. The farmgate price was set at the seed cotton equivalent of 60 percent of the average publicly-quoted world market price, with CMDT retaining the difference between the actual price obtained and the amount paid to farmers. This formula had the advantage of introducing a transparent and automatic link between procurement prices and sales prices. Thus, it provided incentives for CMDT to take steps to improve quality and otherwise obtain the highest possible price from Mali’s cotton, as it retained any premium over the average market price.
12. Unfortunately, the experience after three years has been disappointing. There is no evidence that CMDT has responded to the incentives provided by the mechanism, and it has continued to post substantial losses. Indeed, the level of subsidy has become implicit, rather than reflecting a clear political choice (as evidenced by the recurrent underbudgeting of transfers to CMDT in the Finance Law). At the same time, this approach has increased the level of uncertainty regarding farmgate prices that the peasants—the part least well-equipped to bear price risk in the fiber and textile value chain—must face.
13. There has been extensive discussion in Mali of the possible creation of a price stabilization fund to guarantee a fixed minimum procurement price. There is much interest, in particular, in the recent Burkinabè experience in this regard. However, it is clear that such a fund would not solve the problem of low procurement prices when world market
8
prices are low. Unless donors or the state are committed to making regular contributions to permit the stabilization fund to register recurrent losses (for which advantages and disadvantages are discussed above), any stabilization would face an impossible conundrum. If the guaranteed minimum purchase price were low enough to ensure the long-term viability of the stabilization fund, it would be depriving growers of badly-needed immediate revenue, as they would be themselves implicitly financing the fund in non-crisis years. If, however, the contribution to the fund in a “normal” year (however defined) were kept modest, the viability of the fund in case of a downturn could be easily jeopardized. Indeed, neither a flexible farmgate price not a stabilization fund would solve the problem of low export prices, as they are simply alternative means of distributing a shrunken pie in the face of world prices that will not support adequate farmgate prices and inefficient ginners.
Reform of the integrated “filière” model
14. Barring higher export prices, the avenue to explore is increased production efficiency. Fortunately, there are promising ways to increase efficiency both at the level of the growers and of the ginners. The key for many of these improvements likely lies with a shift away from the traditional “filière” model of integrated sector management centered on the state-owned ginning company, in which the ginner provided credit, inputs, transportation, extension services. As is suggested in a new World Bank study (Labaste et al., 2008), the experience in other parts of Africa suggests that efficiency gains are most likely to be found in moving away from this model of market structure.
Strengthening agricultural services
15. Improved crop yields are critical to increased rural incomes, irrespective of the institutional structure of the sector. Donors are orienting the dialog away from the problems of CMDT and other West African monopsony ginners and onto the producers themselves. With this dialog has come an increased willingness on the part of the government to assume leadership in critical areas such as agricultural research, extension services, and rural roads. Donors have made additional resources available for this work, through instruments like USAID’s West Africa Cotton Improvement Program (WACIP), the AfDB’s Cotton-Textile Support Project, and similar initiatives from donors more traditionally associated with the sector (notably the World Bank, the EU, and AFD). These programs hold out substantial promise of improved yields. The Malian authorities, in particular, have been looking at the experience of Burkina Faso with pest-resistant BT cotton, a genetically-modified variety.
Improving corporate governance at CMDT
16. Notwithstanding possible improvements at the farm level, the cotton sector's viability over the longer term rests in large part on financially-sound ginning operations to buy the seed cotton. In the past, in Mali and elsewhere in the region, the state-owned ginning companies have served variously as an auxiliary treasury for the government, or as
9
the capstone of a political patronage system in the cotton-growing zone that could reward with jobs or punish through the downgrading of purchased cotton. Audits of CMDT in the late 1990s revealed “gross mismanagement, fraud, and embezzlement” (Tefft, 2003). This was one of the bases for the farmers’ boycott of cotton production in 2000/01, which saw output drop by half. Given the even more constrained commercial environment today, it is vital that CMDT reorients itself to be a purely commercial operation.
17. One of the ways under consideration to ensure that CMDT operates on a more commercial basis is privatization. Experience elsewhere in the region has been mixed. Privatization has worked well in Senegal, and reasonably well in Benin and Burkina Faso. It was unsuccessful in Togo, and the failed privatization of the Oils and Soaps Division in Chad has contributed heavily to extensive delays there. In Cameroon, where the state ginner has been relatively successful, the privatization process is just getting under way. This mixed experience underlines the importance of good design and execution in the privatization process.
18. The Malian authorities plan to privatize CMDT, and they have been moving steadily toward this objective. They have created four subsidiary companies (by region), and are transferring the assets of the parent company to the new subsidiaries, which are slated to be sold by 2009. CMDT’s modest government-guaranteed external debt is being assumed by the state, though there is as yet no decision on the disposition of the other liabilities of CMDT, which are substantial.
19. Privatization will not, by itself, resolve the problems of the sector. Little gain should be expected simply in replacing a public monopsony with a private one. Lowering unit costs for ginning will require efficiency gains at the CMDT regional companies. Breaking CMDT into four regional companies will allow comparing the efficiency of ginnery operations. With experience, it may be possible to institute formal benchmarking for company performance, and for the government to serve as a classic regulator of a public service monopsony. In the meantime, the authorities could usefully look closely at the performance of other ginners in the region, in order to gain a better idea of the performance frontier.
C. Conclusions
20. Reforms under way in Mali's cotton sector should help improve efficiency and put the sector on a sound financial footing. With low international cotton prices, no allocational pricing system will solve the problem of reduced cotton incomes. To thrive, the authorities plan to restructure the sector in ways that establish clear incentives to improve productivity. A strengthened ginning sector, perhaps privatized, should permit procurement prices that offer farmers a rational choice between continued cotton production and crop diversification. This will be a critical to strengthen the performance of Mali rain-fed agriculture and improve rural incomes.
10
References
Hanson, Robert (2008), West Africa Cotton Update. Dakar: U.S. Department of Agriculture Foreign Agricultural Service, GAIN Report SG-8001, February 14, 2008.
Labaste, Patrick, et al, “Comparative Analysis of Organization and Performance of African Cotton Sectors: Learning from Experience of Cotton Sector Reform in Africa,” Washington: World Bank, forthcoming.
Tefft, James (2003), “Mali’s White Revolution: Smallholder Cotton from 1960 to 2003,” Pretoria: Successes in African Agriculture (Conference), December 1-3, 2003.
Valderrama Becerra, Carlos (2000), “The World Cotton Market: Prices and Distortions,” Washington: International Cotton Advisory Committee.
11
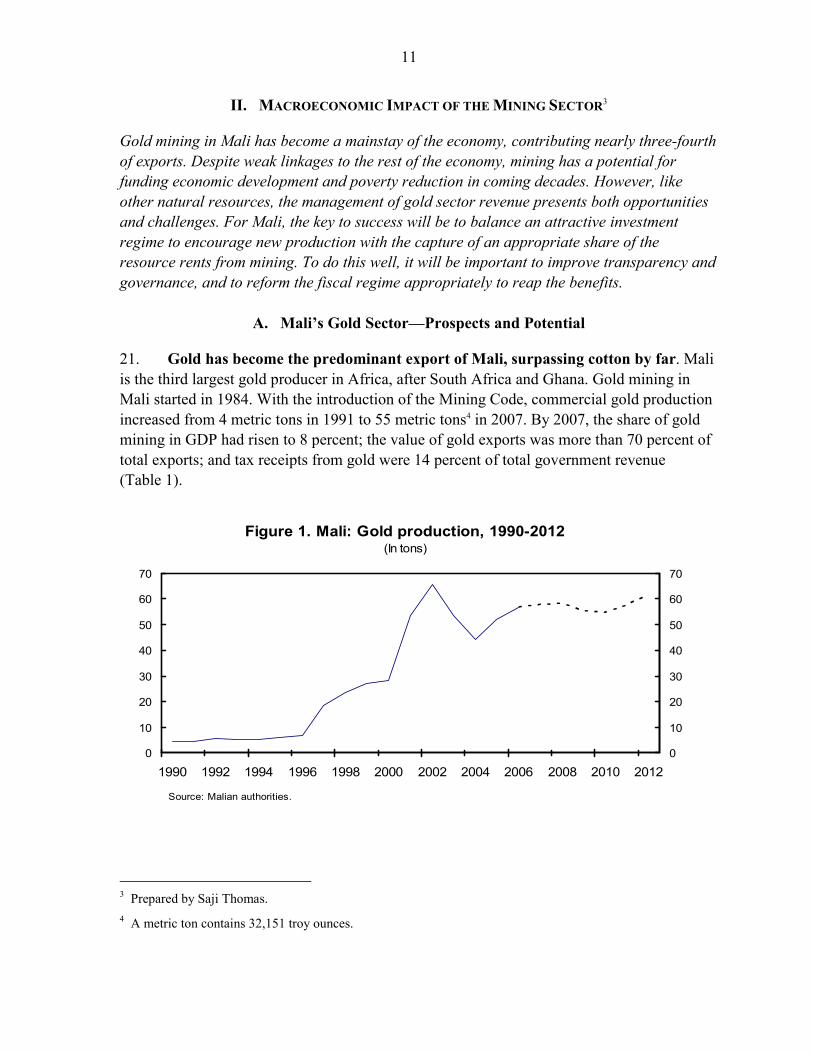
II. MACROECONOMIC IMPACT OF THE MINING SECTOR3
Gold mining in Mali has become a mainstay of the economy, contributing nearly three-fourth of exports. Despite weak linkages to the rest of the economy, mining has a potential for funding economic development and poverty reduction in coming decades. However, like other natural resources, the management of gold sector revenue presents both opportunities and challenges. For Mali, the key to success will be to balance an attractive investment regime to encourage new production with the capture of an appropriate share of the resource rents from mining. To do this well, it will be important to improve transparency and governance, and to reform the fiscal regime appropriately to reap the benefits.
A. Mali’s Gold Sector—Prospects and Potential
21. Gold has become the predominant export of Mali, surpassing cotton by far. Mali is the third largest gold producer in Africa, after South Africa and Ghana. Gold mining in Mali started in 1984. With the introduction of the Mining Code, commercial gold production increased from 4 metric tons in 1991 to 55 metric tons4 in 2007. By 2007, the share of gold mining in GDP had risen to 8 percent; the value of gold exports was more than 70 percent of total exports; and tax receipts from gold were 14 percent of total government revenue (Table 1).
Figure 1. Mali: Gold production, 1990-2012(In tons)
0
10
20
30
40
50
60
70
1990 1992 1994 1996 1998 2000 2002 2004 2006 2008 2010 20120
10
20
30
40
50
60
70
Source: Malian authorities.
3 Prepared by Saji Thomas. 4 A metric ton contains 32,151 troy ounces.
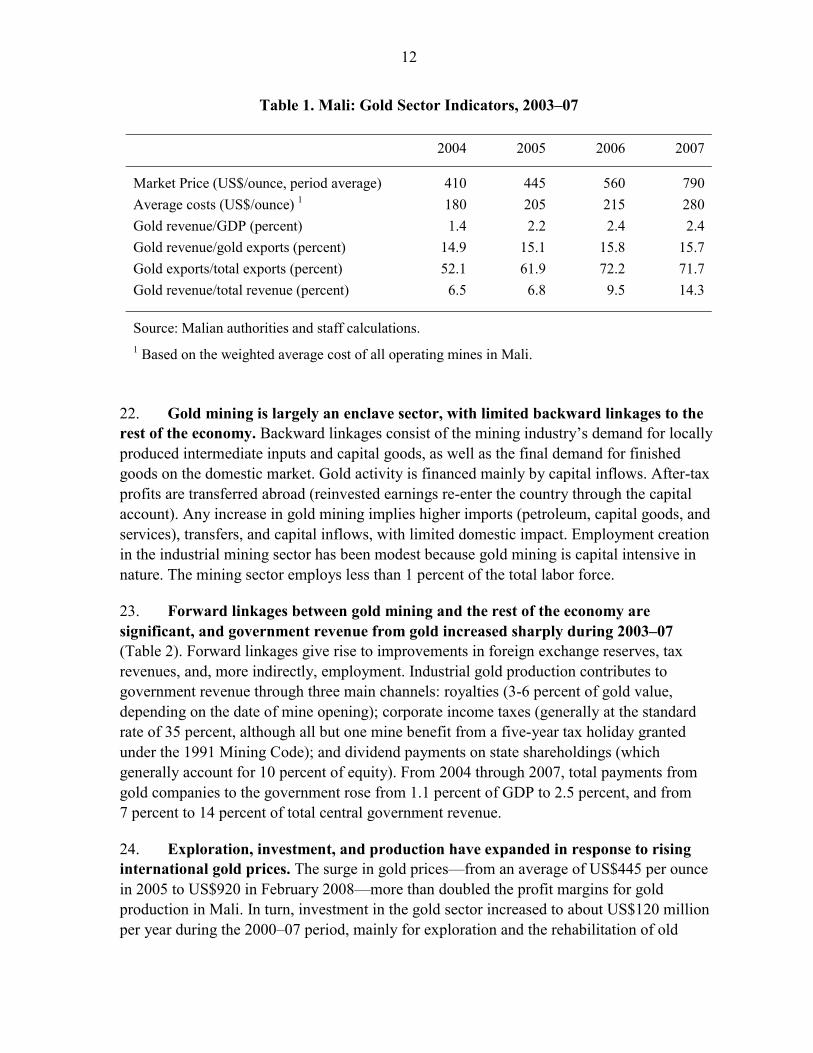
12
Table 1. Mali: Gold Sector Indicators, 2003–07
2004 2005 2006 2007
Market Price (US$/ounce, period average) 410 445 560 790 Average costs (US$/ounce) 1 180 205 215 280 Gold revenue/GDP (percent) 1.4 2.2 2.4 2.4 Gold revenue/gold exports (percent) 14.9 15.1 15.8 15.7 Gold exports/total exports (percent) 52.1 61.9 72.2 71.7 Gold revenue/total revenue (percent) 6.5 6.8 9.5 14.3
Source: Malian authorities and staff calculations. 1 Based on the weighted average cost of all operating mines in Mali.
22. Gold mining is largely an enclave sector, with limited backward linkages to the rest of the economy. Backward linkages consist of the mining industry’s demand for locally produced intermediate inputs and capital goods, as well as the final demand for finished goods on the domestic market. Gold activity is financed mainly by capital inflows. After-tax profits are transferred abroad (reinvested earnings re-enter the country through the capital account). Any increase in gold mining implies higher imports (petroleum, capital goods, and services), transfers, and capital inflows, with limited domestic impact. Employment creation in the industrial mining sector has been modest because gold mining is capital intensive in nature. The mining sector employs less than 1 percent of the total labor force.
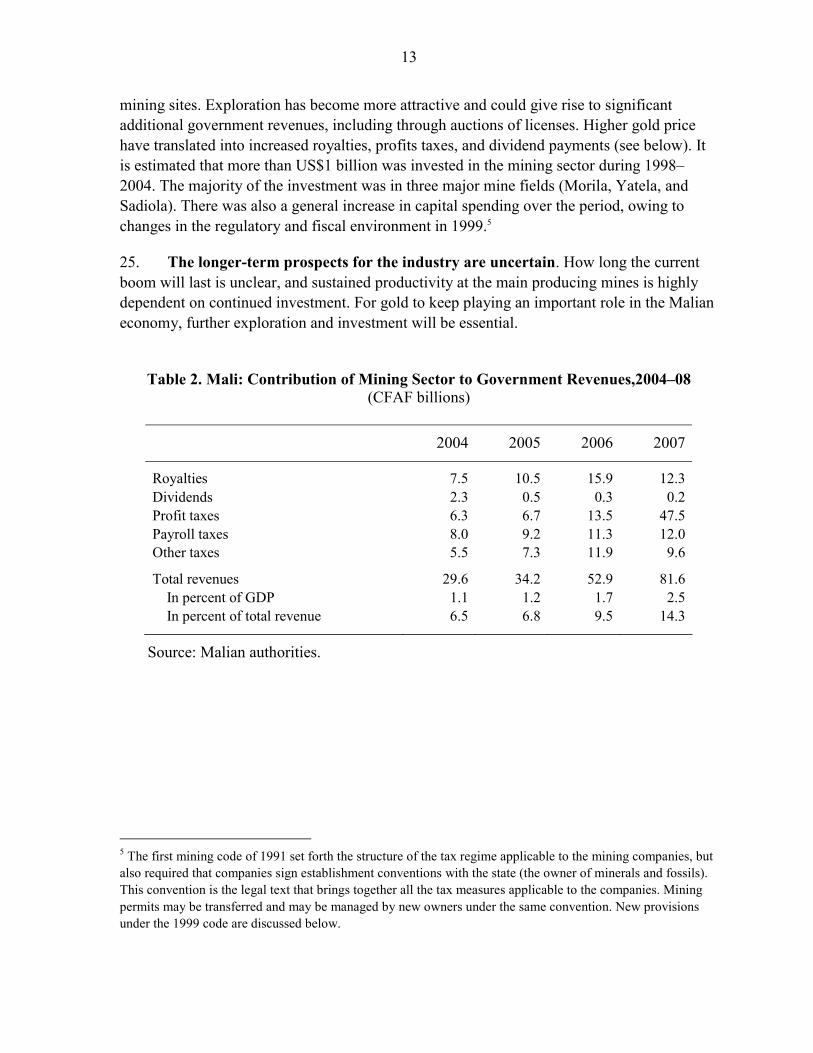
23. Forward linkages between gold mining and the rest of the economy are significant, and government revenue from gold increased sharply during 2003–07 (Table 2). Forward linkages give rise to improvements in foreign exchange reserves, tax revenues, and, more indirectly, employment. Industrial gold production contributes to government revenue through three main channels: royalties (3-6 percent of gold value, depending on the date of mine opening); corporate income taxes (generally at the standard rate of 35 percent, although all but one mine benefit from a five-year tax holiday granted under the 1991 Mining Code); and dividend payments on state shareholdings (which generally account for 10 percent of equity). From 2004 through 2007, total payments from gold companies to the government rose from 1.1 percent of GDP to 2.5 percent, and from 7 percent to 14 percent of total central government revenue.
24. Exploration, investment, and production have expanded in response to rising international gold prices. The surge in gold prices—from an average of US$445 per ounce in 2005 to US$920 in February 2008—more than doubled the profit margins for gold production in Mali. In turn, investment in the gold sector increased to about US$120 million per year during the 2000–07 period, mainly for exploration and the rehabilitation of old
13
mining sites. Exploration has become more attractive and could give rise to significant additional government revenues, including through auctions of licenses. Higher gold price have translated into increased royalties, profits taxes, and dividend payments (see below). It is estimated that more than US$1 billion was invested in the mining sector during 1998–2004. The majority of the investment was in three major mine fields (Morila, Yatela, and Sadiola). There was also a general increase in capital spending over the period, owing to changes in the regulatory and fiscal environment in 1999.5
25. The longer-term prospects for the industry are uncertain. How long the current boom will last is unclear, and sustained productivity at the main producing mines is highly dependent on continued investment. For gold to keep playing an important role in the Malian economy, further exploration and investment will be essential.
Table 2. Mali: Contribution of Mining Sector to Government Revenues,2004–08
(CFAF billions)
2004 2005 2006 2007
Royalties 7.5 10.5 15.9 12.3 Dividends 2.3 0.5 0.3 0.2Profit taxes 6.3 6.7 13.5 47.5 Payroll taxes 8.0 9.2 11.3 12.0 Other taxes 5.5 7.3 11.9 9.6
Total revenues 29.6 34.2 52.9 81.6 In percent of GDP 1.1 1.2 1.7 2.5 In percent of total revenue 6.5 6.8 9.5 14.3
Source: Malian authorities.
5 The first mining code of 1991 set forth the structure of the tax regime applicable to the mining companies, but also required that companies sign establishment conventions with the state (the owner of minerals and fossils). This convention is the legal text that brings together all the tax measures applicable to the companies. Mining permits may be transferred and may be managed by new owners under the same convention. New provisions under the 1999 code are discussed below.
14
B. Policies for a Pro-Development Mining Sector
Mining taxation
26. Taxation of the mineral sector represents the price for the right to extract a scarce resource. The tax objectives arise from the role of the state as owner of minerals, which requires the government to secure an appropriate share in the mineral rent. Maintaining the neutrality characteristic of mineral taxation is essential to fulfill this objective. Mineral extraction makes it possible to generate sizable economic rents, which may exceed the return thresholds necessary to constitute an incentive for the potential investor to carry out the project. Given these types of motivations for mineral taxation, the specific issues in the taxation of mineral resources are: (a) how much to tax, (b) whether a separate tax regime is needed for the mineral sector, and (c) how to combine different levies in a multi-levy system
27. In designing an appropriate mineral tax regime, Mali needs to assess the efficiency of various types of tax instruments and their effect on the incentives and behavior of mining companies. The primary concern should be to design an equitable mineral extraction policy that encourages new investment while ensuring that an appropriate share of resource rents accrue to the government. The choice among fiscal instruments depends on the timing of revenue, risk sharing, administrative convenience and political judgment. The key features of an effective taxation system in the mining sector are fiscal stability, taxation of the mineral rent, avoidance of excessive fiscal risks, and robustness of the tax system. Product-based royalties can ensure that the government receives at least a minimum payment for the exploitation of minerals, and which is less volatile than profit tax revenue. However, profit-based instruments reduce uncertainty in mineral contracts because they mean that the government shares in the returns from projects that could be more profitable than expected and do not unduly penalize investors when economic profits are low.
28. The Mining Code adopted by Mali in 1999 streamlined the permit issuance process and substantially altered the mineral tax regime by shifting the tax burden from inputs and production towards profits. Mining has been regulated by law since 1970, and the legislation was significantly reformed in 1991 and modified again in 1999 with support from the World Bank. Accordingly, royalty on gold production was reduced from 6 percent to 3 percent and customs duties were lowered, in line with the WAEMU common external tariff. The tax holidays on corporate income and import duties during the initial years of production were eliminated and a dividend withholding tax applied. Regulations concerning government participation in the capital of the mining enterprises (back-in-rights) were also modified. These policy changes were designed to foster the development of new gold deposits and increase government revenue from the sector.
15
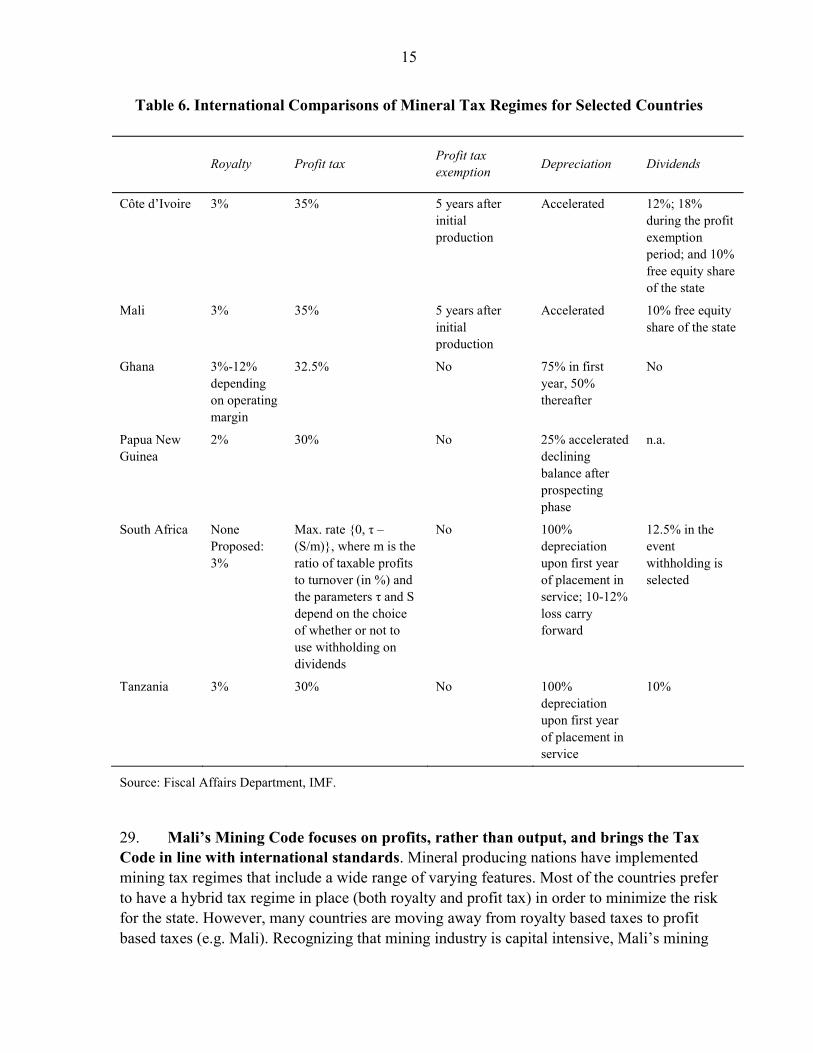
Table 6. International Comparisons of Mineral Tax Regimes for Selected Countries
Royalty Profit tax Profit tax exemption Depreciation Dividends
Côte d’Ivoire 3% 35% 5 years after initial production
Accelerated 12%; 18% during the profit exemption period; and 10% free equity share of the state
Mali 3% 35% 5 years after initial production
Accelerated 10% free equity share of the state
Ghana 3%-12% depending on operating margin
32.5% No 75% in first year, 50% thereafter
No
Papua New Guinea
2% 30% No 25% accelerated declining balance after prospecting phase
n.a.
South Africa None Proposed: 3%
Max. rate {0, τ – (S/m)}, where m is the ratio of taxable profits to turnover (in %) and the parameters τ and S depend on the choice of whether or not to use withholding on dividends
No 100% depreciation upon first year of placement in service; 10-12% loss carry forward
12.5% in the event withholding is selected
Tanzania 3% 30% No 100% depreciation upon first year of placement in service
10%
Source: Fiscal Affairs Department, IMF.
29. Mali’s Mining Code focuses on profits, rather than output, and brings the Tax Code in line with international standards. Mineral producing nations have implemented mining tax regimes that include a wide range of varying features. Most of the countries prefer to have a hybrid tax regime in place (both royalty and profit tax) in order to minimize the risk for the state. However, many countries are moving away from royalty based taxes to profit based taxes (e.g. Mali). Recognizing that mining industry is capital intensive, Mali’s mining
16
tax regime permits the mining enterprise to recover its capital costs before paying income tax. This capital cost recovery is achieved by allowing immediate 100 percent tax deductions for capital costs and infrastructure costs that are incurred during the pre-production period to be depreciated for tax purposes at a 100% rate. While the tax regimes in African countries are broadly comparable, there are some differences on profit taxes, especially with respects to depreciation allowances, reflecting the specificities of each tax regime. In fact, however, what matters for investors (as well as for the state) is the entire tax regime, which means that international comparisons require a comprehensive evaluation of these tax regimes by performing a financial simulation of their impact (Table 6).
30. The tax system applied to the gold sector should provide enough incentives to investors while simultaneously yielding the state an adequate share of rents. Achieving such a balance is not easy. While Mali is retaining the structure of the 1999 Mining Code, the government should develop a better understanding of the taxes payable by mining companies and instill greater certainty with regard to the tax regime. Going forward, issues to consider when revising the Mining Code include sharing of revenue between the central and local governments, and the rights and obligations of minority (state) shareholders.
Macroeconomic policies and the management of mineral wealth
31. Mineral resources can contribute to poverty reduction and growth if exploited and managed carefully. Under appropriate conditions, mineral resources can spur the development of the country. In some developing countries, such as Botswana, revenues from mining companies have been an important engine for economic growth and social development. Natural resources generate substantial income, which can help finance social outlays, infrastructure, and productive capacity, thus adding to future output levels.
32. However, natural resources also pose serious macroeconomic management challenges. The “resource curse” is a complex phenomenon, in which three different processes come into play (Sachs and Warner, 2001). The first process is real currency appreciation arising from resource revenues and its negative effect on the competitive position of other industries (generally referred to as “Dutch disease”). The second process is financial instability, owing to fluctuations in commodity prices and the associated disruptive effects on the government budget. The third process is the effect on political conditions, which historically in some cases reached extreme proportions. Thus, the extraction of natural resources often sets in motion a chain of events that brings to the forefront specific sectors—i.e., the natural resource sector itself and certain activities in the nontradables sector, such as construction, to the detriment of other sectors. As a result, traditional exports become less profitable, causing widespread unemployment.
33. In this environment, it is important that macroeconomic policies are suffi-ciently prudent and supported by appropriate structural policies. With respect to macroeconomic policies, fiscal policy—especially in the fixed exchange rate environment
17
of the CFA franc zone—should be run conservatively. Ideally, the authorities should aim to keep the basic fiscal balance in a range between zero and a surplus equivalent to mining revenue. This approach would help generate savings in good times and provide con-tingencies against an abrupt drop in mining sector revenue. With respect to structural policies, the focus should be on steps to improve the efficiency of the economy and enhance its international competitiveness to counteract any potential Dutch disease-type effects, and thus support employment generation.
Other policies
34. Weak institutions and the lack of accountability and transparency tend to have more deleterious consequences in the face of natural resource revenues. The relative abundance of money often fuels corruption, widens inequality, or even generates conflicts. Natural resource revenues can undermine governments, making them less likely to provide public goods such as health care and education. Large mining revenues may prompt governments to lower or eliminate other taxes and increase spending. In such cases, the population is less likely to demand accountability (Mehlum, 2002). However, the Extractive Industries Transparency Initiative (EITI)—which Mali is committed to implementing in 2008–09—can to improve transparency in mining revenue collection and related expenditure.6
35. Mining operations also entail environmental costs as a result of waste disposal, dust, and water pollution. If not managed properly, these problems could adversely affect the health and livelihood of the population living near mining operations. Key to mitigating environmental risks is setting and monitoring appropriate environmental standards and ensuring adequate environmental and social safeguards at all stages of a mining operation, ranging from exploration, construction, operation, to the closure of mines. In particular, it is important that sufficient funds be saved for clean-up operations. Other pressing issues relate to the rehabilitation of mines after closure (e.g., how to return a disturbed land to a pre-development state or to make alternative use of the land). Mali has taken certain steps to mitigate environmental risks by using regulations as well as direct agreements with the mining companies, including for building up funds for future cleanup operations, and by establishing appropriate environmental performance standards.
C. Conclusions and Policy Implications
36. Natural resources are gifts that require proper management, and good governance is crucial to transform natural wealth into good economic performance. Mining, being an enclave activity, has weak linkages with the rest of the economy. Thus, transparency of gold revenues in terms of its collection and spending becomes very
6 Details on EITI are available at the “eitransparency.org” website.
18
important. If properly managed, natural resources can yield rents that are an important source of development finance. If poorly managed, however, these resources become a curse.
37. Mali’s Mining Code is broadly well suited to ensure that the state gets a fair share of its resources while retaining sufficient incentives over the longer term to attract new exploration. The Mining Code is in line with the fiscal regimes in other sub-Saharan African countries, and it seems appropriate for the authorities to maintain the current mining tax regime, which apportions the risks between the state and the mining companies. However, there is scope to improve its effectiveness, e.g., by adhering to accounting best practices.
38. Transparency of revenue payments from mining companies to governments is an essential step toward greater accountability and an informed debate, and thus toward better governance. Revenue transparency is expected to improve with Mali’s adherence to EITI standards in 2009. In addition to ensuring that revenue flows are fully accounted for and disclosed in a transparent manner, the authorities should focus on using its resources for poverty reduction and development and addressing environmental in a timely manner.
19
References Aryee, Benjamin (2000), “Ghana’s mining sector: its contribution to the national economy,”
Resources Policy, 27, p 61-75.
Baunsgaard, Thomas (2001), “A Primer on Mineral Taxation,” IMF Working Paper, WP/01/139.
Bannon, Ian and Collier, Paul Eds. (2003), “Natural Resources and Violent Conflict: Actions and Options,” World Bank.
Collier, P. (2003), “Breaking the Conflict Trap: Civil War and Development Policy,” Oxford University Press.
Davis, J., R. Ossowski, J. Daniel, and S. Barnett (2001), “Stabilization and Savings Funds for Nonrenewable Resources,” IMF Occasional Paper No. 205, Washington D.C.
Mehlum, H and R. Torvik (2002), “Institutions and the Resource Curse,” Department of Economics University of Oslo, No 29.
PricewaterhouseCoopers (2000), “Mineral Taxation Policies in Asia,” New York.
Sachs, J and Warner, A (2001), “The Curse of Natural Resources,” European Economic Review, 45 827-38.
Sarma, J.V.M and G. Naresh (2001), “Mineral Taxation around the World. Trends and Issues,” Asia-Pacific Tax Bulletin. January 2001.
20
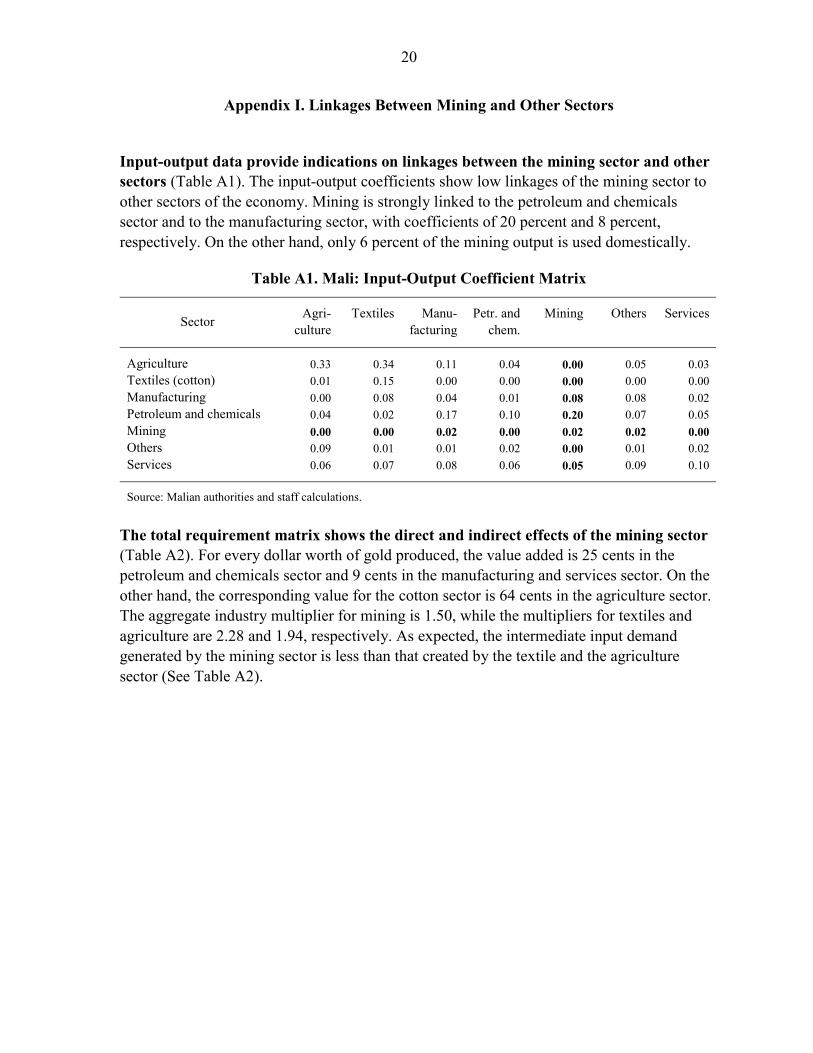
Appendix I. Linkages Between Mining and Other Sectors
Input-output data provide indications on linkages between the mining sector and other sectors (Table A1). The input-output coefficients show low linkages of the mining sector to other sectors of the economy. Mining is strongly linked to the petroleum and chemicals sector and to the manufacturing sector, with coefficients of 20 percent and 8 percent, respectively. On the other hand, only 6 percent of the mining output is used domestically.
Table A1. Mali: Input-Output Coefficient Matrix
Sector Agri-culture
Textiles Manu-facturing
Petr. and chem.
Mining Others Services
Agriculture 0.33 0.34 0.11 0.04 0.00 0.05 0.03 Textiles (cotton) 0.01 0.15 0.00 0.00 0.00 0.00 0.00 Manufacturing 0.00 0.08 0.04 0.01 0.08 0.08 0.02 Petroleum and chemicals 0.04 0.02 0.17 0.10 0.20 0.07 0.05 Mining 0.00 0.00 0.02 0.00 0.02 0.02 0.00 Others 0.09 0.01 0.01 0.02 0.00 0.01 0.02 Services 0.06 0.07 0.08 0.06 0.05 0.09 0.10
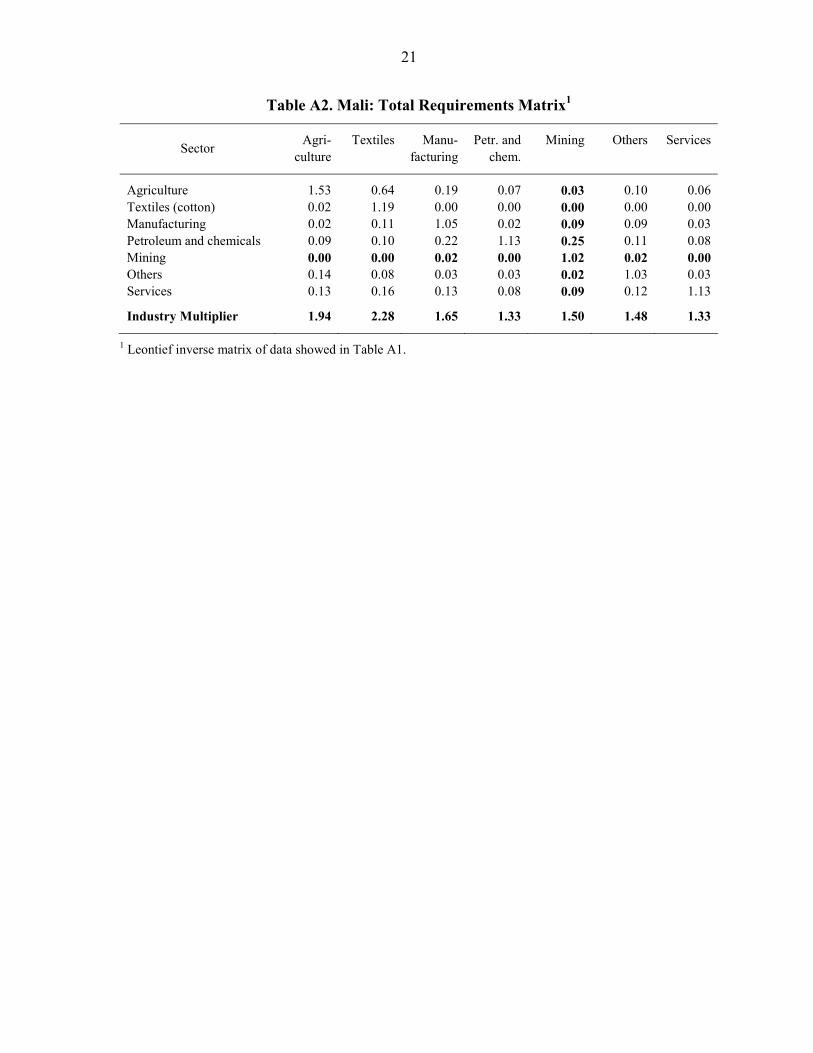
Source: Malian authorities and staff calculations. The total requirement matrix shows the direct and indirect effects of the mining sector (Table A2). For every dollar worth of gold produced, the value added is 25 cents in the petroleum and chemicals sector and 9 cents in the manufacturing and services sector. On the other hand, the corresponding value for the cotton sector is 64 cents in the agriculture sector. The aggregate industry multiplier for mining is 1.50, while the multipliers for textiles and agriculture are 2.28 and 1.94, respectively. As expected, the intermediate input demand generated by the mining sector is less than that created by the textile and the agriculture sector (See Table A2).
21
Table A2. Mali: Total Requirements Matrix1
Sector Agri-culture
Textiles Manu-facturing
Petr. and chem.
Mining Others Services
Agriculture 1.53 0.64 0.19 0.07 0.03 0.10 0.06 Textiles (cotton) 0.02 1.19 0.00 0.00 0.00 0.00 0.00 Manufacturing 0.02 0.11 1.05 0.02 0.09 0.09 0.03 Petroleum and chemicals 0.09 0.10 0.22 1.13 0.25 0.11 0.08 Mining 0.00 0.00 0.02 0.00 1.02 0.02 0.00 Others 0.14 0.08 0.03 0.03 0.02 1.03 0.03 Services 0.13 0.16 0.13 0.08 0.09 0.12 1.13
Industry Multiplier 1.94 2.28 1.65 1.33 1.50 1.48 1.33
1 Leontief inverse matrix of data showed in Table A1.
22
III. PRIVATE SECTOR DEVELOPMENT— ELEMENTS OF A REFORM AGENDA TO SPUR GROWTH7
This chapter assesses priority areas for reforming the business environment in Mali to boost economic growth. In particular, it analyzes the role of business environment, measured by economic freedom and doing business indicators, in explaining growth. After identifying the correlation between these indicators and economic growth in Africa, it investigates how Mali scores on these indicators and assesses the possible impact of reforms of the business environment on growth in Mali.
A. Introduction
39. Mali's lackluster growth performance during the last decade is somewhat surprising, in view of the large aid inflows and strong record of macroeconomic stability. An important part of the explanation can be found in the weakness of the private sector. This chapter discusses how far-reaching reforms of the business environment can promote private sector activity and contribute to achieving Mali ambitious growth targets of 7 percent per year for 2007-11. Although Mali’s business environment is to some extent influenced by its geography, the performance of countries with comparable constraints and natural resource endowments suggest that there is much room to improve Mali’s business climate through private sector-friendly reforms.
40. This chapter looks at the agenda for private sector-led growth in Mali. It does so both through a comparison with other countries in the region and through an exercise to illustrate the potential impact of reforms. Economic theory and experience show that basic institutions that protect the liberty of individuals to pursue their economic interests result in greater prosperity for the society as a whole. Modern scholars of political economy are rediscovering the centrality of free institutions as fundamental ingredients for rapid long-term growth. Hall and Jones (1999), Rodrik (1999), Acemoglu et al (2001), and Djankov et al (2003), among others, have highlighted the role of institutions as a major determinant of growth. Countries that had better political and economic institutions in the past are richer today. The question of how to develop good institutions in a poor country such a Mali remains unanswered, but there is no shortage of clues.
7 Prepared by Abdoul Aziz Wane.
23
B. The Agenda for Private Sector-Led Growth
41. Mali’s ranking in the Heritage Foundation’s Indicators of Economic Freedom (IEF) is low and has deteriorated since 2002. Mali’s overall economic freedom indicator averaged 57.1 over 1995–2008, reflecting a mostly non-free economy. In line with an annual real growth rate that decreased by more than ½ percentage point on average between 1995–2002 and 2003–08, economic freedom scores and ranks consistently weakened after 2002. Average score dipped under the IEF by almost 10 percent from 59.6 over 1995–2002 to 54.2 during 2003–08. Moreover, the IEF, in which Mali ranks, on average, 22nd out of 40 countries in Sub-Saharan Africa (SSA) over 2003–07, depicts a more favorable situation than the World Bank’s Doing Business Indicators, in which Mali ’s average ranking was 32nd out of 46 SSA countries during the same period.
42. The decline in Mali's overall performance reflected a deterioration in business freedom, investment freedom, financial freedom, and property rights. Mali’s ranks in trade freedom, and freedom from government also deteriorated, as other countries improved their performance. The investment freedom index dropped from an average score of 70 before 2003 to 50 thereafter. Although Mali’s regulations allow for full foreign ownership of any business, in practice entry barriers are perceived by foreigners to be higher than for local private operators. This perception has increased in recent years as the purchase of real estate and land has become more difficult, allegedly because of corruption of local authorities that led the central governments to temporarily halt sales of lands. Financial freedom, property rights, and business freedom explain the remainder of the overall weakening of performance. The falling score for business freedom is accounted for by disputes between the government and the private operator of the electricity company, which eventually led to its dismissal. As for property rights, several investors have described Mali’s judicial system as inefficient and nontransparent, while law enforcement is shallow.
43. Nevertheless, Mali’s business climate was better than the average CFA country over 1995–2008. Mali is on average the second freest economy on the EFI, after Senegal, and its performance has been less volatile than other CFA countries. However, over the 2003–08 period, Mali dropped behind Côte d’Ivoire, and Burkina Faso as well. Mali's weaker performance stemmed from deteriorating indicators of financial freedom, business freedom, trade freedom, freedom from government, and investment freedom. The steepest deterioration was recorded in the financial area, with a 23 percent drop in the indicator, thus placing Mali at the 11th place out of 14 countries.
24
44. Reforms to facilitate private sector activity need to be reinvigorated if Mali is to become an attractive destination for the private sector and raise economic growth. Four key areas for reform are highlighted here: international trade, enterprise formation, trans-parency in business transactions, and restructuring and reform of the financial sector.
Overall rank(left axis)
GDP growth
0
5
10
15
20
25
1995 1996 1997 1998 1999 2000 2001 2002 2003 2004 2005 2006 2007 2008-4
-2
0
2
4
6
8
10
12
14
Figure 1. Mali: Inverted Rank under IEF and GDP Growth, 1995-2008 1/
1/ Calculated as 100/rank; an increase depicts an improvement.
45. Reform of regulations governing international trade could help raise per capita GDP growth. Regulations for international trade have remained unchanged for many years, and Mali’s rank has deteriorated further from 157th in the 2007 DBI to 162nd in 2008, and from 7th in 2002 to 16th in 2008 using IEF. The cost (US$2,680) and time (65 days) to import one container is excessively high. Difficulties in accessing ports explain part of this performance, but there is room for improvement, as exemplified by other landlocked countries such as Botswana, Lesotho, Swaziland, and Zambia.
• In 2007, Mali began implementing reforms to speed up the start of a business. The first round of reforms reduced the time needed from 42 days in 2006 to 26 days in early 2008. With the creation of a one-stop shop for investors, which is currently in preparation, the authorities aim at cutting the time needed for creating a business even further, to within 3–5 days. The authorities also plan to reduce the cost of starting a business, which the World Bank has estimated at the equivalent of about $500, to around one-fifth of its current level.
• Financial sector reforms would also help raise Mali’s per capita GDP growth. Mali has implemented few reforms geared toward improving access to credit by the
25
private sector in recent years. Thus, and with other countries improving their financial environment, Mali moved from 132nd in 2007 DBI to 135th in 2008 DBI out of 178 on the indicator for getting credit. A similar trend can be seen in the IEF, where Mali moved from 4th in 2002 to 25th in 2008 on the corresponding measure. Moreover, even average scores for financial freedom deteriorated in the IEF after 2003. This is not surprising given developments in the financial sector, which included government intervention to take a majority shareholding in BHM and BIM in 2005-7. Steps in 2008 to help BHM recover nonperforming loans and privatize BIM move in the right direction (and can be expected to show up in the next round of index compilation).
• The regulations governing the transparency of transactions in Mali have not been reformed in recent years. Mali’s investor protection index remained un-changed over 2006–08, as well as its rank (147 out of 178) on DBI. This performance points to important room for improvement. Steps that could be taken include reforming the judicial system to better enforce regulations related to corporate governance and curb looting by corporate insiders, strengthen requirements for disclosure of proposed transactions to shareholders, and management liability.
Table 1. Geography and Natural Endowments for Selected Countries
Resource-scarce Resource-rich Total
Landlocked 9 countries: Burkina Faso; Burundi; Ethiopia; Lesotho; Malawi; Rwanda; Swaziland; Uganda; Zimbabwe
6 countries: Chad (oil); Botswana (diamonds); Central African Republic (diamonds); Mali (gold); Niger (uranium); Zambia (copper, cobalt)
15
Coastal 11 countries: Cape Verde; Benin; The Gambia; Ghana; Guinea-Bissau; Kenya; Madagascar; Mauritius; Mozambique; Senegal; Tanzania
12 countries: Angola (oil, diamonds); Cameroon (oil); Republic of Congo (oil); Côte d'Ivoire (oil); Equatorial Guinea (oil); Gabon (oil, forestry); Nigeria (oil); Guinea (bauxite, diamonds, gold); Namibia (diamonds); Togo (phosphates); Sierra Leone (diamonds); South Africa (gold, diamonds, uranium, coal)
23
Total 20 18 38
26
Figure 2. Mali: Rank per variable, 1995-2008
0
5
10
15
20
25
30Bu
sine
ssFr
eedo
m
Trad
eFr
eedo
m
Fisc
alFr
eedo
m
Free
dom
from
Gov
't
Mon
etar
yFr
eedo
m
Inve
stm
ent
Free
dom
Fina
ncia
lFr
eedo
m
Prop
erty
Rig
hts
Free
dom
from
Cor
rupt
ion
0
5
10
15
20
25
30
1995-20022003-2008
C. The Business Climate and Macroeconomic Performance
46. Issues beyond factor accumulation drive differences in growth performances of African countries. This section investigates the relationship between the business environment and growth in SSA countries, and uses the results of the regional analysis to illustrate the impact that reform of Mali’s business environment could potentially have on economic growth. It looks at the region using the criteria proposed by Collier (geography and growth), as well as membership of the CFA zone. It then uses the conventional decomposition of sources of growth to investigate the relationship between growth and the variables from DBI and IEF for a cross-section of SSA countries. These variables explain growth through total factor productivity, controlling for investment in the growth equation, following Collins and Bosworth (1998, 2003) and Ndulu and O’Connell (2003).
27
Mali
Burkina Faso Ivory Coast
Senegal
48
50
52
54
56
58
60
62
1995 1996 1997 1998 1999 2000 2001 2002 2003 2004 2005 2006 2007 200848
50
52
54
56
58
60
62
Figure 3. Mali: Score of Economic Freedom for Mali and Selected Neighbors, 1995-2008
Botswana
Mali Zambia
50
55
60
65
70
75
1995 1996 1997 1998 1999 2000 2001 2002 2003 2004 2005 2006 2007 200850
55
60
65
70
75
Figure 4. Mali: Score of Economic Freedom for Mali and Selected Peers, 1995-2008
28
47. This analysis is based on a simple growth equation that includes economic freedom and doing business variables to assess their impact on growth in Africa. It relies on data from the IMF Regional Economic Outlook, the Heritage Foundation's Index of Economic Freedom, and the World Bank's Doing Business indicators, based on a sample of 38 African countries. Several models were estimated. The strongest models show a consistent and strong relationship between average growth of GDP per capita, on the one hand, and investment, DBI and IEF, on the other hand. The main variables found to impact on growth are trade freedom (HF), getting credit (DB), number of procedures (DB), and time to start a business (DB). The variables are as follows:
GDPPCG Growth of GDP per capita INV Investment as a share of GDP TRFREE Trade freedom GCR Ease of getting credit SBPN Number of procedures to start a business SBT Number of days taken by the procedures to start a business PIDI Transparency of transactions or disclosure (investors’ protection).
48. The results show that indicators of economic freedom can explain a large part of the differences in growth in Africa. Causality is difficult to prove and the IEF indicators may be proxies for broader aspects of the business environment. Thus, it is not possible to make definite inference of the growth impact of particular reforms. Moreover, the estimated coefficients are for SSA as a whole, and the quantitative impact of particular policies will vary across countries. Nevertheless, these results tend to confirm that reforms to the environment for private sector activity can have a major impact on economic growth.
49. This important finding can be illustrated through an application to the EFI values for Mali. A plausible reform scenarios could include raising key index values by some 10 percent, including: (a) lower trade barriers, to put Mali in line with other landlocked countries such as Zambia or Botswana; (b) financial sector development and easier access to bank credit, e.g., by implementing recommendations of the recent FSAP mission; (c) effec-tive operations of the one-stop shop for new enterprises, to bring Mali’s performance in line with Burkina Faso’s; and (d) better protection of investors and improved transparency.
50. The approach suggests that strengthening the business environment in Mali could raise economic growth by 1.2 percent per year. A 10 percent improvement in the investors protection index could increase growth by 0.1 percentage point. Table 4 indicates that by bringing the number of days to 12, GDP growth could be higher by 0.4 percentage point. On the basis of estimated coefficients for Africa, reforms to improve international trade procedures that result in a 10 percent increase in Mali’s IEF would add 0.4 percentage points to growth. And financial sector reform could add 0.2 percent to growth.
29
Table 2. Estimation of Growth of Per Capita GDP in 40 African Countries
Variable Coefficient Std. Error t-Statistic Prob.
C -7.655751 2.311669 -3.311786 0.0033INV 0.219914 0.035815 6.140285 0.0000
TRFREE 0.068515 0.029010 2.361782 0.0279GCR -0.012397 0.006337 -1.956390 0.0638SBPN 0.204442 0.110221 1.854840 0.0777SBT -0.016579 0.006820 -2.430784 0.0241PIDI 0.163636 0.126452 1.294057 0.2097
R-squared 0.737278 Mean dependent var 1.510714Adjusted R-squared 0.662214 S.D. dependent var 2.356447S.E. of regression 1.369551 Akaike info criterion 3.679161Sum squared resid 39.38908 Schwarz criterion 4.012212Log likelihood -44.50826 F-statistic 9.822061Durbin-Watson stat 2.033675 Prob (F-statistic) 0.000033
Table 3. Mali’s Performance under Main Variables Impacting Growth in 2008
Country Trade Freedom
Procedures (number)
Time (days)
Rank in ease of getting credit
Disclosure Index
Score for Mali 58.6 13 42 143 6
Rank in 2008 within: 38 African Countries 17 30 14 31 11 14 CFA zone countries 3 10 5 11 5 8 WAEMU countries 3 6 3 5 3 15 landlocked countries 7 13 9 12 5 18 resource rich countries 6 14 7 15 5
30
Table 4. Mali – Possible Impact of Reforms of the Business Environment on Growth
Variables Averages for Mali
Trade Reforms
Financial Sector reform
Reforms to expedite business creation
Reforms to improve
investor's protection
All reforms together
Investment 21.5 21.5 21.5 21.5 21.5 21.5Trade freedom 65.1 71.6 65.1 65.1 65.1 71.6Ease of getting credit 133.5 133.5 120.2 133.5 133.5 120.2Number of procedures 12.6 12.6 12.6 12.6 12.6 12.6Time for procedures 38.8 38.8 38.8 12.0 38.8 12.0Investors' protection 6.0 6.0 6.0 6.0 6.6 6.6 Estimated per capita growth 2.8 3.2 3.0 2.8 2.9 3.6Actual per capita growth 2.7
Impact of reforms on growth 0.4 0.2 0.4 0.1 1.2
Source: Staff estimates.
D. Concluding Remarks
51. Based on the experience of African countries, promoting private sector activity can foster higher economic growth and help Mali achieve its ambitious growth objectives. Notwithstanding some progress in recent years, private enterprises continue to face severe impediments in Mali. The measures to raise growth discussed above are in line with the authorities’ plans to improve the business climate, e.g., to reduce the time needed to set up a business, secure property rights and strengthen the legal framework, cut transport costs, and improve access to bank credit. As a landlocked country that can benefit from growth spillovers, Mali supports the regional integration agenda, with the intended removal of impediments to trade and upgrading of infrastructure, especially roads. Recent developments such as e-trade and air-freight offer new routes to global integration and accelerated economic growth. The ongoing and planned reforms to improve international communications, develop infrastructures, and expand opportunities for education should over time help Mali to achieve its development potential.
31
References
Acemoglu, D. and F. Zilibotti (2001), “Productivity Differences,” Quarterly Journal of Economics, volume 116, pp. 563-606.
Collier, P. (2006) “Africa: Geography and growth,” Centre for the Study of African Economies, Oxford University.
Djankov, S. et al (2003) “The New Comparative Economics,” NBER Working Paper No. 9608.
Doing Business (2008), “Comparing regulations in 178 countries,” Doing Business Project, World Bank Group.
Doing Business (2006), “Creating jobs,” Doing Business Project, World Bank Group.
Doing Business (2005), “Removing obstacles to growth,” Doing Business Project, World Bank Group.
Index of Economic Freedom (2008), available on-line at www.heritage.org.
H., Robert E. and C I. Jones (1999), “Why do some countries produce so much more output per worker than others?” The Quarterly Journal of Economics, Vol. 114, No. 1, pp. 83-116.
Rodrik, D. (1999), “Governing the Global Economy: Does One Architectural Style Fit All?” Available on-line at ksghome.harvard.edu/~drodrik/papers.html.