management practices and growth · management practices and growth ... production manager:...
TRANSCRIPT

MANAGEMENT PRACTICES
AND GROWTH
John Van Reenen, LSE & CEP LSE Growth Commission Evidence Session on Management
London May 27th 2012

INTRODUCTION
• Management is much talked about, but economists have
been sceptical due to lack of hard evidence
• Recent evidence suggests huge variation of firm
productivity & this is related to management
• ~70% of cross country variation in GDP/head “accounted
for” by management practices
• Systematic factors “driving” management – competition,
family firms, skills, FDI, etc.
• Policy implications (evidence base smaller than others,
e.g. human capital)
– Structural (competition, tax, etc.)
– Management-specific (e.g. benchmarking,
informational, etc.)

1. Productivity dispersion within and between countries
2. Measuring & describing management
3. Effect of management on performance
4. Causes and Policy
OUTLINE

PRODUCTIVITY DISPERSION WITHIN COUNTRIES
• Empirical work on plant/firm performance in last 1-2
decades shows huge variation of productivity is a 1st
order economic fact
• Large cross sectional dispersion within countries
– Within US four digit industry, plant labor productivity
90th-10th ≈ 4x (TFP ≈ 2x). Syverson (2004). Other
countries even bigger
– These plant productivity differences are persistent
– Not simply measurement error (e.g. use plant-specific
prices in Foster et al, 2009)
– Other measures of firm performance (e.g. profitability,
size, management quality, etc.) show wide variation

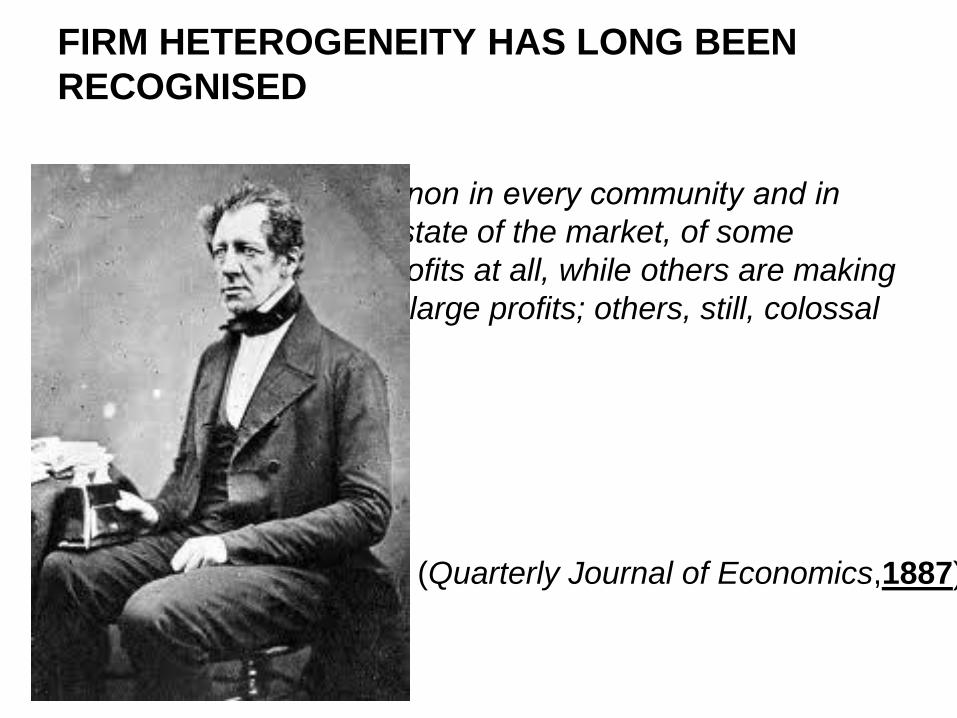
“…we have the phenomenon in every community and in
every trade, in whatever state of the market, of some
employers realizing no profits at all, while others are making
fair profits; others, again, large profits; others, still, colossal
profits.”
FIRM HETEROGENEITY HAS LONG BEEN
RECOGNISED
Francis Walker (Quarterly Journal of Economics,’87)
“…we have the phenomenon in every community and in
every trade, in whatever state of the market, of some
employers realizing no profits at all, while others are making
fair profits; others, again, large profits; others, still, colossal
profits.”
FIRM HETEROGENEITY HAS LONG BEEN
RECOGNISED
Francis Walker (Quarterly Journal of Economics,1887)

7
LARGE INCOME & TFP DIFFERENCES BETWEEN COUNTRIES
Source: Jones and Romer (2010). US=1
Note: related to firm dispersion (Hsieh & Klenow, 2009)

REASONS FOR PERFORMANCE HETEROGENEITY
• TFP Heterogeneity due to “hard technologies”
– R&D, patents, diffusion of ICT (information and
communication technologies), etc.
• These hard technologies matter a lot, but:
– After controlling for technology, still a big TFP residual
– Productivity effects of ICT depend on firm organization
(e.g. Bloom, Sadun & Van Reenen, AER 2012;
Bresnahan, Brynjolfsson and Hitt, QJE 2002)
• Heterogeneity of management practices & organization?
– Case studies & recent advances in measurement

1. Productivity dispersion within and between countries
2. Measuring & describing management
3. Effect of management on performance
4. Causes and Policy
OUTLINE

NOTIONS OF MANAGERIAL “BEST PRACTICE”
• Management styles that have always been better
– e.g. promotion on ability/effort (rather than family)
• Complementarity: Practices that have become
desirable because the environment has changed
– Technological advances makes monitoring output
better (e.g. SAP) and enables more performance
related pay (Lemieux et al, 2009)
• Innovation: Discoveries of how to manage better
– E.g. Toyota system of Lean Manufacturing
– Transferable: dynamic diffusion
10

1) Developing management questions
• Scorecard for 18 monitoring, targets and people/talent
• ≈45 minute phone interview of manufacturing plant managers
2) Obtaining unbiased comparable responses (“Double-blind”)
• Interviewers do not know the company’s performance
• Managers are not informed (in advance) they are scored
• Run from LSE, with same training and country rotation
3) Getting firms to participate in the interview
• Introduced as “Lean-manufacturing” interview, no financials
• Official Endorsement: Bundesbank, Bank of Italy, RBI, etc.
• Run by ~100 MBA-types (loud, assertive, business experience)
THE SURVEY METHODOLOGY

Score (1): Measures
tracked do not
indicate directly
if overall
business
objectives are
being met.
Certain
processes aren’t
tracked at all
(3): Most key
performance
indicators
are tracked
formally.
Tracking is
overseen by
senior
management
(5): Performance is
continuously
tracked and
communicated,
both formally and
informally, to all
staff using a range
of visual
management tools
MONITORING – E.G. “HOW IS PERFORMANCE
TRACKED?”
Note: All 18 dimensions and over 50 examples in Bloom & Van Reenen (2006)

MANAGEMENT SURVEY SAMPLE
• Interviewed over 8,000 firms across 21 countries in Americas,
Asia & Europe
• 45% response rate (responses uncorrelated with performance)
• 3 major waves in 2004, 2006 & 2009 with panel element
Medium sized manufacturing firms:
• Medium sized (100 - 5,000 employees, median ≈ 250)
Manufacturing as easier to measure productivity
─ Now extended to Hospitals, Retail, Schools, Charities,
Nursing homes, Law Firms, Government agencies, etc.
• Many controls for measurement error – second interviews,
controls for interviewer, interviewee and interview effects
• Also running conventional surveys US MOPs, EBRD MOI,..

AVERAGE MANAGEMENT SCORE ACROSS
COUNTRIES
Note: Averages taken across all firms within each country. 9079 observations in total.
2.6 2.8 3 3.2 3.4
management
US
Japan
Germany
Sweden
Canada
Australia
UK
Italy
France
New Zealand
Mexico
Poland
Republic of Ireland
Portugal
Chile
Argentina
Greece
Brazil
China
India

15
0.5
10
.51
0.5
10
.51
1 2 3 4 5 1 2 3 4 5 1 2 3 4 5 1 2 3 4 5
Australia Brazil Canada China
France Germany Great Britain Greece
India Ireland Italy Japan
Poland Portugal Sweden US
De
nsity
managementGraphs by country1
EMERGING COUNTRIES HAVE LONG TAIL OF BADLY
MANAGED FIRMS
Firm-Level Management Scores

16
0.5
10
.51
0.5
10
.51
1 2 3 4 5 1 2 3 4 5 1 2 3 4 5 1 2 3 4 5
Australia Brazil Canada China
France Germany Great Britain Greece
India Ireland Italy Japan
Poland Portugal Sweden US
De
nsity
managementGraphs by country1
EMERGING COUNTRIES HAVE LONG TAIL OF BADLY
MANAGED FIRMS
Firm-Level Management Scores

1. Productivity dispersion within and between countries
2. Measuring & describing management
3. Effect of management on performance
4. Causes and Policy
OUTLINE

18
CAUSAL EFFECT OF MANAGEMENT ON
PERFORMANCE? BLOOM ET AL (2012)
• Run experiment on plants in Indian textile firms outside Mumbai
• Randomized “treatment” plants get heavy management consulting (5 months); “control” plants get very light consulting (just enough to get data)
• Collect weekly performance data on all plants from 2008 to 2010
- Improved management practices led to large and significant improvements in productivity and profitability (~$325k higher pa)

19
THE FACTORIES ARE DISORGANIZED
Instrument
not removed
after use,
blocking
hallway.
Cotton lying on the floor Instrument blocking the hallway
Oil
leaking
from the
machine

20
THE TREATED FIRMS INTRODUCED BASIC
INITIATIVES
Worker involved in “5S” initiative on the
shop floor, marking out the area around
the model machine
Snag tagging to identify the abnormalities on
& around the machines, such as redundant
materials, broken equipment, or accident
areas. The operator and the maintenance
team is responsible for removing these
abnormalities.

1. Productivity dispersion within and between countries
2. Measuring & describing management
3. Effect of management on performance
4. Causes and Policy
OUTLINE
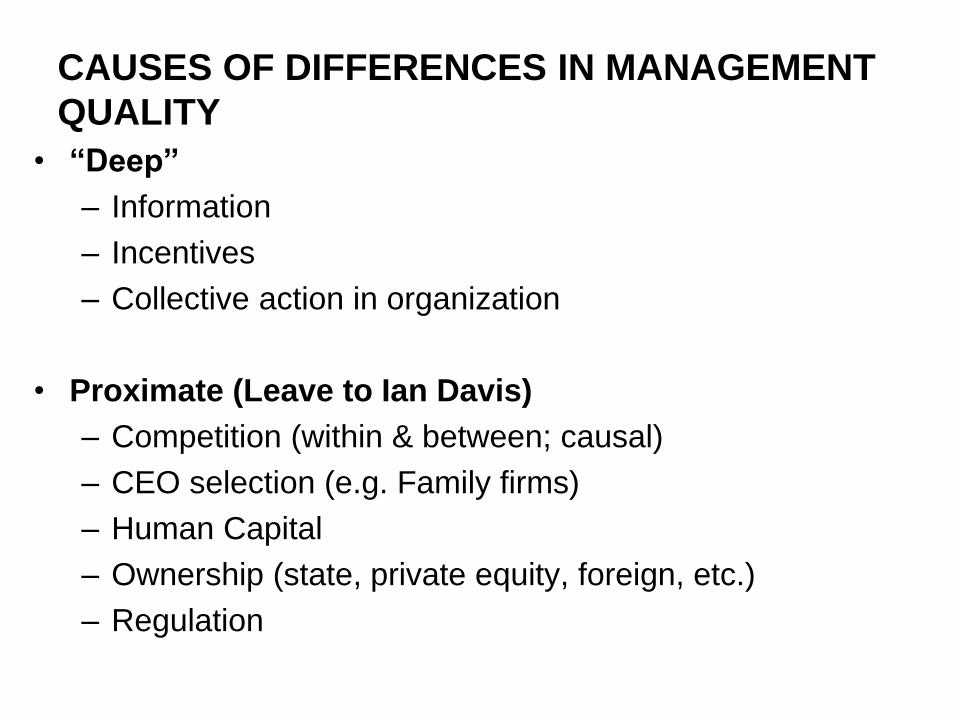
CAUSES OF DIFFERENCES IN MANAGEMENT
QUALITY
• “Deep”
– Information
– Incentives
– Collective action in organization
• Proximate (Leave to Ian Davis)
– Competition (within & between; causal)
– CEO selection (e.g. Family firms)
– Human Capital
– Ownership (state, private equity, foreign, etc.)
– Regulation
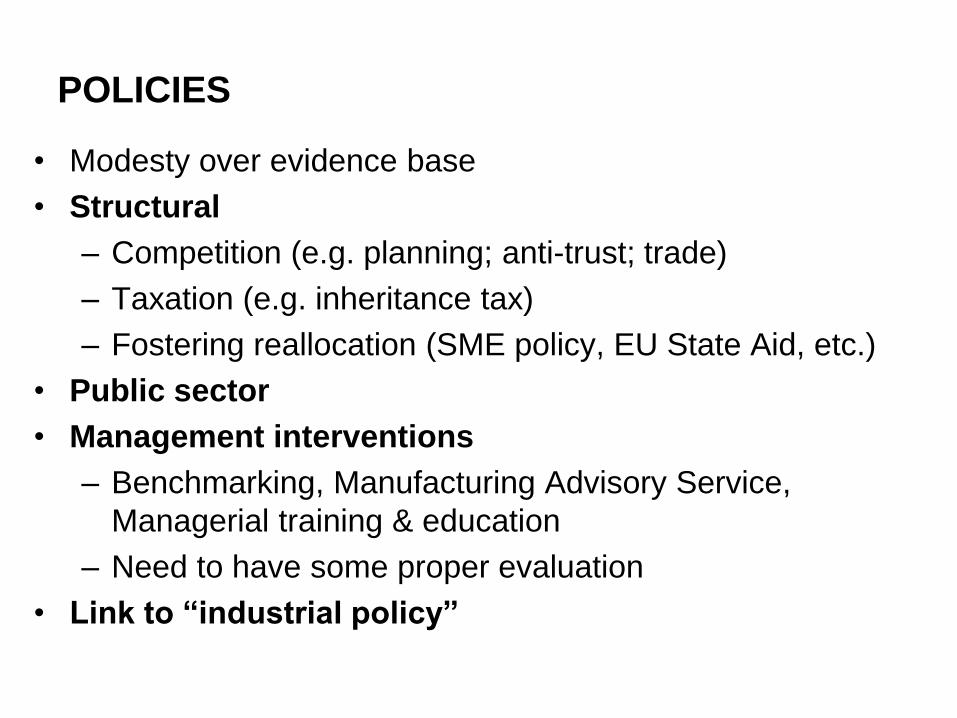
POLICIES
• Modesty over evidence base
• Structural
– Competition (e.g. planning; anti-trust; trade)
– Taxation (e.g. inheritance tax)
– Fostering reallocation (SME policy, EU State Aid, etc.)
• Public sector
• Management interventions
– Benchmarking, Manufacturing Advisory Service,
Managerial training & education
– Need to have some proper evaluation
• Link to “industrial policy”

CONCLUSIONS
• Heterogeneity of productivity across firms and countries a
1st order economic fact
– This is strongly linked to management quality
• Competition improves management through both within
and between firm effects
• Many other factors affecting management (meritocratic
selection, human capital, FDI, ownership, labour market
regulation, etc.)

MY FAVOURITE QUOTES:
[Male manager speaking to an Australian female interviewer]
Production Manager: “Your accent is really cute and I love the
way you talk. Do you fancy meeting up near the factory?”
Interviewer “Sorry, but I’m washing my hair every night for the
next month….”
The traditional British Chat-Up

Production Manager: “Are you a Brahmin?’
Interviewer “Yes, why do you ask?”
Production manager “And are you married?”
Interviewer “No?”
Production manager “Excellent, excellent, my son is looking
for a bride and I think you could be perfect. I must contact
your parents to discuss this”
The traditional Indian Chat-Up
MY FAVOURITE QUOTES:

MY FAVOURITE QUOTES:
Interviewer: “How many production sites do you have abroad?
Manager in Indiana, US: “Well…we have one in Texas…”
Americans on geography
Production Manager: “We’re owned by the Mafia”
Interviewer: “I think that’s the “Other” category……..although I
guess I could put you down as an “Italian multinational” ?”
The difficulties of defining ownership in Europe
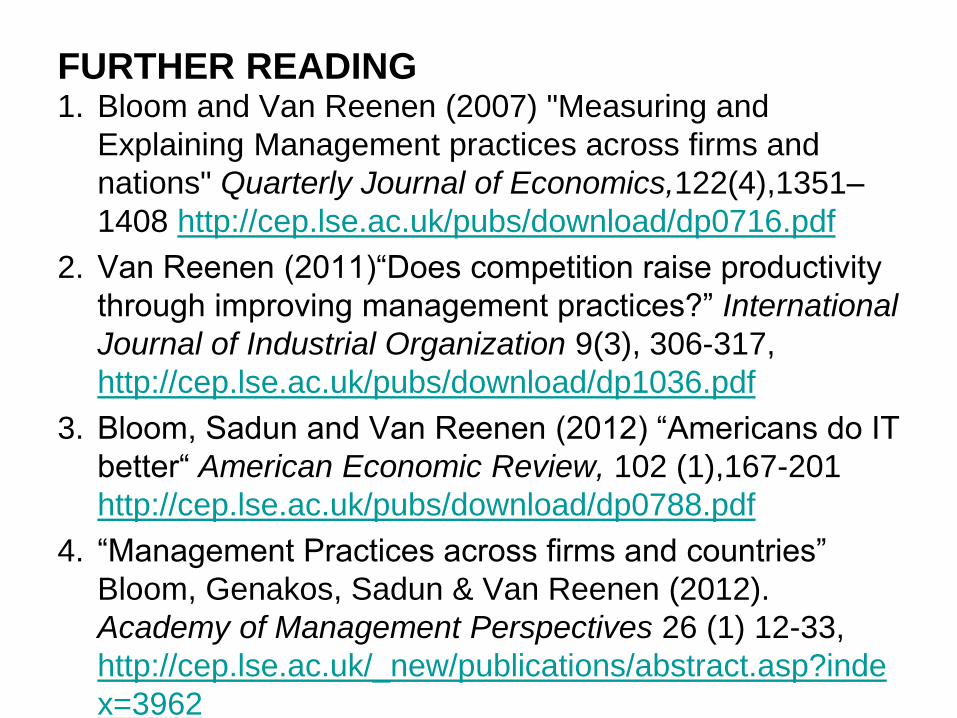
FURTHER READING 1. Bloom and Van Reenen (2007) "Measuring and
Explaining Management practices across firms and
nations" Quarterly Journal of Economics,122(4),1351–
1408 http://cep.lse.ac.uk/pubs/download/dp0716.pdf
2. Van Reenen (2011)“Does competition raise productivity
through improving management practices?” International
Journal of Industrial Organization 9(3), 306-317,
http://cep.lse.ac.uk/pubs/download/dp1036.pdf
3. Bloom, Sadun and Van Reenen (2012) “Americans do IT
better“ American Economic Review, 102 (1),167-201
http://cep.lse.ac.uk/pubs/download/dp0788.pdf
4. “Management Practices across firms and countries”
Bloom, Genakos, Sadun & Van Reenen (2012).
Academy of Management Perspectives 26 (1) 12-33,
http://cep.lse.ac.uk/_new/publications/abstract.asp?inde
x=3962

BACK UP

30
MANY PARTS OF THE FACTORIES ARE DIRTY AND UNSAFE

02
04
06
08
01
00
12
01
40
-20 -10 0 10 20 30 40 50weeks since diagnostic phase
2.5th percentile
QUALITY DEFECTS INDEX: TREATMENT & CONTROL PLANTS
Notes: Displays the average weekly quality defects index, which is a weighted index of quality defects, so a higher score means
lower quality. This is plotted for the 14 on-site treatment plants (+ symbols) and the 6 on-site control plants (♦ symbols). Values
normalized so both series have an average of 100 prior to the start of the intervention. To obtain confidence intervals we
bootstrapped the firms with replacement 250 times.
Control plants
Treatment plants
Weeks after the start of the diagnostic
Qu
alit
y d
efe
cts
ind
ex (
hig
he
r sco
re=
low
er
qu
alit
y)
Start of
Diagnostic
Start of
Implementation
Average (+ symbol)
97.5th percentile
Average (♦ symbol)
97.5th percentile
End of
Implementation
2.5th percentile

COVERAGE OF WORLD MANAGEMENT SURVEY:
21 COUNTRIES
Source: World Management Survey, http://worldmanagementsurvey.org/

* Log scale (sales per worker) ** Firms are grouped in 0.5 increments of assessed management score
4.0
4.5
5.0
5.5
6.0
6.5
1 2 3 4 5
management practice score**
Labour productivity*
LINK BETWEEN PRODUCTIVITY & MANAGEMENT
HOLDS TRUE ACROSS DIFFERENT COUNTRIES
4
5
6
7
1 2 3 4 5
Labour productivity*
2
3
4
5
6
7
1 2 3 4 5
Labour productivity*
4.5
5.0
5.5
6.0
6.5
1 2 3 4 5
management practice score**
Labour productivity*
U.S. U.K.
FR
SE
DE
PL
IT
CN JP
PT
GR

Score (1) People are
promoted
primarily upon
the basis of
tenure
(3) People
are promoted
upon the
basis of
performance
(5) We actively
identify, develop
and promote our
top performers
INCENTIVES - e.g. “HOW DOES THE PROMOTION
SYSTEM WORK?”
Note: All 18 dimensions and over 50 examples in Bloom & Van Reenen (2006)

-6-4
-20
2
lab
p
0 2 4 6 8 10Their self-score: 1 (worst practice), 5 (average) to 10 (best practice)
bandwidth = .8
Lowess smoother
SELF-SCORES UNCORRELATED WITH
PRODUCTIVITY
Labor
Pro
ductivity
Self scored management
* Insignificant 0.03 correlation with labor productivity, cf. management score has a 0.295
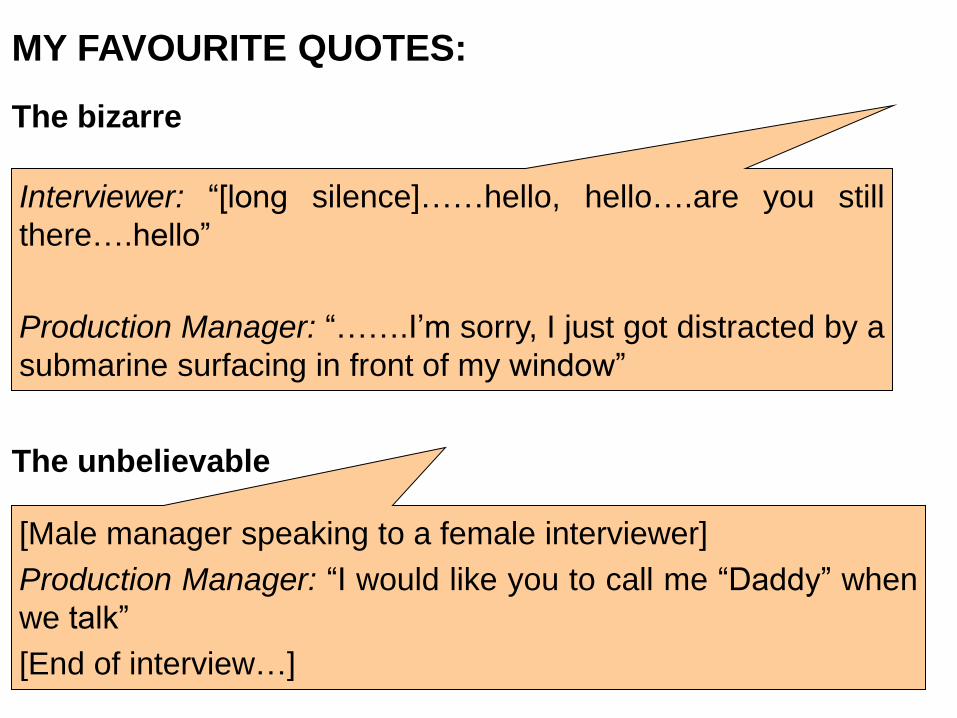
MY FAVOURITE QUOTES:
The bizarre
Interviewer: “[long silence]……hello, hello….are you still
there….hello”
Production Manager: “…….I’m sorry, I just got distracted by a
submarine surfacing in front of my window”
The unbelievable
[Male manager speaking to a female interviewer]
Production Manager: “I would like you to call me “Daddy” when
we talk”
[End of interview…]

MY FAVOURITE QUOTES:
Production Manager: “For example, if an employee suggests
a company slogan, and his name is used, he gets a TV.
If he is employee of the month, he gets a parking space”
Staff rewards the American way
Interviewer: “How would you persuade your top performers to
stay?”
UK Chairman: “Sex is a great thing! If the employee finds a
new girlfriend somewhere else, I can’t do anything!”
Staff retention the UK way