teacher practices and student growth in … practices and student growth ... teacher practices and...
TRANSCRIPT

Technical Report # 1401
Teacher Practices and Student Growth
In Mathematics:
Grades 6-8
Daniel Anderson
Jessica L. Saven
P. Shawn Irvin
Julie Alonzo
Gerald Tindal
University of Oregon

Published by Behavioral Research and Teaching University of Oregon • 175 Education 5262 University of Oregon • Eugene, OR 97403-5262 Phone: 541-346-3535 • Fax: 541-346-5689 http://brt.uoregon.edu
Note: Funds for this dataset were provided by the Oregon Department of Education Contract No. 8777 as part of Project OFAR (Oregon Formative Assessment Resources) Statewide Longitudinal Data System (SLDS), CFDA 84.372A Grant Program that is authorized by the Educational Technical Assistance Act of 2002.
Copyright © 2014. Behavioral Research and Teaching. All rights reserved. This publication, or parts there of, may not be used or reproduced in any manner without written permission.
The University of Oregon is committed to the policy that all persons shall have equal access to its programs, facilities, and employment without regard to race, color, creed, religion, national origin, sex, age, marital status, disability, public assistance status, veteran status, or sexual orientation. This document is available in alternative formats upon request.

Abstract
Schools and districts across the United States have adopted response to intervention
(RTI) as a means for both identifying and intervening with students at risk for low
achievement. The validity of RTI rests largely upon teachers making appropriate
instructional decisions based on students’ responses to a given practice. This study was
designed to explore how teachers’ instructional practices relate to progress monitoring
data in math in Grades 6 and 7. A total of eight teachers participated (five in Grade 6,
three in Grade 7). They administered an easyCBM Common Core State Standards
(CCSS) Math measure to their students monthly and provided information on their
instructional practices for each student at least three times (fall, winter, and spring).
Analyses included: (a) textual analyses of teachers’ self-reported instructional practices,
(b) multilevel growth analyses of students’ math data, and (c) ordinal regression analyses
of students’ intercept and slope predicting the number of interventions the student
received. Results indicate that self-report methods may not be sufficient to adequately
address the relation between teacher practices and students’ growth. Nonetheless, in
Grade 6, a relation was found between students’ average growth in math performance and
the likelihood that they would be administered multiple interventions.
Teacher Practices and Student Growth in Mathematics: Grades 6-8
Within a response to intervention (RTI) framework, all students are administered interim
benchmark screening assessments, typically seasonally (fall, winter, and spring). Students
performing below a specified normative percentile on these benchmarks are provided
educational interventions designed to “boost” their achievement (Deno et al., 2009). The overall
purpose of RTI is to identify students who are at-risk for low-achievement, so that targeted
interventions can be provided and students can “catch-up” with their peers. Regular progress-
monitoring probes are administered to evaluate the effect of interventions. For example, an
intervention may have a large positive effect for Student A, as evidenced by an immediate
change in the student’s achievement level and/or a rapid increase in his or her slope of
improvement. Student A may then be exited from the intervention and placed back in general
instruction. Student B, in contrast, may receive the same intervention, but not adequately respond
as evidenced by no or little change in the student’s level of academic achievement and no
substantial increase in the student’s rate of learning. In this example, Student B might require a
more intensive intervention (e.g., more time in the intervention, or perhaps a different
intervention entirely) to bridge the achievement gap between his or her performance and that of
peers.
Data obtained through RTI offer a rich source of information from which educational
decisions can be based. However, recent research suggests that the decision-making process may
not be as straightforward as the aforementioned scenario may suggest (Tindal, Alonzo, Nese, &
Sáez, 2012). The purpose of this study was to explore teachers’ instructional practices in the field
relative to student data. All teachers participating in the study administered monthly mathematics
progress-monitoring measures to all students in their classes and entered the corresponding
1
instructional information for each student into an online system. Instructional information could
then be evaluated relative to the observed trends in the data. Specifically, we planned the study to
address the following three research questions:
1) What is the average rate and shape of students’ mathematics growth occurring during the
school year?
2) What types of instructional decisions did teachers make for students?
3) Which students were selected for mathematics intervention, and what intervention
practices were used?
Ideally, we would find that students generally made positive growth, and see that teachers
intervened with students who began the year with lower achievement levels and/or made below-
average growth. This is certainly the premise of RTI. It was our hope that the instructional
information provided by the teachers might then inform the observed growth patterns, providing
insight into teachers’ actual practice and a link between student performance data and teacher
instructional decisions. However, if seemingly erratic decisions were made, similar to those seen
in previous research (Tindal et al., 2012), or inadequate growth occurred on average to
sufficiently target students progressing below the norm, then the link between student
performance data and teacher instructional decisions becomes more muddled. This study sought
to investigate these issues through a year-long study in two school districts with a history of RTI
implementation.
2
Methods
Participants and Procedures
A total of eight teachers from two schools in two districts participated in this study.
School A was located in the Pacific Northwest and included six of the eight participating
teachers—three sixth grade teachers and three seventh grade teachers. School B was located in
the Mountain West and included the remaining two teachers—both sixth grade teachers. To
ensure the data were collected with fidelity, we contracted with a math coach from School A to
help facilitate the study and stay in regular contact with the six teachers at her site. Although no
district contact was hired for School B, the lead author kept in regular email contact with both
teachers. The study included a total of 714 students, with 489 students in Grade 6 and 225 in
Grade 7. On average, each teacher instructed 89 students (SD = 31.33). Student demographic
information was unavailable.
There were two primary components of the study. First, teachers assessed all their
students once per month for the duration of the school year using the easyCBM© Common Core
State Standards (CCSS) Math progress-monitoring measures. Second, teachers entered
instructional information into an online database for each student they instructed three times
during the year (during seasonal benchmark testing). Teachers were also asked to enter
instructional information into the online database each time an instructional change was made for
an individual student (e.g., student moved from Tier 1 to Tier 2, or from Tier 2 back to Tier 1,
etc.); however, this was not explicitly required. All teachers began testing students with form #1
of the CCSS Math progress monitoring measure and moved to the subsequent measure each
month.
3
Measures
The easyCBM CCSS Math measures in grades 6 and 7 were used in this study. For a
complete report on the development of the measures, see Anderson, Irvin, Patarapichayatham,
Alonzo, and Tindal (2012). All items were scaled with a Rasch model and forms were
constructed to be of equivalent difficulty. Universal design for assessment components were
used during assessment development, informing the item design, presentation, and interface (see
Thompson, Johnstone, & Thurlow, 2002). An alignment study conducted by Anderson, Irvin,
Alonzo, and Tindal (2012) suggested strong alignment with the CCSS. For an investigation into
the reliability of the test forms, see Anderson, Alonzo, and Tindal (2013a).
Teachers used the same online system to both administer the tests and enter instructional
information (See Figure 1 for an example of the instructional intervention interface). Teachers
selected a student, entered text about the instruction the student was receiving, and then selected
all other students who were receiving the same instruction (all names in Figure 1 are
pseudonyms). Figure 2 displays a hypothetical example of how instructional information was
presented to teachers via time-series graphs. Note the vertical black line indicating the onset of
new instruction (i.e., an intervention). The text the teacher entered in the intervention interface in
Figure 1 is displayed below the time-series graph. These time-series graphs are intended to help
teachers quickly examine the impact of their instructional practices on students’ growth.
Instructional Data
Data from each teacher contained idiosyncrasies that required analysis on an individual
teacher basis. However, there were commonalities. For all teachers, we found numerous
instances of redundant interventions (i.e., the same intervention entered twice, but with
4

grammatical differences, marginally different descriptions, etc.). During our data cleaning
process, all duplicates were collapsed, and all non-math interventions were discarded. Frequency
counts of the number of students receiving 0…n interventions were then calculated, as well as
the number of students within each unique intervention. When available, data on the intensity,
frequency, and duration of the intervention were extracted. Because, as we had requested,
teachers entered instructional information for all students, including those receiving only general
instruction, there were times when it was not clear whether the instruction was truly an
intervention or if it was part of general core instruction. During data cleaning, all ambiguous
cases were coded as interventions. Unless denoted otherwise, interventions were assumed to
continue through the duration of the school-year post-implementation.
Analyses
To explore students’ mathematics growth, hierarchical linear modeling (HLM) was
employed, with separate models fit for each grade. All analyses were conducted with the R
statistical software (R Core Team, 2013) with the lme4 package (Bates, Maechler, Bolker, &
Walker, 2013). Statistical tests of individual parameter estimates were obtained with the
lmerTest package (Kuznetsova, Brockhoff, & Christensen, 2013). Prior to analysis, functional
form was examined by visual inspection. All plots were produced using the ggplot2 package
(Wickham, 2009). Figure 3 plots the mean of each time point for each grade. The red line
indicates a quadratic, curvilinear function fit to the data, while the blue line indicates a linear fit.
Note that for Grade 7, the mean for the fifth time-point (test Form 5) was markedly lower
(~2-3 points) than all other time points. The discrepancy led us to speculate about a possible
form effect, particularly given that Anderson et al. (2013a) found that the reliability of some
CCSS Math test forms for Grade 7 were functioning below optimal levels (e.g., Cronbach’s
5
alpha < .7). These forms have since been revised, but the original forms were used in the current
study. However, in addition to the mean for this test form being notably lower for the full
sample, it was roughly equivalently so for each individual teacher. That is, student scores on
Form 5 were approximately 2-3 points lower than their scores on all other forms for students in
each teacher’s class (see Figure 4). Given the replicated effect across teachers, and known issues
related to the original forms’ reliability, we opted to remove this time point prior to growth
analysis. Thus, only time points 1-4, 6, and 7 were included in the Grade 7 analyses.
In multilevel designs statistical power is primarily driven by the number of units at the
highest level (Raudenbush & Liu, 2000; Snijders, 2005). Our design included only five teachers
in grade 6 and three teachers in grade 7. Power estimates indicated that, despite the relatively
large n size (number of students), power was insufficient (< .20) for a three-level model given
the small j size (number of teachers). Thus, the growth analyses were restricted to two-level
models: repeated measurement occasions nested within students. Restricting the analysis to a
two-level design resulted in observed power of 0.99 for Grade 6 and .80 for Grade 7, for an
effect size of .4 and alpha set at .05.
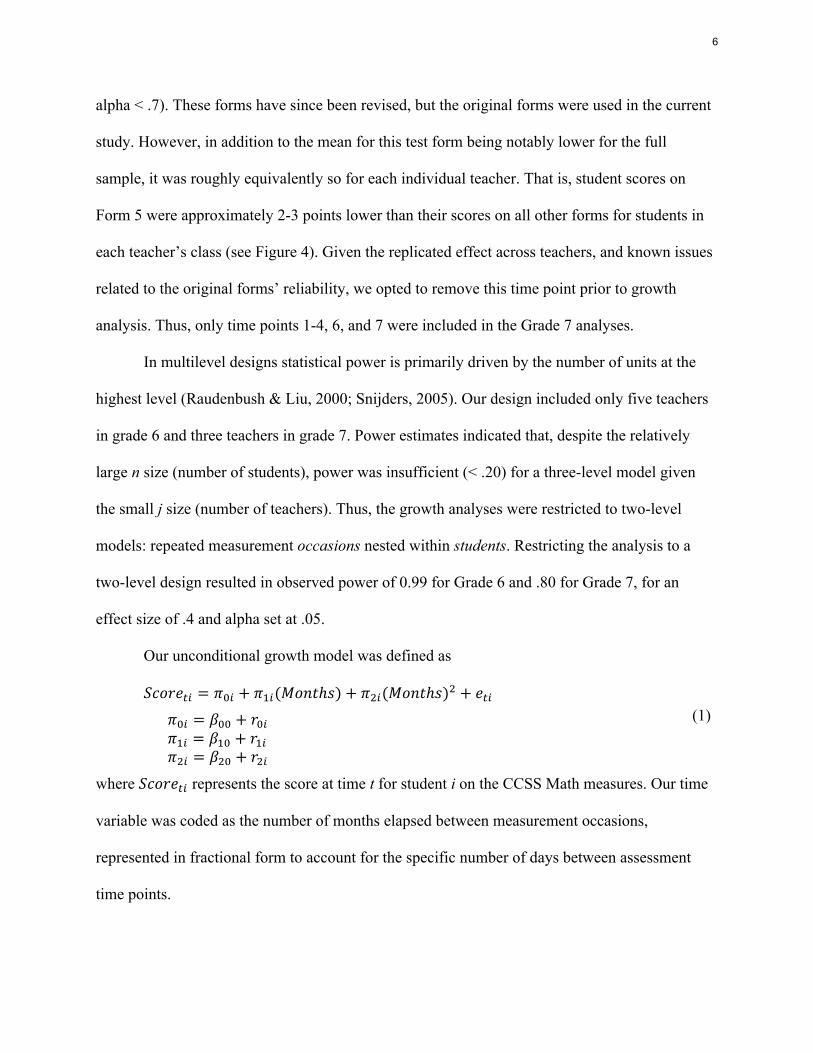
Our unconditional growth model was defined as
𝑆𝑐𝑜𝑟𝑒!" = 𝜋!! + 𝜋!!(𝑀𝑜𝑛𝑡ℎ𝑠)+ 𝜋!!(𝑀𝑜𝑛𝑡ℎ𝑠)! + 𝑒!" (1) 𝜋!! = 𝛽!! + 𝑟!!
𝜋!! = 𝛽!" + 𝑟!! 𝜋!! = 𝛽!" + 𝑟!!
where 𝑆𝑐𝑜𝑟𝑒!" represents the score at time t for student i on the CCSS Math measures. Our time
variable was coded as the number of months elapsed between measurement occasions,
represented in fractional form to account for the specific number of days between assessment
time points.
6
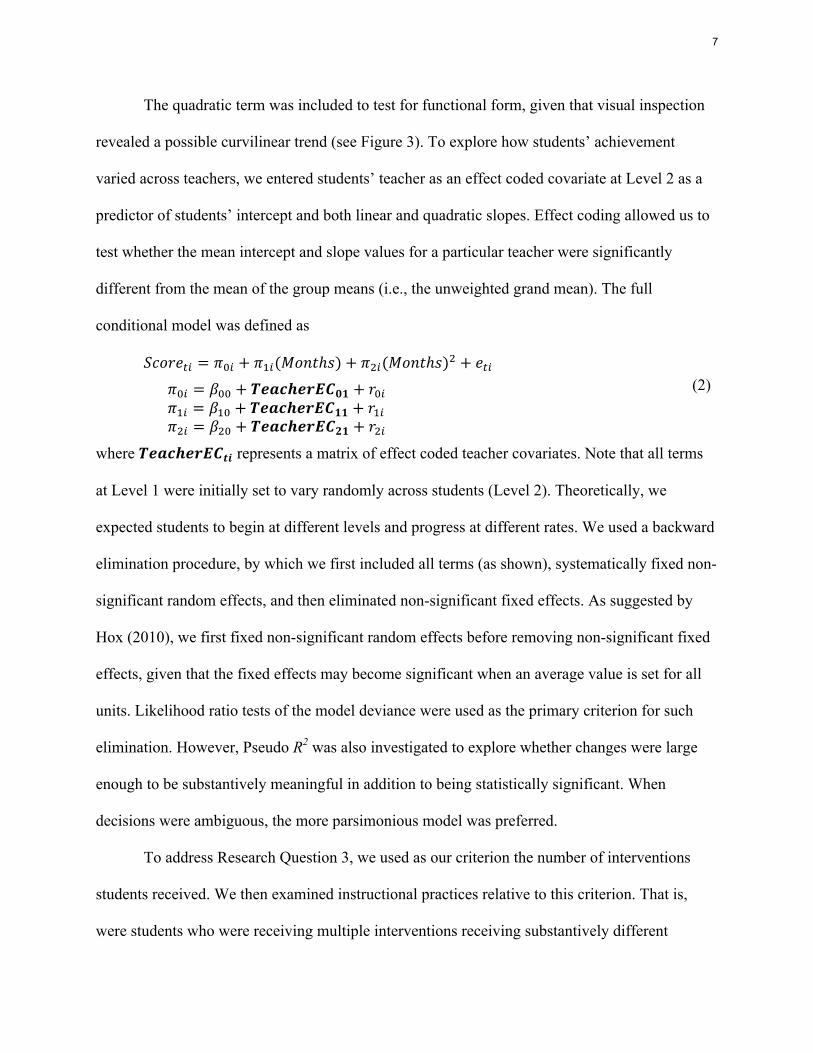
The quadratic term was included to test for functional form, given that visual inspection
revealed a possible curvilinear trend (see Figure 3). To explore how students’ achievement
varied across teachers, we entered students’ teacher as an effect coded covariate at Level 2 as a
predictor of students’ intercept and both linear and quadratic slopes. Effect coding allowed us to
test whether the mean intercept and slope values for a particular teacher were significantly
different from the mean of the group means (i.e., the unweighted grand mean). The full
conditional model was defined as
𝑆𝑐𝑜𝑟𝑒!" = 𝜋!! + 𝜋!!(𝑀𝑜𝑛𝑡ℎ𝑠)+ 𝜋!!(𝑀𝑜𝑛𝑡ℎ𝑠)! + 𝑒!! (2) 𝜋!! = 𝛽!! + 𝑻𝒆𝒂𝒄𝒉𝒆𝒓𝑬𝑪𝟎𝟏 + 𝑟!!
𝜋!! = 𝛽!" + 𝑻𝒆𝒂𝒄𝒉𝒆𝒓𝑬𝑪𝟏𝟏 + 𝑟!! 𝜋!! = 𝛽!" + 𝑻𝒆𝒂𝒄𝒉𝒆𝒓𝑬𝑪𝟐𝟏 + 𝑟!!
where 𝑻𝒆𝒂𝒄𝒉𝒆𝒓𝑬𝑪𝒕𝒊 represents a matrix of effect coded teacher covariates. Note that all terms
at Level 1 were initially set to vary randomly across students (Level 2). Theoretically, we
expected students to begin at different levels and progress at different rates. We used a backward
elimination procedure, by which we first included all terms (as shown), systematically fixed non-
significant random effects, and then eliminated non-significant fixed effects. As suggested by
Hox (2010), we first fixed non-significant random effects before removing non-significant fixed
effects, given that the fixed effects may become significant when an average value is set for all
units. Likelihood ratio tests of the model deviance were used as the primary criterion for such
elimination. However, Pseudo R2 was also investigated to explore whether changes were large
enough to be substantively meaningful in addition to being statistically significant. When
decisions were ambiguous, the more parsimonious model was preferred.
To address Research Question 3, we used as our criterion the number of interventions
students received. We then examined instructional practices relative to this criterion. That is,
were students who were receiving multiple interventions receiving substantively different
7
instruction than students who were receiving zero or one? Further, we conducted an ordinal
regression analysis to explore whether students’ initial achievement (i.e., intercept) and rate of
improvement (i.e., slope) predicted the number of interventions they received over the school
year. Intercept and slope values were extracted from the growth model described above.
Results
In this section we first describe the results of our overall HLM and ordinal regression
models. We then report our descriptive textual analysis of instructional practices by teacher, and
describe how the achievement of students for each teacher differed (if at all) from the mean of
the group means, as well as how the likelihood of students being provided multiple interventions
changed by teacher. Instructional information was not entered into the analyses, but rather was
intended to supplement the growth model results.
Growth Model
Complete HLM growth modeling results are displayed in Table 1. For each grade, the
results are displayed for the full model, as shown in Equation 2, and a reduced model that more
parsimoniously describes the data.
For Grade 6, Teacher was not a significant predictor of the quadratic term, with the
exception of Teacher 3. The quadratic term also varied little between students. The model
including teacher as a predictor of students’ quadratic slope fit the data significantly better than
the model without, 𝜒! 7 = 15.54,𝑝 = .03; however, pseudo R2 suggested the addition of
teacher predictors to the quadratic slope resulted in less that 1% (0.84%) additional variance
explained. Further, AIC was virtually indistinguishable between the models, while BIC
suggested the more parsimonious model fit the data better. Consistent with our a priori rules for
8
prioritizing parsimony, we opted for the simpler model with teacher only predicting students’
intercept and linear slope. The quadratic variance component was also fixed. A plot of the fixed
effects for the final model is displayed in Figure 5. Note that significantly more variability
existed in the mean initial achievement of students by teacher than in the mean linear growth.
The results of the final Grade 6 model suggested that students scored, on average 12.70
points correct at the beginning of the study, which varied between students with an SD of 2.56.
With the exception of Teacher 3, the average initial achievement for students was significantly
different than the unweighted grand mean for the intercept. Students progressed, on average, at a
rate of 0.23 points correct per month (SD = 0.25), with an accelerating curvilinear trend of .05
points per month squared. The mean of the linear slope for Teachers 1 and 5 were significantly
lower than the unweighted grand mean for the linear slope, while the mean for Teacher 2 was
significantly higher. The mean linear growth slope for Teachers 3 and 4 were not significantly
different from the unweighted grand mean.
For Grade 7, no parameters with the exception of the intercept were significant. The
model was reduced to the simplest form that adequately explained the data – an unconditional
linear growth model. The unconditional linear growth model fit the data significantly better than
the unconditional means model (i.e., random intercepts only, with no time variable).
Interestingly, students’ average growth was not statistically different from zero, and the 95% CI
for the linear slope variance components contained 0, suggesting the linear slope did not vary
significantly between students. However, the model with the linear slope varying between
students did fit significantly better than the model with the linear slope fixed
𝜒! 2 = 40.79,𝑝 < .001. Given that the linear growth term itself was not significant, teachers
by definition could not be a significant predictor of students’ growth. The finding that students
9
were not progressing at a rate distinguishable from zero (i.e., flat) was surprising. Possible
explanations for this finding are examined in the Discussion section.
Ordinal Regression
The results of the ordinal regression analysis are displayed in Table 2. Students’ intercept
was a significant predictor of the number of interventions a student received across both grades,
while slope was significant only in Grade 7. Both intercept and slope were negatively related to
the number of interventions the student received, indicating that as students’ initial achievement,
or their rate of growth increased, their likelihood of being provided additional interventions
decreased. These results align with expectations within an RTI framework of instruction and
assessment. In Grade 6, students instructed by Teacher 1 received significantly fewer
interventions than the mean of the group means, while students instructed by Teacher 4 were
over 8 times mores likely to receive an intervention. The teacher factor was not significant in
Grade 7, indicating students were equally likely to receive an intervention regardless of the
teacher providing the instruction.
Results by Teacher: Grade 6
Table 3 displays the number of interventions students received by teacher. Proportions
are displayed in parentheses. Note that for a few teachers the number of students not receiving
any interventions was zero, or close to zero. All such teachers included their students in an
intervention termed “Flex Friday”, during which students from across classrooms were grouped
by common instructional needs. Thus, even if students were performing at or even above
expectations, they still technically received an intervention and were coded as such.
Teacher 1. Teacher 1 instructed 131 sixth-grade students. These students began, on
average, scoring 15.74 points (~75th percentile), which was 3.04 points higher than the
10
unweighted grand mean and was statistically significant (t = 9.43, p < .001). Our theory that
students who began the school year at a higher than normal achievement level would receive
fewer targeted interventions was supported by these results: only 25% of these students received
an intervention. The proportion of students receiving an intervention aligns well with general
RTI recommendations (Fuchs & Fuchs, 2006) assuming the teacher was using local norms. The
ordinal regression analysis indicated that students were, on average, less likely to be
administered multiple interventions than students in other sixth grade classes (OR = .10, p <
.05). Students’ average linear growth was -0.04, which was 0.27 points lower than the
unweighted grand mean, and was also statistically significant (t = -4.71, p < .001). All sixth-
grade students also made significant accelerating curvilinear growth, at 0.05 points per month
squared (t = 3.84, p < .001). Thus, although students instructed by Teacher 1 began the year with
a higher than average achievement level, they progressed at a substantially lower rate and were
less likely to receive multiple interventions than the average sixth grade student in the average
class. For example, students instructed by the average teacher would have been predicted to
make, on average, 1.14 points of growth after three months. However, students instructed by
Teacher 1 would be predicted to have made 0.03 points of growth over the same three months.
Teacher 1 used six categories to label instructional practices: (a) general instruction, (b)
general instruction with accommodations, (c) double general instruction, (d) leveled general
instruction, (e) independent coursework, and (f) classroom interventions. Approximately 97% of
students received general (core) instruction based on the CCSS, with approximately 4-5%
receiving general instruction with accommodations. In addition to the core curriculum, 12
instructional categories were identified through textual analysis. Table 4 displays the identified
instructional categories intended to supplement the more general categories Teacher 1 provided.
11

Five of the instructional practices provided by Teacher 1 appear largely characterized by
additional exposure to the core curriculum (e.g., extended time). Four practices appeared to
instructionally “go beyond” the core curriculum in some manner (e.g., independent acceleration,
Tier 2 or Tier 3 instruction, and remedial skills practice). Two practices involved moving
students to smaller groups. Daily peer tutoring was also implemented for a few students.
Teacher 2. Teacher 2 instructed 80 sixth-grade students. These students began, on
average, scoring 11.21 points, which was about 1.5 points lower than the unweighted grand mean
and was statistically significant (t = -3.19, p = .001). However, students progressed at a rate of
0.50 items correct per month, on average, which was a significantly higher rate than the
unweighted grand mean (t = 3.26, p = .001). Indeed, students instructed by Teacher 2 progressed,
on average, at a faster rate than students instructed by any other teacher in the study.
Teacher 2 labeled instructional practices by General Instruction, Pre-Algebra, and five
different Math Academy instructional practices: (a) knowing fractions, (b) understanding
fractions, (c) place value, (d) rational numbers, and (e) an unspecified global “Academy”
intervention/instructional practice. Table 5 provides a description of each instructional label, as
provided by Teacher 2, as well as the number and percentage of students within each group. Note
that Teacher 2 used a general label Academy that appeared to correspond to the Flex Friday label
used by other teachers in the same district. Of the 80 students instructed by Teacher 2, 64 were
coded into either the General Instruction group or the Academy group. An additional five
students were coded into both groups. The remaining 11 students were all coded as receiving
each of the three more specific Math Academy interventions, with the exception of one student
who was coded as receiving Pre-Algebra. All coded instructional information was academic in
nature.
12

Teacher 3. Teacher 3 instructed 82 sixth-grade students. These students began and
progressed at a level that was not significantly different from the unweighted grand mean of
12.70 and 0.23 points correct per month, respectively.
Teacher 3 indicated four instructional practices (Table 6): (a) 50 minutes of math help
Monday through Thursday, (b) pre-teaching, (c) 140 minutes of math help on Fridays, and (d)
120 minutes a week of work-based fractions. Teacher 3 also indicated student participation in
three Math Navigator units: (a) knowing fractions, (b) understanding fractions, and (c) place
value. Students received zero (38 students, 46%) to six (1 student, 1%) interventions, with most
receiving just one (22 students, 27%).
Approximately 73% of students who were administered one intervention were assigned
work-based fractions as part of the Math Navigator unit. Approximately 14% of students
received math help Monday through Thursday, while 9% were assigned to the place value unit of
Math Navigator. Approximately 12% of students received two interventions. These students
were assigned work-based fractions 90% of the time, with 70% of students also receiving math
help on Fridays, and 20% receiving math help Monday through Thursday. The four students
receiving three interventions all received math help on Fridays, as well as participating in the
work-based fractions intervention. Three of the students in this group also received math help on
Monday through Thursday. The remaining student in this group received a pre-teaching
intervention. Of the six students receiving four interventions, all received work-based fractions
and also pre-teaching. Approximately two-thirds participated in the place value unit of Math
Navigator.
Teacher 4. Teacher 4 instructed 55 sixth-grade students. These students began, on
average, scoring 8.73 points, which was nearly 4 points lower than the unweighted grand mean
13

and was statistically significant (t = -6.13, p < .001). The low initial achievement of students
(average being slightly below the 20th percentile) would seem to suggest that many students
were in need of additional academic attention. Students instructed by Teacher 4 were over 8
times as likely as students instructed by the “average” teacher to receive multiple interventions
(OR = 8.04, p < .05). Students’ average linear growth was not statistically different from the
unweighted grand mean (t = 1.77, p = .076).
Teacher 4 did not include any general instruction label, which made interpretation
difficult because all students were represented in a single instructional group; thus, it was unclear
whether all students received some sort of intervention in addition to core instruction, or if one of
the instructional labels represented core instruction. The eight instructional grouping labels,
along with a detailed description and the specific number of students represented within each
group, are represented in Table 7. Based on the proportion of students represented in each
instructional group, and information coded by other teachers within the same school, it would
appear that Flex Friday was the closest grouping related to general instruction. Teacher 4
described Flex Friday as “a pre-teach/re-teach model for students who are just below standard in
their regular gen-ed math class. The focus is on using equivalent fraction understanding to find
common denominators for adding/subtracting fractions and for simplifying fractions.”
Approximately 89% of Teacher 4’s students received Flex Friday intervention.
Almost all students who were coded as receiving only one intervention received Flex
Friday. The exceptions were two students who were coded in an Enrichment program –
presumably an accelerated instructional program. Students coded as receiving two interventions
generally also received Flex Friday, along with one of the Math Academy interventions. Two
students were coded as also receiving Enrichment, while three were coded as receiving
14
Intervention. A similar pattern was observed for students who received three interventions, with
students generally receiving one extra Math Academy intervention. Finally, almost all students
receiving four interventions received Flex Friday and all three Math Academy interventions:
Knowing Fractions, Place Value, and Understanding Fractions.
Teacher 5. Teacher 5 instructed 143 sixth-grade students. These students began the year
scoring, on average, 15.84 points out of the 25 possible (~75th percentile). This beginning
achievement level was over three points higher than the unweighted grand mean, and was
statistically significant (t = 9.73, p < .001). Given the high initial achievement, we would
theoretically expect fewer students to receive additional instructional attention. Yet, the ordinal
regression analysis did not suggest students instructed by Teacher 5 were any less likely to be
administered an intervention than students in other classes (OR = .94, p < .05). Students
instructed by Teacher 5 made, on average, 0.09 points of linear growth per month, which was
significantly lower than the unweighted grand mean linear slope (t = -2.30, p = .02).
Teacher 5 used two labels for instructional practices: general instruction and peer
tutoring. Multiple instructional practices were also described without a label assigned by Teacher
5. These were analyzed and given 12 researcher-identified labels, as displayed in Table 8. It
should be noted that Teacher 5 indicated not all students received general math (core) instruction
based on the CCSS (135 of 143 students). Though the possibility exists that these eight students
did not receive core curriculum, it appears more likely that this was a data entry error based on
the instruction/intervention information indicated for them. For example, Teacher 5 indicated
that two of these eight students received preferential seating and out-of-class help sessions. It
seems unreasonable that these two students would receive these particular interventions without
having also received core instruction in math.
15

Six of the twelve researcher-identified instructional practices appeared largely academic
in nature, including one “industry packaged” math intervention, Moby Math, and four teacher-
created interventions. Moby Math is an online math intervention offered by MobyMax that is
designed to align with the CCSS and provide students extra practice in targeted skill areas
(MobyMax, 2013). Teacher 5 indicated that five students received the Moby Math intervention
one day per week for at least three weeks. The short duration of this intervention indicates that
perhaps these students were struggling in one or more math skills, and thus, Teacher 5
supplemented CCSS core curriculum with Moby Math to improve specific skills. The remaining
five interventions indicated as being implemented by Teacher 5 appeared as variations of extra
instructional time, the most implemented of these being peer tutoring. Teacher 5 indicated that
33 students received daily peer tutoring in math for an average of 10 minutes per day. Other
academic interventions included: one-to-one instruction (n = 9) for approximately 10 minutes
over four days per week, and out-of-class help session (n = 4) implemented as a stand-alone
intervention (n = 2) or in concert with another intervention (e.g., peer tutoring, parental
communication).
In addition to academic information, five academic and/or behavioral-focused practices
were also recorded. The most frequently implemented of these was preferential seating (n = 77).
Additional intervention of this nature was generally a variation of parental communication. Six
students received parental communication as a standalone intervention, while three additional
students received it in concert with another intervention (e.g., out-of-class help sessions, positive
reinforcement).
16

Results by Teacher: Grade 7
As mentioned previously, seventh grade students, on average, did not make growth
significantly distinguishable from zero (i.e., flat). Further, neither this lack of growth, nor the
odds of students being administered multiple interventions varied by teacher. That is, the teacher
factor in the ordinal regression analysis was not significant for any individual teacher. Below, we
describe the instructional practices for each of the three Grade 7 teachers included in the study,
but do not discuss the average growth occurring within each classroom.
Teacher 6. Teacher 6 instructed 82 seventh-grade students who were coded as having
received between 0 and 6 interventions. The following instructional labels were provided: (a)
General Instruction, (b) Flex Friday, (c) Progress-Monitoring, and (d) Math Academy. The Math
Academy label had both a general label, as well as three specific labels: (a) Measurement, (b)
Operations and Word Problems, and (c) Rational Numbers. Full descriptions of each of these
instructional labels, as well as the number of students receiving each, are provided in Table 9.
Twenty students, or approximately 24%, were coded as having only received General
Instruction. Students coded as receiving two interventions generally received General Education
along with Flex Friday, although five students received Progress Monitoring. Students coded
with three labels were generally assigned to all three of these practices, while students coded as
receiving more than three interventions were also assigned to one or multiple Math Academy
interventions.
Teacher 7. Teacher 7 instructed 84 seventh-grade students and provided three
instructional practice labels: (a) Special Education for math, (b) Pre-Algebra, and (c) Flex
Friday, described as “a pre-teach/re-teach model for students performing just below standard in
general education math classes”. During Flex Friday, teachers divided students based on their
17
educational needs to provide targeted instruction. Teacher 7 also indicated student participation
in four Math Academy units: (a) measurement, (b) rational numbers, (c) understanding fractions,
and (d) operations/word problems. Students received zero (n = 7 students, 8%) to four (n = 11
students, 13%) interventions, with the majority receiving only one (n = 39 students, 45%). Full
descriptions of the instructional labels and the number of students receiving each, are provided in
Table 10.
Approximately 54% of students who received one intervention were assigned to Flex
Friday, with 41% to pre-algebra. The remaining 5% were assigned to either the measurement or
the operations and word problems unit of Math Academy. The 21 students receiving two
interventions were assigned to Pre-Algebra 57% of the time, with 48% of students participating
in Flex Friday. Approximately 43% of students were assigned to the measurement portion of
Math Academy, 19% to rational numbers, 14% to operations and word problems, and 5% to
understanding fractions. In addition, 14% of students received Special Education in math. All six
students receiving three interventions during the year were assigned to the measurement portion
of Math Academy, four also participated in Flex Friday, three participated in Math Academy for
rational numbers, three participated in Pre-Algebra, and one received an understanding fractions
and operations and word problems intervention. All 11 students who received four interventions
participated in the measurement portion of Math Academy, as well as Flex Friday. Eight were
assigned to the operations and word problems portion of Math Academy, seven to understanding
fractions, four to rational numbers, and three to Pre-Algebra.
Teacher 8. Two clear interventions were indicated for the 63 seventh-grade students
instructed by Teacher 8: (a) Special Education; and (b) Flex Friday, described as “a pre-teach/re-
teach model for students performing just below standard in general education math classes”.
18
Some students received Flex Friday for the whole year; others for two-month intervals. Teacher
8 also indicated students participated in five different Math Academy units: (a) measurement, (b)
place value, (c) rational numbers, (d) understanding fractions, and (e) operations/word problems.
Students received 0 (n = 1 student, 2%) to 4 (n = 5 students, 8%) interventions, with the majority
receiving one (n = 26 students, 41%). Full descriptions of each of these instructional labels, as
well as the number of students receiving each, are provided in Table 11.
The majority of students receiving only one intervention were assigned to either full year
Flex Friday (42%), or to a two-month Flex Friday segment (31%). The same was largely true for
the 19 students receiving two interventions. Special Education was coded as an intervention for
six students (~32%). The 12 students receiving three interventions during the year were
frequently assigned to full year Flex Friday (67%) and the measurement portion of Math
Academy (67%). Roughly a third participated in a two-month Flex Friday segment. In the Math
Academy intervention, an additional 42% of students received the place value component and/or
the understanding fractions component, while roughly a third participated in the operations and
word problems component. In the final group of five students receiving four interventions, all
participated in the measurement portion of Math Academy, as well as some form of Flex Friday
(40% full-year, 40% two two-month periods, 20% one two-month period).
Discussion
The purpose of this study was to explore students’ mathematics growth on the
easyCBM© CCSS Math measures in Grades 6 and 7, along with teachers’ instructional
practices. Specifically, we aimed to describe the average shape and rate of students’ growth
within each grade, explore general instructional decisions, and attempt to identify patterns in
students identified for additional instructional support. Below, each item is discussed in turn.
19
Growth Modeling
The average rate and shape of students’ growth was substantially different between the
two grades. For Grade 6, an accelerating curvilinear trend best modeled the observed data. For
Grade 7, a linear model best fit the observed data. Students’ overall growth trajectories resulted
in modest gains in both grades. In Grade 6, students were predicted to gain approximately one
item correct per season (3 months), while in Grade 7 students did not, on average, make growth
significantly different from 0. In Grade 6, the initial linear portion of the trajectory varied
between students, but the curvilinear portion did not. In Grade 7, only the intercept varied
significantly between students. Finally, in Grade 6, students made, on average, significantly
different growth depending on the teacher by whom they were instructed. In Grade 7, students’
slope did not vary between students, rendering an analysis of teacher effects untenable due to
lack of variance in student scores.
The overall modest growth observed in the Grade 6 sample and the lack of any observed
growth on average for Grade 7, likely relates to multiple factors. First, the measures themselves
were found, in a previous study, to be functioning at less than ideal levels of reliability (e.g., <
.70; Anderson et al., 2013a). Although students in Grade 7 exhibited, on average, flat growth, it
is possible that some of this lack of growth was due to unreliability in measurement. Subsequent
revisions to the measures have been made (Anderson, Alonzo, & Tindal, 2013b), and future
studies using the easyCBM CCSS Math measures are anticipated to have more success in
modeling students’ growth with greater precision. Second, a growing body of research seems to
suggest that the overall rate of mathematics acquisition, particularly in the upper grades, may
simply be shallower than growth observed in other domains or grade levels (Foegen, Jiban, &
20
Deno, 2007; Irvin, Anderson, Saven, Alonzo, & Tindal, 2013; Saven, Anderson, Nese, Alonzo,
& Tindal, 2013).
Alternative methods for scaling the measures (outside of raw scores) may help make the
measures more sensitive to detecting changes in students’ abilities. However, the challenge for
teachers to use students’ growth in mathematics within decision-making frameworks such as RTI
will likely remain given that the “true” rate of acquisition in math conceptual understanding is
modest when compared to early developmental skills (e.g., number recognition fluency and
reading fluency). Third, this study was conducted with measures specifically written to align
with the CCSS. However, the schools in which the study took place were all in their first year of
implementing CCSS-based instruction. It is possible that students did not have adequate
opportunity to learn the content prior to testing. As Burkhardt and Schoenfeld (2003) noted, “it
takes a long time for a collaborative team [i.e., teachers] to discover and document the
complexities of large-scale implementation” (p. 11). It is quite possible that the low growth
observed was due, in part, to implementation effects associated with the transition to the
Common Core.
General Instructional Practices
This study was conducted in two schools in two western states. Part of the challenge of
evaluating instructional practices from a limited sample is that school or district policies will
likely create common practices across teachers. Such was the case in this study. For instance,
many teachers, who worked in the same school and likely shared students, coded Flex Friday as
an instructional practice. This study also was conducted with teachers entering instructional
information into an online repository, rather than having teachers’ practices observed and coded
by trained researchers. Although the online interface was convenient, the lack of depth of
21

information led us to be unable to achieve our initial goal – including instructional practices as
covariates in growth analyses. Rather, the instructional information acquired supplemented the
growth analyses. Yet even here, the information was not coded with sufficient detail to enable in-
depth understanding of why differential rates of student growth might have occurred.
Teachers 1 and 2 had the largest difference in terms of students’ average growth, with
students instructed by Teacher 2 making approximately half a point of growth more per month,
on average, than students instructed by Teacher 1. We were hopeful that the teacher-provided
instructional information would supplement our results to help explain these discrepancies.
Unfortunately, many questions remain. Although Teacher 2’s students made significantly greater
improvement relative to other teachers in this study, the coded instructional information was
quite similar to Teachers 3 and 4, for whom average student growth was not significantly
different than the mean of the group means. It is therefore unclear what Teacher 2 did
instructionally different (if anything) from Teachers 3 and 4 that might account for his or her
students progressing at a faster than average rate.
The overarching question of our study—how teacher instructional practices relate to
student growth—remains largely unanswered. Future research should employ direct observation
of teacher practices in addition to self-report techniques. Were more accurate data available,
instructional practices could be entered directly into growth models so the effect of specific
interventions might be observed. These analyses would then represent, essentially, an interrupted
time series design in which the effects of interventions would be observable in direct relation to
changes in student growth. Further, if students were administered interventions at different time
periods, a multiple baseline design could be paired with the interrupted time series design. The
22

research design would then have strong internal validity, leading to greater confidence in any
observed effects
Students Identified as In Need of Additional Support
Little information was available regarding why specific students were administered
multiple interventions when others were not. The results of our ordinal regression analysis
suggested that students’ initial achievement was a consistent and quite strong predictor of the
likelihood that students would be provided multiple interventions. Students’ rate of improvement
was a significant predictor in Grade 7, but not Grade 6. Teachers were not a significant predictor
in Grade 7, but were the most important predictor (i.e., resulted in the greatest change in
likelihood of receiving multiple interventions) in Grade 6.
The differences in the likelihood of students receiving additional interventions by teacher
in Grade 6 was likely related to teachers in Grade 6 coming from two different schools in two
different states, with different school-wide RTI policies, and serving different student
populations. However, it also may have been the result of two teachers—Teacher 1 and Teacher
4—being quite discrepant in the number of interventions they provided from all other teachers.
Follow-up comparisons were not conducted to examine, for instance, if the likelihood differed
between Teacher 2 and Teacher 3. On the whole, however, teachers were different in the rate at
which they provided interventions. It is also worth noting that Teacher 1 and Teacher 4 did, in
fact, teach in different schools. The likelihood of students receiving an intervention in Teacher
1’s classroom was significantly less than average, while the likelihood was significantly more in
Teacher 4’s classroom.
Clearly, more work needs to be completed to better understand how these decisions are
being made. While the ordinal regression analysis showed some of the predictive power of
23
intercept and slope, there are surely other factors that come into consideration when determining
how many and which interventions a student should receive (e.g., resource allocation, other
academic performance indices). This study did little to address the specific types of interventions
students received. Future research should focus specifically on these teacher decision-making
aspects, as the validity of RTI rests on such decisions.
Conclusion
Although RTI has been adopted at an astounding rate across the country (Castillo &
Batsche, 2012), its promises may be unfruitful if (a) teachers are not identifying the correct
students for intervention, and/or (b) the intervention does not sufficiently increase students’
achievement beyond what core instruction would otherwise provide. More research relating
teachers’ practices with students’ growth is needed. The efforts of this study also suggest that
self-report mechanisms for collecting intervention or instructional data may be insufficient.
Accurate data requires not only precise coding of practices, but also specific dates from which
the onset of instruction occurred. Such data were largely missing from our sample. Our study can
therefore only be considered a preliminary analysis for future research.
24

References
Anderson, D., Alonzo, J., & Tindal, G. (2013a). Study of the Reliability of CCSS-Aligned Math
Measures (2012 Research Version): Grades 6-8 (Technical Report No. 1312). Eugene, OR:
Behavioral Research and Teaching, University of Oregon.
Anderson, D., Alonzo, J., & Tindal, G. (2013b). easyCBM CCSS Math Item Scaling and Test
Form Revision (2012-2013): Grades 6-8. (Technical Report No. 1313). Eugene, OR:
Behavioral Research and Teaching, University of Oregon.
Anderson, D., Irvin, P. S., Alonzo, J., & Tindal, G. (2012). The Alignment of the easyCBM
Middle School Mathematics CCSS Measures to the Common Core State Standards
(Technical Report No. 1208). Eugene, OR: Behavioral Research and Teaching, University of
Oregon.
Anderson, D., Irvin, P. S., Patarapichayatham, C., Alonzo, J., & Tindal, G. (2012). The
Development and Scaling of the easyCBM CCSS Middle School Mathematics Measures
(Technical Report No. 1207). Eugene, OR: Behavioral Research and Teaching, University of
Oregon.
Bates, D., Maechler, M., Bolker, B., & Walker, S. (2013). lme4: Linear mixed-effects models
using Eigen and S4. R package version 1.0-4. http://CRAN.R-‐project.org/package=lme4.
Burkhardt, H., & Schoenfeld, A. H. (2003). Improving educational research: Toward a more
useful, more influential, and better-funded enterprise. Educational Researcher, 32, 3-14. doi:
10.3102/0013189X032009003
Castillo, J. M., & Batsche, G. M. (2012). Scaling up response to intervention: The influency of
policy and research nad the role of program evaluation. NASP Communiqué, 40(8),
http://www.nasponline.org/publications/cq/40/48/scaling-‐up-‐response.aspx.
25

Deno, S., Reschly, A., Lembke, E., Magnusson, D., Callender, S., Windram, H., et al. (2009).
Developing a school-wide progress-monitoring system. Psychology in the Schools, 46, 44-55.
doi: 10.1002/pits.20353
Foegen, A., Jiban, C., & Deno, S. (2007). Progress monitoring measures in mathematics. Journal
of Special Education, 41, 121-139. doi: 10.1177/00224669070410020101
Fuchs, D., & Fuchs, L. S. (2006). Introduction to response to intervention: What, why and how
valid is it? Reading Research Quarterly, 41, 93-99. doi: 10.1598/RRQ.41.1.4
Hox, J. J. (2010). Multilevel analysis: Techniques and applications. New York, NY: Routledge.
Irvin, P. S., Anderson, D., Saven, J. L., Alonzo, J., & Tindal, G. (2013). Within-year growth in
math: Implications for progress-monitoring using RTI. Paper presented at the annual meeting
of the American Educational Research Association, San Francisco, CA.
Kuznetsova, A., Brockhoff, P. B., & Christensen, R. H. B. (2013). lmerTest: Tests for random
and fixed effects for linear mixed effect models (lmer objects of lme4 package). R package
version 2.0-0. http://CRAN.R-‐project.org/package=lmerTest.
MobyMax. (2013). Moby Math Retrieved 10-21-13, 2013, from
http://www.mobymax.com/Curriculum/Math
R Core Team. (2013). R: A language and environment for statistical computing. R Foundation
for Statistical Computing, Vienna, Austria. URL http://www.R-‐project.org/ .
Raudenbush, S. W., & Liu, X. (2000). Statistical power and optimal design for multisite
randomized trials. Psychological Methods, 5, 199-213. doi: 10.1037//1082-989X.5.2.199
Saven, J. L., Anderson, D., Nese, J. F. T., Alonzo, J., & Tindal, G. (2013). Teacher decision
making and within-year growth in math. Paper presented at the Annual meeting of the
American Educational Research Association, San Francisco, CA.
26

Snijders, T. A. B. (2005). Power and sample size in multilevel linear models. In B. S. Everitt &
D. C. Howell (Eds.), Encyclopedia of Statistics in Behavioral Science (Vol. 3, pp. 1570-
1573). Chicester: Wiley.
Thompson, S. J., Johnstone, C. J., & Thurlow, M. L. (2002). Universal design applied to large
scale assessments (Synthesis Report 44). Minneapolis, MN: University of Minnesota,
National Center on Educational Outcomes. Retrieved November 2, 2011, from the World
Wide Web: http://education.umn.edu/NCEO/OnlinePubs/Synthesis44.html.
Tindal, G., Alonzo, J., Nese, J. F. T., & Sáez, L. (2012). Validating progress monitoring in the
context of RTI. Paper presented at the Pacific Coast Research Conference (PCRC), Coronado,
CA.
Wickham, H. (2009). ggplot2: elegant graphics for data analysis. New York: Springer.
27

Table 1 Hierarchical Linear Growth Modeling Results
Parameter Grade 6 Grade 7 Full Final Final 95% CI Full Final Final 95% CI
Fixed effects Intercept, 𝛽!! 12.73* 12.70* 12.14 13.25 12.73* 12.91* 12.46 13.36
Teacher 1, 𝛽!" 3.30* 3.04* 2.41 3.68 - - - - Teacher 2, 𝛽!" -2.65* -1.49* -2.40 -0.57 - - - - Teacher 3, 𝛽!" -2.00* -0.73 -1.48 0.02 - - - - Teacher 4, 𝛽!" -1.71 -3.97* -5.24 -2.70 - - - - Teacher 5, 𝛽!" 3.05* 3.14* 2.51 3.77 - - - - Teacher 6, 𝛽!" - - - - -0.29 - - - Teacher 7, 𝛽!" - - - - 0.05 - - - Teacher 8, 𝛽!" - - - - 0.24 - - -
Linear, 𝛽!" 0.20 0.23* 0.01 0.45 0.22 0.00 -0.10 0.09 Teacher 1, 𝛽!! -0.60* -0.27* -0.39 -0.16 - - - - Teacher 2, 𝛽!" 0.87 0.27* 0.11 0.44 - - - - Teacher 3, 𝛽!" 0.54 -0.07 -0.20 0.05 - - - - Teacher 4, 𝛽!" -0.78 0.21 -0.02 0.45 - - - - Teacher 5, 𝛽!" -0.03 -0.14* -0.25 -0.02 - - - - Teacher 6, 𝛽!" - - - - 0.36 - - - Teacher 7, 𝛽!" - - - - -0.28 - - - Teacher 8, 𝛽!" - - - - -0.08 - - -
Quadratic, 𝛽!" 0.06* 0.05* 0.02 0.08 -0.03 - - - Teacher 1, 𝛽!" 0.05 - - - - - - - Teacher 2, 𝛽!! -0.07 - - - - - - - Teacher 3, 𝛽!" -0.06* - - - - - - - Teacher 4, 𝛽!" 0.10 - - - - - - - Teacher 5, 𝛽!" -0.02 - - - - - - - Teacher 6, 𝛽!" - - - - -0.05 - - - Teacher 7, 𝛽!" - - - - 0.05 - - - Teacher 8, 𝛽!" - - - - 0.00 - - -
Variance components Intercept, 𝑟!! 2.50 2.56 2.31 2.83 3.04 2.74 2.36 3.16 Linear, 𝑟!! 0.25 0.25 0.11 0.92 0.61 0.45 -0.34 0.20 Quadratic, 𝑟!! 0.01 - - - 0.09 - - - Residual, 𝑒!" 2.44 2.45 2.38 2.53 2.69 2.73 0.34 0.57
Model Fit AIC 14246 14247 5869 5779 BIC 14376 14336 5949 5809 Deviance 14202 14217 5837 5767
Note. Variance components reported in standard deviation units. No statistical test of variance components was performed. Confidence intervals computed from deviance profiling, and are displayed in the following format: lower bound estimate | upper bound estimate. *p < .05
28

Table 2 Ordinal Regression Results
Parameter Estimate SE 95% CI: Est Odds Ratio 95% CI: OR Lower Upper Lower Upper
Grade 6 Intercept -0.45* 0.09 -0.63 -0.27 0.64 0.53 0.77 Slope -1.54 1.16 -3.82 0.73 0.21 0.02 2.08 Teacher 1 -2.33* 0.24 -2.83 -1.87 0.10 0.06 0.15 Teacher 2 0.08 0.20 -0.31 0.47 1.09 0.74 1.60 Teacher 3 0.22 0.20 -0.17 0.61 1.25 0.84 1.84 Teacher 4 2.08* 0.23 1.64 2.54 8.04 5.14 12.73 Teacher 5 -0.06 0.16 -0.39 0.26 0.94 0.68 1.30
Grade 7 Intercept -0.36* 0.06 -0.48 -0.24 0.70 0.62 0.78 Slope -1.14* 0.43 -1.99 -0.31 0.32 0.14 0.73 Teacher 6 -0.09 0.18 -0.44 0.26 0.92 0.65 1.30 Teacher 7 -0.15 0.17 -0.49 0.19 0.86 0.61 1.20 Teacher 8 0.24 0.18 -0.12 0.60 1.27 0.89 1.82
*p < .05
29

Table 3
Number of Interventions students received, by teacher
n Interventions
Teacher
Grade 6 Grade 7
1 2 3 4 5 6 7 8
0 98 (.75) 31 (.39) 38 (.46) 0 (.00) 67 (.47) 20 (.24) 7 (.08) 1 (.02)
1 24 (.18) 29 (.36) 22 (.27) 30 (.54) 31 (.22) 2 (.02) 39 (.46) 25 (.40)
2 7 (.05) 10 (.13) 10 (.12) 8 (.14) 24 (.17) 11 (.13) 21 (.25) 20 (.32)
3 1 (.01) 10 (.13) 4 (.05) 6 (.11) 14 (.10) 19 (.23) 6 (.07) 12 (.19)
4 1 (.01) 0 (.00) 6 (.07) 12 (.21) 5 (.04) 17 (.21) 11 (.13) 5 (.08)
5 0 (.00) 0 (.00) 0 (.00) 0 (.00) 1 (.01) 6 (.07) 0 (.00) 0 (.00)
6 0 (.00) 0 (.00) 1 (.01) 0 (.00) 1 (.01) 7 (.09) 0 (.00) 0 (.00)
Total 131 80 82 56 143 82 84 63
Note. Proportion displayed in parentheses. Proportions not summing to 1.0 represent rounding error.
30
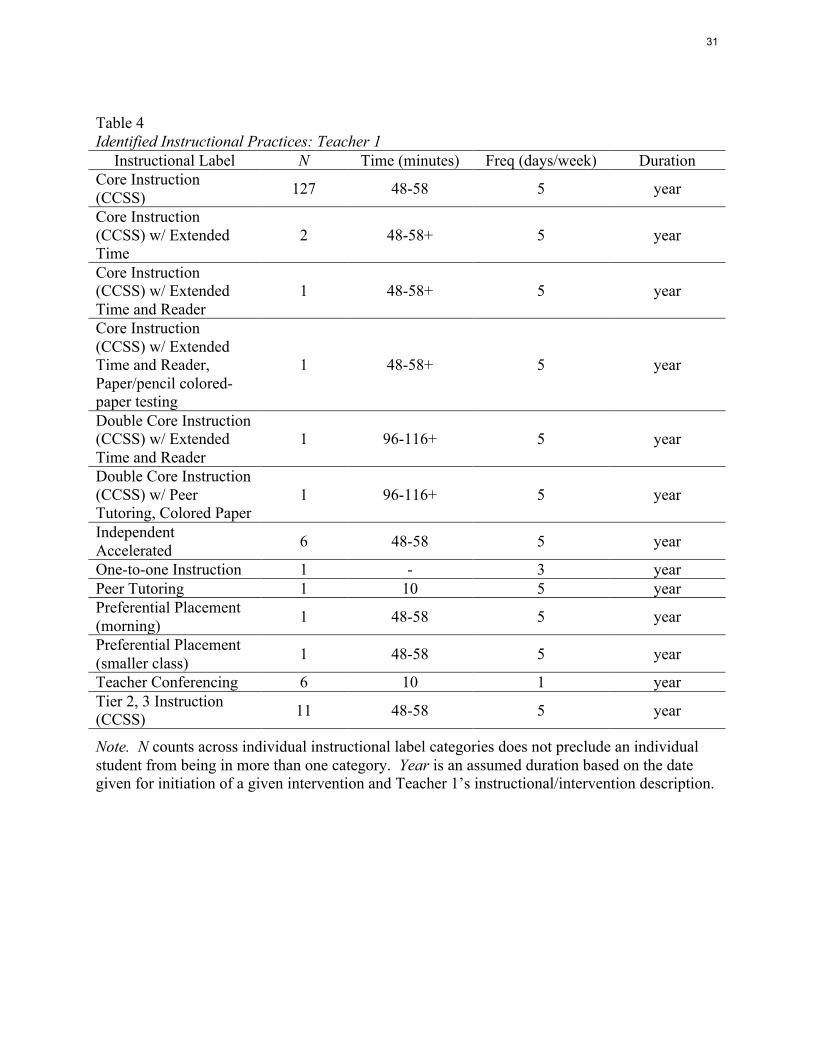
Table 4 Identified Instructional Practices: Teacher 1
Instructional Label N Time (minutes) Freq (days/week) Duration Core Instruction (CCSS) 127 48-58 5 year
Core Instruction (CCSS) w/ Extended Time
2 48-58+ 5 year
Core Instruction (CCSS) w/ Extended Time and Reader
1 48-58+ 5 year
Core Instruction (CCSS) w/ Extended Time and Reader, Paper/pencil colored-paper testing
1 48-58+ 5 year
Double Core Instruction (CCSS) w/ Extended Time and Reader
1 96-116+ 5 year
Double Core Instruction (CCSS) w/ Peer Tutoring, Colored Paper
1 96-116+ 5 year
Independent Accelerated 6 48-58 5 year
One-to-one Instruction 1 - 3 year Peer Tutoring 1 10 5 year Preferential Placement (morning) 1 48-58 5 year
Preferential Placement (smaller class) 1 48-58 5 year
Teacher Conferencing 6 10 1 year Tier 2, 3 Instruction (CCSS) 11 48-58 5 year
Note. N counts across individual instructional label categories does not preclude an individual student from being in more than one category. Year is an assumed duration based on the date given for initiation of a given intervention and Teacher 1’s instructional/intervention description.
31
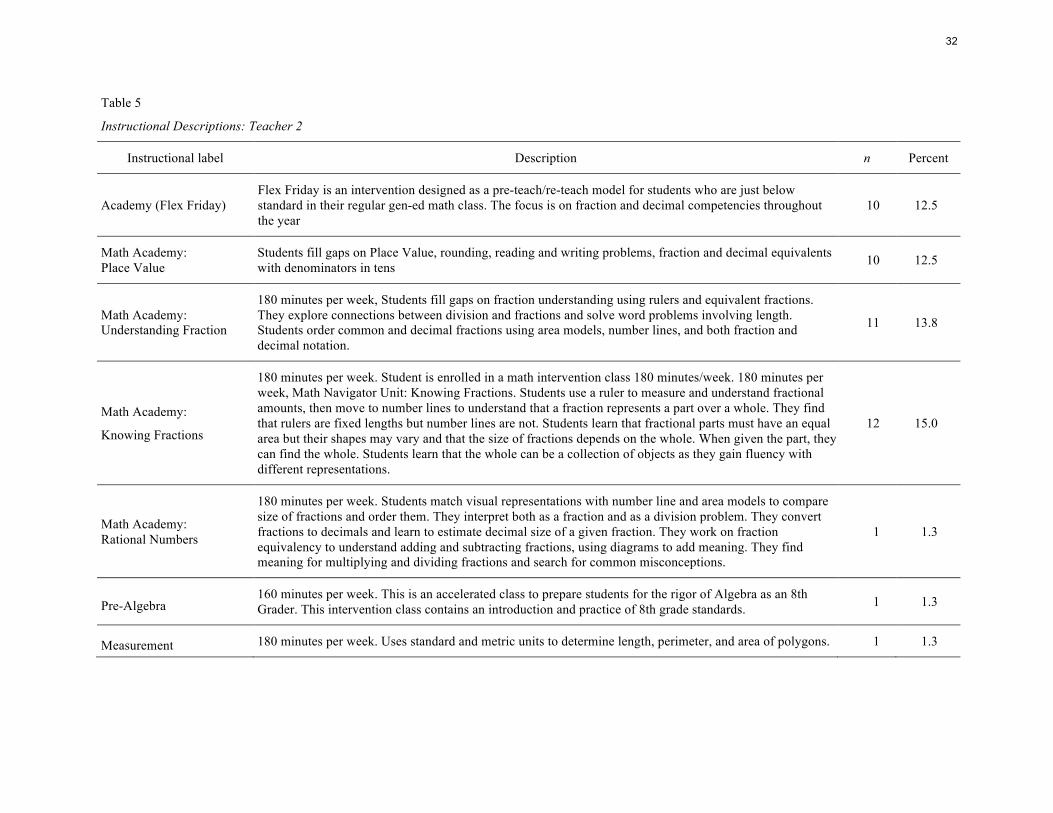
Table 5
Instructional Descriptions: Teacher 2
Instructional label Description n Percent
Academy (Flex Friday) Flex Friday is an intervention designed as a pre-teach/re-teach model for students who are just below standard in their regular gen-ed math class. The focus is on fraction and decimal competencies throughout the year
10 12.5
Math Academy: Place Value
Students fill gaps on Place Value, rounding, reading and writing problems, fraction and decimal equivalents with denominators in tens 10 12.5
Math Academy: Understanding Fraction
180 minutes per week, Students fill gaps on fraction understanding using rulers and equivalent fractions. They explore connections between division and fractions and solve word problems involving length. Students order common and decimal fractions using area models, number lines, and both fraction and decimal notation.
11 13.8
Math Academy:
Knowing Fractions
180 minutes per week. Student is enrolled in a math intervention class 180 minutes/week. 180 minutes per week, Math Navigator Unit: Knowing Fractions. Students use a ruler to measure and understand fractional amounts, then move to number lines to understand that a fraction represents a part over a whole. They find that rulers are fixed lengths but number lines are not. Students learn that fractional parts must have an equal area but their shapes may vary and that the size of fractions depends on the whole. When given the part, they can find the whole. Students learn that the whole can be a collection of objects as they gain fluency with different representations.
12 15.0
Math Academy: Rational Numbers
180 minutes per week. Students match visual representations with number line and area models to compare size of fractions and order them. They interpret both as a fraction and as a division problem. They convert fractions to decimals and learn to estimate decimal size of a given fraction. They work on fraction equivalency to understand adding and subtracting fractions, using diagrams to add meaning. They find meaning for multiplying and dividing fractions and search for common misconceptions.
1 1.3
Pre-Algebra 160 minutes per week. This is an accelerated class to prepare students for the rigor of Algebra as an 8th Grader. This intervention class contains an introduction and practice of 8th grade standards. 1 1.3
Measurement 180 minutes per week. Uses standard and metric units to determine length, perimeter, and area of polygons. 1 1.3
32
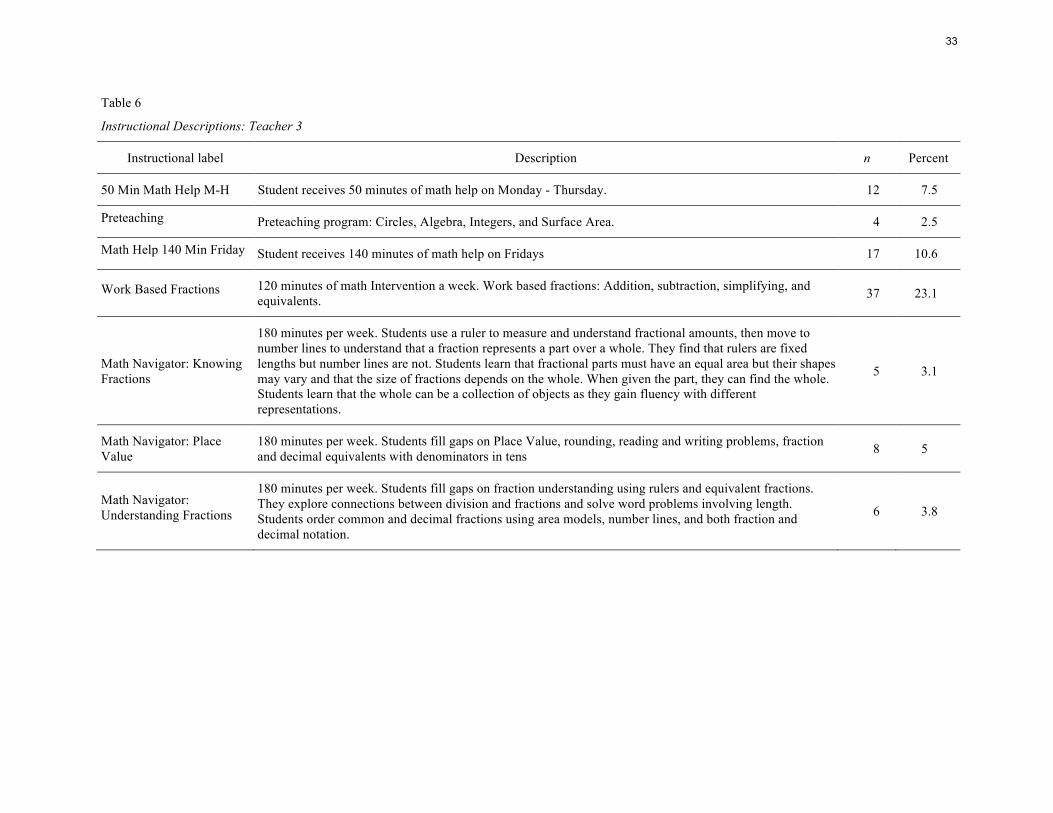
Table 6
Instructional Descriptions: Teacher 3
Instructional label Description n Percent
50 Min Math Help M-H Student receives 50 minutes of math help on Monday - Thursday. 12 7.5
Preteaching Preteaching program: Circles, Algebra, Integers, and Surface Area. 4 2.5
Math Help 140 Min Friday Student receives 140 minutes of math help on Fridays 17 10.6
Work Based Fractions 120 minutes of math Intervention a week. Work based fractions: Addition, subtraction, simplifying, and equivalents. 37 23.1
Math Navigator: Knowing Fractions
180 minutes per week. Students use a ruler to measure and understand fractional amounts, then move to number lines to understand that a fraction represents a part over a whole. They find that rulers are fixed lengths but number lines are not. Students learn that fractional parts must have an equal area but their shapes may vary and that the size of fractions depends on the whole. When given the part, they can find the whole. Students learn that the whole can be a collection of objects as they gain fluency with different representations.
5 3.1
Math Navigator: Place Value
180 minutes per week. Students fill gaps on Place Value, rounding, reading and writing problems, fraction and decimal equivalents with denominators in tens 8 5
Math Navigator: Understanding Fractions
180 minutes per week. Students fill gaps on fraction understanding using rulers and equivalent fractions. They explore connections between division and fractions and solve word problems involving length. Students order common and decimal fractions using area models, number lines, and both fraction and decimal notation.
6 3.8
33
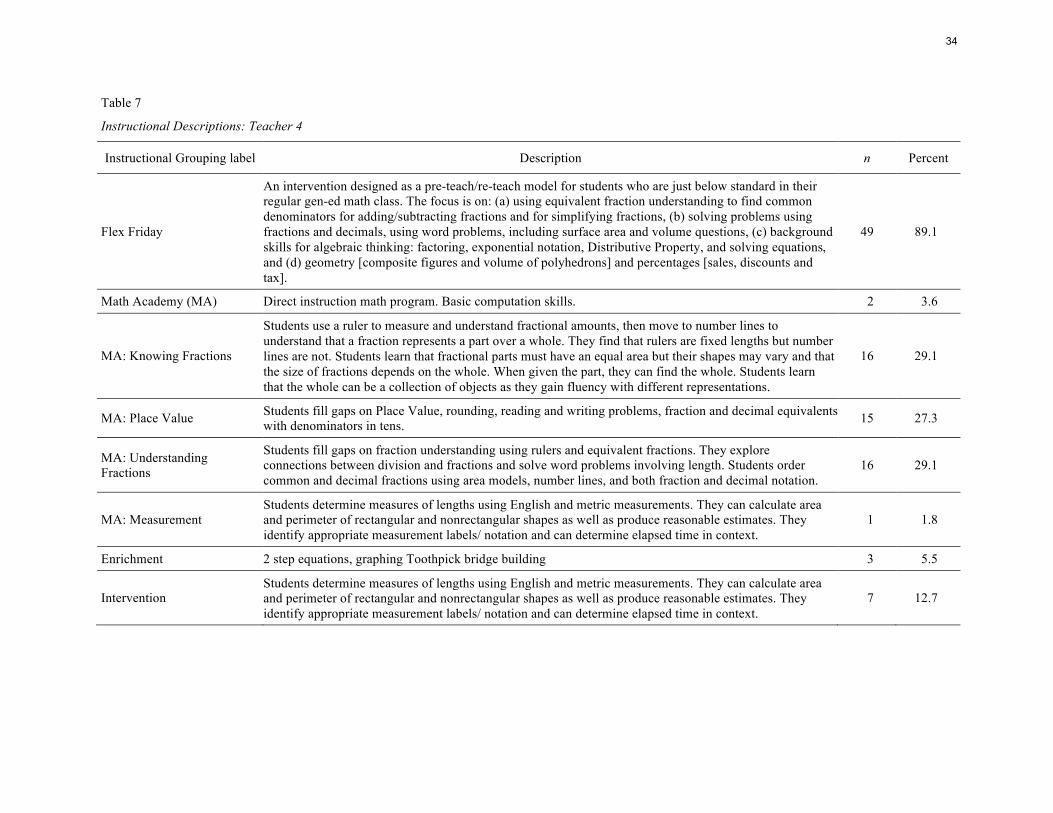
Table 7
Instructional Descriptions: Teacher 4
Instructional Grouping label Description n Percent
Flex Friday
An intervention designed as a pre-teach/re-teach model for students who are just below standard in their regular gen-ed math class. The focus is on: (a) using equivalent fraction understanding to find common denominators for adding/subtracting fractions and for simplifying fractions, (b) solving problems using fractions and decimals, using word problems, including surface area and volume questions, (c) background skills for algebraic thinking: factoring, exponential notation, Distributive Property, and solving equations, and (d) geometry [composite figures and volume of polyhedrons] and percentages [sales, discounts and tax].
49 89.1
Math Academy (MA) Direct instruction math program. Basic computation skills. 2 3.6
MA: Knowing Fractions
Students use a ruler to measure and understand fractional amounts, then move to number lines to understand that a fraction represents a part over a whole. They find that rulers are fixed lengths but number lines are not. Students learn that fractional parts must have an equal area but their shapes may vary and that the size of fractions depends on the whole. When given the part, they can find the whole. Students learn that the whole can be a collection of objects as they gain fluency with different representations.
16 29.1
MA: Place Value Students fill gaps on Place Value, rounding, reading and writing problems, fraction and decimal equivalents with denominators in tens. 15 27.3
MA: Understanding Fractions
Students fill gaps on fraction understanding using rulers and equivalent fractions. They explore connections between division and fractions and solve word problems involving length. Students order common and decimal fractions using area models, number lines, and both fraction and decimal notation.
16 29.1
MA: Measurement Students determine measures of lengths using English and metric measurements. They can calculate area and perimeter of rectangular and nonrectangular shapes as well as produce reasonable estimates. They identify appropriate measurement labels/ notation and can determine elapsed time in context.
1 1.8
Enrichment 2 step equations, graphing Toothpick bridge building 3 5.5
Intervention Students determine measures of lengths using English and metric measurements. They can calculate area and perimeter of rectangular and nonrectangular shapes as well as produce reasonable estimates. They identify appropriate measurement labels/ notation and can determine elapsed time in context.
7 12.7
34

Table 8 Identified Instructional Practices: Teacher 5 Instructional Label N Time (minutes) Freq (days/week) Duration Core Instruction (CCSS) 135 50 5 year
Peer Tutoring 33 10 5 year Moby Math 5 60 1 three weeks One-to-one instruction 9 10 4 year
Out-of-class Help Session 2 - 2.5 -
Out-of-class Help Session, one-to-one instruction, parental communication w/ peer tutoring
1 - - -
Extended instruction 1 15 1 -
Parental communication 6 - 1 -
Parental communication w/ Out-of-class Help Session
1 - 1 -
Parental communication w/ Positive reinforcement
1 - 5 -
Positive reinforcement 2 - 5 year
Preferential Seating 77 - 5 year
Note. N counts across individual instructional label categories does not preclude an individual student from being in more than one category. For example, the same student may receive preferential seating, parental communication, one-to-one instruction, and core instruction.
35
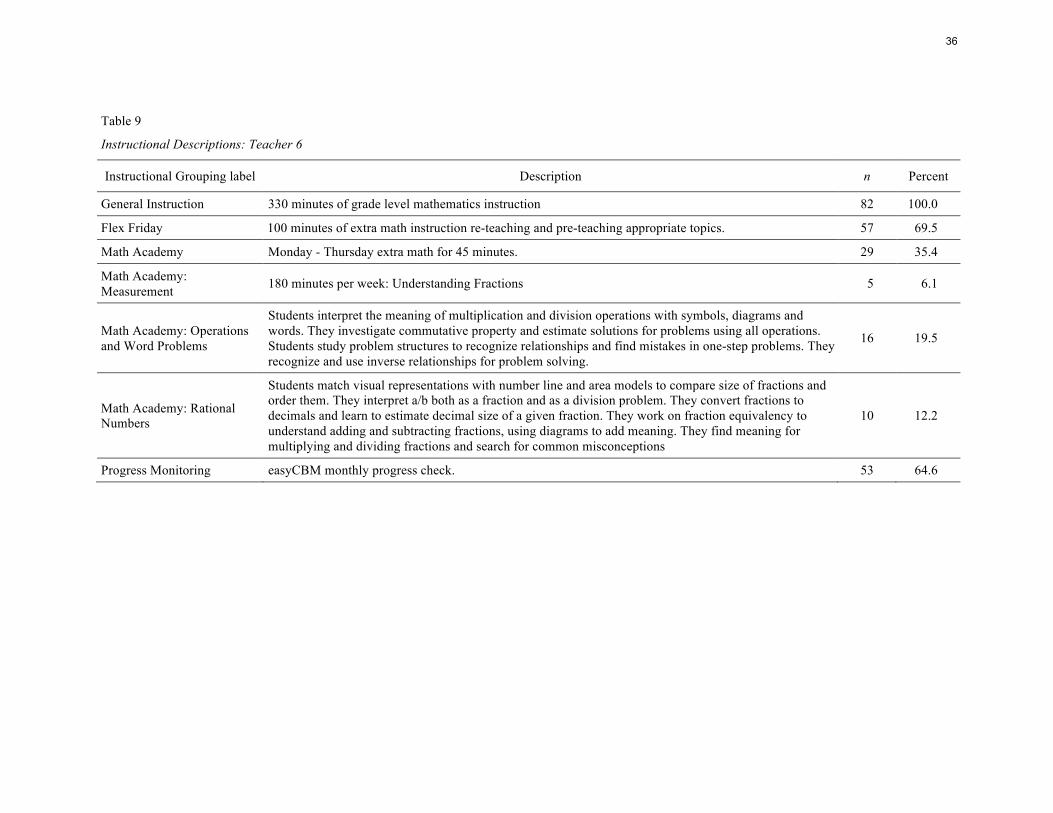
Table 9
Instructional Descriptions: Teacher 6
Instructional Grouping label Description n Percent
General Instruction 330 minutes of grade level mathematics instruction 82 100.0
Flex Friday 100 minutes of extra math instruction re-teaching and pre-teaching appropriate topics. 57 69.5
Math Academy Monday - Thursday extra math for 45 minutes. 29 35.4
Math Academy: Measurement 180 minutes per week: Understanding Fractions 5 6.1
Math Academy: Operations and Word Problems
Students interpret the meaning of multiplication and division operations with symbols, diagrams and words. They investigate commutative property and estimate solutions for problems using all operations. Students study problem structures to recognize relationships and find mistakes in one-step problems. They recognize and use inverse relationships for problem solving.
16 19.5
Math Academy: Rational Numbers
Students match visual representations with number line and area models to compare size of fractions and order them. They interpret a/b both as a fraction and as a division problem. They convert fractions to decimals and learn to estimate decimal size of a given fraction. They work on fraction equivalency to understand adding and subtracting fractions, using diagrams to add meaning. They find meaning for multiplying and dividing fractions and search for common misconceptions
10 12.2
Progress Monitoring easyCBM monthly progress check. 53 64.6
36
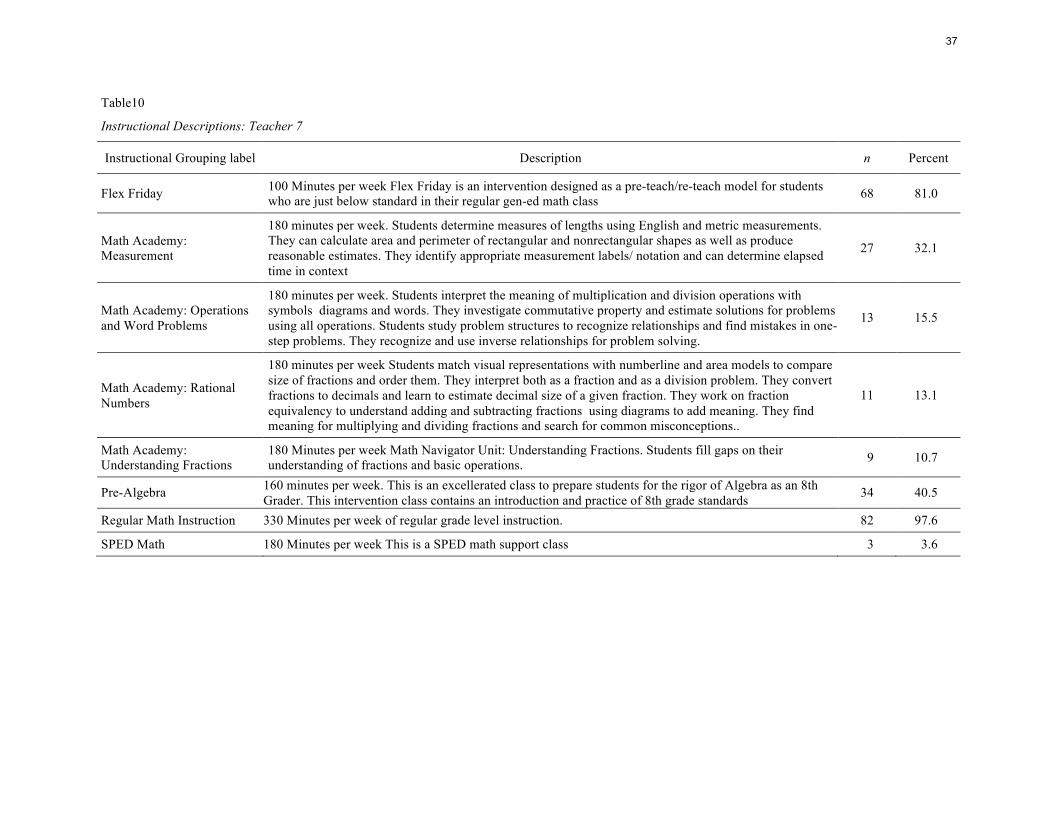
Table10
Instructional Descriptions: Teacher 7
Instructional Grouping label Description n Percent
Flex Friday 100 Minutes per week Flex Friday is an intervention designed as a pre-teach/re-teach model for students who are just below standard in their regular gen-ed math class 68 81.0
Math Academy: Measurement
180 minutes per week. Students determine measures of lengths using English and metric measurements. They can calculate area and perimeter of rectangular and nonrectangular shapes as well as produce reasonable estimates. They identify appropriate measurement labels/ notation and can determine elapsed time in context
27 32.1
Math Academy: Operations and Word Problems
180 minutes per week. Students interpret the meaning of multiplication and division operations with symbols diagrams and words. They investigate commutative property and estimate solutions for problems using all operations. Students study problem structures to recognize relationships and find mistakes in one-step problems. They recognize and use inverse relationships for problem solving.
13 15.5
Math Academy: Rational Numbers
180 minutes per week Students match visual representations with numberline and area models to compare size of fractions and order them. They interpret both as a fraction and as a division problem. They convert fractions to decimals and learn to estimate decimal size of a given fraction. They work on fraction equivalency to understand adding and subtracting fractions using diagrams to add meaning. They find meaning for multiplying and dividing fractions and search for common misconceptions..
11 13.1
Math Academy: Understanding Fractions
180 Minutes per week Math Navigator Unit: Understanding Fractions. Students fill gaps on their understanding of fractions and basic operations. 9 10.7
Pre-Algebra 160 minutes per week. This is an excellerated class to prepare students for the rigor of Algebra as an 8th Grader. This intervention class contains an introduction and practice of 8th grade standards 34 40.5
Regular Math Instruction 330 Minutes per week of regular grade level instruction. 82 97.6
SPED Math 180 Minutes per week This is a SPED math support class 3 3.6
37

Table 11
Instructional Descriptions: Teacher 8
Instructional label Description n Percent
Flex Friday
100 minutes/week. Flex Friday is an intervention designed as a pre-teach/re-teach model for students who are just below standard in their regular gen-ed math class. The focus for Jan-Feb is on understanding scale factors with similar polygons and part-to-part and part-to-whole ratios. Focus for Mar-Apr has gone from decimal/fraction equivalents to surface area and volume of cylinders cones and pyramids to data analysis with stem-and-leaf plots to probability. May-June includes data-statistics and probability. More algebra equation work has been added.
58 92.1
Math Academy: Measurement
180 minutes per week Math Navigator Unit: Measurement. Students determine measures of lengths using English and metric measurements. They can calculate area and perimeter of rectangular and nonrectangular shapes as well as produce reasonable estimates. They identify appropriate measurement labels/ notation and can determine elapsed time in context.
22 34.9
Math Academy: Place Value
180 minutes per week Math Navigator Unit: Place Value Decimals to Billions. Students fill gaps on place value rounding reading and writing problems fraction and decimal equivalents with denominators in tens. 11 17.5
Math Academy: Rational Numbers
180 minutes per week, Math Navigator Unit: Rational Numbers. Students match visual representations with number line and area models to compare size of fractions and order them. They interpret both as a fraction and as a division problem. They convert fractions to decimals and learn to estimate decimal size of a given fraction. They work on fraction equivalency to understand adding and subtracting fractions, using diagrams to add meaning. They find meaning for multiplying and dividing fractions and search for common misconceptions
5 7.9
38
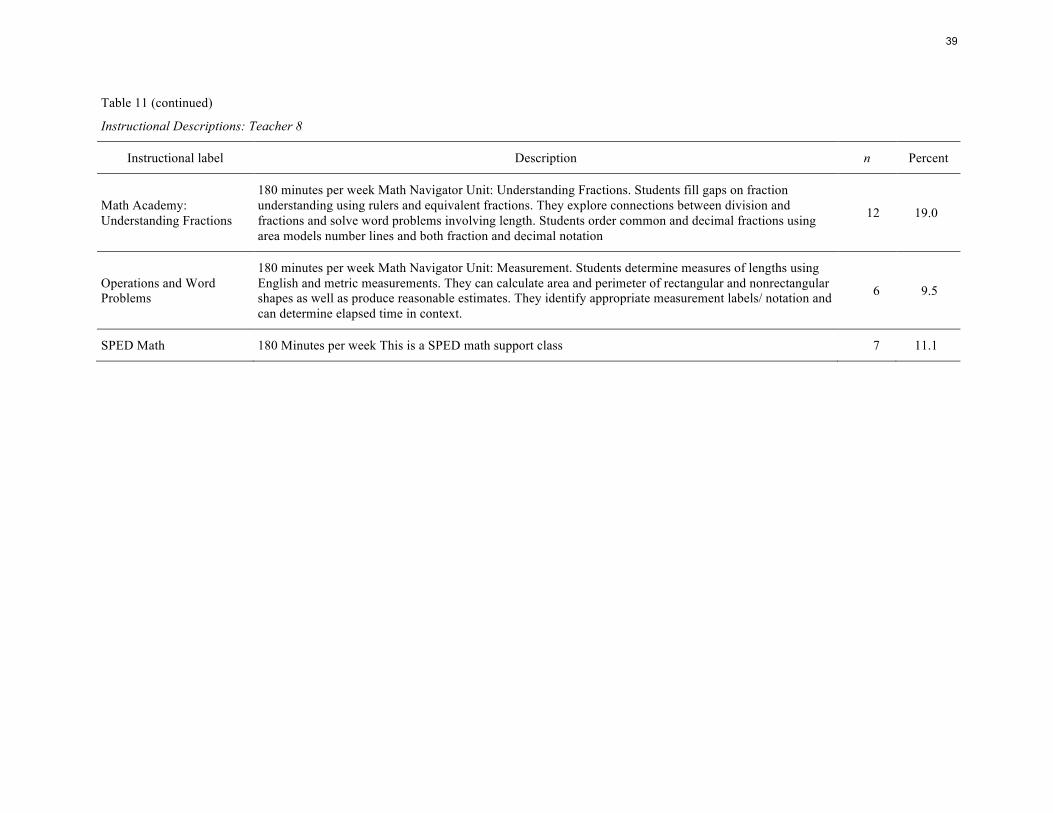
Table 11 (continued)
Instructional Descriptions: Teacher 8
Instructional label Description n Percent
Math Academy: Understanding Fractions
180 minutes per week Math Navigator Unit: Understanding Fractions. Students fill gaps on fraction understanding using rulers and equivalent fractions. They explore connections between division and fractions and solve word problems involving length. Students order common and decimal fractions using area models number lines and both fraction and decimal notation
12 19.0
Operations and Word Problems
180 minutes per week Math Navigator Unit: Measurement. Students determine measures of lengths using English and metric measurements. They can calculate area and perimeter of rectangular and nonrectangular shapes as well as produce reasonable estimates. They identify appropriate measurement labels/ notation and can determine elapsed time in context.
6 9.5
SPED Math 180 Minutes per week This is a SPED math support class 7 11.1
39
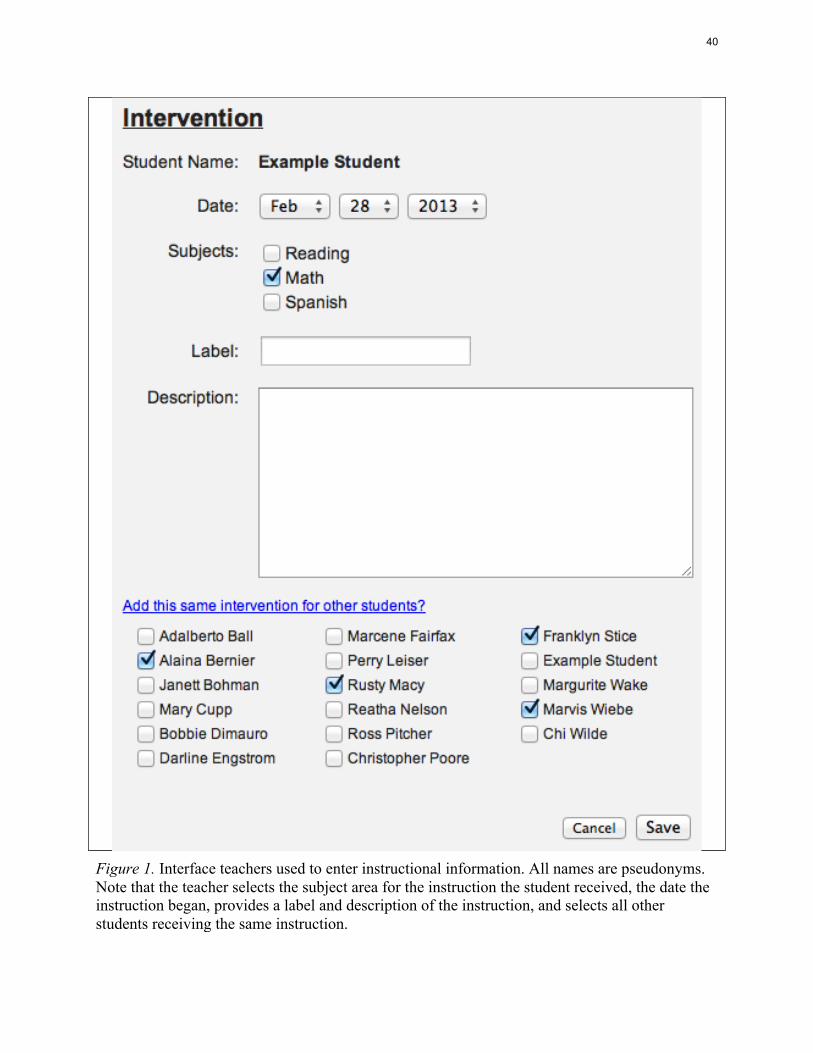
Figure 1. Interface teachers used to enter instructional information. All names are pseudonyms. Note that the teacher selects the subject area for the instruction the student received, the date the instruction began, provides a label and description of the instruction, and selects all other students receiving the same instruction.
40
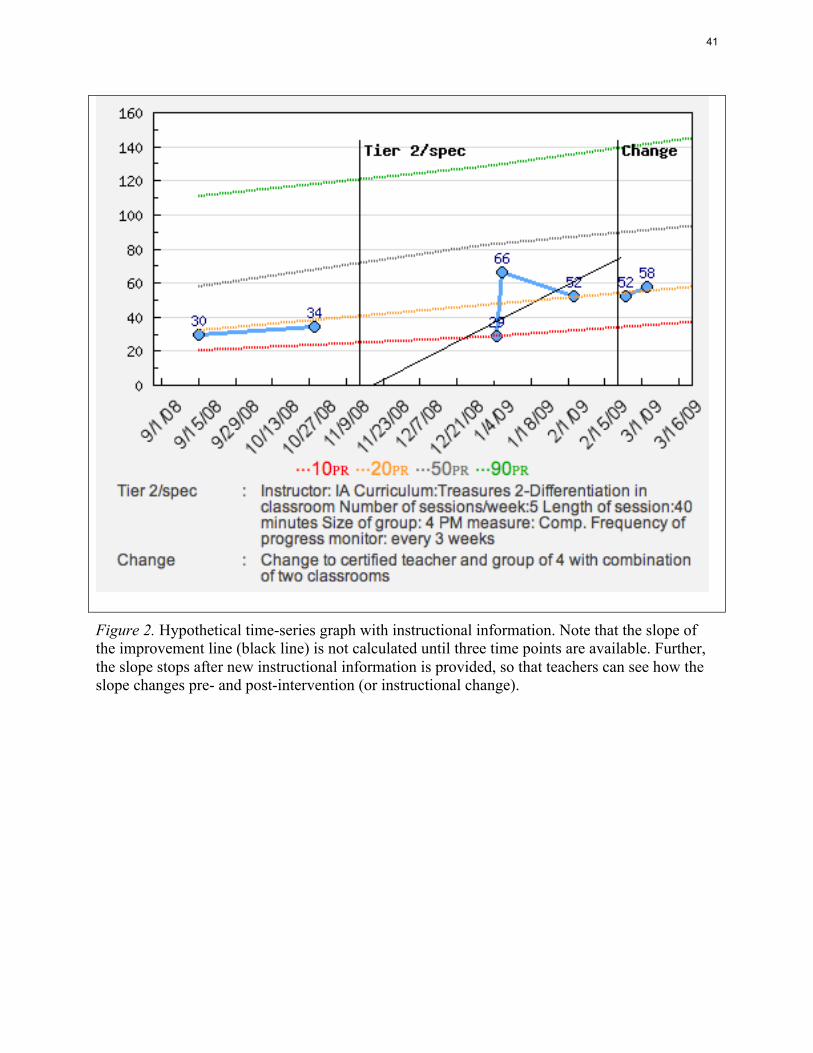
Figure 2. Hypothetical time-series graph with instructional information. Note that the slope of the improvement line (black line) is not calculated until three time points are available. Further, the slope stops after new instructional information is provided, so that teachers can see how the slope changes pre- and post-intervention (or instructional change).
41

Figure 3. Means by Grade. The plot for each grade shows a quadratic, curvilinear fit to the data (red line) and a linear fit to the data (blue line).
Grade 6 Grade 7
12
14
16
0 2 4 6 8 0 2 4 6 8month
Score
42
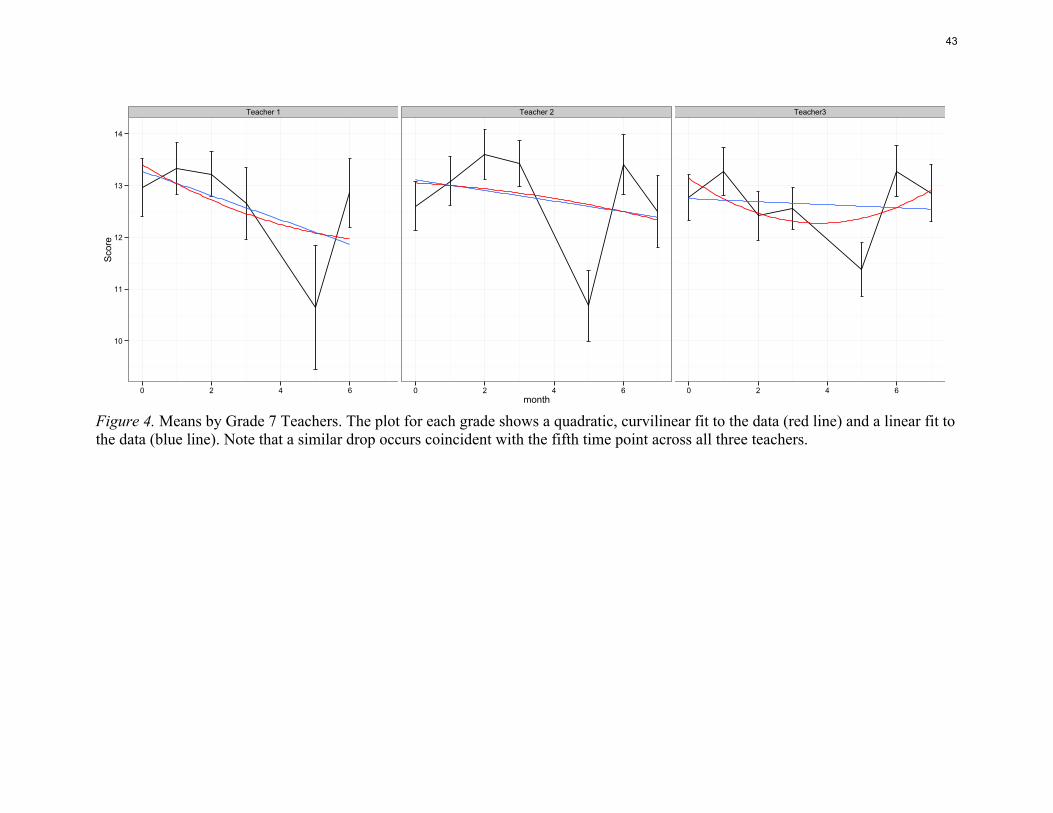
Figure 4. Means by Grade 7 Teachers. The plot for each grade shows a quadratic, curvilinear fit to the data (red line) and a linear fit to the data (blue line). Note that a similar drop occurs coincident with the fifth time point across all three teachers.
Teacher 1 Teacher 2 Teacher3
10
11
12
13
14
0 2 4 6 0 2 4 6 0 2 4 6month
Score
43

Figure 5. Grade 6 fixed effects coefficients. Note that the intercept is not represented, but was estimated with a value of 12.14. Values are representative of the linear model, so fixed effect linear growth estimates for teachers are relative to the overall linear growth (displayed at the bottom of the figure).
Overall Linear Growth
Overall Curvilinear Growth
Intercept: Teacher 1
Intercept: Teacher 2
Intercept: Teacher 3
Intercept: Teacher 4
Intercept: Teacher 5
Linear Growth: Teacher 1
Linear Growth: Teacher 2
Linear Growth: Teacher 3
Linear Growth: Teacher 4
Linear Growth: Teacher 5
-4 -2 0 2 4Estimate
44