management report 31 12 08 · production of refined oil, tons 37 774 36 069 production of bottled...
TRANSCRIPT

K E R N E L H O L D I N G S . A . A N D S U B S I D I A R I E S
- 1 -
OVERVIEW
Andrey Verevskiy, Chairman of Kernel Holding S.A., stated:
The second quarter of our financial year 2009 was characterized by a deepening of the world financial and economic crisis. This crisis has engulfed Ukraine and has led to an abrupt decline in export volumes and prices of some of the main exports from Ukraine. In soft commodities, we have also experienced a further significant decline in prices. In volume terms, however, soft commodity exports from Ukraine continue unabated. Our oil production plants work at close to full capacity and grain export volumes have increased over the previous quarter of the current financial year. Furthermore, and maybe more importantly, volumes transacted have not been achieved at the expense of margins.
The economic downturn has led to a 50% devaluation of the Hrivnia, the Ukrainian currency, versus the US Dollar. If the foreign exchange losses resulting from US dollar-denominated financing have been to some extent offset by the positive impact of valuation of goods to be included in calculation of gross profit, the devaluation has negatively impacted on the valuations of company property, plant and equipment, and has led to a substantial decrease in equity.
In terms of strategic developments, the present challenging economic conditions will also, we believe, offer us growth opportunities. The phasing out of weaker competitors will accelerate as they find access to financing increasingly difficult. The present circumstances will also provide opportunities to acquire assets fitting our business model. As of today, management is looking at several such opportunities for development, both in Ukraine and outside Ukraine.
Looking ahead, the current financial year is unfolding largely according to our planning. While we see reasons for concern regarding the next coming harvest in most countries, present demand for soft commodities remains strong. As for Ukraine, and even though the farming sector is facing difficult times, we shall wait until spring to assess the capacity of farmers to produce for the new harvest.
Financial and production highlights
Revenues increased 86% compared to second quarter of the previous financial year;
Operating profit increased 125% compared to second quarter of the previous financial year;
Net income increased 64% compared to second quarter of the previous financial year;
EBITDA increased 133% compared to second quarter of the previous financial year.
3-month period ended 31 December 2008
3-month period ended 31 December 2007
Grain sales, tons 601 553 53 543 Crushing of sunflower seeds, tons 199 649 172 453 Production of refined oil, tons 37 774 36 069 Production of bottled oil, tons 29 896 30 045
Results for 2nd Quarter FY2009
Our revenues for the 3-month period ended 31 December 2008 have increased year-on-year from USD 156 Mio to USD 291 Mio, a 86% increase over the second quarter of our previous financial year. Our operating profit for the quarter increased year-on-year 125% from USD 23.9 Mio to 53.7 Mio and pre-tax profit increased 48% to USD 20.4 million (USD 13.8 million for the same period last year).
Gross margin for the Group increased from 23% to 31% and operating margin increased year-on-year from 15.3% to 18.4% thanks partially to devaluation of the Hrivnia and its effect on cost of goods for the quarter.
Largely as a consequence of the significant decrease in soft commodity prices, our Net debt position decreased from USD 267 million as of 31 December 2007 to USD 183 million as of 31 December 2008.
The significant devaluation of the Hrivnia versus the US Dollar in the period from October to December 2008 led to USD 13.6 million in foreign exchange losses, arising from revaluation of the loan portfolio denominated in US dollars. These foreign exchange losses were however partially offset, and should continue to be offset in the next coming quarters, by the positive impact of the Hrivnia devaluation on the gross margin of the company and also on Hrivnia denominated administrative and distribution costs.

K E R N E L H O L D I N G S . A . A N D S U B S I D I A R I E S
- 2 -
Our G&A expenses are steadily decreasing relative to our turnover, from 2.5% in the second quarter of the previous financial year to 1.6% for the present reporting period.
Our financial expenses relative to turnover have also decreased year-on-year from 6% in the second quarter of the previous financial year to 3.9% in the second quarter of the current financial year, the decrease being a direct consequence of the increase in revenue and a lower debt level.
Strict management and control of accounts receivables and inventory level, together with falling commodity prices and the devaluation of the Ukrainian currency, have led to improved performance ratios over the last two quarters and, unusual for this period of high inventories, a positive cash flow from operating activity in the second quarter.
Segmental review
Sunflower oil in bulk
The down trend we witnessed in the oil price in the 1st quarter of our financial year 2009 continued through the 2nd quarter. Over the three-month period to December 2008, the international bulk oil price dropped another 25%. The company however maintained a healthy crush margin as we managed to pass on to the farmer the fall in the oil price. Volume wise, the fall in prices has not affected capacity utilization at our three plants, where we have been operating at close to full capacity since the beginning of the financial year.
Bottled sunflower oil
In the wake of the fall in international vegetable oil prices, we decreased prices for bottled oil on our domestic market by 14% on average. Due however to the devaluation of the Hrivnia, bottled oil prices of our competitors were at one point lower than international prices for bulk oil. We consequently chose to export the oil to maintain margins and decrease our bottled oil sales volumes. As the supply of cheap oil dries up on the domestic market, we believe our sales volumes of bottled oil will recover in a relatively short period of time.
Grain
The grain origination and marketing segment showed continued strong performance in the 2nd quarter. By 31 December 2008, the company had originated and sold a total of 1.5 million tons of grain, of which 1.16 million tons had been delivered and exported. As volumes targeted for the financial year have already been largely achieved, it is likely that company management will again review upwards its plan for the year. Margins remain quite healthy, in the range of 11 to 12%.
Farming
Having harvested 265 thousand tons of grain and oil bearing crops in 2008, our farming division is now looking towards the 2009 crop and harvest. Notwithstanding the significant decrease in soft commodity prices, the division has fully carried out plantings for winter crops, and will plant all remaining acreage in the spring. All 85,000 ha of farm land presently managed by the company will therefore bear crops in 2009. Furthermore, as the company continues to seek opportunities to expand its farming activity, we are reviewing a number of possible investments in distressed assets to grow our farm land.
Grain handling and transshipment services in Illichevsk port
Volumes of grain handled through our port terminal in Illichevsk have increased by 9% over the 1st quarter of the current financial year, reaching a total of 856,832 tons of grain throughput for the quarter, and a total of 1.68 million tons for the first six months of the current financial year . We are confident that, with another 5 to 10 million tons of grain expected to be exported from Ukraine until the new harvest, the terminal will deliver on initial expectations and even exceed throughput of 3 million tons.
Silo services
The silo services division continues to exceed initial expectations. An additional 700,000 tons of grain and oil bearing crops have been added to the 1 million tons in storage at the end of the 1st quarter of the current financial year. With the 2008 crop now mostly in store, we would expect this total figure of 1.7 million to decrease throughout the remainder of the current financial year, as the grain is being shipped for export and to the local market for domestic consumption.

K E R N E L H O L D I N G S . A . A N D S U B S I D I A R I E S
- 3 -
OUTLOOK
To date, all business segments of the company apart from farming have been performing according to expectations.
As to the liquidity position of the company, we will continue to have a cautious approach and keep a high level of liquidity. On this basis, we believe the company has quite adequate financial means to operate and execute the plans devised for each business segment.
In consideration of this outlook, our full-year 2009 guidance remains unchanged with revenue forecasted at USD 1,100 million, EBITDA at USD 185 million and Net income at USD 115 million.

Kernel Holding S.A. and
Subsidiaries
Condensed Consolidated Financial Statements
For the 3 months ended 31 December 2008

K E R N E L H O L D I N G S . A . A N D S U B S I D I A R I E S
- 1 -
TABLE OF CONTENTS CONDENSED CONSOLIDATED FINANCIAL STATEMENTS FOR THE 3 MONTHS ENDED 31 DECEMBER 2008
SELECTED FINANCIAL DATA--------------------------------------------------------------------------------------------------------------- 2
CONSOLIDATED BALANCE SHEET -----------------------------------------------------------------------------------------------3
CONSOLIDATED INCOME STATEMENT -----------------------------------------------------------------------------------------4
CONSOLIDATED STATEMENT OF CHANGES IN SHAREHOLDERS’ EQUITY-------------------------------------------5
CONSOLIDATED STATEMENT OF CASH FLOWS ------------------------------------------------------------------------------7
NOTES TO THE CONDENSED CONSOLIDATED FINANCIAL STATEMENTS ----------------------------------------8-30

KERNEL HOLDING S.A. AND SUB SIDIARIES
The notes on pages 8 to 30 form an integral part of these consolidated financial statements
- 2 -
SELECTED FINANCIAL DATA AS OF 31 DECEMBER 2008 (unaudited) (in thousands unless otherwise stated) thousand USD thousand zloty thousand EUR
SELECTED FINANCIAL DATA for the 3 months ended 31 December 2008 2007 2008 2007 2008 2007
I. Revenue 291 404 156 406 834 231 394 769 220 972 108 014 II. Operating profit/(loss) 53 746 23 857 153 864 60 215 40 756 16 476 III. Profit/(loss) before income tax 20 423 13 841 58 467 34 935 15 487 9 559 IV. Net profit/(loss) 20 045 12 229 57 385 30 866 15 200 8 445 V. Net cash flow from operating activity 100 298 (176 324) 287 133 (445 042) 76 056 (121 769) VI. Net cash flow from investment activity (8 951) (9 988) (25 625) (25 210) (6 788) (6 898) VII. Net cash flow from financial activity (182 118) 187 765 (521 367) 473 919 (138 100) 129 671 VIII. Total net cash flow (90 771) 1 453 (259 859) 3 667 (68 832) 1 004 IX. Total assets 603 924 562 632 1 788 702 1 370 009 428 726 382 477 X. Current liabilities 199 229 172 787 590 076 420 737 141 433 117 460 XI. Non-current liabilities 124 016 146 886 367 311 357 667 88 039 99 853 XII. Share capital 1 815 1 673 5 376 4 074 1 288 1 137 XIII. Total equity 280 679 242 959 831 315 591 605 199 254 165 164 XIV. Number of shares 68 741 000 68 741 000 68 741 000 68 741 000 68 741 000 68 741 000 XV. Profit/(loss) per ordinary share (in USD/zloty/EUR) 0,33 0,18 0,95 0,45 0,25 0,12 XVI. Diluted number of shares 68 741 000 68 741 000 68 741 000 68 741 000 68 741 000 68 741 000 XVII. Diluted profit/(loss) per ordinary share (in USD/zloty/EUR) 0,33 0,18 0,95 0,45 0,25 0,12 XVIII. Book value per share (in USD/zloty/EUR) 4,01 3,46 11,88 8,43 2,85 5,09 XIX. Diluted book value per share (in USD/zloty/EUR) 4,01 3,46 11,88 8,43 2,85 5,09
On behalf of the Board ___________________________________ ______________________________ Andrey Verevskiy Anastasia Usachova Chairman of the Board CFO

K E R N E L H O L D I N G S . A . A N D S U B S I D I A R I E S
The notes on pages 8 to 30 form an integral part of these consolidated financial statements - 3 -
CONSOLIDATED BALANCE SHEET AS OF 31 DECEMBER 2008 (in US dollars and in thousands unless otherwise stated)
Notes 31 December
2008
30 September
2008
30 June 2008
31 December
2007 (unaudited) (unaudited) (audited) (reviewed)
ASSETS CURRENT ASSETS: Cash 97 239 234 307 88 530 16 391 Trade accounts receivable, net 43 448 50 292 48 720 36 050 Prepayments to suppliers and other current assets, net 40 725 54 791 29 736 16 310 Taxes recoverable and prepaid, net 56 654 65 130 23 219 67 223 Inventory 100 484 181 384 144 707 256 372 Biological assets 6 461 2 796 42 421 1 919 Total current assets 345 011 588 700 377 333 394 265 NON-CURRENT ASSETS: Property, plant and equipment, net 5 187 695 236 175 231 624 126 431 Intangible assets, net 6 36 907 59 284 58 081 30 523 Goodwill 30 057 47 730 45 319 6 410 Other non-current assets 4 254 17 510 43 251 5 003 Total non-current assets 258 913 360 699 378 275 168 367 TOTAL ASSETS 603 924 949 399 755 608 562 632 LIABILITIES AND EQUITY CURRENT LIABILITIES: Trade accounts payable 9 006 11 115 5 545 7 213 Advances from customers and other current liabilities 20 491 40 020 21 879 7 951 Short-term borrowings 7 160 093 288 235 120 087 135 151 Short-term corporate bonds 1 957 25 730 30 984 9 900 Current portion of long-term borrowings 7 682 6 892 6 626 12 572 Total current liabilities 199 229 371 992 185 121 172 787 NON-CURRENT LIABILITIES: Long-term borrowings 8 102 879 87 992 91 148 103 577 Obligations under finance lease 7 781 15 307 6 907 2 362 Long-term corporate bonds - - - 19 868 Deferred tax liabilities 9 13 227 25 897 31 786 21 079 Other non-current liabilities 129 208 229 - Total non-current liabilities 124 016 129 404 130 070 146 886 COMMITMENTS AND CONTINGENCIES Equity attributable to Kernel Holding S.A. shareholders Share capital 1 815 1 815 1 815 1 673 Share premium reserve 236 637 236 637 236 637 154 975 Additional paid-in capital 39 944 39 944 39 944 39 944 Translation reserve (151 389) 1 768 14 358 - Retained earnings 148 759 126 056 104 053 41 463 Total equity attributable to Kernel Holding S.A. 275 766 406 220 396 807 238 055 shareholders Minority Interest 4 913 41 783 43 610 4 904 Total equity 280 679 448 003 440 417 242 959 TOTAL LIABILITIES AND EQUITY 603 924 949 399 755 608 562 632 Book value 275 766 406 220 396 807 238 055 Number of shares 68 741 000 68 741 000 68 741 000 68 741 000 Book value per one share (in USD) 4,01 5,91 5,77 3,46 Diluted number of shares 68 741 000 68 741 000 68 741 000 68 741 000 Diluted book value per share (in USD) 4,01 5,91 5,77 3,46
On behalf of the Board Andrey Verevskiy ________________________ Anastasia Usachova______________________ Chairman of the Board CFO

K E R N E L H O L D I N G S . A . A N D S U B S I D I A R I E S
The notes on pages 8 to 30 form an integral part of these consolidated financial statements - 4 -
CONSOLIDATED INCOME STATEMENT FOR THE 3 MONTHS ENDED 31 DECEMBER 2008 (in US dollars and in thousands unless otherwise stated)
3 months 6 months 3 months 6 months ended 31 December 2008 ended 31 December 2007
(unaudited) (unaudited) (unaudited) (reviewed) REVENUE 291 404 662 707 156 406 250 420 COST OF SALES (200 769) (479 083) (120 137) (189 793) GROSS PROFIT 90 635 183 624 36 269 60 627 OTHER OPERATIONAL INCOME 7 583 11 233 2 654 4 246 OPERATING EXPENSES: Distribution costs (39 902) (84 010) (11 190) (17 235) General and administrative expenses (4 570) (11 788) (3 876) (8 077) TOTAL OPERATING EXPENSES (44 472) (95 798) (15 066) (25 312) OPERATING PROFIT 53 746 99 059 23 857 39 561 Finance costs, net (11 457) (19 199) (9 388) (14 268) Foreign exchange (loss)/gain, net (13 570) (30 258) (989) (1 757) Other (expenses)/income, net (8 296) (6 776) 361 412 PROFIT BEFORE INCOME TAX 20 423 42 826 13 841 23 948 INCOME TAX (378) 444 (1 612) (3 281) NET PROFIT 20 045 43 270 12 229 20 667 NET PROFIT /attributable to:
Shareholders of Kernel Holding S.A. 22 703 44 705 12 215 20 637
Minority interest (2 658) (1 435) 14 30
Number of shares 68 741 000 68 741 000 68 741 000 68 741 000
Profit per ordinary share (in USD) 0,33 0,65 0.18 0,30
Diluted number of shares 68 741 000 68 741 000 68 741 000 68 741 000
Diluted per ordinary share (in USD) 0,33 0,65 0.18 0,30
On behalf of the Board
Andrey Verevskiy ________________________ Anastasia Usachova______________________ Chairman of the Board CFO

KERNEL HOLDING S.A. AND SUB SIDIARIES
The notes on pages 8 to 30 form an integral part of these consolidated financial statements
- 5 -
CONSOLIDATED STATEMENT OF CHANGES IN SHAREHOLDERS' EQUITY FOR THE 3 MONTHS ENDED 31 DECEMBER 2008 (in US dollars and in thousands unless otherwise stated)
Share capital
Share premium reserve
Additional paid-in capital
Translation reserve Retained
earnings
Total equity attributable to
Kernel Holding S.A. shareholders
Minority interest
Total equity
Balance at 30 September 2007 1 232 2 608 39 944 - 29 248 73 032 11 704 84 736 Effect of changes on minority interest - - - - - - (6 814) (6 814) Increase of share capital 441 160 997 - - - 161 438 - 161 438 Issued capital and IPO expenses - (8 630) - - - (8 630) - (8 630) Net profit - - - - 12 215 12 215 14 12 229 Balance at 31 December 2007 1 673 154 975 39 944 - 41 463 238 055 4 904 242 959
Effect of changes on minority interest - - - - - - 5 027 5 027 Acquisition of Subsidiaries - - - - - - 6 563 6 563 Repurchase of minority share - - - - - - (7 600) (7 600) Issued capital and IPO expenses - (63) - - - (63) - (63) Net profit - - - - 19 529 19 529 76 19 605 Balance at 31 March 2008 1 673 154 912 39 944 - 60 992 257 521 8 970 266 491 Effect of changes on minority interest - - - - - - (3 070) (3 070) Disposal of Subsidiaries - - - - - - (32) (32) Acquisition of Subsidiaries - - - - - - 38 872 38 872 Increase of share capital 142 83 712 - - - 83 854 - 83 854 Issued capital and IPO expenses - (1 987) - - - (1 987) - (1 987) Effect of foreign exchange differences - - - 14 358 - 14 358 - 14 358 Net profit - - - - 43 061 43 061 (1 130) 41 931 Balance at 30 June 2008 1 815 236 637 39 944 14 358 104 053 396 807 43 610 440 417
KERNEL HOLDING S.A. AND SUB SIDIARIES
The notes on pages 8 to 30 form an integral part of these consolidated financial statements
- 6 -
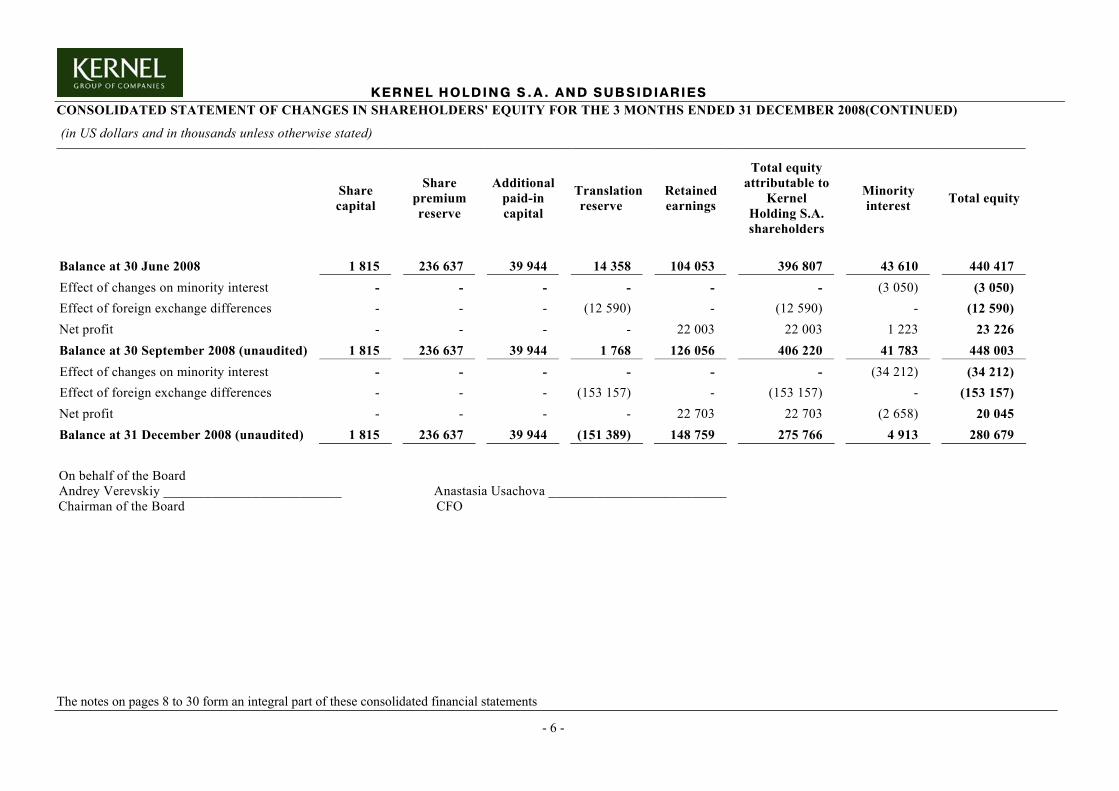
CONSOLIDATED STATEMENT OF CHANGES IN SHAREHOLDERS' EQUITY FOR THE 3 MONTHS ENDED 31 DECEMBER 2008(CONTINUED)
(in US dollars and in thousands unless otherwise stated)
Share capital
Share premium reserve
Additional paid-in capital
Translation reserve Retained
earnings
Total equity attributable to
Kernel Holding S.A. shareholders
Minority interest Total equity
Balance at 30 June 2008 1 815 236 637 39 944 14 358 104 053 396 807 43 610 440 417 Effect of changes on minority interest - - - - - - (3 050) (3 050) Effect of foreign exchange differences - - - (12 590) - (12 590) - (12 590) Net profit - - - - 22 003 22 003 1 223 23 226 Balance at 30 September 2008 (unaudited) 1 815 236 637 39 944 1 768 126 056 406 220 41 783 448 003 Effect of changes on minority interest - - - - - - (34 212) (34 212) Effect of foreign exchange differences - - - (153 157) - (153 157) - (153 157) Net profit - - - - 22 703 22 703 (2 658) 20 045 Balance at 31 December 2008 (unaudited) 1 815 236 637 39 944 (151 389) 148 759 275 766 4 913 280 679
On behalf of the Board Andrey Verevskiy __________________________ Anastasia Usachova __________________________ Chairman of the Board CFO

KERNEL HOLDING S.A. AND SUB SIDIARIES
The notes on pages 8 to 30 form an integral part of these consolidated financial statements - 7 -
CONSOLIDATED STATEMENT OF CASH FLOWS FOR THE 3 MONTHS ENDED 31 DECEMBER 2008
(in US dollars and in thousands unless otherwise stated) 3 months 6 months 3 months 6 months ended 31 December 2008 ended 31 December 2007 (unaudited) (unaudited) (unaudited) (reviewed)OPERATING ACTIVITIES: Profit/(loss) before income tax 20 423 42 826 13 841 23 948
Adjustments to reconcile profit before income tax to net cash used
Amortization and depreciation 7 386 14 241 2 362 4 786 Finance costs 11 457 19 199 9 388 14 268 Bad debt expenses and other accruals (710) (1 194) (642) (344) Loss/(gain) on disposal of property, plant and equipment (101) (378) 174 153 Foreign exchange losses/(gain), net 13 570 30 258 989 1 757 Income from “DAK asset” (204) (204) 32 32 Gain on sales of equity investments - - - (2 034)Operating profit before working capital changes 51 821 104 748 26 144 42 566Changes in working capital: Decrease/(increase) in trade accounts receivable 8 447 6 986 (18 225) (25 472) Decrease/(increase) in prepayments and other current assets 3 446 (25 523) (1 767) (7 970) Decrease/(increase) in restricted cash balance 46 297 (13 986) (926) (7 342) Decrease/(increase) in taxes recoverable and prepaid 8 476 (33 514) (27 876) (45 320) Decrease/(increase) in biological assets (3 665) 35 984 1 717 7 753 Decrease/(increase) in inventories 17 938 (17 844) (133 663) (216 473) Increase/(decrease) in trade accounts payable (2 109) 3 408 (10 999) 1 781
Increase/(decrease) in advances from customers and other current liabilities (18 076) (853) (1 181) (246)
Cash obtained from/(used in) operations 112 575 59 406 (166 776) (250 723) Finance costs paid (11 457) (19 199) (9 388) (14 268) Income tax paid (820) (1 168) (160) (259) Net cash provided by/(used in)operating activities 100 298 39 039 (176 324) (265 250)INVESTING ACTIVITIES: Purchase of property, plant and equipment (7 675) (11 113) (7 061) (10 114) Proceeds from disposal of property, plant and equipment 161 2 855 424 932 Sales/(Purchase) of intangible and other non-current assets (1 437) (1 030) (271) (13 854) Acquisition of Subsidiaries - (5 824) (3 080) (3 080) Disposal of Subsidiaries - - - 3 549 Net cash used in investing activities (8 951) (15 112) (9 988) (22 567)FINANCING ACTIVITIES: Proceeds from short-term and long-term borrowings 138 457 423 990 51 528 140 559 Repayment of short-term and long-term borrowings (291 406) (420 539) (10 497) (35 511) Corporate bonds issued/(repaid) (23 773) (29 027) - 19 831 Repayment of subordinated loan - - (7 532) (7 532) Proceeds from share capital increase - - 441 441 Proceeds from share premium reserve increase - - 160 997 160 997 Issued capital and IPO expenses paid - - (7 172) (7 172) Net cash provided by financing activities (176 722) (25 576) 187 765 271 613TRANSLATION ADJUSTMENT (5 396) (3 628) - -NET INCREASE/(DECREASE) IN CASH AND CASH (90 771) (5 277) 1 453 (16 204)CASH AND CASH EQUIVALENTS, at the beginning of the 144 307 58 813 7 095 24 752CASH AND CASH EQUIVALENTS, at the end of the period 53 536 53 536 8 548 8 548
On behalf of the Board Andrey Verevskiy ________________________ Anastasia Usachova______________________ Chairman of the Board CFO
KERNEL HOLDING S.A. AND SUB SIDIARIES
- 8 -
NOTES TO THE CONDENSED CONSOLIDATED FINANCIAL STATEMENTS FOR THE 3 MONTHS ENDED 31 DECEMBER 2008 (in US dollars and in thousands unless otherwise stated)
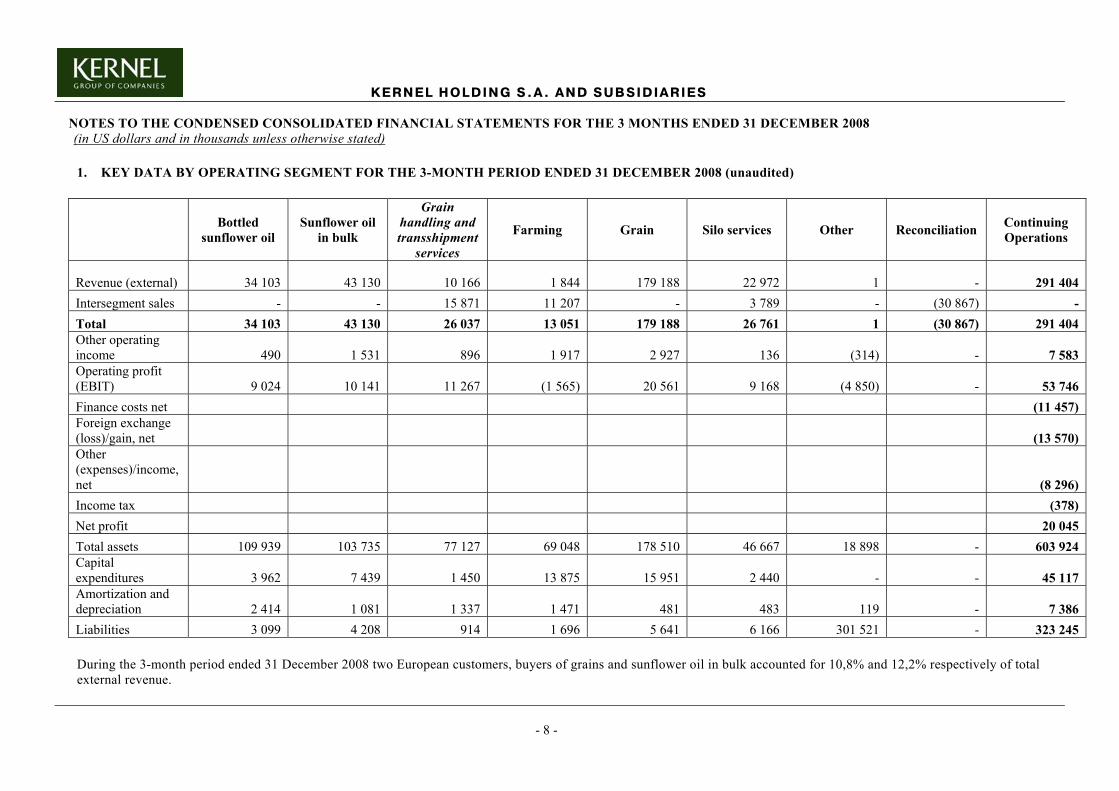
1. KEY DATA BY OPERATING SEGMENT FOR THE 3-MONTH PERIOD ENDED 31 DECEMBER 2008 (unaudited)
Bottled sunflower oil
Sunflower oil in bulk
Grain handling and transshipment
services
Farming Grain Silo services Other Reconciliation Continuing Operations
Revenue (external) 34 103 43 130 10 166 1 844 179 188 22 972 1 - 291 404 Intersegment sales - - 15 871 11 207 - 3 789 - (30 867) - Total 34 103 43 130 26 037 13 051 179 188 26 761 1 (30 867) 291 404 Other operating income 490 1 531 896 1 917 2 927 136 (314) - 7 583 Operating profit (EBIT) 9 024 10 141 11 267 (1 565) 20 561 9 168 (4 850) - 53 746 Finance costs net (11 457) Foreign exchange (loss)/gain, net (13 570) Other (expenses)/income, net (8 296) Income tax (378) Net profit 20 045 Total assets 109 939 103 735 77 127 69 048 178 510 46 667 18 898 - 603 924 Capital expenditures 3 962 7 439 1 450 13 875 15 951 2 440 - - 45 117 Amortization and depreciation 2 414 1 081 1 337 1 471 481 483 119 - 7 386 Liabilities 3 099 4 208 914 1 696 5 641 6 166 301 521 - 323 245
During the 3-month period ended 31 December 2008 two European customers, buyers of grains and sunflower oil in bulk accounted for 10,8% and 12,2% respectively of total external revenue.

KERNEL HOLDING S.A. AND SUB SIDIARIES
- 9 -
1. KEY DATA BY OPERATING SEGMENT (CONTINUED) FOR THE 3-MONTH PERIOD ENDED 31 DECEMBER 2007 (unaudited)
Bottled sunflower oil
Sunflower oil in bulk
Grain handling and transshipment
services
Farming Grain Silo services Other Reconciliation Continuing Operations
Revenue (external) 53 583 54 876 - 1 345 34 049 13 183 (630) - 156 406
Intersegment sales 785 - - 7 634 - 1 253 - (9 672) -
Total 54 368 54 876 - 8 979 34 049 14 436 (630) (9 672) 156 406 Other operating income (86) 5 - 1 289 159 1 215 72 - 2 654
Operating profit (EBIT) 10 305 9 198 - 854 4 870 4 745 (6 115) - 23 857
Finance costs, net (9 388) Foreign exchange (loss)/gain, net (989)
Other (expenses)/income, net
361
Income tax (1 612)
Net profit 12 229
Total assets 158 946 227 185 - 15 926 94 795 46 638 19 142 - 562 632 Capital expenditures 2 700 4 464 - 5 946 296 16 434 - 13 856
Amortization and depreciation 321 495 - 955 - 313 278 - 2 362
Liabilities 6 745 12 194 - 994 6 719 3 897 289 124 - 319 673
During the 3-month period ended 31 December 2007 none of the Group’s external customers accounted for more than 10% of total external revenue.

K E R N E L H O L D I N G S . A . A N D S U B S I D I A R I E S
- 10 -
2. NATURE OF THE BUSINESS
Kernel Holding S.A. (hereinafter referred to as the "Holding") incorporated under the legislation of Luxembourg on 15 June 2005 (Number B-109 173 at the Luxembourg Register of Companies) is the holding company for a group of entities (hereinafter referred to as the "Subsidiaries" ), which together form the Kernel Group (hereinafter referred to as the "Group" ).
The primary activity of the Group is related to production of bottled sunflower oil, production and subsequent export of bulk sunflower oil and meal, wholesale trade of grain (mainly wheat, barley and corn), farming and provision of logistics and trans-shipment services.
The majority of the Group operations are located in Ukraine. Financial year of the Group runs from 1st of July to 30th of June.
The principal operating office of the Group is located at the following address: 35 Olesya Gonchara str., 01034 Kyiv, Ukraine.
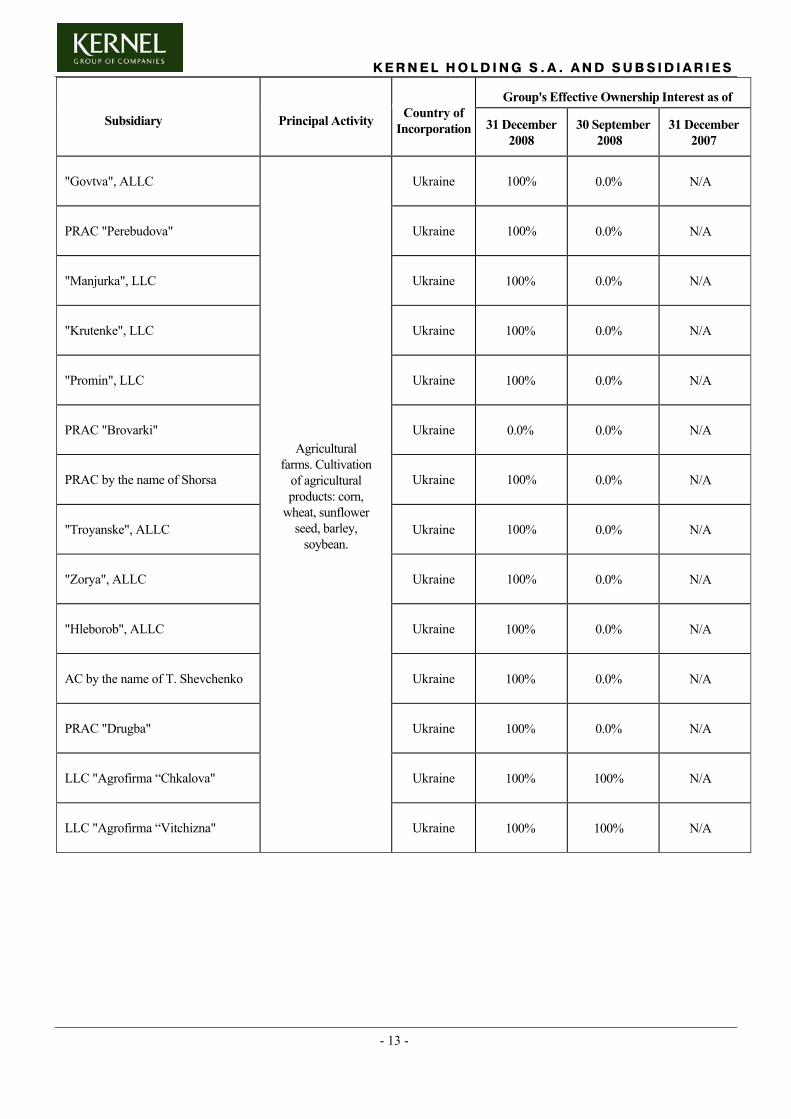
As of 31 December 2008, 30 September 2008 and 31 December 2007 the structure of the Group and principal activities of the Subsidiaries consolidated by the Holding were as follows:
Group's Effective Ownership Interest as of
Subsidiary Principal Activity Country of Incorporation 31 December
2008 30 September
2008 31 December
2007
"Kernel-Capital", LLC
Holding company for grain elevators
and other Subsidiaries in
Ukraine. Performs transactions with
financial instruments.
Ukraine 99.9% 99.9% 99.9%
"Etrecom Investments", LLC Holding company. Cyprus 100% 100% 100%
"Yuzhtrans-Terminal", LLC Dormant company. Ukraine 99.9% 99.9% 99.9%
Inerco Trade S.A. Switzerland 99.0% 99.0% 99.0% Lanen S.A. Panama 100% 100% 100% "Kernel-Trade", LLC
Trade of sunflower oil, meal and grain.
Ukraine 100% 100% 100% Jerste BV Holding company Netherlands 100% 100% N/A
CJSC "Poltava oil crushing plant — Kernel Group" Ukraine 95.2% 95.2% 94.9%
JSC "Vovchansk OEP" Ukraine 99.3% 99.3% 99.0% CJSC "Prykolotne OEP" Ukraine 100% 100% 100%
CJSC "Prykolotnyanska oliya"
Production plants. Production of
sunflower oil and meal.
Ukraine 0.0% 46.4% 0.0%
LLC JE "Inerco-Ukraine" Holding company. No
significant activity since the date of foundation.
Ukraine 100% 100% 100%
“Transagroinvest” LLC No significant
activity since the date of foundation.
Ukraine 100% 100% N/A
CJSC "Poltavaavtotransservis" Trucking company. Ukraine 99.9% 99.9% 99.9%

K E R N E L H O L D I N G S . A . A N D S U B S I D I A R I E S
- 11 -
Group's Effective Ownership Interest as of
Subsidiary Principal Activity Country of Incorporation 31 December
2008 30 September
2008 31 December
2007
CJSC "Reshetylivka Hliboproduct" Ukraine 100% 99.9% 100%
JSC "Reshetilovski elevator" Ukraine 0.0% 0.0% 0.0%
CJSC "Horol-Elevator" Ukraine 100% 100% 100%
JSC "Khorolskiy elevator" Ukraine 0.0% 0.0% 0.0%
CJSC "Mirgorodsky elevator" Ukraine 100% 99.9% 100%
CJSC "Globynsky elevator HP" Ukraine 100% 100% 100%
JSC "Globinsky elevator kliboproduktiv" Ukraine 0.0% 0.0% 0.0%
JSC "Poltavske khlibopriemalne pidpriemstvo" Ukraine 88.2% 88.2% 88.2%
JSC "Golovanivske khlibopriemalne pidpriemstvo" Ukraine Disposed of on
01 April 2008 Disposed of on 01 April 2008 99.2%
CJSC "Galeschina-Agro" Ukraine 99.9% 99.9% 99.9%
CJSC "Gogoleve-Agro" Ukraine 99.9% 99.9% 99.9%
CJSC "Sagaydak-Agro" Ukraine 100% 100% 100%
CJSC "Karlivka-Agro" Ukraine 99.9% 99.9% 99.9%
CJSC "Lazorkovski Elevator" Ukraine 99.9% 99.9% 99.9%
"Zherebkivsky elevator LTD" Ukraine 99.9% 99.9% 99.9%
"Kononivsky elevator LTD" Ukraine 99.9% 99.9% 99.9%
"Bandurskiy elevator", LLC Ukraine 100% 100% 100%
CJSC "Semenivski elevator" Ukraine 99.9% 99.9% 99.9%
"Kobelyaki hleboproduct", LLC Ukraine 100% 0.1% 0.1%
CJSC "Vlasivskiy KHP" Ukraine In process of liquidation
In process of liquidation
In process of liquidation
"Sahnovshina hleboproduct", LLC Ukraine 100% 100% 100%
CJSC "Velykoburlutske HPP"
Grain elevators. Provision of
cleaning, drying and grain and oilseed storage
services.
Ukraine 100% 100% 100%

K E R N E L H O L D I N G S . A . A N D S U B S I D I A R I E S
- 12 -
Group's Effective Ownership Interest as of
Subsidiary Principal Activity Country of Incorporation 31 December
2008 30 September
2008 31 December
2007
CJSC "Gutnansky elevator" Ukraine 100% 100% 100%
CJSC "Lykhachivsky KHP" Ukraine 100% 100% 100%
CJSC "Shevchenkisky KHP" Ukraine 100% 100% 100%
CJSC "Orilske HPP" Ukraine 100% 100% 100%
CJSC "Kovyagivske KHP"
Grain elevators. Provision of
cleaning, drying and grain and oilseed storage
services.
Ukraine 100% 100% 100%
"Ykragrobiznes", LLC Holding company. Ukraine 100% 100% N/A
"Agroservise", LLC Ukraine 100% 100% 100%
"Zernoservise", LLC Ukraine 100% 100% 100%
"Unigrain-Agro" (Globino), LLC Ukraine 100% 100% 100%
"Unigrain-Agro" (Semenovka), LLC Ukraine 100% 100% 100%
"Mrija-Agro", LLC Ukraine 100% 100% 100%
CJSC "Lozivske HPP" Ukraine 100% 100% 100%
CJSC "Krasnopavlivsky KHP" Ukraine 100% 100% 100%
CJSC "Agrofirma "Krasnopavlivska" Ukraine 0.0% 0.0% 0.0%
"Agrofirma "Arshitsa", LLC Ukraine 100% 100% N/A
"Agrotera-Kolos", LLC Ukraine 100% 0.0% N/A
"Chorna Kamyanka", LLC
Agricultural farms. Cultivation
of agricultural products: corn,
wheat, sunflower seed, barley,
soybean.
Ukraine 100% 100% N/A
K E R N E L H O L D I N G S . A . A N D S U B S I D I A R I E S
- 13 -
Group's Effective Ownership Interest as of
Subsidiary Principal Activity Country of Incorporation 31 December
2008 30 September
2008 31 December
2007
"Govtva", ALLC Ukraine 100% 0.0% N/A
PRAC "Perebudova" Ukraine 100% 0.0% N/A
"Manjurka", LLC Ukraine 100% 0.0% N/A
"Krutenke", LLC Ukraine 100% 0.0% N/A
"Promin", LLC Ukraine 100% 0.0% N/A
PRAC "Brovarki" Ukraine 0.0% 0.0% N/A
PRAC by the name of Shorsa Ukraine 100% 0.0% N/A
"Troyanske", ALLC Ukraine 100% 0.0% N/A
"Zorya", ALLC Ukraine 100% 0.0% N/A
"Hleborob", ALLC Ukraine 100% 0.0% N/A
AC by the name of T. Shevchenko Ukraine 100% 0.0% N/A
PRAC "Drugba" Ukraine 100% 0.0% N/A
LLC "Agrofirma “Chkalova" Ukraine 100% 100% N/A
LLC "Agrofirma “Vitchizna"
Agricultural farms. Cultivation
of agricultural products: corn,
wheat, sunflower seed, barley,
soybean.
Ukraine 100% 100% N/A

K E R N E L H O L D I N G S . A . A N D S U B S I D I A R I E S
- 14 -
Group's Effective Ownership Interest as of
Subsidiary Principal Activity Country of Incorporation 31 December
2008 30 September
2008 31 December
2007
"Transbulk Terminal", LLC Ukraine 100% 100% N/A
C.F.C Ukraine Ltd Ukraine 100% 100% N/A
Estron Corporation Ltd Cyprus 100% 100% N/A
Chorex Developments Limited Cyprus 100% 100% N/A
Hamalex Developments LTD
Provision of grain handling
and transshipment
services, including
services to the Group.
Cyprus 100% 100% N/A
The Group consolidated the financial statements of CJSC "Prykolotnyanska oliya", JSC "Reshetilovski elevator", JSC "Khorolskiy elevator", JSC "Globinsky elevator kliboproduktiv", LLC "Agrofirma "Krasnopavlivska, PRAC "Brovarki", due to the fact that shareholders holding a majority share of the voting rights in these Subsidiaries are related parties of the Group. "Kernel-Capital" LLC received power of attorney from these related parties to act on their behalf in exercising ownership rights related to these shares. The Group's management believes that it has power to govern operating and financial policies of these Subsidiaries.
These consolidated financial statements were authorized for issue by the Board of Directors of Kernel Holding S.A., on 09 February 2009.

K E R N E L H O L D I N G S . A . A N D S U B S I D I A R I E S
- 15 -
3. CHANGE IN SHARE CAPITAL
Since 15 June 2005 the holding company of the Group is Kernel Holding S.A. (Luxembourg) (the "Holding"), whose share capital as of 31 December 2008 consisted of 68,741,000 (sixty eight million seven hundred and forty one thousand) ordinary bearer shares without indication of a nominal value, providing 68,741,000 voting rights (as of 31 December 2007 – 63,341,000 shares).
The shares were distributed as follows:
Shares allotted and fully paid as
of
Share owned as of
Shares allotted and fully paid as
of
Share owned as of SHAREHOLDERS
31 December 2008 31 December 2007
Namsen LTD (limited company registered under the legislation of Cyprus) (hereinafter the "Majority Shareholder") 40 574 250
59.03%
40 574 250
64.05%
Evergreen Financial Limited (a company incorporated and registered in the Territory of the British Virgin Islands) (hereinafter Evergreen Financial Limited) -
-
-
- Free-float 28 166 750 40.97% 22 766 750 35.95% Individual - - - -
Total 68 741 000 100.00% 63 341 000 100.00%
As of 31 December 2008 and 2007 100% of the beneficial interest in the “Majority Shareholder” was held by Verevskiy Andrey Mikhaylovych (hereinafter the “Beneficial Owner”).
On 19 November, 2007 Namsen LTD executed a call-option for 1,334 shares (14.29%), held by Evergreen Financial Limited.
In order to perform an initial public offering of the shares of the Company on the Warsaw Stock Exchange, the general shareholders meeting resolves to split the existing shares of the Company at a split ratio of one to five thousand (1:5,000) and to consequently split the existing nine thousand three hundred thirty-four (9,334) shares of the Company without indication of a nominal value into 46,670,000 (forty-six million six hundred seventy thousand) shares of the Company without indication of a nominal value.
On 23 November, 2007 the Holding was listed on the Warsaw Stock Exchange (WSE). The total size of the Offering was PLN 546 402 000 (comprising 22,766,750 shares, of which 16,671,000 were primary offering (newly issued)).
On 27 June 2008, an additional 5,400,000 ordinary bearer shares of the Company were admitted to trading on the main market of the Warsaw Stock Exchange.
Luxembourg companies are required to allocate to legal reserve a minimum of 5% of the annual net income until this reserve equals up to 10% of subscribed share capital. This reserve of an amount of USD 125 thousand as of 31 December 2008, unchanged from 31 December 2007, may not be distributed as dividends.

K E R N E L H O L D I N G S . A . A N D S U B S I D I A R I E S
- 16 -
4. BASIS OF PRESENTATION OF FINANCIAL STATEMENTS AND SUMMARY OF SIGNIFICANT ACCOUNTING POLICIES
Basis of Presentation and Accounting - The accompanying consolidated financial statements are prepared under the historical cost convention in accordance with International Financial Reporting Standards ("IFRS"), adopted by the International Accounting Standards Board ("IASB"), and interpretations, issued by the International Financial Reporting Interpretations Committee ("IFRIC").
The Group Subsidiaries maintain their accounting records in local currencies in accordance with the accounting and reporting regulations of the countries of incorporation. Local statutory accounting principles and procedures may differ from those generally accepted under IFRS. Accordingly, the consolidated financial statements, which have been prepared from the Group Subsidiaries' local statutory accounting records, reflect adjustments necessary for such financial statements to be presented in accordance with IFRS.
The present financial statements have been prepared in accordance with amendments to IFRS which became effective on 31 December 2008. The Group has adopted IFRS 8 Operating Segments in advance of its effective date, with effect from 1 July 2008.
Accounting Estimates - The application of IFRS requires the use of reasonable assumptions and estimates. These estimates and assumptions affect the reported amounts of assets and liabilities and the disclosure of contingent assets and liabilities at the date of the consolidated financial statements. Actual results could differ from these estimates.
Measurement and Presentation Currency, - The local currency of the Holding was the Euro until 31 December 2006. Starting from 01 January 2007, and in accordance with the resolution of the shareholders dated 31 July 2007, the measurement currency is the United States dollar ("USD"). Management utilizes the USD as the measurement and reporting currency of the accompanying consolidated financial statements of the Holding under International Accounting Standard ("IAS") No. 21 "The Effects of Changes in Foreign Exchange Rates" as its major assets and sources of finance are denominated in USD. The measurement currencies for the Subsidiaries of the Group are mainly local currencies of the countries, where the Group Subsidiaries are incorporated and operate, with the exception of Inerco Trade S.A. (Switzerland), Lanen S.A. (Panama), Estron Corporation Ltd, Chorex Developments Limited, Hamalex Developments LTD. Management has utilized USD as the measurement currency for Inerco Trade SA, Lanen SA, Estron Corporation Ltd, Chorex Developments Limited and Hamalex Developments LTD under IAS No. 21 as their major sources of finance, prices of sales contracts with customers and also prices of significant contracts for purchases of goods and services from suppliers were denominated in USD.
Transactions in currencies other than measurement currencies of the Group companies are treated as transactions in foreign currencies.
Basis of Consolidation - The consolidated financial statements incorporate the consolidated financial statements of the Holding and companies controlled by the Group ("its Subsidiaries") made up as of 31 December 2008. Control is achieved where the parent company has the power to govern the financial and operating policies of an investee enterprise, either directly or indirectly, so as to obtain benefits from its activities.
The purchase method of accounting is used for acquired businesses. The equity attributable to minority owners' interests is shown separately in the consolidated balance sheet. On acquisition, the assets and liabilities of a Subsidiary are measured at their fair values at the date of acquisition. The interest of minority owners is stated at the minority's proportion of the fair values of the assets and liabilities recognized.
Where necessary, adjustments are made to the financial statements of Subsidiaries to bring the accounting policies used into line with those used by other members of the Group.
All significant intercompany transactions and balances between the Group enterprises are eliminated on consolidation. Unrealized gains and losses resulting from intercompany transactions are also eliminated unless for unrealized losses which cannot be recovered.
Minority interest at the balance sheet date represents the minority shareholders' portion of the pre-acquisition fair values of the identifiable assets and liabilities of the Subsidiary at the acquisition date, and the minorities' portion of movements in equity since the date of the acquisition.
Goodwill - Goodwill arising on consolidation represents the excess of the cost of acquisition over the Group's interest in the adjusted net fair value of identifiable assets, liabilities and contingent liabilities of the Subsidiary on the date of acquisition. Goodwill arising from business combinations for which the agreement date is on or after 31 March 2004 is recognized as an asset and carried at cost less any accumulated impairment losses. The goodwill is not amortized and is tested for impairment annually or more frequently if events or changes in circumstances indicate that it might be impaired.

K E R N E L H O L D I N G S . A . A N D S U B S I D I A R I E S
- 17 -
4. BASIS OF PRESENTATION OF FINANCIAL STATEMENTS AND SUMMARY OF SIGNIFICANT ACCOUNTING POLICIES (CONTINUED)
Goodwill arising on the acquisition of a foreign operation and any fair value adjustments to the carrying amounts of assets and liabilities arising on the acquisition of that operation are treated as assets and liabilities of the foreign operation. Therefore, they are expressed in the measurement currency of the foreign operation and are translated at the closing rate.
Excess of Group's interest in the adjusted net fair value of identifiable assets, liabilities and contingent liabilities of the acquired Subsidiaries over cost of acquisition is recognized immediately in the income statement of the period when the acquisition takes place.
Intangible Assets - Intangible assets acquired separately from a business are capitalized at primary cost. Amortization of intangible assets except for the "Schedry Dar", "Stozhar", "Zolota" and "Domashnya" trademarks is calculated on a straight-line basis over 2-10 years, and is included in "General and administrative expenses". The "Schedry Dar", "Stozhar", Zolota" and "Domashnya" trademarks have indefinite useful life and thus are not amortized but tested for impairment by comparing their recoverable amount with their carrying amount annually and whenever there is an indication that the trademarks may be impaired.
Foreign Currencies Translation - Transactions in currencies other than the measurement currencies of the Group companies are initially recorded at the rates of exchange prevailing on the dates of the transactions. Subsequently, monetary assets and liabilities denominated in such currencies are translated at the rates prevailing on the balance sheet date.
On consolidation, the assets and liabilities of the Subsidiaries are translated at exchange rates prevailing on the balance sheet date. Income and expense items are translated at the average exchange rates for the period. Exchange differences arising, if any, are recognized in shareholders' equity and included in "Cumulative translation adjustment".
The exchange rates used in preparation of these financial statements are as follows:
Currency
Closing rate as of
31 December 2008
Average rate for the 3 months
ended 31 December
2008
Average rate for the 6 months
ended 31 December
2008
Closing rate as of
31 December 2007
Average rate for the 3 months
ended 31 December
2007
Average rate for the 6
months ended 31 December
2007 USD/UAH 7.7000 6.2117 5.5293 5.0500 5.0500 5.0500 USD/EUR 0.7099 0.7583 0.7152 0.6798 0.6906 0.7096 USD/PLN 2.9618 2.8628 2.5322 2.4350 2.5240 2.6413
Financial instruments - financial instruments are classified according to the following categories: financial assets or financial liabilities recognized at fair value through profit or loss; held-to-maturity investments; available-for-sale financial assets; and also the Group’s trade receivables, as well as loans receivable.
Financial assets or financial liabilities at fair value through profit or loss – Are financial instruments, acquired, mainly, with the purpose of proceeds from short-term price fluctuations or designated as such upon initial recognition. Financial assets or liabilities are recognized at fair value through profit or loss if the Group manages such investments and makes purchase and sale decisions based on their fair value. Classified by the Group as an instrument at the moment of initial recognition, they are measured at fair value with any resultant gain or loss recognized in profit or loss.
Held-to-maturity investments - This category is for fixed maturity financial assets with fixed or determinable payments that the Group has the positive intention and ability to hold to maturity except for the Group’s trade or loan receivables. Held-to-maturity investments are measured at amortized cost using the effective interest method.
Available-for-sale financial assets - Investments in equity securities and certain debt securities are classified as available-for-sale financial assets. Subsequent to initial recognition, they are measured at fair value and changes therein, other than impairment losses, and foreign exchange gains and losses on available-for-sale monetary items are recognized directly in equity. When such assets are disposed the cumulative gain from assets revaluation are included in a calculation of the financial result on the disposal which is registered in income statement. The cumulative loss in equity is transferred to income statement immediately.

K E R N E L H O L D I N G S . A . A N D S U B S I D I A R I E S
- 18 -
4. BASIS OF PRESENTATION OF FINANCIAL STATEMENTS AND SUMMARY OF SIGNIFICANT ACCOUNTING POLICIES (CONTINUED)
Loans - Lent by the Group, are financial assets, created by means of grant of money directly to a borrower or participating in providing of credit services, except for those assets, which were created with the purpose of immediate sale or sale during a short-term period or classified as investments held for trading. For loans, given on a rate and terms which are different from markets, the difference between the par value of the given out resources and fair value of lending amount is reflected in income statement in the period, when it was lent, as adjustment of sum of primary estimation of the loan. Loans with fixed maturity terms are measured at amortized cost using the effective interest method. Loans without fixed maturity terms are carried at initial cost. The given out loans are reflected in balance sheet less allowance for estimated non-recoverable amounts.
Held-to-maturity investments and the Group’s trade receivables and loans receivable are included in the complement of intangible assets, except of those cases when the term of redemption expires within 12 months from the date of balance. Financial assets which are recognized at fair value through profit or loss is a part of current assets as well as available-for-sale investments if the Group’s management has intent to realize them during 12 months from the date of balance. All acquisitions and sales of investments are registered at the date of calculation. Investments in equity securities where fair value cannot be estimated on a reasonable basis are stated at cost using the effective interest method less impairment losses.
Borrowing costs - Borrowing costs directly attributable to the acquisition, construction or production of qualifying assets, which are assets that necessarily take a substantial period of time to get ready for their intended use or sale, are added to the cost of those assets, until such time as the assets are substantially ready for their intended use or sale.
Investment income earned on the temporary investment of specific borrowings pending their expenditure on qualifying assets is deducted from the borrowing costs eligible for capitalization.
All other borrowing costs are recognized in profit or loss in the period in which they are incurred. The interest expense component of finance lease payments is recognized in the income statement using the effective interest rate method.
Investments in Non-consolidated Subsidiaries and Associates - Investments in corporate shares where the Group owns more than 20% of share capital, but does not have ability or intent to control or exercise significant influence over operating and financial policies, or non-consolidation of such companies does not have a significant effect on the financial statements taken as a whole, or the Group intends to resell such investments in the nearest future, as well as investments in corporate shares where the Group owns less than 20% of share capital, are accounted for at fair value or at cost of acquisition, if the fair value of investments cannot be determined. Management periodically assesses the carrying values of such investments and provides allowances for impairment, if necessary. As of 31 December 2008 and 2007 there were no investments in non-consolidated subsidiaries and associates.
Share capital and earnings per share
Ordinary shares - Incremental costs directly attributable to issue of ordinary shares and share options are recognized as a deduction from equity.
Repurchase of share capital - When share capital recognized as equity is repurchased, the amount of the consideration paid, including directly attributable costs, is recognized as a deduction from equity. Repurchased shares are classified as treasury shares and are presented as a deduction from total equity.
Equity-settled transactions - The Group has adopted Financial Reporting Standard (FRS) 20 ‘Share-based Payment’ during the financial year 2008.
The cost of equity-settled transactions with employees are measured by reference to the fair value at the grant date and are recognized as an expense over the vesting period, which ends on the date on which the relevant employees become fully entitled to the award.
Fair value is calculated using the Black-Scholes model. No expense is recognized for awards that do not ultimately vest. At each balance sheet date before vesting, the cumulative expense is calculated; representing the extent to which the vesting period has expired and management’s best estimate of the achievement or otherwise of non-market conditions and of the number of equity instruments that will ultimately vest. The movement in cumulative expense since the previous balance sheet date is recognized in the income statement, with a corresponding entry in equity.
Earnings per share - Are calculated by dividing net profit attributable to shareholders of the parent company by the weighted average number of shares outstanding during the period.

K E R N E L H O L D I N G S . A . A N D S U B S I D I A R I E S
- 19 -
4. BASIS OF PRESENTATION OF FINANCIAL STATEMENTS AND SUMMARY OF SIGNIFICANT ACCOUNTING POLICIES (CONTINUED)
Inventories - Inventories are stated at the lower of cost or net realizable value. Cost comprises purchase cost and, where applicable, those expenses that have been incurred in bringing the inventory to their present location and condition. Cost is calculated using FIFO method. Net realizable value is the estimated selling price in the ordinary course of business less the estimated costs of completion and the estimated costs necessary to make the sale.
Biological Assets - The Group classifies wheat, barley, corn, soy, sunflower seeds and other crops, which it produces, and cattle as biological assets. In accordance with IAS No. 41 "Agriculture", biological assets are measured on initial recognition and at each balance sheet date at their fair value less estimated point-of-sale costs, except for the case where the fair value cannot be measured reliably. Biological assets, for which market-determined prices or values are not available and for which alternative estimates of fair value are determined to be clearly unreliable, are measured using the present value of expected net cash flows from the sale of an asset discounted at a current market-determined pre-tax rate. The objective of a calculation of the present value of expected net cash flows is to determine the fair value of a biological asset in its present location and condition.
The Group classifies biological assets as current or non-current depending upon the average useful life of the particular group of biological assets. All of the Group's biological assets, except cattle, were classified as current as their average useful life is less than one year.
Taxes Recoverable and Prepaid - Taxes recoverable and prepaid are stated at their nominal value as reduced by appropriate allowances for estimated irrecoverable amounts.
Property, Plant and Equipment - Except for land, property, plant and equipment is carried at its cost less any accumulated depreciation and accumulated impairment losses. Land is carried at cost and is not depreciated.
Property, plant and equipment acquired in a business combination is initially recognized at fair value determined based on valuations performed by independent professionally qualified appraisers.
Capitalized costs include major expenditures for improvements and replacements that extend the useful lives of the assets or increase their revenue generating capacity. Repairs and maintenance expenditures that do not meet the foregoing criteria for capitalization are charged to income statement as incurred.
Property, plant and equipment are depreciated over the estimated remaining useful economic lives of assets mostly determined by independent appraisals under the straight-line method. Remaining useful lives of property, plant and equipment are as follows:
Buildings and constructions 20-50 years Production machinery and equipment 10-20 years Agricultural vehicles and equipment 3-10 years Fixtures, fittings and other fixed assets 5-20 years Transport vehicles 4-7 years Construction in progress ("CIP") and uninstalled equipment not depreciated
Construction in progress comprises costs directly related to construction of property, plant and equipment including an appropriate allocation of directly attributable variable overheads that are incurred in construction. Depreciation of these assets commences when the assets are put into operation.
Impairment of Non-Current Assets - At each balance sheet date the Group reviews the carrying amounts of the Group's non-current assets to determine whether there is any indication that those assets have suffered an impairment loss. If any such indication exists, the recoverable amount of the assets is estimated in order to determine the extent of the impairment loss (if any). Where it is not possible to estimate the recoverable amount of an individual asset, the Group estimates the recoverable amount of the cash-generating unit to which the asset belongs.
Recoverable amount is the greater of net selling price and value in use. In assessing value in use, the estimated future cash flows are discounted to their present value using effective interest rate that reflects current market assessments of the time value of money and the risks specific to the asset.
If the recoverable amount of an asset (or cash-generating unit) is estimated to be less than its carrying amount, the carrying amount of the asset (cash-generating unit) is reduced to its recoverable amount. Impairment losses are recognized as an expense immediately, unless the relevant asset is carried at a revalued amount, in which case the impairment loss is treated as a revaluation decrease. Where an impairment loss subsequently reverses, the carrying amount of the asset (cash-generating unit) is increased to the revised estimate of its recoverable amount, but so that the increased carrying amount does not exceed the carrying amount that would have been determined had no impairment loss been recognized for the asset (cash-generating unit) in prior years. A reversal of an impairment loss is recognized as income immediately.

K E R N E L H O L D I N G S . A . A N D S U B S I D I A R I E S
- 20 -
4. BASIS OF PRESENTATION OF FINANCIAL STATEMENTS AND SUMMARY OF SIGNIFICANT ACCOUNTING POLICIES (CONTINUED)
Trade and Other Accounts Payable - Trade and other accounts payable are stated at their nominal value.
Short-term and Long-term Borrowings - Short-term and long-term borrowings are recorded at the proceeds received, net of direct issue costs. Finance charges, including payments at origination and settlement, are accounted for on an accrual basis and are added to the carrying amount of the liability to the extent that they are not settled in the period in which they arise.
The difference between nominal amount of consideration received and the fair value of loans obtained from related parties of the Group at other than market terms is recognized in the period the loan is obtained as initial recognition adjustment discounting the loan based on market rates at inception.
Revenue Recognition - Revenue is recognized to the extent that it is probable that the economic benefits will flow to the Group and the revenue can be reliably measured. The following specific recognition criteria must also be met before revenue is recognized:
Sale of goods and finished products - Revenue is recognized when the significant risks and rewards of ownership of goods for resale and finished products have passed to the buyer and the amount of revenue can be measured reliably.
Rendering of services - Revenue is recognized when services are rendered.
Classification of administrative expenses - The Group includes all expenses related to the administration of the Group in General and administrative expenses except for payroll expenses related to administration of elevators. Such expenses are included in Cost of sales.
Income Taxes - Income taxes have been computed in accordance with the laws currently enacted in the countries, where the Holding and its Subsidiaries are incorporated.
Deferred tax is accounted for using the balance sheet liability method in respect of temporary differences arising from differences between the carrying amount of assets and liabilities in the financial statements and the corresponding tax basis used in the computation of taxable profit. Deferred tax liabilities are generally recognized for all taxable temporary differences and deferred tax assets are recognized to the extent that it is probable that taxable profits will be available against deductible temporary differences.
Deferred tax is calculated at rates that are expected to apply to the period when the asset is realized or the liability is settled.
Deferred income tax assets and liabilities are offset when:
− the Group has a legally enforceable right to set off the recognized amounts of current tax assets and current tax liabilities;
− the Group has an intention to settle on a net basis, or to realize the asset and settle the liability simultaneously;
− the deferred tax assets and the deferred tax liabilities relate to income taxes levied by the same taxation authority in each future period in which significant amounts of deferred tax liabilities and assets are expected to be settled or recovered.
Leases - Leases are classified as finance leases whenever the terms of the lease transfer substantially all the risks and rewards of ownership to the lessee. All other leases are classified as operating leases.
Assets held under finance leases are recognized as assets of the Group at their fair value at the date of acquisition. The corresponding liability to the lessor is included in the balance sheet as a finance lease obligation. Finance costs, which represent the difference between the total leasing commitments and the fair value of the assets acquired, are charged to income over the term of the relevant lease so as to produce a constant periodic rate of charge on the remaining balance of the obligations for each accounting period.
Rentals payable under operating leases are included in expenses for the period to which they relate on a straight-line basis over the term of the relevant lease.
Contingencies - Contingent liabilities are not recognized in the financial statements. They are disclosed unless the possibility of an outflow of resources embodying economic benefits is remote. A contingent asset is not recognized in the financial statement but disclosed when an inflow of economic benefits is probable.

K E R N E L H O L D I N G S . A . A N D S U B S I D I A R I E S
- 21 -
4. BASIS OF PRESENTATION OF FINANCIAL STATEMENTS AND SUMMARY OF SIGNIFICANT ACCOUNTING POLICIES (CONTINUED)
Provisions - A provision is recognized in the balance sheet when the Group has a legal or constructive obligation as a result of a past event, and it is probable that an outflow of economic benefits will be required to settle the obligation. If the effect is material, provisions are determined by discounting the expected future cash flows at a pre-tax rate that reflects current market assessments of the time value of money and, where appropriate, the risks specific to the liability.
Operating Segments - Operating segments are reported in a manner consistent with the internal reporting as provided to the chief operating decision makers in order to allocate resources to the segment and to assess its performance. The Management and the members of the Board of Directors of the Group are identified as the chief operating decision makers. Segments in the consolidated financial statements are defined in accordance with the type of activity, products sold or services provided.
The operating segments' activities are as follows:
Operating Segments Activities
Bottled sunflower oil Production, refining, bottling, marketing and distribution of bottled sunflower oil.
Sunflower oil in bulk Production and sales of sunflower oil in bulk (crude and refined) and meal
Grain Sourcing and merchandizing of wholesale grain.
Grain handling and transshipment services
Grain handling and trans-shipment services in the port of Ilyichevsk.
Grain silo services Provision of cleaning, drying and grain storage services.
Farming Agricultural farming. Production of wheat, barley, corn, soybean and sunflower seed.
The measure of profit and loss and assets and liabilities is based on the Group Accounting Policies which are compliant with IFRS.
In the financial statements as of 31 December 2008 the segment table reflects continuing operations only. The prior-year figures have been reclassified to ensure comparability.
The reconciliation eliminates intersegment items and reflects income and expenses not allocable to segments.
The segment data is calculated as follows:
− The intersegment sales reflect intergroup transactions effected on an arm's-length basis. − Capital expenditures, amortization and depreciation related to property, plant and equipment and intangible
assets are allocated to the segments when possible.
Since financial management of Group companies is carried out centrally, financial liabilities are not allocated directly to the respective operating segments. Consequently, the liabilities shown for the individual segments do not include financial liabilities.

KERNEL HOLDING S.A. AND SUB SIDIARIES
- 22 -
5. PROPERTY, PLANT AND EQUIPMENT, NET
The following table represents movements in property, plant and equipment for the 6 months ended 31 December 2008 :
Land Buildings and Construction
s
Production machinery and
equipment
Agricultural vehicles and equipment
Transport vehicles
Fixtures, fittings and other fixed
assets
CIP and uninstalled equipment
Total
Cost As of 30 June 2008 2 173 110 393 103 953 21 818 5 695 5 557 5 483 255 072
Additions from acquisition of Subsidiaries - 1 189 - 273 20 - - 1 482 Additions - - - - - - 45 117 45 117 Transfers - 2 261 1 460 9 913 798 1 037 (15 469) - Due to disposal of Subsidiaries - - - - - - - - Other disposals - (2 142) (313) (2 397) (79) (88) - (5 019) Translation differences (806) (39 116) (17 081) (10 275) (2 317) (2 315) (13 008) (84 918)
As of 31 December 2008 1 367 72 585 88 019 19 332 4 117 4 191 22 123 211 734
Accumulated depreciation
As of 30 June 2008 - (8 581) (9 287) (2 296) (1 588) (1 696) - (23 448)
Depreciation - (3 235) (4 709) (2 594) (490) (474) - (11 502) Due to disposal of Subsidiaries - - - - - - - - Other disposals - 21 211 379 25 33 - 669 Translation differences - 4 131 3 902 721 718 770 - 10 242
As of 31 December 2008 - (7 664) (9 883) (3 790) (1 335) (1 367) - (24 039)
Net Book Value
As of 31 December 2008 1 367 64 921 78 136 15 542 2 782 2 824 22 123 187 695 As of 30 June 2008 2 173 101 812 94 666 19 522 4 107 3 861 5 483 231 624

K E R N E L H O L D I N G S . A . A N D S U B S I D I A R I E S
- 23 -
6. INTANGIBLE ASSETS, NET
The following table represents movements in intangible assets for the 6 months ended 31 December 2008 and 2007:
Cost as of 30 June 2008 59 502 Cost as of 30 June 2007 17 055 Additions from acquisition of Subsidiaries 1 981
Additions from acquisition of Subsidiaries -
Additions 1 084 Additions 13 854 Disposals (2) Disposals (34) Translation difference (22 772) Translation difference - Cost as of 31 December 2008 39 793 Cost as of 31 December 2007 30 875
Accumulated depreciation as of 30 June 2008 (1 421)
Accumulated depreciation as of 30 June 2007 (234)
Amortization charge (3 162) Amortization charge (130) Disposals - Disposals 12 Translation difference 1 697 Translation difference - Accumulated depreciation as of 31 December 2008 (2 886)
Accumulated depreciation as of 31 December 2007 (352)
Net book value as of 31 December 2008 36 907
Net book value as of 31 December 2007 30 523
Included in intangible assets of Subsidiaries are the "Schedry Dar", "Stozhar”, "Zolota" and “Domashnya” trademarks with the value of USD 7,229 thousand, USD 9,385 thousand, USD 13,289 thousand and USD 287 thousand respectively. These trademarks are used by the Group for sale of bottled sunflower oil mostly in the Ukrainian market. Trade mark "Stozhar" was pledged as security for long-term loans as of 31 December 2008 (as of 31 December 2007 trade mark "Stozhar" was also pledged) (Note 8).
Management of the Group expects the demand for bottled sunflower oil to be stable in the foreseeable future. The Group believes that, as a result of further promotion of the "Schedry Dar", "Stozhar", "Zolota" and "Domashnya" trademarks sales of bottled oil under these trademarks and the current bottled oil market share enjoyed by the Group will be stable and thus the Group will obtain economic benefits from them during an indefinite period of time. Accordingly, the trademarks which belong to the Group are considered to have indefinite useful life and thus are not amortized but tested for impairment by comparing their recoverable amount with their carrying amount annually and whenever there is an indication that the trademarks may be impaired.
K E R N E L H O L D I N G S . A . A N D S U B S I D I A R I E S
- 24 -
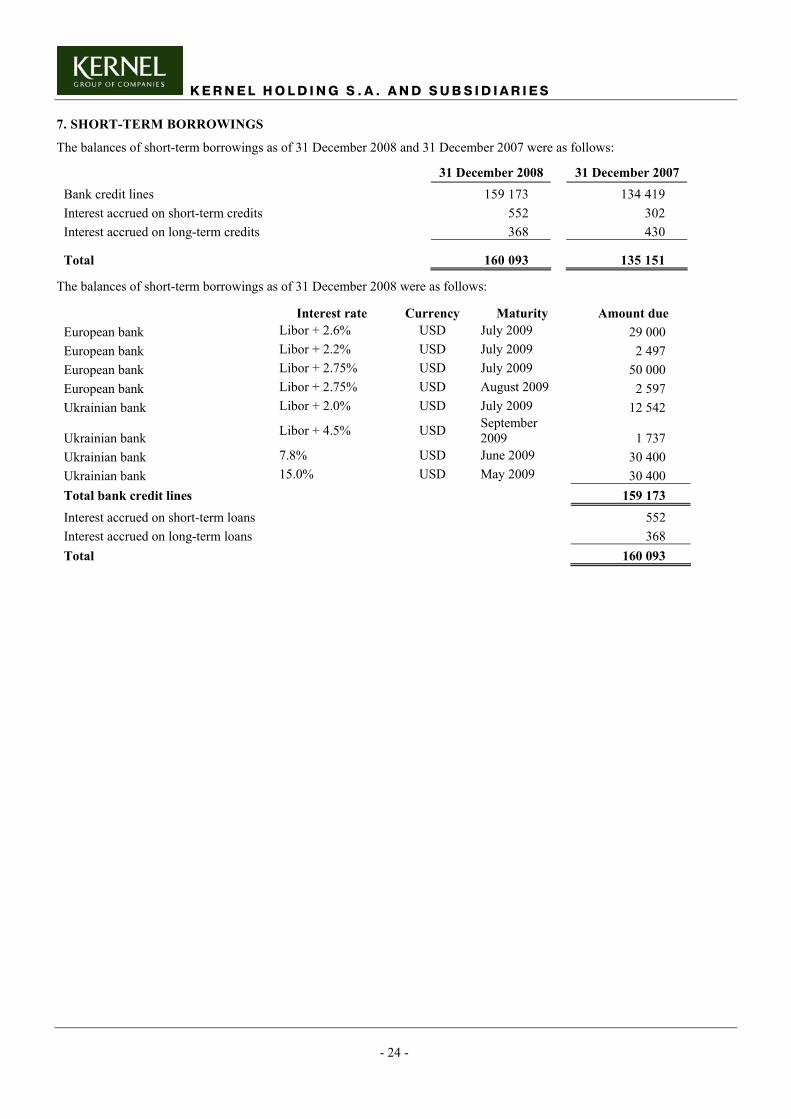
7. SHORT-TERM BORROWINGS
The balances of short-term borrowings as of 31 December 2008 and 31 December 2007 were as follows:
31 December 2008 31 December 2007 Bank credit lines 159 173 134 419 Interest accrued on short-term credits 552 302 Interest accrued on long-term credits 368 430
Total 160 093 135 151
The balances of short-term borrowings as of 31 December 2008 were as follows:
Interest rate Currency Maturity Amount due European bank Libor + 2.6% USD July 2009 29 000 European bank Libor + 2.2% USD July 2009 2 497 European bank Libor + 2.75% USD July 2009 50 000 European bank Libor + 2.75% USD August 2009 2 597 Ukrainian bank Libor + 2.0% USD July 2009 12 542
Ukrainian bank Libor + 4.5% USD September 2009 1 737
Ukrainian bank 7.8% USD June 2009 30 400 Ukrainian bank 15.0% USD May 2009 30 400 Total bank credit lines 159 173 Interest accrued on short-term loans 552 Interest accrued on long-term loans 368 Total 160 093

K E R N E L H O L D I N G S . A . A N D S U B S I D I A R I E S
- 25 -
7. SHORT-TERM BORROWINGS (CONTINUED)
The balances of short-term borrowings as of 31 December 2007 were as follows:
Interest rate Currency Maturity Amount due Ukrainian bank Libor + 2.35% USD July 2008 10 000 Ukrainian bank Libor + 4.5% USD November 2008 41 019 European Bank Libor + 2.35% USD June 2008 30 825 European Bank Libor + 2.9% USD January 2008 12 000 European Bank Libor + 2.0% USD June 2008 25 000 European Bank Libor + 2.125% USD June 2008 15 575 Total bank credit lines 134 419 Interest accrued on short-term loans 302 Interest accrued on long-term loans 430 Total 135 151
As of 31 December 2008 the overall maximum credit limit for short-term bank credit lines amounted to USD 701 948 thousand (as of 31 December 2007 USD 170 891 thousand).
As of 31 December 2008 and 2007 short-term loans from banks were secured as follows:
Assets pledged 31 December 2008 31 December
2007 Cash 60 800 - Inventories 60 770 135 310 Property, plant and equipment (Note 5) 542 - Total 122 112 135 310
In June 2008 Kernel Trade LLC and Kernel Holding S.A. signed loan agreements with the Ukrainian subsidiary of a European bank, each loan for a maximum amount of USD 90,000 thousand. The loan to Kernel Trade LLC is secured by pledge of Kernel Holding shares owned by Namsen LTD, the majority shareholder of the Group. Funds drawn by Kernel Trade LLC are placed on deposit and pledged as security for the loan provided to Kernel Holding S.A., which can then borrow the corresponding amount. The total amount outstanding as per 31 December 2008 under both loan agreements was USD 60,800 thousand.
8. LONG-TERM BORROWINGS
The balances of long-term borrowings as of 31 December 2008 and 2007 were as follows:
31 December
2008 31 December
2007 Long-term bank loans 110 561 116 149 Current portion of long-term borrowings (7 682) (12 572) Total 102 879 103 577
Long-term bank loans
The balances of long-term borrowings as of 31 December 2008 were as follows:
Interest rate Currency Maturity Amount due Ukrainian bank 11.25% USD July 2010 51 750 Ukrainian bank Libor + 5.0% USD November 2013 44 811 European Bank Libor + 3.52% USD 2015 14 000 Total bank credit lines 110 561

K E R N E L H O L D I N G S . A . A N D S U B S I D I A R I E S
- 26 -
8. LONG-TERM BORROWINGS (CONTINUED)
The balances of long-term borrowings as of 31 December 2007 were as follows:
Interest rate Currency Maturity Amount due Ukrainian bank 14.0% UAH July 2010 7 042 Ukrainian bank 12.0% USD July 2010 58 750 Ukrainian bank Libor + 5.0% USD November 2013 50 357 Total bank credit lines 116 149
Long-term loans from Ukrainian Banks
Long-term loans from Ukrainian banks as of 31 December 2008 included revolving and non-revolving credit lines from two banks with the overall maximum credit limit of USD 162 750 thousand (as of 31 December 2007 USD 126 670 thousand).
As of 31 December 2008 and 2007 long-term loans from Ukrainian banks were secured as follows:
Assets pledged 31 December 2008 31 December 2007 Inventories - 9 200 Property, plant and equipment (Note 5) 114 402 99 783 Intangible assets (Note 6) 9 385 9 385
Controlling stakes in Subsidiaries Not quantifiable Not quantifiable Total 123 787 118 368
In addition, controlling stakes in the following Subsidiaries were pledged to secure the long-term bank loans of the Group as of 31 December 2008 and 2007:
Name of Subsidiary, in which a stake was pledged 31 December 2008 31 December 2007
CJSC "Poltava oil crushing plant-Kernel Group" CJSC "Poltava oil crushing plant-Kernel Group" CJSC "Reshetylivka Hliboproduct" CJSC "Reshetylivka Hliboproduct" CJSC "Globynsky elevator HP" CJSC "Horol-Elevator" CJSC "Gutnansky elevator" CJSC "Globynsky elevator HP" JSC "Poltavske khlibopriemalne pidpriemstvo" CJSC "Karlivka-Agro" CJSC "Prykolotne OEP" CJSC "Galeschina-Agro" CJSC "Velykoburlutske HPP" CJSC "Lazorkovski Elevator" CJSC "Shevchenkisky KHP" CJSC "Sagaydak-Agro" CJSC "Orilske HPP" CJSC "Mirgorodskiy elevator" CJSC "Kovyagivske KHP" JSC "Golovanivske hlibopriemalne pidpriemstvo" CJSC "Poltavaavtotransservis" CJSC "Gutnansky elevator" LLC "Bandurskiy elevator" JSC "Poltavske khlibopriemalne pidpriemstvo" CJSC "Krasnopavlivsky KHP" CJSC "Lozivske HPP" JSC "Vovchansk OEP" CJSC "Prykolotne OEP" CJSC "Gogoleve-Agro" CJSC "Velykoburlutske HPP" CJSC "Semenivski elevator" CJSC "Lykhachivsky KHP" CJSC "Shevchenkisky KHP" CJSC "Orilske HPP" CJSC "Kovyagivske KHP" CJSC "Poltavaavtotransservis"

K E R N E L H O L D I N G S . A . A N D S U B S I D I A R I E S
- 27 -
9. INCOME TAX
As of 31 December 2008 and 2007 the major components of deferred tax assets and liabilities were as follows:
31 December 2008 31 December 2007 Deferred tax assets arising from: Valuation of advances from customers 5 087 320 Tax losses carried forward 641 100 Valuation of accounts receivable 395 1 345 Valuation of property, plant and equipment 161 109 Valuation of intangible assets 125 - Valuation of inventories 9 2 Valuation of accrued expenses and other temporary differences 202 120 Deferred tax asset 6 620 1 996 Less: valuation allowance (282) (125) Net deferred tax asset after valuation allowance 6 338 1 871 Deferred tax liability arising from: Valuation of property, plant and equipment (10 127) (15 884) Valuation of prepayments to suppliers and prepaid expenses (7 057) (3 086) Valuation of intangible assets (2 363) (3 583) Valuation of inventories (10) (397) Valuation of financial investments (8) - Deferred tax liability (19 565) (22 950) Net deferred tax liability (13 227) (21 079)
As of 31 December 2008 and 2007 all deferred taxes arose from temporary differences in value related to assets and liabilities of Subsidiaries located in Ukraine. The corporate income tax rate in Ukraine was 25% as of 31 December 2008 and 31 December 2007.
The components of income tax expense for the 3 months ended 31 December 2008 and 31 December 2007 were as follows:
31 December 2008 31 December 2007 Current income tax benefit/(expenses) (820) 1 451 Deferred tax benefit/(expenses) 442 (3 063) Income tax benefit/(expenses) (378) (1 612)
K E R N E L H O L D I N G S . A . A N D S U B S I D I A R I E S
- 28 -
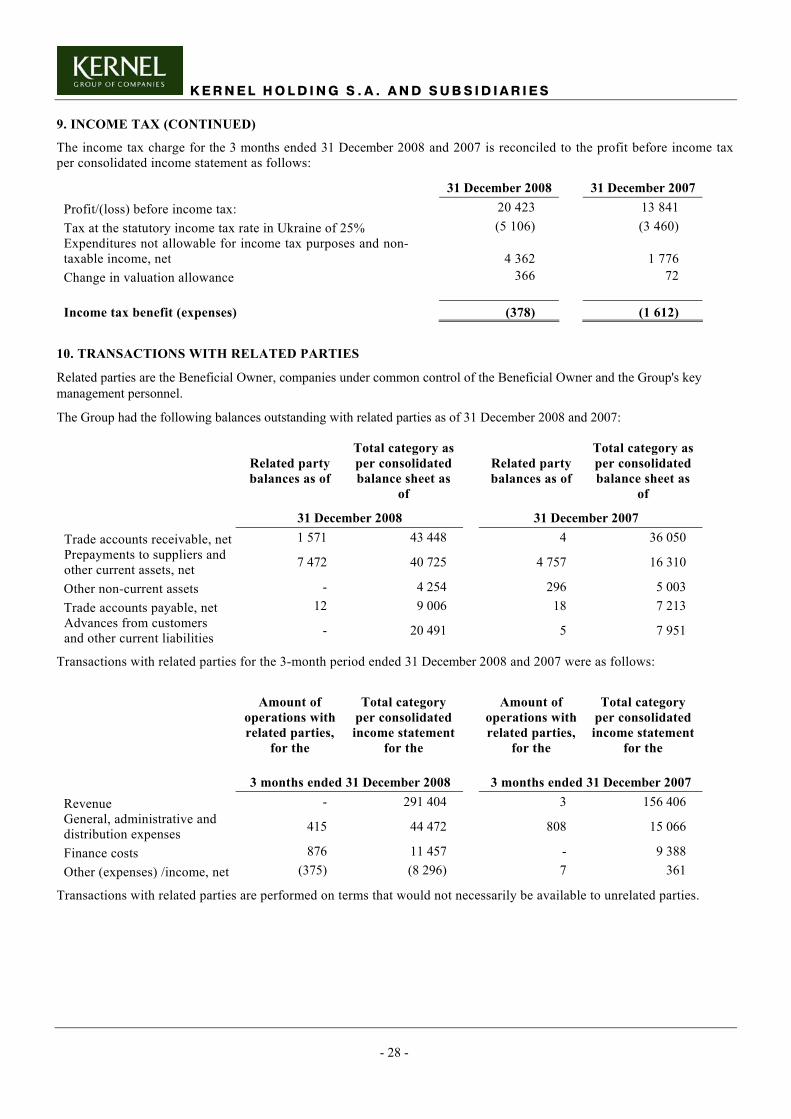
9. INCOME TAX (CONTINUED)
The income tax charge for the 3 months ended 31 December 2008 and 2007 is reconciled to the profit before income tax per consolidated income statement as follows:
31 December 2008 31 December 2007 Profit/(loss) before income tax: 20 423 13 841 Tax at the statutory income tax rate in Ukraine of 25% (5 106) (3 460) Expenditures not allowable for income tax purposes and non-taxable income, net 4 362 1 776 Change in valuation allowance 366 72 Income tax benefit (expenses) (378) (1 612)
10. TRANSACTIONS WITH RELATED PARTIES
Related parties are the Beneficial Owner, companies under common control of the Beneficial Owner and the Group's key management personnel.
The Group had the following balances outstanding with related parties as of 31 December 2008 and 2007:
Related party balances as of
Total category as per consolidated balance sheet as
of
Related party balances as of
Total category as per consolidated balance sheet as
of
31 December 2008 31 December 2007 Trade accounts receivable, net 1 571 43 448 4 36 050 Prepayments to suppliers and other current assets, net 7 472 40 725 4 757 16 310
Other non-current assets - 4 254 296 5 003 Trade accounts payable, net 12 9 006 18 7 213 Advances from customers and other current liabilities - 20 491 5 7 951
Transactions with related parties for the 3-month period ended 31 December 2008 and 2007 were as follows:
Amount of
operations with related parties,
for the
Total category per consolidated income statement
for the
Amount of
operations with related parties,
for the
Total category per consolidated income statement
for the
3 months ended 31 December 2008 3 months ended 31 December 2007 Revenue - 291 404 3 156 406 General, administrative and distribution expenses 415 44 472 808 15 066
Finance costs 876 11 457 - 9 388 Other (expenses) /income, net (375) (8 296) 7 361
Transactions with related parties are performed on terms that would not necessarily be available to unrelated parties.

K E R N E L H O L D I N G S . A . A N D S U B S I D I A R I E S
- 29 -
11. COMMITMENTS AND CONTINGENCIES
Operating Environment - The principal business activities of the Group are in Ukraine. Laws and regulations affecting businesses operating in Ukraine are subject to rapid changes. As a result, the Group's assets and operations could be at risk if there were any adverse changes in the political and business environments.
Taxation - Ukrainian tax authorities are increasingly directing their attention to the business community. As a result, the Ukrainian tax environment is often changing and subject to inconsistent application, interpretation and enforcement. Non-compliance with Ukrainian laws and regulations can lead to the imposition of severe penalties and penalty interest.
It should be noted that the Group was involved in transactions that may be interpreted by the tax authorities in a way different from that of the Group and additional tax charges and penalties may be imposed. Despite the fact that the most significant tax returns of the Group companies for the said periods were reviewed by the tax authorities without any significant disputes or additional tax charges, they are still open for further review. In accordance with the current legislation, tax returns remain open and subject to examination for a three-year period after their submission, however, in certain cases this limitation does not apply.
Future tax examinations could raise issues or assessments which are contrary to the Group tax filings. Such assessments could include taxes, penalties and interest, and these amounts could be material. While the Group believes it has complied with Ukrainian tax legislation, there have been many new tax and foreign currency laws and related regulations introduced in recent years which are not always clearly written.
Retirement and Other Benefit Obligations - Most employees of the Group receive pension benefits from the Pension Fund, an Ukrainian Government organization in accordance with the applicable laws and regulations. The Group is required to contribute a specified percentage of the payroll to the Pension Fund to finance the benefits. The only obligation of the Group with respect to this pension plan is to make the specified contributions.
As of 31 December 2008 and 31 December 2007 the Group was not liable for any significant supplementary pensions, post-retirement health care, insurance benefits or retirement indemnities to its current or former employees.
Legal Issues - The Group is involved in litigation and other claims that are in the ordinary course of its business activities. Management of the Group believes that the resolution of such legal matters will not have a material impact on its financial position.
Capital commitments – As of 31 December 2008 the Group had commitments under contracts with European and Ukrainian suppliers for a total amount of USD 12 million for supply of equipment and services required for the new solvent extraction plant under construction, and for a total amount of USD 5 million for supply of equipment and services required for increase in production capacity at CJSC "Poltava oil crushing plant-Kernel Group".
The Group signed in November 2007 three contracts with European suppliers for a total value of up to USD 21 500 thousand for supply of equipment and services required for the construction of a complete pre-pressing and solvent extraction plant for processing of sunflower seed, rapeseed and soybean. In December 2007 the Group signed contracts for a total value of up to USD 4 000 thousand for supply of agricultural equipment and machineries.
Contractual Commitments on Sales - As of 31 December 2008 the Group had entered into commercial contracts for export of 507 thousand tons of grain and 123 thousand tons of sunflower oil and meal, corresponding to an amount of USD 101,500 thousand and USD 42,000 thousand respectively in prices as of 31 December 2008.
As of 31 December 2007 the Group had entered into commercial contracts for export of 149 thousand tons of sunflower oil and meal, corresponding to an amount of USD 144 000 thousand in prices as of 31 December 2007.
12. FAIR VALUE OF FINANCIAL INSTRUMENTS
Estimated fair value disclosures of financial instruments is made in accordance with the requirements of IAS No. 32 "Financial Instruments: Disclosure and Presentation" and IAS No. 39 "Financial Instruments: Recognition and Measurement". Fair value is defined as the amount at which the instrument could be exchanged in a current transaction between knowledgeable willing parties in an arm's length transaction, other than in forced or liquidation sale. As no readily available market exists for a large part of the Group's financial instruments, judgment is necessary in arriving at fair value, based on current economic conditions and specific risks attributable to the instrument. The estimates presented herein are not necessarily indicative of the amounts the Group could realize in a market exchange from the sale of its full holdings of a particular instrument.
As of 31 December 2008 and 2007 the following methods and assumptions were used by the Group to estimate the fair value of each class of financial instruments for which it is practicable to estimate such value:

K E R N E L H O L D I N G S . A . A N D S U B S I D I A R I E S
- 30 -
12. FAIR VALUE OF FINANCIAL INSTRUMENTS (CONTINUED)
Cash - for these short-term instruments the carrying amount is a reasonable estimate of fair value.
Trade and Other Accounts Receivable - The carrying amount of trade and other accounts receivable is considered a reasonable estimate of their fair value as the allowance for estimated irrecoverable amounts is considered a reasonable estimate of the discount required to reflect the impact of credit risk.
Trade and Other Accounts Payable - The carrying amount of trade and other accounts payable is a reasonable estimate of their fair value.
Short-term Borrowings - For these short-term instruments the carrying amount is a reasonable estimate of fair value.
Long-term Bank Borrowings - The carrying amount of long-term bank borrowings is considered a reasonable estimate of their fair value as the nominal interest rate on long-term bank borrowings is considered to be a reasonable approximation of the fair market rate with reference to loans with similar credit risk level and maturity period at the reporting date.
Long-term Loans from Related Parties - The carrying amount of long-term loans from related parties equals their fair value.
13. DESCRIPTION OF SIGNIFICANT EVENTS FOR THE 3-MONTH PERIOD ENDED 31 DECEMBER 2008
On 15 October 2008 Kernel Holding S.A. announced the completion and finalization of the acquisition of the grain handling and transshipment terminal in the Commercial Sea Port of Ilyichevsk, Ukraine. As a result of this transaction, Kernel Holding SA received legal title to the companies Estron, Chorex and Hamalex, together holding all the assets of the port terminal. Total value of the transaction is approximately USD 95 million. Together with the completion of the transaction, Kernel Holding SA signed an agreement with a large international grain trader for the provision of throughput services until 30 June 2027 at market prices. The parties to the agreement have agreed a throughput of 500,000 tons of grain in the first year following signing, followed by 1 million tons per year in the following years.
On 17 November 2008 the Annual General Meeting of Kernel Holding S.A. shareholders was held. There was declared a dividend at nil for the financial year ended 30 June 2008.
14. SUBSEQUENT EVENTS
No significant event has occurred following the three-month period ending 31 December 2008.