manager of emerging managers overview - surs 10- 6 042414_progress... · manager of emerging...
TRANSCRIPT

Changing the Face of the Investment Management IndustrySM | 1
Changing the Face of the Investment Management Industrysm
www.progressinvestment.com
Manager of Emerging Managers OverviewAchieving Investment Excellence and Diversity through the SURS/Progress PartnershipApril 24, 2014
Presented to:The Board of Trustees and Investment Staff
State Universities Retirement System of Illinois
Progress Presenters:Thurman V. White, Jr.President & Chief Executive Officer
Mona WilliamsExecutive Vice President
Exhibit 10
Changing the Face of the Investment Management IndustrySM | 2
A Snapshot View of Progress
History and Our Role in the SURS/Progress Relationship
The Business Case for Investing in Emerging Managers
SURS’ Emerging Manager Success Stories
How We Define Success
Appendix
– Progress Database
– Progress SURS Portfolios (as of February 28, 2014)
– Professional Biographies
PROPRIETARY AND CONFIDENTIAL: NOT FOR DISTRIBUTION OR REPRINTCopyright © 2014 Progress Investment Management Company, LLCThe information contained in this presentation is confidential and legally privileged information intended only for the use of the individual or entity.
Discussion Overview
Exhibit 10

Changing the Face of the Investment Management IndustrySM | 3
Independent, 100% employee-owned MWBE-certified Registered Investment Adviser
$8.4 billion in AUM as of March 31, 2014
Pioneer and leading manager of emerging managers: 23 years
What differentiates our firm and benefits SURS:
– Alpha Focus: Fiduciary mindset. Performance matters
– People: Experienced and committed employee-owners
– Depth and Breadth of Experience: 23 years - different asset classes, customized client investmentmodels, hired/fired over 125 emerging managers and graduated 26 managers representing 31investment strategies to direct hire assignments
– Knowledge Advantage: Manager due diligence and selection. Portfolio construction and riskmanagement. Manager assistance to mitigate emerging manager business and investment risks;empowers managers
– Organizational Scale/Capacity/Resources: Intellectual capital, research database, due diligence,systems and analytic tools, client reporting and monitoring oversight to manage multiple mandates.Capacity for growth
– Culture: Bold vision for “change”, empowerment and inclusion. Value-centric leadership model to sethigh performance expectations
– Consultative and Adaptive to a Broad Range of Client Needs: Extension of staff and responsivehigh touch service. Knowledgeable about various public policy requirements and environments
– Non-Investment Alpha: Thought leader. Share “best practices” with all stakeholders: clients,managers, consultants and MWBE brokers
A Snapshot View of Progress
MissionWe invest with emerging managers to deliver alpha and achieve other client objectives
VisionTo become the Company most known for changing the face of the investment management industry
We define and lead the industry
We discover, fund and coach the next generation of talent
We inform perceptions about the risks and opportunities for investing with emerging managers
We build a culture that motivates and rewards performance
ValuesExcellence
Integrity
Leadership
Diversity
Teamwork
Exhibit 10

Changing the Face of the Investment Management IndustrySM | 4
Thurman White Jr., JD, MA, BA (21)1, 2
Chief Executive Officer
Chief Investment Officer Alex Hsiao, MBA, BS (20)1, 2
Jose Balagot, MS, BA (24)1, 2
Safia B. Mehta, BA, CFA (22)
Laura Nickols, MBA, BA (24) 2
Justin Eagan, CFA, MBA, BS (15)
Christina Wang, CFA, MA, BA (13)
Tung Ming, BS (12)
Janice Osugi, CFA, BA (14)
Ronald Aubert, MBA, BS (6)
Andrew Finver, MIA, BA (14)
Investments
Executive Vice President Mona Williams, BA (22)1,2
Adrienne Gaines (28)
Marcus Alexis, MBA, BA (20)
Jason Miles, MBA, BA (16)
Linda Cornett, BS (22)
Norma Galdamez, BA (10)
Kyle Parker, BA (4)
Janet Paz (8)
Marketing and Client Service
Senior Vice President, FinanceRita Cai, MBA, BS (23)1
Chris Tan, MBA, BS (15)
Paul Dattilio, Jr, BA (16)
Finance
Vice President, Fund AdministrationHilda Wong, BS (19)
Lily Liang, CPA, BS (11)
Rina Yabut, BA (36)
Kayla Leung, BS (6)
Andrew Bautista, BS (3)
Fund Administration
Vice President, Information TechnologyRicha Sharma, MS, BS (12)
Kenneth Greer (14)
Ilya Rotsenmar, BS (8)
Ramakrishna Vuppaluru, BS (10)
Aashka Shah, BE (4)
Information Technology
Vice President, Operations and Manager Compliance Sabrina Brutus, CCEP®, BA (10)
Vicki Kiele, BA (7)
Shoka Marefat, BA (2)
Compliance & Operations
Chief of Administration and OperationsBeverly Pasley-Harrison, BA (35)1
Compliance, Administration and Operations
Team-driven investment and management processes
100% Employee-owned
Disciplined Governance
- Board of Directors
- Management Committee
- Investment Committee
- Client Strategy Committee
Notes:( ) Years of Industry Functional Experience1 Management Team2 Investment Committee Member
The Progress TeamExhibit 10
Changing the Face of the Investment Management IndustrySM | 5* Multiple-Strategy Clients
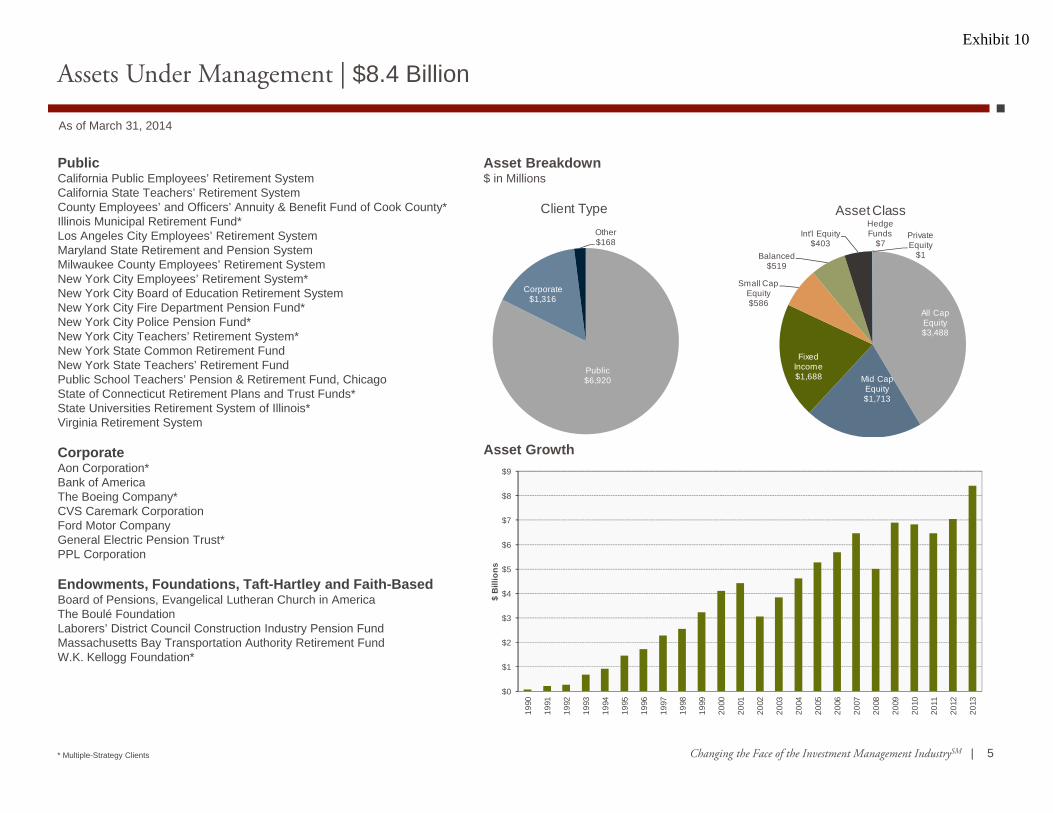
Assets Under Management | $8.4 Billion
As of March 31, 2014
Asset Breakdown $ in Millions
PublicCalifornia Public Employees’ Retirement SystemCalifornia State Teachers’ Retirement SystemCounty Employees’ and Officers’ Annuity & Benefit Fund of Cook County*Illinois Municipal Retirement Fund*Los Angeles City Employees’ Retirement System Maryland State Retirement and Pension SystemMilwaukee County Employees’ Retirement SystemNew York City Employees’ Retirement System*New York City Board of Education Retirement SystemNew York City Fire Department Pension Fund*New York City Police Pension Fund*New York City Teachers’ Retirement System*New York State Common Retirement FundNew York State Teachers’ Retirement FundPublic School Teachers’ Pension & Retirement Fund, ChicagoState of Connecticut Retirement Plans and Trust Funds*State Universities Retirement System of Illinois*Virginia Retirement System
CorporateAon Corporation*Bank of AmericaThe Boeing Company*CVS Caremark CorporationFord Motor CompanyGeneral Electric Pension Trust*PPL Corporation
Endowments, Foundations, Taft-Hartley and Faith-BasedBoard of Pensions, Evangelical Lutheran Church in AmericaThe Boulé FoundationLaborers’ District Council Construction Industry Pension FundMassachusetts Bay Transportation Authority Retirement FundW.K. Kellogg Foundation*
Asset Growth
Public$6,920
Corporate $1,316
Other$168
Client Type
All Cap Equity$3,488
Mid Cap Equity$1,713
Fixed Income$1,688
Small Cap Equity$586
Balanced$519
Int'l Equity$403
Hedge Funds
$7Private Equity
$1
Asset Class
$0
$1
$2
$3
$4
$5
$6
$7
$8
$9
1990
1991
1992
1993
1994
1995
1996
1997
1998
1999
2000
2001
2002
2003
2004
2005
2006
2007
2008
2009
2010
2011
2012
2013
$ B
illio
ns
Exhibit 10
Changing the Face of the Investment Management IndustrySM | 6
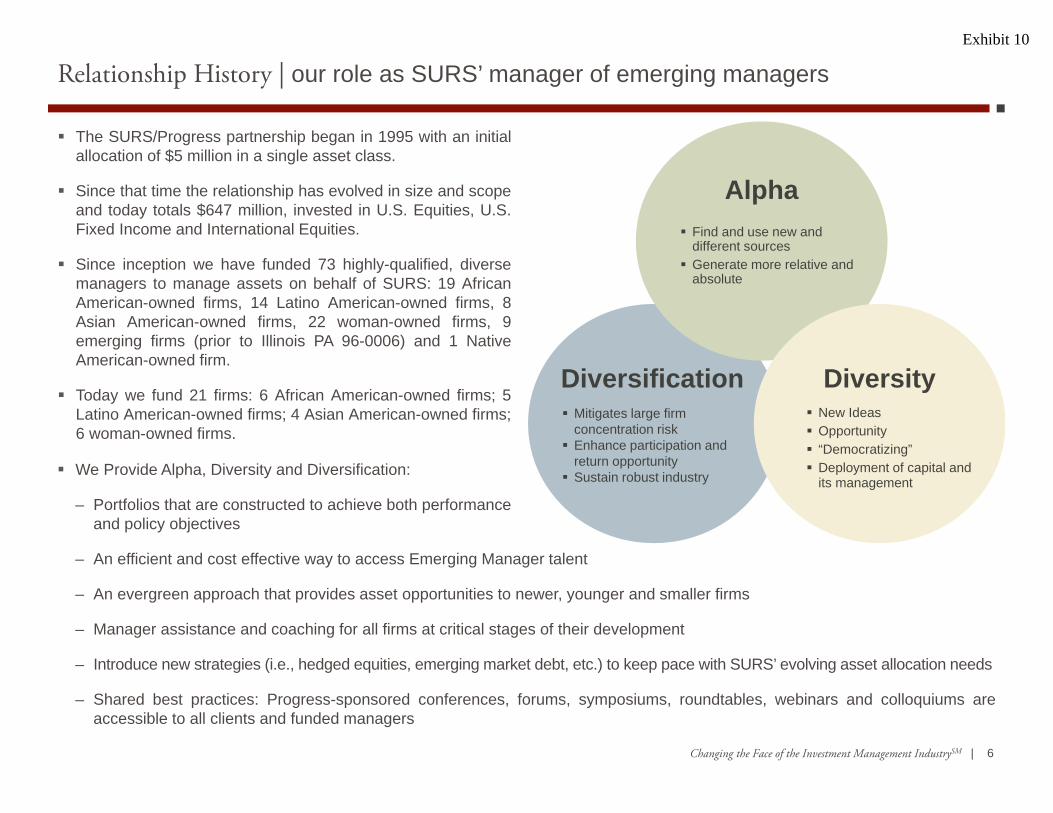
The SURS/Progress partnership began in 1995 with an initialallocation of $5 million in a single asset class.
Since that time the relationship has evolved in size and scopeand today totals $647 million, invested in U.S. Equities, U.S.Fixed Income and International Equities.
Since inception we have funded 73 highly-qualified, diversemanagers to manage assets on behalf of SURS: 19 AfricanAmerican-owned firms, 14 Latino American-owned firms, 8Asian American-owned firms, 22 woman-owned firms, 9emerging firms (prior to Illinois PA 96-0006) and 1 NativeAmerican-owned firm.
Today we fund 21 firms: 6 African American-owned firms; 5Latino American-owned firms; 4 Asian American-owned firms;6 woman-owned firms.
Relationship History | our role as SURS’ manager of emerging managers
Find and use new and different sources
Generate more relative and absolute
Mitigates large firm concentration risk
Enhance participation and return opportunity
Sustain robust industry
Alpha
Diversification New Ideas Opportunity “Democratizing” Deployment of capital and
its management
Diversity
We Provide Alpha, Diversity and Diversification:
– Portfolios that are constructed to achieve both performance and policy objectives
– An efficient and cost effective way to access Emerging Manager talent
– An evergreen approach that provides asset opportunities to newer, younger and smaller firms
– Manager assistance and coaching for all firms at critical stages of their development
– Introduce new strategies (i.e., hedged equities, emerging market debt, etc.) to keep pace with SURS’ evolving asset allocation needs
– Shared best practices: Progress-sponsored conferences, forums, symposiums, roundtables, webinars and colloquiums areaccessible to all clients and funded managers
Exhibit 10

Changing the Face of the Investment Management IndustrySM | 7
Institutional investors face various challenges when allocating to emerging managers (asset class, active vs. passive, direct vs.MoM). Progress plays critical roles by providing an efficient approach to accessing and managing smaller, younger, emerging firms.Key benefits include:
Manager of Managers Value Proposition | a solutions-based approach
Dedicated Resources
SURS
Portfolio Diversification Efficiency Competitive Fee StructureManager Assistance
– Focus on alpha generation
– Reduced capacity and concentration risk
– Portfolio construction and lifecycle management
– Investment risk management
– Can address manager overlap; complement to SURS’ Manager Diversity Program
– Single point of contact– Focused sourcing and
selection– Reduced
administration and monitoring costs
– Standalone or complement to direct hire program
– Extension of staff– Integrated team and
technology infrastructure
– Daily monitoring and compliance
– “Non-investment” alpha
– Shared best practices to reduce business risk
– Capital introductions to facilitate growth
– Business risk management and mitigation
– No “Fee on Fee”– Split fee model– Split favors managers
Exhibit 10

Changing the Face of the Investment Management IndustrySM | 8
Global firms, global products, global clients
DefinitionMinority, women, disabled, veteran and emerging firms; <$10B; RIAs (SEC/State)
Global definition and global acceptance will expand opportunities
Exclusively WMBE; <$500M; independent
Small; predominantly public market asset classes
Few; not well known or visible
Few formal programs
Single product firms; dominant shareholder ownership; manual processes
Entrance of mainstream players as service providers and minority stake “partners” further validates emerging manager investing
From opportunistic to formalized programs across the country
Multi product firms, including alternatives; broad ownership models; strategic partners; leverage technology and outsourcing options (back office, compliance, etc.)
Robust; now includes alternative strategies—PE, Real Assets, Hedge Funds
Will continue to expand as EM alpha generation potential is recognized across asset classes
Continued influx of new players and consolidation of existing players as demand grows and expertise is required
Global acceptance and institutionalization of programs as part of overall investment strategy
1990 2014 Forward
Universe
EM Service Providers
Plan Sponsor Programs
EM Profile
The Evolution of the Emerging Manager IndustryExhibit 10

Changing the Face of the Investment Management IndustrySM | 9
Long-only Industry Concentration The largest 595 investment managers (>$10 billion in AUM)
represent 87.5% ($51.4 trillion) of the global assetmanagement industry
The next 3,915 Emerging Managers (as defined by Illinois withless than $10 billion in AUM) represent 12.5% ($7.3 trillion)with MWBE firms representing less than 1% of the global assetmanagement industry with a total AUM between $400-500billion
Emerging Manager Advantage Research continues to support the performance and
diversification value of emerging managers Emerging firms are well-resourced, technologically savvy,
leverage outsourced solutions and have broader ownershipmodels
Current Environment New firm formations continue, but greater activity is around
new products from existing firms and new firms in the hedgefund space
Big themes: de-risking and the implication for emergingmanagers; re-purposing of assets; evolution of benchmarks;graduation
Despite progress, myths about emerging managers and theManager of Managers model prevail (fees, performance andrisk)
State of the Industry Today | concentration = opportunity for clients and managers
Asset Management Industry Concentration
Source: M oney M arket Directories, eVestment, Progress Investment M anagement
1% 3%9%
25%
62%
8%
53%
19% 15%8% 4% 1%
0%10%20%30%40%50%60%70%80%90%
100%
Largest 50AUM
$50-$184AUM
$10-$50AUM
$2-$10AUM
$0-$2AUM
MWBE
% of Firms % Global AUM
Exhibit 10
Changing the Face of the Investment Management IndustrySM | 10
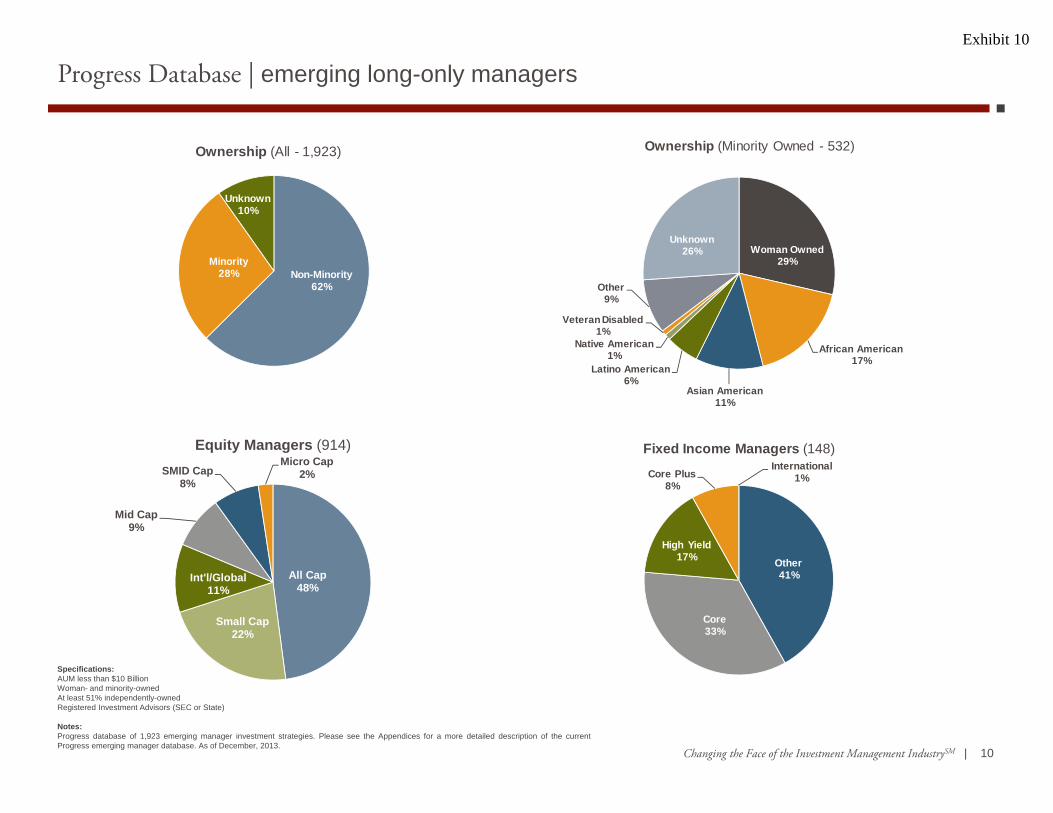
Specifications:AUM less than $10 BillionWoman- and minority-ownedAt least 51% independently-ownedRegistered Investment Advisors (SEC or State)
Notes:Progress database of 1,923 emerging manager investment strategies. Please see the Appendices for a more detailed description of the currentProgress emerging manager database. As of December, 2013.
Progress Database | emerging long-only managers
Other41%
Core33%
High Yield17%
Core Plus8%
International1%
Fixed Income Managers (148)
Woman Owned29%
African American17%
Asian American11%
Latino American6%
Native American1%
Veteran Disabled1%
Other9%
Unknown26%
Ownership (Minority Owned - 532)
Non-Minority62%
Minority28%
Unknown10%
Ownership (All - 1,923)
All Cap48%
Small Cap22%
Int'l/Global11%
Mid Cap9%
SMID Cap8%
Micro Cap2%
Equity Managers (914)
Exhibit 10
Changing the Face of the Investment Management IndustrySM | 11
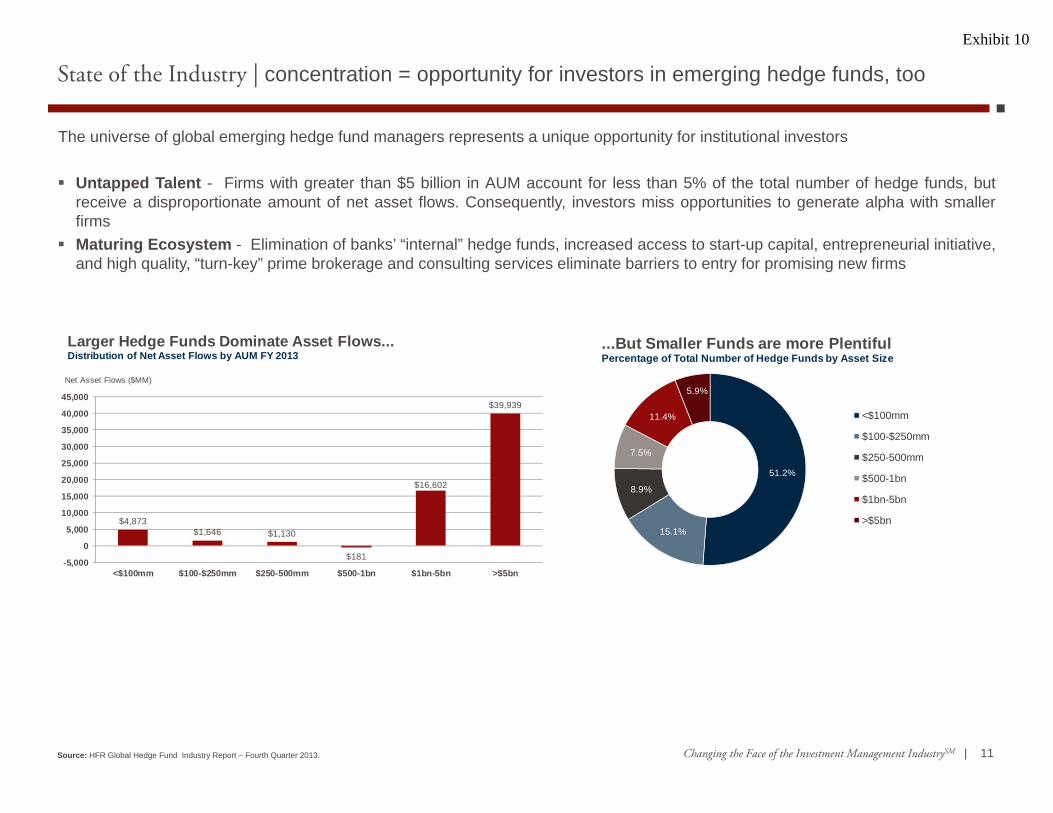
The universe of global emerging hedge fund managers represents a unique opportunity for institutional investors
Untapped Talent - Firms with greater than $5 billion in AUM account for less than 5% of the total number of hedge funds, butreceive a disproportionate amount of net asset flows. Consequently, investors miss opportunities to generate alpha with smallerfirms
Maturing Ecosystem - Elimination of banks’ “internal” hedge funds, increased access to start-up capital, entrepreneurial initiative,and high quality, “turn-key” prime brokerage and consulting services eliminate barriers to entry for promising new firms
Source: HFR Global Hedge Fund Industry Report – Fourth Quarter 2013.
State of the Industry | concentration = opportunity for investors in emerging hedge funds, too
$4,873$1,646 $1,130
$181
$16,602
$39,939
-5,000
0
5,000
10,000
15,000
20,000
25,000
30,000
35,000
40,000
45,000
<$100mm $100-$250mm $250-500mm $500-1bn $1bn-5bn >$5bn
Net Asset Flows ($MM)
Larger Hedge Funds Dominate Asset Flows...Distribution of Net Asset Flows by AUM FY 2013
51.2%
15.1%
8.9%
7.5%
11.4%
5.9%
...But Smaller Funds are more PlentifulPercentage of Total Number of Hedge Funds by Asset Size
<$100mm
$100-$250mm
$250-500mm
$500-1bn
$1bn-5bn
>$5bn
Exhibit 10

Changing the Face of the Investment Management IndustrySM | 12
69%
19%
5%6%
Less than 100(1,029)
100 to 300(285)
300 to 500(82)
More than 500(87)
52%
15%
17%
2%2%
11% US
Europe
Asia
Latin America
Emerging/Frontier
Global
18%
82%
% of MWBE(267)
% of Strategy(1,216)
62%22%
16%
L/S Equities
Credit/ Event Driven
Global Macro
Progress has exposure to more than 1,500 emerging and MWBE hedge funds across the globe, employing a wide range ofinvestment strategies and themes
“Emerging Hedge Funds” = generally less than $300 million in AUM, or less than 3-Year track record. As of December 31, 2013.
Progress Database | emerging hedge funds managers
By Region By Strategy
By Size ($MM) By Ownership
Exhibit 10

Changing the Face of the Investment Management IndustrySM | 13
1199 SEIU Employees Benefit and Pension Funds Alameda County Employees’ Retirement Association Arkansas Teacher Retirement System Bank of America Corporation Boeing Company, The Boulé Foundation California Public Employees’ Retirement System California State Teachers’ Retirement System Chicago Policemen’s Annuity & Benefit Fund Chicago Teachers’ Pension Fund City of Kansas City Employees’ Retirement System City of Philadelphia Board of Pensions and Retirement Coca Cola Master Retirement Trust Contra Costa County Employees’ Retirement Association Cook County Employees’ Detroit General Retirement System District of Columbia Retirement Board Exelon Corporation GE Asset Management Illinois Municipal Retirement Fund Illinois State Board of Investment Indiana Public Employees’ Retirement Fund Liberty Mutual Retirement Benefit Plan Los Angeles City Employees’ Retirement System Los Angeles County Employees Retirement Association Maryland State Retirement & Pension System Massachusetts Bay Transportation Authority Ret. Fund Michigan Department of Treasury
Minnesota State Board of Investment Municipal Employees’ Annuity & Benefit Fund of Chicago New York City Board of Education Retirement System New York City Employees’ Retirement System New York City Fire Department Pension Fund New York City Police Pension Fund New York State Common Retirement Fund New York State Teachers’ Retirement System Ohio Public Employees Retirement System Oregon Public Employees Retirement Fund Pennsylvania Public School Employees’ Retirement System Pennsylvania Treasury Department, The PG&E Corporation PPL Services Corporation Public School Teachers’ Pension & Retirement Fund of Chicago San Antonio Fire & Police Pension Fund San Francisco City & County Employees’ Retirement System San Joaquin County Employees’ Retirement Association Seattle City Employees’ Retirement System Shell Oil Company State of Connecticut Retirement Plans & Trust Funds State Universities Retirement System of Illinois Teacher Retirement System of Texas Teachers’ Retirement System of the City of New York Teachers’ Retirement System of the State of Illinois Verizon Communications, Inc. W.K. Kellogg Foundation
Note: Above is a representative list of known U.S. Pension Plans that have committed assets to emerging manager strategies:
Widespread and Growing Utilization of Emerging ManagersExhibit 10

Changing the Face of the Investment Management IndustrySM | 14
Practice (40%)Increase usage of Emerging, MWBE managers and broker/dealers
Policy (25%)Integration of Emerging Manager Practice as fundamental aspect of plan policy
Performance (15%)Value-add from usage of Emerging, MWBE managers and broker/dealers
Governance/People (15%)Diversity among plan governing body and key staff decision-makers
Other (5%)Outreach, best practice sharing, legislative compliance, etc.
40%
25%
15%
15%
5%
0 5025 30 35 40 455 10 15 20
Percentage WeightingCategoryDiversity Scoring Model
Self-diagnostic tool to achieve Plan excellence in the areas of plan diversity and inclusion Targeted for public pension plans but can be customized for corporations, foundations and endowments Highlights best practices holistically
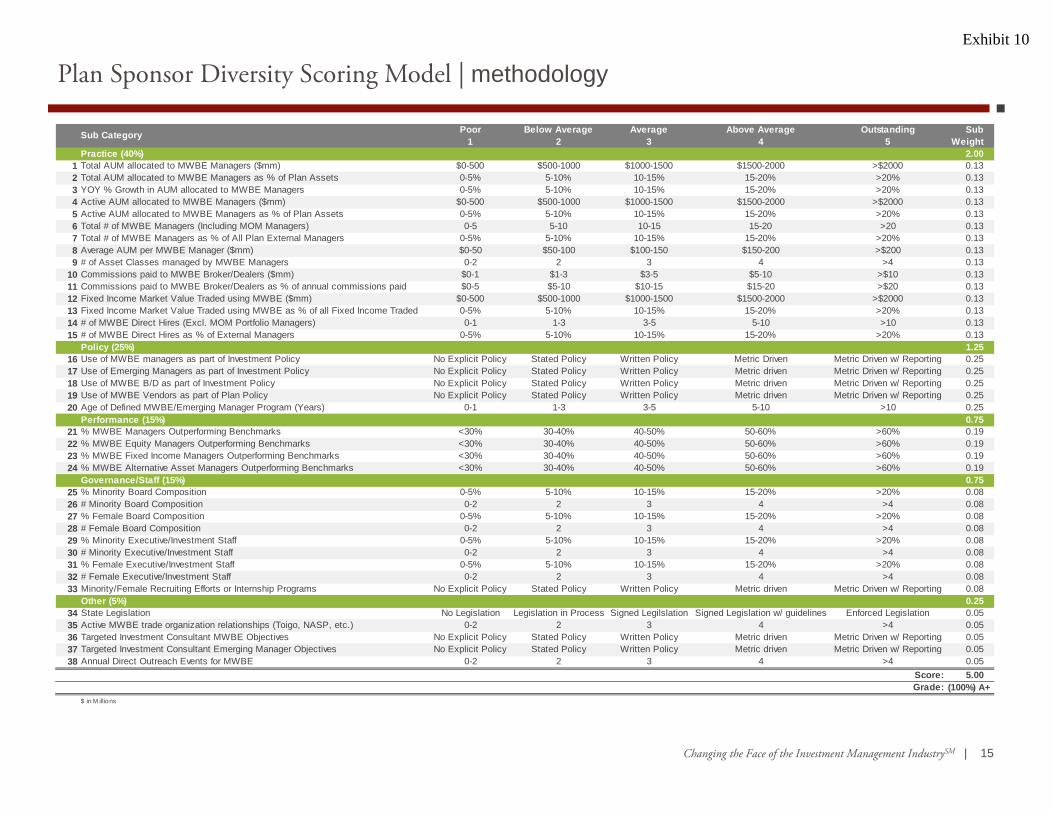
Plan Sponsor Diversity Scoring Model | overviewExhibit 10
Changing the Face of the Investment Management IndustrySM | 15
Poor Below Average Average Above Average Outstanding Sub1 2 3 4 5 Weight
Practice (40%) 2.001 Total AUM allocated to MWBE Managers ($mm) $0-500 $500-1000 $1000-1500 $1500-2000 >$2000 0.13 2 Total AUM allocated to MWBE Managers as % of Plan Assets 0-5% 5-10% 10-15% 15-20% >20% 0.13 3 YOY % Growth in AUM allocated to MWBE Managers 0-5% 5-10% 10-15% 15-20% >20% 0.13 4 Active AUM allocated to MWBE Managers ($mm) $0-500 $500-1000 $1000-1500 $1500-2000 >$2000 0.13 5 Active AUM allocated to MWBE Managers as % of Plan Assets 0-5% 5-10% 10-15% 15-20% >20% 0.13 6 Total # of MWBE Managers (Including MOM Managers) 0-5 5-10 10-15 15-20 >20 0.13 7 Total # of MWBE Managers as % of All Plan External Managers 0-5% 5-10% 10-15% 15-20% >20% 0.13 8 Average AUM per MWBE Manager ($mm) $0-50 $50-100 $100-150 $150-200 >$200 0.13 9 # of Asset Classes managed by MWBE Managers 0-2 2 3 4 >4 0.13
10 Commissions paid to MWBE Broker/Dealers ($mm) $0-1 $1-3 $3-5 $5-10 >$10 0.13 11 Commissions paid to MWBE Broker/Dealers as % of annual commissions paid $0-5 $5-10 $10-15 $15-20 >$20 0.13 12 Fixed Income Market Value Traded using MWBE ($mm) $0-500 $500-1000 $1000-1500 $1500-2000 >$2000 0.13 13 Fixed Income Market Value Traded using MWBE as % of all Fixed Income Traded 0-5% 5-10% 10-15% 15-20% >20% 0.13 14 # of MWBE Direct Hires (Excl. MOM Portfolio Managers) 0-1 1-3 3-5 5-10 >10 0.13 15 # of MWBE Direct Hires as % of External Managers 0-5% 5-10% 10-15% 15-20% >20% 0.13
Policy (25%) 1.2516 Use of MWBE managers as part of Investment Policy No Explicit Policy Stated Policy Written Policy Metric Driven Metric Driven w/ Reporting 0.25 17 Use of Emerging Managers as part of Investment Policy No Explicit Policy Stated Policy Written Policy Metric driven Metric Driven w/ Reporting 0.25 18 Use of MWBE B/D as part of Investment Policy No Explicit Policy Stated Policy Written Policy Metric driven Metric Driven w/ Reporting 0.25 19 Use of MWBE Vendors as part of Plan Policy No Explicit Policy Stated Policy Written Policy Metric driven Metric Driven w/ Reporting 0.25 20 Age of Defined MWBE/Emerging Manager Program (Years) 0-1 1-3 3-5 5-10 >10 0.25
Performance (15%) 0.7521 % MWBE Managers Outperforming Benchmarks <30% 30-40% 40-50% 50-60% >60% 0.19 22 % MWBE Equity Managers Outperforming Benchmarks <30% 30-40% 40-50% 50-60% >60% 0.19 23 % MWBE Fixed Income Managers Outperforming Benchmarks <30% 30-40% 40-50% 50-60% >60% 0.19 24 % MWBE Alternative Asset Managers Outperforming Benchmarks <30% 30-40% 40-50% 50-60% >60% 0.19
Governance/Staff (15%) 0.7525 % Minority Board Composition 0-5% 5-10% 10-15% 15-20% >20% 0.08 26 # Minority Board Composition 0-2 2 3 4 >4 0.08 27 % Female Board Composition 0-5% 5-10% 10-15% 15-20% >20% 0.08 28 # Female Board Composition 0-2 2 3 4 >4 0.08 29 % Minority Executive/Investment Staff 0-5% 5-10% 10-15% 15-20% >20% 0.08 30 # Minority Executive/Investment Staff 0-2 2 3 4 >4 0.08 31 % Female Executive/Investment Staff 0-5% 5-10% 10-15% 15-20% >20% 0.08 32 # Female Executive/Investment Staff 0-2 2 3 4 >4 0.08 33 Minority/Female Recruiting Efforts or Internship Programs No Explicit Policy Stated Policy Written Policy Metric driven Metric Driven w/ Reporting 0.08
Other (5%) 0.2534 State Legislation No Legislation Legislation in Process Signed Legilslation Signed Legislation w/ guidelines Enforced Legislation 0.05 35 Active MWBE trade organization relationships (Toigo, NASP, etc.) 0-2 2 3 4 >4 0.05 36 Targeted Investment Consultant MWBE Objectives No Explicit Policy Stated Policy Written Policy Metric driven Metric Driven w/ Reporting 0.05 37 Targeted Investment Consultant Emerging Manager Objectives No Explicit Policy Stated Policy Written Policy Metric driven Metric Driven w/ Reporting 0.05 38 Annual Direct Outreach Events for MWBE 0-2 2 3 4 >4 0.05
Score: 5.00 Grade:
$ in M illions
Sub Category
(100%) A+
Plan Sponsor Diversity Scoring Model | methodologyExhibit 10

Changing the Face of the Investment Management IndustrySM | 16
Summary of Sub-Categories BENCHMARK Plan A Plan B Plan C Plan DPractice (40%) 2.00 1.71 1.79 1.68 1.65
1 Total AUM allocated to MWBE Managers ($ value; % of total; YOY% Growth; AUM Per Manager, # of Asset Classes) 0.67 0.56 0.59 0.64 0.562 Total MWBE Managers and Direct Hires (absolute number; % of total) 0.53 0.53 0.53 0.43 0.533 Active AUM allocated to MWBE Managers ($ value; % total) 0.27 0.16 0.27 0.16 0.164 Commissions and Fixed Income Market Value Traded using MWBE Broker/Dealers ($ value; % of total) 0.53 0.45 0.40 0.45 0.40
Policy (25%) 1.25 1.25 1.25 1.15 1.255 Use of Emerging Managers, MWBE managers, MWBE B/D, MWBE Vendors as part of Policy 1.25 1.25 1.25 1.15 1.25
Performance (15%) 0.75 0.45 0.45 0.45 0.456 % MWBE Managers Outperforming Benchmarks By Asset Class (Equity, Fixed, Alternatives) 0.75 0.45 0.45 0.45 0.45
Governance/Staff (15%) 0.75 0.57 0.73 0.58 0.577 Minority/Female Board Composition, Executive/Investment Staff, and Recruting Efforts 0.75 0.57 0.73 0.58 0.57
Other (5%) 0.25 0.14 0.18 0.13 0.158 State Legislation 0.05 0.05 0.05 0.05 0.059 Direct Out Reach Programs and Active MWBE trade organization relationships (Toigo, NASP, etc.) 0.10 0.05 0.09 0.04 0.06
10 Targeted Investment Consultant MWBE/Emerging Manager Objectives 0.10 0.04 0.04 0.04 0.04
Total Score: 5.00 4.11 4.40 3.99 4.07
100.0% 82.3% 88.0% 79.9% 81.4%A+ B B+ B- B
Data Sources: Illino is P lan Sponsors 2011 Reports to General Assembly, Annual Financial Reports, and Investment P lans
Grade:
Plan Sponsor Diversity Scoring Model | hypothetical example
Our methodology and the current results reveal that diversity as an explicit policy at the legislative level, combined with sweepingplan sponsor level inclusion practices, lead to higher diversity scores
– Plan Sponsor A = 4.11/5.00 (82%)
– Plan Sponsor B = 4.40/5.00 (88%)
– Plan Sponsor C = 3.99/5.00 (80%)
– Plan Sponsor D = 4.07/5.00 (81%)
Exhibit 10
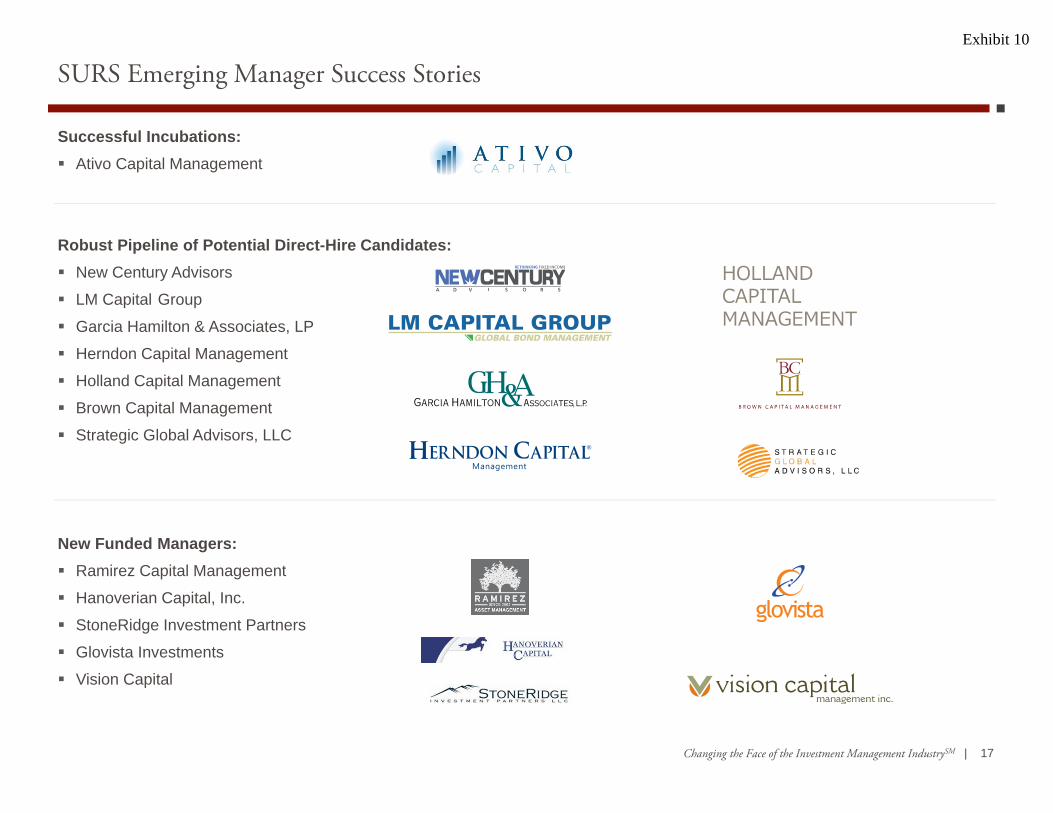
Changing the Face of the Investment Management IndustrySM | 17
Successful Incubations: Ativo Capital Management
Robust Pipeline of Potential Direct-Hire Candidates: New Century Advisors
LM Capital Group
Garcia Hamilton & Associates, LP
Herndon Capital Management
Holland Capital Management
Brown Capital Management
Strategic Global Advisors, LLC
New Funded Managers: Ramirez Capital Management
Hanoverian Capital, Inc.
StoneRidge Investment Partners
Glovista Investments
Vision Capital
SURS Emerging Manager Success StoriesExhibit 10

Changing the Face of the Investment Management IndustrySM | 18
Strategic Ideas and Opportunities | 2014 and beyond
Progress will continue to work with SURS to develop and implement strategies that create more opportunities for emerging managersand broker/dealers. We will:
Identify new emerging manager ideas and funding opportunities across all asset classes, including emerging hedge funds
Facilitate new manager and new product supply through:
– The exploration and development of new vehicles (i.e., seeding and incubation platforms)
– Targeted outreach to affinity groups in order to stimulate the “diverse manager” pipeline
– Coaching emerging firms to bring new products to market
Encourage increased use of minority and women-owned brokers by:
– Providing regular information to all SURS’ managers on MWDV brokerage firms and their capabilities
– Engaging MWDV firms through a competitive bidding process for transition management when rebalancing the SURS portfolio
– Work with SURS to convene forums for dialogue and communication between emerging asset managers and broker dealers
Provide data and best practices information to SURS Board and Committees as required
Assist SURS in its interface and communication with the Illinois State Senate regarding SURS’ activities, progress andachievements with respect to MWDV usage, consistent with Illinois PA 96-0006
Exhibit 10
Changing the Face of the Investment Management IndustrySM | 19
Additional Discussion Items | 2014 and beyond
How can Progress be additive relative to the proposed NEPC New Asset Class Recommendations?
Considerations
Reduced U.S. equity exposure and impact upon potential for expanded MWDBE engagement
How hedged equity, other absolute return and commodities strategies are represented in the emerging manager universe
Progress portfolio overlap with/complement to the SURS Manager Diversity Program: policies and other Progress client models
Exhibit 10

Changing the Face of the Investment Management IndustrySM | 20
Partner Relative fund out-performance Non-investment alpha More diversity among investment
managers in multi-asset classes Responsive client service Good community partner/vendor
relationships
Satisfied clients and managers Thought leader and innovator “Lifeline” to young firms Do well by doing good Develop strong community and
diversity partnerships Employee growth and share in
rewards
SURS
Progress Opportunity Relative portfolio out-performance Share best practices – business
and investment Preparation for direct hire
assignments
Manager
Conclusion | how we define successExhibit 10

Changing the Face of the Investment Management IndustrySM | 21
Appendix | Progress Database
Exhibit 10

Changing the Face of the Investment Management IndustrySM | 22
Manager Researchand Focus List (Strategies)
Total Universe2,052
ResearchList 323
Buy List
219
Funded List
86
As of March 31, 2014
Specifications AUM less than $10 BillionWoman- and minority-owned At least 51% independently-owned Registered Investment Advisors
Notes:Emerging: Male Caucasian of non minority descentUnknown: Not yet qualified but in our system
The Progress Proprietary Database
Size and Style Matrix
AUM EmergingAfrican
AmericanAfrican American, Veteran /Disabled
Asian American
Latino American
Minority + Woman
Native American
Other Minority
Veteran /Disabled Woman Unknown
Grand Total
0-50 174 59 --- 19 15 1 2 --- 4 39 84 39750-100 42 3 --- 4 5 --- 15 --- 20 4 93100-500 269 24 2 24 9 3 5 9 --- 71 17 433500-1,000 163 19 --- 11 7 10 --- 3 --- 31 17 2611,000-2,000 159 20 --- 6 2 4 --- 6 --- 21 13 2312,000-5,000 284 18 --- 10 11 5 --- 4 2 38 23 3955,000 and Above 172 19 --- 10 --- --- --- --- --- 16 25 242Grand Total 1,263 162 2 84 44 28 7 37 6 236 183 2,052
The following report is in IMS: MCS - Progress Database Style and Ownership Matrix
Asset Class EmergingAfrican
AmericanAfrican American, Veteran /Disabled
Asian American
Latino American
Minority + Woman
Native American
Other Minority
Veteran /Disabled Woman Unknown
Grand Total
All Cap Core 48 2 --- 3 1 --- --- 1 --- 10 4 69All Cap Growth 38 2 --- 4 3 --- --- 2 --- 6 4 59All Cap Value 49 1 --- --- 1 1 --- 3 --- 6 61Alternatives 16 1 --- 2 1 2 --- --- --- 2 16 40Emerging Markets --- --- --- 1 1 --- --- --- --- --- 2Emerging Market Debt --- --- --- --- --- --- --- --- 1 1Fixed Income Core 53 10 --- 2 4 2 --- 2 --- 7 4 84Fixed Income Core Plus 13 2 --- 3 1 1 --- --- --- 1 1 22Fixed Income High Yield 23 3 --- 4 1 --- --- --- --- 8 4 43Fixed Income Intermediate Core 2 1 --- --- --- --- --- --- --- 3Fixed Income Other 65 13 --- 1 2 1 --- --- --- 17 9 108Global Equity 8 --- --- 3 1 2 --- --- --- 1 15Hedge Fund 48 6 --- 7 3 1 2 1 --- 9 4 81International Equity 10 3 --- 4 4 2 --- 3 --- 8 34International Small Cap --- 1 --- --- --- --- --- --- --- --- 1International/Global Equity 101 10 --- 8 --- 2 --- 2 --- 22 11 156Large Cap Core 97 6 --- 5 3 1 --- 3 2 21 15 153Large Cap Growth 107 21 --- 7 1 3 --- 2 2 30 12 185Large Cap Value 124 16 1 4 2 1 1 1 1 14 11 176Micro Cap Core 7 --- --- --- 3 --- --- --- --- 1 11Micro Cap Growth 8 --- --- --- --- --- --- 1 --- --- 2 11Micro Cap Value 7 1 --- --- --- --- --- --- --- --- 2 10Mid Cap Core 23 7 --- --- 1 --- --- --- 10 2 43Mid Cap Growth 29 11 --- 4 1 2 --- --- 10 3 60Mid Cap Value 33 9 --- --- 1 2 1 1 --- 2 1 50Other Equity 66 5 1 6 1 --- 1 2 --- 6 51 139Small Cap Core 56 6 --- 2 1 --- 1 --- 17 7 90Small Cap Growth 74 11 --- 8 3 1 --- 3 1 11 11 123Small Cap Value 85 10 --- 3 3 1 1 5 --- 4 3 115SMID Cap Core 15 3 --- --- 2 --- 1 1 --- 4 1 27SMID Cap Growth 36 1 --- 2 --- --- --- --- 6 4 49SMID Cap Value 22 --- --- 1 --- 2 --- 3 --- 2 1 31Grand Total 1,263 162 2 84 44 28 7 37 6 236 183 2,052
Exhibit 10
Changing the Face of the Investment Management IndustrySM | 23
Progress/SURS Portfolios
Exhibit 10

Changing the Face of the Investment Management IndustrySM | 24
All Cap Equity – Outperformed by 121 bps net (34.79 versus 33.57 for the Russell 3000 Index)
Fixed Income – Outperformed by 45 bps net (-1.57 versus -2.02 for the Barclays Capital U.S. Aggregate Index)
Non-U.S. Equity – Underperformed by 85 bps net (22.45 versus 23.30 for the MSCI EAFE Index); back in positive territory in 2014
2013 Performance Summary | equity, fixed income and internationalExhibit 10

Changing the Face of the Investment Management IndustrySM | 25
Asset Distribution | all cap equity
As of February 28, 2014
Manager Profile, Allocation, and Status:
Portfolio Manager Ownership Type Location ProductPortfolio Market
Value ($MM)% of
PortfolioPortfolio Status
Firm AUM ($MM)
% of Firm AUM
Fortaleza Asset Management, Inc. Latino American/Woman Owned Chicago, IL Large Growth 29.53 8.25 Monitor 199 14.82
Holland Capital Management African American Chicago, IL Large Growth 55.05 15.37 Good Standing 4,932 1.12
Vision Capital Management, Inc. Woman Owned Portland, OR Large Growth 38.44 10.73 Good Standing 1,074 3.58
Affinity Investment Advisors, LLC Asian American Irvine, CA Large Value 68.44 19.11 Good Standing 840 8.15
Herndon Capital Management African American Atlanta, GA Large Value 62.48 17.45 Monitor 10,210 0.61
Hahn Capital Management Woman Owned San Francisco, CA Mid Core 62.39 17.42 Good Standing 1,050 5.94
GW Capital, Inc. Asian American Bellevue, WA SMID Value 22.79 6.36 Good Standing 2,930 0.78
StoneRidge Investment Partners African American Malvern, PA Small Growth 18.95 5.29 Good Standing 1,013 1.87
Total Fund 358.09 100.00
Exhibit 10

Changing the Face of the Investment Management IndustrySM | 26
Fund Performance | all cap equity
As of February 28, 2014
Cumulative Performance (%):
Portfolio Manager Style 1 Month 3 Months 6 Months YTD 1 Year 3 Year 5 YearSince
InceptionInception
DateFortaleza Asset Management, Inc. L/G 5.34 4.99 18.20 2.86 30.24 14.91 22.78 8.50 05/01/2008
Russell 1000 Growth Index 5.15 5.07 17.84 2.15 29.14 15.06 24.02 9.33
Excess (+/-) Returns 0.19 -0.08 0.35 0.71 1.10 -0.15 -1.24 -0.83
Holland Capital Management L/G 5.60 5.36 17.16 2.29 27.52 15.16 --- 17.87 01/14/2010
Russell 1000 Growth Index 5.15 5.07 17.84 2.15 29.14 15.06 --- 18.04
Excess (+/-) Returns 0.45 0.29 -0.68 0.14 -1.62 0.10 --- -0.17
Vision Capital Management, Inc. L/G 5.34 6.32 14.96 1.99 --- --- --- 16.13 05/31/2013
Russell 1000 Growth Index 5.15 5.07 17.84 2.15 --- --- --- 19.66
Excess (+/-) Returns 0.19 1.25 -2.88 -0.16 --- --- --- -3.53
Affinity Investment Advisors, LLC L/V 4.88 4.00 16.76 1.25 --- --- --- 17.89 05/31/2013
Russell 1000 Value Index 4.33 3.17 13.49 0.63 --- --- --- 14.07
Excess (+/-) Returns 0.55 0.82 3.27 0.62 --- --- --- 3.83
Herndon Capital Management L/V 4.83 3.00 15.69 -0.16 23.43 14.23 25.32 10.24 05/01/2008
Russell 1000 Value Index 4.33 3.17 13.49 0.63 23.47 14.06 23.19 6.39
Excess (+/-) Returns 0.50 -0.18 2.21 -0.79 -0.04 0.17 2.13 3.86
Hahn Capital Management M/C 4.52 1.61 9.89 -0.50 27.24 16.50 --- 17.96 01/24/2011
Russell Midcap Index 5.87 6.90 17.66 3.81 29.11 15.06 --- 16.02
Excess (+/-) Returns -1.35 -5.29 -7.78 -4.30 -1.87 1.43 --- 1.94
GW Capital, Inc. SMID/V 4.84 4.11 14.74 0.96 25.82 14.42 28.15 10.90 05/01/2008
Russell 2500 Value Index 4.92 4.57 16.79 2.12 25.51 13.98 26.57 10.09
Excess (+/-) Returns -0.08 -0.46 -2.05 -1.16 0.31 0.44 1.58 0.81
StoneRidge Investment Partners S/G 5.61 3.87 20.11 2.19 --- --- --- 31.11 05/31/2013
Russell 2000 Growth Index 4.83 5.13 19.20 3.02 --- --- --- 24.94
Excess (+/-) Returns 0.78 -1.25 0.91 -0.83 --- --- --- 6.17
State Universities Retirement System of Illinois (GROSS) 5.04 3.93 15.34 1.09 27.47 14.29 23.17 8.41 05/01/2008
State Universities Retirement System of Illinois (NET) 5.04 3.81 15.07 1.09 26.87 13.76 22.60 7.91
Russell 3000 Index 4.74 4.11 15.83 1.43 26.74 14.59 23.87 8.13
Excess (+/-) Returns (GROSS) 0.30 -0.18 -0.49 -0.34 0.72 -0.30 -0.70 0.28
Excess (+/-) Returns (NET) 0.30 -0.30 -0.76 -0.34 0.13 -0.83 -1.27 -0.22
Annualized Returns*: Period Ending February 28, 2014
Source: Progress Investment M anagement Company, LLC. Note: Returns are final. (*) Annualized for periods 1 year and longer. The Net o f Fees returns prior to 2004 were based on the highest fee methodology. From 2004 and thereafter, the net returns are based on actual fees. Returns reflect the reinvestment o f dividends and earnings. Index performance includes the reinvestment o f dividends and earnings. Past performance is no guarantee of future results.
Exhibit 10

Changing the Face of the Investment Management IndustrySM | 27
Asset Distribution | fixed income
As of February 28, 2014
Manager Profile, Allocation, and Status:
Portfolio Manager Ownership Type Location ProductPortfolio Market
Value ($MM)% of
PortfolioPortfolio Status
Firm AUM ($MM)
% of Firm AUM
Garcia Hamilton & Associates, L.P Latino American/Woman Owned Houston, TX FI Core 13.40 11.67 Good Standing 3,387 0.40
Piedmont Investment Advisors, LLC African American Durham, NC FI Core 16.29 14.18 Good Standing 3 603.30
Ramirez Asset Management Latino American New York, NY FI Core 15.13 13.17 Good Standing 584 2.59
Ambassador Capital Management African American Detroit, MI FI Core Plus 23.39 20.37 Watch List 1,306 1.79
LM Capital Group, LLC Latino American San Diego, CA FI Core Plus 23.13 20.14 Good Standing 4,867 0.48
New Century Advisors, LLC Woman Owned Chevy Chase, MD FI Core Plus 23.51 20.47 Good Standing 1,752 1.34
Total Fund 114.85 100.00Note: Includes cash.
Source: Progress Investment M anagement Company, LLC
Exhibit 10

Changing the Face of the Investment Management IndustrySM | 28
Fund Performance | fixed income
As of February 28, 2014
Cumulative Performance (%):
Portfolio Manager Style 1 Month 3 Months 6 Months YTD 1 Year 3 Year 5 YearSince
InceptionInception
DateGarcia Hamilton & Associates, L.P FI/C 1.00 2.24 4.14 2.68 2.19 5.85 --- 6.33 10/20/2009
Barclays Capital U.S. Aggregate 0.53 1.44 2.85 2.02 0.16 3.84 --- 4.18
Excess (+/-) Returns 0.47 0.80 1.29 0.66 2.03 2.01 --- 2.16
Piedmont Investment Advisors, LLC FI/C 0.69 1.71 3.46 2.20 0.58 4.59 7.03 5.45 05/01/2008
Barclays Capital U.S. Aggregate 0.53 1.44 2.85 2.02 0.16 3.84 5.14 4.73
Excess (+/-) Returns 0.16 0.27 0.62 0.18 0.42 0.75 1.89 0.72
Ramirez Asset Management FI/C 0.58 1.83 3.27 2.14 --- --- --- 1.20 05/31/2013
Barclays Capital U.S. Aggregate 0.53 1.44 2.85 2.02 --- --- --- 0.88
Excess (+/-) Returns 0.05 0.40 0.42 0.12 --- --- --- 0.32
Ambassador Capital Management FI/C+ 0.54 1.78 2.85 2.43 0.44 4.06 6.18 6.04 05/01/2008
Barclays Capital U.S. Aggregate 0.53 1.44 2.85 2.02 0.16 3.84 5.14 4.73
Excess (+/-) Returns 0.01 0.35 0.01 0.41 0.28 0.22 1.04 1.31
LM Capital Group, LLC FI/C+ 1.03 1.60 3.85 2.16 1.01 5.04 7.28 5.81 05/01/2008
Barclays Capital U.S. Aggregate 0.53 1.44 2.85 2.02 0.16 3.84 5.14 4.73
Excess (+/-) Returns 0.50 0.16 1.01 0.14 0.84 1.20 2.14 1.08
New Century Advisors, LLC FI/C+ 0.87 2.06 3.81 2.42 1.16 4.93 6.77 6.10 05/01/2008
Barclays Capital U.S. Aggregate 0.53 1.44 2.85 2.02 0.16 3.84 5.14 4.73
Excess (+/-) Returns 0.34 0.63 0.97 0.41 0.99 1.09 1.63 1.37
State Universities Retirement System of Illinois - Fixed (GROSS) 0.78 1.84 3.54 2.32 0.96 4.79 6.68 5.96 05/01/2008
State Universities Retirement System of Illinois - Fixed (NET) 0.78 1.72 3.29 2.32 0.50 4.30 6.18 5.47
Barclays Capital U.S. Aggregate 0.53 1.44 2.85 2.02 0.16 3.84 5.14 4.73
Excess (+/-) Returns (GROSS) 0.25 0.40 0.69 0.30 0.80 0.95 1.54 1.23
Excess (+/-) Returns (NET) 0.25 0.28 0.44 0.30 0.33 0.46 1.04 0.74
Annualized Returns*: Period Ending February 28, 2014
Source: Progress Investment M anagement Company, LLC. Note: Returns are final. (*) Annualized for periods 1 year and longer. The Net o f Fees returns prior to 2004 were based on the highest fee methodology. From 2004 and thereafter, the net returns are based on actual fees. Returns reflect the reinvestment of dividends and earnings. Index performance includes the reinvestment o f dividends and earnings. Past performance is no guarantee of future results.
Exhibit 10

Changing the Face of the Investment Management IndustrySM | 29
Asset Distribution | non-U.S. equity
As of February 28, 2014
Manager Profile, Allocation, and Status:
Portfolio Manager Ownership Type Location ProductPortfolio Market
Value ($MM)% of
PortfolioPortfolio Status
Firm AUM ($MM)
% of Firm AUM
Hanoverian Capital, Inc. Woman Owned Kennett Square, PA Developed 18.23 10.36 Good Standing 228 8.01
Glovista Investments, LLC Asian American/Latino American Jersey City, NJ Emerging Markets 5.24 2.98 Good Standing 857 0.61
Brown Capital Management, Inc. African American Baltimore, MD International Equity 27.13 15.42 Good Standing 7,019 0.39
Cheswold Lane Asset Management, LLC Woman Owned West Conshohocken, PA International Equity 30.12 17.12 Good Standing 327 9.21
John Hsu Capital Group, Inc. Asian American New York, NY International Equity 18.75 10.66 Monitor 511 3.67
Sky Investment Counsel Inc. Asian American/Woman Owned Toronto, Ontario, International Equity 32.33 18.38 Watch List 1,747 1.85
Strategic Global Woman Owned Newport Beach, CA International Equity 43.96 24.99 Good Standing 562 7.82
Total Fund 175.91 100.00Note: Includes cash.
Source: Progress Investment M anagement Company, LLC
Exhibit 10
Changing the Face of the Investment Management IndustrySM | 30
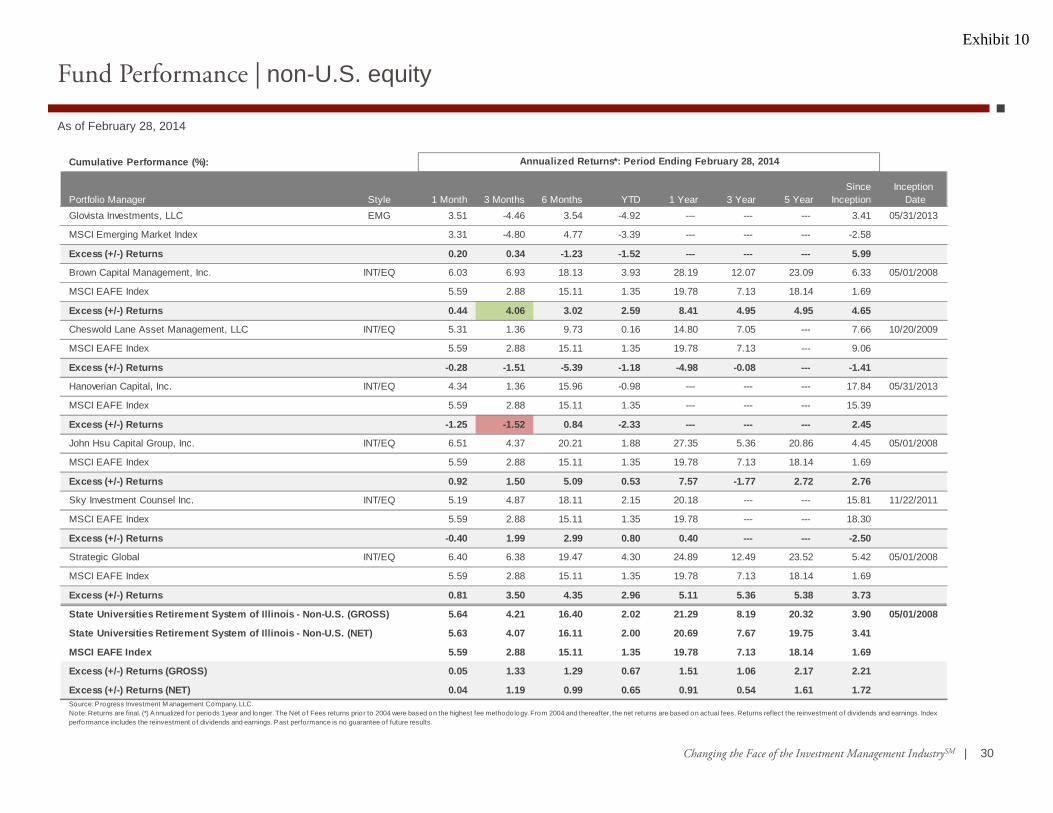
Fund Performance | non-U.S. equity
As of February 28, 2014
Cumulative Performance (%):
Portfolio Manager Style 1 Month 3 Months 6 Months YTD 1 Year 3 Year 5 YearSince
InceptionInception
DateGlovista Investments, LLC EMG 3.51 -4.46 3.54 -4.92 --- --- --- 3.41 05/31/2013
MSCI Emerging Market Index 3.31 -4.80 4.77 -3.39 --- --- --- -2.58
Excess (+/-) Returns 0.20 0.34 -1.23 -1.52 --- --- --- 5.99
Brown Capital Management, Inc. INT/EQ 6.03 6.93 18.13 3.93 28.19 12.07 23.09 6.33 05/01/2008
MSCI EAFE Index 5.59 2.88 15.11 1.35 19.78 7.13 18.14 1.69
Excess (+/-) Returns 0.44 4.06 3.02 2.59 8.41 4.95 4.95 4.65
Cheswold Lane Asset Management, LLC INT/EQ 5.31 1.36 9.73 0.16 14.80 7.05 --- 7.66 10/20/2009
MSCI EAFE Index 5.59 2.88 15.11 1.35 19.78 7.13 --- 9.06
Excess (+/-) Returns -0.28 -1.51 -5.39 -1.18 -4.98 -0.08 --- -1.41
Hanoverian Capital, Inc. INT/EQ 4.34 1.36 15.96 -0.98 --- --- --- 17.84 05/31/2013
MSCI EAFE Index 5.59 2.88 15.11 1.35 --- --- --- 15.39
Excess (+/-) Returns -1.25 -1.52 0.84 -2.33 --- --- --- 2.45
John Hsu Capital Group, Inc. INT/EQ 6.51 4.37 20.21 1.88 27.35 5.36 20.86 4.45 05/01/2008
MSCI EAFE Index 5.59 2.88 15.11 1.35 19.78 7.13 18.14 1.69
Excess (+/-) Returns 0.92 1.50 5.09 0.53 7.57 -1.77 2.72 2.76
Sky Investment Counsel Inc. INT/EQ 5.19 4.87 18.11 2.15 20.18 --- --- 15.81 11/22/2011
MSCI EAFE Index 5.59 2.88 15.11 1.35 19.78 --- --- 18.30
Excess (+/-) Returns -0.40 1.99 2.99 0.80 0.40 --- --- -2.50
Strategic Global INT/EQ 6.40 6.38 19.47 4.30 24.89 12.49 23.52 5.42 05/01/2008
MSCI EAFE Index 5.59 2.88 15.11 1.35 19.78 7.13 18.14 1.69
Excess (+/-) Returns 0.81 3.50 4.35 2.96 5.11 5.36 5.38 3.73
State Universities Retirement System of Illinois - Non-U.S. (GROSS) 5.64 4.21 16.40 2.02 21.29 8.19 20.32 3.90 05/01/2008
State Universities Retirement System of Illinois - Non-U.S. (NET) 5.63 4.07 16.11 2.00 20.69 7.67 19.75 3.41
MSCI EAFE Index 5.59 2.88 15.11 1.35 19.78 7.13 18.14 1.69
Excess (+/-) Returns (GROSS) 0.05 1.33 1.29 0.67 1.51 1.06 2.17 2.21
Excess (+/-) Returns (NET) 0.04 1.19 0.99 0.65 0.91 0.54 1.61 1.72
Annualized Returns*: Period Ending February 28, 2014
Source: Progress Investment M anagement Company, LLC. Note: Returns are final. (*) Annualized for periods 1 year and longer. The Net o f Fees returns prior to 2004 were based on the highest fee methodology. From 2004 and thereafter, the net returns are based on actual fees. Returns reflect the reinvestment of dividends and earnings. Index performance includes the reinvestment o f dividends and earnings. Past performance is no guarantee of future results.
Exhibit 10

Changing the Face of the Investment Management IndustrySM | 31
1. The calculation of returns is computed monthly for each composite, including the reinvestment of dividends and interest, and all cash reserves. Both dividends and interest are accrued withvaluation of securities based on trade-date. Monthly or quarterly returns for each composite are an asset-weighted composite of all discretionary accounts managed (including any terminatedaccounts) under that strategy.
2. Performance is Gross of Fees unless otherwise noted. Gross of Fees performance is calculated after the deduction of trading expenses, but does not reflect the deduction of management fees,custodial fees, or other fees.
3. Net of Fees performance is calculated as Gross of Fees less the management fees (and sub-advisor fees,) but before the deduction of custodial or other fees. Progress' management fees aredescribed in our Form ADV.
4. The index returns include reinvestment of dividend income, but do not reflect the deduction of any transaction costs or management costs that would be involved in investing in the indices - theeffect of these costs would be to lower the indicated index returns by an undetermined amount.
5. A complete list of Progress' composites, composite descriptions, and performance results is available upon request.
6. The definition of "firm" as used to determine Progress' total assets is the entirety of fee based assets managed under Progress.
7. All composites are representative of five or fewer portfolios.
8. All dollar figures in this presentation are expressed in U.S. dollars.
9. Past performance is not necessarily indicative of future results.
Example of impact of fees on gross performance of 20% annually, compounded over one (1), three (3), and five (5) years with quarterly fee payment:
In one-on-one presentations, Progress Investment Management Company may present performance returns gross of fees. Fees will reduce the returns of a client portfolio. Fees for the [ABC]strategy are generally [AMT] percent per annum. The fee schedule contained in Progress' Form ADV-Part II is available upon request. As an example, the effect of investment management feeson the total value of a client’s portfolio assuming (a) $1 million investment, (b) portfolio return of 10% a year, and (c) 0.91% annual investment advisory fee would be $10,010 in the first year andcumulative effects of $59,905.76 over 5 years and $152,073.97 over ten years. Actual investment advisory fees incurred by clients may vary based on portfolio size, fees, and performancereturns.
Progress Investment Management Company, LLC (“Progress”) claims compliance with the Global Investment Performance Standards. The GIPS® standards were promulgated by the CFA Instituteas the industry standard for performance calculation and reporting. Progress’ compliance with the GIPS® standards has been verified for the period from January 1, 2005 throughDecember 31, 2012 by Ashland Partners & Company LLP.
Verification assesses whether (1) the firm has complied with all the composite construction requirements of the GIPS standards on a firm-wide basis and (2) the firm’s policies and procedures aredesigned to calculate and present performance in compliance with the GIPS standards. Verification does not ensure the accuracy of any specific composite presentation. The verification report(s) areavailable upon request.
ACTUAL INVESTMENT ADVISORY FEES MAY VARY BASED ON PORTFOLIO SIZE, INVESTMENT STRATEGY, ASSET CLASS, CUSTODIANFEES AND PERFORMANCE RETURNS.PAST PERFORMANCE DOES NOT GUARANTEE FUTURE RESULTS.
Disclosure Statement Exhibit 10

Changing the Face of the Investment Management IndustrySM | 32
Professional Biographies
Exhibit 10
Changing the Face of the Investment Management IndustrySM | 33
Thurman V. White, Jr. » President and Chief Executive Officer (1992)Thurman is responsible for the vision and values of Progress, as well as leadership to achieve all the firm’s operational, financial and strategic goals. He chairs the Management Committee and serves as a voting member of theInvestment Committee. From 1992 to 1994, Thurman served as chief operating officer of Progress, with day-to-day oversight of the firm’s operations, and he was responsible for developing and maintaining several key clientrelationships during a time of rapid business growth. From 1994 to 2001, Thurman served as managing director, where he took on a variety of senior leadership responsibilities, including product development, new businessdevelopment and client retention. He served as the firm’s product manager, leading its private-equity fund-of-funds strategy for investment in emerging private-equity partnerships. In 2000, he led the firm’s effort on behalf of CalPERS tomanage a $40 million venture capital fund making direct investment in emerging investment management firms, and placing assets to manage with those firms from a $1 billion pool. In 2001, Thurman was named president of Progress.In 2004, he guided senior management as it teamed with an outside investor in a successful management buyback of the firm, at which time he also became CEO. Since the management buyback, Thurman has piloted the firm as ithas continued its steady growth in assets under management, expanded the firm’s employee ownership and implemented a values-centric leadership model. Thurman has had previous line management and operating companyexperience with profit/loss responsibility, as well as public policy experience at the state legislative and federal agency levels. Thurman earned a bachelor of arts in public and international affairs from the Woodrow Wilson School atPrinceton University, a master’s degree in communications from Stanford University and a law degree from Boalt Hall, University of California, Berkeley. He has been a member of the California Bar since 1981.
Alex Hsiao » Chief Investment Officer (2006)Alex leads the investment team, overseeing all investment and fund-related activities at Progress, including quantitative evaluation, monitoring of manager performance, portfolio monitoring and analysis, manager selection andcommunication. He chairs the Investment Committee and is a voting member. He is also a member of the Management Committee. Prior to joining Progress, he served as the treasurer and chief investment officer of TheCalifornia Endowment in Los Angeles. While there, he managed a portfolio of approximately $4 billion in various traditional equity, fixed-income and alternative investment strategies. Prior to his work with The CaliforniaEndowment, Mr. Hsiao worked for Bankers Trust in Hong Kong, where he managed a staff of 10 and served as a risk management analyst. Later, as vice president of Fixed Income, he managed a $2 billion proprietary debtportfolio focused on undervalued assets throughout Asia. Alex earned a bachelor of science in managerial economics from the University of California, Davis and a master of business administration from the University ofCalifornia, Irvine.
Jose Balagot » Deputy Chief Investment Officer (1996)As a member of the firm's Portfolio Management team, Jose leads the firm's manager research function and is involved in client portfolio construction, monitoring and rebalancing. He is a voting member of the InvestmentCommittee and a member of the Management Committee. Prior to joining Progress, Jose was an international equity analyst for Bailard, Biehl and Kaiser, where he was responsible for database design, returns forecasting,performance measurement, attribution analysis and asset allocation modeling. Previously, he was an economic consultant for DRI/McGraw-Hill, building econometric forecasting models and market planning systems for Fortune500 companies. Jose earned both bachelor of arts and master of science degrees in economics at the University of California, Santa Cruz.
Mona S. Williams » Executive Vice President (2000)Mona is responsible for the creation and implementation of new business development strategies, with specific emphasis on plan sponsors in the public, corporate and foundation/endowment areas nationwide. Under herleadership, her team develops all new client relationships and manages the firm’s existing client and consultant relationships. Mona is a member of the Progress Board of Directors, serves on the Management Committee and isa voting member of the Investment Committee. Prior to joining Progress, she was director of marketing for Albriond Capital Management, where she was responsible for new business development, client service and clientretention. She also served as the director of marketing for Capital Insight Brokerage. Her earlier experience includes positions in the institutional equities department of Bear Stearns and in the retail division of Merrill Lynch. Monaearned a bachelor of arts degree from the University of California, Berkeley. She is a board member of the National Association of Securities Professionals.
Beverly Pasley-Harrison » Chief of Administration and Operations (1999)Beverly oversees the Compliance, Administration and Operations functions of the firm. She is a current member of the Management Committee. Beverly has extensive experience in the financial services industry. She began her careerworking on the institutional-trading desk at Bateman Eichler, Hill Richards in Southern California, which resulted in a relationship with a major asset management firm in northern California. She eventually left Los Angeles to pursue whatbecame a 10-year-long tenure in San Francisco with RCM Capital Management as a portfolio and research assistant. Subsequently, she joined Harris Bretall Sullivan & Smith as its director of operations, Gardner Rich & Co. asmanaging director and Cazenave & Co. as vice president and principal. Beverly earned a bachelor of science degree in business administration at the California State University, Long Beach. Beverly is a member of the Societyand Corporate Compliance and Ethics.
Rita Cai » Senior Vice President, Finance (2004)Rita is responsible for all finance and accounting operations at Progress, including financial planning, internal controls and treasury functions. She is also heavily involved with both clients and sub managers regarding fees,contracts and other financial arrangements. Rita is a member of the Management Committee. Prior to joining Progress, Rita was a senior finance manager at Outsource, a venture investment company focused on infrastructuredevelopment projects in Asia. Previously, she was director of operations for Global Vision Technology, where she made a major contribution to the development and growth of a venture capital subsidiary during her nine yearswith the company. Prior to moving to the U.S., she worked as director of administration for the five-star Holiday Inn Yangtze Hotel, where she managed a staff of 15 and was responsible for budgeting and cost accounting. Ritaearned a bachelor of science degree in finance from Chongqing University and a master of business administration degree in finance and accounting from Regis University.
Professional Biographies | executive leadershipExhibit 10

Changing the Face of the Investment Management IndustrySM | 34
Safia B. Mehta, CFA » Senior Vice President & Portfolio Manager (2014)As a member of the firm’s investment team, Safia is responsible for managing client portfolios, including portfolio construction, manager evaluation, monitoring performance and rebalancing. Prior to joining Progress, Safia was aprincipal at North Point Advisors, where she was a member of the investment committee and responsible for all aspects of portfolio management utilizing emerging sub-advisors across various asset classes. Safia has over 22years of investment management experience which includes oversight of over $20 billion in assets for institutional pension plans invested across many asset classes with over 100 sub-advised strategies at Prudential Financialand management of over $5 billion in pension assets for PepsiCo. Safia graduated with a bachelor of arts from the University of Toronto, Canada and holds the Chartered Financial Analyst (CFA) designation. Currently she is theVP, Chair of University Relations and Advocacy for the CFA Society of Stamford, Connecticut. She regularly speaks at investment industry conferences.
Laura K. Nickols » Vice President, Investments (1993)Laura is responsible for conducting research on funded and prospective managers, preparing research reports and making manager recommendations. Furthermore, she assists in the monitoring, analysis and evaluation offunded accounts. Laura is a voting member of the Investment Committee. Prior to joining Progress, she was a senior analyst at the University of California, Berkeley, in the Benefit Programs department. Previously, she was aconsultant/analyst at William M. Mercer Asset Planning, where she was responsible for investment style analysis, asset allocation studies, manager search/analysis, and performance measurement and evaluation. She began herinvestment career at Callan Associates as an investment analyst. Laura earned a bachelor of arts degree from the University of California, Santa Cruz, and a master of business administration degree in finance from GoldenGate University.
Justin Eagan, CFA » Vice President, Investments (2012)Justin is responsible for conducting manager research on funded and prospective managers specializing in large and small cap domestic equity strategies. His primary focus is to find promising emerging manager strategies forthe Progress platform and to monitor and manage a portfolio of our funded managers. Prior to joining Progress, Justin was Vice President and Senior Investment Manager Research Analyst at Morgan Stanley Smith Barneywhere he performed research and due diligence on mutual funds and separately managed accounts for Morgan Stanley's retail wrap channel investment programs covering domestic/global/international equity, fixed income andreal estate securities strategies. Previously, he was at Deutsche Bank and JP Morgan as a Product Manager and Portfolio Associate. He began his career at Morgan Stanley Dean Witter. Justin earned a master of businessadministration in finance from St. John’s University and a bachelor of science degree in accounting from Southern Connecticut State University. Justin is a CFA charter holder.
Christina Wang, CFA » Assistant Vice President and Associate Portfolio Manager (2009)Christina is responsible for manager sourcing, research and monitoring, performance measurement and evaluation, portfolio analytics, risk analysis, and research tools development. Prior to joining Progress, she was a DatabaseManager and Research Analyst at Freeman Associates Investment Management. She was responsible for database construction and monitoring, quantitative model analysis and research projects. Before joining Freeman,Christina worked at the Business and Economic Research Center at Middle Tennessee State University. She was responsible for the modeling of local economic leading indicators and other regional economic projects. Christinaearned a master of economics degree from Middle Tennessee State University and a bachelor of arts degree in finance from Southwest University of Finance and Economics. Christina is currently pursing a PhD in economics atMiddle Tennessee State University and is a CFA charter holder.
Tung Ming » Senior Research Analyst (2001)Tung is responsible for assisting and supporting the Progress Investment team with respect to manager research and portfolio analytics. Prior to serving as an Investment Analyst, Tung was a Portfolio Accountant with Progresswhere he was responsible for fund accounting, calculating performance and monitoring compliance. Tung earned a bachelor of arts degree in finance from the University of Maryland at College Park.
Janice M. Osugi, CFA » Senior Research Analyst (2012)Janice is responsible for manager sourcing, research and monitoring, and supporting the analysis and evaluation of funded accounts. Janice has over 13 years of investment management and financial services experience. Priorto joining Progress, she was senior investment analyst for the Jewish Community Federation where she performed key roles in investment evaluation and oversight, promoting fiduciary best-practices for $3 billion assets. Beforethe JCF, she spent eight years at Credit Suisse Private Banking where she was responsible for investment analysis, asset allocation, risk modeling, and performance measurement for her clients. Janice earned a bachelor of artsdegree in economics from the University of California at Berkeley and is a CFA charter holder.
Ronald M. Aubert II » Research Analyst (2013)Ron is responsible for assisting and supporting the Investment team’s manager sourcing, research and monitoring, portfolio analytics, and risk analysis efforts. Prior to joining Progress, Ron was a Junior Equity Research Analyst at FiduciaryManagement Associates, LLC where he performed research on the consumer discretionary and technology industries for the firm’s small and mid-capitalization products. Prior to his tenure with Fiduciary Management Associates, Ron was anInvestment Banking Senior Analyst at Merrill Lynch & Co. where he focused on capital structure optimization for clients in the technology industry. Ron began his career at Ernst & Young, LLP as a Risk Advisory Associate. Ronald earned twobachelor of science degrees in accounting and business administration – corporate finance from the University of Southern California and a master of business administration degree with concentrations in economics, behavioraleconomics, finance, and entrepreneurship from The University of Chicago Booth School of Business.
Andrew Finver » Director of Hedge Fund Research (2013)Andrew is responsible for leading the research and manager sourcing for the firm’s Hedge Fund platform. Andrew is involved with the selection and portfolio construction with regards to emerging hedge funds. Andrew has over14 years of experience, most recently as the director of US research for The Torrey Funds, an emerging manager fund of funds. At Torrey, Andrew was a partner, served on the Investment Committee, and helped triple the firm’sAUM. Prior to Torrey, Andrew was an analyst at Valenzuela Capital Partners and an associate in GE Capital’s Structured Finance Group. He started his career in HSBC’s merger & acquisitions team. Andrew earned a bachelorof arts degree in political studies/ psychology from Pitzer College in Claremont, CA, and a masters in international affairs from Columbia University.
Professional Biographies | investmentsExhibit 10

Changing the Face of the Investment Management IndustrySM | 35
Adrienne E. Gaines » Senior Vice President, Strategic Client Relations and Marketing (2010)Adrienne is responsible for strategic relationship management and business development in the public fund market. Additionally, she works with the Progress team on sales strategy, new product development, and theestablishment of new distribution channels, namely Taft-Hartley. Prior to joining Progress, Adrienne was founder and Managing Member of AMA Advisors, an independently-owned strategic advisory and consulting firm directedtoward investment managers. From 2001 to 2007, Adrienne was a partner at the Yucaipa Companies where she held a variety of leadership positions. Before Yucaipa, Adrienne was a Managing Director at Pacific CorporateGroup, a private equity advisory and investment management firm. Adrienne has over 25 years of experience in investor relations, corporate affairs, marketing and business development. She has been professionally active inthe investment community her entire career and has developed an extensive global network in the institutional investment industry.
Marcus L. Alexis » Senior Vice President, Marketing & Client Service (2013)Marcus is responsible for strategic relationship management and business development in the endowment, foundation and corporate markets. Additionally, he works with the Progress team on sales strategy, new productdevelopment, and the establishment of new distribution channels. Prior to joining Progress, Marcus was a director of relationship management at Bank of Montreal Asset Management. Prior to his work at Bank of Montreal,Marcus managed the private equity fund-of-funds client service team at Russell Investments; managed the western region consultant relations effort for Wellington Management Company and held business development roles atAllianz Global Investors and Bankers Trust Company. Overall, Marcus has 20 years of experience in institutional business development, client service and consultant relations. In addition to his work with U.S. based investors,he has experience marketing and servicing plan sponsors and consultants domiciled in Canada, the U.K., the Caribbean and Australia. Marcus earned a bachelor of arts degree from Stanford University and a master of businessadministration degree from the Kellogg School of Management at Northwestern University.
Jason Miles » Vice President, Strategy (2013)Jason is responsible for enhancing the firm’s overall growth strategy via the marketing and client service group including positioning, product development, research and process improvement. Jason has over 16 years ofexperience executing global growth strategies for both private and public companies. He has significant experience in investment banking and capital market transactions including private placements, mergers, acquisitions, andjoint ventures. Prior to joining Progress, Jason was vice president of mergers and acquisitions at Bank of America where he focused on corporate development transactions involving large financial institutions and serviceproviders. Previously, Jason was a senior associate and founding member of Viant Capital, where he focused on transaction execution for emerging growth clients and strategic acquirers. Before Viant Capital, he was anassociate and founding member of the Private Equity Placements Group at Banc of America Securities. Jason began his career as an analyst in the Private Capital Markets Group at Robertson Stephens. In the aggregate, Jasonhas closed over 90 strategic capital transactions totaling over $7 billion. Jason earned a bachelor of arts degree in corporate finance from Morehouse College where he was a Roothbert Scholar and a master of businessadministration degree with concentrations in finance and entrepreneurial management from The Wharton School, University of Pennsylvania.
Linda D. Cornett » Assistant Vice President, Marketing and Client Service (2004)Linda is responsible for all aspects of internal client service. Linda’s team ensures that all client and consultant reports are delivered accurately and on time. She is responsible for completing Requests for Proposals, assistingwith the production of marketing materials, client presentations and updating commercial databases. Prior to joining Progress, Linda spent 13 years at State Street Corporation where she was an assistant vice president, clientrelationship management. Linda is a founding member and current acting president of the National Association of Securities Professionals, San Francisco Chapter. Linda earned a bachelor of science degree in businessadministration from the University of Phoenix.
Professional Biographies | marketing and client serviceExhibit 10
Changing the Face of the Investment Management IndustrySM | 36
Sabrina Brutus, CCEP » Vice President, Operations and Manager Compliance (2011)Sabrina is responsible for ensuring that the company’s middle office operations and manager compliance procedures are rigorously applied in order to prevent violations of client guidelines and federal securities laws. She worksclosely with Investments, Marketing and Client Service, Finance and the CCO to mitigate operational risk for both the company and the managers. She is also responsible for monitoring legal and ethical business practices asdefined by the SEC and other governing bodies. Prior to joining Progress, Sabrina served as chief compliance officer at Bivium Capital Partners, where she was responsible for leading the firm’s compliance efforts, includingdesigning and implementing internal controls, policies and procedures to assure compliance with applicable local, state and federal laws and regulations and third-party guidelines; administering the Code of Ethics; monitoringsub-advisers for compliance with portfolio and client investment guidelines; conducting compliance training; performing initial and continuing due diligence of sub-advisers, including on-site visits; managing audits andinvestigations into regulatory and compliance issues; and responding to requests for information from regulatory bodies. Sabrina was also responsible for the daily operations of the firm. Sabrina earned a bachelor of arts degreein english with a concentration in business administration from Rutgers, The State University of New Jersey. She is a member of the National Association of Securities Professionals, the National Society of ComplianceProfessionals, the Society of Corporate Compliance and Ethics, and is a Certified Compliance and Ethics Professional.
Hilda Wong » Vice President, Fund Administration (2005)Hilda primarily focuses on all aspects of investment operations, including fund account reconciliation, performance calculation and maintenance of fund transition in the accounting system. She also acts as a liaison betweenProgress, sub managers and custodians. Prior to Progress, she spent eight years in managing portfolio accounting and performance evaluation for the high-net-worth-individual accounts of Shuman & Schneider InvestmentCounsel. She then moved to Kaspick & Company (a subsidiary of TIAA-CREF) to serve as a portfolio-reporting analyst. Responsible for trust accounting, client appraisal and performance reporting for the planned-giving servicesof colleges, universities and other non-profits and foundations. She has been in the investment portfolio/fund accounting business since 1993, beginning her career as an operations analyst with The Boston Company AssetManagement, (a subsidiary of Mellon Financial Corporation). Afterwards, she joined Gamboa & Company as a portfolio accountant, providing support of daily trading, monthly reconciliation, appraisal, performance and capitalgains reporting of individual accounts. Hilda earned a bachelor of science degree in business administration and accounting from San Francisco State University.
Richa Sharma » Vice President, Information Technology (2006)Richa is responsible for all of the information technology-related initiatives at Progress, including projects and operations. Richa provides technical design and architecture guidance, as well as management for information-technology projects.Richa has vast experience in software development; she has led a variety of complex software projects for large, multinational organizations. Her core strengths include software-requirements design anddevelopment; configuration management; project management; and quality management. Richa earned a bachelor of science degree in mathematics and a master of computer applications degree, both at Himachal PradeshUniversity in India.
Professional Biographies | operations and complianceExhibit 10

Changing the Face of the Investment Management Industrysm | 37Copyright © 2014 Progress Investment Management Company, LLC. All rights reserved. No part of this collateral may be reproduced or transmitted in any form or by any means, electronic or mechanical, including photocopying, recording or by any information storage and retrieval system, without the written permission of Progress Investment Management Company, LLC except where permitted by law.
San Francisco Office33 New Montgomery Street, 19th FloorSan Francisco, CA 94105
415. 512. 3480
415. 512. 3475
www.progressinvestment.com
Progress
Exhibit 10