managing capacity and demand mcgraw-hill/irwin copyright © 2011 by the mcgraw-hill companies, inc....
Post on 20-Dec-2015
215 views
TRANSCRIPT

Managing Capacity and Demand
McGraw-Hill/Irwin Copyright © 2011 by The McGraw-Hill Companies, Inc. All rights reserved.
Learning Objectives Describe the strategies for matching
capacity and demand for services. Recommend an overbooking strategy. Use Linear Programming to prepare a
weekly workshift schedule. Prepare a work schedule for part-time
employees. Explain what yield management is and
how it is applied.
11-2

Level Capacity and Chase Demand
Strategic Dimension Level Capacity Chase Demand
Customer Waiting Generally Low Moderate
Employee Utilization Moderate High
Labor-skill Level High Low
Labor Turnover Low High
Training Required per Employee High Low
Working Conditions Pleasant Hectic
Supervision Required Low High
Forecasting Long-run Short-run
11-3

Strategies for Matching Capacity and Demand for Services
MANAGINGDEMAND
PartitioningdemandDeveloping
complementaryservices
Establishingprice
incentivesDevelopingreservationsystems
Promoting off-peakdemand
Yieldmanagement
MANAGINGCAPACITY
Cross-training
employees
Increasingcustomer
participationSharingcapacity
Schedulingwork shifts
Creatingadjustablecapacity
Usingpart-time
employees
11-4
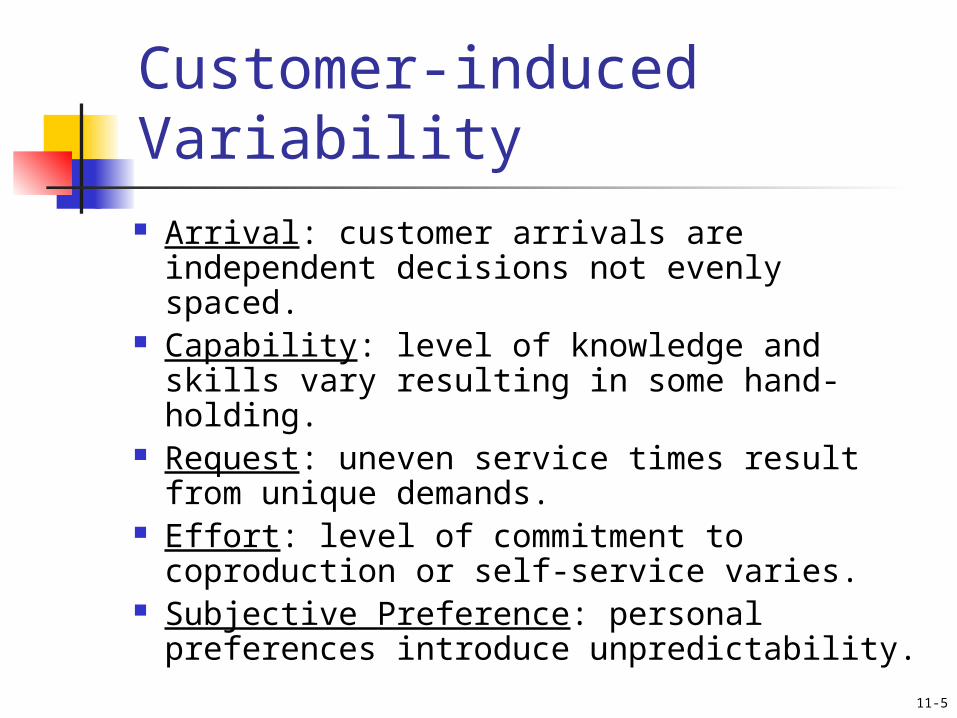
Customer-induced Variability Arrival: customer arrivals are
independent decisions not evenly spaced.
Capability: level of knowledge and skills vary resulting in some hand-holding.
Request: uneven service times result from unique demands.
Effort: level of commitment to coproduction or self-service varies.
Subjective Preference: personal preferences introduce unpredictability.
11-5

Strategies for ManagingCustomer-induced Variability
Type of Variability
Accommodation Reduction
Arrival Provide generous staffing Require reservations
Capability Adapt to customer skill levels
Target customers based on capability
Request Cross-train employees Limit service breadth
Effort Do work for customers Reward increased effort
SubjectivePreference
Diagnose expectations and adapt
Persuade customers to adjust expectations
11-6

Segmenting Demand at a Health Clinic
0
20
40
60
80
100
120
140
Mon. Tue. Wed. Thur. Fri.
BeforeSmoothingAfterSmoothing
Smoothing Demand by AppointmentScheduling
Day Appointments
Monday 84Tuesday 89Wednesday 124Thursday 129Friday 114
11-7

Discriminatory Pricing for Camping
Experience No. of Daily
Type Days and weeks of camping season Days Fee 1 Saturdays and Sundays of weeks 10 to 15, plus 14 $6.00 Dominion Day and civic holidays 2 Saturdays and Sundays of weeks 3 to 9 and 15 to 19, 23 2.50 plus Victoria Day 3 Fridays of weeks 3 to 15, plus all other days of weeks 43 0.50 9 to 15 that are not in experience type 1 or 2 4 Rest of camping season 78 free
EXISTING REVENUE VS PROJECTED REVENUE FROM DISCRIMINATORY PRICING
Existing flat fee of $2.50 Discriminatory fee Experience Campsites Campsites Type occupied Revenue occupied (est.)
Revenue 1 5.891 $14,727 5,000 $30,000 2 8,978 22,445 8,500 21,250 3 6,129 15,322 15,500 7.750 4 4,979 12,447 …. ….Total 25,977 $ 64,941 29,000 $59,000
11-8

Hotel Overbooking Loss Table
Number of Reservations Overbooked
No- Prob-shows ability 0 1 2 3 4 5 6 7 8
90 .07 0 100 200 300 400 500 600 700 800 9001 .19 40 0 100 200 300 400 500 600 700 8002 .22 80 40 0 100 200 300 400 500 600 7003 .16 120 80 40 0 100 200 300 400 500 6004 .12 160 120 80 40 0 100 200 300 400 5005 .10 200 160 120 80 40 0 100 200 300 400 6 .07 240 200 160 120 80 40 0 100 200 300 7 .04 280 240 200 160 120 80 40 0 100 200 8 .02 320 280 240 200 160 120 80 40 0 100 9 .01 360 320 280 240 200 160 120 80 40 0 Expected loss, $ 121.60 91.40 87.80 115.00 164.60 231.00 311.40 401.60 497.40
560.00
11-9

Daily Scheduling ofTelephone Operator Workshifts
0
5
10
15
20
25
30
Time
Num
ber o
f ope
rato
rs
Scheduler program assigns tours so that the number of operators present each half hour adds up to the
number required
Topline profile
12 2 4 6 8 10 12 2 4 6 8 10 12
Tour
0
500
1000
1500
2000
2500
Time
Cal
ls
12 2 4 6 8 10 12 2 4 6 8 10 12
11-10

LP Model for Weekly Workshift Schedule with Two Days-off Constraint
Objective function: Minimize x1 + x2 + x3 + x4 + x5 + x6 + x7
Constraints: Sunday x2 + x3 + x4 + x5 + x6
3 Monday x3 + x4 + x5 + x6 + x7 6
Tuesday x1 + x4 + x5 + x6 + x7 5
Wednesday x1 + x2 + x5 + x6 + x7 6 Thursday x1 + x2 + x3 + x6 + x7 5 Friday x1 + x2 + x3 + x4 + x7
5 Saturday x1 + x2 + x3 + x4 + x5 5
xi 0 and integer
Schedule matrix, x = day off
Nurse Su M Tu W Th F Sa 1 x x … … … … ... 2 … x x … … … … 3 … ... x x … … … 4 … ... x x … … … 5 … … … … x x … 6 … … … … x x … 7 … … … … x x … 8 x … … … … … xTotal 6 6 5 6 5 5 7Required 3 6 5 6 5 5 5Excess 3 0 0 0 0 0 2
11-11

Scheduling Part-time Bank Tellers
Objective function:Minimize x1+ x2+x3+x4+x5+x6+x7
Constraints: Sunday x2+x3+x4+x5+x6 b1
Monday x3+x4+x5+x6+x7 b2
0
1
2
3
4
5
6
7
Tel
lers
req
uire
d
Mon. Tues. Wed. Thurs. Fri.
Two Full-time Tellers
54
1
32
1
432 1
5 2
Fri. Mon. Wed. Thurs Tues. 0
1
2
3
4
5
Te
llers
re
qu
ired
Decreasing part-time teller demand histogram
DAILY PART-TIME WORK SCHEDULE, X=workday
Teller Mon. Tues. Wed. Thurs. Fri. 1 x …. x …. x 2 x …. …. x x 3,4 x …. …. …. x 5 …. …. x …. x
11-12

Ideal Characteristics for Yield Management
Relatively Fixed Capacity Ability to Segment Markets Perishable Inventory Product Sold in Advance Fluctuating Demand Low Marginal Sales Cost and High
Capacity Change Cost
11-13

Q
P
Price
Quantity
Consumer Surplus
Seats Available
Demand Curve
Airline Pricing for a Coach SeatTraditional Fixed Price
Total Revenue = PQ
11-14

Price
Quantity
P1
P2
P3
Q1 Q2 Q3
Consumer Surplus
Advanced
Purchase
Internet
Special
FullCoach
Demand Curve
Seats Available
Airline Pricing for a Coach SeatMultiple Pricing Using Yield Management
Total Revenue = P1Q1 + (Q2-Q1)P2 + (Q3-Q2)P3
11-15

Seasonal Allocation of Rooms by Service Class for Resort Hotel
First class
Standard
Budget
Per
cent
age
of c
apac
ity a
lloca
ted
to d
iffer
ent s
ervi
ce c
lass
es
60%
50%30%
20%
50%
Peak Shoulder Off-peak Shoulder (30%) (20%) (40%) (10%)Summer Fall Winter Spring
Percentage of capacity allocated to different seasons
30%20% 20%
10% 30%
50% 30%
11-16

Demand Control Chart for a Hotel
0
50
100
150
200
250
300
350
1 5 9 13 17 21 25 29 33 37 41 45 49 53 57 61 65 69 73 77 81 85 89
Days before arrival
Rese
rvat
ions
Expected Reservation Accumulation
2 standard deviation control limits
11-17

Yield Management Using the Critical Fractile Model
P d xC
C C
F D
p Fu
u o
( )( )
Where x = seats reserved for full-fare passengers d = demand for full-fare tickets p = proportion of economizing (discount) passengers Cu = lost revenue associated with reserving one too few seatsat full fare (underestimating demand). The lost opportunity is the difference between the fares (F-D) assuming a passenger, willingto pay full-fare (F), purchased a seat at the discount (D) price. Co = cost of reserving one to many seats for sale at full-fare(overestimating demand). Assume the empty full-fare seat wouldhave been sold at the discount price. However, Co takes on twovalues, depending on the buying behavior of the passenger whowould have purchased the seat if not reserved for full-fare. if an economizing passenger if a full fare passenger (marginal gain)
Expected value of Co = pD-(1-p)(F-D) = pF - (F-D)
CD
F Do
( )
11-18

Topics for Discussion What organizational problems can arise from the use
of part-time employees? How can computer-based reservation systems
increase service capacity utilization? What possible dangers are associated with
developing complementary services? Will the widespread use of yield management
eventually erode the concept of fixed prices? Go to http://en.wikipedia.org/wiki/Yield_management
and discuss the ethical issues associated with yield management.
11-19

Interactive Exercise
Watch the PowerPoint presentation concerning the overbooking experience at the Doubletree Hotel in Houston, Texas. How could this situation been handled differently?
11-20