mangrove dynamics in west africa - altwym.nl · giri et al. (2010) 2000 13776000 spalding, kainuma...
TRANSCRIPT

Mangrove dynamics in West Africa
commissioned by
Fondation MAVA, Gland, Suisse
A&W-report 2029


A&W-report 2029 Mangrove dynamics in West Africa
Mangrove dynamics in West Africa
A&W-report 2029
L. Zwarts

A&W-report 2029 Mangrove dynamics in West Africa
Cover photograph
Mangroves on Ilha de Caiar (15-12-2009; 11.245ºN, 15.390ºW), between Rio Tombali and Rio Cumbiiã, Guinea-
Bissau. Photo: Leo Zwarts
L. Zwarts 2014
Mangrove dynamics in West Africa . A&W-report 2029
Altenburg & Wymenga ecologisch onderzoek, Feanwâlden, The Netherlands
Commissioned by
Fondation MAVA
Rue Mauverney, 28
1196 Gland
Switzerland
Tel : +41 (0)21 544 16 00
Fax : +41 (0)21 544 16 16
Email : [email protected]
Realised by
Altenburg & Wymenga
ecologisch onderzoek bv
P.O.box 32
9269 ZR Feanwâlden,
The Netherlands
Tel +31 511 47 47 64
Fax +31 511 47 27 40
www.altwym.nl
Project number Project leader Status
2131man E. Wymenga Final
Authorisation Autograph Date
Approved E. Wymenga 30-6-2014

A&W-report 2029 Mangrove dynamics in West Africa
Contents
1 Introduction 1
1.1 A world without mangrove? 1
1.2 Aims of this study 2
1.3 Acknowledgements 3
2 Methods 5
2.1 Available mangrove data layers 5
2.2 Tree cover on seven study sites 6
3 Results 11
3.1 Comparison per site 11
3.2 Comparison of methods 13
3.3 Are mangroves in West Africa in decline? 14
3.4 In search of explanations of the observed trends 16
4 Discussion and conclusions 25
4.1 No long-term decline of mangroves in West Africa 25
4.2 Mangroves and rice cultivation 25
4.3 Planting mangroves 27
4.4 Future work 28
5 Summary 29
6 Cited literature 31


A&W-report 2029 Mangrove dynamics in West Africa 1
1 Introduction
1.1 A world without mangrove?
According to Valiela et al. (2001), mangroves worldwide decline by 2% per year, which is more than the
decline of tropical forest. Do we even face the prospect of a world without mangroves within 100 years
(Duke at al. 2007)? Valiela et al. (2001) arrive at a loss of 35% worldwide between about 1970 and
1990, varying between 14% in Australia, 36% in Asia and 38% in America (north and south combined);
in Africa the average loss would be 32%.
There are several reasons why mangroves decline. The main threat in Asia is the mariculture for which
mangroves are converted into ponds to grow shrimp, prawn and fish. Saenger & Bellan (1995) and
Corcoran et al. (2007) identified the following threats to mangroves in West Africa:
Agriculture and aquaculture (rice, shrimp, fish)
Construction of access roads
Construction of embankments
Desertification
Fuel wood and charcoal
Hydroelectric projects
Land-based sources of pollution
Oil exploration, drilling and production
Rubbish dumping
Sand mining
Sewage and pollution
Unsustainable gathering, fishing and hunting
Urban and tourism development
Water diversion for agriculture and aquaculture
Mangrove forests and the rice fields within the mangrove zone of West Africa measure 4000 km2 and 8000
km2, respectively (Bos et al. 2007). The photo, taken from a low-flying small plane, shows the extensive
mangrove zone with rice fields along the north bank of the Rio Cacheu (24-8-2008; 12.143ºN and 16.266ºW) .

2 A&W-report 2029 Mangrove dynamics in West Africa
So far, there are 11 estimates of the worldwide surface of mangroves (Fig.1; Table 1). At first sight, the
just mentioned overall negative trend is not evident for the period 1980-2000. All authors emphasize the
large uncertainty, partly due to the different methods being used (surfaces derived from topographical
map, vegetation map, remotely sensed data) and the large variation in the spatial resolution of the
remotely sensed data being 1.1 km at AVHRR imagery against 0.6-2 m in DigitalGlobe’s QuickBird and
GeoEye’s IKONOS images (visible as true colour images in Google Earth). The three most recent
estimates are based on the same remote sensing data (Landsat 7 images with a similar resolution of 30
m) and also from the same period. Nonetheless, their estimates vary between 13.8 and 15.7 million km2,
a difference of 14%. Hence it is still unclear to what degree the suggested worldwide decline of the
mangrove forests is due to methodological problems and the use of poor data.
Fig. 1. The
estimates of
mangrove area
worldwide;
same data as
Table 1.
Table 1. Estimates of mangrove area worldwide. If printed in italic, year is the weighted average year of all
national area estimates; otherwise it is the publication year. From FAO (2007) for all references before 2000.
Reference Year Estimated total mangrove area, km2
FAO & UNEP (1981a,b,c) 1980 15642673
Saenger, Hegerl & Davie (1983) 1983 16221000
FAO (1994) 1982 16500000
Groombridge (1992) 1992 19847861
Clough (1993); Diop (1993); Lacerda (1993) 1993 12429115
Fisher & Spalding (1993) 1993 19881800
Spalding, Blasco & Field (1997) 1997 18100077
Aizpuru, Achard & Blasco (2000) 2000 17075600
FAO (2007) 2000 15705000
Giri et al. (2010) 2000 13776000
Spalding, Kainuma & Collins (2010) 2000 15040408
1.2 Aims of this study
The first aim of this report is to compare and evaluate three recent estimates of mangrove area in West
Africa: Bos et al. (2006), Giri et al. (2010a, 2010b) and Spalding et al. (2010). All three studies used
recent satellite imagery with a 30m spatial resolution from the Landsat archive to map the mangroves,
using digital elevation data to eliminate the terrestrial areas and select the areas of interest – the
intertidal zone covered by mangroves. They selected spectral classes from band 3, 4 and 5 being
A&W-report 2029 Mangrove dynamics in West Africa 3
specific for mangroves (although –unfortunately– they did not mention the selected bandwidth
combinations; but see Bertrand 1993, Corcoran et al. 2007, Andrieu & Mering 2008). Giri et al. (2010a,
2010b), as well as Bos et al. (2006) used a consistent methodology, but Spalding et al. (2010) included
observed data, by which source data and associated errors are not consistent across the dataset. On
the other hand, by doing so, evident errors may be corrected.
As already stated by Giri et al. (2010) a statistically robust validation dataset is not available to measure
the accuracy of these global mangrove databases. These authors evaluated their database with other
existing global, regional and local datasets and performed qualitative validation with the help of local
experts and high-resolution satellite data such as QuickBird and IKONOS available within Google Earth.
We used the same high-resolution Google Earth images to digitise by hand the mangrove cover
independent of the classifications made in the three studies mentioned above. This allows us to do a
quantitative validation of the mangrove databases and evaluate the estimated surface areas.
The second aim of this report is to investigate whether the mangroves in West Africa have declined as
much as suggested by Valiela et al. (2001) and others.
A separate report will deal with the significance of the West African mangroves for millions of small
passerine birds from Europe who spend here the northern winter (Altenburg & van Spanje 1989).
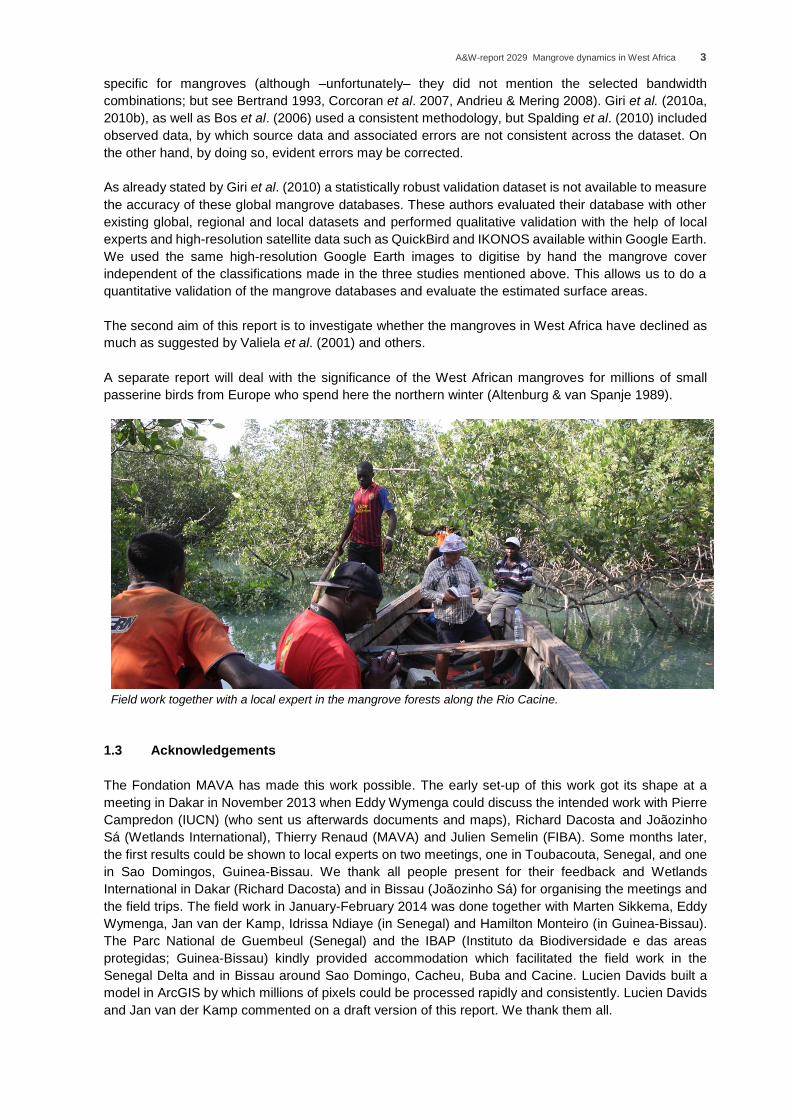
Field work together with a local expert in the mangrove forests along the Rio Cacine.
1.3 Acknowledgements
The Fondation MAVA has made this work possible. The early set-up of this work got its shape at a
meeting in Dakar in November 2013 when Eddy Wymenga could discuss the intended work with Pierre
Campredon (IUCN) (who sent us afterwards documents and maps), Richard Dacosta and Joãozinho
Sá (Wetlands International), Thierry Renaud (MAVA) and Julien Semelin (FIBA). Some months later,
the first results could be shown to local experts on two meetings, one in Toubacouta, Senegal, and one
in Sao Domingos, Guinea-Bissau. We thank all people present for their feedback and Wetlands
International in Dakar (Richard Dacosta) and in Bissau (Joãozinho Sá) for organising the meetings and
the field trips. The field work in January-February 2014 was done together with Marten Sikkema, Eddy
Wymenga, Jan van der Kamp, Idrissa Ndiaye (in Senegal) and Hamilton Monteiro (in Guinea-Bissau).
The Parc National de Guembeul (Senegal) and the IBAP (Instituto da Biodiversidade e das areas
protegidas; Guinea-Bissau) kindly provided accommodation which facilitated the field work in the
Senegal Delta and in Bissau around Sao Domingo, Cacheu, Buba and Cacine. Lucien Davids built a
model in ArcGIS by which millions of pixels could be processed rapidly and consistently. Lucien Davids
and Jan van der Kamp commented on a draft version of this report. We thank them all.

4 A&W-report 2029 Mangrove dynamics in West Africa
Scattered mangrove trees on the tidal flats and dense mangroves along tidal creeks in study site Casamance-
East (Fig. 3). Date: 26-8-2008; coordinates: 12°37'29'' N and 16°11' 48'' W.
Dense mangrove forests and bare tidal flats along the southern border of the Rio Grande de Buba, with Ilha de
Bolama left at the horizon (study site Buba-South; Fig. 3) Date: 25-8-2008; coordinates: 11.476°N and
15.413°W.
A&W-report 2029 Mangrove dynamics in West Africa 5
2 Methods
2.1 Available mangrove data layers
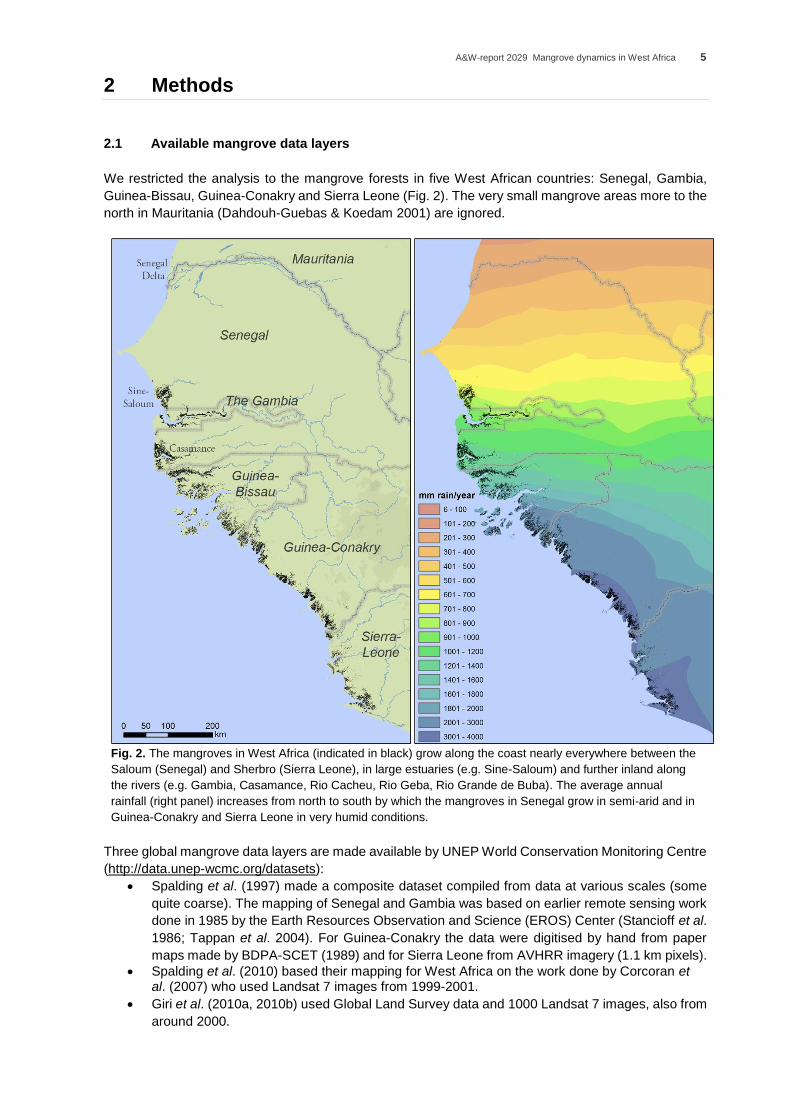
We restricted the analysis to the mangrove forests in five West African countries: Senegal, Gambia,
Guinea-Bissau, Guinea-Conakry and Sierra Leone (Fig. 2). The very small mangrove areas more to the
north in Mauritania (Dahdouh-Guebas & Koedam 2001) are ignored.
Fig. 2. The mangroves in West Africa (indicated in black) grow along the coast nearly everywhere between the
Saloum (Senegal) and Sherbro (Sierra Leone), in large estuaries (e.g. Sine-Saloum) and further inland along
the rivers (e.g. Gambia, Casamance, Rio Cacheu, Rio Geba, Rio Grande de Buba). The average annual
rainfall (right panel) increases from north to south by which the mangroves in Senegal grow in semi-arid and in
Guinea-Conakry and Sierra Leone in very humid conditions.
Three global mangrove data layers are made available by UNEP World Conservation Monitoring Centre
(http://data.unep-wcmc.org/datasets):
Spalding et al. (1997) made a composite dataset compiled from data at various scales (some
quite coarse). The mapping of Senegal and Gambia was based on earlier remote sensing work
done in 1985 by the Earth Resources Observation and Science (EROS) Center (Stancioff et al.
1986; Tappan et al. 2004). For Guinea-Conakry the data were digitised by hand from paper
maps made by BDPA-SCET (1989) and for Sierra Leone from AVHRR imagery (1.1 km pixels).
Spalding et al. (2010) based their mapping for West Africa on the work done by Corcoran et al. (2007) who used Landsat 7 images from 1999-2001.
Giri et al. (2010a, 2010b) used Global Land Survey data and 1000 Landsat 7 images, also from
around 2000.

6 A&W-report 2029 Mangrove dynamics in West Africa
Bos et al. (2006) used 16 images of the West African coast, 14 from 2001-2003 (Landsat 7; ETM+) and
two from 1986 (Landsat 5; MSS). We used the digital versions of their land cover maps.
As shown below, the dataset of Spalding et al. (1997) was not detailed enough. Fortunately, there are
excellent studies giving detailed maps of the mangroves in different West African countries and the
changes during the last 50 years, e.g. Andrieu (2010), Cuq et al. (1996), Conchedda et al. (2008 &
2011), Sakho et al. (2011), Vasconcelos et al. (2002), Lourenço et al. (2009). The following sources will
be used to compare in detail the distribution of the mangroves in specific areas:
High-resolution satellite photographs from the mid-1960s with a ground resolution of about 2 m
(https://lta.cr.usgs.gov/declass_1) were geo-referenced using physical features, such as rocks
or crossroads , that could be identified on the photographs and Google Earth images.
We made digital scans of the topographical maps of Guinea-Bissau (1/50.000; Junta das
Missões Geográficas e de Investigações Junta das Missoes Geográficas, published in 1956-
1972, but based on aerial photographs and field work in 1949-1956). We did the same for
Senegal (maps 1/50.000, Japanese International Cooperation Agency (JICA); published in
1991, based on aerial photographs and field work in 1989-1990).
High-resolution remotely sensed imagery given as “historical images” in Google Earth. The time
slider within Google Earth allows comparison of images, usually in very large detail.
All layers had, or were converted to, the same projection: WGS84 UTM 28N.
2.2 Tree cover on seven study sites
The tree cover of mangrove, such as visible on satellite images made available by Google Earth, was
measured in seven sites: five from Guinea-Bissau and two from southern Senegal (Fig. 3).
Fig. 3. The seven sites in Senegal
and Guinea-Bissau where the tree
cover of mangrove forests was
estimated using Google Earth
images.
Nine density classes were distinguished: tree cover by mangrove: 0%, 1%, 5% (2-7%), 10% (8-15%),
20% (16-30%), 40% (31-50%), 60% (51-70%), 80% (71-90%) and 100% (91-100%). The mapping was
done with the Arc2Earth extension integrated in ESRI’s ArcGIS, while the image on the screen was at
a scale of 1/4000. At this level, the mangrove, and even individual trees, are clearly visible, although the
imagery is detailed enough to zoom in even more.

A&W-report 2029 Mangrove dynamics in West Africa 7
Mapping of the tree cover was easy if the mangroves were densely packed and it was sufficient to
indicate the fringes. Open areas if larger than 0.3-0.5 ha were indicated separately. Smaller open sites
are clearly visible, but it would be too time-consuming to indicate them. That is why areas, including the
open areas, were marked as 80% or 60% coverage, or less, depending on the canopy openness.
Similarly, in areas with scattered mangrove trees, we did not mark the individual trees, but searched for
homogenous areas where the tree cover was 1%, 5% etc.
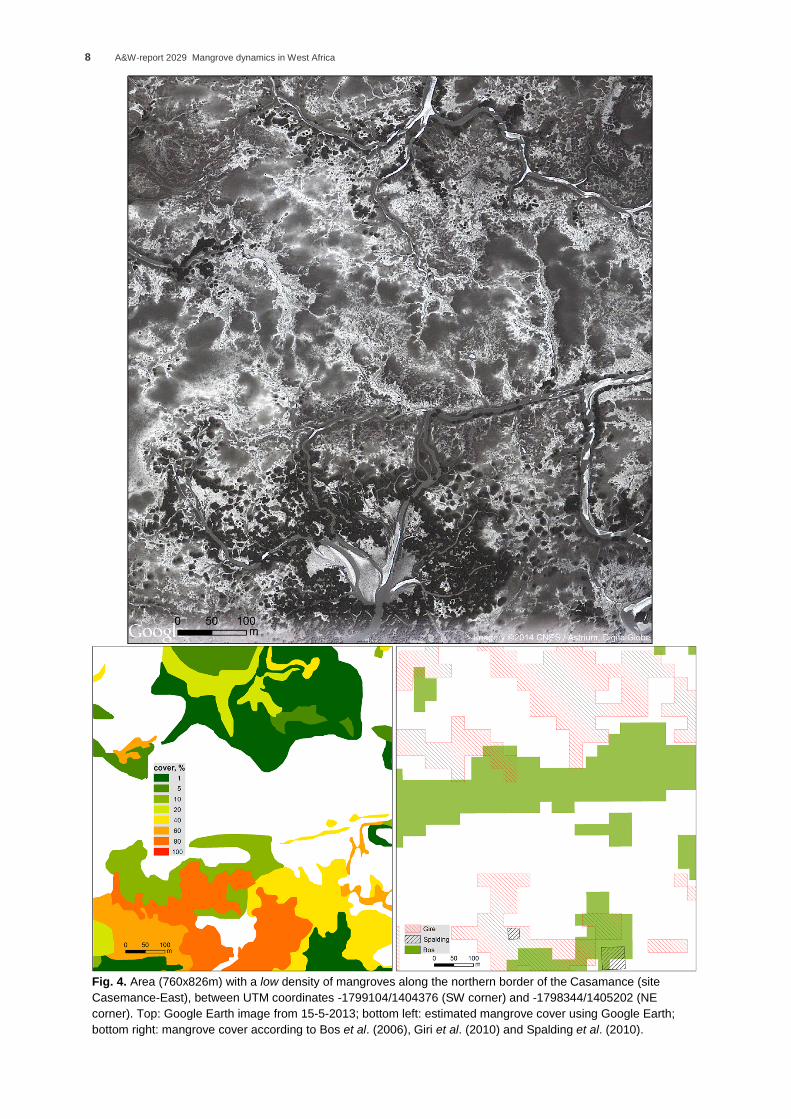
Fig. 4 shows for a small area within study site Casamance E the Google Earth image as well as its
estimated coverage and the occurrence of mangroves according to Bos et al. (2006), Giri et al. (2010),
and Spalding et al. (2010). The majority of the surface within this area (4.77 ha) is bare, with some
clusters of trees in the south and scattered trees in the north. According to Spalding et al. (2007) (not
shown) the same area would be fully covered by mangroves. The recent remote sensing studies are
closer to the truth, although the mutual overlap between the three studies is low.
Fig. 5 shows a nearby area of the same size with a high density of mangrove. In this case, there would
be no mangroves according to Spalding et al. (2007). The three recent studies correctly revealed the
presence of a dense mangroves forest north of a creek and more open mangrove forest in the southern
part of this area.
Ideally, one would expect that the remotely sensed data would produce pixels with (or without)
mangroves if the cover of mangroves is less (or above) 50%. In reality, it will often deviate, certainly at
pixel level, for four reasons. First, the four studies use remote sensing data of different years with a
possible change in woody cover of the mangroves, although this appears not to be the case in the areas
shown in Figs. 4 and 5. The historical imagery in Google Earth does not reveal any change in the cover
of mangroves shown in Fig. 4 for six images between 26-4-2003 and 15-5-2013 and in Fig. 5 for eight
images between 20-4-2004 and 15-11-2013. Fig. 6 shows, as an example, four Google Earth images
between 2004 and 2010 of the area shown in Fig. 5. The historical images enable everyone to check
whether the mangrove cover has changed during the last years, or not (which is usually the case in
West Africa; see Fig. 7).
Second, the projection may differ between the studies, by which a strip of mangroves along a creek,
although correctly identified in different studies, may easily show a small or even no overlap due to a
shift of only some pixels in the projection.
Third, although mangroves are relatively easy to distinguish from other vegetation types, not all pixels
are correctly identified. Bos et al. (2006) found that 64% of the pixels classified as mangroves were
mangroves in reality (“users accuracy”), while 74% of the observed mangroves were also actually
classified as mangroves (“producers accuracy”). Both other studies give no details about their users
accuracy and producers accuracy.
To compare the three remote sensing studies with our interpretation of Google Earth images, we
calculated for the seven study areas (Fig. 3) the fraction of pixels being mangroves according to the
three studies. This was done separately for the zones with a different coverage. The 30x30m pixels in
the three studies were subdivided into 2x2m pixels (thus 225 4m2 pixels for every 900 m2 pixel). This
was done to facilitate the calculation of the overlap between the mangrove maps produced by the three
remote sensing studies (with a single mangrove category) and our map (with 1-100% mangrove
coverage).
8 A&W-report 2029 Mangrove dynamics in West Africa
Fig. 4. Area (760x826m) with a low density of mangroves along the northern border of the Casamance (site
Casemance-East), between UTM coordinates -1799104/1404376 (SW corner) and -1798344/1405202 (NE
corner). Top: Google Earth image from 15-5-2013; bottom left: estimated mangrove cover using Google Earth;
bottom right: mangrove cover according to Bos et al. (2006), Giri et al. (2010) and Spalding et al. (2010).

A&W-report 2029 Mangrove dynamics in West Africa 9
Fig. 5. Area (760x626m) with a high density of mangroves along the southern border of the Casamance (site
Casemance-East), between UTM coordinates -1816900/140.027 (SW corner) and -1814140/1401852 (NE
corner). Top: Google Earth image from 15-11-2013; bottom left: estimated mangrove cover using Google Earth;
bottom right: mangrove cover according to Bos et al. (2006), Giri et al. (2010) and Spalding et al. (2010).

10 A&W-report 2029 Mangrove dynamics in West Africa
Fig. 6. Google Earth images of the area shown in Fig. 5 at four different dates between 2004 and 2010 to
demonstrate that nothing has changed.
Fig. 7. Google Earth image zoomed in more than Fig.6, showing the same area (210 x 410m) in the Casamance
for two different dates. No tree has disappeared in the upper part of the image, but some in the lower part.
A&W-report 2029 Mangrove dynamics in West Africa 11
3 Results
3.1 Comparison per site
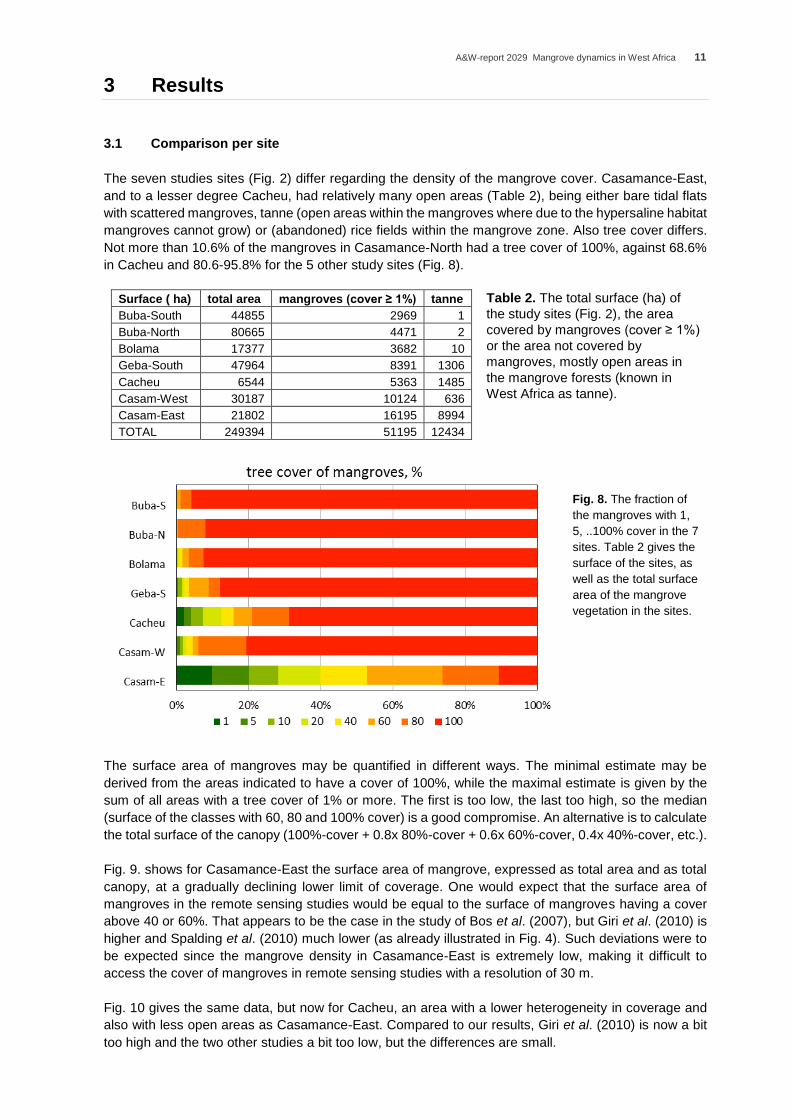
The seven studies sites (Fig. 2) differ regarding the density of the mangrove cover. Casamance-East,
and to a lesser degree Cacheu, had relatively many open areas (Table 2), being either bare tidal flats
with scattered mangroves, tanne (open areas within the mangroves where due to the hypersaline habitat
mangroves cannot grow) or (abandoned) rice fields within the mangrove zone. Also tree cover differs.
Not more than 10.6% of the mangroves in Casamance-North had a tree cover of 100%, against 68.6%
in Cacheu and 80.6-95.8% for the 5 other study sites (Fig. 8).
Surface ( ha) total area mangroves (cover ≥ 1%) tanne
Buba-South 44855 2969 1
Buba-North 80665 4471 2
Bolama 17377 3682 10
Geba-South 47964 8391 1306
Cacheu 6544 5363 1485
Casam-West 30187 10124 636
Casam-East 21802 16195 8994
TOTAL 249394 51195 12434
Table 2. The total surface (ha) of
the study sites (Fig. 2), the area
covered by mangroves (cover ≥ 1%)
or the area not covered by
mangroves, mostly open areas in
the mangrove forests (known in
West Africa as tanne).
Fig. 8. The fraction of
the mangroves with 1,
5, ..100% cover in the 7
sites. Table 2 gives the
surface of the sites, as
well as the total surface
area of the mangrove
vegetation in the sites.
The surface area of mangroves may be quantified in different ways. The minimal estimate may be
derived from the areas indicated to have a cover of 100%, while the maximal estimate is given by the
sum of all areas with a tree cover of 1% or more. The first is too low, the last too high, so the median
(surface of the classes with 60, 80 and 100% cover) is a good compromise. An alternative is to calculate
the total surface of the canopy (100%-cover + 0.8x 80%-cover + 0.6x 60%-cover, 0.4x 40%-cover, etc.).
Fig. 9. shows for Casamance-East the surface area of mangrove, expressed as total area and as total
canopy, at a gradually declining lower limit of coverage. One would expect that the surface area of
mangroves in the remote sensing studies would be equal to the surface of mangroves having a cover
above 40 or 60%. That appears to be the case in the study of Bos et al. (2007), but Giri et al. (2010) is
higher and Spalding et al. (2010) much lower (as already illustrated in Fig. 4). Such deviations were to
be expected since the mangrove density in Casamance-East is extremely low, making it difficult to
access the cover of mangroves in remote sensing studies with a resolution of 30 m.
Fig. 10 gives the same data, but now for Cacheu, an area with a lower heterogeneity in coverage and
also with less open areas as Casamance-East. Compared to our results, Giri et al. (2010) is now a bit
too high and the two other studies a bit too low, but the differences are small.

12 A&W-report 2029 Mangrove dynamics in West Africa
Fig. 9. The total surface in
the site Casamance-E
classified as mangroves if
only areas classified as
100%, 80+100%,
60+80+100%, etc. are
considered as mangroves
(left) compared to the total
surface according to the
three remote sensing studies
(right).
Open areas within the
mangroves (left out in left
graph) measure 89.9 km2.
Fig. 10. The total surface in
the site Cacheu classified as
mangroves if only areas
classified as 100%,
80+100%, 60+80+100%, etc.
are considered as
mangroves (left) compared
to the total surface according
to the three remote sensing
studies (right).
Open areas within the
mangroves (left out in left
graph) measure 14.8 km2.
Fig. 11. The total surface in
the 7 sites combined
classified as mangroves if
only areas classified as
100%, 80+100%,
60+80+100%, etc. are
considered as mangroves
(left) compared to the total
surface according to the
three remote sensing studies
(right).
Open areas within the
mangroves (left out in left
graph) measure 124.3 km2.
Fig. 11 takes all data of the 7 sites together. The total surface according to the three remote sensing
studies hardly differ, being higher for Giri et al. (2010) (308 km2), lower for Spalding et al. (2010) (288
km2) and in-between for Bos et al. (2007) (302 km2). These estimates are below what we expected from
A&W-report 2029 Mangrove dynamics in West Africa 13
our own mapping, where the surface area of mangroves with a coverage of ≥40% amounts to 325 km2.
The next section analyses this (small) deviation.
3.2 Comparison of methods
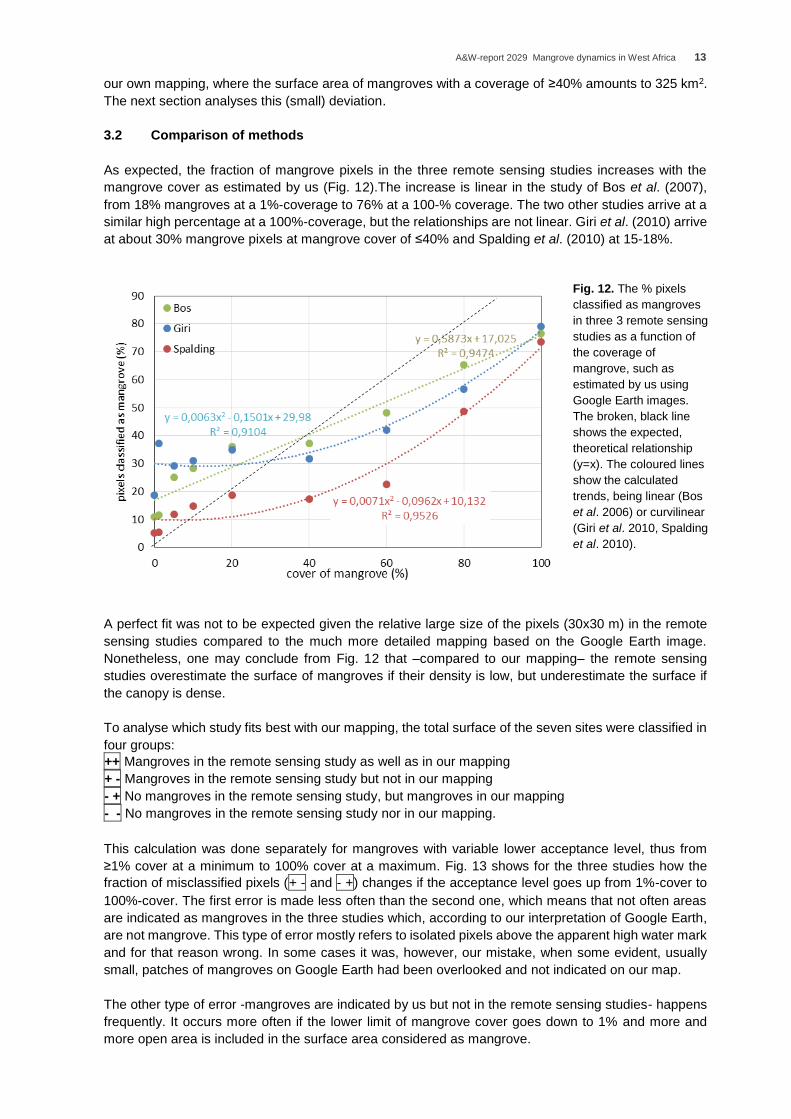
As expected, the fraction of mangrove pixels in the three remote sensing studies increases with the
mangrove cover as estimated by us (Fig. 12).The increase is linear in the study of Bos et al. (2007),
from 18% mangroves at a 1%-coverage to 76% at a 100-% coverage. The two other studies arrive at a
similar high percentage at a 100%-coverage, but the relationships are not linear. Giri et al. (2010) arrive
at about 30% mangrove pixels at mangrove cover of ≤40% and Spalding et al. (2010) at 15-18%.
Fig. 12. The % pixels
classified as mangroves
in three 3 remote sensing
studies as a function of
the coverage of
mangrove, such as
estimated by us using
Google Earth images.
The broken, black line
shows the expected,
theoretical relationship
(y=x). The coloured lines
show the calculated
trends, being linear (Bos
et al. 2006) or curvilinear
(Giri et al. 2010, Spalding
et al. 2010).
A perfect fit was not to be expected given the relative large size of the pixels (30x30 m) in the remote
sensing studies compared to the much more detailed mapping based on the Google Earth image.
Nonetheless, one may conclude from Fig. 12 that –compared to our mapping– the remote sensing
studies overestimate the surface of mangroves if their density is low, but underestimate the surface if
the canopy is dense.
To analyse which study fits best with our mapping, the total surface of the seven sites were classified in
four groups:
++ Mangroves in the remote sensing study as well as in our mapping
+ - Mangroves in the remote sensing study but not in our mapping
- + No mangroves in the remote sensing study, but mangroves in our mapping
- - No mangroves in the remote sensing study nor in our mapping.
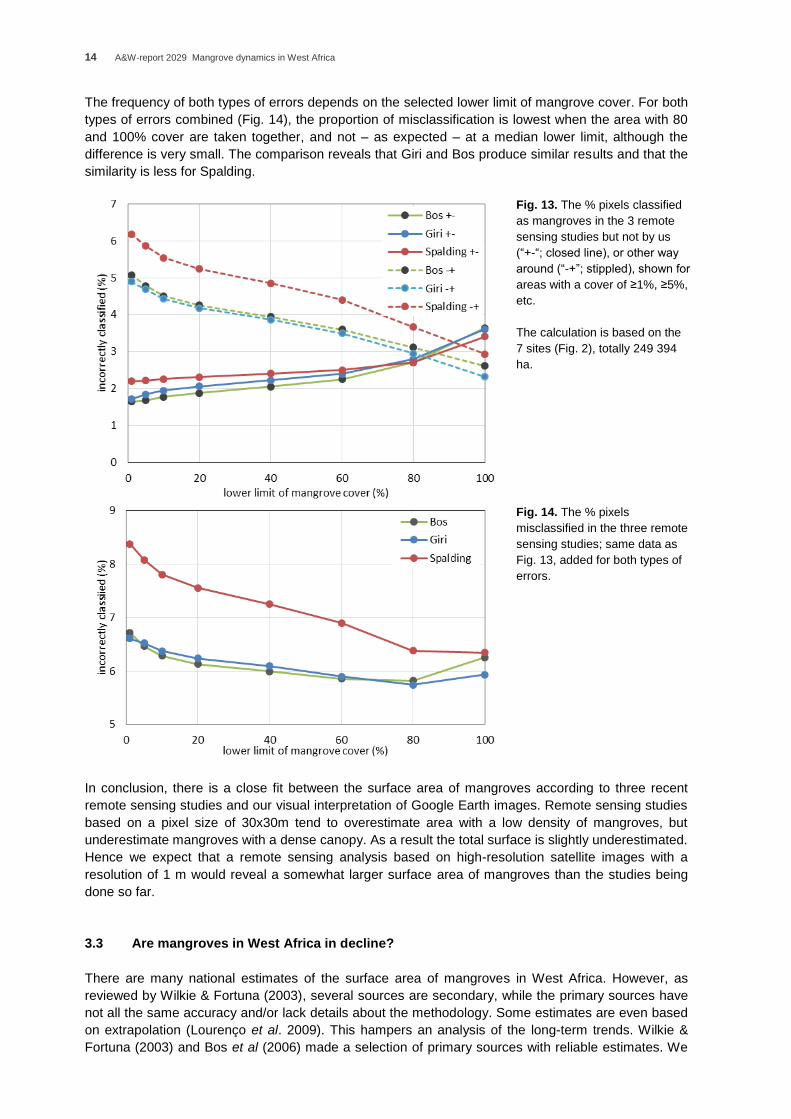
This calculation was done separately for mangroves with variable lower acceptance level, thus from
≥1% cover at a minimum to 100% cover at a maximum. Fig. 13 shows for the three studies how the
fraction of misclassified pixels (+ - and - +) changes if the acceptance level goes up from 1%-cover to
100%-cover. The first error is made less often than the second one, which means that not often areas
are indicated as mangroves in the three studies which, according to our interpretation of Google Earth,
are not mangrove. This type of error mostly refers to isolated pixels above the apparent high water mark
and for that reason wrong. In some cases it was, however, our mistake, when some evident, usually
small, patches of mangroves on Google Earth had been overlooked and not indicated on our map.
The other type of error -mangroves are indicated by us but not in the remote sensing studies- happens
frequently. It occurs more often if the lower limit of mangrove cover goes down to 1% and more and
more open area is included in the surface area considered as mangrove.
14 A&W-report 2029 Mangrove dynamics in West Africa
The frequency of both types of errors depends on the selected lower limit of mangrove cover. For both
types of errors combined (Fig. 14), the proportion of misclassification is lowest when the area with 80
and 100% cover are taken together, and not – as expected – at a median lower limit, although the
difference is very small. The comparison reveals that Giri and Bos produce similar results and that the
similarity is less for Spalding.
Fig. 13. The % pixels classified
as mangroves in the 3 remote
sensing studies but not by us
(“+-“; closed line), or other way
around (“-+”; stippled), shown for
areas with a cover of ≥1%, ≥5%,
etc.
The calculation is based on the
7 sites (Fig. 2), totally 249 394
ha.
Fig. 14. The % pixels
misclassified in the three remote
sensing studies; same data as
Fig. 13, added for both types of
errors.
In conclusion, there is a close fit between the surface area of mangroves according to three recent
remote sensing studies and our visual interpretation of Google Earth images. Remote sensing studies
based on a pixel size of 30x30m tend to overestimate area with a low density of mangroves, but
underestimate mangroves with a dense canopy. As a result the total surface is slightly underestimated.
Hence we expect that a remote sensing analysis based on high-resolution satellite images with a
resolution of 1 m would reveal a somewhat larger surface area of mangroves than the studies being
done so far.
3.3 Are mangroves in West Africa in decline?
There are many national estimates of the surface area of mangroves in West Africa. However, as
reviewed by Wilkie & Fortuna (2003), several sources are secondary, while the primary sources have
not all the same accuracy and/or lack details about the methodology. Some estimates are even based
on extrapolation (Lourenço et al. 2009). This hampers an analysis of the long-term trends. Wilkie &
Fortuna (2003) and Bos et al (2006) made a selection of primary sources with reliable estimates. We

A&W-report 2029 Mangrove dynamics in West Africa 15
used their lists, but added some recent studies (Lourenço et al. 2009, Spalding et al. 2010, Giri et al.
2010) to construct Fig. 15.
Fig. 15. Available estimates of surface area covered
by mangrove in the five countries. Red and blue dots
refer to studies considered to be less or more reliable,
respectively, by Wilkie & Fortuna (2003) and Bos et al.
(2006); the trend lines are based on the latter data.
Data from Wilkie & Fortuna (2003), Bos et al. (2006),
Lourenço et al. (2009), Spalding et al. (2010), Giri et
al. (2010).
The large variation in the national estimates is partly due to how mangrove cover is defined. For most
studies it is not clear whether open areas and areas with scattered mangroves are included in the total
estimate or not. This makes a large difference, even in Guinea-Bissau, where the large majority of the
mangrove cover may be characterised as dense (Table 2). SCET International (1978) distinguished for
Guinea-Bissau dense mangroves (3180 km2), scattered mangroves (320 km2) and open areas within
mangroves (380 km2). We have taken as total the sum of dense and scattered mangroves (3500 km2),
but one may also be more (3180 km2) or less strict (3560 km2), a difference of 12%. The difference must
be larger for Senegal, where a considerable part of the mangrove zone consists of open areas and
areas with only some mangrove trees.
Surface (km2) Bos Giri Spalding
Gambia 679 673 583
Senegal 1452 1226 1281
Guinea-Bissau 2521 2732 2982
Guinea-Conakry 2215 2359 2029
Sierra Leone 1085 1405 1049
TOTAL 7953 8396 7924
Table 3. The three country estimates of area
covered by mangroves in 2000 according to
Bos et al. (2006), Giri et al. (2010) and
Spalding et al. (2010).
The large variation in the estimates is also due to problems with the interpretation of the remotely sensed
images. Bos et al. (2006), Giri et al. (2010) and Spalding et al. (2010) used the same Landsat images
16 A&W-report 2029 Mangrove dynamics in West Africa
from around 2000. Their estimates differ nevertheless (Table 3): the lowest estimate is 10% (Gambia)
to 30% (Sierra Leone) below the highest estimate of the mangrove extent in a country.
A large part of the variation in the national estimates (Fig. 15) disappears when less reliable estimates
are left out of consideration. After a selection is made for (according to Wilkie & Fortuna 2003 and Bos
et al. 2006) reliable estimates, the trend for Senegal is significantly negative. The national trends are
also negative in Guinea-Conakry and Sierra Leone, but they lack statistical significance. The mangroves
in Gambia and Guinea-Bissau declined too, but increased again since the 1990s.
The next section attempts to search for an explanation of the observed trends. Fortunately, some
recently published papers have carefully analysed the possible change in the surface area of mangrove
in different regions within West Africa.
3.4 In search of explanations of the observed trends
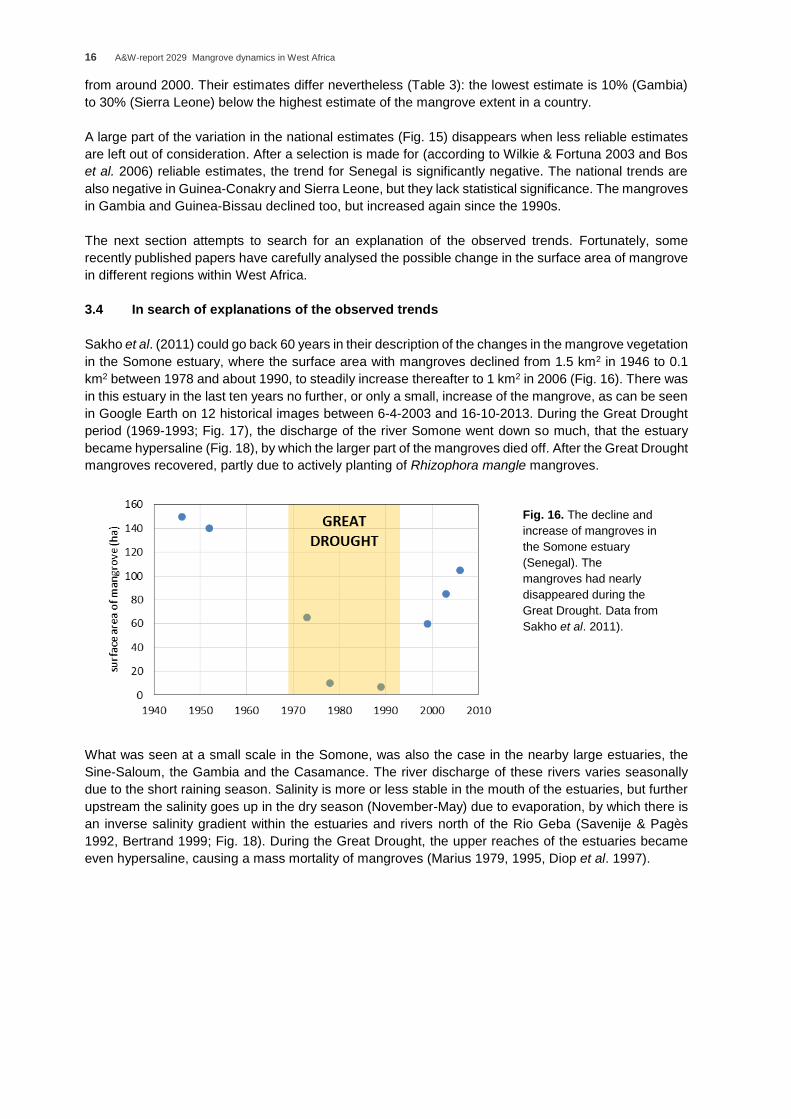
Sakho et al. (2011) could go back 60 years in their description of the changes in the mangrove vegetation
in the Somone estuary, where the surface area with mangroves declined from 1.5 km2 in 1946 to 0.1
km2 between 1978 and about 1990, to steadily increase thereafter to 1 km2 in 2006 (Fig. 16). There was
in this estuary in the last ten years no further, or only a small, increase of the mangrove, as can be seen
in Google Earth on 12 historical images between 6-4-2003 and 16-10-2013. During the Great Drought
period (1969-1993; Fig. 17), the discharge of the river Somone went down so much, that the estuary
became hypersaline (Fig. 18), by which the larger part of the mangroves died off. After the Great Drought
mangroves recovered, partly due to actively planting of Rhizophora mangle mangroves.
Fig. 16. The decline and
increase of mangroves in
the Somone estuary
(Senegal). The
mangroves had nearly
disappeared during the
Great Drought. Data from
Sakho et al. 2011).
What was seen at a small scale in the Somone, was also the case in the nearby large estuaries, the
Sine-Saloum, the Gambia and the Casamance. The river discharge of these rivers varies seasonally
due to the short raining season. Salinity is more or less stable in the mouth of the estuaries, but further
upstream the salinity goes up in the dry season (November-May) due to evaporation, by which there is
an inverse salinity gradient within the estuaries and rivers north of the Rio Geba (Savenije & Pagès
1992, Bertrand 1999; Fig. 18). During the Great Drought, the upper reaches of the estuaries became
even hypersaline, causing a mass mortality of mangroves (Marius 1979, 1995, Diop et al. 1997).

A&W-report 2029 Mangrove dynamics in West Africa 17
Fig. 17. The annual rainfall
between 1922 and 2004,
averaged for 16 meteorological
stations in the SW part of
Senegambia (15.3-17.0º W and
12.5-14.5º N); missing values
were imputed; averages for 2005-
2013 are less reliable since 14 of
16 stations were missing. The red
line shows the running mean. The
period considered as the Great
Drought in West Africa is
indicated. Note that there was
only a partial recovery of the
rainfall in Gambia and SW
Senegal since 1994.
Dead mangrove trees in the intertidal zone along the lower Soungrougou
River, a northern arm of the Casamance. (Date: 26-8-2008; coordinates:
12.748ºN and 16.037ºW).
All mangroves in the middle and upper part of the Casamance and its
branches died when during the Great Drought the river flow was reduced
and the conditions became hypersaline.
Fig. 18. The Casamance is one of the
northern estuaries (graph copied from
Bertrand 1999) where the salinity gradient is
inverse, in contrast to the southern
estuaries (Rio Geba and further south)
where the mixing of water from the sea
water and the river results in a declining
salinity further upstream. The contrast
between both types of estuaries becomes
larger during drought periods when the river
discharge of dryland rivers in the north
declines relatively much more compared to
the rivers from the humid south.
Great
drought

18 A&W-report 2029 Mangrove dynamics in West Africa
Fig. 19. The surface area
of mangroves in the
Saloum being lost, stable
and new in three periods.
Data from Dièye et al.
(2013).
Fig. 20. Map of the
change in the
mangrove area in the
lower Casamance
between 1986 and
2006. During these
20 years the total
surface increased by
3%, from 742 to 766
km2. Source:
Conchedda et al.
(2008).
The black square
refers to Fig. 21 (top
panel) where a
CORONA satellite
photograph is
compared to a recent
Google Earth image.
The loss of mangroves in the Saloum was large in the first half of the Great Drought, being stable at a
low level during the second half of the Great Drought after which the surface area slowly increased at
the partial recovery of the rainfall (Fig. 19; Dièye et al. 2013; Conchedda et al. 2011).
The phenomenon of the “inverse estuary” explains why in Senegal and Gambia the mangroves in the
river mouth were not affected during the Great Drought and remained stable over a long time: Gambia
(Maniatis 2005) and Casamance (Conchedda et al. 2008; Fig. 20), even over a time span of nearly half
a century (Fig. 21 top), while at the same time the mangroves died off further upstream in the Gambia
River (Jeminez et al. 1985) and Casamance (Sall 1982 (cited by Sakho et al. 2011), Debenay 1989);
see also Fig. 21 (bottom)) and increased thereafter (Conchedda et al. 2011). Locally, however, there
was a decline of mangroves in the transnational region at the northern and southern border of Gambia
between 1986 and 2010 mainly due to illegal cutting (Carney et al. 2014).
Similarly to the global trends in Gambia and Senegal, the mangroves in the mouth of the Rio Cacheu
(northern Guinea-Bissau) were stable, but disappeared during the Great Drought from the most inland
part of the Cacheu River (Vasconcelos et al. 2002; Fig. 22). A comparison of different kinds of maps
and satellite images may help to investigate the loss of mangroves on the upper course of Rio Cacheu
A&W-report 2029 Mangrove dynamics in West Africa 19
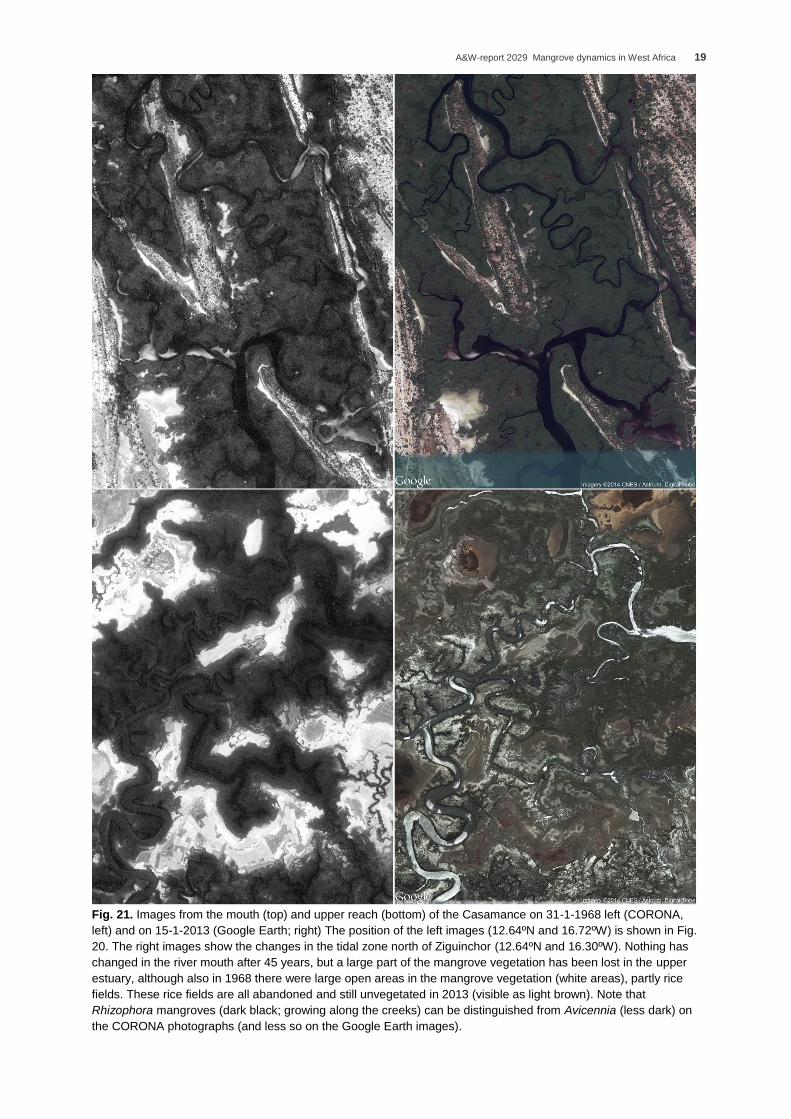
Fig. 21. Images from the mouth (top) and upper reach (bottom) of the Casamance on 31-1-1968 left (CORONA,
left) and on 15-1-2013 (Google Earth; right) The position of the left images (12.64ºN and 16.72ºW) is shown in Fig.
20. The right images show the changes in the tidal zone north of Ziguinchor (12.64ºN and 16.30ºW). Nothing has
changed in the river mouth after 45 years, but a large part of the mangrove vegetation has been lost in the upper
estuary, although also in 1968 there were large open areas in the mangrove vegetation (white areas), partly rice
fields. These rice fields are all abandoned and still unvegetated in 2013 (visible as light brown). Note that
Rhizophora mangroves (dark black; growing along the creeks) can be distinguished from Avicennia (less dark) on
the CORONA photographs (and less so on the Google Earth images).

20 A&W-report 2029 Mangrove dynamics in West Africa
such as shown by Vasconcelos et al. (2002). The small square shown in Fig. 22, measuring 4.8 x 2.4 km,
was selected to demonstrate why mangroves have disappeared (Fig. 23). The topographical map from 1956
(Fig. 23A) shows that this blind arm of the river was still covered by mangroves with one rice field and some
bare areas between the mangrove zone and the upland. The same open areas are clearly visible on the
CORONA image from 1968 (Fig. 23B). Apparently not much has changed between 1956 and 1968 with
dense mangrove vegetation along the meandering creeks and only a few open areas within the mangrove
zone. The only difference is that some small rice fields visible on the image of 1968 are still indicated as
tanne (bare ground) in 1956.
The differences are large between the CORONA image from 1968 and the maps based on remotely sensed
data of 2000 ((Giri et al. 2010) (red in Fig. 23C), Spalding et al. 2010 (grey in Fig. 23C) and Bos et al. 2006
(dark green in Fig. 23D)): The mangrove vegetation has disappeared from a large part of this area within 12
years. The explanation is found on the map of Bos et al. (2006) (Fig. 23D): there is more bare ground, partly
because farmers have removed mangroves to create rice fields. Indeed the Google Earth image of 2004
(Fig. 23E) shows in the area indicated by Bos as rice fields clearly the dams and ditches and (because the
image is from January) also the bare fields. Some rice fields had already been abandoned, visible as bare
land with linear structures of dikes and ditches. These structures are not well visible on the scale given in
Fig. 23E and 23F; but go to Google Earth to see the original historical images, being more detailed as
reproduced here. Fig. 23E clearly shows that the dense mangrove forests along the creeks in 1968 (Fig.
23B) have been changed into a more open forest with open areas in 2004. Not much has changed in the
Fig. 22. Land cover maps of the Rio Cacheu for 1956 (top) (based on an aerial photographs and topographical
map) and for 1998 (bottom) (based on remotely sensed data and field work). Note the loss of mangroves on
the inland part of the estuary. The historical changes within the black square are shown in more detail in Fig.
23. Source: Vasconcelos et al. (2002).

A&W-report 2029 Mangrove dynamics in West Africa 21
Fig. 23. Maps of the area indicated as square (4.8x2.4 km) in Fig. 22. A. Topographical map (aerial photos 1956); B.
CORONA-satellite photo 31-1-1968; C. mangroves in 2000 (red=only Giri et al. 2010, grey= only Spalding et al. 2010;
dark red: both studies) D. land cover in 2000 (Bos et al. 2006). E. Google Earth 3-1-2004, F. Google Earth 9-4-2012.

22 A&W-report 2029 Mangrove dynamics in West Africa
following eight years (Fig. 23G), but the cover by mangroves has increased again: the strips along the
creeks are wider and the first mangrove trees have colonised the abandoned rice fields.
One may conclude from Fig. 23 that the loss of mangrove forest is partly due to tree mortality (likely due
to the dry conditions in the 1980s) and for a larger part due to the development of new rice fields at the
expense of the mangrove vegetation. A large part of these rice fields have been in exploitation for not
more than some dozens of years. The mangrove vegetation has partly recovered since 2000 due to
regrowth on bare land and also preliminary recolonisation of the former rice fields. The recovery is
evident but things move at a snail’s pace. Hence it may take still many years before the former rice fields
have been changed again into mangrove forests from the past.
Fig. 24. The variation in the surface
area of mangroves in Guinea-
Bissau (km2; labels near the dots).
The red dots refer to Lourenço et
al. (2009).
Other studies:
1976: SCET International (1978)
1982: Atlanta consult (1982)
1987: Cuq et al. (1996)
1990: CIRAD-Forêt (1990)
2000: Bos et al. (2006) (2521 km2)
Giri et al. (2010) (2732 km2 and
Spalding et al. (2010) (2982 km2)).
Fig. 23 shows the land cover change in only one small area of 11.5 km2. Inspection of mangrove areas
elsewhere along the Rio Cacheu, using the same maps and images as in Fig. 23, reveals the same
driving forces, drought and rice farming, explaining the changes in land use and land cover. A detailed
study is needed to make such generalisation for larger areas, but the available global data are already
suggestive.
Fig. 25. The relative change in the
surface area of rice fields in different
regions of Guinea-Bissau between
1978 and 1990, varying between a
decline by 25-50% in the north
(Cacheu) and an increase by over
100% in the south (Tombali). Map
copied from Mendy (1994).
For Guinea-Bissau as a whole, the mangroves declined in the 1970s and 1980s to recover from the
1990s onwards (Fig. 24). Remarkably, the decline and increase were the largest in the most northern
region of the country. As reviewed by Dimbara (1999), the mangroves declined between 1978 and 1990
by 21% and 22% in the north and mid of Guinea-Bissau (region Cacheu and Quinara) and less in the
south (decrease of 10% in Bolama and 9% in Tombali; SCET International 1978; CIRAD-Forêt 1990).

A&W-report 2029 Mangrove dynamics in West Africa 23
Lourenço et al. (2009) concluded that the mangroves in Cacheu and Biombo have increased again
between 1990 and 2007 by 20% and 10%, respectively. In contrast, there was no recovery in the 1990s,
as in the northern part of the country, but a further decline by another 9% in Tombali, the most southern
region of Guinea-Bissau (Lourenço et. al 2009). These contrasting tendencies may be due to the
recovery of mangroves in the north after the loss during the Great Drought. Probably more important is
that abandoned rice fields are recolonized by mangroves (Lourenço et al. 2009). This has occurred on
a large scale in Cacheu. The ongoing loss of mangroves in the Tombali region is likely due to still
expanding rice cultivation (Fig. 25).
Farmers do not remove the trunks of all mangroves in recently reclaimed rice fields. The trees die off as soon as
the fields are embanked.
The few data available suggest for Guinea-Conakry a decline of the mangrove area (Fig. 15), which
according to Bertrand (1993) is not primarily due to human interventions in the mangrove belt itself, but
due to changes in the coastal zone, such as deforestation and the expansion of rice cultivation, by which
the sedimentation declines, tidal zones get smaller and, hence, mangrove forests degrade.
Wolanski & Cassage (2000) paint a bleak picture of the Guinean mangroves where large mangrove
trees have disappeared and rice cultivation is described as a shifting (slash and burn) cultivation since
rice fields are only cultivated temporarily and then abandoned. They believe that this has a large
negative impact since mangroves should rarely resettle on these left rice fields.
A simple way to check whether there is indeed an ongoing decline of the mangrove vegetation is to
check the available historical images of Google Earth (and old, but accurate, topographical maps and
CORONA satellite images). It was a surprising experience for us to see that in most sites in Senegal
and Guinea-Bissau the mangrove vegetation has not changed at all over many years. There are less
historical images for Guinea-Conakry in Google Earth, but the available images suggest a much larger
24 A&W-report 2029 Mangrove dynamics in West Africa
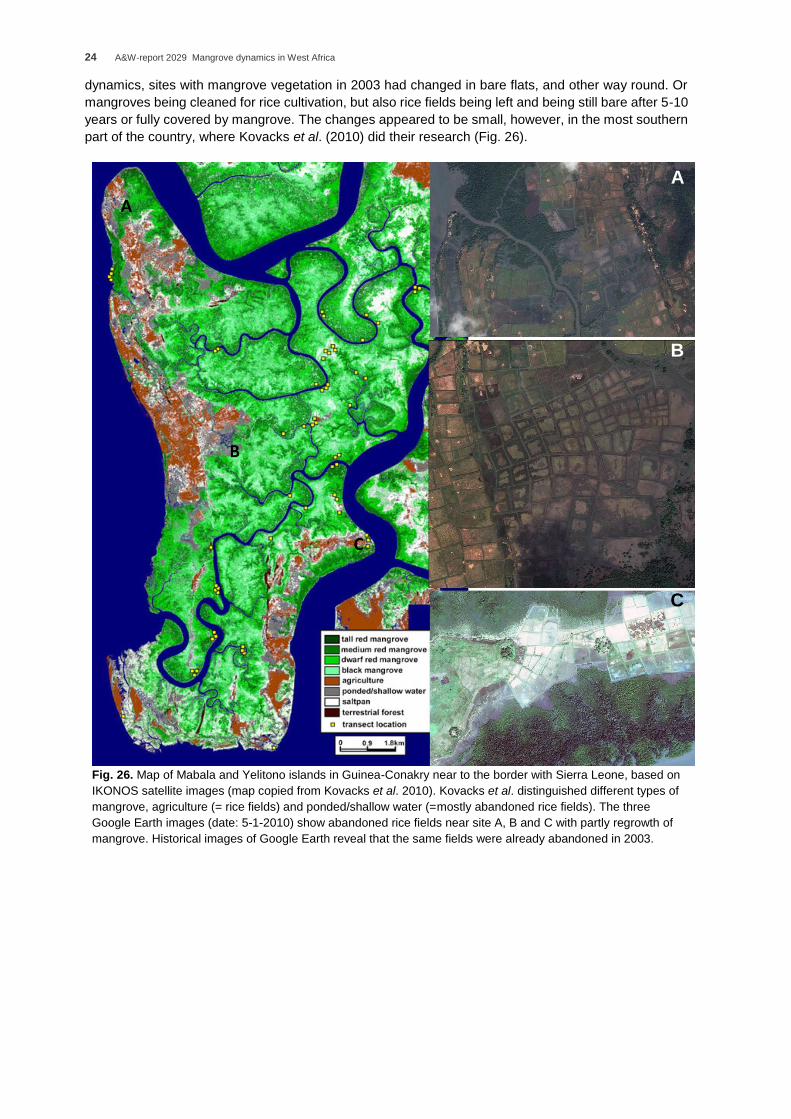
dynamics, sites with mangrove vegetation in 2003 had changed in bare flats, and other way round. Or
mangroves being cleaned for rice cultivation, but also rice fields being left and being still bare after 5-10
years or fully covered by mangrove. The changes appeared to be small, however, in the most southern
part of the country, where Kovacks et al. (2010) did their research (Fig. 26).
Fig. 26. Map of Mabala and Yelitono islands in Guinea-Conakry near to the border with Sierra Leone, based on
IKONOS satellite images (map copied from Kovacks et al. 2010). Kovacks et al. distinguished different types of
mangrove, agriculture (= rice fields) and ponded/shallow water (=mostly abandoned rice fields). The three
Google Earth images (date: 5-1-2010) show abandoned rice fields near site A, B and C with partly regrowth of
mangrove. Historical images of Google Earth reveal that the same fields were already abandoned in 2003.
A
B
C

A&W-report 2029 Mangrove dynamics in West Africa 25
4 Discussion and conclusions
4.1 No long-term decline of mangroves in West Africa
Valiela et al. (2001) estimate that the world has lost 35% of the mangroves in only 20 years, 1970-1990.
For West-Africa they arrive at a decline of 40.4% between 1953-1983 and 1995-1999 (total surface of
mangroves in Senegal, Gambia, Guinea-Bissau, Guinea-Conakry and Sierra-Leone estimated at 14757
km2 and 9799 km2, respectively). The country estimates being used for 1953-1983 are considered as
less reliable by Wilkie & Fortuna (2003). Moreover, the figures used by Valiela et al. (2001) for Senegal
and Guinea-Bissau are outliers (5000 km2 for Senegambia and 4760 km2 for Guinea-Bissau; see Fig.
15). Hence there is no reason to believe that West Africa has lost so much mangroves. On the contrary,
from the mangrove studies in West Africa, one may conclude that the total surface area covered by
mangroves has remained stable during the last 30 years, although with local differences. Much
mangroves have been lost in the northern estuaries during the Great Drought, mostly further inland but
not near the sea. Mangroves have partly recovered from these losses after the partial recovery of the
rainfall since 1994. Farmers have reclaimed mangroves for rice cultivation causing local disappearance
of mangrove, but there is regrowth (albeit slow) where these fields are abandoned. New rice fields are
much less common than abandoned rice fields, which results in a recent recovery of the mangrove
vegetation in West Africa.
4.2 Mangroves and rice cultivation
A major explanation of the regrowth of mangroves in Guinea-Bissau is the extension of the mangrove
forest in abandoned rice fields in the mangrove and tidal zone. Although people grow rice in these
polders for already 1000 years (Fields-Black 2008), its surface area has increased in the 20th century
(Penot 1994) at the expense of the mangrove forests, but it was the other way around since the
beginning of the anti-colonial war (1963-1974). Since 1990s many farmers switched to the more
profitable cashew (Temudo & Abrantes 2014) and rice fields were more and more abandoned and
recolonized by mangroves (Lourenço et al. 2009), especially in the drier north (Fig. 26).
Abandoned rice fields along the northern bank of the Rio Cacheu (Date: 28-8-2008; coordinates: 12.204ºN and
16.378ºW). Note that low clay dikes and ditches along these dikes are still visible and that the tree cover of
mangroves within the former rice fields is much lower than beyond the former rice fields.

26 A&W-report 2029 Mangrove dynamics in West Africa
Fig. 27. Regrowth of mangrove in abandoned rice fields along the northern border of the Rio Geba, some kms
west of Bissau (11.818ºN and 15.641ºW) as shown on four (of the 18 on 24-5-2014 available) historical images
in Google Earth. The area shown measures 780 x 890 m. The dike around the rice fields, still intact on 13-2-
2003, was broken before 29-3-2007. Note that mangroves recolonizes the bare fields along the ditches and
creeks.
The mangroves in Guinea-Bissau have increased by about 500 km2 (Fig. 24). To what degree can this
increase be explained by regrowth of mangroves in the abandoned rice fields? The surface area of rice
fields in the mangrove zone amounted to 1810 km2 in 1976 (SCET International 1978) and 1330 km2 in
1987 (Cuq et al. 1996). Bos et al. (2006) arrive at a much lower surface, 530 km2, probably because
they use a strict definition, “area in rice cultivation” hence excluding all (temporary) fallow land; a
comparable estimate of 650 km2 is given by the FAO for harvested rice in 2003 1. As long as we do not
know the possible change in the fraction of fallow land in the mangrove rice, it is difficult to quantify the
assumed decline of the total surface of rice fields. In any case, to explain an increase of the mangroves
1 http://www.factfish.com/statistic-country/guinea-bissau/rice%2C%20paddy%2C%20area%20harvested

A&W-report 2029 Mangrove dynamics in West Africa 27
in Guinea-Bissau by 500 km2, a much larger surface of rice fields must have been abandoned, since
the majority of these left fields remain bare, at least for many years. After farmers have left, the dikes
remain and the enclosed areas become in fact artificial tannes, being for mangroves too saline to survive
the dry season. The historical images of Google Earth can be used again to show how long abandoned
rice fields remain bare. One example is given for a complex of rice fields some kms west of Bissau city
(Fig. 27). In this area the recolonisation took place relatively fast since the dike was broken soon, but
were that not the case, the flood cannot enter the area and rice fields may remain bare much longer.
We made 2200 pictures from the mangrove zone in Gambia, Senegal and Guinea-Bissau on 24, 25 and
26 August 2008 during an aerial survey with a small plane flying at an altitude of 150-200 m. Studying
these pictures 6 years later clearly reveals that indeed many rice fields have been abandoned, mainly
in the north of Guinea-Bissau and hardly in the south. This must explain why indeed the observed trends
differ for the mangroves in northern and southern Guinea-Bissau. Extensive rice fields being abandoned,
as observed in the northern part of Guinea-Bissau, were not seen during the aerial survey on the other
side of the border, in the Casamance, nor in Gambia.
Extensive rice complex fully in exploitation (without abandoned fields) along the southern border of the Rio
Geba (date: 24-8-2008; 11.864ºN and 15.387ºW). Mangroves are only found in a narrow strip along the river’s
edge and on the island in the river.
4.3 Planting mangroves
During the field work in January-February 2014 we came across many sites where mangroves have
been planted by local people, from the Somone estuary near Dakar in Senegal to the Rio Cacine near
the border between Guinea-Bissau and Guinea-Conakry. These sites were usually relatively small so
the total surface with planted mangroves must be relatively insignificant compared to the area with
natural mangrove vegetation. We learned from our local guides and the participants of two workshops
(see acknowledgements) that the people in Senegal are more motivated to plant mangroves than in the
south. This seems conceivable. In the north, mangroves are planted in areas where they have
disappeared during the Great Drought, while in Cacine, as someone said, “why planting mangroves if
you find them here everywhere”.

28 A&W-report 2029 Mangrove dynamics in West Africa
Planting of mangroves is often supported by international agencies and NGO’s. They can use the
historical images of Google Earth to monitor the growth of the planted mangroves (see image below).
Mangroves planted along the road through tidal flats near Tobor, Casamance, can be monitored afterwards using
historical images in Google Earth (Date photo: 21-9-2007; coordinates of images: 12.630º N,16.280º W).
There is one reason of concern regarding the planting of mangrove. People plant Rhizophora mangle,
since this species produces large seedlings (propagules) which are easy to plant. Much planting has
taken place where mangrove forests have disappeared (Sine-Saloum, upper reaches of the Casamance
and Rio Cacheu). Unfortunately, Rhizophora is vulnerable to hypersalinity and the trees will certainly die
off at the next Great Drought. Hence it would be better to plant the less critical mangrove Avicennia
germinans, but local people involved in planting mangroves told us that either they had never tried or
that it would be much more time-consuming.
4.4 Future work
There are more and more possibilities to map mangroves using remote sensing (as reviewed by
Heumann 2011). However, the very high resolution imagery available since 2000 is still rarely used so
far, while mapping mangrove vegetation in three dimensions (measuring tree height with LiDAR)
(Faytyinbo & Simard 2013) is still too expensive to do so over large areas. Also the possibilities to
distinguish different types of mangroves in West Africa are so far insufficiently used (but see Kovacks
et al. 2010; Fig. 25). CORONA images (see Fig. Fig. 20, 22B) have not been applied to study the change
in mangrove vegetation in West Africa since the mid-1960s. Such a systematic comparison would help
to answer relevant questions such as where have mangroves been converted into rice fields, where
have rice fields been abandoned and where have these abandoned rice fields remained bare or covered
again by mangroves. It may also enable to quantify the actual decline of the tidal zone and mangrove
forests in Guinea-Conakry for which Bertrand (1993) has already given the cause 20 years ago.

A&W-report 2029 Mangrove dynamics in West Africa 29
5 Summary
Mangroves are a key habitat for coastal protection, communities (Ecosystem Services) and biodiversity
in the intertidal zone of coastal West Africa, but declining all over the world. The decline in West Africa
has been estimated at c. 40% between 1953-1983 and 1995-1999. With support of the Foundation
MAVA and several PRCM partners, we studied the dynamics of West African mangroves over time from
N Senegal (Senegal Delta) up to Sierra Leone. We analysed the available studies on the distribution
and development of mangroves. These studies appeared to differ highly in the quality of the remotely
sensed data being used. Using recent images with a (very) high resolution we digitised the actual
presence of mangrove in detail in seven study sites along the West African coast. This enabled us to
reach the two goals of this study: 1) compare the quality of the different studies available and 2) establish
whether there has been a decline in the surface areas of mangroves in West-Africa.
The supposed decline of West African mangroves is partly based on less reliable figures. This study
shows, that the growing quality of remotely sensed data with an increasing resolution resulted in better
estimates of the cover of mangroves. Hence, there is no reason to believe that West Africa has lost so
much mangroves as mentioned above. On the contrary, from the reliable mangrove studies in West
Africa, one may conclude that the total surface area covered by mangroves has remained stable during
the last 30 years, although with local differences. Many mangroves have been lost in the northern
estuaries (Senegal Delta, Somone, Delta du Saloum) during the Great Drought, mostly further inland
but not near the sea. The latter has been caused by low rainfall and a high evaporation (inversed
gradient of salinity in the northern estuaries). Mangroves have partly recovered from these losses after
the partial recovery of the rainfall since 1994. Farmers have reclaimed mangroves for rice cultivation
causing local disappearance of mangrove, but there is regrowth (albeit slow) where these fields are
abandoned. New rice fields are much less common than abandoned rice fields, which results in a recent
recovery of the mangrove vegetation in West Africa.
In the small Somone estuary in Senegal (south of Dakar) it has been shown in detail that recovered
rainfall led to a regrowth of mangroves, such in combination with replanting. A major explanation of the
regrowth of mangroves in Guinea-Bissau is the extension of the mangrove forest in abandoned rice
fields in the mangrove and tidal zone. Although people grow rice in these polders for already 1000 years,
its surface area has increased in the 20th century at the expense of the mangrove forests, but it was the
other way around since the beginning of the anti-colonial war (1963-1974). Since 1990s many farmers
switched to the more profitable cashew and rice fields were more and more abandoned and recolonized
by mangroves, especially in the drier north.
Locally, replanting of mangroves has led to restoring of mangrove habitat. There is one reason of
concern regarding the planting of mangrove. People plant Rhizophora mangle, since this species
produces large seedlings (propagules) which are easy to plant. Much planting has taken place where
mangrove forests have disappeared (Sine-Saloum, upper reaches of the Casamance and Rio Cacheu).
Unfortunately, Rhizophora is vulnerable to hypersalinity and the trees will certainly die off at a next Great
Drought. Hence it would less risky when they plant the less critical mangrove Avicennia germinans.
The currently available remote sensing data are very useful to monitor the development of mangroves,
in particular the results of reforestration. However, there are more and more possibilities to map
mangroves using remote sensing with very high resolution imagery. Also, the use of CORONA images
from the mid-1960s may be used for these purposes. A systematic comparison of these images with the
current situation (and reliable data in between) would help to answer relevant questions such as where
have mangroves been converted into rice fields, where rice fields have been abandoned and where
have these abandoned rice fields remained bare or be covered again by mangroves.

30 A&W-report 2029 Mangrove dynamics in West Africa
Exchange of information between mangrove experts during two workshops in Toubacouta, Senegal,
and Sao Domingos, Guinea-Bissau.

A&W-report 2029 Mangrove dynamics in West Africa 31
6 Cited literature
Altenburg, W. & van Spanje, T. (1989) Utilization of mangroves by birds in Guinea-Bissau. Ardea, 77,
57-74.
Atlanta consult (1978) Inventaire et classement des Forêts de Guinée-Bissau.
Andrieu, J. (2010) Commentaire de la carte des changements de l'occupation du sol dans les rivières-
du-sud. Le Monde des cartes, 23-42.
Andrieu, J. & Mering, C. (2008) Cartographie par télédétection des changements de la couverture
végétale sur la bande littorale ouest-africaine: exemple des Rivières du Sud du delta du Saloum au Rio
Geba. Télédétection, 8, 93-118.
Aizpuru, M., Achard, F. & Blasco, F. (2000). Global assessment of cover change of the mangrove forests
using satellite imagery at medium to high resolution. EEC Research Project No. 15017-1999-05 FIED
ISP FR. Ispra, Italy, Joint Research Centre.
BDPA, SCET (1989) Potentialités et possibilités de relance de l’activité forestière : synthèse régionale
et nationale, BDPA (Bureau pour le développement de la production agricole), SCET.
Bertrand, F. (1993) Contribution à l'étude de l'environnement et de la dynamique des mangroves de Guinée. ORSTOM, Paris.
Bertrand, F. (1999b) Mangrove dynamics in the Rivieres du Sud area, West Africa: an ecogeographic
approach. Hydrobiologia, 413, 115-126.
Bos, D., Grigoras, I. & Ndiaye, A. (2006) Land cover and avian biodiversity in rice fields and mangroves
of West Africa. A&W/Wetlands International, Veenwouden.
http://www.altwym.nl/uploads/file/118A%26W-rapport%20824-Rice_mangroves_bos_etal_2006.pdf
Carney, J., Gillespie, T. W. & Rosomoff, R. (2014) Assessing forest change in a priority West African
mangrove ecosystem: 1986-2010. Geoforum, 53, 126-135.
Clough, B.F. (1993) Economic and environmental values of mangrove forests and their present state of
conservation in the South-East Asia/Pacific Region. Mangrove Ecosystems Technical Reports No. 1,
ITTO/ISME/JIAM Project PD71/89, Rev.1 (F). Nishihara, Japan, International Society for Mangrove
Ecosystems (ISME), International Tropical Timber Organization (ITTO) & Japan International
Association for Mangroves (JIAM).
Conchedda, G., Durieux, L. & Mayaux, P. (2008) An object-based method for mapping and change
analysis in mangrove ecosystems. ISPRS Journal of Photogrammetry and Remote Sensing, 63, 578-
589.
Conchedda, G., Lambin, E. F. & Mayaux, P. (2011) Between Land and Sea: Livelihoods and
Environmental Changes in Mangrove Ecosystems of Senegal. Annals of the Association of American
Geographers, 101, 1259
Corcoran, E., Ravilious, C. & Skuja, M. (2007) Mangroves of Western and Central Africa. UNEP-
Regional Seas Perogramme/UNEP-WCMC
Cuq, F., Madec, V. & Gourmelon, F. (1996) Mise à jour de la carte d'occupation des sols des provinces
côtières de Guinée-Bissau. MappeMonde, 4, 21-26.
32 A&W-report 2029 Mangrove dynamics in West Africa
Dahdouh-Guebas, F. & Koedam, N. (2001) Are the northernmost mangroves of West Africa viable? - a
case study in Banc d'Arguin National Park, Mauritania. Hydrobiologia, 458, 241-253.
Debenay, J. P., Pagès, J. & Diouf, P. S. (1989) Ecological zonation of the hyperhaline estuary of the Casamance River (Senegal): Foraminifera, zooplankton and abiotic variables. Hydrobiologia, 174, 161-176.
Dièye, E.B., Diaw, T., Sané, T. & Ndour, N. (2013) Dynamique de la mangrove de l'estuaire du Saloum
(Sénégal) entre 1972 et 2010. Cybergo : European Journal of Geography, 629.
Diombera, K. (1999) Collecte et analyse de données pour l'aménagement durable des forêts - joindre
les efforts nationaux et internationaux Programme de partenariat CE-FAO (1998-2002). Programme
d'évaluation des Ressources Forestières Mondiales en Guinée-Bissau. FAO, Rome.
Diop, E.S. (1993) Conservation and sustainable utilization of mangrove forests in Latin America and
Africa regions. Part II. Africa. Mangrove Ecosystems Technical Reports No. 3, ITTO/ISME Project
PD114/90. Nishihara, Japan, International Society for Mangrove Ecosystems (ISME) & International
Tropical Timber Organization (ITTO).
Diop, E. S., Soumare, A., Diallo, N. & Guisse, A. (1997) Recent changes of the mangroves of the Saloum
River Estuary, Senegal. Mangroves and salt marshes, 1, 163-172.
Duke, N. C., Meynecke, J. O., Dittmann, S., Ellison, A. M., Anger, K., Berger, U., Cannicci, S., Diele, K., Ewel, K. C. & Field, C. D. (2007) A world without mangroves? Science, 317, 41-42.
FAO (1994). Mangrove forest management guidelines. FAO Forestry Paper,117. Rome.
FAO (2007) The world's mangroves 1980-2005. FAO Forestry Paper, 153, Rome.
FAO & UNEP (1981a) Proyecto de Evaluación de los Recursos Forestales Tropicales: los recursos
forestales de la América tropical. Rome.
FAO & UNEP (1981b) Tropical Forest Resources Assessment Project: forest resources of tropical
Africa. Part II. Country briefs. Rome.
FAO & UNEP (1981c) Tropical Forest Resources Assessment Project: forest resources of tropical Asia.
Rome.
Fatoyinbo, T. E. & Simard, M. (2013) Height and biomass of mangroves in Africa from ICESat/GLAS
and SRTM. International Journal of Remote Sensing, 34, 668-681.
Fields-Black, E. (2008) Untangling the many roots of West African mangrove rice farming: rice technology in the Rio Nunez region, earliest times to c. 1800. The Journal of African History, 49, 1-21.
Fisher, P. & Spalding, M.D. (1993). Protected areas with mangrove habitat. Cambridge, UK, UNEP-
World Conservation Monitoring Centre.
Giri, C., Ochieng, E., Tieszen, L., Zhu, Z., Singh, A., Loveland, T., Masek, J. & Duke, N. (2010a) Status
and distribution of mangrove forests of the world using earth observation satellite data. Global Ecology
and Biogeography, 20, 154-159.
Giri, C., Ochieng, E., Tieszen, L., Zhu, Z., Singh, A., Loveland, T., Masek, J. & Duke, N. (2011b). Global
distribution of mangrove forests of the world using earth observation satellite data. In Supplement to:
Giri et al. (2011a). Cambridge (UK): UNEP World Conservation Monitoring Centre. URL: data.unep-
wcmc.org/datasets/2.

A&W-report 2029 Mangrove dynamics in West Africa 33
Groombridge, B. (1992) Global biodiversity: status of the earth’s living resources. UNEP-WCMC/The
National History Museum/IUCN/Worldwide Fund for Nature/World Resources Institute. London,
Chapman & Hall.
Heumann, B. W. (2011) Satellite remote sensing of mangrove forests: Recent advances and future
opportunities. Progress in Physical Geography, 35, 87-108.
Jimenez, J. A., Lugo, A. E. & Cintron, G. (1985) Tree mortality in mangrove forests. Biotropica, 17, 177-185.
Kovacs, J., Santiago de, F., Bastien, J. & Lafrance, P. (2010) An Assessment of Mangroves in Guinea,
West Africa, Using a Field and Remote Sensing Based Approach. Wetlands, 30, 773-782.
Lacerda, L.D. (1993) Conservation and sustainable utilization of mangrove forests in Latin America and
Africa regions. Vol. 2, Part I. Latin America. Mangrove Ecosystems Technical Reports No. 2, ITTO/ISME
Project PD114/90 (F). Nishihara, Japan, International Society for Mangrove Ecosystems (ISME) &
International Tropical Timber Organization (ITTO).
Lourenço, P., Cabral, A. I. R., Oom, D., Vasconcelos, M. J. P., Catarino, L. & Temudo, M. P. (2009) Re-growth of mangrove forests of Guinea-Bissau. 3rd International Symposium on Remote Sensing of Environment 'Sustaining the Millennium Development Goals', 1-4.
Maniatis, D. (2005) Retrospective study of the mangroves of the Tanbi Wetland Complex, The Gambia. Vrije Universiteit Brussel.
Marius, C. (1979) Effets de la sécheresse sur l'évolution phytogéographique et pédologique de la mangrove de Basse-Casamance. Bull.IFAN, Série A, 4, 669-691.
Marius, C. (1995) Effets de la sécheresse sur l'évolution des mangroves du Sénégal et de la Gambie. Sécheresse, 6, 123-125.
Mendy, P. (1994) La dynamique contrastée de la gestion des espaces littoraux de la Guinée-Bissau. Dynamique et usages de la mangrove dans les pays des rivières du Sud (du Sénégal à la Sierra Leone) (ed M.-C. Cormier-Salem), pp. 195-208. ORSTOM, Paris.
Penot, E. (1994) La riziculture de mangrove de la société balant dans la région de Tombali en Guinée-Bissau. Colloques et Séminaires (France).Dynamique et usages de la mangrove dans les pays des rivières du sud, 209-222.
Saenger, P. & Bellan, M. (1995) The mangrove vegetation of the Atlantic Coast of Africa: a review.
Université de Toulouse, Toulouse.
Saenger, P., Hegerl, E.J. & Davie, J.D.S. (1983) Global status of mangrove ecosystems. Commission
on Ecology Papers No. 3. Gland, Switzerland, World Conservation Union (IUCN).
Sakho, I., Mesnage, V., Deloffre, J., Lafite, R., Niang, I. & Faye, G. (2011) The influence of natural and
anthropogenic factors on mangrove dynamics over 60 years: The Somone Estuary, Senegal. Estuarine
Coastal and Shelf Science, 94, 93-101.
Sall, M.M. (1982) Dynamique et morphogenèse actuelle au Sénégal occidental. Thèse
de Doctorat d’Etat, Université Louis Pasteur de Strasbourg,
Savenije, H. H. G. & Pagès, J. (1992) Hypersalinity: a dramatic change in the hydrology of Sahelian estuaries. Journal of Hydrology, 135, 157-174.
SCET International (1978). Potentialités agricoles, forestières et pastorales. I. Diagnostics sur
l’agriculture et les ressources forestières, esquisse de schéma directeur de développement agricole et
forestier. II. Sols, utilisation actuelle, vocation. III. Cartes. SCET-International, Saint-Quentin-en-
Yvelines.
34 A&W-report 2029 Mangrove dynamics in West Africa
Spalding, M., Blasco, F. & Field, C. (1997) World mangrove Atlas. International Society for Mangrove
Ecosystems (ISME), Okinawa.
Spalding, M., Kainuma, M. and Collins. L. (2010). World Atlas of Mangroves. A collaborative project of
ITTO, ISME, FAO, UNEP-WCMC, UNESCO-MAB, UNU-INWEH and TNC. Earthscan, London.
Stancioff, A., Staljanssens, M. & Tappan, G. (1986) Cartographie et télédétection des ressources de la
République du Sénégal. In: Etude de la géologie, de l'hydrologie, des sols, de la végétation et des
potentiels d'utilisation des sols. Ministre de l'Intérieur, Sécrétariat d'Etat à la Décentralisation, Agence
des Etats Unis d'Amérique pour le Développement.
Tappan, G. G., Sall, M., Wood, E. C. & Cushing, M. (2004) Ecoregions and land cover trends in Senegal.
J.Arid Environ., 59, 427-462
Temudo, M. & Abrantes, M. (2014) The Cashew Frontier in Guinea-Bissau, West Africa: Changing Landscapes and Livelihoods. Human Ecology, 42, 217-230.
Valiela, I., Bowen, J. L. & York, J. K. (2001) Mangrove Forests: One of the World's Threatened Major
Tropical Environments. Bioscience, 51, 807-815.
Vasconcelos, M., Mussá Biai, J., Diniz, M. & Diniz, M. (2002) Land cover change in two protected areas
of Guinea-Bissau (1956–1998). Applied Geography, 22, 139-156.
Wilkie, M.L. & Fortuna S. (2003). Status and trends in mangrove area extent worldwide. Forest
Resources Assessment Working Paper No. 63. Forest Resources Division. FAO, Rome.
http://www.fao.org/docrep/007/j1533e/j1533e00.htm
Wolanski, E. & Cassagne, B. (2000) Salinity intrusion and rice farming in the mangrove-fringed Konkouré River delta, Guinea. Wetlands Ecology and Management, 8, 29-36.
Visiting address
Suderwei 2
9269 TZ Feanwâlden
The Netherlands
Post address
P.O.Box 32
9269 ZR Feanwâlden
The Netherlands
Tel +31 511 47 47 64
Fax +31 511 47 27 40
www.altwym.nl